the Creative Commons Attribution 4.0 License.
the Creative Commons Attribution 4.0 License.
 | 15 Apr 2021
SoilKsatDB: global database of soil saturated hydraulic conductivity measurements for geoscience applications
Tomislav Hengl
Peter Lehmann
Sara Bonetti
The saturated soil hydraulic conductivity (Ksat) is a key parameter in many hydrological and climate models. Ksat values are primarily determined from basic soil properties and may vary over several orders of magnitude. Despite the availability of Ksat datasets in the literature, significant efforts are required to combine the data before they can be used for specific applications. In this work, a total of 13 258 Ksat measurements from 1908 sites were assembled from the published literature and other sources, standardized (i.e., units made identical), and quality checked in order to obtain a global database of soil saturated hydraulic conductivity (SoilKsatDB). The SoilKsatDB covers most regions across the globe, with the highest number of Ksat measurements from North America, followed by Europe, Asia, South America, Africa, and Australia. In addition to Ksat, other soil variables such as soil texture (11 584 measurements), bulk density (11 262 measurements), soil organic carbon (9787 measurements), moisture content at field capacity (7382), and wilting point (7411) are also included in the dataset. To show an application of SoilKsatDB, we derived Ksat pedotransfer functions (PTFs) for temperate regions and laboratory-based soil properties (sand and clay content, bulk density). Accurate models can be fitted using a random forest machine learning algorithm (best concordance correlation coefficient (CCC) equal to 0.74 and 0.72 for temperate area and laboratory measurements, respectively). However, when these Ksat PTFs are applied to soil samples obtained from tropical climates and field measurements, respectively, the model performance is significantly lower (CCC = 0.49 for tropical and CCC = 0.10 for field measurements). These results indicate that there are significant differences between Ksat data collected in temperate and tropical regions and Ksat measured in the laboratory or field. The SoilKsatDB dataset is available at https://doi.org/10.5281/zenodo.3752721 (Gupta et al., 2020) and the code used to extract the data from the literature and the applied random forest machine learning approach are publicly available under an open data license.
- Article
(5842 KB) - Full-text XML
-
Supplement
(283 KB) - BibTeX
- EndNote


The soil saturated hydraulic conductivity (Ksat) describes the rate of water movement through saturated soils and is defined as the ratio between water flux and hydraulic gradient (Amoozegar and Warrick, 1986). It is a key variable in a number of hydrological, geomorphological, and climatological applications, such as rainfall partitioning into infiltration and runoff (Vereecken et al., 2010), optimal irrigation design (Hu et al., 2015), and the prediction of natural hazards including catastrophic floods and landslides (Batjes, 1996; Gliński et al., 2000; Zhang et al., 2018). Accurate measurements of Ksat in the laboratory and field are laborious and time consuming and are often scale dependent (Youngs, 1991). Using infiltrometer measurements in the field also enables the measurement of Ksat in forests and other types of structured soils; however, so far Ksat values have been measured mainly for agricultural soils (Romano and Palladino, 2002).
Efforts to produce reliable and spatially refined datasets of hydraulic properties date back to the 1970s with the proliferation of distributed hydrologic and climatic modeling. These early notable works also provided basic databases (some of which are used in this study) for Australia (McKenzie et al., 2008; Forrest et al., 1985), Belgium (Vereecken et al., 2017; Cornelis et al., 2001), Brazil (Tomasella et al., 2000, 2003; Ottoni et al., 2018), France (Bruand et al., 2004), Germany (Horn et al., 1991; Krahmer et al., 1995), Hungary (Nemes, 2002), the Netherlands (Wösten et al., 2001), Poland (Glinski et al., 1991), and the USA (Rawls et al., 1982). A detailed discussion of the available datasets for Ksat and other hydrophysical properties is provided in Nemes (2011). Collaborative efforts have resulted in the compilation of multiple databases, including the Unsaturated Soil Hydraulic Database (UNSODA) (Nemes et al., 2001), the Grenoble Catalogue of Soils (GRIZZLY) (Haverkamp et al., 1998), and the Mualem catalogue (Mualem, 1976). These databases, however, focused on soil types and not on the spatial context of Ksat mapping. In an effort to provide spatial context, Jarvis et al. (2013) and Rahmati et al. (2018) published global databases for soil hydraulic and soil physical properties. Likewise, the European soil data center also started projects, such as SPADE (Hiederer et al., 2006) and HYPRES (Wösten, 2000), for generating spatially referenced soil databases for several countries. Since HYPRES only includes western European countries, Weynants et al. (2013) gathered data from 18 countries and developed the European HYdropedological Data Inventory (EU-HYDI) database. This dataset is, however, not publicly available and was not included in this compilation. The datasets mentioned above cover almost all climatic zones except tropical regions, where Ksat values can be significantly different due to the strong local weathering processes and different clay mineralogy (Hodnett and Tomasella, 2002). Recently, Ottoni et al. (2018) published a dataset named HYBRAS (Hydrophysical Database for Brazilian Soils) improving the coverage of South American tropical regions. In addition, Rahmati et al. (2018) recently published the Soil Water Infiltration Global database (SWIG) with information on Ksat for the whole globe. In the SWIG database, some Ksat values were extracted from the literature and other Ksat values were deduced from infiltration time series. In contrast to laboratory measurements that determine Ksat as the ratio of flux density to gradient, infiltration-based methods determine Ksat by fitting infiltration dynamics to parametric models of the infiltration process; for a review on analytical models characterizing the infiltration process, see Kutílek et al. (1988), Youngs (1991), and Vereecken et al. (2019).
The increasing demand for highly resolved descriptions of surface processes requires commensurate advances in the representation of Ksat in modern Earth system model (ESM) applications. Several existing Ksat datasets are either missing coordinates or these are provided with an unknown accuracy, thus limiting their applications for spatial modeling. For example, the SWIG dataset is missing information on soil depth and assigns entire watersheds to a single coordinate. Similarly, the UNSODA dataset does not provide coordinates and soil texture information for all samples. For a few locations, HYBRAS uses a different coordinate system. Taken together, these limitations imply that to prepare spatially referenced global Ksat datasets for large scale applications, it requires serious effort to compile, standardize, and quality check all (publicly available) literature.
The objective of the work here is to provide a new global standardized Ksat database (SoilKsatDB) that can be used for geoscience applications. To do so, a total of 13 258 Ksat measurements was compiled, standardized, and crosschecked to produce a harmonized compilation that is analysis-ready (i.e., it can directly be used to test various machine learning algorithms for spatial analysis). We compiled data from existing datasets and, to improve the spatial coverage in regions with sparse data, we conducted a literature search to include Ksat measurements in geographic areas that were not yet included in other existing databases. In this paper, we first describe the data compilation process and then describe methodological steps used to spatially reference, filter, and standardize the existing datasets. As an illustrative application of the dataset, we derive pedotransfer functions (PTFs) for different climatic regions and measurement methods and discuss their transferability to other regions and measurement methodologies. We fully document all importing, standardization, and binding steps using the R environment for statistical computing (R Core Team, 2013), so that we can collect feedback from other researchers and increase the speed of further updates and improvements. The newly created dataset (SoilKsatDB) can be accessed via https://doi.org/10.5281/zenodo.3752721 (Gupta et al., 2020).
2.1 Data sources
To locate and obtain all compatible datasets, a literature search was conducted using different search engines, including Science Direct (https://www.sciencedirect.com/, last access: 9 February 2021), Google Scholar (https://scholar.google.com/, last access: 9 February 2021), and Scopus (https://www.scopus.com, last access: 11 January 2021). We searched soil hydraulic conductivity datasets using “saturated hydraulic conductivity database”, “Ksat”, and “hydraulic conductivity curves” as keywords. The collected datasets are listed in Table 1 together with the number of Ksat observations for each study. They can be classified into three main categories, namely: (i) existing datasets (in the form of tables) published and archived with a DOI in peer-reviewed publications, (ii) legacy datasets in paper or document format (e.g., legacy reports, PhD theses, and scientific studies), and (iii) online materials.
Existing datasets include published datasets such as HYBRAS (Ottoni et al., 2018), UNSODA (Nemes et al., 2001), SWIG (Rahmati et al., 2018), and the soil hydraulic properties over the Tibetan Plateau (Zhao et al., 2018), from which we extracted the required information as described in Table 2. The major challenge with making the existing datasets compatible for binding (standardization, removing redundancy) was to obtain the locations for a particular sample as well as the corresponding measurement depths. For instance, the UNSODA database does not provide information on the geographical locations. To fill the gaps and make the data suitable also for spatial analysis, we used Google Earth to find the coordinates based on the given location (generally an address or a location name). Moreover, all datasets were crosschecked to avoid redundancy. For example, the UNSODA data include the data of Vereecken et al. (2017) and Richard and Lüscher (1983/87) while the SWIG database includes the measurements of Zhao et al. (2018). Hence we removed these from the UNSODA and SWIG database and used the original sources.
Rycroft et al. (1975)Habel (2013)Wang et al. (2008)Waddington and Roulet (1997)Nyman et al. (2011)Deshmukh et al. (2014)Takahashi (1997)Bhattacharyya et al. (2006)Price et al. (2010)Katimon and Hassan (1997)Lopes et al. (2020)Bonsu and Masopeh (1996)El-Shafei et al. (1994)Yasin and Yulnafatmawita (2018)Bambra (2016)Lopez et al. (2015)Daniel et al. (2017)Verburg et al. (2001)Kramarenko et al. (2019)Arend (1941)Southard and Buol (1988)Zakaria (1992)Helbig et al. (2013)Chang (2010)Ramli (1999)Gwenzi et al. (2011)Yao et al. (2013)Singh et al. (2011)Päivänen (1973)Becker et al. (2018)Campbell et al. (1977)Mahapatra and Jha (2019)Baird et al. (2017)Chief et al. (2008)Amer et al. (2009)Keisling (1974)Conedera et al. (2003)Radcliffe et al. (1990)Rahimy (2011)Ebel et al. (2012)Vogeler et al. (2019)Hao et al. (2019)Ferreira et al. (2005)Singh et al. (2006)Kanemasu (1994)Imeson et al. (1992)Kelly et al. (2014)Tete-Mensah (1993)Johansen et al. (2001)Elnaggar (2017)Zhao et al. (2018)Lamara and Derriche (2008)Ganiyu et al. (2018)Hinton (2016)Parks and Cundy (1989)Cisneros et al. (1999)Vieira and Fernandes (2004)Ravi et al. (2017)Niemeyer et al. (2014)Houghton (2011)Smettem and Ross (1992)Sharratt (1990)Tian et al. (2017)Boike et al. (1998)Habecker et al. (1990)Li et al. (2017)Andrade (1971)Nielsen et al. (1973)Forrest et al. (1985)Beyer et al. (2015)Robbins (1977)Richard and Lüscher (1983/87)Blake et al. (2010)Sonneveld et al. (2005)Sanzeni et al. (2013)Bonell and Williams (1986)Quinton et al. (2008)Vereecken et al. (2017)Kutiel et al. (1995)Simmons (2014)Coelho (1974)Martin and Moody (2001)Ouattara (1977)Kool et al. (1986)Mott et al. (1979)Hardie et al. (2011)Nemes et al. (2001)Rab (1996)Baird (1997)Ottoni et al. (2018)Soracco et al. (2010)Kirby et al. (2001)Rahmati et al. (2018)Varela et al. (2015)Yoon (2009)Grunwald (2020)Sayok et al. (2007)Jabro (1992)Abagandura et al. (2017)Greenwood and Buttle (2014)Table 1List of articles, digitized Ksat datasets, and the number of points (N) per dataset used to generate the SoilKsatDB.

In the case of legacy datasets (non-digital tabular format, non-peer-reviewed data), we invested significant effort to digitize, clean, and crosscheck the data to extract Ksat values. Two datasets were also collected directly from project websites providing data on hydraulic and thermal conductivity (retrieved from https://daac.ornl.gov/FIFE/guides/Soil_Hydraulic_Conductivity_Data.html, last access: 8 January 2021, and described in Kanemasu (1994)) and the Florida database (http://soils.ifas.ufl.edu, last access: 8 January 2021) from Grunwald (2020).
There are many biomes and climatic regions, such as desert dunes, peatlands, and frozen soils, for which very few Ksat measurements were publicly available. We have intensively searched for additional data for these areas and found 39 studies (each with less than 5 Ksat measurements) to cover these regions. We thus digitized Ksat values from these studies (shown either in bar charts or line plots), georeferenced the maps where necessary, and then converted the data into tabular form. In some cases, we also contacted colleagues that worked in these regions to retrieve additional data.
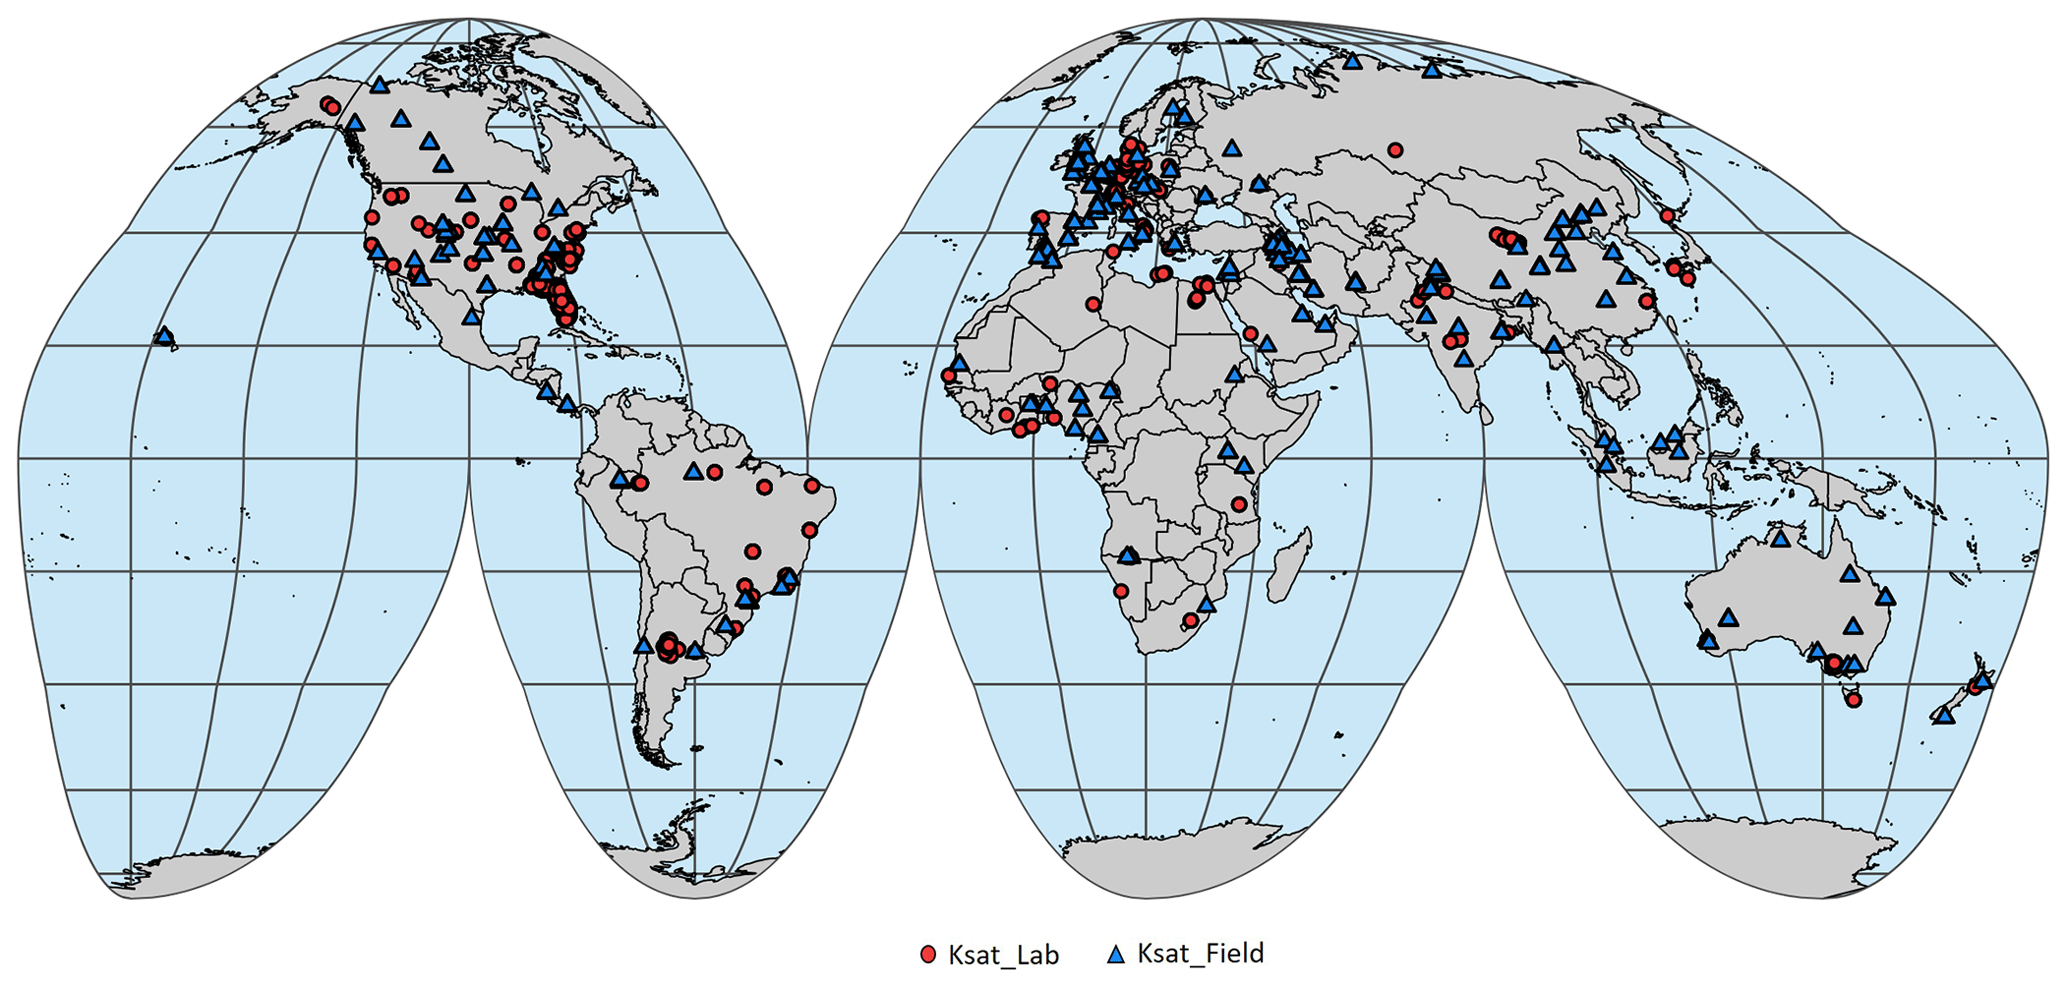
Figure 1Spatial distribution of Ksat measurements based on (red) laboratory and (blue) field measurements in the SoilKsatDB. A total of 1908 locations are shown on the map.
2.2 Georeferencing Ksat values and definition of spatial accuracy
Georeferencing of Ksat measurements is important for using the data for local, regional, or global hydrological and land surface models. Although many studies provided information on the geographical location of the measurements, studies conducted particularly in the 1970s and 1980s only provided the name of the locations and approximate distance from a reference location. A limited accuracy of the position value may affect the application of the Ksat value in a spatially distributed model. For example, in the case of a location with contrasting hydraulic properties, it must be known to which subregion the measured value can be assigned and the user must know if the given location is accurate enough. For that purpose we assigned an accuracy value (“accuracy classes”) to each measurement as explained next. We assigned each Ksat value to one of seven “accuracy classes” ranging from highest (0–100 m) to lowest (more than 10 000 m or non-available information (NA)) accuracy. For example, Forrest et al. (1985), Zhao et al. (2018), and Ottoni et al. (2018) provided exact coordinates of the locations, thus we assigned a location accuracy of 0–100 m (i.e., highly accurate; see Table 3 for more details). For other references, we digitized provided maps or sketches with locations of the points. We first georeferenced these maps using ESRI ArcGIS software (v10.3) and then digitized the coordinates from georeferenced images. Some of the documents we digitized (e.g., Nemes et al., 2001) provided the names of specific locations and hence we used Google Earth to obtain the coordinates. We estimate that the spatial location accuracy of these points is roughly between 0 and 5 km. Similarly, spatial maps in jpg format (e.g., Becker et al., 2018) were georeferenced with 100–500 m location accuracy. In contrast, few studies (e.g., Yoon, 2009) provided the exact location of the sampling with assumed location accuracy of 10–20 m. In the SWIG database, the information related to location (coordinates for each point) was missing, so we went through each publication referenced in Rahmati et al. (2018) and added coordinates.
Table 2(a) Description and units of some key variables listed in the database. The list can be found in the readme file (Table 1) and dataset “sol_ksat.pnts_horizons” on Zenodo (https://doi.org.10.5281/zenodo.3752721). We used the same codes as in the National Cooperative Soil Survey (NCSS) Soil Characterization Database (National Cooperative Soil Survey, 2016). (b) Example of Ksat database structure with key variables (from left to right: unique ID, reference, longitude and latitude (decimal degree), minimum and maximum accuracy (m), top and bottom of soil sample (cm), horizon designation, bulk density (g cm−3), moisture content at field capacity and wilting point (%), soil textural class, clay, silt and sand content (%), soil organic carbon content (%), soil acidity, saturated hydraulic conductivity measured in lab or field (cm d−1), source of the data, location id, and mean soil depth). NA is “no value”. Column names are explained in (a). The dataset file “sol_ksat.pnts_horizons” can be found on Zenodo (https://doi.org.10.5281/zenodo.3752721).
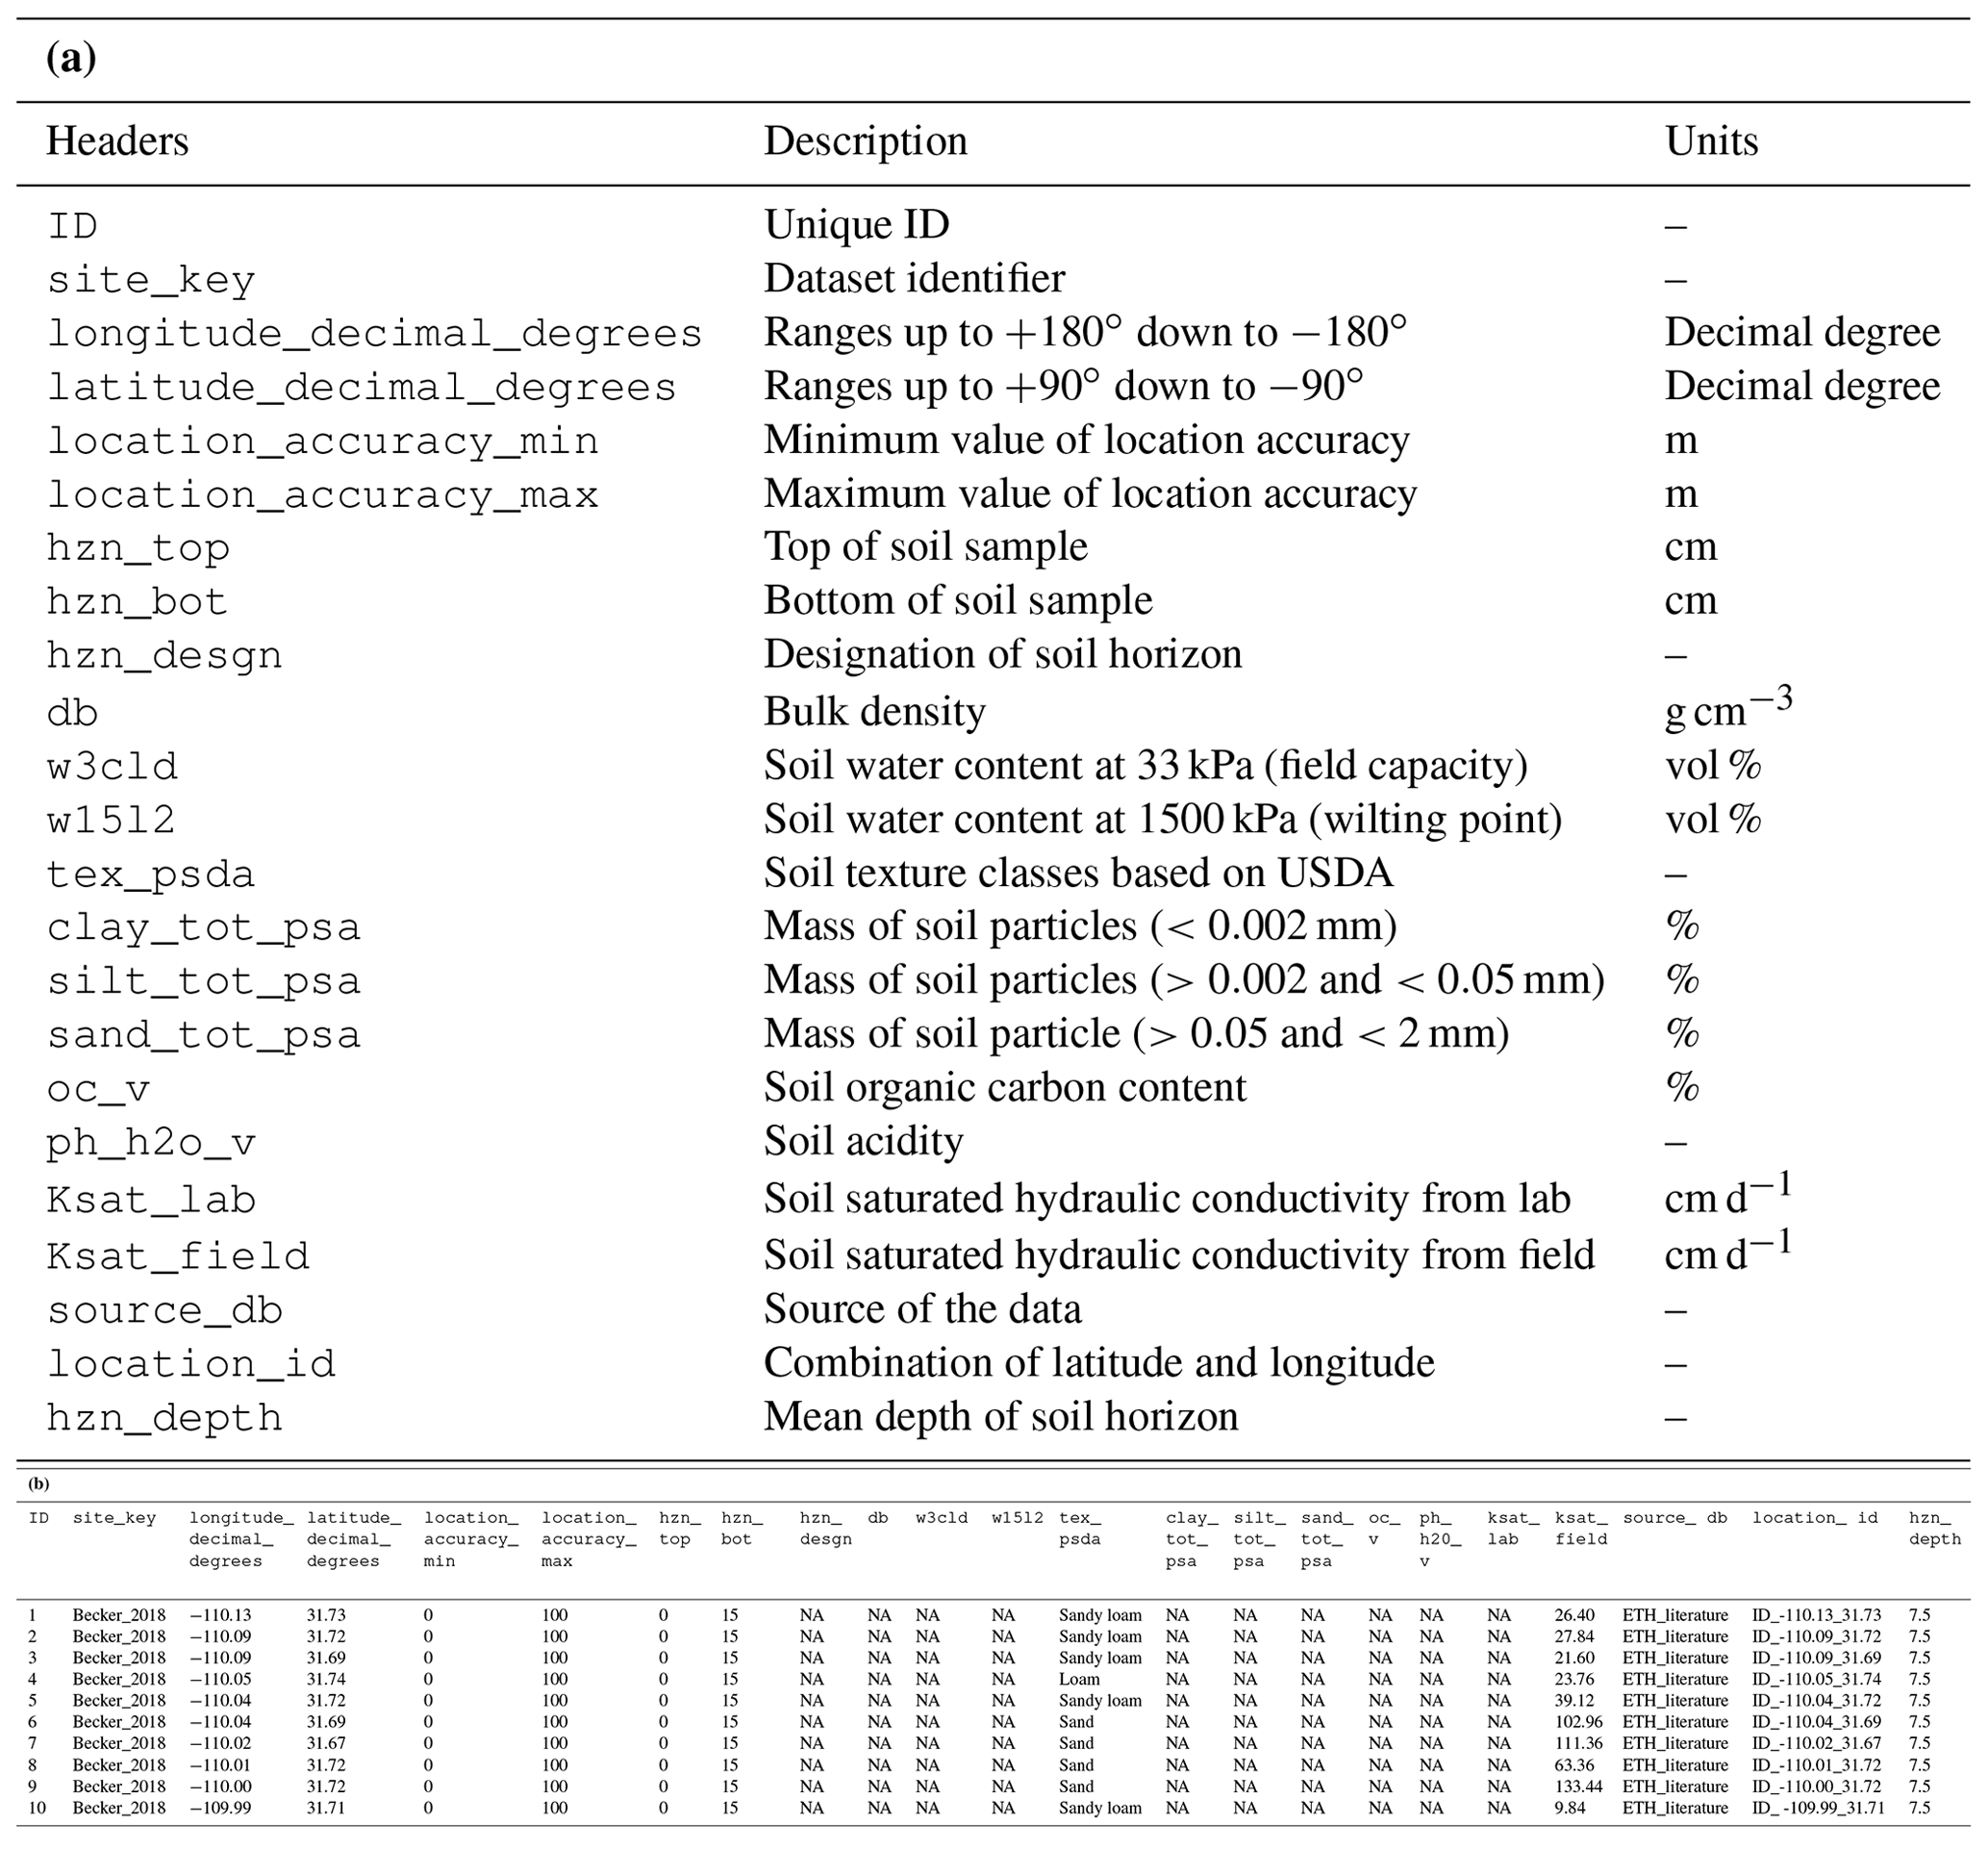
Table 3Number of samples (N) assigned to each spatial accuracy class. NA are samples without information on spatial accuracy.
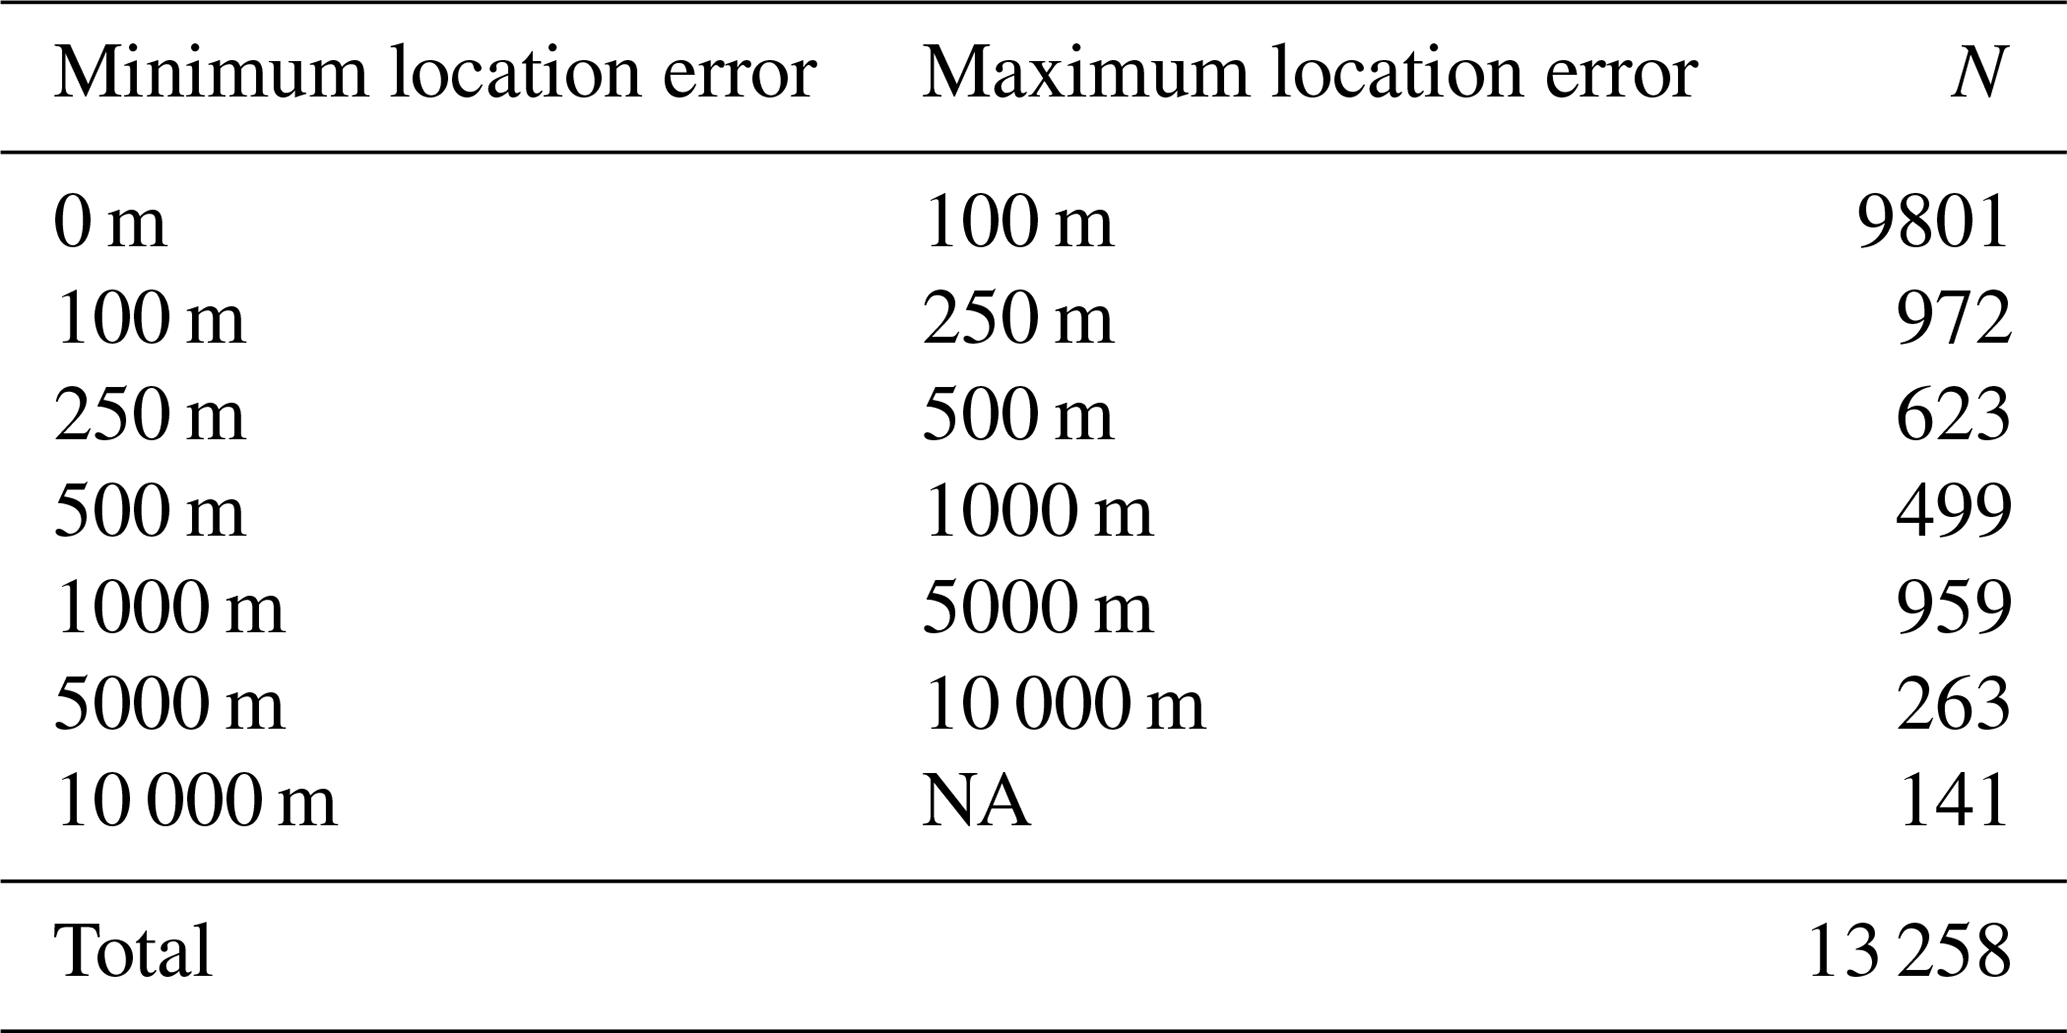
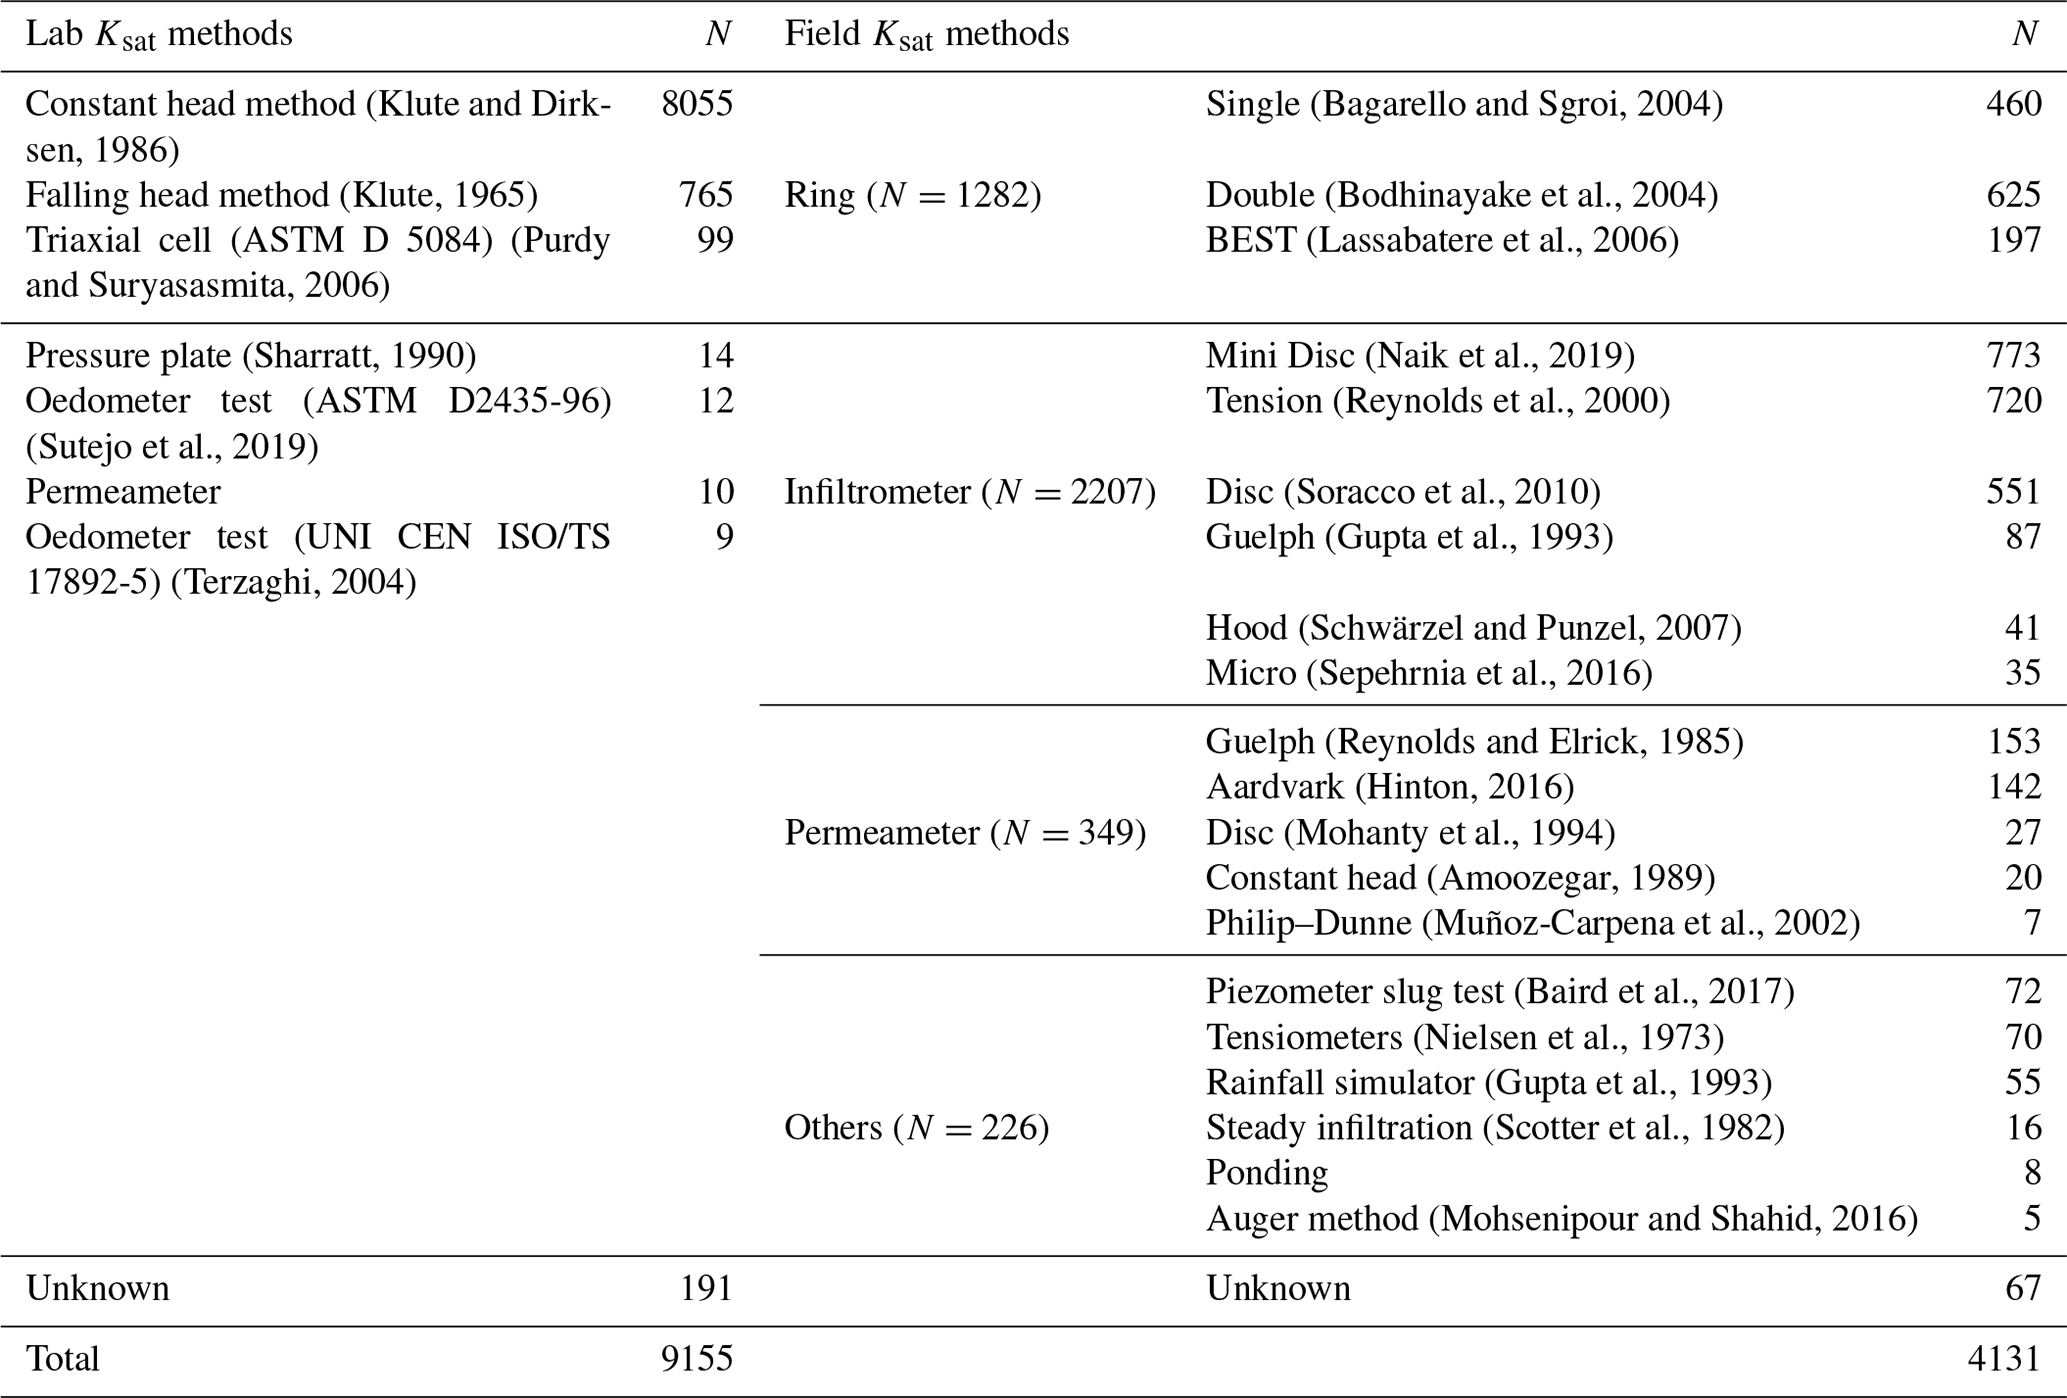
Table 4Instruments and methods used to estimate Ksat. A key reference with further details is given for all methods. The field methods are subdivided into different subcategories (in some cases, “ponding” in the field methods or “permeameter” in the lab methods were listed in original studies without specification). Information on the applied method for each sample is provided in file “sol_ksat.pnts_metadata_cl_pedo.csv” (https://doi.org/10.5281/zenodo.3752721).
2.3 Standardization
The database was cleaned to remove 716 unrealistic low Ksat values as outliers deduced from infiltration time series in the SWIG database. Moreover, in the SWIG database, soil depth information was not available, so we assumed that infiltration experiments were conducted in the topsoil and assigned a depth of 0–20 cm. Furthermore, we computed sand (particles > 50 µm), silt (2–50 µm), and clay fraction (<2 µm) for the UNSODA database based on the available particle-size data, assuming a log-normal distribution, as described in Nemes et al. (2001).
After data extraction from the literature, georeferencing, and standardization (conversion of all values to the same units), all information was collected in tabulated form in the new database SoilKsatDB (https://doi.org/10.5281/zenodo.3752721). The database consists of 23 columns (various sample properties) and 13 259 rows (a header and 13 258 samples). An excerpt of the database with all 23 columns is shown in Table .
Table 5Mean values of soil hydrophysical properties for each soil textural class. The number of samples (N) is given in parentheses under each soil variable for each soil texture classes. N values marked with * correspond to undefined soil texture class. BD: bulk density (g cm−3); OC: soil organic carbon content (%); FC: moisture content at field capacity (vol %); WP: moisture content at wilting point (vol %); and are laboratory and field Ksat (cm d−1), respectively. For Ksat, the geometric mean is reported (due to the sensitivity to a few extreme values for the arithmetic mean). For all other properties the arithmetic mean is provided.

2.4 Statistical modeling of Ksat
To show a possible application of the database, we computed various PTFs. The PTF models were fitted using a random forest (RF) machine learning algorithm (Breiman, 2001) in the R environment for statistical computing (R Core Team, 2013). We fitted the RF model for log-transformed (log10) Ksat values as a function of primary soil properties. In this application, PTFs for Ksat were built based on bulk density and sand and clay content. The observed correlation between these primary soil properties and Ksat motivated us to use key variables for the estimation of PTFs. Organic carbon (OC) was not used to build the PTFs because (i) this information was missing for 15 % of measurements and (ii) the correlation between OC and Ksat was poor (i.e., 0.005; Pearson correlation coefficient). We derived two PTFs for Ksat:
-
PTF for temperate regions. The map of Ksat locations were overlaid on the Köppen–Geiger climate zone map (Rubel and Kottek, 2010; Hamel et al., 2017) and then divided the measurements based on climatic regions (temperate, tropical, boreal, and arid) to account for differences in climate and related weathering processes (Hodnett and Tomasella, 2002). A total of 8296 Ksat values for measurements in temperate climate that contain information on sand, clay, and bulk density, were used to develop the PTF. The dataset was randomly divided into a training (6637 samples, 80 %) and testing dataset (1659 samples, 20 %). PTFs for temperate regions include all depths of Ksat measurements (40 % Ksat values from the top 0-20 cm of soil). In a validation step, we applied the PTF determined for temperate regions to tropical regions. Compared to temperate regions, the tropics are affected by different soil formation processes resulting in different clay mineral types. With such validation, we intend to discuss the transferability of PTFs across different regions.
-
PTF for laboratory-based Ksat values. In a second application, the dataset (total 13 258) was divided into laboratory- and field-based Ksat values. A total of 9155 Ksat measurements belong to laboratory and 4131 Ksat measurements belong to field values. The laboratory dataset (8491 Ksat measurements with information on soil texture and bulk density information) was used for training (6793) and testing (1698) following the same method as used for the PTF for the temperate climate (i.e., 80 % for training and 20 % for testing). Lab-based PTFs includes all depths of Ksat measurements (30 % Ksat values from the top 0-20 cm of soil). Similar to the application of the PTF from the temperate region for the tropics, we apply the PTF deduced from laboratory data for prediction of Ksat measured in the field. We expect differences because field measurements scan larger soil volumes that may contain soil structural pores.
The “ranger” package version 0.12.1 (Wright and Ziegler, 2015) was used to build the PTFs. The PTFs developed for temperate regions and for laboratory data were then applied to test their ability to predict the result for the measurements in the tropical climate (1111 Ksat measurements) and for field measurements (1998 Ksat measurements with information on soil texture and bulk density information), respectively. The code for generating and testing the PTFs is provided in the Supplement. ANOVA (analysis of variance) with post hoc Tukey's HSD (honestly significant difference) test (Hilton and Armstrong, 2006; Abdi and Williams, 2010) was used to test the significant difference in Ksat between texture classes. The ANOVA test indicates that at least one group differs from the other groups but does not explain the patterns of differences between means. Then, the Tukey HSD test was used to compute the significant difference between two means using a statistical distribution as shown in the results in Appendix A. This analysis was important to understand and check whether Ksat values between soil texture classes are significantly different or not.
The relative importance of the covariates for modeling Ksat was assessed by the node impurity, which for RF regression problems is computed as the decrease of residual sum of squares (RSS) when a particular covariate splits the data at the nodes of a tree (Hastie et al., 2009, Sects. 10.13.1, 15.3.2). The variable that provides maximum decline in RSS (and consequently increase in node purity) is considered the most important variable; the variable with the second largest RSS decrease is considered the second most important variable, and so on. Furthermore, the accuracy of the predictions was evaluated using bias, root mean square error (RMSE, in log-transformed Ksat measurement), and concordance correlation coefficient (CCC) (Lawrence and Lin, 1989).
Bias and RMSE are defined as
where y and are observed and predicted Ksat values, respectively, and n is the total number of cross-validation points.
The CCC is a measure of the agreement between observed and predicted Ksat value and is computed as
where and μy are predicted and observed means, and σy are predicted and observed variances, and ρ is the Pearson correlation coefficient between predicted and observed values. CCC is equal to 1 for a perfect model.
3.1 Data coverage of SoilKsatDB
Based on the literature search and data compilation, we have assembled a total of 13 258 values of Ksat from 1908 locations (each location has a unique location_id). Moreover, the database contains a total of 13 286 Ksat values because a few studies have reported both field and lab measurements for the same location. Figure 1 shows the global distribution of the sites used in this study. Most data originate from North America, followed by Europe, Asia, South America, Africa, and Australia. With respect to climatic regions, 10 093 Ksat measurements were taken in temperate regions (8296 contained texture and bulk density information and were used to build PTFs) and 1443, 1106, 580, and 36 in tropical, arid, boreal, and polar regions, respectively, as shown in Fig. 2b. The points are often spatially clustered with the biggest cluster of points (1103 locations with 6532 Ksat measurements) in Florida (Grunwald, 2020). The Ksat database includes 4131 values from field measurement and 9155 values from laboratory measurements. In particular, different types of infiltrometers (e.g., Mini disc infiltrometer, Tension infiltrometer) and permeameters (e.g., Guelph permeameter, Aardvark permeameter) were used for the field measurements, whereas constant or falling head methods were mainly used in laboratory analyses (Table 4).
Out of the 13 258 Ksat measurements, 11 584 had information on soil texture, 11 262 on bulk density, 9787 on organic carbon, 7382 on field capacity, and 7411 on wilting point, while for 8994 measurements information for all basic soil properties (bulk density, soil texture, and organic carbon) was available (Fig. 2a).
The methods used to compute these soil properties (as much as we could extract from the literature and existing databases) are listed in the CSV file sol_ksat.pnts_metadata_cl_pedo.csv available at https://doi.org/10.5281/zenodo.3752721. Note that in addition to 11 584 soil texture values, 75 measurements have soil texture information with total (sand + silt + clay) less than 98 % or greater than 102 %. We did not use these values in the PTF development but included it in the database as “Error” class in the soil texture column.
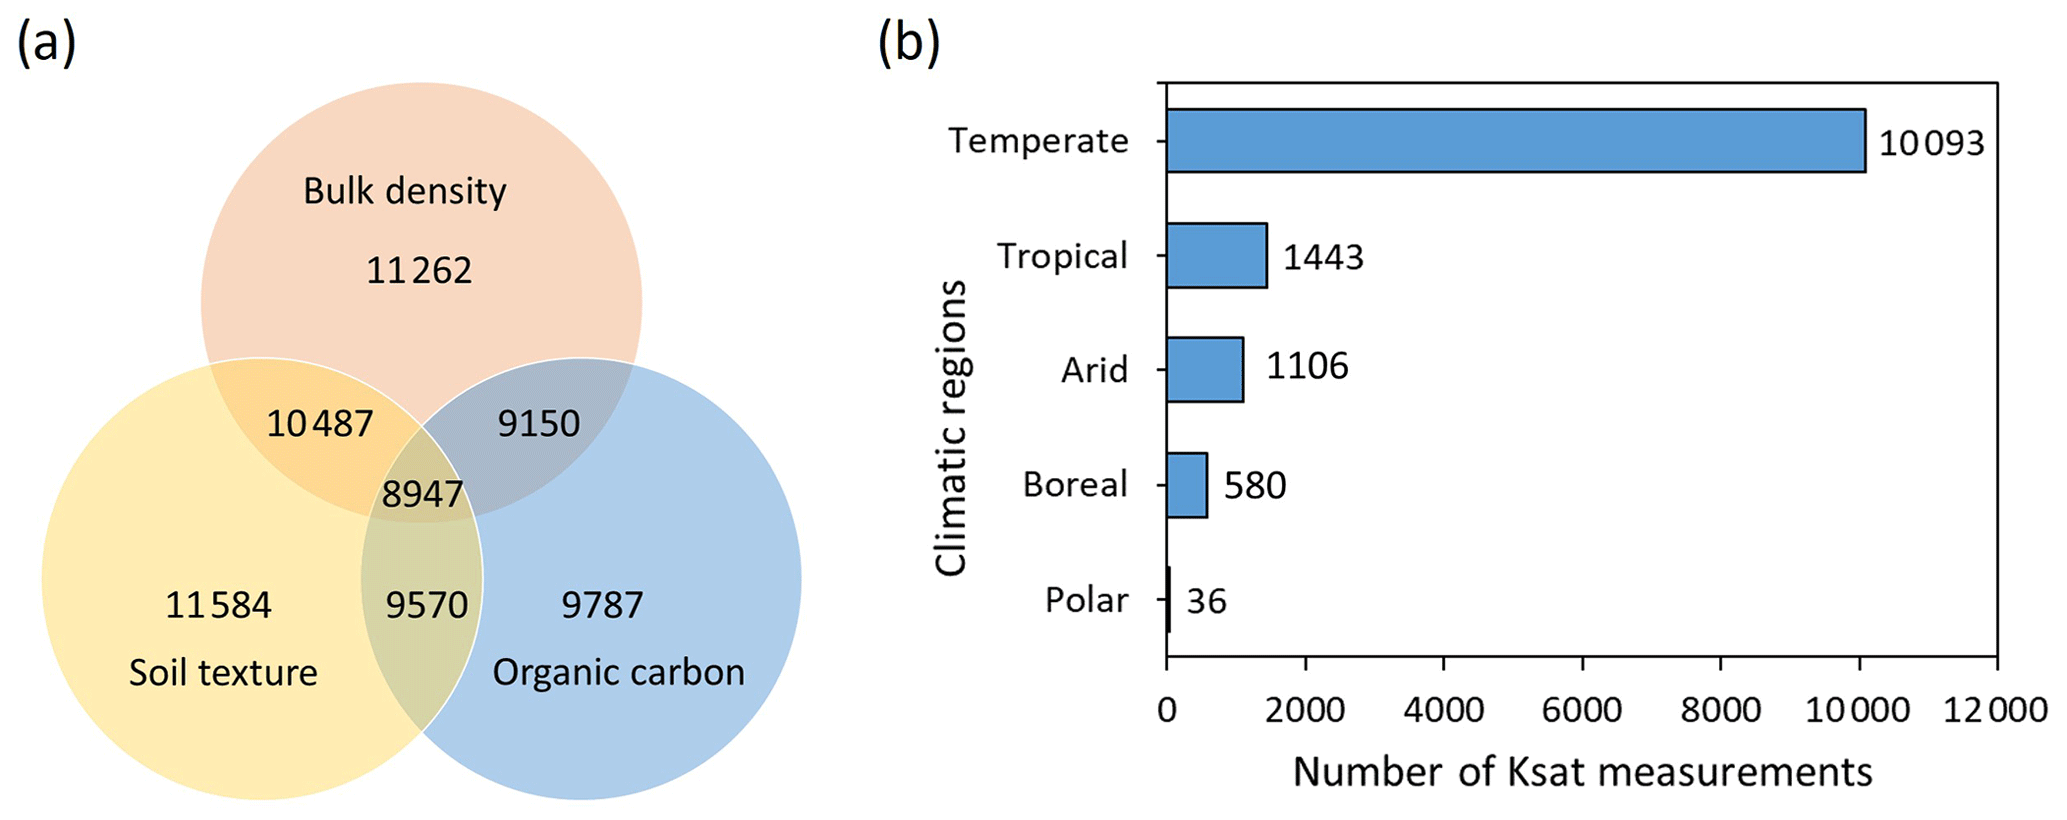
Figure 2Description of Ksat measurements. (a) Venn diagram illustrating the number of Ksat measurements in the SoilKsatDB for which bulk density, soil texture, and soil organic carbon data were also available. Note that the size of the intersecting areas does not represent the correct fractions. (b) Distribution of Ksat measurements among climatic regions.
3.2 Statistical characteristics of SoilKsatDB
The distribution of measurements based on soil texture classes is shown on the USDA soil texture triangle in Fig. 3a. The database covers all textural classes, with a high clustering in sandy soils due to the numerous samples from Florida (Grunwald, 2020), while only few measurements belong to the silt textural class. The increase in Ksat values in clayey and loamy soils for field methods (compared to laboratory methods) is likely due to the effect of soil structure. ANOVA with post hoc Tukey's HSD test showed that the mean values for all broad soil texture classes are significantly different from each other, except for clayey soils field Ksat values and sandy soils field Ksat values (see Table A1). The violin distribution plot in Fig. 3c shows the range of Ksat values for the different databases. Most of the datasets report Ksat values between 10−2 and 102.5 cm d−1, with a wider range of Ksat values observed in measurements from theses and reports (including studies with extreme values from sandy desert soils and low conductive clay soils) and from the SWIG database (databases 9 and 6 in Fig. 3c, respectively). Likewise, Fig. 3d shows the violin distribution of Ksat based on soil texture classes. The arithmetic mean of Ksat was highest for the sand and loamy sand soils (i.e., 2.68 and 1.99, respectively, in log 10 cm d−1), while the lowest mean values were found for silt and silty loam (i.e., 1.12 and 1.15, respectively, in log 10 cm d−1). Table A2 shows that the Ksat values in sand and loamy sand soil texture classes are significantly different from all other soil texture classes. However, silt, silty clay, and silty clay loam classes are not significantly different from clay, sandy clay, and sandy clay loam Ksat values.
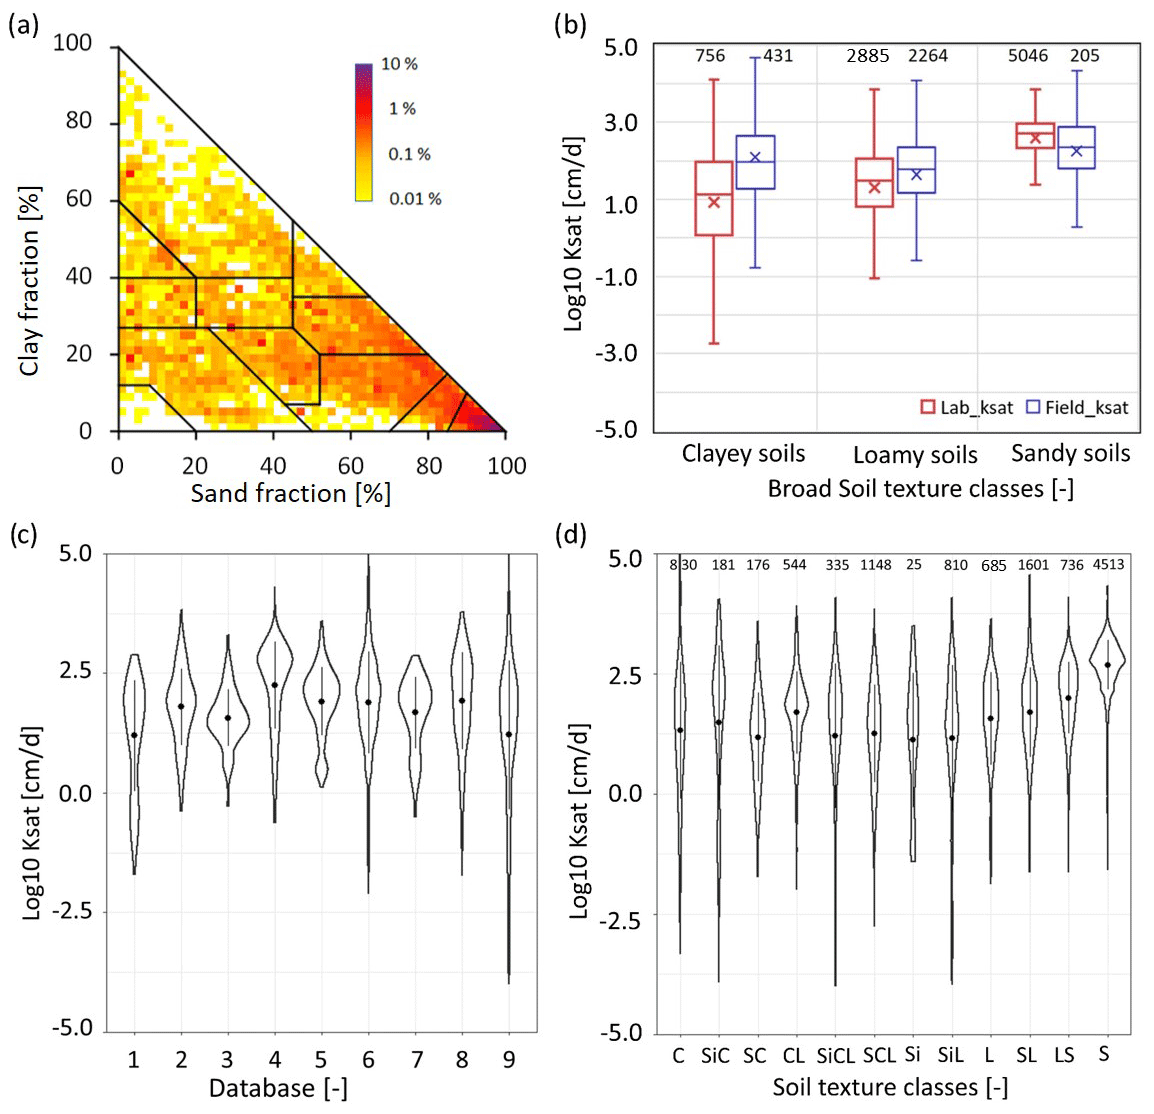
Figure 3Characterization of collected Ksat values: (a) distribution of soil samples on the USDA soil texture triangle, (b) distribution of Ksat values using broad soil texture classes (sandy soils: sand and loamy sand; loamy soils: sandy loam, loam, silt loam, silt, clay loam, and sandy clay loam; clayey soils: sandy clay, silty clay, and clay) based on laboratory and field measurements (the number of measurements is shown on the top of the figure). Panel (c) shows the range of Ksat values spanned by each data source. The database numbers 1–9 refer to different sources and databases. 1: Australia (Forrest et al., 1985), 2: Belgium (Vereecken et al., 2017), 3: China (Tian et al., 2017; Li et al., 2017), 4: Florida (Grunwald, 2020), 5: HYBRAS (Ottoni et al., 2018), 6: SWIG (Rahmati et al., 2018), 7: Tibetan Plateau (Zhao et al., 2018), 8: UNSODA (Nemes et al., 2001), 9: all other databases in Table 1. (d) Distribution of Ksat based on soil textural classes with the number of measurements shown on the top of the figure. In the violin diagrams (c, d), the dot represents the mean value and the line represents the standard deviation for each dataset.
Average values of Ksat and other hydrophysical properties are shown in Table 5. Higher average organic carbon and bulk density values were observed in clayey and loamy soils compared to sandy soils. Ksat values obtained from field measurements were on average higher than those obtained from laboratory Ksat values. Particularly for the clay texture class, much lower Ksat values were observed for laboratory (mean Ksat≈8 cm d−1) compared to field (mean Ksat≈110 cm d−1) measurements (Table 5). Figure 3b further illustrates the higher range of Ksat values obtained for finer texture soils (clay and loam) compared to coarser soils (sand).
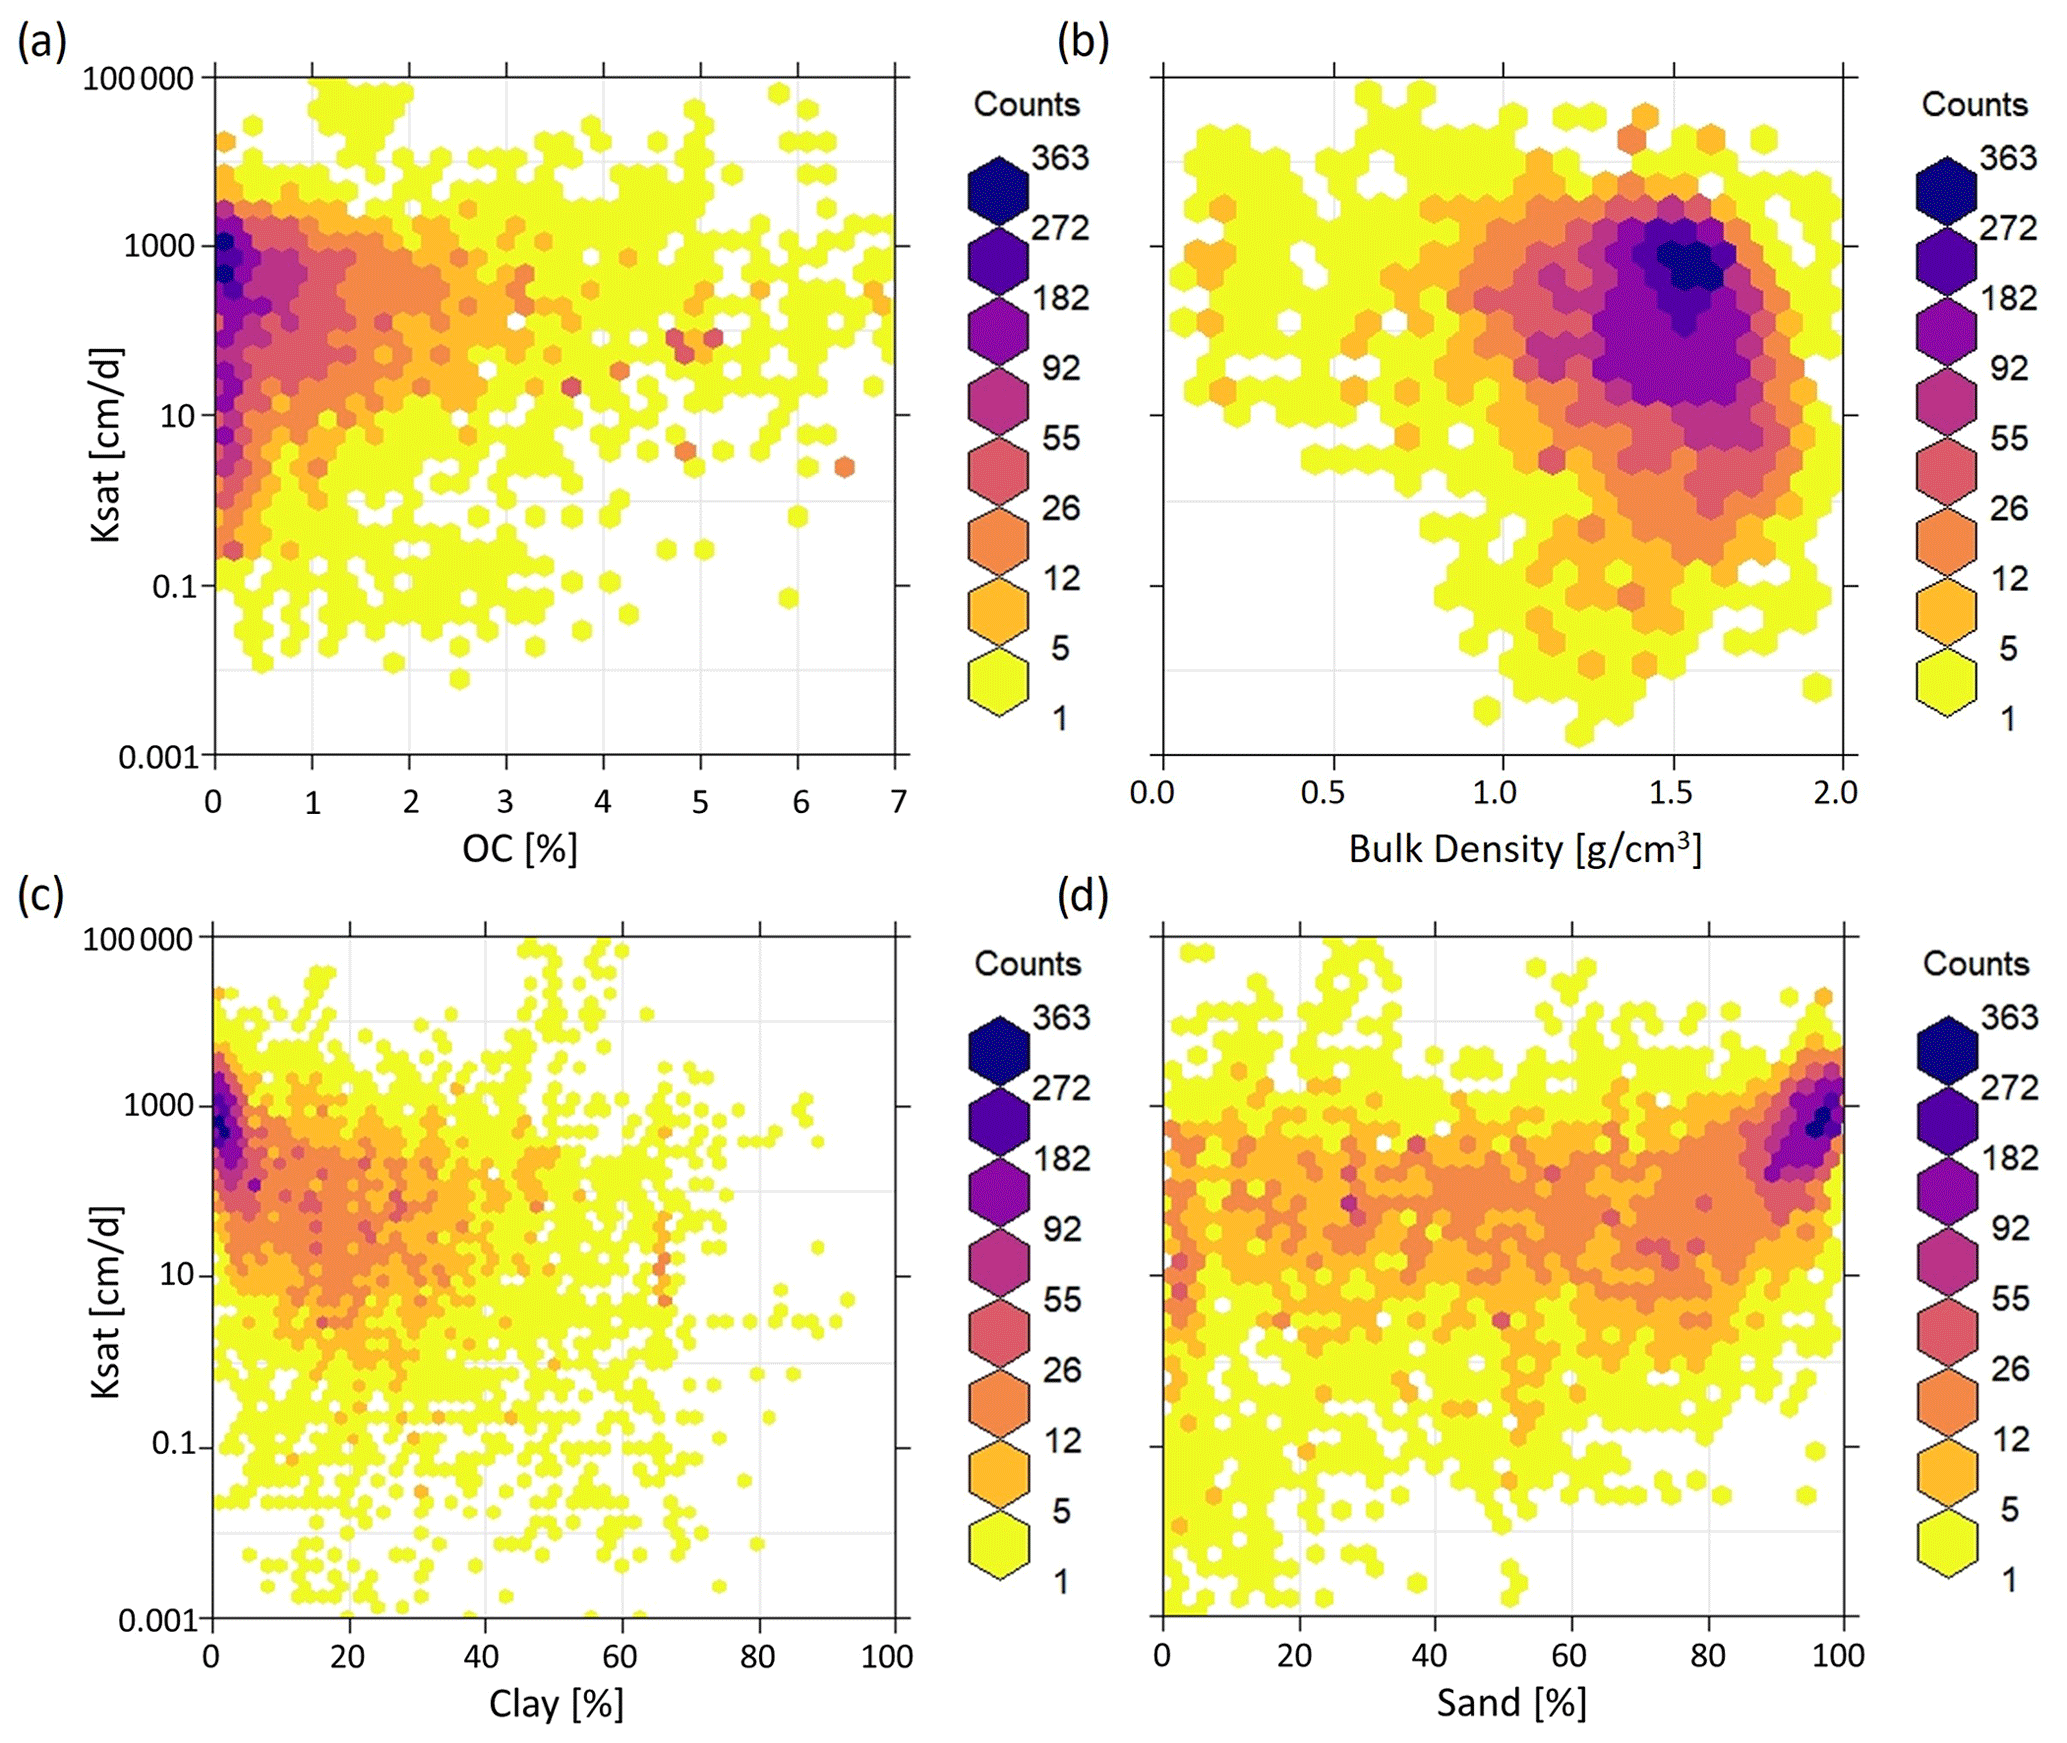
Figure 4Partial correlation between Ksat and (a) soil organic carbon OC (%), (b) bulk density (g cm−3), (c) clay (%), and (d) sand content (%) as heat maps. Ksat decreases with increasing clay content and bulk density, and increases with sand content. The color of each hexagonal cell shows the number of the measurements in each cell.
3.3 Ksat PTFs derivation
As a test application of SoilKsatDB, two PTFs were derived for Ksat (i.e., for measurements taken in temperate regions and based on laboratory measurements) using basic soil properties as covariates. General trends between Ksat and soil properties are shown in partial correlation plots in Fig. 4. The figure indicates that Ksat decreases with clay content and bulk density, and increases with sand content.
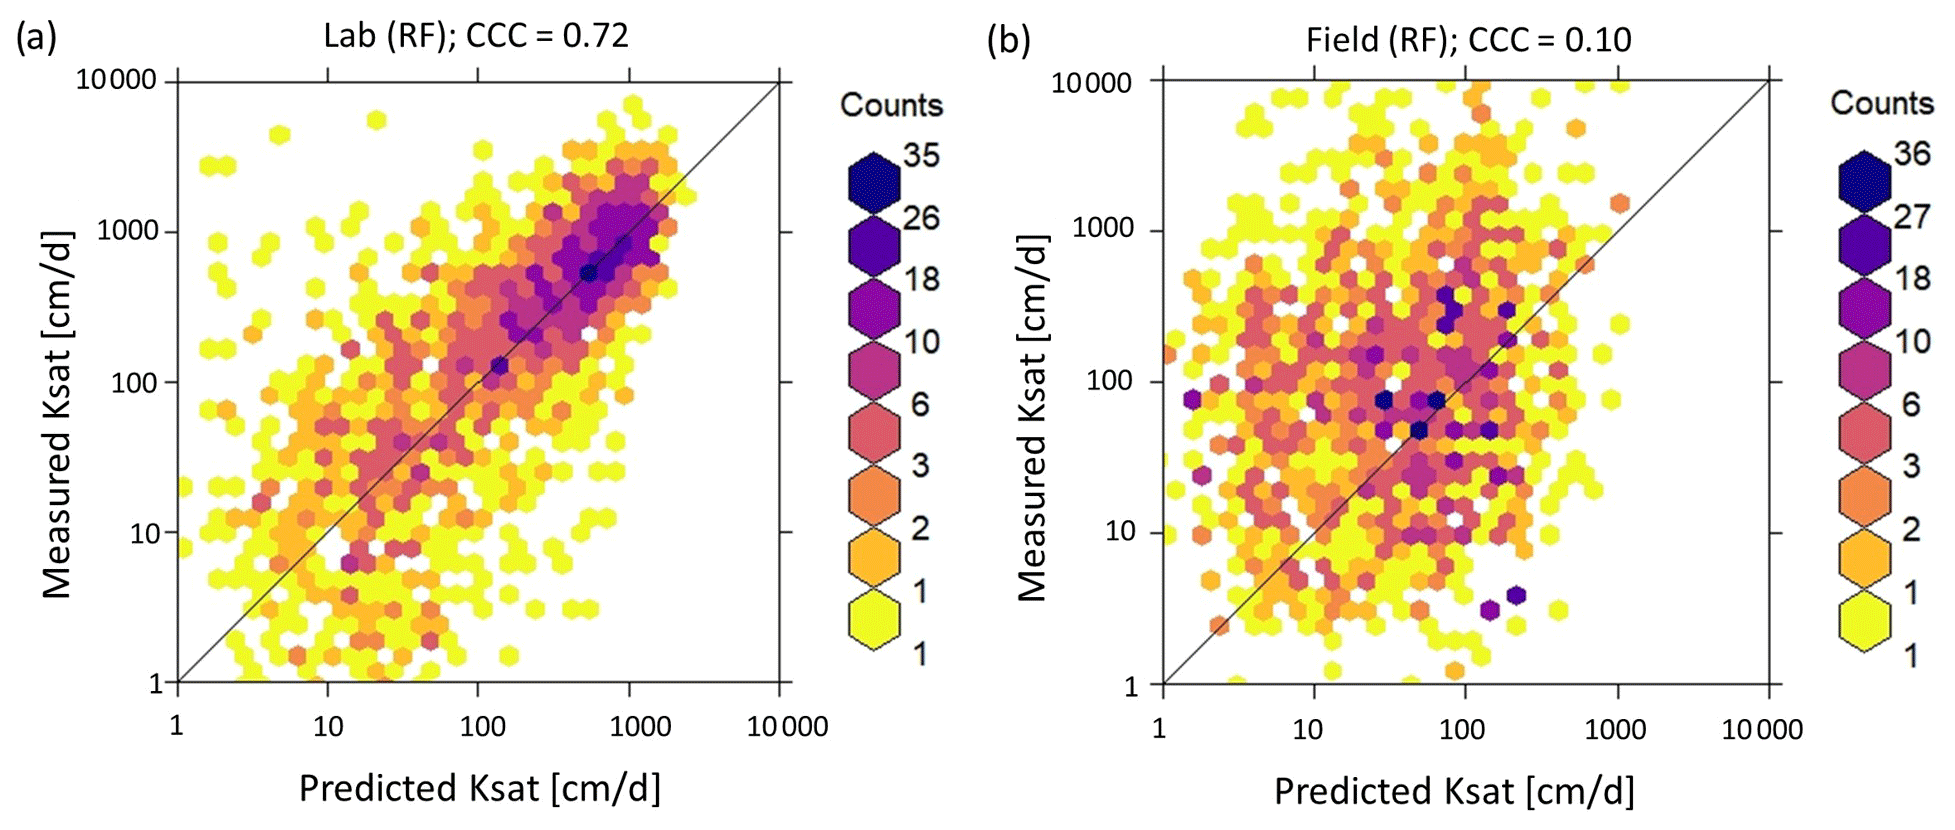
Figure 5The correlation between observed and predicted Ksat values obtained from random forest (RF) models. The RF-based pedotransfer function (PTF) model was fitted using data for laboratory measurements of Ksat and tested on both laboratory (a) and field (b) measurements. Results showed reasonable agreement (CCC = 0.72) using RF algorithms for laboratory measurements, but low CCC (0.10) for field measurements. PTFs developed based on laboratory measurements do not provide accurate estimates of Ksat measured in the field.
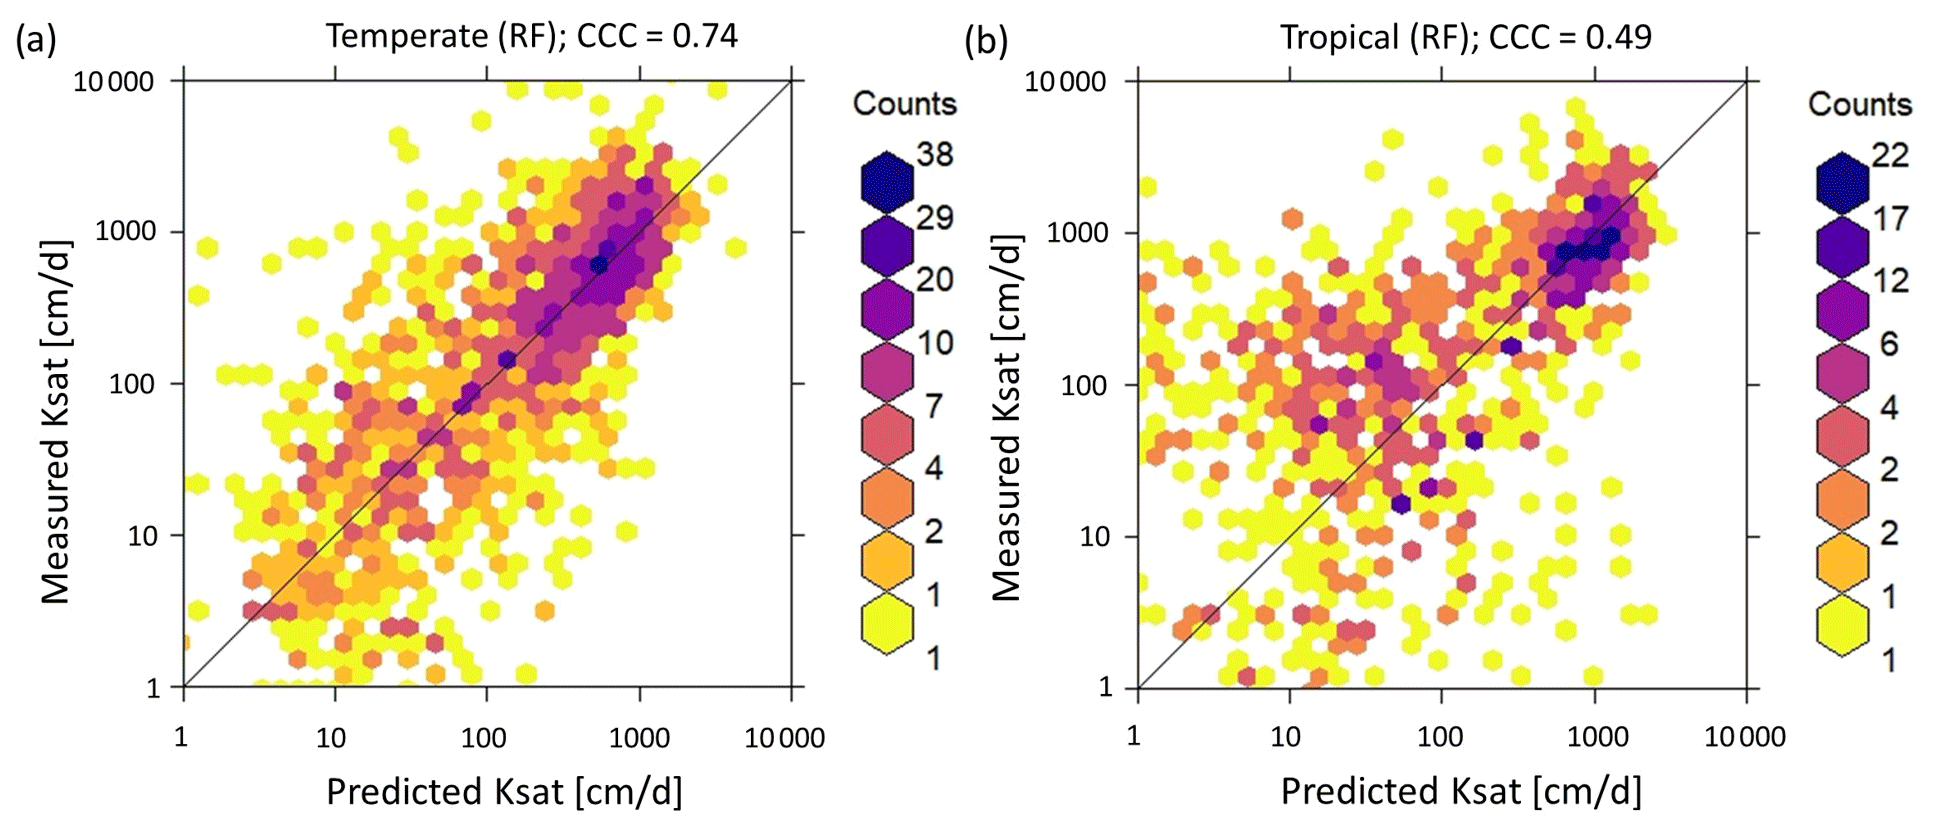
Figure 6Correlation between observed and predicted Ksat values obtained from the random forest (RF) model. The RF-based pedotransfer function (PTF) model was obtained by fitting 6637 training points measured in a temperate climate and tested on (a) data from temperate climate (1659 measurements) and (b) data from tropical areas (1111 measurements). PTFs showed good performance (CCC = 0.74) for the measurements taken in the temperate climate (including both laboratory and field measurements), but lower CCC values were obtained for tropical soil measurements (0.49 for RF). PTFs determined for temperate regions cannot be easily transferred to tropical regions because of the different soil forming processes.
Figure A1 shows the list of relative importance of the covariates to build PTFs for the measurements from temperate regions and laboratory-based measurements. Clay content was found to be the most important variable followed by sand and bulk density for the temperate climate PTF. On the other hand, sand content was the most important variable followed by clay and bulk density for the laboratory-based Ksat PTF. CCC, bias, and RMSE were, respectively, equal to 0.74, −0.006, and 0.64, for the temperate-based PTF, and 0.72, −0.02, and 0.66 for laboratory-based PTF.
As we will discuss in more detail in the next section, PTF models derived for temperate and laboratory-based Ksat values underestimated Ksat for tropical- and field-based Ksat values, respectively (see Figs. 6b and 5b). CCC, bias, and RMSE values were, respectively, equal to 0.49, −0.2, and 0.94 for tropical Ksat values, and to 0.10, −0.22, and 1.2 for field measured Ksat values.
4.1 Laboratory vs. field estimated Ksat: effect of soil structure
The Ksat values were, on average, higher for the field measurements compared to laboratory measurements for most soil texture classes (Table 5 and Figs. 3b and 5). The difference in laboratory and field-based Ksat values and larger range of Ksat values for fine textured soil is probably related to the effect of biologically induced soil structure that might be neglected in laboratory measurements. The omission of soil structures in many laboratory samples limits the possibility to properly reproduce field observations that are likely to be more affected by the presence of biopores (Fatichi et al., 2020) and other soil structural characteristics, such a cracks. In other words, variability in the Ksat values depends on the consideration (and existence) of soil structure by the measurement methods. Soil structural pores change the pore size distribution and subsequently affect Ksat values (Tuller and Or, 2002). Such an effect is more likely to be neglected in laboratory measurements rather than in field studies due to the small size of most laboratory samples. Presence or absence of large structural pores depends on the scale of measurements (that is usually larger in the field). Mohanty et al. (1994), for example, compared three field methods and one laboratory method and found that the sample size affects the measurement of Ksat due to the presence and absence of open-ended pores. Similarly, Ghanbarian et al. (2017) showed that the sample dimensions (e.g., internal diameter and height) also impact Ksat. The authors further developed a sample dimension-dependent PTF, which performed better than other PTFs available in the literature. Likewise, Braud et al. (2017) used three field methods for Ksat measurements and found significant variation between these measurement methods. Davis et al. (1996) also highlighted the necessity to choose the most appropriate scale of measurement for a particular soil sample when undertaking conductivity measurements. They tested small cores (73 mm wide and 63 mm high) and large cores (223 mm wide and 300 mm high) using the constant head method in the laboratory and found a difference of 1 to 3 orders of magnitude.
4.2 Temperate vs. tropical soils: effect of soil formation processes
PTFs obtained for temperate soils performed poorly for tropical soils (Fig. 6), with Ksat being underestimated by the temperate-based PTFs. This result is in agreement with Tomasella et al. (2000) who derived PTFs using data from tropical Brazilian soils, which did not properly capture observations in temperate soils. We argue that the significant differences for tropical and temperate soils are due to the differences in the soil-forming processes that also define the clay type and mineralogy. In fact, Oxisols (highly weathered clay soils as a result of high rainfall and temperature in tropical regions) are characterized by inactive (non-swelling) clay minerals. In contrast to tropical soils, active (smectite) and moderately active clay minerals (illite) are the dominant clay minerals in temperate regions. These swelling clay minerals retain water within internal structures with very low hydraulic conductivity. Therefore, such a difference in clay mineralogy is likely responsible for the underestimation of Ksat in tropical soils from PTFs based on measurements in temperate areas. In addition, soil structure formation processes may be different in tropical and temperate regions (perennial activities of vegetation in the tropics), which would also lead to differences between measured Ksat values for the two climatic regions.
4.3 Limitations of SoilKsatDB
We put an effort to combine laboratory and field data from across the globe. However, we acknowledge that there are still gaps in some regions, such as Russia and higher northern latitudes in general, which may result in uncertainties in Ksat estimates in such regions. The SoilKsatDB could also be of limited use for fine-resolution applications because many data points were characterized by limited spatial accuracy and missing soil depth information. Specifically, the spatial accuracy of many points is between tens of meters and several kilometers (see the methodology sections regarding the extraction of the spatial locations using Google Earth). Many of the records in the SoilKsatDB come from legacy scientific reports and the original authors could not be traced and contacted, hence we advise to use these data with caution. In addition, in the SWIG database, the soil depth and measurement method information were not provided, and often one location was used to represent an entire watershed. We tried to revisit each publication and extract the most accurate coordinates of assumed sampling locations. In addition, we assumed that most of the samples were obtained from field measurements as authors used different infiltrometers to compute Ksat, so there might be a few points in our SoilKsatDB that belong to laboratory measurements and that we have incorrectly assigned to field measurements. Moreover, the field measurements in the database are a mix of many Ksat measurement methods.
For each measurement, a location accuracy (0–100 m = highly accurate, >10 000 m = least accurate) was assigned based on the sampling location accuracy. The location accuracy can be used as a weight or probability argument in machine learning for Ksat mapping. We are aware that this was a rather subjective decision; a more objective way to assign weights would be to use the actual spatial positioning errors. Because these were not available for most of the datasets, we have opted for the definition of a location accuracy estimated from the available documentation.
4.4 Further developments
The advancement in remote sensing technology opens the doors to link the hydraulic properties with global environmental data. Satellite-based maps of environmental characteristics such as local information on vegetation, climate, and topography for specific areas, which are often ignored by basic PTFs, can be incorporated. For example, Sharma et al. (2006) developed PTFs using environmental variables such as topography and vegetation and concluded that these attributes, at fine spatial scales, were useful to capture the observed variations within the soil mapping units. Likewise, Szabó et al. (2019) used a random forest machine learning algorithm for mapping soil hydraulic properties and incorporated local environmental information such as vegetation, climate, and topography.
All collected data and related soil characteristics are provided online for reference and are available at https://doi.org/10.5281/zenodo.3752721 (Gupta et al., 2020). Please note that our zenodo collection of files contains more than is described in the paper.
We compiled a comprehensive global dataset of Ksat measurements (N=13 258) by importing, quality controlling, and standardizing tabular data from existing soil profile databases and legacy reports, as well as the scientific literature. The SoilKsatDB covers a broad range of soil types and climatic regions and hence is useful in global models. A larger variation in Ksat values was observed for fine-textured soils compared to coarse-textured soils, indicating the effect of soil structure on Ksat. Moreover, Ksat values obtained from field measurements were generally higher than those from laboratory measurements, likely due to the impact of soil structural pores in field measurements.
The new database was used to develop PTFs using RF algorithms for Ksat values obtained for temperate climates and for laboratory measurements. PTFs developed for a certain climatic region (temperate) or measurement method (laboratory) could not be satisfactorily applied to estimate Ksat for other regions (tropical) or measurement method (field) due to the role of different soil forming processes (inactive clay minerals in tropical soils and impact of biopores in field measurements).
There are still some gaps in the geographical representation of the data, especially in Russia and the higher northern latitudes, that could induce uncertainty in global modeling. Therefore, the dataset can be further improved by covering the missing areas thus allowing better accuracy in modeling applications.
The SoilKsatDB was developed in R software and is available via https://doi.org/10.5281/zenodo.3752721. We have made the code and data publicly available to enable further developments and improvements.
Table A1Listed p values under 95 percent confidence interval for each class to show the significant difference in Ksat between texture classes (see Fig. 3b). The significant difference was computed using ANOVA (analysis of variance) with post hoc Tukey's HSD (honestly significant difference). The values in bold show the significant difference in Ksat between two soil texture classes.
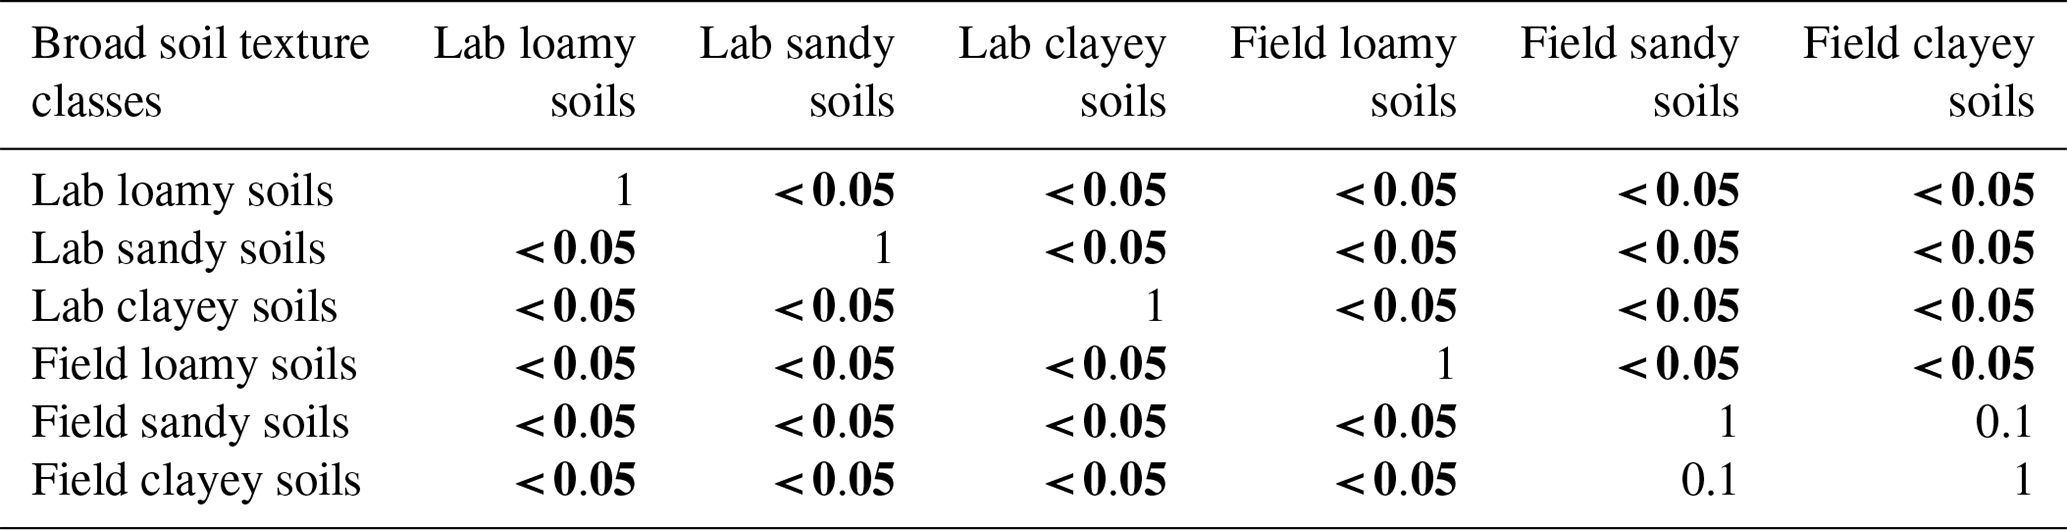
Table A2Listed p values under 95 % confidence interval for each class to show the significant difference in Ksat between texture classes for Fig. 3d. The significant difference was computed using ANOVA (analysis of variance) with post hoc Tukey's HSD (honestly significant difference) test. The values in bold show the significant difference in Ksat between two soil texture classes.
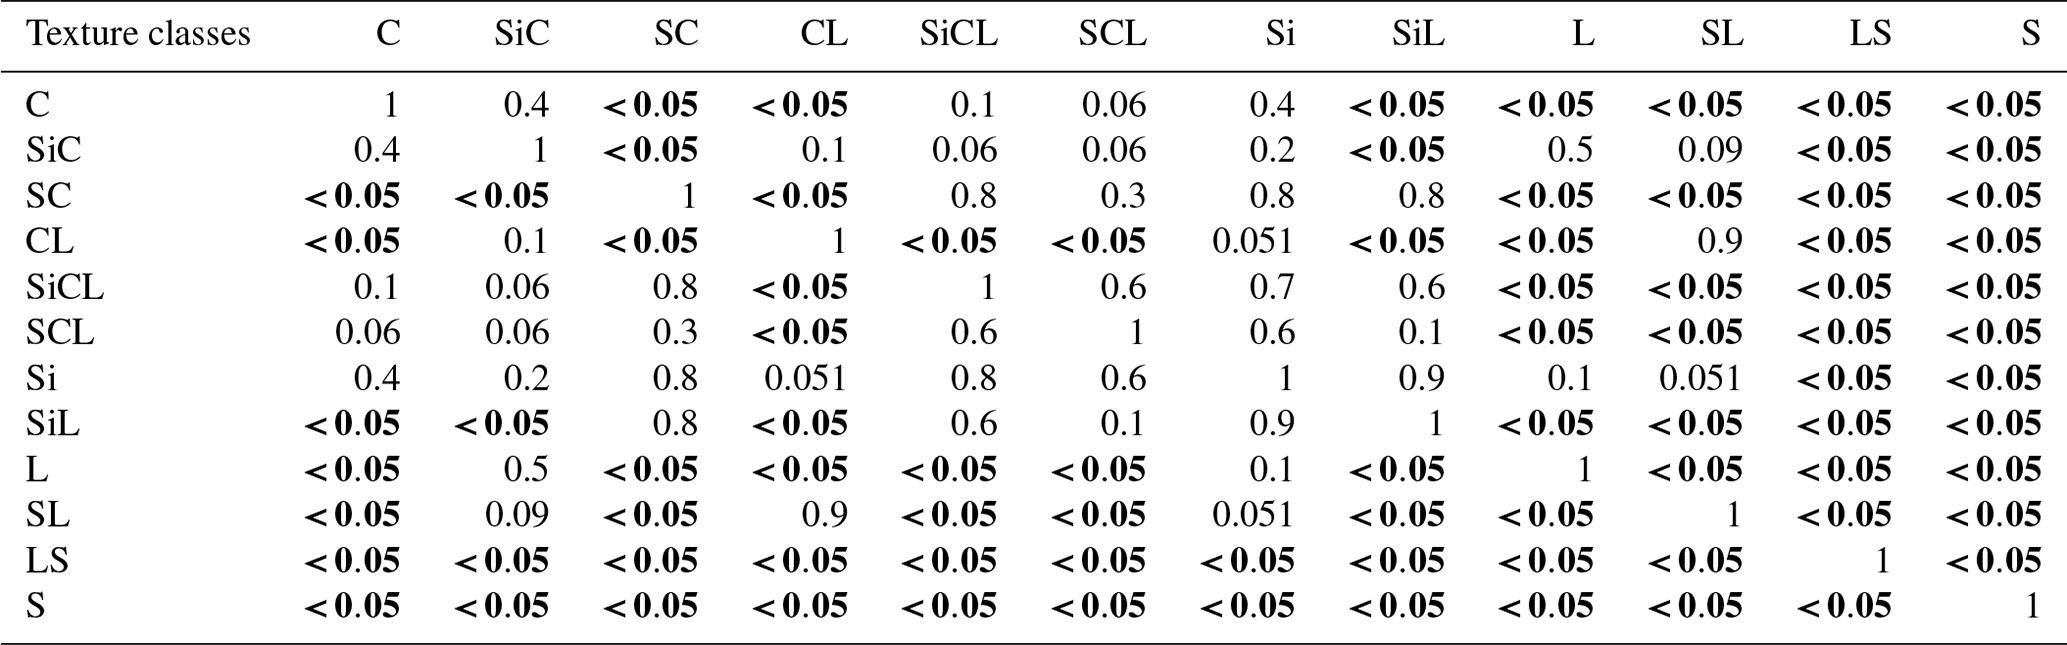
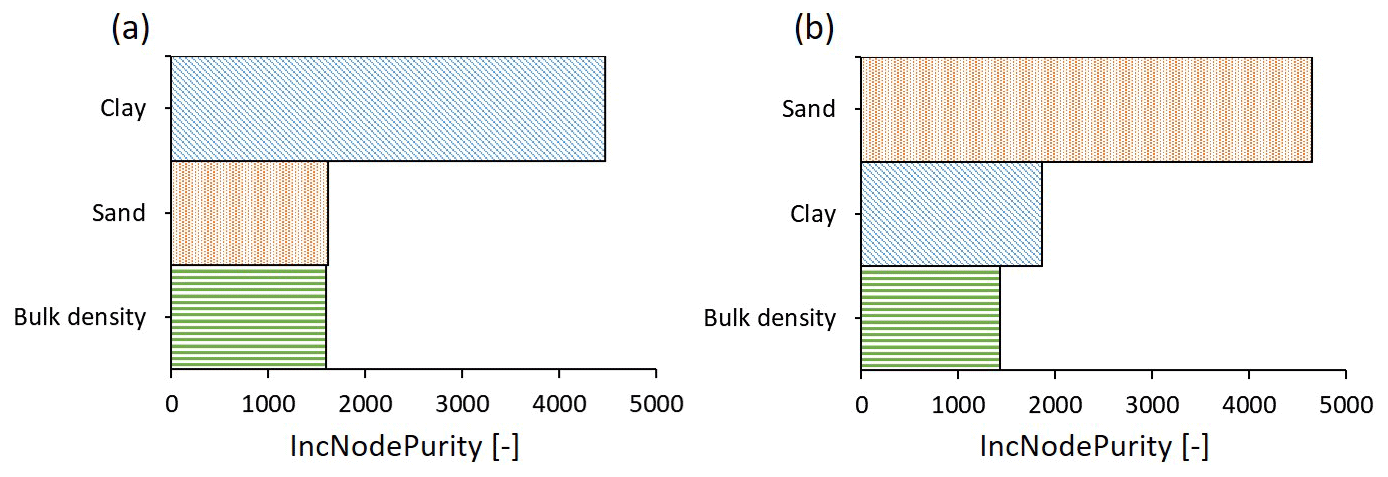
Figure A1Importance of the variables for developing the PTFs for Ksat using the random forest algorithm. The x axis displays the average increase in node purity (the larger the value, the more important a covariate). (a) Clay content was the most important variable followed by sand and bulk density for the random forest model built on data from temperate regions. (b) Sand content was the most important variable followed by clay and bulk density for the random forest model based on laboratory measurements.
The supplement related to this article is available online at: https://doi.org/10.5194/essd-13-1593-2021-supplement.
SG processed the data and assembled the database. SG and TH performed the data analyses. SG wrote the first draft of the manuscript. TH, PL, SB, and DO edited the manuscript. SG revised the manuscript and PL, SB, and DO made significant contributions to the data interpretation. TH, PL, SB, and DO read and approved the final version of the manuscript. DO supervised the study.
The authors declare that they have no conflict of interest.
The SoilKsatDB is a compilation of numerous existing datasets from which the most significant are: SWIG dataset (Rahmati et al., 2018), UNSODA (Leij et al., 1996; Nemes et al., 2001), and HYBRAS (Ottoni et al., 2018). The study was supported by ETH Zurich (Grant ETH-18 18-1). OpenGeoHub maintains a global repository of Earth System Science datasets at http://www.openlandmap.org (last access: 25 March 2021). We thank Zhongwang Wei for helping us collect the datasets and for insightful discussions. We acknowledge Samuel Bickel (ETH Zurich) for the help with high performance computing. We would also like to thank two anonymous reviewers, Attila Nemes, and Sibylle K. Hassler (topical editor) for their constructive feedback to improve the manuscript.
This research has been supported by the ETH Zurich (grant no. ETH-18 18-1).
This paper was edited by Sibylle K. Hassler and reviewed by two anonymous referees.
Abagandura, G. O., Nasr, G. E.-D. M., and Moumen, N. M.: Influence of tillage practices on soil physical properties and growth and yield of maize in jabal al akhdar, Libya, Open Journal of Soil Science, 7, 118–132, 2017. a
Abdi, H. and Williams, L. J.: Tukey's honestly significant difference (HSD) test, Encyclopedia of research design, 3, 583–585, 2010. a
Amer, A.-M. M., Logsdon, S. D., and Davis, D.: Prediction of hydraulic conductivity as related to pore size distribution in unsaturated soils, Soil Sci., 174, 508–515, 2009. a
Amoozegar, A.: A compact constant-head permeameter for measuring saturated hydraulic conductivity of the vadose zone, Soil Sci. Soc. Am. J., 53, 1356–1361, 1989. a
Amoozegar, A. and Warrick, A.: Hydraulic conductivity of saturated soils: field methods, Methods of Soil Analysis: Part 1, 5, 735–770, 1986. a
Andrade, R. B.: The influence of bulk density on the hydraulic conductivity and water content-matric suction relation of two soils, PhD thesis, Utah State University, 1971. a
Arend, J. L.: Infiltration rates of forest soils in the Missouri Ozarks as affected by woods burning and litter removal, J. For., 39, 726–728, 1941. a
Bagarello, V. and Sgroi, A.: Using the single-ring infiltrometer method to detect temporal changes in surface soil field-saturated hydraulic conductivity, Soil Till. Res., 76, 13–24, 2004. a
Baird, A. J.: Field estimation of macropore functioning and surface hydraulic conductivity in a fen peat, Hydrol. Process., 11, 287–295, 1997. a
Baird, A. J., Low, R., Young, D., Swindles, G. T., Lopez, O. R., and Page, S.: High permeability explains the vulnerability of the carbon store in drained tropical peatlands, Geophys. Res. Lett., 44, 1333–1339, 2017. a, b
Bambra, A.: Soil loss estimation in experimental orchard at Nauni in Solan district of Himachal Pradesh, PhD thesis, Yashwant Singh Parmar, University of horticulture and forestry, Solan (Nauni) HP, 2016. a
Batjes, N. H.: Total carbon and nitrogen in the soils of the world, Eur. J. Soil Sci., 47, 151–163, 1996. a
Becker, R., Gebremichael, M., and Märker, M.: Impact of soil surface and subsurface properties on soil saturated hydraulic conductivity in the semi-arid Walnut Gulch Experimental Watershed, Arizona, USA, Geoderma, 322, 112–120, 2018. a, b
Beyer, M., Gaj, M., Hamutoko, J. T., Koeniger, P., Wanke, H., and Himmelsbach, T.: Estimation of groundwater recharge via deuterium labelling in the semi-arid Cuvelai-Etosha Basin, Namibia, Isot. Environ. Healt. S., 51, 533–552, 2015. a
Bhattacharyya, R., Prakash, V., Kundu, S., and Gupta, H.: Effect of tillage and crop rotations on pore size distribution and soil hydraulic conductivity in sandy clay loam soil of the Indian Himalayas, Soil Till. Res., 86, 129–140, 2006. a
Blake, W. H., Theocharopoulos, S. P., Skoulikidis, N., Clark, P., Tountas, P., Hartley, R., and Amaxidis, Y.: Wildfire impacts on hillslope sediment and phosphorus yields, J. Soils Sed., 10, 671–682, 2010. a
Bodhinayake, W., Si, B. C., and Noborio, K.: Determination of hydraulic properties in sloping landscapes from tension and double-ring infiltrometers, Vadose Zone J., 3, 964–970, 2004. a
Boike, J., Roth, K., and Overduin, P. P.: Thermal and hydrologic dynamics of the active layer at a continuous permafrost site (Taymyr Peninsula, Siberia), Water Resour. Res., 34, 355–363, 1998. a
Bonell, M. and Williams, J.: The two parameters of the Philip infiltration equation: their properties and spatial and temporal heterogeneity in a red earth of tropical semi-arid Queensland, J. Hydrol., 87, 9–31, 1986. a
Bonsu, M. and Masopeh, B.: Saturated hydraulic conductivity values of some forest soils of Ghana determined by a simple method, Ghana Journal of Agricultural Science, 29, 75–80, 1996. a
Braud, I., Desprats, J.-F., Ayral, P.-A., Bouvier, C., and Vandervaere, J.-P.: Mapping topsoil field-saturated hydraulic conductivity from point measurements using different methods, J. Hydrol. Hydromech., 65, 264–275, 2017. a
Breiman, L.: Random forests, Machine Learn., 45, 5–32, 2001. a
Bruand, A., Duval, O., and Cousin, I.: Estimation des propriétés de rétention en eau des sols à partir de la base de données SOLHYDRO: Une première proposition combianant le type d'horizon, sa texture et sa densité apparente., Étude et Gestion des Sols, 11, 323–334, 2004. a
Campbell, R. E., Baker, J., Ffolliott, P. F., Larson, F. R., and Avery, C. C.: Wildfire effects on a ponderosa pine ecosystem: an Arizona case study, USDA For. Serv. Res. Pap. RM-191, US Department of Agriculture, Forest Service, Rocky Mountain Forest and Range Experimental Station, Fort Collins, CO, 12 pp., 191, 1977. a
Chang, Y.-J.: Predictions of saturated hydraulic conductivity dynamics in a midwestern agricultural watershed, Iowa, PhD thesis, University of Iowa, USA, 2010. a
Chief, K., Ferré, T., and Nijssen, B.: Correlation between air permeability and saturated hydraulic conductivity: Unburned and burned soils, Soil Sci. Soc. Am. J., 72, 1501–1509, 2008. a
Cisneros, J., Cantero, J., and Cantero, A.: Vegetation, soil hydrophysical properties, and grazing relationships in saline-sodic soils of Central Argentina, Can. J. Soil Sci., 79, 399–409, 1999. a
Coelho, M. A.: Spatial variability of water related soil physical properties., PhD thesis, The University of Arizona, USA, 1974. a
Conedera, M., Peter, L., Marxer, P., Forster, F., Rickenmann, D., and Re, L.: Consequences of forest fires on the hydrogeological response of mountain catchments: a case study of the Riale Buffaga, Ticino, Switzerland, Earth Surf. Processes Landf., 28, 117–129, 2003. a
Cornelis, W. M., Ronsyn, J., Van Meirvenne, M., and Hartmann, R.: Evaluation of pedotransfer functions for predicting the soil moisture retention curve, Soil Sci. Soc. Am. J., 65, 638–648, 2001. a
Daniel, S., Gabiri, G., Kirimi, F., Glasner, B., Näschen, K., Leemhuis, C., Steinbach, S., and Mtei, K.: Spatial distribution of soil hydrological properties in the Kilombero floodplain, Tanzania, Hydrology, 4, 1–13, 2017. a
Davis, S. H., Vertessy, R. A., Dunkerley, D. L., and Mein, R. G.: The influence of scale on the measurement of saturated hydraulic conductivity in forest soils, in: National Conference Publication-Institution of Engineers Australia NCP, 1, 103–108, Institution of Engineers, Australia, 1996. a
Deshmukh, H., Chandran, P., Pal, D., Ray, S., Bhattacharyya, T., and Potdar, S.: A pragmatic method to estimate plant available water capacity (PAWC) of rainfed cracking clay soils (Vertisols) of Maharashtra, Central India, Clay Res., 33, 1–14, 2014. a
Ebel, B. A., Moody, J. A., and Martin, D. A.: Hydrologic conditions controlling runoff generation immediately after wildfire, Water Resour. Res., 48, 1–13, 2012. a
Elnaggar, A.: Spatial Variability of Soil Physiochemical Properties in Bahariya Oasis, Egypt, Egyptian J. Soil Sci., 57, 313–328, https://doi.org/10.21608/EJSS.2017.4438, 2017. a
El-Shafei, Y., Al-Darby, A., Shalaby, A., and Al-Omran, A.: Impact of a highly swelling gel-forming conditioner (acryhope) upon water movement in uniform sandy soils, Arid Land Res. Manag., 8, 33–50, 1994. a
Fatichi, S., Or, D., Walko, R., Vereecken, H., Young, M. H., Ghezzehei, T. A., Hengl, T., Kollet, S., Agam, N., and Avissar, R.: Soil structure is an important omission in Earth System Models, Nat. Commun., 11, 1–11, 2020. a
Ferreira, A., Coelho, C., Boulet, A., and Lopes, F.: Temporal patterns of solute loss following wildfires in Central Portugal, Int. J. Wildland Fire, 14, 401–412, 2005. a
Forrest, J., Beatty, H., Hignett, C., Pickering, J., and Williams, R.: Survey of the physical properties of wheatland soils in eastern Australia, Tech. rep., CSIRO Division of Soils, Australia, 1985. a, b, c, d
Ganiyu, S., Rabiu, J., and Olatoye, R.: Predicting hydraulic conductivity around septic tank systems using soil physico-chemical properties and determination of principal soil factors by multivariate analysis, Journal of King Saud University-Science, 32, 555–562, 2018. a
Ghanbarian, B., Taslimitehrani, V., and Pachepsky, Y. A.: Accuracy of sample dimension-dependent pedotransfer functions in estimation of soil saturated hydraulic conductivity, Catena, 149, 374–380, 2017. a
Glinski, J., Ostrowski, J., Stepniewska, Z., and Stepniewski, W.: Soil sample bank representing mineral soils of Poland, Problemy Agrofizyki (Poland), 1991. a
Gliński, J., Stępniewski, W., Stępniewska, Z., Włodarczyk, T., Brzezińska, M., et al.: Characteristics of aeration properties of selected soil profiles from central Europe., Int. Agrophys., 14, 17–31, 2000. a
Greenwood, W. and Buttle, J.: Effects of reforestation on near-surface saturated hydraulic conductivity in a managed forest landscape, southern Ontario, Canada, Ecohydrology, 7, 45–55, 2014. a
Grunwald, S.: Florida soil characterization data, Soil and water science department, IFAS-Instituite of food and agriculture science, University of Florida, available at: http://soils.ifas.ufl.edu (last access: 8 January 2021), 2020. a, b, c, d, e
Gupta, R., Rudra, R., Dickinson, W., Patni, N., and Wall, G.: Comparison of saturated hydraulic conductivity measured by various field methods, Transactions of the ASAE, 36, 51–55, 1993. a, b
Gupta, S., Hengl, T., Lehmann, P., Bonetti, S., and Or, D.: SoilKsatDB: global compilation of soil saturated hydraulic conductivity measurements for geoscience applications, Zenodo, https://doi.org/10.5281/zenodo.3752721, 2020. a, b, c
Gwenzi, W., Hinz, C., Holmes, K., Phillips, I. R., and Mullins, I. J.: Field-scale spatial variability of saturated hydraulic conductivity on a recently constructed artificial ecosystem, Geoderma, 166, 43–56, 2011. a
Habecker, M., McSweeney, K., and Madison, F.: Identification and genesis of fragipans in Ochrepts of north central Wisconsin, Soil Sci. Soc. Am. J., 54, 139–146, 1990. a
Habel, A. Y.: The role of climate on the aggregate stability and soil erodibility of selected El-Jabal Al-Akhdar soils-Libya, Alexandria Journal of Agricultural Research, 58, 261–271, 2013. a
Hamel, P., Falinski, K., Sharp, R., Auerbach, D. A., Sánchez-Canales, M., and Dennedy-Frank, P. J.: Sediment delivery modeling in practice: Comparing the effects of watershed characteristics and data resolution across hydroclimatic regions, Sci. Total Environ., 580, 1381–1388, 2017. a
Hao, M., Zhang, J., Meng, M., Chen, H. Y., Guo, X., Liu, S., and Ye, L.: Impacts of changes in vegetation on saturated hydraulic conductivity of soil in subtropical forests, Sci. Rep.-UK, 9, 1–9, 2019. a
Hardie, M. A., Cotching, W. E., Doyle, R. B., Holz, G., Lisson, S., and Mattern, K.: Effect of antecedent soil moisture on preferential flow in a texture-contrast soil, J. Hydrol., 398, 191–201, 2011. a
Hastie, T., Tibshirani, R., and Friedman, J.: The Elements of Statistical Learning; Data Mining, Inference and Prediction, Springer, New York, 2 edn., 2009. a
Haverkamp, R., Zammit, C., Bouraoui, F., Rajkai, K., Arrúe, J., and Heckmann, N.: GRIZZLY: Grenoble catalogue of soils: Survey of soil field data and description of particle-size, soil water retention and hydraulic conductivity functions, Lab. d'Etude des Transferts en Hydrol. et Environ., Grenoble, France, 1998. a
Helbig, M., Boike, J., Langer, M., Schreiber, P., Runkle, B. R., and Kutzbach, L.: Spatial and seasonal variability of polygonal tundra water balance: Lena River Delta, northern Siberia (Russia), Hydrogeol. J., 21, 133–147, 2013. a
Hiederer, R., Jones, R. J., and Daroussin, J.: Soil Profile Analytical Database for Europe (SPADE): reconstruction and validation of the measured data (SPADE/M), Geografisk Tidsskrift-Danish Journal of Geography, 106, 71–85, 2006. a
Hilton, A. and Armstrong, R. A.: Statnote 6: post-hoc ANOVA tests, Microbiologist, 2006, 34–36, 2006. a
Hinton, H.: Land Management Controls on Hydraulic Conductivity of an Urban Farm in Atlanta, GA, PhD thesis, Georgia State University, USA, 2016. a, b
Hodnett, M. and Tomasella, J.: Marked differences between van Genuchten soil water-retention parameters for temperate and tropical soils: a new water-retention pedo-transfer functions developed for tropical soils, Geoderma, 108, 155–180, 2002. a, b
Horn, A., Stumpfe, A., Kues, J., Zinner, H.-J., and Fleige, H.: Die Labordatenbank des Niedersächsischen Bodeninformationssystems (NIBIS)-. Teil: Fachinformationssystem Bodenkunde, Geologisches Jahrbuch. Reihe A, Allgemeine und regionale Geologie BR Deutschland und Nachbargebiete, Tektonik, Stratigraphie, Paläontologie, Tagung der Gesellschaft für Geologische Wissenschaften, 4 May 1988, Elbingerode, Stratigraphie, Lithologie, Tektonik und Lagerstätten ausgewählter Bereiche im Unter- und Mittelharz, 59–97, 1991. a
Houghton, T. B.: Hydrogeologic characterization of an alpine glacial till, Snowy Range, Wyoming, PhD thesis, Colorado State University, USA, Libraries, 2011. a
Hu, W., She, D., Shao, M., Chun, K. P., and Si, B.: Effects of initial soil water content and saturated hydraulic conductivity variability on small watershed runoff simulation using LISEM, Hydrol. Sci. J., 60, 1137–1154, 2015. a
Imeson, A., Verstraten, J., Van Mulligen, E., and Sevink, J.: The effects of fire and water repellency on infiltration and runoff under Mediterranean type forest, Catena, 19, 345–361, 1992. a
Jabro, J.: Estimation of saturated hydraulic conductivity of soils from particle size distribution and bulk density data, Transactions of the ASAE, 35, 557–560, 1992. a
Jarvis, N., Koestel, J., Messing, I., Moeys, J., and Lindahl, A.: Influence of soil, land use and climatic factors on the hydraulic conductivity of soil, Hydrol. Earth Syst. Sci., 17, 5185–5195, https://doi.org/10.5194/hess-17-5185-2013, 2013. a
Johansen, M. P., Hakonson, T. E., and Breshears, D. D.: Post-fire runoff and erosion from rainfall simulation: contrasting forests with shrublands and grasslands, Hydrol. Process., 15, 2953–2965, 2001. a
Kanemasu, E.: Soil Hydraulic Conductivity Data (FIFE), ORNL Distributed Active Archive Center, https://doi.org/10.3334/ORNLDAAC/107, 1994. a, b
Katimon, A. and Hassan, A. M. M.: Field hydraulic conductivity of some Malaysian peat, Malaysian Journal of Civil Engineering, 10, 14–20,, 1997. a
Keisling, T. C.: Precision with which selected physical properties of similar soils can be estimated, PhD thesis, Oklahoma State University, USA, 1974. a
Kelly, T. J., Baird, A. J., Roucoux, K. H., Baker, T. R., Honorio Coronado, E. N., Ríos, M., and Lawson, I. T.: The high hydraulic conductivity of three wooded tropical peat swamps in northeast Peru: measurements and implications for hydrological function, Hydrol. Process., 28, 3373–3387, 2014. a
Kirby, J., Kingham, R., and Cortes, M.: Texture, density and hydraulic conductivity of some soils in San Luis province, Argentina, Ciencia del suelo, 19, 20–28, 2001. a
Klute, A.: Laboratory measurement of hydraulic conductivity of saturated soil, Methods of Soil Analysis: Part 1 Physical and Mineralogical Properties, Including Statistics of Measurement and Sampling, 9, 210–221, 1965. a
Klute, A. and Dirksen, C.: Hydraulic conductivity and diffusivity: Laboratory methods, Methods of Soil Analysis: Part 1, 5, 687–734, 1986. a
Kool, J., Albrecht, K. A., Parker, J., and Baker, J.: Physical and chemical characterization of the Groseclose soil mapping unit, Tech. rep., Virginia Agricultural Experiment Station, Virginia, 1986. a
Krahmer, U., Hennings, V., Müller, U., and Schrey, H.-P.: Ermittlung bodenphysikalischer Kennwerte in Abhängigkeit von Bodenart, lagerungsdichte und Humusgehalt, Zeitschrift für Pflanzenernährung und Bodenkunde, 158, 323–331, 1995. a
Kramarenko, V., Brakorenko, N., and Molokov, V.: Hydraulic conductivity of peat in Western Siberia, in: E3S Web of Conferences, 98, 11003, EDP Sciences, https://doi.org/10.1051/e3sconf/20199811003, 2019. a
Kutiel, P., Lavee, H., Segev, M., and Benyamini, Y.: The effect of fire-induced surface heterogeneity on rainfall-runoff-erosion relationships in an eastern Mediterranean ecosystem, Israel, Catena, 25, 77–87, 1995. a
Kutílek, M., Krejča, M., Haverkamp, R., Rendon, L., and Parlange, J.-Y.: On extrapolation of algebraic infiltration equations, Soil Technol., 1, 47–61, 1988. a
Lamara, M. and Derriche, Z.: Prediction of unsaturated hydraulic properties of dune sand on drying and wetting paths, Electron. J. Geotech. Eng., 13, 1–19, 2008. a
Lassabatere, L., Angulo-Jaramillo, R., Soria Ugalde, J., Cuenca, R., Braud, I., and Haverkamp, R.: Beerkan estimation of soil transfer parameters through infiltration experiments–BEST, Soil Sci. Soc. Am. J., 70, 521–532, 2006. a
Lawrence, I. and Lin, K.: A concordance correlation coefficient to evaluate reproducibility, Biometrics, 45, 255–268, 1989. a
Leij, F., Alves, W., Van Genuchten, M. T., and Williams, J.: The UNSODA Unsaturated Soil Hydraulic Database, User's Manual, Version 1.0, Rep. EPA/600/R-96, US Environmental Protection Agency, Ada, Oklahoma, 95, 103, 1996. a
Li, X., Liu, S., Xiao, Q., Ma, M., Jin, R., Che, T., Wang, W., Hu, X., Xu, Z., Wen, J., and Wang, L.: A multiscale dataset for understanding complex eco-hydrological processes in a heterogeneous oasis system, Sci. Data, 4, 170083, https://doi.org/10.1038/sdata.2017.83, 2017. a, b
Lopes, V. S., Cardoso, I. M., Fernandes, O. R., Rocha, G. C., Simas, F. N. B., de Melo Moura, W., Santana, F. C., Veloso, G. V., and da Luz, J. M. R.: The establishment of a secondary forest in a degraded pasture to improve hydraulic properties of the soil, Soil Till. Res., 198, 104538, https://doi.org/10.1016/j.still.2019.104538, 2020. a
Lopez, O., Jadoon, K., and Missimer, T.: Method of relating grain size distribution to hydraulic conductivity in dune sands to assist in assessing managed aquifer recharge projects: Wadi Khulays dune field, western Saudi Arabia, Water, 7, 6411–6426, 2015. a
Mahapatra, S. and Jha, M. K.: On the estimation of hydraulic conductivity of layered vadose zones with limited data availability, J. Earth Syst. Sci., 128, 75, https://doi.org/10.1007/s12040-019-1101-1, 2019. a
Martin, D. A. and Moody, J. A.: Comparison of soil infiltration rates in burned and unburned mountainous watersheds, Hydrol. Process., 15, 2893–2903, 2001. a
McKenzie, N., Jacquier, D., and Gregory, L.: Online soil information systems–recent Australian experience, in: Digital soil mapping with limited data, Springer, https://doi.org/10.1007/978-1-4020-8592-5_24, pp. 283–290, 2008. a
Mohanty, B., Kanwar, R. S., and Everts, C.: Comparison of saturated hydraulic conductivity measurement methods for a glacial-till soil, Soil Sci. Soc. Am. J., 58, 672–677, 1994. a, b
Mohsenipour, M. and Shahid, S.: Estimation OF saturated hydraulic conductivity: A Review, Malasia: Academia Edu, available at: http://bit.ly/2WShxfW (last access: 3 February 2021), 2016. a
Mott, J., Bridge, B., and Arndt, W.: Soil seals in tropical tall grass pastures of northern Australia, Soil Res., 17, 483–494, 1979. a
Mualem, Y.: Catalogue of the hydraulic properties of unsaturated soils, Technion Israel Institute of Technology, Technion Research & Development, Israel, 1976. a
Muñoz-Carpena, R., Regalado, C. M., Álvarez-Benedi, J., and Bartoli, F.: Field evaluation of the new Philip-Dunne permeameter for measuring saturated hydraulic conductivity, Soil Sci., 167, 9–24, 2002. a
Naik, A. P., Ghosh, B., and Pekkat, S.: Estimating soil hydraulic properties using mini disk infiltrometer, ISH Journal of Hydraulic Engineering, 25, 62–70, 2019. a
National Cooperative Soil Survey: National cooperative soil survey characterization database, United States Department of Agriculture, Natural Resoucres Conservation, Lincoln, NE, 2016. a
Nemes, A.: Unsaturated soil hydraulic database of Hungary: HUNSODA, Agrokémia és Talajtan, 51, 17–26, 2002. a
Nemes, A.: Databases of soil physical and hydraulic properties, Encyclopedia of agrophysics, 194–199, https://doi.org/10.1007/978-90-481-3585-1_39, 2011. a
Nemes, A. d., Schaap, M., Leij, F., and Wösten, J.: Description of the unsaturated soil hydraulic database UNSODA version 2.0, J. Hydrol., 251, 151–162, 2001. a, b, c, d, e, f, g
Nielsen, D., Biggar, J., and Erh, K.: Spatial variability of field-measured soil water properties, Hilgardia, 42, 215–259, 1973. a, b
Niemeyer, R., Fremier, A. K., Heinse, R., Chávez, W., and DeClerck, F. A.: Woody vegetation increases saturated hydraulic conductivity in dry tropical Nicaragua, Vadose Zone J., 13, 1–11, 2014. a
Nyman, P., Sheridan, G. J., Smith, H. G., and Lane, P. N.: Evidence of debris flow occurrence after wildfire in upland catchments of south-east Australia, Geomorphology, 125, 383–401, 2011. a
Ottoni, M. V., Ottoni Filho, T. B., Schaap, M. G., Lopes-Assad, M. L. R., and Rotunno Filho, O. C.: Hydrophysical database for Brazilian soils (HYBRAS) and pedotransfer functions for water retention, Vadose Zone J., 17, 1–17, 2018. a, b, c, d, e, f, g
Ouattara, M.: Variation of saturated hydraulic conductivity with depth for selected profiles of Tillman-Hollister soil, PhD thesis, Oklahoma State University, Oklahoma, 1977. a
Päivänen, J.: Hydraulic conductivity and water retention in peat soils, Suomen metsätieteellinen seura, Finland, 1973. a
Parks, D. S. and Cundy, T. W.: Soil hydraulic characteristics of a small southwest Oregon watershed following high-intensity wildfires, in: Proceedings of the Symposium on Fire and Watershed Management, edited by: Berg, N. H., 26–28 October 1988, Sacramento, California, Gen. Tech. Rep. PSW-109, US Department of Agriculture, Forest Service, Pacific Southwest Forest and Range Experiment Station, Berkeley, Calif., 109, 63–67, 1989. a
Price, K., Jackson, C. R., and Parker, A. J.: Variation of surficial soil hydraulic properties across land uses in the southern Blue Ridge Mountains, North Carolina, USA, J. Hydrol., 383, 256–268, 2010. a
Purdy, S. and Suryasasmita, V.: Comparison of hydraulic conductivity test methods for landfill clay liners, in: Advances in Unsaturated Soil, Seepage, and Environmental Geotechnics, GeoShanghai International Conference 2006, China, pp. 364–372, 2006. a
Quinton, W. L., Hayashi, M., and Carey, S. K.: Peat hydraulic conductivity in cold regions and its relation to pore size and geometry, Hydrol. Process., 22, 2829–2837, 2008. a
Rab, M.: Soil physical and hydrological properties following logging and slash burning in the Eucalyptus regnans forest of southeastern Australia, Forest Ecol. Manag., 84, 159–176, 1996. a
Radcliffe, D., West, L., Ware, G., and Bruce, R.: Infiltration in adjacent Cecil and Pacolet soils, Soil Sci. Soc. Am. J., 54, 1739–1743, 1990. a
Rahimy, P.: Effects of Soil Depth and Saturated Hydraulic Conductivity Spatial Variation on Runoff Simulation by the Limburg Soil Erosion Model, LISEM: A Case Study in Faucon Catchment, University of Twente Faculty of Geo-Information and Earth Observation (ITC), France, 2011. a
Rahmati, M., Weihermüller, L., Vanderborght, J., Pachepsky, Y. A., Mao, L., Sadeghi, S. H., Moosavi, N., Kheirfam, H., Montzka, C., Van Looy, K., Toth, B., Hazbavi, Z., Al Yamani, W., Albalasmeh, A. A., Alghzawi, M. Z., Angulo-Jaramillo, R., Antonino, A. C. D., Arampatzis, G., Armindo, R. A., Asadi, H., Bamutaze, Y., Batlle-Aguilar, J., Béchet, B., Becker, F., Blöschl, G., Bohne, K., Braud, I., Castellano, C., Cerdà, A., Chalhoub, M., Cichota, R., Císlerová, M., Clothier, B., Coquet, Y., Cornelis, W., Corradini, C., Coutinho, A. P., de Oliveira, M. B., de Macedo, J. R., Durães, M. F., Emami, H., Eskandari, I., Farajnia, A., Flammini, A., Fodor, N., Gharaibeh, M., Ghavimipanah, M. H., Ghezzehei, T. A., Giertz, S., Hatzigiannakis, E. G., Horn, R., Jiménez, J. J., Jacques, D., Keesstra, S. D., Kelishadi, H., Kiani-Harchegani, M., Kouselou, M., Kumar Jha, M., Lassabatere, L., Li, X., Liebig, M. A., Lichner, L., López, M. V., Machiwal, D., Mallants, D., Mallmann, M. S., de Oliveira Marques, J. D., Marshall, M. R., Mertens, J., Meunier, F., Mohammadi, M. H., Mohanty, B. P., Pulido-Moncada, M., Montenegro, S., Morbidelli, R., Moret-Fernández, D., Moosavi, A. A., Mosaddeghi, M. R., Mousavi, S. B., Mozaffari, H., Nabiollahi, K., Neyshabouri, M. R., Ottoni, M. V., Ottoni Filho, T. B., Pahlavan-Rad, M. R., Panagopoulos, A., Peth, S., Peyneau, P.-E., Picciafuoco, T., Poesen, J., Pulido, M., Reinert, D. J., Reinsch, S., Rezaei, M., Roberts, F. P., Robinson, D., Rodrigo-Comino, J., Rotunno Filho, O. C., Saito, T., Suganuma, H., Saltalippi, C., Sándor, R., Schütt, B., Seeger, M., Sepehrnia, N., Sharifi Moghaddam, E., Shukla, M., Shutaro, S., Sorando, R., Stanley, A. A., Strauss, P., Su, Z., Taghizadeh-Mehrjardi, R., Taguas, E., Teixeira, W. G., Vaezi, A. R., Vafakhah, M., Vogel, T., Vogeler, I., Votrubova, J., Werner, S., Winarski, T., Yilmaz, D., Young, M. H., Zacharias, S., Zeng, Y., Zhao, Y., Zhao, H., and Vereecken, H.: Development and analysis of the Soil Water Infiltration Global database, Earth Syst. Sci. Data, 10, 1237–1263, https://doi.org/10.5194/essd-10-1237-2018, 2018. a, b, c, d, e, f, g
Ramli, M.: Management of Groundwater Resources from Peat in Sarawak, Paper presented at the Workshop Working Towards Integrated Peatland Management, Kuching, Sarawak, 1999. a
Ravi, S., Wang, L., Kaseke, K. F., Buynevich, I. V., and Marais, E.: Ecohydrological interactions within “fairy circles” in the Namib Desert: Revisiting the self-organization hypothesis, J. Geophys. Res.-Biogeo., 122, 405–414, 2017. a
Rawls, W. J., Brakensiek, D. L., and Saxtonn, K.: Estimation of soil water properties, Transactions of the ASAE, 25, 1316–1320, 1982. a
R Core Team: R: A Language and Environment for Statistical Computing, R Foundation for Statistical Computing, Vienna, Austria, available at: http://www.R-project.org/ (last access: 1 April 2021), 2013. a, b
Reynolds, W. and Elrick, D.: In situ measurement of field-saturated hydraulic conductivity, sorptivity, and the α-parameter using the Guelph permeameter, Soil Sci., 140, 292–302, 1985. a
Reynolds, W., Bowman, B., Brunke, R., Drury, C., and Tan, C.: Comparison of tension infiltrometer, pressure infiltrometer, and soil core estimates of saturated hydraulic conductivity, Soil Sci. Soc. Am. J., 64, 478–484, 2000. a
Richard, F. and Lüscher, P.: Physikalische Eigenschaften von Böden der Schweiz. Lokalformen. Eidg. Anstalt für das forstliche Versuchswesen. Sonderserie, Eidgenössische Technische University, Switzerland, 1983/87. a, b
Robbins, C. W.: Hydraulic conductivity and moisture retention characteristics of southern Idaho's silt loam soils, Tech. rep., University of Idaho College of Agriculture, USA, 1977. a
Romano, N. and Palladino, M.: Prediction of soil water retention using soil physical data and terrain attributes, J. Hydrol., 265, 56–75, 2002. a
Rubel, F. and Kottek, M.: Observed and projected climate shifts 1901–2100 depicted by world maps of the Köppen-Geiger climate classification, Meteorol. Z., 19, 135–141, 2010. a
Rycroft, D., Williams, D., and Ingram, H.: The transmission of water through peat: I. Review, The Journal of Ecology, 63, 535–556, https://doi.org/10.2307/2258734, 1975. a
Sanzeni, A., Colleselli, F., and Grazioli, D.: Specific surface and hydraulic conductivity of fine-grained soils, J. Geotech. Geoenviron., 139, 1828–1832, 2013. a
Sayok, A., Ayob, K., Melling, L., Goh, K., Uyo, L., and Hatano, R.: Hydraulic conductivity and moisture characteristics of tropical peatland-preliminary investigation, Malaysian Society of Soil Science (MSSS), Malaysian, 2007. a
Schwärzel, K. and Punzel, J.: Hood infiltrometer—a new type of tension infiltrometer, Soil Sci. Soc. Am. J., 71, 1438–1447, 2007. a
Scotter, D., Clothier, B., and Harper, E.: Measuring saturated hydraulic conductivity and sorptivity using twin rings, Soil Res., 20, 295–304, 1982. a
Sepehrnia, N., Hajabbasi, M. A., Afyuni, M., and Lichner, L.: Extent and persistence of water repellency in two Iranian soils, Biologia, 71, 1137–1143, 2016. a
Sharma, S. K., Mohanty, B. P., and Zhu, J.: Including topography and vegetation attributes for developing pedotransfer functions, Soil Sci. Soc. Am. J., 70, 1430–1440, 2006. a
Sharratt, B. S.: Water retention, bulk density, particle size, and thermal and hydraulic conductivity of arable soils in interior Alaska, School of Agriculture and Land Resources Management, Agricultural and Forestry Experiment Station, Alaska, 1990. a, b
Simmons, L. A.: Soil hydraulic and physical properties as affected by logging management, PhD thesis, University of Missouri–Columbia, USA, 2014. a
Singh, I., Awasthi, O., Sharma, B., More, T., and Meena, S.: Soil properties, root growth, water-use efficiency in brinjal (Solanum melongena) production and economics as affected by soil water conservation practices, Ind. J. Agric. Sci., 81, 84–87, 2011. a
Singh, R., Van Dam, J., and Feddes, R. A.: Water productivity analysis of irrigated crops in Sirsa district, India, Agric. Water Manage., 82, 253–278, 2006. a
Smettem, K. and Ross, P.: Measurement and prediction of water movement in a field soil: The matrix-macropore dichotomy, Hydrol. Process., 6, 1–10, 1992. a
Sonneveld, M., Everson, T., and Veldkamp, A.: Multi-scale analysis of soil erosion dynamics in Kwazulu-Natal, South Africa, Land Degrad. Dev., 16, 287–301, 2005. a
Soracco, C. G., Lozano, L. A., Sarli, G. O., Gelati, P. R., and Filgueira, R. R.: Anisotropy of saturated hydraulic conductivity in a soil under conservation and no-till treatments, Soil Till. Res., 109, 18–22, 2010. a, b
Southard, R. and Buol, S.: Subsoil saturated hydraulic conductivity in relation to soil properties in the North Carolina Coastal Plain, Soil Sci. Soc. Am. J., 52, 1091–1094, 1988. a
Sutejo, Y., Saggaff, A., Rahayu, W., and Hanafiah: Hydraulic conductivity and compressibility characteristics of fibrous peat, in: IOP Conference Series: Materials Science and Engineering, IOP Publishing, Bristol, 620, 012053, 2019. a
Szabó, B., Szatmári, G., Takács, K., Laborczi, A., Makó, A., Rajkai, K., and Pásztor, L.: Mapping soil hydraulic properties using random-forest-based pedotransfer functions and geostatistics, Hydrol. Earth Syst. Sci., 23, 2615–2635, https://doi.org/10.5194/hess-23-2615-2019, 2019. a
Takahashi, H.: Studies on microclimate and hydrology of peat swamp forest in Central Kalimantan, Indonesia, in: Biodiversity and Sustainability of Tropical peatlands, Samara Publishing Limited, Indonesia, 178–198, 1997. a
Terzaghi, K.: Geotechnical investigation and testing-Laboratory testing of soil-Part 5: Incremental loading oedometer test 2, W3C XML, 1, 2006, 2004. a
Tete-Mensah, I.: Evaluation of Some Physical and Chemical Properties of Soils Under two Agroforestrv Practices, PhD thesis, University of Ghana, Ghana, 1993. a
Tian, J., Zhang, B., He, C., and Yang, L.: Variability in soil hydraulic conductivity and soil hydrological response under different land covers in the mountainous area of the Heihe River Watershed, Northwest China, Land Degrad. Dev., 28, 1437–1449, 2017. a, b
Tomasella, J., Hodnett, M. G., and Rossato, L.: Pedotransfer functions for the estimation of soil water retention in Brazilian soils, Soil Sci. Soc. Am. J., 64, 327–338, 2000. a, b
Tomasella, J., Pachepsky, Y., Crestana, S., and Rawls, W.: Comparison of two techniques to develop pedotransfer functions for water retention, Soil Sci. Soc. Am. J., 67, 1085–1092, 2003. a
Tuller, M. and Or, D.: Unsaturated Hydraulic Conductivity of Structured Porous MediaA Review of Liquid Configuration–Based Models, Vadose Zone J., 1, 14–37, 2002. a
Varela, M., Benito, E., and Keizer, J.: Influence of wildfire severity on soil physical degradation in two pine forest stands of NW Spain, Catena, 133, 342–348, 2015. a
Verburg, K., Bridge, B. J., Bristow, K. L., and Keating, B. A.: Properties of selected soils in the Gooburrum–Moore Park area of Bundaberg, CSIRO Land and Water Technical Report, CSIRO Land and water, Canberra, Australia, 9, 77, 2001. a
Vereecken, H., Weynants, M., Javaux, M., Pachepsky, Y., Schaap, M., and Genuchten, M. T.: Using pedotransfer functions to estimate the van Genuchten–Mualem soil hydraulic properties: A review, Vadose Zone J., 9, 795–820, 2010. a
Vereecken, H., Van Looy, K., Weynants, M., and Javaux, M.: Soil retention and conductivity curve data base sDB, link to MATLAB files, PANGAEA, https://doi.org/10.1594/PANGAEA.879233, 2017. a, b, c, d
Vereecken, H., Weihermüller, L., Assouline, S., Šimunek, J., Verhoef, A., Herbst, M., Archer, N., Mohanty, B., Montzka, C., Van derborght, J., Balsamo, G., Bechtold, M., Boone, A., Chadburn, S., Cuntz, Mathias., Decharme, Bertrand., Ducharne, Agnès., Ek, M., Garrigues, S., Goergen, K., Ingwersen, J., Kollet, S., M.Lawrence, David., Li, Q., Or, D., Swenson, S., de Vrese, P., Walko, R., Wu, Y., and Xue, Y.: Infiltration from the pedon to global grid scales: An overview and outlook for land surface modeling, Vadose Zone J., 18, 1–53, 2019. a
Vieira, B. C. and Fernandes, N. F.: Landslides in Rio de Janeiro: the role played by variations in soil hydraulic conductivity, Hydrol. Process., 18, 791–805, 2004. a
Vogeler, I., Carrick, S., Cichota, R., and Lilburne, L.: Estimation of soil subsurface hydraulic conductivity based on inverse modelling and soil morphology, J. Hydrol., 574, 373–382, 2019. a
Waddington, J. and Roulet, N.: Groundwater flow and dissolved carbon movement in a boreal peatland, J. Hydrol., 191, 122–138, 1997. a
Wang, T., Zlotnik, V. A., Wedin, D., and Wally, K. D.: Spatial trends in saturated hydraulic conductivity of vegetated dunes in the Nebraska Sand Hills: Effects of depth and topography, J. Hydrol., 349, 88–97, 2008. a
Weynants, M., Montanarella, L., Toth, G., Arnoldussen, A., Anaya Romero, M., Bilas, G., Borresen, T., Cornelis, W., Daroussin, J., Gonçalves, M. D. C., Haugen, L.-E., Hennings, V., Houskova, B., Iovino, M., Javaux, M., Keay, C. A., Kätterer, T., Kvaerno, S., Laktinova, T., Lamorski, K.,Lilly, A., Mako, A., Matula, S., Morari, F., Nemes, A., Patyka, N. V., Romano, N., Schindler, U., Shein, E., Slawinski, C., Strauss, P., Tóth, B., and Woesten, H.: European HYdropedological Data Inventory (EU-HYDI), EUR Scientific and Technical Research Series, EUR 26053 EN, 167 pp., 2013. a
Wösten, J.: The HYPRES database of hydraulic properties of European soils., Adv. GeoEcology, 32, 135–143, 2000. a
Wösten, J., Pachepsky, Y. A., and Rawls, W.: Pedotransfer functions: bridging the gap between available basic soil data and missing soil hydraulic characteristics, J. Hydrol., 251, 123–150, 2001. a
Wright, M. N. and Ziegler, A.: Ranger: a fast implementation of random forests for high dimensional data in C++ and R, arXiv preprint arXiv:1508.04409, 2015. a
Yao, S., Zhang, T., Zhao, C., and Liu, X.: Saturated hydraulic conductivity of soils in the Horqin Sand Land of Inner Mongolia, northern China, Environ. Monit. Assess., 185, 6013–6021, 2013. a
Yasin, S. and Yulnafatmawita, Y.: Effects of Slope Position on Soil Physico-chemical Characteristics Under Oil Palm Plantation in Wet Tropical Area, West Sumatra Indonesia, AGRIVITA, J. Agric. Sci., 40, 328–337, 2018. a
Yoon, S. W.: A measure of soil structure derived from water retention properties: A kullback-Leibler distance approach, Ph.D. thesis, Rutgers University-Graduate School, New Brunswick, 2009. a, b
Youngs, E.: Infiltration measurements – a review, Hydrol. Process., 5, 309–319, 1991. a, b
Zakaria, S.: Water management in deep peat soils in Malaysia, PhD thesis, Cranfield University, Cranfield, UK, 1992. a
Zhang, S., Xiahou, Y., Tang, H., Huang, L., Liu, X., and Wu, Q.: Study on the spatially variable saturated hydraulic conductivity and deformation behavior of accumulation reservoir landslide Based on surface nuclear magnetic resonance survey, Adv. Civil Eng., 2018, 7290640, https://doi.org/10.1155/2018/7290640, 2018. a
Zhao, H., Zeng, Y., Lv, S., and Su, Z.: Analysis of soil hydraulic and thermal properties for land surface modeling over the Tibetan Plateau, Earth Syst. Sci. Data, 10, 1031–1061, https://doi.org/10.5194/essd-10-1031-2018, 2018. a, b, c, d, e