the Creative Commons Attribution 4.0 License.
the Creative Commons Attribution 4.0 License.
 | 12 Apr 2021
Integrated water vapour content retrievals from ship-borne GNSS receivers during EUREC4A
Pierre Bosser
Olivier Bock
Cyrille Flamant
Sandrine Bony
Sabrina Speich
In the framework of the EUREC4A (Elucidating the role of clouds–circulation coupling in climate) campaign that took place in January and February 2020, integrated water vapour (IWV) contents were retrieved over the open tropical Atlantic Ocean using Global Navigation Satellite System (GNSS) data acquired from three research vessels (R/Vs): R/V Atalante, R/V Maria S. Merian and R/V Meteor. This paper describes the GNSS processing method and compares the GNSS IWV retrievals with IWV estimates from the European Centre for Medium-range Weather Forecasts (ECMWF) fifth reanalysis (ERA5), from the Moderate Resolution Imaging Spectroradiometer (MODIS) infrared products and from terrestrial GNSS stations located along the tracks of the ships. The ship-borne GNSS IWV retrievals from R/V Atalante and R/V Meteor compare well with ERA5, with small biases (−1.62 kg m−2 for R/V Atalante and +0.65 kg m−2 for R/V Meteor) and a root mean square (rms) difference of about 2.3 kg m−2. The results for the R/V Maria S. Merian are found to be of poorer quality, with an rms difference of 6 kg m−2, which is very likely due to the location of the GNSS antenna on this R/V prone to multipath effects. The comparisons with ground-based GNSS data confirm these results. The comparisons of all three R/V IWV retrievals with MODIS infrared products show large rms differences of 5–7 kg m−2, reflecting the enhanced uncertainties in these satellite products in the tropics. These ship-borne IWV retrievals are intended to be used for the description and understanding of meteorological phenomena that occurred during the campaign, east of Barbados, Guyana and northern Brazil. Both the raw GNSS measurements and the IWV estimates are available through the AERIS data centre (https://en.aeris-data.fr/, last access: 20 September 2020). The digital object identifiers (DOIs) for R/V Atalante IWV and raw datasets are https://doi.org/10.25326/71 (Bosser et al., 2020a) and https://doi.org/10.25326/74 (Bosser et al., 2020d), respectively. The DOIs for the R/V Maria S. Merian IWV and raw datasets are https://doi.org/10.25326/72 (Bosser et al., 2020b) and https://doi.org/10.25326/75 (Bosser et al., 2020e), respectively. The DOIs for the R/V Meteor IWV and raw datasets are https://doi.org/10.25326/73 (Bosser et al., 2020c) and https://doi.org/10.25326/76 (Bosser et al., 2020f), respectively.
- Article
(3731 KB) - Full-text XML
- Companion paper
- BibTeX
- EndNote


Precise positioning with Global Navigation Satellite System (GNSS), in particular on the vertical component, requires the estimation of propagation delays due to the transit of the signals transmitted by the satellites through the atmosphere. These delays depend in particular on the water vapour content which is mainly located in the troposphere. As part of the GNSS data processing, the tropospheric propagation delay is modelled by a zenith component, the so-called zenith tropospheric delay (ZTD), that is projected onto the receiver-satellite line of sight using mapping functions. Horizontal north–south and east–west gradients are also used to describe the azimuthal asymmetry of the delay. The integrated water vapour (IWV) contents are derived from the ZTD estimates. Since the late 1990s, both GNSS ZTD and IWV products have progressively been incorporated into the array of meteorological observation techniques used for atmospheric studies, and they are assimilated into numerical weather prediction (NWP) models (Poli et al., 2007; Guerova et al., 2016). The GNSS technique possesses numerous advantages compared to other passive remote sensing techniques: the instrumentation is low-cost and power-efficient; the measurements are obtained in all weather conditions and do not require instrumental calibrations; the IWV data can be retrieved at high frequency (typically every 5 min). The agreement between GNSS-derived IWVs and their counterparts observed with more conventional meteorological instrumentation (e.g. radiosondes, microwave and infrared radiometers, lidars) has been widely confirmed (Bevis et al., 1992; Haase et al., 2003; Bosser et al., 2010; Bock et al., 2013), and the accuracy of the technique is evaluated to be around 1–2 kg m−2 (Bock et al., 2013; Ning et al., 2016). The use of ground-based GNSS-derived IWVs for atmospheric-process studies has thus become common practice in meteorological campaigns (Haase et al., 2003; Bock et al., 2008, 2016; Hadad et al., 2018).
Since the mid-2000s, various studies have been carried out to evaluate IWV retrievals from ship-borne GNSS receivers. In this configuration, the analysis of GNSS data is more complex than for data from static terrestrial GNSS receivers due to the strong correlation between positions and propagation delays estimated with the same temporal sampling (30–300 s). Two strategies can be applied for the precise processing of GNSS data: relative positioning, which requires the use of nearby ground reference stations and from which the position of the antenna is determined relative to these reference stations, and absolute positioning, for which the position of the antenna is determined directly relative to the satellites. Over open oceans, the extended distance to terrestrial reference stations prevents the use of the more precise relative positioning. Absolute positioning, also called kinematic PPP (precise point positioning), is mandatory there. Despite these limitations, the quality of sea-borne IWV retrievals is promising, even though it is still lower than that obtained for terrestrial stations. Compared to conventional meteorological instruments, the root mean square (rms) of differences generally varies between 2 and 3 kg m−2 (Fujita et al., 2014; Shoji et al., 2017; Wang et al., 2019; Liu et al., 2019), while the rms of differences with numerical weather prediction models ranges from 1 to 3 kg m−2 (Boniface et al., 2012; Wang et al., 2019; Fourrié et al., 2019).
In the framework of the EUREC4A (Elucidating the role of clouds–circulation coupling in climate) campaign that took place in January and February 2020 (Stevens et al., 2021), we took advantage of the presence of GNSS receivers on board three of the research vessels (R/Vs) involved (namely, the French R/V Atalante and the German R/V Maria S. Merian and R/V Meteor) to exploit the raw GNSS data for meteorological purposes. The three R/Vs were deployed as part of a huge experimental set-up in the tropical west Atlantic Ocean that gathered airborne, sea-borne and island-based measuring platforms from Europe, the United States of America and the Caribbean. The objective is to provide benchmark measurements of clouds and of their environment in the trade winds and to test hypothesized cloud feedback mechanisms thought to explain large differences in model estimates of climate sensitivity (Bony et al., 2017). During the campaign, R/V Meteor operated mainly east of Barbados documenting atmospheric conditions upwind of the Barbados Cloud Observatory (BCO) (Stevends et al., 2016) in the so-called Trade-wind Alley. R/V Maria S. Merian and R/V Atalante operated mainly southeast of Barbados, off the coast of Guyana and northern Brazil.
In Sect. 2, we present the collection of GNSS measurements gathered from the three R/Vs and the strategies used for processing the data. In Sect. 3, we evaluate the processing outputs from two different GNSS processing software packages. The comparison of two software packages is motivated by the difficulty encountered in processing the lower-quality data acquired from the R/V Maria S. Merian. In Sect. 4, we compare the GNSS-derived IWV data with those from the European Centre for Medium-range Weather Forecasts (ECMWF) fifth reanalysis (ERA5) and from the Moderate Resolution Imaging Spectroradiometer (MODIS), as well as from a set of terrestrial GNSS stations located along the tracks of the three ships. In Sect. 5, we draw the main conclusions regarding the processing and analysis of the ship-borne GNSS datasets.
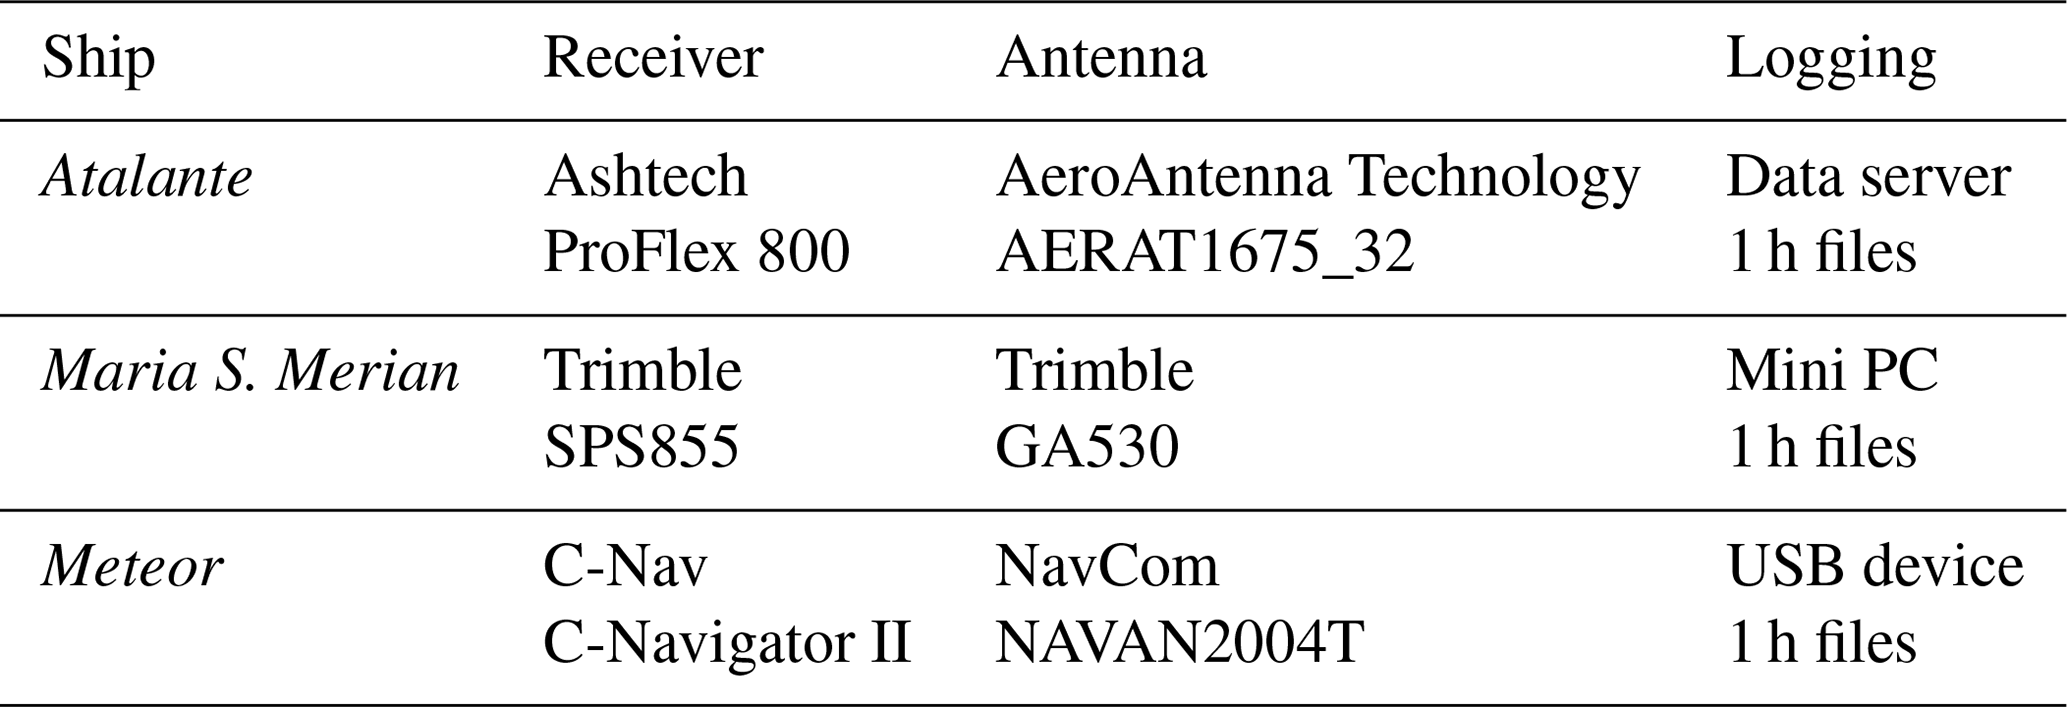
Table 1Summary of ship-borne GNSS acquisition systems operated during EUREC4A.
2.1 GNSS measurements
The antenna, receivers and logging systems used on the three R/Vs are presented in Table 1. All three instrumentation systems were able to provide high-quality carrier-phase data necessary to retrieve accurate positions and tropospheric parameters. The data-logging methods differed from one R/V to another which is not a problem as all data were post-processed after the campaign. On R/V Atalante, data were automatically saved hourly on the on-board data storage system. On R/V Maria S. Merian, a dedicated device was deployed to save data in real time and to upload the data hourly via the Internet. Finally, on R/V Meteor, the data were saved hourly on a removable medium connected to the receiver that was retrieved at the end of the campaign. On all the receivers the measurements were made at a rate of 1 s for GNSS satellites above a minimum elevation cut-off angle of 3∘ for R/V Maria S. Merian and R/V Meteor and 5∘ for R/V Atalante. For the former two R/Vs, only Global Positioning System (GPS) measurements were saved, while for R/V Atalante both GPS and GLONASS (Globalnaïa Navigatsionnaïa Spoutnikovaïa Sistéma) measurements were saved. However, for the sake of homogeneity between the three datasets, only data from the GPS constellation satellites have been processed.
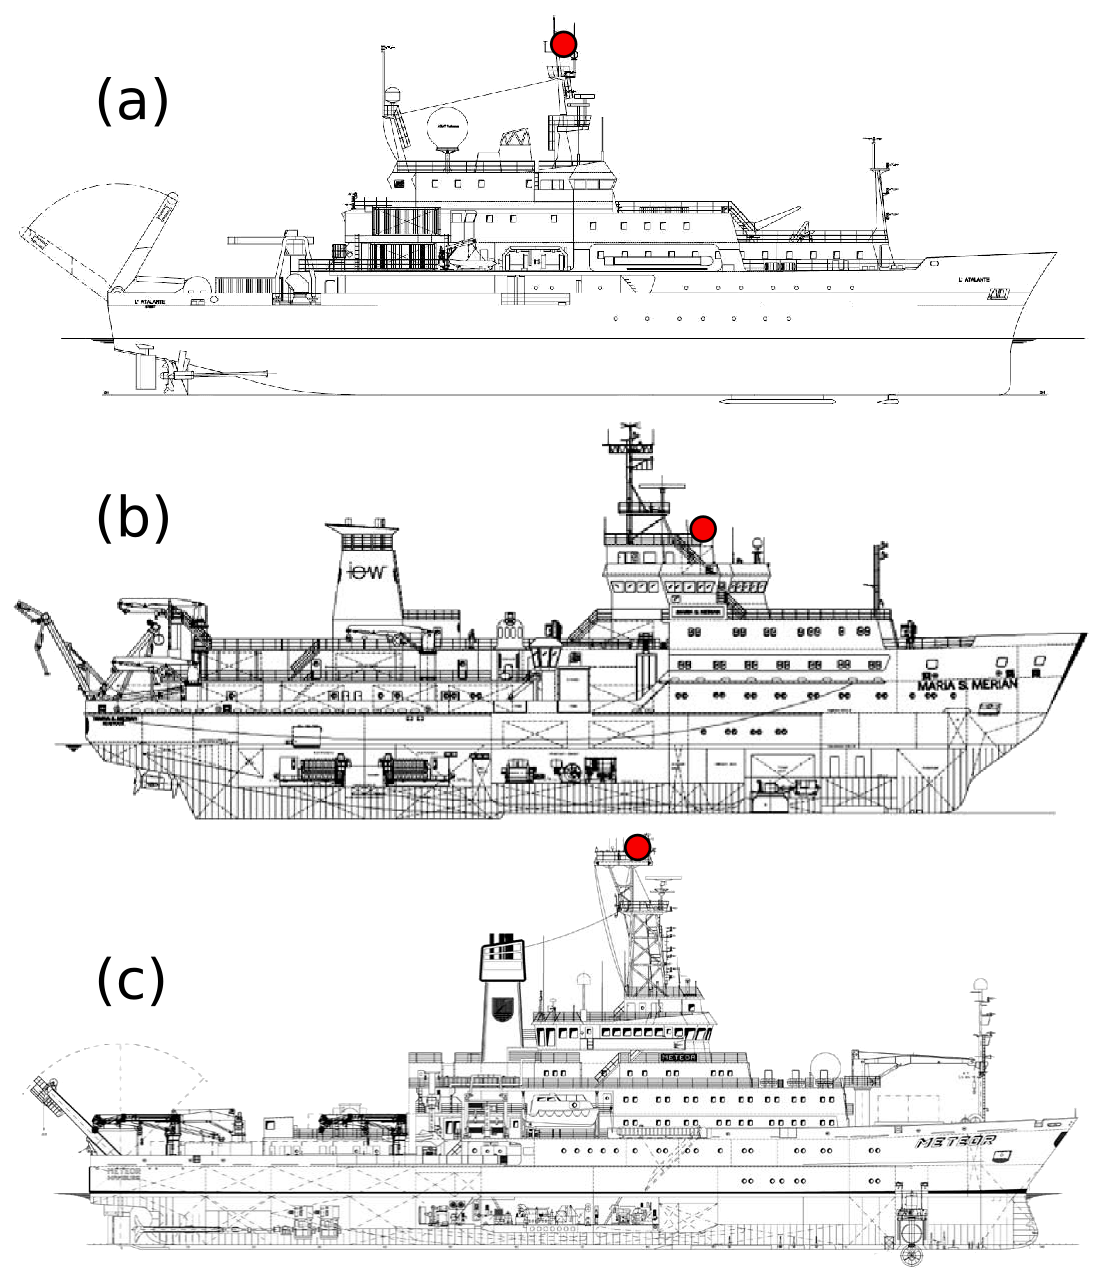
Figure 1Schematic diagram of the location of the GNSS antennas used (red circles) on R/V Atalante (a), R/V Maria S. Merian (b) and R/V Meteor (c) during the EUREC4A campaign. Schematic diagrams are courtesy of Génavir and Briese Research.
The location of each of the GNSS antennas on the three ships is shown in Fig. 1. The antennas of R/V Atalante and R/V Meteor are located on the crow's nest, the highest point of the ship, which helps in minimizing interference with other scientific and navigation instruments. The antenna of the R/V Maria S. Merian is located on the higher observation deck below the crow's nest and below the main radar antenna. We will see later that this position has a direct impact on the quality of the measurements carried out with this antenna.
Figure 2 shows the routes followed by the three ships during the campaign. R/V Atalante started its cruise from the archipelago of Guadeloupe on 18 January 2020 (day 18) and headed southward until 31 January (day 31) and then back north until reaching Guadeloupe on 21 February (day 52). It mostly operated in the larger ocean area south of Barbados and in the North Brazil Current eddy corridor (the so-called Boulevard des Tourbillons). It also conducted operations in Trade-wind Alley after leaving Guadeloupe en route to the North Brazil Current and prior to returning to Guadeloupe. R/V Maria S. Merian operated between 18 January (day 18) and 19 February (day 50) in the same area as R/V Atalante, south of Barbados and further east, where strong mesoscale ocean eddies are generally present. It also performed measurements in Trade-wind Alley while cruising in and out of Bridgetown, Barbados, during the campaign. R/V Meteor operated between 18 January (day 18) and 20 February (day 51) upwind of the BCO and of the aircraft operation area. Its main cruise track consisted of a 2 d, cross-wind, race-track pattern across Trade-wind Alley; its operations took place within Trade-wind Alley between 12.5 and 14.5∘ N, along the 57.25∘ W meridian. R/V Maria S. Merian had an encounter with both R/V Atalante and R/V Meteor in the course of the campaign.
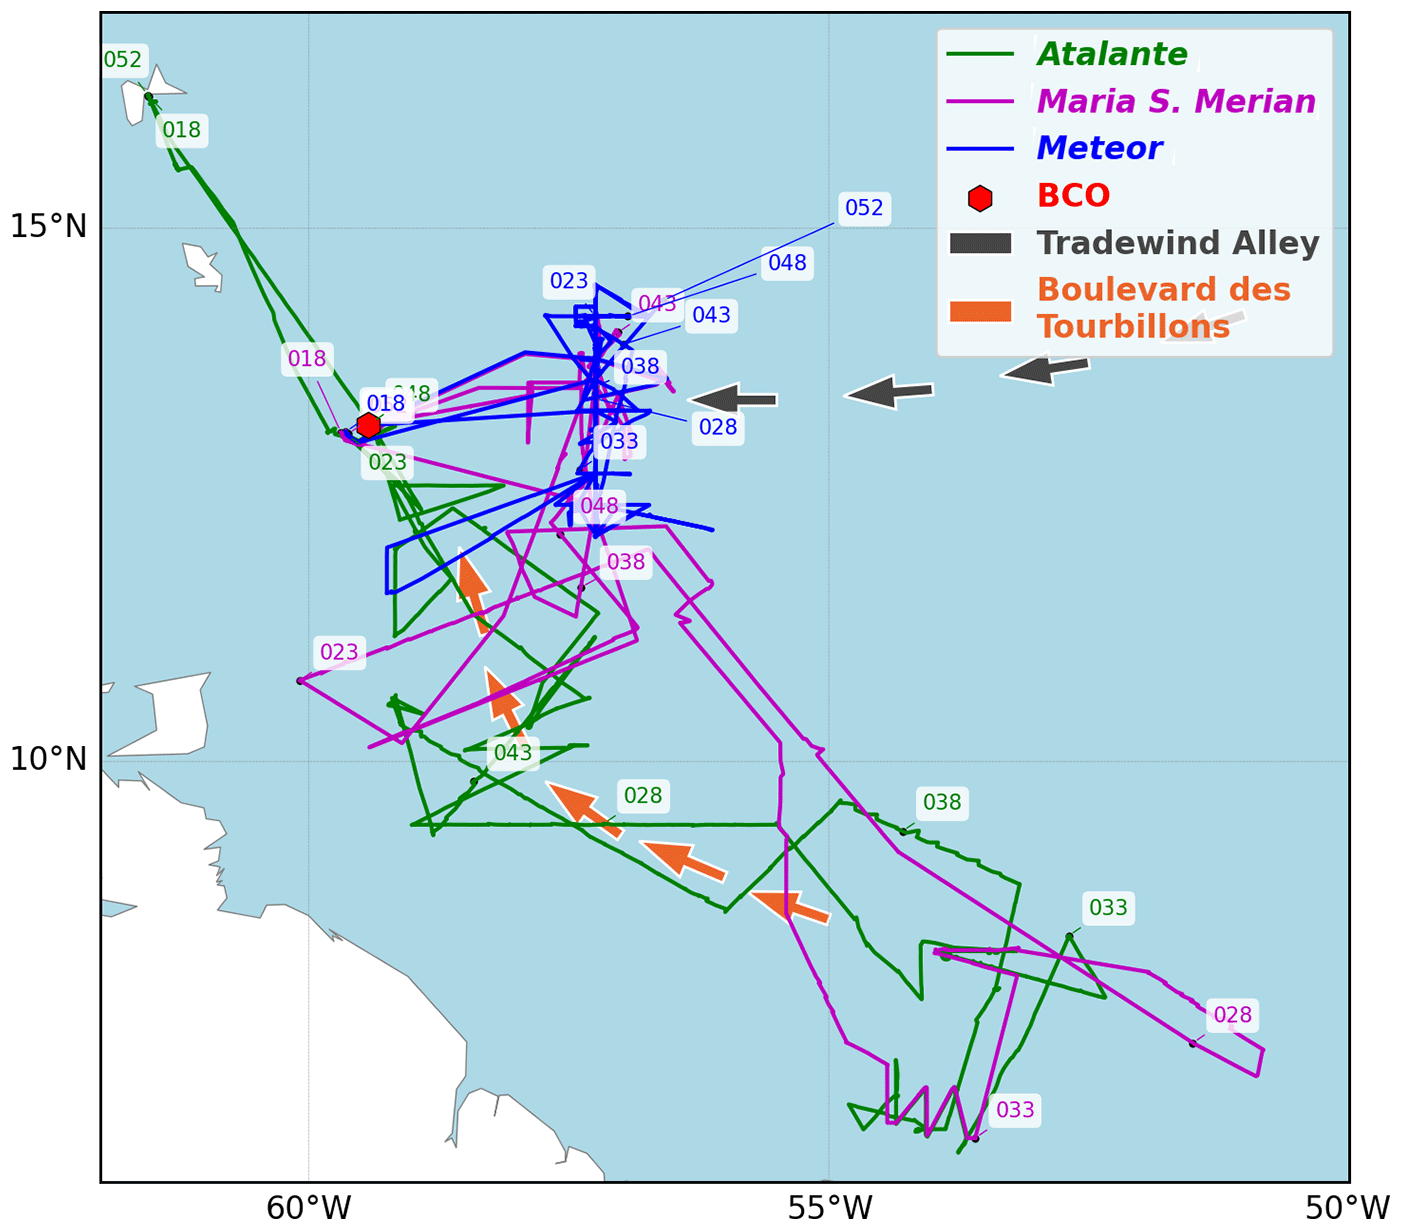
Figure 2Ships trajectory from start to end of the EUREC4A campaign. BCO denotes the Barbados Cloud Observatory. Labels indicate vessel passage dates (day of year in 2020), and the arrows schematic represents Trade-wind Alley (black arrows) and the Boulevard des Tourbillons (orange arrows).

Figure 3Availability of ship-borne GNSS measurements (from RINEX files) during the EUREC4A campaign. Vertical black marks denote interruptions in acquisition.
The diagram in Fig. 3 represents the availability of raw data from each of the three R/Vs. The data acquired by R/V Maria S. Merian have many interruptions (297 over the periods, amounting to about 40 h). These interruptions are mainly due to voluntary cuts to save telecommunication bandwidth for higher-priority experiments requiring high data rates. R/V Atalante and R/V Meteor carried out quasi-continuous measurements over the whole period (6 interruptions resulting in a loss of 1 h of data for R/V Atalante, 7 interruptions for a loss of 2 min of data for R/V Meteor).
Table 2Quality check diagnostics of GNSS phase observations (GPS measurements only) for the period from day of year 18 to 50 in 2020 on board R/Vs Atalante, Maria S. Merian and Meteor. The diagnostics are obtained with TEQC software (Estey and Meertens, 1999). Nsat is the average number of satellites per day; MP1 and MP2 are multipath combinations for L1 and L2 carriers; %obs is the percentage of complete observations (observed divided by the expected number of observations); obs slips is the ratio between complete observations and the number of slips. All the numbers are given as daily means ±1 standard deviation.

Table 2 presents some GNSS data quality diagnostics obtained with the translation, editing and quality check (TEQC) software (Estey and Meertens, 1999). The software operates on Receiver Independent Exchange Format (RINEX) observation files. The average number of daily observed GPS satellites was close to the maximum value (currently 31), although the mean value was lower (29) for R/V Maria S. Merian, with a higher standard deviation (4). The parameters MP1 and MP2 are a measure of the multipath (interference in the code and phase measurements induced by reflections or scattering by surfaces close to the GNSS antenna) embedded in the GNSS measurements on frequency carriers L1 and L2. The values remain quite low for R/V Meteor and R/V Atalante which indicates that the antennas on these ships were almost not disturbed by their environment thanks to their location atop the other scientific and navigation antennas (see Fig. 1). For R/V Maria S. Merian the multipath values are much higher confirming that the GNSS antenna was disturbed by its surroundings (e.g. reflections on metallic structures, pickup of radar signals). The percentage of daily observations is about 90 % of the expected quantity for both R/V Atalante and R/V Meteor. This percentage decreases to 68 % for R/V Maria S. Merian, as expected from Fig. 3. The last indicator is the ratio of the number of observations per cycle slip (a cycle slip happens when a carrier phase, L1 or L2, is lost). The larger this ratio, the higher the quality of the observations. A typical value of a few hundred or more is expected. Again, R/V Atalante and R/V Meteor data exhibit a much better quality than R/V Maria S. Merian data.
From these diagnostics, it is to be expected that the quality of GNSS measurements acquired on R/V Atalante and R/V Meteor is adequate to retrieve accurate IWVs. On the other hand, the errors in the position and IWV estimates are expected to be much higher for the R/V Maria S. Merian GNSS data, as confirmed in the following sections.
2.2 GNSS data processing
The GNSS observations were initially processed with the GIPSY-OASIS II v6.4 (hereafter GIPSY) software in kinematic PPP mode (Zumberge et al., 1997) using standard options that are similar to the static mode used in Bock et al. (2021). The software uses the Jet Propulsion Laboratory (JPL) fiducial-free and high-rate (30 s) final products 3.0 for satellite orbits and clocks. The data were analysed in a 30 h window centred on noon (UTC) of each day from which the 00:00–24:00 parameters were extracted to avoid edge effects. Second order ionosphere correction was used. Phase ambiguities were fixed using the wide-lane and phase bias information computed by JPL as part of their processing of the global GNSS network (Bertiger et al., 2010). The kinematic mode estimates receiver position, clock offsets, ZTDs and horizontal gradients simultaneously for each epoch at a rate of 30 s. No constraint was applied to positions between consecutive epochs.
Tropospheric delays were modelled by time-varying zenith components and horizontal gradients. The zenith components include the zenith hydrostatic delay (ZHD) and the zenith wet delay (ZWD) which represent the contributions of dry air and water molecules, respectively, in the atmospheric column (Bevis et al., 1992). The projection of the zenith delays into the direction of the GNSS satellites is performed using the Vienna Mapping Function 1 (VMF1) (Boehm et al., 2006). The projection of the gradient parameters is performed using the Bar-Sever et al. (1998) mapping function. ZHD was only corrected a priori while ZWDs and horizontal gradients were modelled as random-walk process corrections to the a priori values estimated during the data processing with a 30 s time resolution. The random-walk process parameters were fixed as in the static mode to 5 and 0.5 mm h for ZWDs and gradients, respectively. The a priori values for ZHD and ZWD and the coefficients for the mapping functions were extracted from the Technische Universität Wien (TU Wien) database (https://vmf.geo.tuwien.ac.at/, last access: 20 September 2020). These values are computed from the 6-hourly ECMWF operational analyses by TU Wien and are distributed on a global 2∘ × 2.5∘ latitude–longitude grid. In order to take into account the effect of ship along-track displacements on these parameters, a pre-processing was carried out in order to obtain an approximate trajectory. A priori ZHDs and ZWDs were then calculated using a filtered version of this first trajectory every 30 s using 1 h median filtering. The mapping function parameters were calculated only for the average daily positions but were temporally interpolated from the 6-hourly sampling to 30 s.
Two other processing parameters are of importance: the elevation cut-off angle and the observation weighting. In the standard static processing, we used a 7∘ cut-off angle and uniform phase observation weighting of 10 mm. The choice of these parameters results from a compromise between including low-elevation observations that help decorrelate position and ZTD estimates (this is especially important in kinematic mode where both parameters are estimated at every epoch) and rejecting low-elevation observations which are prone to multipath errors. We tested several variants of these parameters and noticed that they had a small but significant impact on the position and ZTD estimates for R/Vs Atalante and Meteor and a very large impact on the results from R/V Maria S. Merian. The results for the latter were actually very poor as anticipated in the previous section, and after testing unsuccessfully several other processing options (especially the arc duration for satellite tracking and the ambiguity fixing strategy) we decided to test several other processing software packages.
The SPARK software, available as an online GNSS processing tool of the Canadian Spatial Reference System Precise Point Positioning (CSRS-PPP) service of Natural Resources Canada (https://webapp.geod.nrcan.gc.ca/geod/tools-outils/ppp.php, last access: 20 September 2020; Banville et al., 2018) provided the best solution with R/V Maria S. Merian data. The analysis strategy with that software is very similar to that used with GIPSY, namely kinematic PPP mode with ambiguity resolution, VMF1 modelling for mapping functions, a priori ZHD and ZWD data from TU Wien, and a 30 h processing window. Differences between the software packages concern satellite orbit and clock products, as SPARK uses the International GNSS Service (IGS) final products and the random-walk parameters which are fixed to 3 and 0.1 mm h for ZWDs and gradients, respectively. The elevation cut-off angle in SPARK is fixed to 7.5∘, and the observation weighting is not specified. However several tests conducted with GIPSY showed that SPARK and GIPSY results for R/Vs Atalante and Meteor agreed best when GIPSY included a weighting. The main disadvantage of the SPARK online service is the impossibility of changing the processing parameters. Nevertheless, the results of SPARK for R/V Maria S. Merian GNSS data remained largely superior to those obtained with GIPSY. It is worth noting that this is the first time in our 15 years of experience of GIPSY that it actually fails to converge towards an acceptable solution. The problem in the GIPSY processing with the data from R/V Maria S. Merian was identified in the data editing module, which is an upstream processing step, where many observations were deleted because of too many cycle slips. We believe that the main difference is that SPARK uses more modern and efficient data editing and processing algorithms. It is worth noting that the GIPSY software has recently evolved into a new software package called GipsyX (Bertiger et al., 2020) which uses more state-of-the-art data editing and processing compared to GIPSY. It is likely that GipsyX can resolve the problem encountered by GIPSY with the R/V Maria S. Merian data and produce solutions close to those of SPARK. This new software will be tested in the near future.
Regarding the elevation cut-off angle value and observation weighting tests with GIPSY, we noticed that switching from 7.5∘ (taken as identical to SPARK) to 3∘ changed the mean height estimates for R/Vs Atalante and Meteor by 2.3 and 3.6 mm, respectively, and mean ZTDs in a consistent way with a factor of approximately −3.5. Similarly, the comparison of two solutions with and without observation weighting (uniform vs. ) highlighted a difference in the mean height of 5.8 and 15.2 mm for the two R/Vs and consistent differences in mean ZTDs. Such changes are symptomatic of the presence of low-elevation errors due to multipath for instance. The slightly larger variations for R/V Meteor suggest that the data from this R/V are more impacted by multipath errors. The final GIPSY processing options that we retained were thus motivated by the reduction of multipath errors. The cut-off angle was therefore fixed to 7.5∘ and a down-weighting of low-elevation-angle observations was applied. Another advantage of this choice is that the GIPSY processing options were consistent with those of SPARK that were used for processing the R/V Maria S. Merian data.
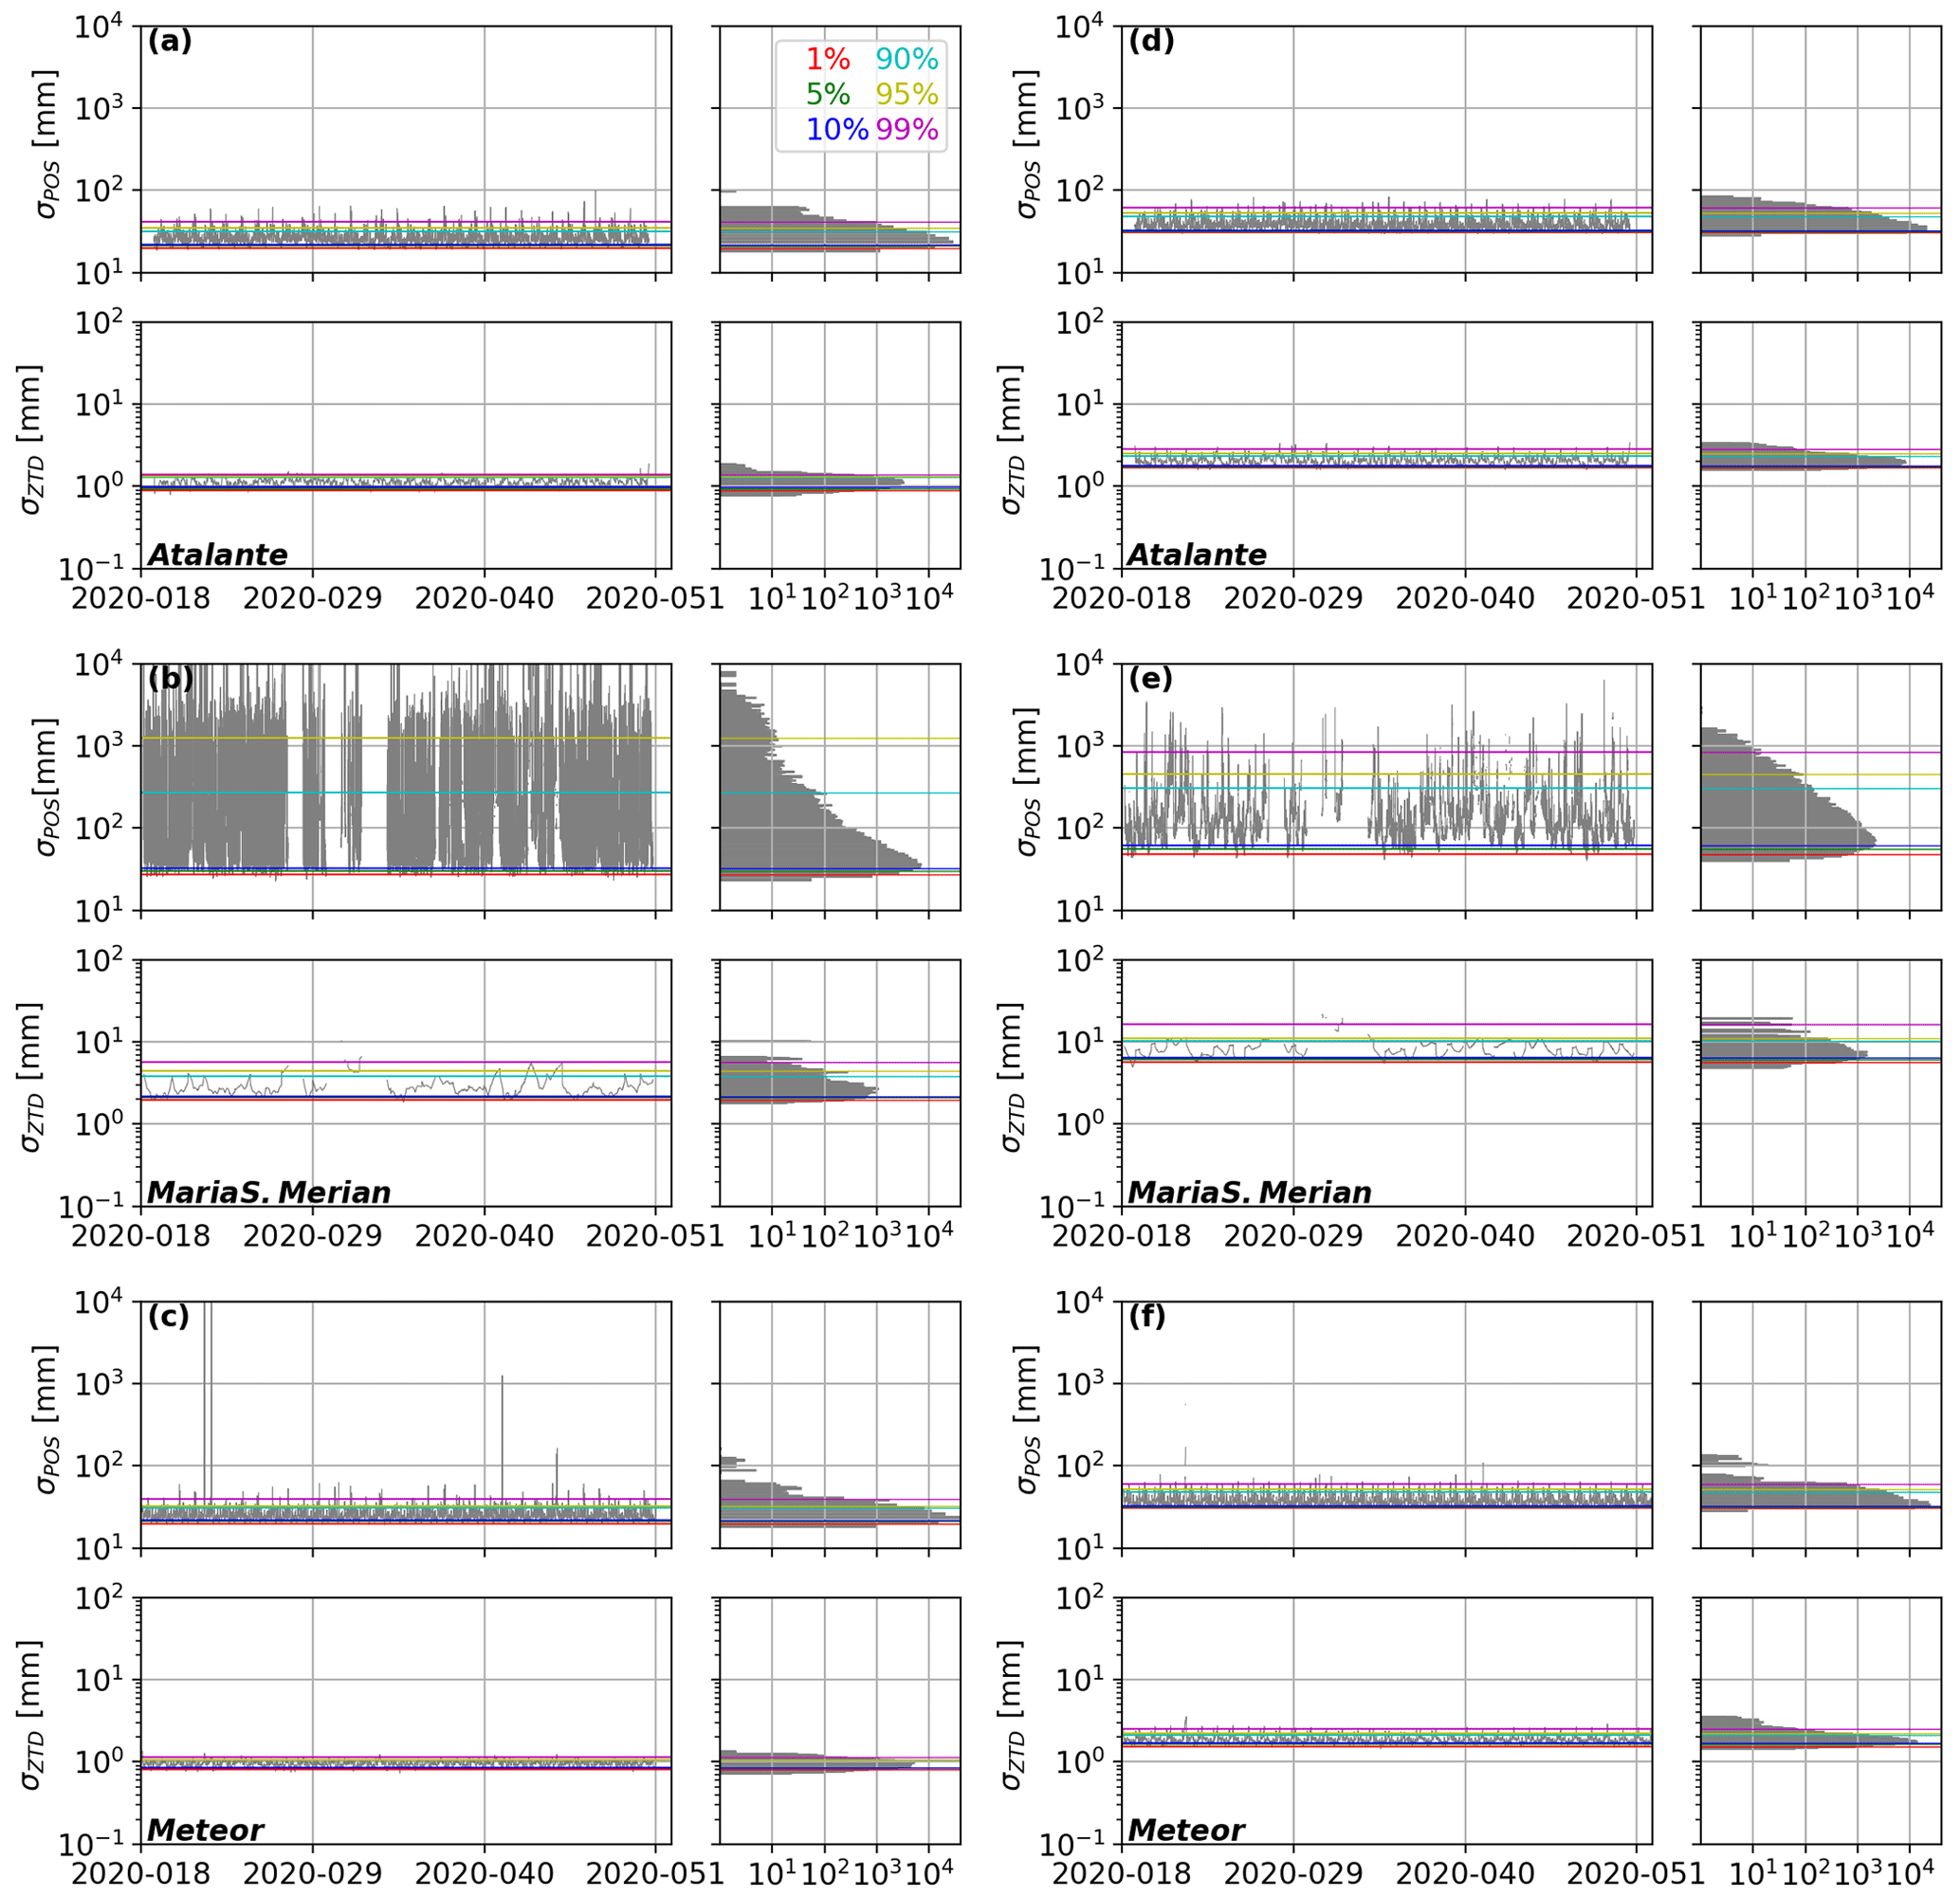
Figure 4Formal errors for position (σPOS) and ZTD (σZTD) estimates for the three R/Vs, from top to bottom: Atalante, Maria S. Merian, and Meteor. (a–c) GIPSY processing. (d–f) SPARK processing. Horizontal coloured lines indicate values for the 1st, 5th, 10th, 90th, 95th and 99th percentiles.
3.1 Formal errors
The first characterization of the processing results was carried out by analysing the formal errors in the three-dimensional positions and ZTD estimates. Figure 4 shows the temporal evolution and the histograms of the formal errors for the two processing software packages and the three R/Vs, and Table 3 reports the respective percentile values. Two features stand out from the plots: the shift towards higher values for the SPARK software results and the very large scatter of the R/V Maria S. Merian results for both software packages. The shift is mainly linked to the differences in parameterization of the two software packages (e.g. weighting of measurements, random walks) and input data (e.g. orbit and clock products). The larger scatter for R/V Maria S. Merian data is explained by the lower data quality leading to more outliers which are associated with larger formal errors.
Table 3Percentile (p) values for formal errors in position (σPOS) and ZTD (σZTD), in millimetres, for GIPSY and SPARK processing.
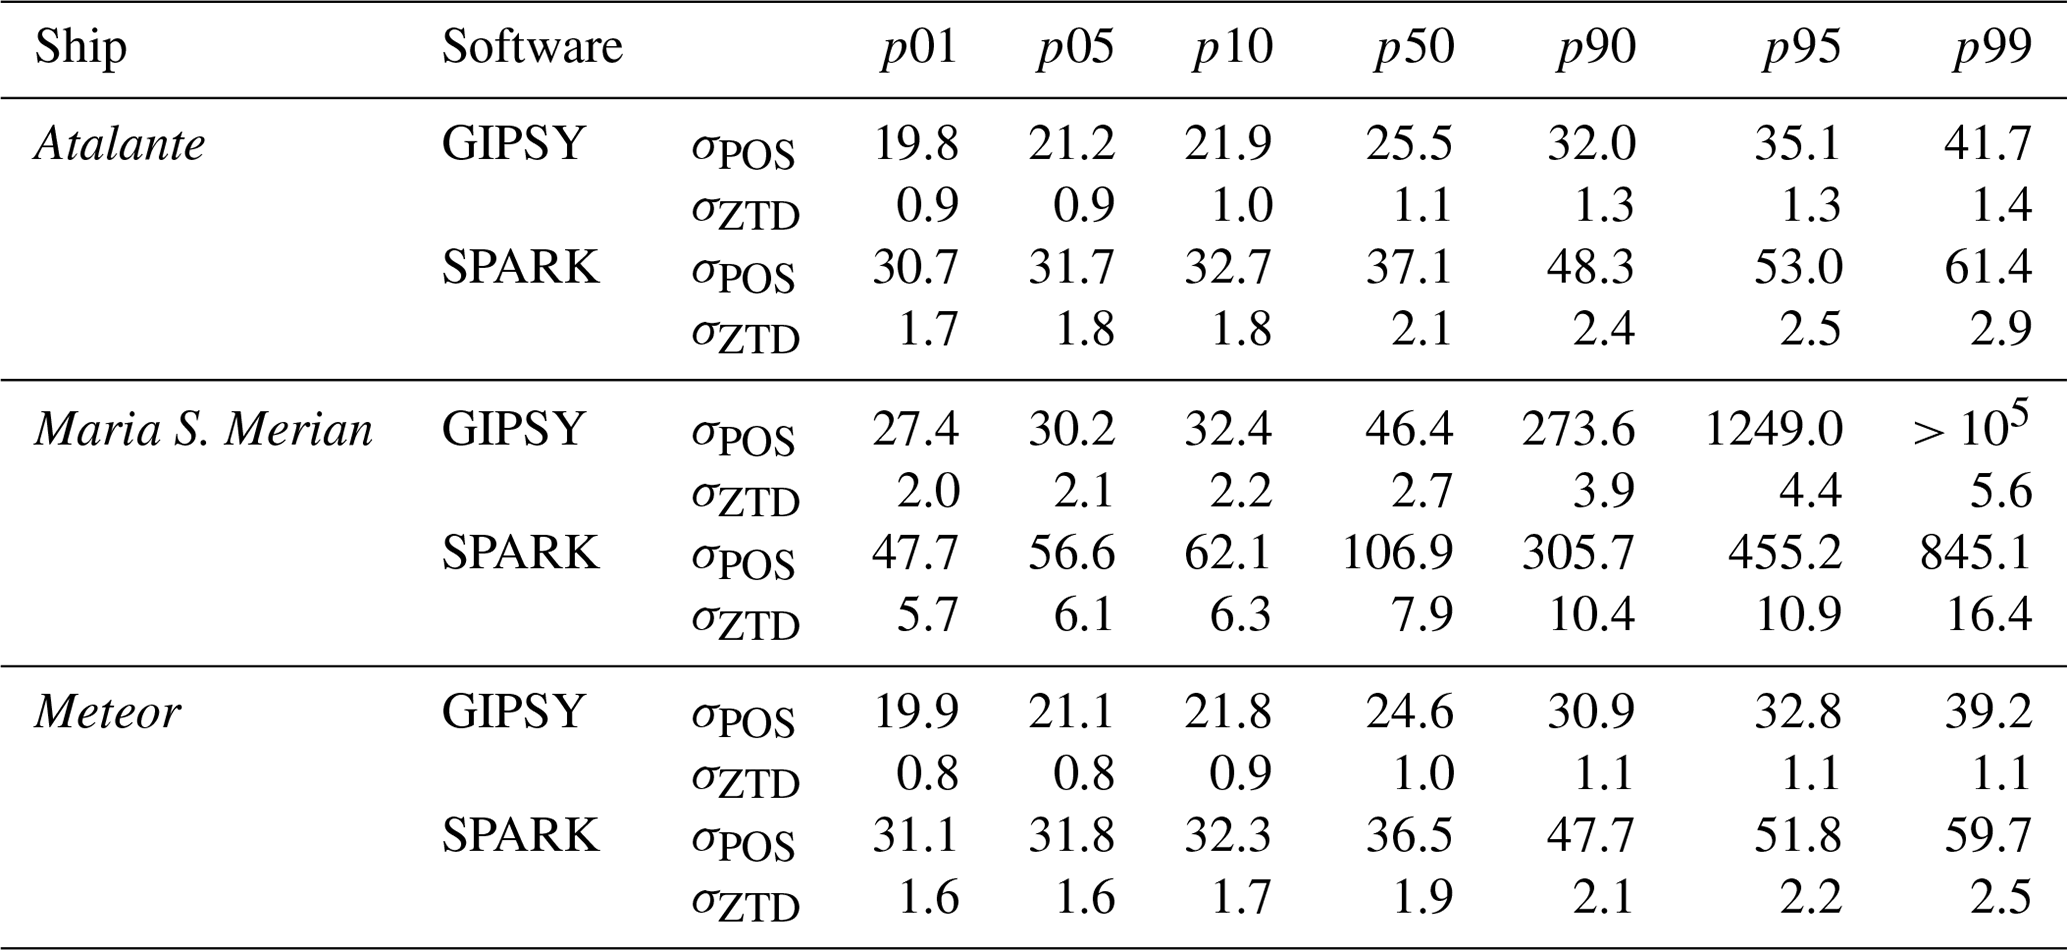
The GIPSY results for R/Vs Atalante and Meteor show median formal errors around 25 mm on positions and 1 mm on ZTDs, with 99th-percentile values around 40 mm for positions and 1.1 to 1.4 mm for ZTDs. The SPARK results are higher by a factor of ∼ 1.5 for positions and 2 for ZTDs, for both R/Vs. For R/V Maria S. Merian, the median values of formal errors are globally higher compared to the other two R/Vs and the ratio of percentiles between processing software packages is not constant. The 99th-percentile value of position error with SPARK is about 85 cm, while it exceeds 100 m with GIPSY which reveals a huge instability in the GIPSY retrievals. Contrary to the position errors, ZTD errors remain small thanks to the constraint on variability imposed by the random-walk model, with 99th-percentile values of 5.6 mm for GIPSY and 16.4 mm for SPARK.
3.2 Data screening
The analysis of the distribution of formal errors helped to set the range limits for the post-processing data screening in order to reject outliers in the ZTD and position estimates (Bock, 2020). Due to the different statistical properties observed in the results discussed above, different thresholds were adopted for the two software packages and the three R/Vs:
-
For both R/V Atalante and R/V Meteor, we observed for processing a dip in the histogram of the formal errors in positions around 70 and 90 mm for GIPSY and SPARK, respectively. Histograms of the formal errors in ZTD did not emphasize any discontinuities. So, for GIPSY estimates, we set the range check upper limit for the formal errors in positions to 70 mm, which led to a rejection of 0.004 % (4 points out of 105) for R/V Atalante and 0.05 % (49 points out of 105) for R/V Meteor. For SPARK estimates, we set the limit for formal errors in positions to 90 mm, which led to no rejection (0 points) for R/V Atalante and a rejection of 0.09 % (85 points) for R/V Meteor. With these range limits, the number of rejections for both software packages was fairly consistent.
-
For R/V Maria S. Merian, the histograms of formal error in positions were more continuous, and only a small dip was observed at around 70 cm for the GIPSY solution. The histograms of formal errors in ZTDs present a dip at around 7 mm for GIPSY and 13 mm for SPARK. For GIPSY, upper limits for the formal errors in position and ZTD were therefore set to 70 cm and 7 mm, respectively, which led to a rejection of 6.7 % (5261 points out of 7.5×10⁴). For SPARK, the limit for formal errors in positions was set 90 cm (i.e. in the same proportion as for the other ships) and the upper limit for the formal errors in ZTD was set to 13 mm, which led to a rejection of 2.82 % (2177 points).
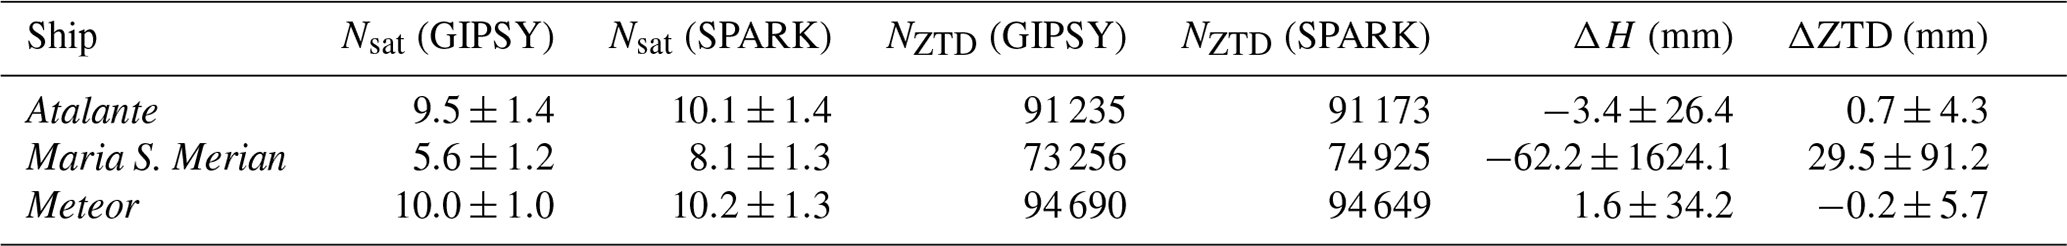
Table 4Comparisons of GIPSY and SPARK processing results: Nsat average number of satellites per epoch; NZTD the total number of ZTD estimates available after the post-processing data screening, ΔH and ΔZTD the differences in height and ZTD estimates (SPARK minus GIPSY). Average number of satellites and differences are given as means ±1 standard deviation.
3.3 Comparison of position and ZTD estimates
Table 4 gives some statistics on the results from the two software packages after the screening. The average number of satellites used per epoch for R/Vs Atalante and Meteor is nominal (around 10) and consistent between software packages. This is not the case for R/V Maria S. Merian for which this number is much smaller for the GIPSY processing (5.6) although slighter better for SPARK (8.1). As previously mentioned, these numbers suggest that a lot of data were edited by both software types, which in the case of GIPSY become very small and make the solution unstable. Figure 5 compares the height and ZTD estimates for R/V Maria S. Merian from both software packages from which the instability of the GIPSY solution is obvious.
The other statistics of Table 4 show that both software packages are able to estimate nearly the same number of height and ZTD parameters for R/Vs Atalante and Meteor, although the number of estimates is smaller for SPARK than for GIPSY. The height and ZTD estimates are fairly consistent between software for R/Vs Atalante and Meteor but much larger for R/V Maria S. Merian despite the outlier screening.
Finally, we decided to keep the GIPSY solutions for R/Vs Atalante and Meteor for the main reason that we have access to more processing output parameters which may be useful for further investigations. For the R/V Maria S. Merian, the SPARK solution was kept because it is obviously of higher quality.
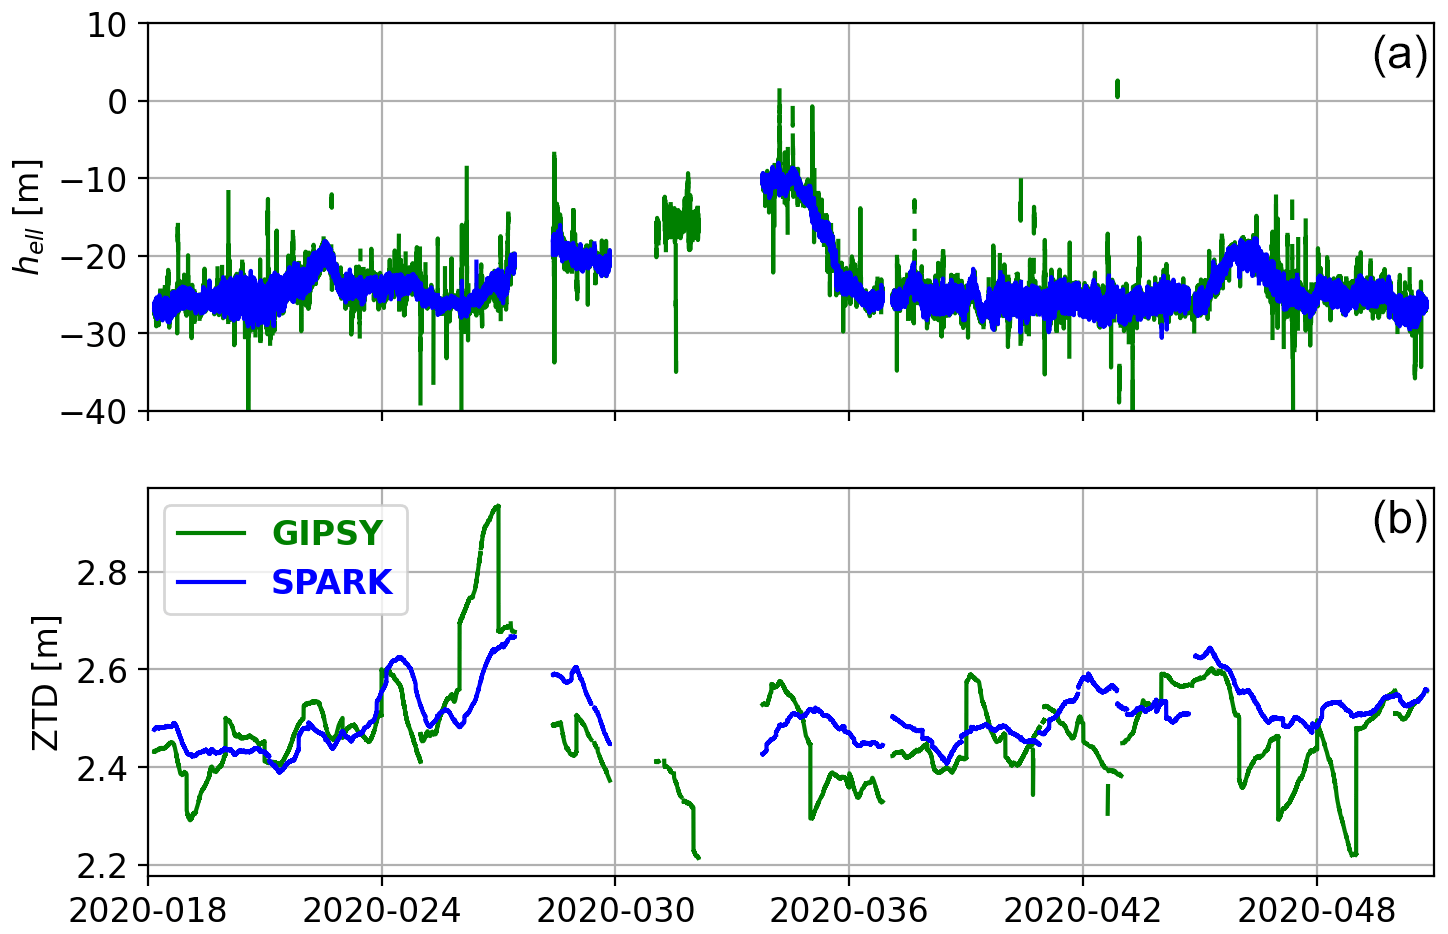
Figure 5Comparisons of ellipsoid height (a) and ZTD (b) estimates for R/V Maria S. Merian using GIPSY (green) and SPARK (blue).
3.4 Vertical positioning evaluation
For the assessment of the vertical component of the final estimated positions, we converted the ellipsoidal heights to geoid heights using EGM2008 (Pavlis et al., 2012), which were then compared to sea surface heights derived from operational ocean model products. The mean sea surface height was taken from the CNES_CLS 2015 model (Pujol et al., 2018); the ocean tides were taken from the FES2014b model (Lyard et al., 2016); and the barometric correction was derived from mean sea level pressure from ERA5 (Hersbach et al., 2020). GNSS height was also corrected from crust deformations using IERS conventional models (Petit and Luzum, 2010) for solid earth tides and ocean tide loading derived from FES2014b.
Figure 6 shows the differences between the modelled and GNSS-estimated geoid heights for the three R/Vs. Note that since the draught between the antenna reference point and the waterline of the ships is not precisely known (and is subject to variations of several tens of centimetres during the cruise), the differences were corrected for the median antenna heights. As a result, the mean differences for all three ships were insignificant. The GNSS time series were also smoothed using a 5 min median filter in order to reduce fast heave movements of the ships. Standard deviations of the GNSS height errors for the filtered data are on the order of 20 cm for R/V Meteor and R/V Atalante. These errors are consistent with the error budget described by Bouin et al. (2009) for sea surface height determination by GNSS and the formal errors in the CNES_CLS mean surface that ranges from a few millimetres up to 10 cm in coastal zones over the area. For R/V Maria S. Merian, the standard deviation reaches 40.8 cm (Fig. 6). The position estimates for this ship are much noisier, reflecting the poorer quality of the GNSS data acquired on this vessel as previously mentioned.

Figure 6Geoid height estimates from GNSS and model (top panel) and differences (model − GNSS) (bottom panel) for the three R/Vs: (a) Atalante, (b) Maria S. Merian and (c) Meteor. Raw denotes the raw height estimates at a 30 s rate; Smooth denotes smoothed height estimates using a 10 min running median. SH_WWS denotes the Significant height of combined wind waves and swell product extracted from ERA5. Numerical values indicate mean ±1 standard deviation.
Inspection of the geoid height time series in Fig. 6 shows a period of larger scatter around 20–22 January 2020. We checked that these errors are not related to the JPL and IGS satellite orbit and clock products by performing a kinematic mode processing of GNSS observations for nearby terrestrial stations. The latter did not show this feature. The impact of a higher speed of ships during this period, which could increase heave, is also not suspected, since the speed values are of the same order throughout the entire campaign. These variations are therefore more likely related to the sea state during this period. This is confirmed by the time series of “Significant height of combined wind waves and swell” that are derived from the product of the same name from ERA5 and represented by dashed lines in Fig. 6 bottom panels: time series show a good agreement between periods of large scatters of differences and high values for waves and swell.
Finally, small offsets are observed in the height time series of R/V Atalante at the beginning and end of the campaign, as the vessel is docked. These variations are probably due to the lower performance of the mean sea surface model in the coastal waters of Guadeloupe.
4.1 GNSS IWV retrieval
As mentioned previously, during the data processing, the ZTD was modelled with two components as follows:
After the processing, we need to extract the ZWD using a precise estimate of the ZHD. In this work, ZHD was computed from mean sea level pressure extracted from ERA5 reanalysis with a horizontal resolution of 0.25∘ × 0.25∘ and temporal sampling of 1 h (Hersbach et al., 2020) using the modified Saastamoinen formula (Saastamoinen, 1972) proposed by Bosser et al. (2007). The ZHD estimates were corrected for the height difference between the GNSS antenna and the mean sea level using the following formula (Steigenberger et al., 2009) which is adequate here since the height differences remain small (< 50 m):
where hERA5 and hGNSS are the geoid heights of the ERA5 grid point and of the GNSS antenna, respectively; T(hERA5) and P(hERA5) are the temperature and pressure from ERA5 at the model surface; g(hERA5)=9.8062 m s−2 is the gravity at the model surface; gatm=9.7840 m s−2 is the approximated gravity of the centre of mass of the atmosphere (Nilson et al., 2013); and k1=0.77643 K Pa−1 is a refractivity constant for dry air updated by Bock et al. (2021) for the EUREC4A period. In the case that larger height differences are considered, a more accurate formulation of height correction should be applied such as that proposed in Bock (2020).
The final GNSS ZWD estimate was obtained as
and the IWV was converted from ZWD(hGNSS) following
where κ(Tm) is a semi-empirical function of the weighted mean temperature Tm (Bevis et al., 1992):
where Rv=461.5 J K−1 kg−1 is the specific gas constant for water vapour and K Pa−1 and k3=3752.01 K2 Pa−1 are refractivity constants for the water molecule updated by Bock et al. (2021). The Tm values used to compute κ are provided by TU Wien on the same global grid as the a priori ZHD and ZWD products used for GNSS processing. We interpolated the Tm values at each position and time for which the GNSS ZWD estimates were available. The final GNSS IWV estimates were retrieved at a resolution of 30 s for all three R/Vs.
4.2 IWV comparisons with ERA5 and MODIS
4.2.1 ERA5 IWV pre-processing
The ERA5 reanalysis IWV data were provided by the Copernicus service (Hersbach et al., 2020) with a horizontal resolution of 0.25∘ × 0.25∘ and temporal sampling of 1 h. We first extrapolated the IWV data from the ERA5 model surface to the height of the GNSS antenna by using the empirical formulation proposed by Bock et al. (2005):
where kg m−3 is an adequate scaling constant; hERA5 and hGNSS are the geoid heights (in metres) of the ERA5 grid points and of the GNSS antenna, respectively; IWVERA5(hERA5) is the ERA5 IWV value at the grid point; and IWVERA5(hGNSS) is the extrapolated value at the GNSS antenna height.
The final 1-hourly ERA5 IWV values to be compared with GNSS retrievals were computed by bilinearly interpolating the values from the four ERA5 grid points surrounding the GNSS antenna.
4.2.2 MODIS_IR IWV pre-processing
MODIS IWV retrievals used here are based on clear sky, nighttime and daytime infrared (hereafter MODIS_IR) products MYD05 and MOD05, collection 6, from the Aqua and Terra satellites, respectively (King et al., 2003). The spatial resolution of MODIS_IR products is 5 km. We only used data for which the “Quality_Assurance_Infrared” flags were set to “Useful” and “Best Quality”. For each pass of the Aqua and Terra satellites over the EUREC4A domain, the closest pixel representing a valid IWV within a 20 km radius area around each vessel was considered. In the time domain, the satellite measurements and the GNSS measurement are time-matched.
Note that the MODIS near-IR IWV product is known to be of higher quality than the IR product but it is only available during the daytime, over infrared reflective surfaces such as clear land, clouds and oceanic areas in the condition of sun glint. The latter condition is very restrictive as only very few observations were found be valid over our study area. For this reason we only used the IR product here.
Several studies have evaluated the MODIS_IR IWV product by comparison with ground-based measurements from radiosondes and ground-based water vapour radiometers. They have found an rms difference of between 5 and 6 kg m−2 in cloud-free conditions (Liu et al., 2015; Ferrare et al., 2002). The accuracy of the MODIS_IR IWV products is less than expected from the ERA5 reanalysis, but it still provides an independent observational source of evaluation for the GNSS retrievals.

Figure 7IWV time series from GNSS, ERA5 and MODIS_IR (top panel) and differences with respect to GNSS (ERA5 or MODIS_IR − GNSS) (bottom panel) for the three R/Vs: (a) Atalante, (b) Maria S. Merian and (c) Meteor.
4.2.3 Note on spatial and temporal representativeness
The GNSS, ERA5 and MODIS_IR data are time-matched for the comparisons; i.e. the closest GNSS estimate is used for each of the ERA5 or MODIS_IR estimates. The time difference is thus implicitly limited to ±15 s. Since all three datasets provide more or less instantaneous IWV estimates, there is no significant difference in the timescales.
Regarding the spatial scale, GNSS measurements are analysed within a cut-off angle of 7.5∘ above the horizon. Assuming a representative height for water vapour in the atmosphere of about 5 km yields an IWV footprint with a radius of about 35 km around the GNSS antenna. ERA5 has a horizontal resolution of 0.25∘ (25–30 km) which is fairly consistent with GNSS retrievals. On the other hand, MODIS_IR has a horizontal resolution of 5 km. However, for the comparison with GNSS and ERA5, we have considered MODIS_IR pixels within a 20 km radius around the GNSS antenna to compute the MODIS_IR-related IWV. Therefore the horizontal scales of the retrievals associated with the different techniques are fairly consistent and no significant spatial representativeness errors are expected.
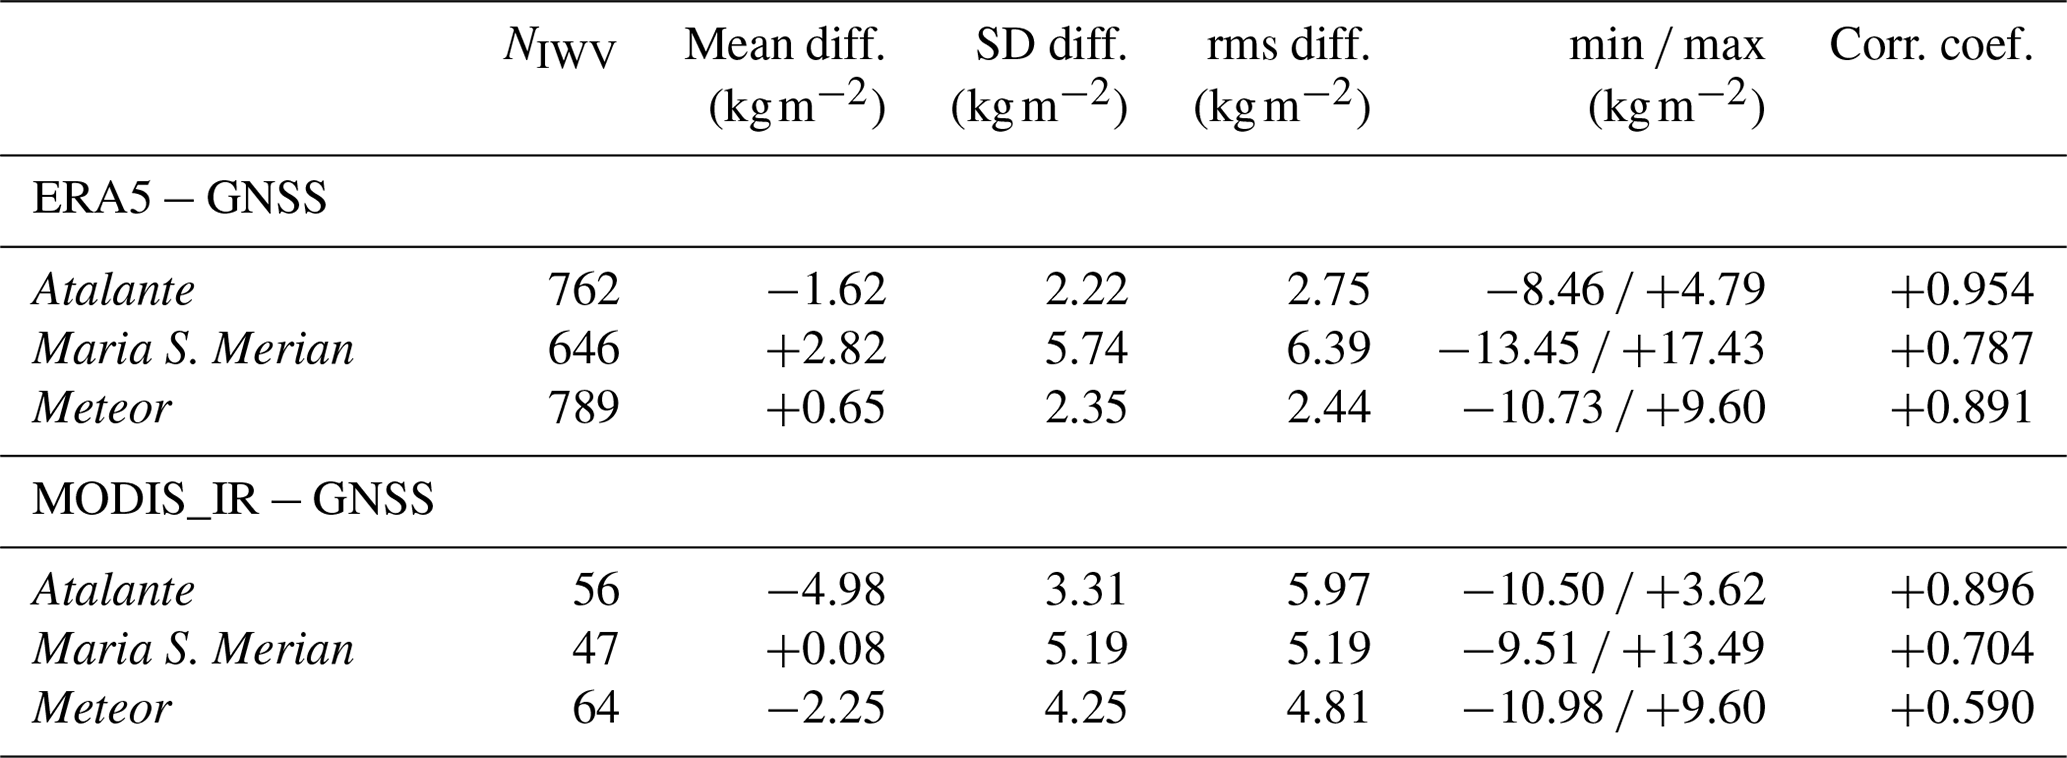
Table 5Comparisons of ERA5 and MODIS_IR IWV with respect to ship-borne GNSS estimates: NIWV – number of IWV comparisons, mean, standard deviation, rms, minimum and maximum of IWV differences (ERA5 or MODIS_IR minus GNSS), and correlation coefficient.
4.2.4 Comparison results
Figure 7 shows the IWV time series and the differences for the three datasets and the three R/Vs. The agreement between GNSS and ERA5 is fairly good for R/Vs Atalante and Meteor. Both datasets are consistent in depicting the slow temporal variations of IWV during the cruises of both ships. The differences for the shorter time variations rarely exceed ±5 kg m−2, but in general, the rapid variations are more peaked in the GNSS series. For R/V Maria S. Merian, the agreement is not as good, with IWV differences often exceeding the level of ±5 kg m−2. Nevertheless, the slow variations in IWV are still properly retrieved by GNSS in spite of discontinuities in the time series. For the three R/Vs, the agreement with MODIS_IR IWV data is globally not as good as with ERA5 IWVs, with much more scattered results and IWV differences with respect to the GNSS estimates from R/Vs Atalante and Meteor often exceeding the level of ±5 kg m−2.
Interestingly, the IWV time series for R/V Meteor is more concentrated around 30 kg m−2, while the other two R/Vs sampled higher IWV contents during their southward excursions in the tropics (e.g. up to 50 kg m−2 around day 28). Correlated variations in IWV are also observed by all three ships in different periods as a result of the large-scale atmospheric circulation (e.g. the increasing IWV trend between days 40 and 46).
Statistics of IWV differences between GNSS, ERA5 and MODIS_IR are given in Table 5. The mean difference between GNSS and ERA5 is negative for R/V Atalante (−1.62 kg m−2), meaning that GNSS over-estimates IWV compared to ERA5, while the difference with R/V Meteor is positive (+0.65 kg m−2). These biases can be seen in the time series of Fig. 7 where the IWV differences for R/V Atalante are mainly below zero, while they are more centred on zero for R/V Meteor. The origin of these biases is unclear and may partly be due to a small differential bias in the ZTD estimates from the two ships (possibly connected with different multipath effects; see the discussion in the previous section). However, small dry biases were also reported in ERA5 over the Caribbean arc compared to ground-based GNSS IWV data during the NAWDEX campaign (Bosser and Bock, 2021) and during EUREC4A (Bock et al., 2021), although they were smaller during the latter, possibly thanks to the additional observations assimilated into the reanalysis during the EUREC4A campaign. The standard deviations of differences are around 2.3 kg m−2, and the correlation coefficients are above 0.89 for R/V Meteor and above 0.95 for R/V Atalante.
As expected, the agreement with ERA5 is not as good for R/V Maria S. Merian, both in terms of mean (+2.82 kg m−2) and standard deviation (> 5 kg m−2), with minimum and maximum differences in excess of ±13 kg m−2. The correlation coefficient is also smaller (< 0.8) than for the other two ships.
The statistics of comparisons with respect to MODIS_IR are worse than for ERA5, although consistent with the accuracy of this MODIS_IR product over the ocean. GNSS IWV retrievals are dry-biased with respect to MODIS_IR products for both R/V Atalante (−4.98 kg m−2) and R/V Meteor (−2.25 kg m−2), and standard deviations are in excess of 3.3 kg m−2. The correlation coefficient is also smaller for the two ships compared to ERA5, with a value significantly lower for R/V Meteor. Concerning R/V Maria S. Merian, the statistics of the comparison with MODIS_IR are better than for ERA5, with the exception of the correlation coefficient. GNSS IWV retrievals are slightly moist-biased with respect to MODIS_IR products for R/V Maria S. Merian (+0.08 kg m−2). Nevertheless, indicators such as the standard deviation, rms, and minimum and maximum differences all suggest that the statistical comparison with MODIS_IR is worse for R/V Maria S. Merian than for the other two ships.
From the statistical analysis between GNSS and ERA5, we may estimate the differential bias between R/V Atalante and R/V Meteor to be ∼ 2.2 kg m−2 on average. The differential bias with respect to ERA5 between R/V Maria S. Merian and R/V Atalante amounts to 4.4 kg m−2, and this bias reduces to 2.2 kg m−2 between R/V Maria S. Merian and R/V Meteor. The differential biases with respect to MODIS_IR are consistent.
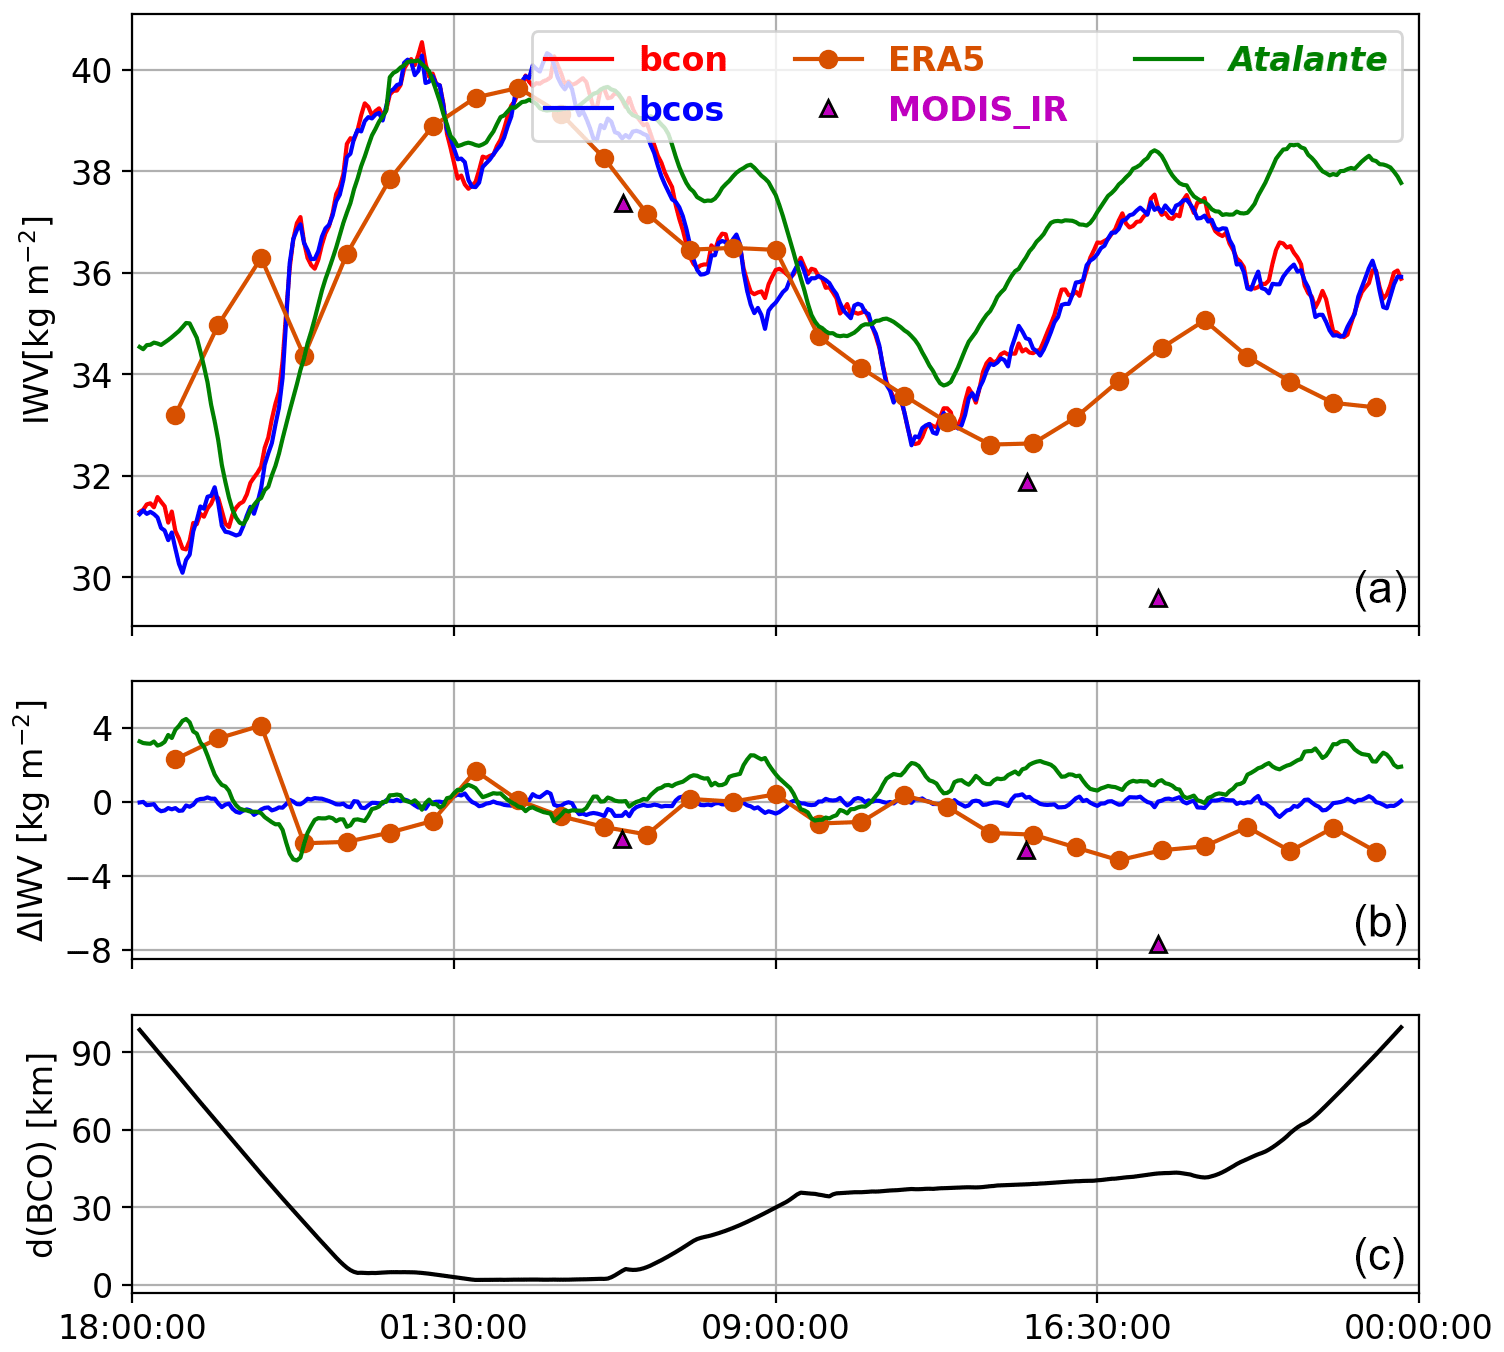
Figure 8IWV time series from R/V Atalante GNSS data, ground-based GNSS data at the BCO (station BCON and BCOS), ERA5, and MODIS_IR, as Atalante passes close to the BCO between day of year 47 (18:00 UTC) and day of year 49 (00:00 UTC). (a) The IWV time series; (b) the differences with respect to BCON; and (c) the distance between R/V Atalante and the BCON station.
4.3 IWV comparisons with ground-based GNSS stations
The IWV estimates from the three ships were also compared to the IWV data retrieved from permanent stations operated in the Caribbean and the two GNSS stations (BCON and BCOS) installed at the BCO for EUREC4A (Bock et al., 2021). The ground-based IWV estimates were height-corrected using Eq. (6), and the comparisons were performed when the distance between the ships and ground-based GNSS stations was smaller than 20 km and the height difference was smaller than 100 m. Statistics were computed when at least 20 data points were available. Available for comparison were eight stations for R/V Atalante, two stations for R/V Maria S. Merian and two stations for R/V Meteor.
As an example, Fig. 8 compares the IWV data for a short period when the R/V Atalante passed close to the BCO. The upper panel of Fig. 8 shows the IWV time series from which it can be seen that the temporal variations between the ship-borne and ground-based GNSS measurements are highly consistent, especially when the ships get closer than 20 km (variations are then well within ±1 kg m−2 in the middle panel). Comparatively, ERA5 shows large spurious variations, with a marked wet bias between 18:00 and 20:00 UTC (day 47) and a persistent dry bias between 14:00 and 00:00 UTC (day 48).
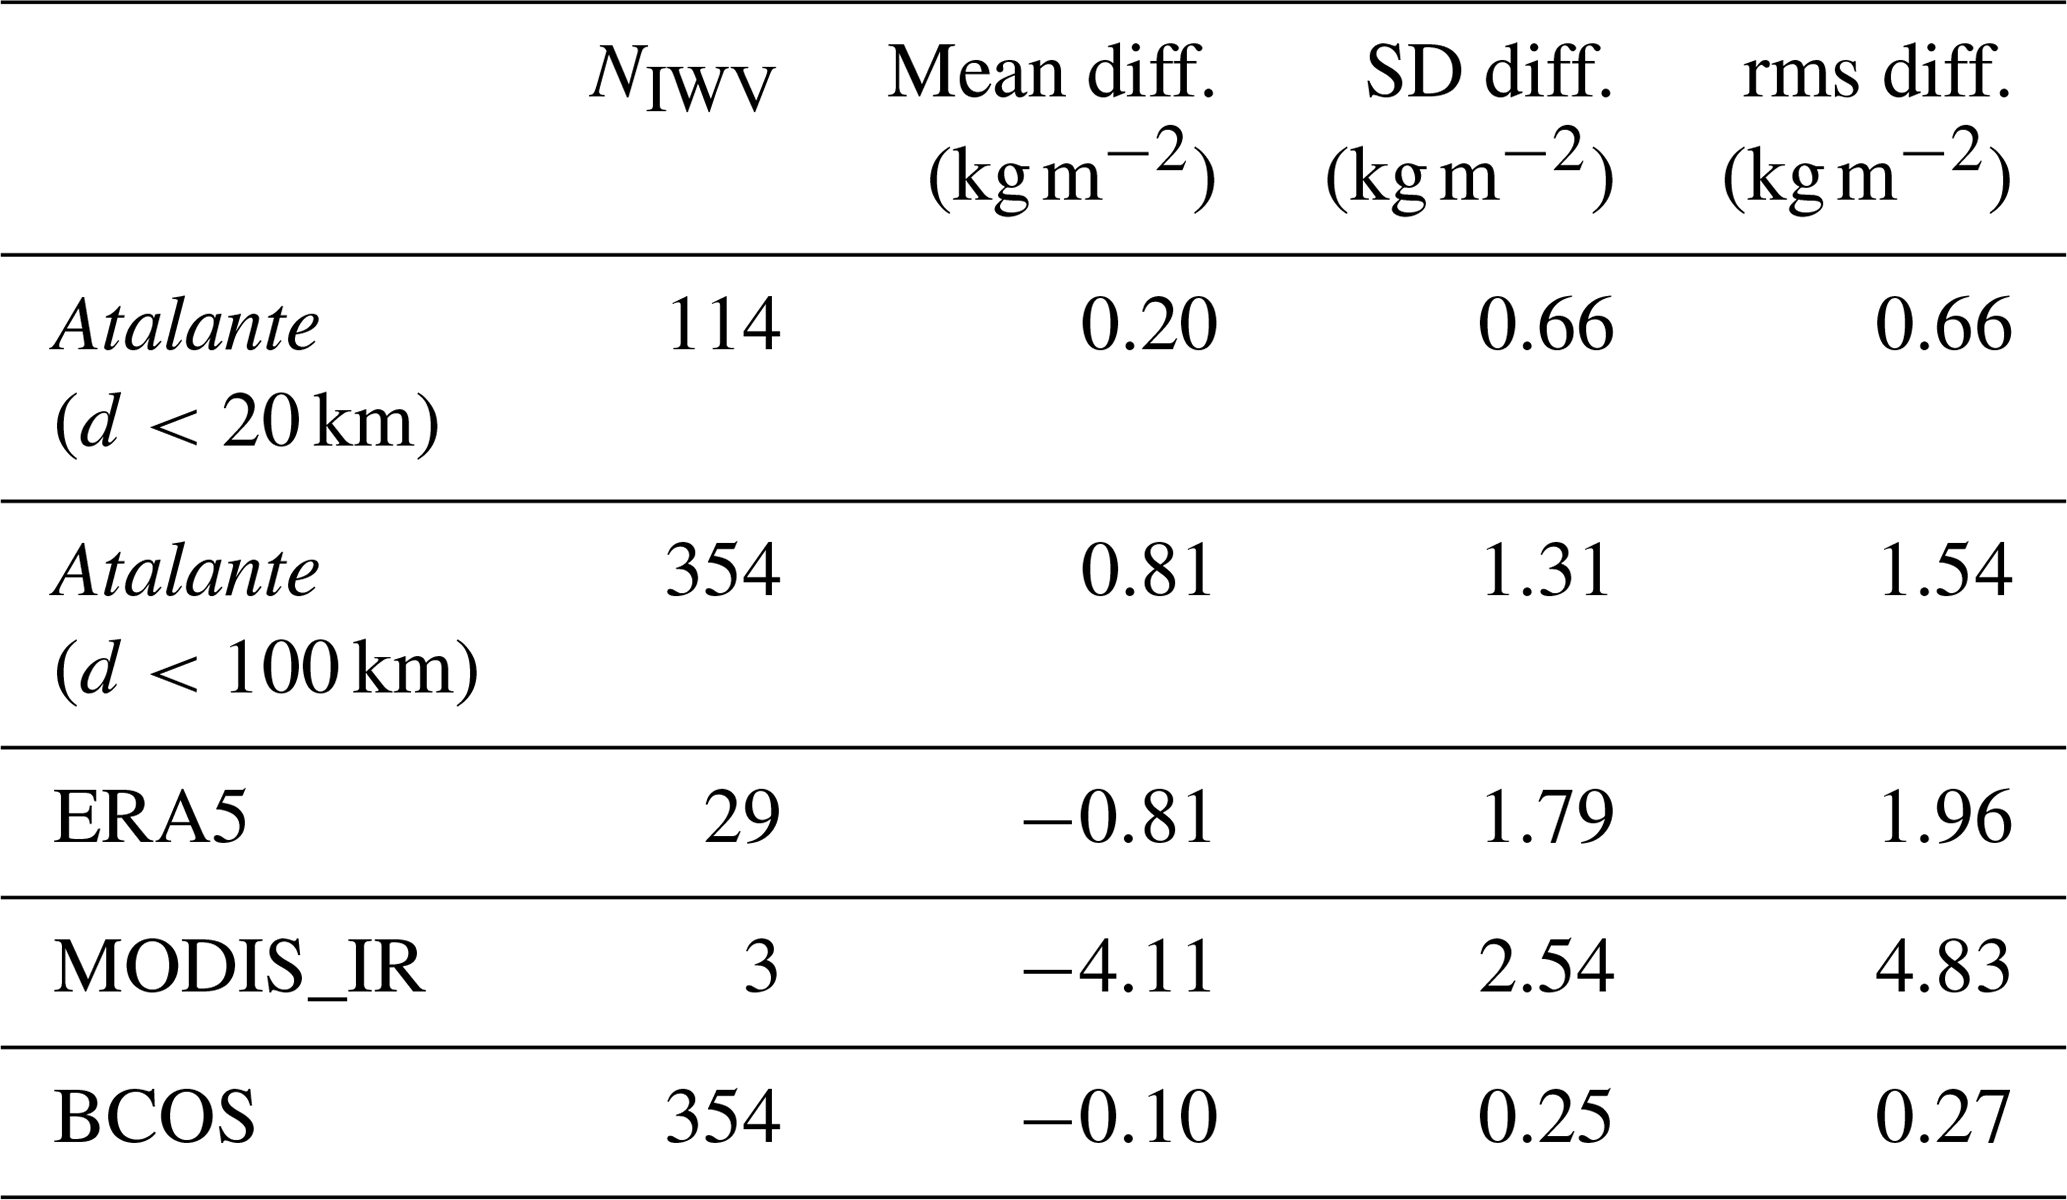
The statistics of the differences in all IWV retrievals with respect to the BCON station are summarized in Table 6. A difference of −0.02 ± 0.66 kg m−2 is observed between R/V Atalante and BCON when the distance is smaller than 20 km, which increases to 0.81 ± 1.31 kg m−2 when distances of up to 100 km are included. ERA5 has a mean bias of −0.81 kg m−2 and a standard deviation of difference of 1.79 kg m−2. The MODIS_IR comparison is not significant as only three points of comparison are available over this short period. The difference between the two ground-based GNSS stations is −0.10 ± 0.25 kg m−2. This is an estimate of the internal precision of the technique which is obviously very good.

Figure 9Comparisons of GNSS IWV from the three R/Vs to GNSS IWV retrieved from ground-based GNSS stations when the R/Vs pass close to the stations. The dots represent the mean difference (ground-based stations − R/V), and the error bars represent the standard deviation of differences. The x axis represents time. The central period is not displayed because no data could be compared as the ships were far offshore. Results enclosed in the two dashed-line rectangles are valid at the same time but are separated in the plot for legibility. The three ships are distinguished by different colours.
The mean and standard deviation of IWV differences from the three ships with all encountered ground-based GNSS stations are plotted as a function of time in Fig. 9. The R/V Atalante shows an overall negative bias, meaning that the ship-borne IWV estimates are larger than the ground-based station results, while the R/V Meteor results are of the opposite sign. The differential bias between R/V Atalante and R/V Meteor shown in Fig. 9 is seen to be ≈ 2 kg m−2 on average. This result is fairly consistent with the differential bias between the two ships derived from the ERA5 and MODIS_IR comparisons discussed in the previous sub-section, although the time series are largely under-sampled here due to the distance restriction between the ships and ground-based stations. During two periods (day of year 19–20 and 49–50), the R/V Atalante crosses a group of four stations in Guadeloupe (marked by dashed-line rectangles in Fig. 9). For both periods the bias is more negative compared to BCON and MAGT, located slightly south of the main island Marie-Galante of Guadeloupe. It can also be noticed that during the second period the biases are increasingly more negative with time; this may be connected with the ship entering the harbour where more multipath effects are to be expected. For R/V Maria S. Merian the biases are much larger although the standard deviations remain close to those observed for the other comparisons.
Table 6Comparisons of IWV data from GNSS on R/V Atalante, ERA5, MODIS_IR and the GNSS station BCOS to IWV data from the GNSS station BCON from day of year 47 (18:00) to day of year 49 (00:00 UTC): NIWV – number of comparisons, mean, standard deviation and rms of differences.
4.4 IWV comparisons during ships encounters
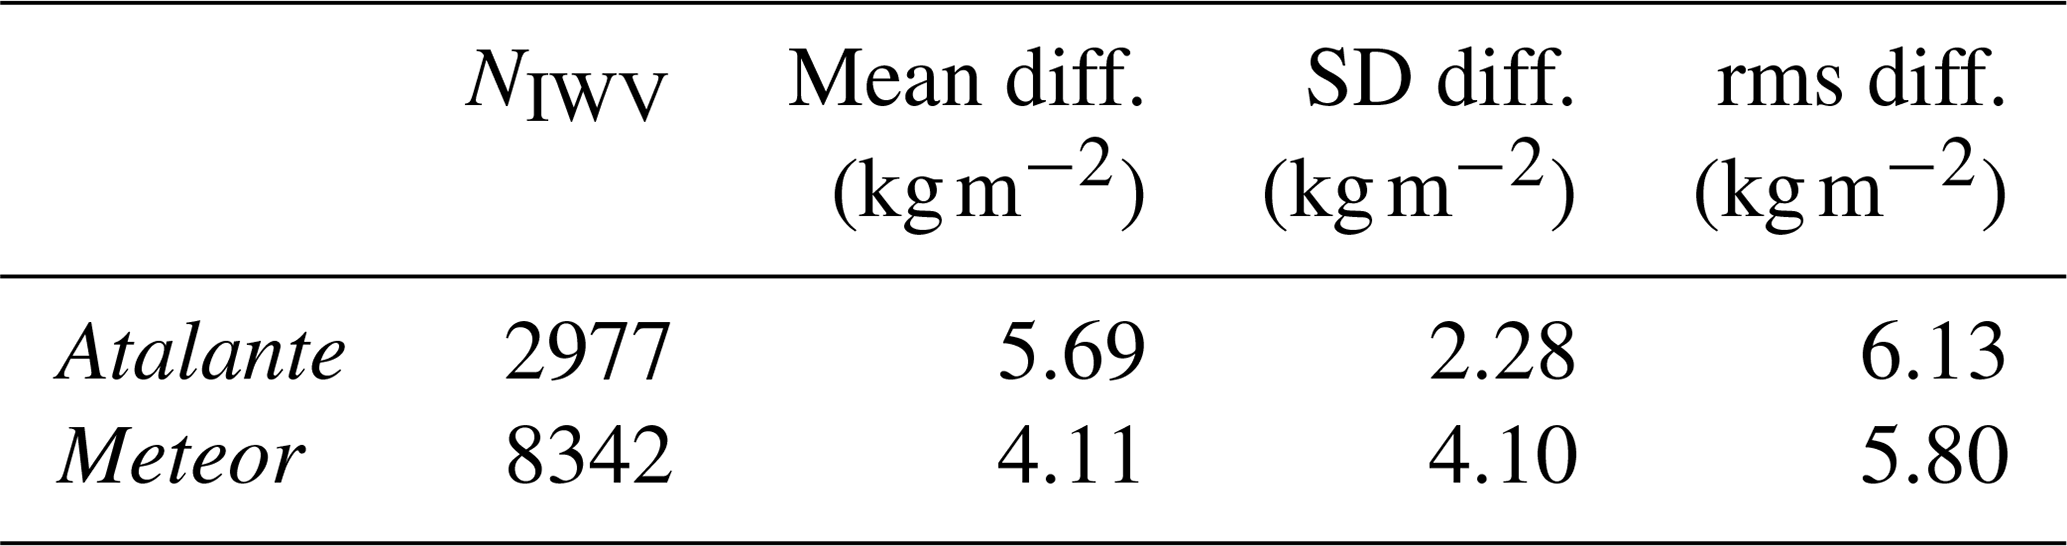
During the campaign, the R/V Maria S. Merian met with the other two R/Vs several times: three times with R/V Atalante (for a total duration of about 25 h and 2977 points of comparison) and eight times with Meteor (for a total duration of about 70 h and 8342 points of comparison). Table 7 shows the mean IWV differences between the ships which can be compared to the differential biases discussed above using ERA5 as a common reference. Here, the bias between R/V Atalante and R/V Maria S. Merian amounts to 5.69 kg m−2 and the bias between R/V Meteor and R/V Maria S. Merian reduces to 4.11 kg m−2. The agreement with the differential biases found with respect to ERA5 is quite poor (4.4 and 2.2 kg m−2 for these two comparisons, respectively). The reason is that the R/V Maria S. Merian has a varying bias component (Fig. 7) combined with the fact that these biases are computed over different sample periods. Similarly, the differential bias between R/V Atalante and R/V Meteor using R/V Maria S. Merian as a common reference amounts to kg m−2 which is in poor agreement with the differential bias between these ships estimated previously with respect to ERA5 (2.2 kg m−2). The standard deviation of the differences are very different (2.28 kg m−2 between R/V Atalante and R/V Maria S. Merian and 4.10 kg m−2 between R/V Meteor and R/V Maria S. Merian), which again is explained by the varying bias component of the R/V Maria S. Merian IWV retrievals.
Table 7Comparisons of IWV from R/Vs Atalante and Meteor to IWV from Maria S. Merian: NIWV – number of comparisons, mean, standard deviation and rms of differences.
MSS_CNES_CLS_15 was produced by CLS and distributed by Aviso+, with support from CNES (https://www.aviso.altimetry.fr/, last access: 20 September 2020).
FES2014b was produced by Noveltis, Legos and CLS and distributed by Aviso+, with support from CNES (https://www.aviso.altimetry.fr/, last access: 20 September 2020).
ERA5 data are provided by the Copernicus Climate Change Service (C3S, 2017; https://cds.climate.copernicus.eu/cdsapp#!/home, last access: 20 September 2020).
The RINEX files containing the GNSS measurements as well as the screened IWV estimates are available for download at the AERIS website:
-
GNSS RINEX files.
-
R/V Atalante – https://doi.org/10.25326/74 (Bosser et al., 2020d)
-
R/V Maria S. Merian – https://doi.org/10.25326/75 (Bosser et al., 2020e)
-
R/V Meteor – https://doi.org/10.25326/76 (Bosser et al., 2020f)
-
-
GNSS IWV data.
-
R/V Atalante – https://doi.org/10.25326/71 (Bosser et al., 2020a)
-
R/V Maria S. Merian – https://doi.org/10.25326/72 (Bosser et al., 2020b)
-
R/V Meteor – https://doi.org/10.25326/73 (Bosser et al., 2020c).
-
GPS phase measurements from GNSS instruments on board R/Vs Atalante, Maria S. Merian and Meteor operating during the EUREC4A campaign have been processed, and the position and IWV estimates have been inter-compared and validated. A thorough data quality check revealed that the data acquired on R/Vs Atalante and Meteor are of higher quality than the data from R/V Maria S. Merian, likely because of the location of the antenna on the latter R/V making it more prone to multipath errors and signal pickup from other instruments (e.g. radars). Two software packages were used to process the phase measurements in kinematic PPP mode. The GIPSY software which we usually use to process both static terrestrial and kinematic ship-borne measurements failed to analyse the noisy data from R/V Maria S. Merian. The online SPARK software performed better, but still the results for the R/V Maria S. Merian were of much lower quality than for the other two ships. Nevertheless, we decided to keep the SPARK results for the R/V Maria S. Merian and the GIPSY results for the other two ships. A post-processing screening procedure was also applied to the ZTD estimates in order to remove outliers, mainly in the R/V Maria S. Merian data.
First the ship-borne GNSS results were assessed through the comparison of the estimated vertical position components with sea surface height models. The results were quite conclusive for R/Vs Meteor and Atalante, while R/V Maria S. Merian data showed significant inconsistencies. Second, the ship-borne IWV estimates were compared to the ERA5 reanalysis. A small negative bias of −1.62 kg m−2 was found for R/V Atalante; a small positive bias of +0.65 kg m−2 was found for R/V Meteor; and a slightly larger bias of +2.52 kg m−2 was found for R/V Maria S. Merian. The rms differences for the three ships amounted to 2.2, 2.7 and 5.75 kg m−2, respectively. The much larger rms differences for the R/V Maria S. Merian point to the difficulty of retrieving accurate IWV estimates from the noisy measurements of the GNSS system on this ship. We also compared the ship-borne IWV retrievals to the MODIS infrared product. The latter is, however, not very accurate over the oceans, and we found rms differences of between 4.8 and 6.0 kg m−2. A differential bias was evidenced between R/Vs Atalante and Meteor of 2.27 kg m−2. We hypothesize that the ship-borne GNSS measurements from R/Vs Atalante and Meteor may have some small local multipath errors as well. The differential bias between R/V Maria S. Merian and the other two R/Vs was estimated to be 4.4 kg m−2 (R/V Atalante minus R/V Maria S. Merian) and 2.2 kg m−2 (R/V Meteor minus R/V Maria S. Merian). However, we emphasize that the GNSS IWV retrievals from the R/V Maria S. Merian include a strongly varying bias component that makes these results rather inaccurate. Comparison with ground-based GNSS IWV data from stations located along the route of the three R/Vs confirms the previous results.
This study highlights the potential of retrieving IWV estimates from GNSS measurements collected from dual-frequency GNSS or GPS navigation systems on board modern research vessels. The strength of this technique lies in the existence of a large number of ships (not only research vessels) cruising the oceans that are already equipped with such GNSS systems. Further investigations are currently being made for retrieving IWV estimates in near real time that would be especially useful for numerical weather prediction.
PB carried out the GNSS data analysis and the comparisons. PB, OB and CF analysed the results and co-wrote the article with contributions from SB and SP. SB organized the EUREC4A campaign.
The authors declare that they have no conflict of interests.
This article is part of the special issue “Elucidating the role of clouds–circulation coupling in climate: datasets from the 2020 (EUREC4A) field campaign”. It is not associated with a conference.
The authors would like to thank the following on-board technical staff of Atalante (Génavir), Maria S. Merian and Meteor (Briese Research) for their support in the preparation of the on-board GNSS configuration and the acquisition of the GNSS data at sea during the campaign: Michael Maggiulli, Emmerich Reize, Heinz Voigt-Wentzel, Olaf Willms and Reimar Wolf (Briese Research) and Hervé Bisquay and Thomas Peel (Génavir). Stefan Kinne and Bjoern Bruegmann (Max-Planck-Institut für Meteorologie) and Johannes Karstensen (Geomar) are also acknowledged for providing contacts and support to the project.
This work was supported by the CNRS programme LEFE/INSU through the projects GEMMOC and VEGAN.
The EUREC4A project was supported by the European Research Council (ERC) under the European Union's Horizon 2020 research and innovation programme (grant agreement no. 694768).
This paper is IPGP contribution number 4196.
This paper was edited by Silke Gross and reviewed by Kebiao Mao and one anonymous referee.
Banville, S., Donahue, B., Farinaccio, J., Hassen, E., and Lamothe, P.: Updates to the CSRS-PPP online service, in: IGS Workshop 2018, Wuhan, PRC, 29 October–2 November 2018. a
Bar-Sever, Y. E., Kroger, P. M., and Borjeson, J. A.: Estimating horizontal gradients of tropospheric path delay with a single GPS receiver, J. Geophys. Res., 103, 5019–5035, https://doi.org/10.1029/97JB03534, 1998. a
Bertiger, W., Desai, S. D., Haines, B., Harvey, N., Moore, A. W., Owen, S., and Weiss, J. P.: Single receiver phase ambiguity resolution with GPS data, J. Geodesy, 84, 327–337, https://doi.org/10.1007/s00190-010-0371-9, 2010. a
Bertiger, W., Bar-Sever, Y., Dorsey, A., Haines, B., Harvey, N., Hemberger, D., Heflin, M., Lu, W., Miller, M., Moore, A. W., Murphy, D., Ries, P., Romans, L., Sibois, A., Sibthorpe, A., Szilagyi, B., Vallisneri, M., and Willis, P.: GipsyX/RTGx, a new tool set for space geodetic operations and research, Adv. Space Res., 66, 469–489, https://doi.org/10.1016/j.asr.2020.04.015, 2020. a
Bevis, M., Bussinger, S., Herring, T. A., Rocken, C., Anthes, R. A., and Ware, R. H.: GPS Meteorology: Remote Sensing of Atmospheric Water Vapor Using the Global Positioning System, J. Geophys. Res., 97, 15787–15801, 1992. a, b, c
Bock, O.: Standardization of ZTD screening and IWV conversion, in: Advanced GNSS Tropospheric Products for Monitoring Severe Weather Events and Climate: COST Action ES1206 Final Action Dissemination Report, edited by: Jones, J., Guerova, G., Douša, J., Dick, G., de Haan, S., Pottiaux, E., Bock, O., Pacione, R., and van Malderen, R., Springer International Publishing, 314–324, https://doi.org/10.1007/978-3-030-13901-8_5, 2020. a, b
Bock, O., Keil, C., Richard, E., Flamant, C., and Bouin, M.-N.: Validation of precipitable water from ECMWF model analyses with GPS and radiosonde data during the MAP SOP, Q. J. Roy. Meteor. Soc., 131, 3013–3036, https://doi.org/10.1256/qj.05.27, 2005. a
Bock, O., Bouin, M. N., Doerflinger, E., Collard, P., Masson, F., Meynadier, R., Nahmani, S., Koité, M., Gaptia Lawan Balawan, K., Didé, F., Ouedraogo, D., Pokperlaar, S., Ngamini, J.-B., Lafore, J. P., Janicot, S., Guichard, F., and Nuret, M.: West African Monsoon observed with ground-based GPS receivers during African Monsoon Multidisciplinary Analysis (AMMA), J. Geophys. Res., 113, 21005, https://doi.org/10.1029/2008JD010327, 2008. a
Bock, O., Bosser, P., Bourcy, T., David, L., Goutail, F., Hoareau, C., Keckhut, P., Legain, D., Pazmino, A., Pelon, J., Pipis, K., Poujol, G., Sarkissian, A., Thom, C., Tournois, G., and Tzanos, D.: Accuracy assessment of water vapour measurements from in situ and remote sensing techniques during the DEMEVAP 2011 campaign at OHP, Atmos. Meas. Tech., 6, 2777–2802, https://doi.org/10.5194/amt-6-2777-2013, 2013. a, b
Bock, O., Bosser, P., Pacione, R., Nuret, M., Fourrié, N., and Parracho, A.: A high-quality reprocessed ground-based GPS dataset for atmospheric process studies, radiosonde and model evaluation, and reanalysis of HyMeX Special Observing Period, Q. J. Roy. Meteor. Soc., 142, 56–71, https://doi.org/10.1002/qj.2701, 2016. a
Bock, O., Bosser, P., Flamant, C., Doerflinger, E., Jansen, F., Fages, R., Bony, S., and Schnitt, S.: IWV observations in the Caribbean Arc from a network of ground-based GNSS receivers during EUREC4A, Earth Syst. Sci. Data Discuss. [preprint], https://doi.org/10.5194/essd-2021-50, in review, 2021. a, b, c, d, e
Boehm, J., Niell, A. E., Tregoning, P., and Schuh, H.: The Global Mapping Function (GMF) : A new empirical mapping function based on numerical weather model data, Geophys. Res. Lett., 33, L07304, https://doi.org/10.1029/2005GL025546, 2006. a
Boniface, K., C., C., Chery, J., Ducrocq, V., Rocken, C., Doerflinger, E., and Collard, P.: Potential of shipborne GPS atmospheric delay data for prediction of Mediterranean intense weather events, Atmos. Sci. Lett., 13, 250–256, https://doi.org/10.1002/asl.391, 2012. a
Bony, S., Stevens, B., Ament, F., Bigorre, S., Chazette, P., Crewell, S., Delanoë, J., Emanuel, K., Farrell, D., Flamant, C., Gross, S., Hirsch, L., Karstensen, J., Mayer, B., Nuijens, L., Ruppert, J. H., Sandu, I., Siebesma, P., Speich, S., Szczap, F., Totems, J., Vogel, R., Wendisch, M., and Wirth, M.: EUREC4A: A Field Campaign to Elucidate the Couplings Between Clouds, Convection and Circulation, Surv. Geophys., 38, 1529–1568, https://doi.org/10.1007/s10712-017-9428-0, 2017. a
Bosser, P. and Bock, O.: IWV retrieval from ground GNSS receivers during NAWDEX, Adv. Geosci., 55, 13–22, https://doi.org/10.5194/adgeo-55-13-2021, 2021. a
Bosser, P., Bock, O., Pelon, J., and Thom, C.: An improved mean gravity model for GPS hydrostatic delay calibration, Geosci. Remote Sens. Lett., 4, 3–7, https://doi.org/10.1109/LGRS.2006.881725, 2007. a
Bosser, P., Bock, O., Thom, C., Pelon, J., and Willis, P.: A case study of using Raman lidar measurements in high-accuracy GPS applications, J. Geodesy, 84, 251–265, https://doi.org/10.1007/s00190-009-0362-x, 2010. a
Bosser, P., Bock, O., and Flamant, C.: IWV from shipborne GNSS antenna on R/V Atalante during EUREC4A campaign, AERIS data center, https://doi.org/10.25326/71, 2020a. a, b
Bosser, P., Bock, O., and Flamant, C.: IWV from shipborne GNSS antenna on R/V Maria S. Merian during EUREC4A campaign, AERIS data center, https://doi.org/10.25326/72, 2020b. a, b
Bosser, P., Bock, O., and Flamant, C.: IWV from shipborne GNSS antenna on R/V Meteor during EUREC4A campaign, AERIS data center, https://doi.org/10.25326/73, 2020c. a, b
Bosser, P., Bock, O., and Flamant, C.: Raw GNSS data from shipborne GNSS antenna on R/V Atalante during EUREC4A campaign, AERIS data center, https://doi.org/10.25326/74, 2020d. a, b
Bosser, P., Bock, O., and Flamant, C.: Raw GNSS data from shipborne GNSS antenna on R/V Maria S. Merian during EUREC4A campaign, AERIS data center, https://doi.org/10.25326/75, 2020e. a, b
Bosser, P., Bock, O., and Flamant, C.: Raw GNSS data from shipborne GNSS antenna on R/V Meteor during EUREC4A campaign, AERIS data center, https://doi.org/10.25326/76, 2020f. a, b
Bouin, M.-N., Ballu, V., Calmant, S., Boré, J.-M., Folcher, E., and Ammann, J.: A kinematic GPS methodology for sea surface mapping, Vanuatu, J. Geodesy, 83, 1203, https://doi.org/10.1007/s00190-009-0338-x, 2009. a
Copernicus Climate Change Service (C3S): Fifth generation of ECMWF atmospheric reanalyses of the global climate, Copernicus Climate Change Service Climate Data Store (CDS), available at: https://cds.climate.copernicus.eu/cdsapp#!/home (last access: 20 September 2020), 2017. a
Estey, L. and Meertens, C.: TEQC: The Multi-Purpose Toolkit for GPS/GLONASS Data, GPS Solutions, 3, 42–49, https://doi.org/10.1007/PL00012778, 1999. a, b
Ferrare, R. A., Brasseur, L., Turner, D. D., Tooman, T., Remer, L., and Gao, B.: Evaluation of Terra MODIS Aerosol and Water Vapor Measurements Using ARM SGP Data AMS 11th Conference on Atmospheric Radiation, 2001, A31B-062002, 2002. a
Fourrié, N., Nuret, M., Brousseau, P., Caumont, O., Doerenbecher, A., Wattrelot, E., Moll, P., Bénichou, H., Puech, D., Bock, O., Bosser, P., Chazette, P., Flamant, C., Di Girolamo, P., Richard, E., and Saïd, F.: The AROME-WMED reanalyses of the first special observation period of the Hydrological cycle in the Mediterranean experiment (HyMeX), Geosci. Model Dev., 12, 2657–2678, https://doi.org/10.5194/gmd-12-2657-2019, 2019. a
Fujita, M., Wada, A., Iwabuchi, T., and Rocken, C.: Tropospheric monitoring over the ocean using a shipborne GNSS receiver, Proceedings of the 27th International Technical Meeting of The Satellite Division of the Institute of Navigation (ION GNSS+ 2014), 1085–1089, 2014. a
Guerova, G., Jones, J., Douša, J., Dick, G., de Haan, S., Pottiaux, E., Bock, O., Pacione, R., Elgered, G., Vedel, H., and Bender, M.: Review of the state of the art and future prospects of the ground-based GNSS meteorology in Europe, Atmos. Meas. Tech., 9, 5385–5406, https://doi.org/10.5194/amt-9-5385-2016, 2016. a
Haase, J., Ge, M., Vedel, H., and Calais, E.: Accuracy and Variability of GPS Tropospheric Delay Measurements of Water Vapor in the Western Mediterranean, J. Appl. Meteorol., 42, 1547–1568, https://doi.org/10.1175/1520-0450(2003)042, 2003. a, b
Hadad, D., Baray, J.-L., Montoux, N., Van Baelen, J., Fréville, P., Pichon, J.-M., Bosser, P., Ramonet, M., Yver Kwok, C., Bègue, N., and Duflot, V.: Surface and Tropospheric Water Vapor Variability and Decadal Trends at Two Supersites of CO-PDD (Cézeaux and Puy de Dôme) in Central France, Atmosphere-Basel, 9, 302, https://doi.org/10.3390/atmos9080302, 2018. a
Hersbach, H., Bell, B., Berrisford, P., Hirahara, S., Horányi, A., Muñoz-Sabater, J., Nicolas, J., Peubey, C., Radu, R., Schepers, D., Simmons, A., Soci, C., Abdalla, S., Abellan, X., Balsamo, G., Bechtold, P., Biavati, G., Bidlot, J., Bonavita, M., De Chiara, G., Dahlgren, P., Dee, D., Diamantakis, M., Dragani, R., Flemming, J., Forbes, R., Fuentes, M., Geer, A., Haimberger, L., Healy, S., Hogan, R. J., Hólm, E., Janisková, M., Keeley, S., Laloyaux, P., Lopez, P., Lupu, C., Radnoti, G., de Rosnay, P., Rozum, I., Vamborg, F., Villaume, S., and Thépaut, J.-N.: The ERA5 global reanalysis, Q. J. Roy. Meteor. Soc., 146, 1999–2049, https://doi.org/10.1002/qj.3803, 2020. a, b, c
King, M. D., Menzel, W. P., Kaufman, Y. J., Tanre, D., Gao, B.-C., Platnick, S., Ackerman, S. A., Remer, L. A., Pincus, R., and Hubanks, P. A.: Cloud and aerosol properties, precipitable water, and profiles of temperature and water vapor from MODIS, IEEE T. Geosci. Remote, 41, 442–458, 2003. a
Liu, H., Tang, S., Zhang, S., and Hu, J.: Evaluation of MODIS water vapour products over China using radiosonde data, Int. J. Remote Sens., 36, 680–690, https://doi.org/10.1080/01431161.2014.999884, 2015. a
Liu, Y., Liu, Y., Chen, G., and Wu, Z.: Evaluation of HY-2A satellite-borne water vapor radiometer with shipborne GPS and GLONASS observations over the Indian Ocean, GPS Solutions, 23, 23–87, https://doi.org/10.1007/s10291-019-0876-5, 2019. a
Lyard, F. H., Carrère, L., Cancet, M., Boy, J.-P., Gégout, P., and Lemoine, J.-M.: The FES2014 tidal atlas, accuracy assessment for satellite altimetry and other geophysical applications, in: EGU General Assembly 2016, Vienna, Austria, EPSC2016-17693, 2016. a
Nilson, T., Boehm, J., Wijaya, D. D., Tresch, A., Nafisi, V., and Schuh, H.: Path Delay in the Neutral Atmosphere, in: Atmospheric Effects in Space Geodesy, edited by: Boehm, J. and Schuh, H., Springer, Berlin, Heidelberg, 73–136, https://doi.org/10.1007/978-3-642-36932-2_3, 2013. a
Ning, T., Wang, J., Elgered, G., Dick, G., Wickert, J., Bradke, M., Sommer, M., Querel, R., and Smale, D.: The uncertainty of the atmospheric integrated water vapour estimated from GNSS observations, Atmos. Meas. Tech., 9, 79–92, https://doi.org/10.5194/amt-9-79-2016, 2016. a
Pavlis, N. K., Holmes, S. A., Kenyon, S. C., and Factor, J. K.: The development and evaluation of the Earth Gravitational Model 2008 (EGM2008), J. Geophys. Res., 117, B04406, https://doi.org/10.1029/2011JB008916, 2012. a
Petit, G. and Luzum, B.: IERS 2010 Conventions, Tech. rep., IERS, Frankfurt-am-Main, Germany, 2010. a
Poli, P., Moll, P., Rabier, F., Desroziers, G., Chapnik, B., Berre, L., Healy, S. B., Andersson, E., and El Guelai, F.-Z.: Forecast impact studies of zenith total delay data from European near real-time GPS stations in Météo-France 4DVAR, J. Geophys. Res., 112, D06114, https://doi.org/10.1029/2006JD007430, 2007. a
Pujol, M.-I., Schaeffer, P., Faugère, Y., Raynal, M., Dibarboure, G., and Picot, N.: Gauging the Improvement of Recent Mean Sea Surface Models: A New Approach for Identifying and Quantifying Their Errors, J. Geophys. Res.-Oceans, 123, 5889–5911, https://doi.org/10.1029/2017JC013503, 2018. a
Saastamoinen, J.: Atmospheric correction for the troposphere and stratosphere in radio ranging of satellites, in: The use of artificial Satellites for geodesy, Geophysical Monograph, 15, 247–251, AGU, USA, 1972. a
Shoji, Y., Sato, K., Yabuki, M., and Tsuda, T.: Comparison of shipborne GNSS-derived precipitable water vapor with radiosonde in the western North Pacific and in the seas adjacent to Japan, Earth, 69, 153, https://doi.org/10.1186/s40623-017-0740-1, 2017. a
Steigenberger, P., Boehm, J., and Tesmer, V.: Comparison of GMF/GPT with VMF1/ECMWF and implications for atmospheric loading, J. Geodesy, 83, 943–951, https://doi.org/10.1007/s00190-009-0311-8, 2009. a
Stevends, B., Farell, D., Hirsch, L., Jansen, F., Nuijens, L., Serikov, I., Brügmann, B., Forde, M., Linne, H., Lonitz, K., and Prospero, J. M.: The Barbados Cloud Observatory: Anchoring Investigations of Clouds and Circulation on the Edge of the ITCZ, B. Am. Meteorol. Soc., 97, 787–801, https://doi.org/10.1175/bams-d-14-00247.1, 2016. a
Stevens, B., Bony, S., Farrell, D., Ament, F., Blyth, A., Fairall, C., Karstensen, J., Quinn, P. K., Speich, S., Acquistapace, C., Aemisegger, F., Albright, A. L., Bellenger, H., Bodenschatz, E., Caesar, K.-A., Chewitt-Lucas, R., de Boer, G., Delanoë, J., Denby, L., Ewald, F., Fildier, B., Forde, M., George, G., Gross, S., Hagen, M., Hausold, A., Heywood, K. J., Hirsch, L., Jacob, M., Jansen, F., Kinne, S., Klocke, D., Kölling, T., Konow, H., Lothon, M., Mohr, W., Naumann, A. K., Nuijens, L., Olivier, L., Pincus, R., Pöhlker, M., Reverdin, G., Roberts, G., Schnitt, S., Schulz, H., Siebesma, A. P., Stephan, C. C., Sullivan, P., Touzé-Peiffer, L., Vial, J., Vogel, R., Zuidema, P., Alexander, N., Alves, L., Arixi, S., Asmath, H., Bagheri, G., Baier, K., Bailey, A., Baranowski, D., Baron, A., Barrau, S., Barrett, P. A., Batier, F., Behrendt, A., Bendinger, A., Beucher, F., Bigorre, S., Blades, E., Blossey, P., Bock, O., Böing, S., Bosser, P., Bourras, D., Bouruet-Aubertot, P., Bower, K., Branellec, P., Branger, H., Brennek, M., Brewer, A., Brilouet, P.-E., Brügmann, B., Buehler, S. A., Burke, E., Burton, R., Calmer, R., Canonici, J.-C., Carton, X., Cato Jr., G., Charles, J. A., Chazette, P., Chen, Y., Chilinski, M. T., Choularton, T., Chuang, P., Clarke, S., Coe, H., Cornet, C., Coutris, P., Couvreux, F., Crewell, S., Cronin, T., Cui, Z., Cuypers, Y., Daley, A., Damerell, G. M., Dauhut, T., Deneke, H., Desbios, J.-P., Dörner, S., Donner, S., Douet, V., Drushka, K., Dütsch, M., Ehrlich, A., Emanuel, K., Emmanouilidis, A., Etienne, J.-C., Etienne-Leblanc, S., Faure, G., Feingold, G., Ferrero, L., Fix, A., Flamant, C., Flatau, P. J., Foltz, G. R., Forster, L., Furtuna, I., Gadian, A., Galewsky, J., Gallagher, M., Gallimore, P., Gaston, C., Gentemann, C., Geyskens, N., Giez, A., Gollop, J., Gouirand, I., Gourbeyre, C., de Graaf, D., de Groot, G. E., Grosz, R., Güttler, J., Gutleben, M., Hall, K., Harris, G., Helfer, K. C., Henze, D., Herbert, C., Holanda, B., Ibanez-Landeta, A., Intrieri, J., Iyer, S., Julien, F., Kalesse, H., Kazil, J., Kellman, A., Kidane, A. T., Kirchner, U., Klingebiel, M., Körner, M., Kremper, L. A., Kretzschmar, J., Krüger, O., Kumala, W., Kurz, A., L'Hégaret, P., Labaste, M., Lachlan-Cope, T., Laing, A., Landschützer, P., Lang, T., Lange, D., Lange, I., Laplace, C., Lavik, G., Laxenaire, R., Le Bihan, C., Leandro, M., Lefevre, N., Lena, M., Lenschow, D., Li, Q., Lloyd, G., Los, S., Losi, N., Lovell, O., Luneau, C., Makuch, P., Malinowski, S., Manta, G., Marinou, E., Marsden, N., Masson, S., Maury, N., Mayer, B., Mayers-Als, M., Mazel, C., McGeary, W., McWilliams, J. C., Mech, M., Mehlmann, M., Meroni, A. N., Mieslinger, T., Minikin, A., Minnett, P., Möller, G., Morfa Avalos, Y., Muller, C., Musat, I., Napoli, A., Neuberger, A., Noisel, C., Noone, D., Nordsiek, F., Nowak, J. L., Oswald, L., Parker, D. J., Peck, C., Person, R., Philippi, M., Plueddemann, A., Pöhlker, C., Pörtge, V., Pöschl, U., Pologne, L., Posyniak, M., Prange, M., Quiñones Meléndez, E., Radtke, J., Ramage, K., Reimann, J., Renault, L., Reus, K., Reyes, A., Ribbe, J., Ringel, M., Ritschel, M., Rocha, C. B., Rochetin, N., Röttenbacher, J., Rollo, C., Royer, H., Sadoulet, P., Saffin, L., Sandiford, S., Sandu, I., Schäfer, M., Schemann, V., Schirmacher, I., Schlenczek, O., Schmidt, J., Schröder, M., Schwarzenboeck, A., Sealy, A., Senff, C. J., Serikov, I., Shohan, S., Siddle, E., Smirnov, A., Späth, F., Spooner, B., Stolla, M. K., Szkółka, W., de Szoeke, S. P., Tarot, S., Tetoni, E., Thompson, E., Thomson, J., Tomassini, L., Totems, J., Ubele, A. A., Villiger, L., von Arx, J., Wagner, T., Walther, A., Webber, B., Wendisch, M., Whitehall, S., Wiltshire, A., Wing, A. A., Wirth, M., Wiskandt, J., Wolf, K., Worbes, L., Wright, E., Wulfmeyer, V., Young, S., Zhang, C., Zhang, D., Ziemen, F., Zinner, T., and Zöger, M.: EUREC4A, Earth Syst. Sci. Data Discuss. [preprint], https://doi.org/10.5194/essd-2021-18, in review, 2021. a
Wang, J., Wu, Z., Semmling, M., Zus, F., Gerland, S., Ramatschi, M., Ge, M., Wickert, J., and Schuh, H.: Retrieving Precipitable Water Vapor From Shipborne Multi-GNSS Observations, Geophys. Res. Lett., 46, https://doi.org/10.1029/2019GL082136, 2019. a, b
Zumberge, J. F., Heflin, M. B., Jefferson, D. C., and Watkins, M. M.: Precise point positioning for the efficient and robust analysis of GPS data from large networks, J. Geophys. Res., 102, 5005–5017, 1997. a