the Creative Commons Attribution 4.0 License.
the Creative Commons Attribution 4.0 License.
 | 29 Mar 2021
Diets of the Barents Sea cod (Gadus morhua) from the 1930s to 2018
Bryony L. Townhill
Rebecca E. Holt
Bjarte Bogstad
Joël M. Durant
John K. Pinnegar
Andrey V. Dolgov
Natalia A. Yaragina
Edda Johannesen
Geir Ottersen
A new dataset on the diet of Atlantic cod in the Barents Sea from the 1930s to the present day has been compiled to produce one of the largest fish diet datasets available globally. Atlantic cod is one of the most ecologically and commercially important fish species in the North Atlantic. The stock in the Barents Sea is by far the largest, as a result of both successful management and favourable environmental conditions since the early 2000s. As a top predator, cod plays a key role in the Barents Sea ecosystem. The species has a broad diet consisting mainly of crustaceans and teleost fish, and both the amount and type of prey vary in space and time. The data – from Russia, Norway and the United Kingdom – represent quantitative stomach content records from more than 400 000 fish and qualitative data from 2.5 million fish. Many of the data are from joint collaborative surveys between Norway and Russia. The sampling was conducted throughout each year, allowing for seasonal, annual and decadal comparisons to be made. Visual analysis shows cod diets have changed considerably from the start of the dataset in the 1930s to the present day. There was a large proportion of herring in the diets in the 1930s, whereas in more recent decades capelin, invertebrates and other fish dominate. There are also significant interannual asynchronous fluctuations in prey, particularly capelin and euphausiids. Combining these datasets can help us understand how the environment and ecosystems are responding to climatic changes, and what influences the diet and prey switching of cod. Trends in temperature and variability indices can be tested against the occurrence of different prey items, and the effects of fishing pressure on cod and prey stocks on diet composition could be investigated. The dataset will also enable us to improve parametrization of food web models and to forecast how Barents Sea fisheries may respond in the future to management and to climate change. The Russian data are available through joint projects with the Polar Branch of the Russian Federal Research Institute of Fisheries and Oceanography (VNIRO). The UK and Norwegian data (Townhill et al., 2020) are being released with this paper at https://doi.org/10.21335/NMDC-2139169383.
- Article
(3783 KB) - Full-text XML
-
Supplement
(2949 KB) - BibTeX
- EndNote


Here we document a new extensive dataset on the stomach content of Atlantic cod (Gadus morhua) in the Barents Sea. We have compiled the dataset by joining historical data from the UK (1930–1964) with historical data from the Soviet Union/Russia (1947–1983) and more recent (1984–2018) data from a large existing joint Norwegian–Russian cod stomach content database. The resulting dataset spans the period from 1930 until present day.
Comprehensive information on the predation dynamics of ecologically important species, based upon the analysis of individual stomach contents, is vital for an understanding of how the biological components in an ecosystem are connected (Hyslop, 1980; Holt et al., 2019). Such data can provide detailed knowledge on the diet of a species in an area at a particular time. When conducted over long temporal scales and across size classes, spatially high-resolution stomach content data can provide data that are key to understanding trophic interactions in marine ecosystems.
Unfortunately, long-term high-quality fish population diet data with good spatio-temporal coverage are rare, as the effort and resources required to collect and analyse stomach contents at this scale are considerable. However, due mainly to the stock's commercial importance, Russia, Norway and the UK have invested considerable resources in sampling, working up and sustaining stomach contents data for the Barents Sea (or northeast Arctic) cod. Diet data are valuable in elucidating trophic interactions – and particularly important in areas where multiple species are caught. For example, diet data allow predation mortality to be included in stock assessments (ICES, 2019) and help in understanding inter-specific interactions between predators (Durant et al., 2014).
To support the cod fishery in the Barents Sea, the UK carried out surveys from the 1930s, mainly collecting catch and length data but also recording stomach contents. They collected content data from a few hundred to 3500 stomachs each year, ending in the 1960s. The Norwegian–Russian data originate from a joint research project on the diet and food consumption of Barents Sea fish, with cod as the main study species, initiated in the mid-1980s. This was a joint endeavour between IMR (Institute of Marine Research, Norway) and PINRO (Knipovich Polar Research Institute of Marine Fisheries and Oceanography, since 2019 named the Polar Branch of the Russian Federal Research Institute of Fisheries and Oceanography (VNIRO); Mehl, 1986; Mehl and Yaragina, 1992; Dolgov et al., 2007, 2011; Yaragina et al., 2009). An average of 8153 stomachs were analysed each year (Holt et al., 2019). In addition, there are also numerous Russian cod diet data that were collected from the 1930s–1980s, (Dolgov et al., 2007; Yaragina and Dolgov, 2011), which are described here and summarized in the Supplement. These could not be made available in the main dataset published with this paper but are available under joint research projects.
Atlantic cod is one of the most ecologically and commercially important fish species in the North Atlantic, and the Barents Sea stock is by far the largest. As opposed to many other cod stocks and other fish worldwide, the Barents Sea cod are doing well, a result of both successful management and favourable environmental conditions since the early 2000s (Kjesbu et al., 2014; Ottersen et al., 2014; Fossheim et al., 2015). Cod plays a key role in the Barents Sea ecosystem and is the dominating top predator. While cod has a broad diet consisting mainly of crustaceans and teleost fish, the amount and kind of prey actually available vary in space and time as well as by cod size (Zatsepin and Petrova, 1939; Yaragina et al., 2009; Johannesen et al., 2012, 2015; Holt et al., 2019).
For Atlantic cod, being arguably one of the most important fish on the planet, such diet data exist in several seas: e.g. in the Baltic (Neuenfeldt and Beyer, 2006); on Georges Bank (Tsou and Collie, 2001); in the Gulf of Maine, US (Willis et al., 2013); in Icelandic waters (Pálsson and Björnsson, 2011); and in the northeast US shelf ecosystem (Link and Garrison, 2002). A comparison of Atlantic cod diet and the role of cod in the various ecosystems was made by Link et al. (2009). Data on the diet of other northeast Atlantic species have been recently released, allowing analysis of herring, blue whiting, mackerel, albacore and bluefin tuna diets (Pinnegar et al., 2015). The time series of these pelagic species begin in the 1860s and combine data from France, Norway, Iceland, Ireland and the UK. Here, we compile a similar dataset of Barents Sea cod diet data, from Norway, Russia and the UK.
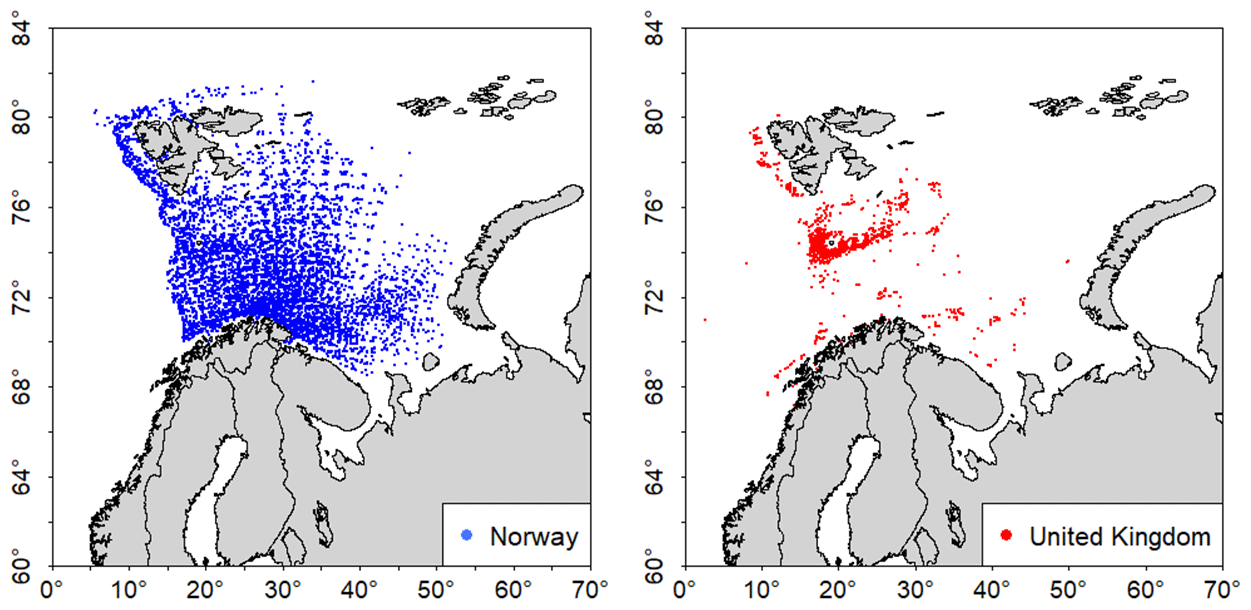
Figure 1The location of the cod stomach samples taken in the Barents Sea by each country.
2.1 UK Barents Sea surveys
A UK fishery began in the Barents Sea in 1905, with increased exploitation from 1929. Catches of cod and therefore profits were high, particularly from the 1930s when sea temperatures in the area became warmer (Cushing, 1966), and cod stock sizes increased to historic high levels in the 1930s–1940s (Hylen, 2002). Aimed at investigating the cod fishery and the influence of temperature, which already at the time was known to influence cod distributions, the UK carried out fishery surveys in the Barents Sea from the 1930s to the 1960s, with a break for WWII. The surveys were conducted firstly on board commercial fishing vessels and later with a dedicated Arctic survey vessel, the RV Ernest Holt (Graham, 1953). The surveys collected data on cod abundance, length distributions, temperature, salinity and depth, and samples of cod stomachs were also taken. This was less systematic than for present-day cruises, and so the data are less statistically robust than for the data for the 1980s onwards. The frequency of prey items was recorded rather than the mass of each prey item, and no data on stomach fullness were collected. For the majority of surveys, prey occurrence is recorded for each stomach individually. For some, however, pooled data are provided, for up to 198 stomachs in total. The survey methodology is described in Graham (1953) and summarized in Townhill et al. (2015). On the RV Ernest Holt, a standard otter trawl was used, with and without Vigneron-Dahl gear. Rather than using a statistically designed survey grid, the scientists wanted to find large cod groups, and so vessels searched for high cod catches, operating more like a commercial fishing boat.
DAPSTOM database summary
Under the Centre for Environment, Fisheries and Aquaculture Science (Cefas) project Trawling Through Time (DP332) and the Norwegian–British–Russian research project CoDINA (Cod: Diet and food web dyNAmics), funded by the Research Council of Norway, the data for these surveys were digitized from paper logbooks held by Cefas, and the stomach data are held in the DAPSTOM database (Cefas, 2014; Pinnegar, 2014). The DAPSTOM (Database And Portal for Fish STOMach records diet database), described in Pinnegar (2019), contains 256 354 records from 360 561 stomachs, with the first records from the 1830s. These are from 204 species and 9445 research cruises/sampling campaigns. Twenty-eight per cent of the records are for Atlantic cod, mainly for the seas around the UK but also including these for the Barents Sea.
2.2 The joint Norway–Russia research programme on trophic relationships in the Barents Sea
Russian and Norwegian surveys include cod stomach sampling in their regular procedures, as described in Dolgov et al. (2007, 2011). The joint research programme began in 1987, initially collecting stomach samples of cod and haddock with the objectives of quantitative analysis of demersal fish stomachs, calculating consumption by cod of commercially important prey species and creating the basis for developing Barents Sea multispecies models (Dolgov et al., 2007). Since the surveys began, other species have been included to further understand trophic interactions. The stomach samples are taken on research surveys that use both pelagic and bottom trawls. Up to 10 stomachs are collected for each 10 cm length group at stations which have biological sampling on Norwegian surveys (Mehl and Yaragina, 1992). On Russian commercial vessels and Russian national surveys, 25 stomachs are sampled per trawl. Unlike the historical UK surveys in the Barents Sea, these stomachs are weighed, and the total weight and degree of digestion for each prey item are recorded. For items that can be identified and are intact, lengths are recorded, as well as the total number of identifiable prey in each stomach. Maturity and sex are also recorded, and otoliths read to measure age. Only the Norwegian data are included in the Barents Sea cod dataset, published alongside this paper.
2.3 Barents Sea cod dataset
The UK stomach contents dataset has been merged with the Norway data from 1984 as part of the project CoDINA, to form the Barents Sea cod dataset. As part of the merging process, data underwent a thorough quality control, as described in Holt et al. (2019). A description of each prey category is provided in Supplement 1, and the metadata for the dataset are provided in Supplement 2.
2.3.1 Data summary
The largest number and geographic spread of samples are from Norwegian surveys, with fewer samples from UK surveys (Fig. 1). The data include the area to the west and north of Svalbard (Spitsbergen).
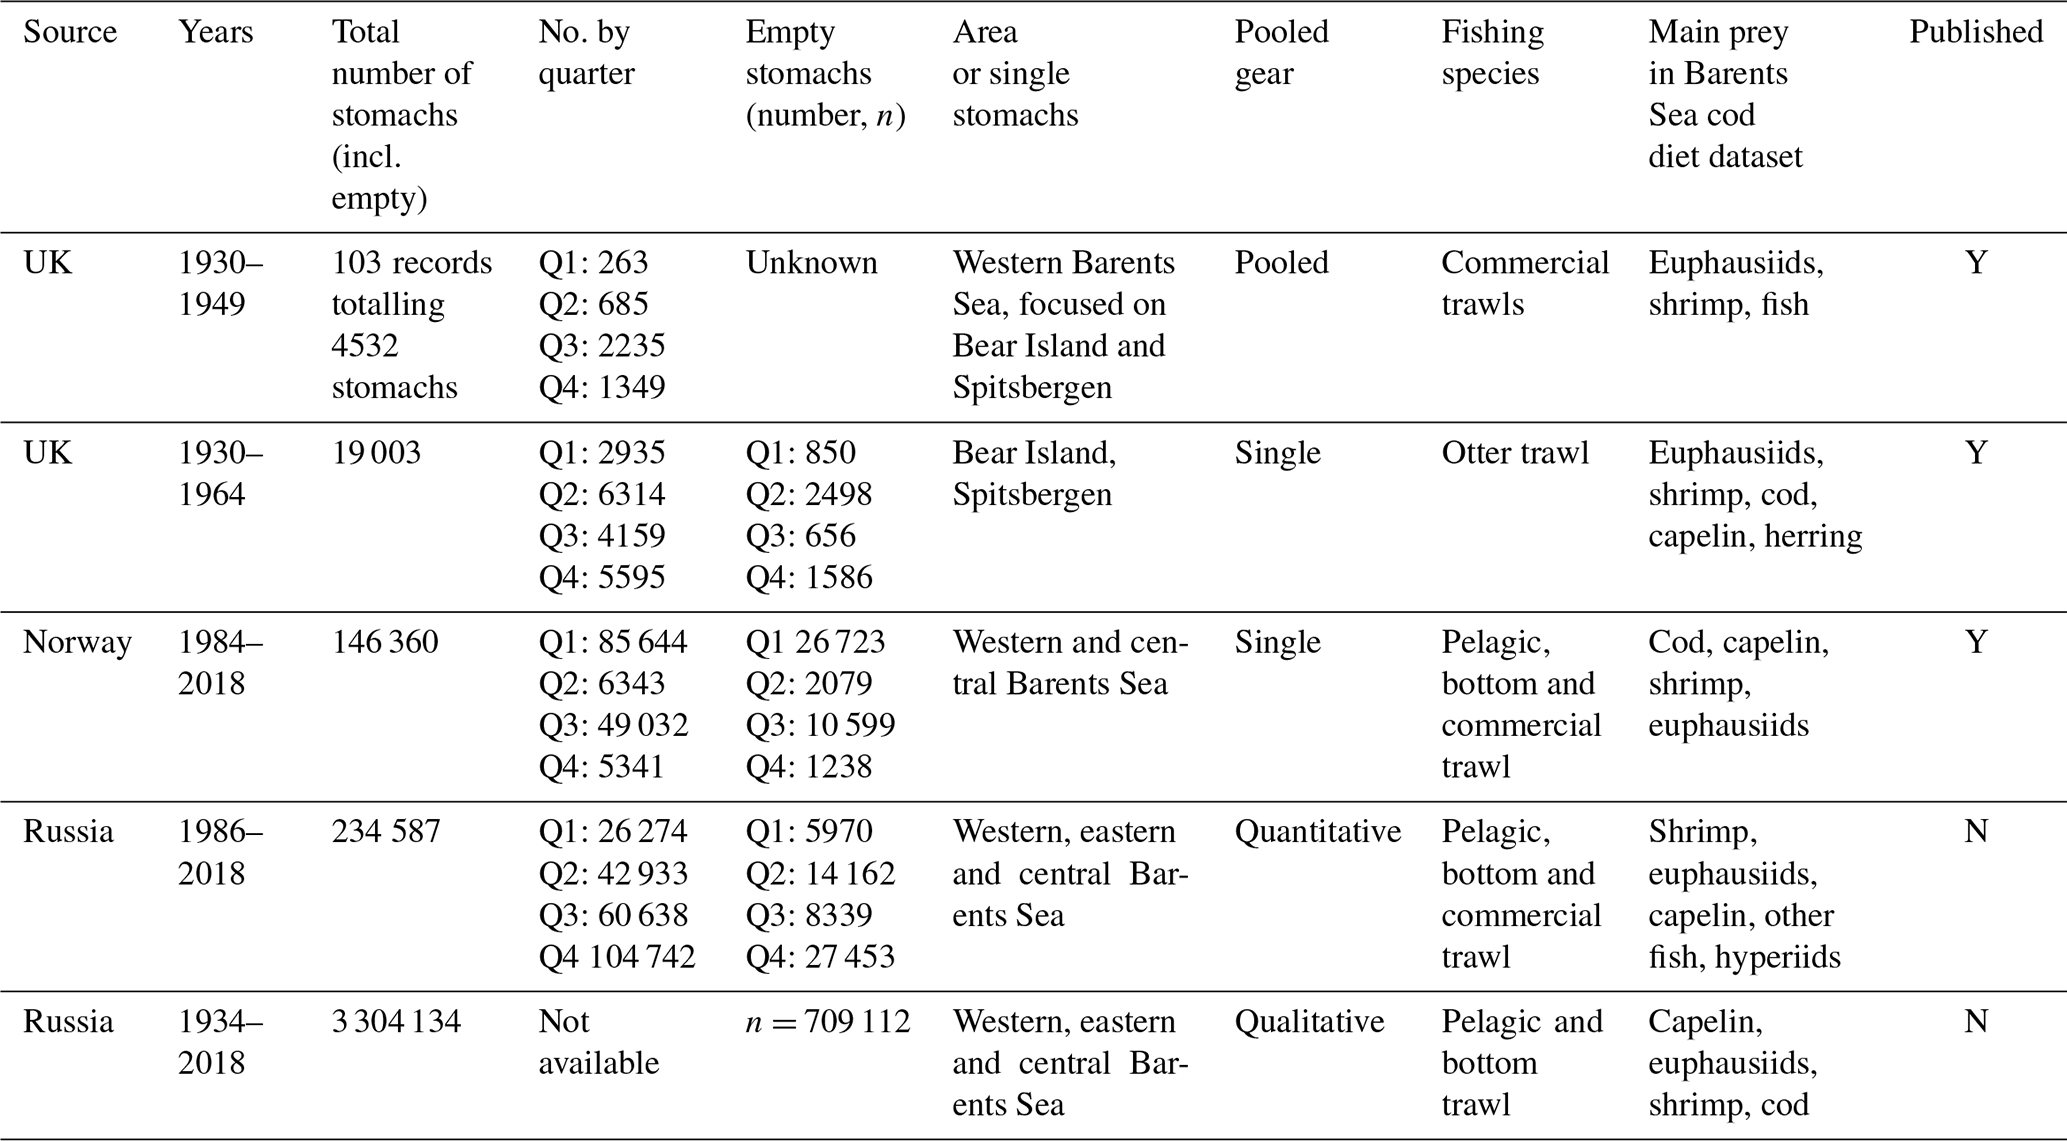
A total of 400 054 individual stomachs are contained in the Barents Sea cod diet dataset (Table 1). These include 102 197 empty stomachs. The numbers sampled in each year vary according to the number of surveys in each year, with no stomach data in some years (Fig. 2). The number of empty stomachs varies each year (Fig. 2). The UK qualitative data in Fig. 2 are the 103 pooled records in the UK dataset, where the contents of more than one stomach are recorded together. Up to 198 stomachs are combined in each of these records.
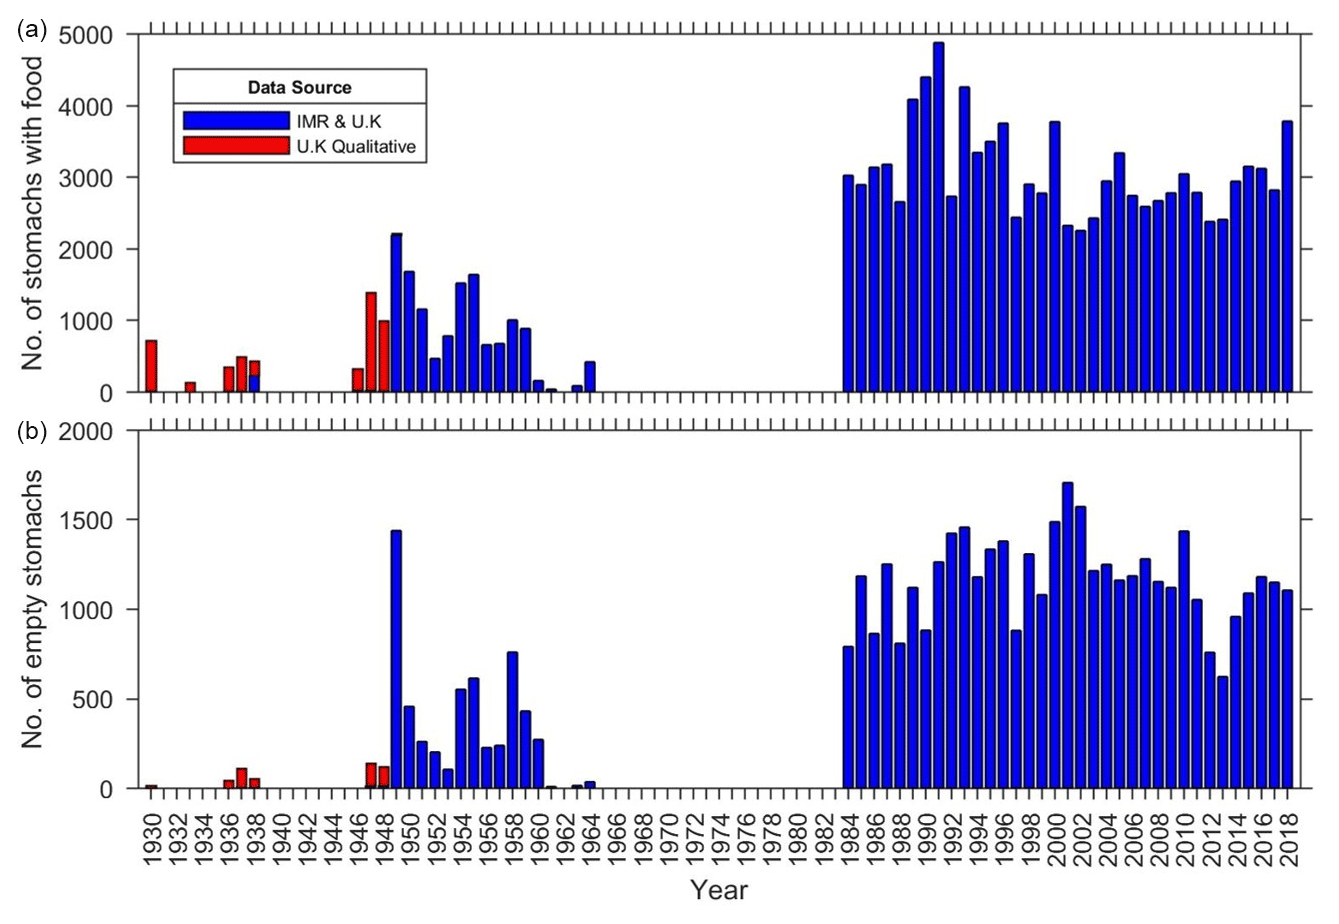
Figure 2Number of stomachs sampled in each year, showing those with food contents (a) and those that were empty (b).
The Barents Sea cod diet dataset contains data from across the Barents Sea, from the north of Norway to Spitsbergen and eastwards to Russia (Fig. 1); however the overall coverage and sampling locations varied each year. The UK surveys in the 1930s and 1940s tended to be in the region south and east of Spitsbergen and around Bear Island. From the 1980s onwards, the Norwegian survey area was further to the eastern Barents Sea (Fig. 3). There are no data in the dataset for the 1970s, as the UK surveys stopped in the 1960s, and the IMR and PINRO joint collection of quantitative data did not begin until the 1980s (Dolgov et al., 2007).
Stomachs have been sampled throughout the year (Fig. 4), allowing for seasonal changes in the diet to be analysed. Sampling is widespread in quarters 1, 3 and 4 but does not go as far north in quarters 1 and 2. This is because there is ice cover preventing the survey vessels from travelling north and east of Spitsbergen during the winter. It is generally more limited in geographical area during quarter 2 as few regular surveys have been carried out in that quarter.
2.3.2 Diet composition
The dataset shows that cod diets do not remain constant, and occurrence of different prey items changes each decade (Fig. 5) and year (Fig. 6). In the 1930s, when there are fewer records, most of the food items are not identified to species, and there is a large proportion of other food and other fish in the diets (Fig. 5). From the 1940s onwards, most of the fish items found in the stomach are identified to species. The data show a large amount of herring in the diet in the 1930s, which is not found again in later decades. In the 1940s and 1950s, there is a high occurrence of euphausiids in the diet, and this decreases to the 2010s. There is a lower occurrence of capelin in the earlier decades, particularly in the 1930s and 1960s, and this increases again to a high proportion of the diet from 1990s onwards. Cod cannibalism is apparent in every decade, with the highest proportion of cod in the diet at > 30 % in 1930s, reduced to 20 % or less thereafter in later years. These figures show how variable the diet compositions are between years and decades. There is a large proportion of herring in the diets in the 1930s, which does not occur again, and in more recent decades capelin, invertebrates and unidentified fish (other fish) dominate.
Looking at the prey occurrence of the main prey items in each year (Fig. 6), there are quite large annual fluctuations, particularly for capelin, cod, euphausiids and shrimp. Haddock, hyperiids, redfish, polar cod and herring have fewer annual spikes. Capelin, cod, euphausiids and shrimp have the highest frequency of occurrence in the earlier part of the time series, to the 1960s. The occurrence is still variable from the 1980s onwards, but to a lesser degree.

Figure 3Extent of the sampling coverage in each decade. Red: year 0, e.g. 1940; dark blue: year 1, e.g. 1941; pink: year 2, e.g. 1942; navy blue: year 3, e.g. 1943; yellow: year 4, e.g. 1944; dark green: year 5, e.g. 1945; purple: year 6, e.g. 1946; pale blue: year 7, e.g. 1947; orange: year 8, e.g. 1948; pale green: year 9, e.g. 1949.
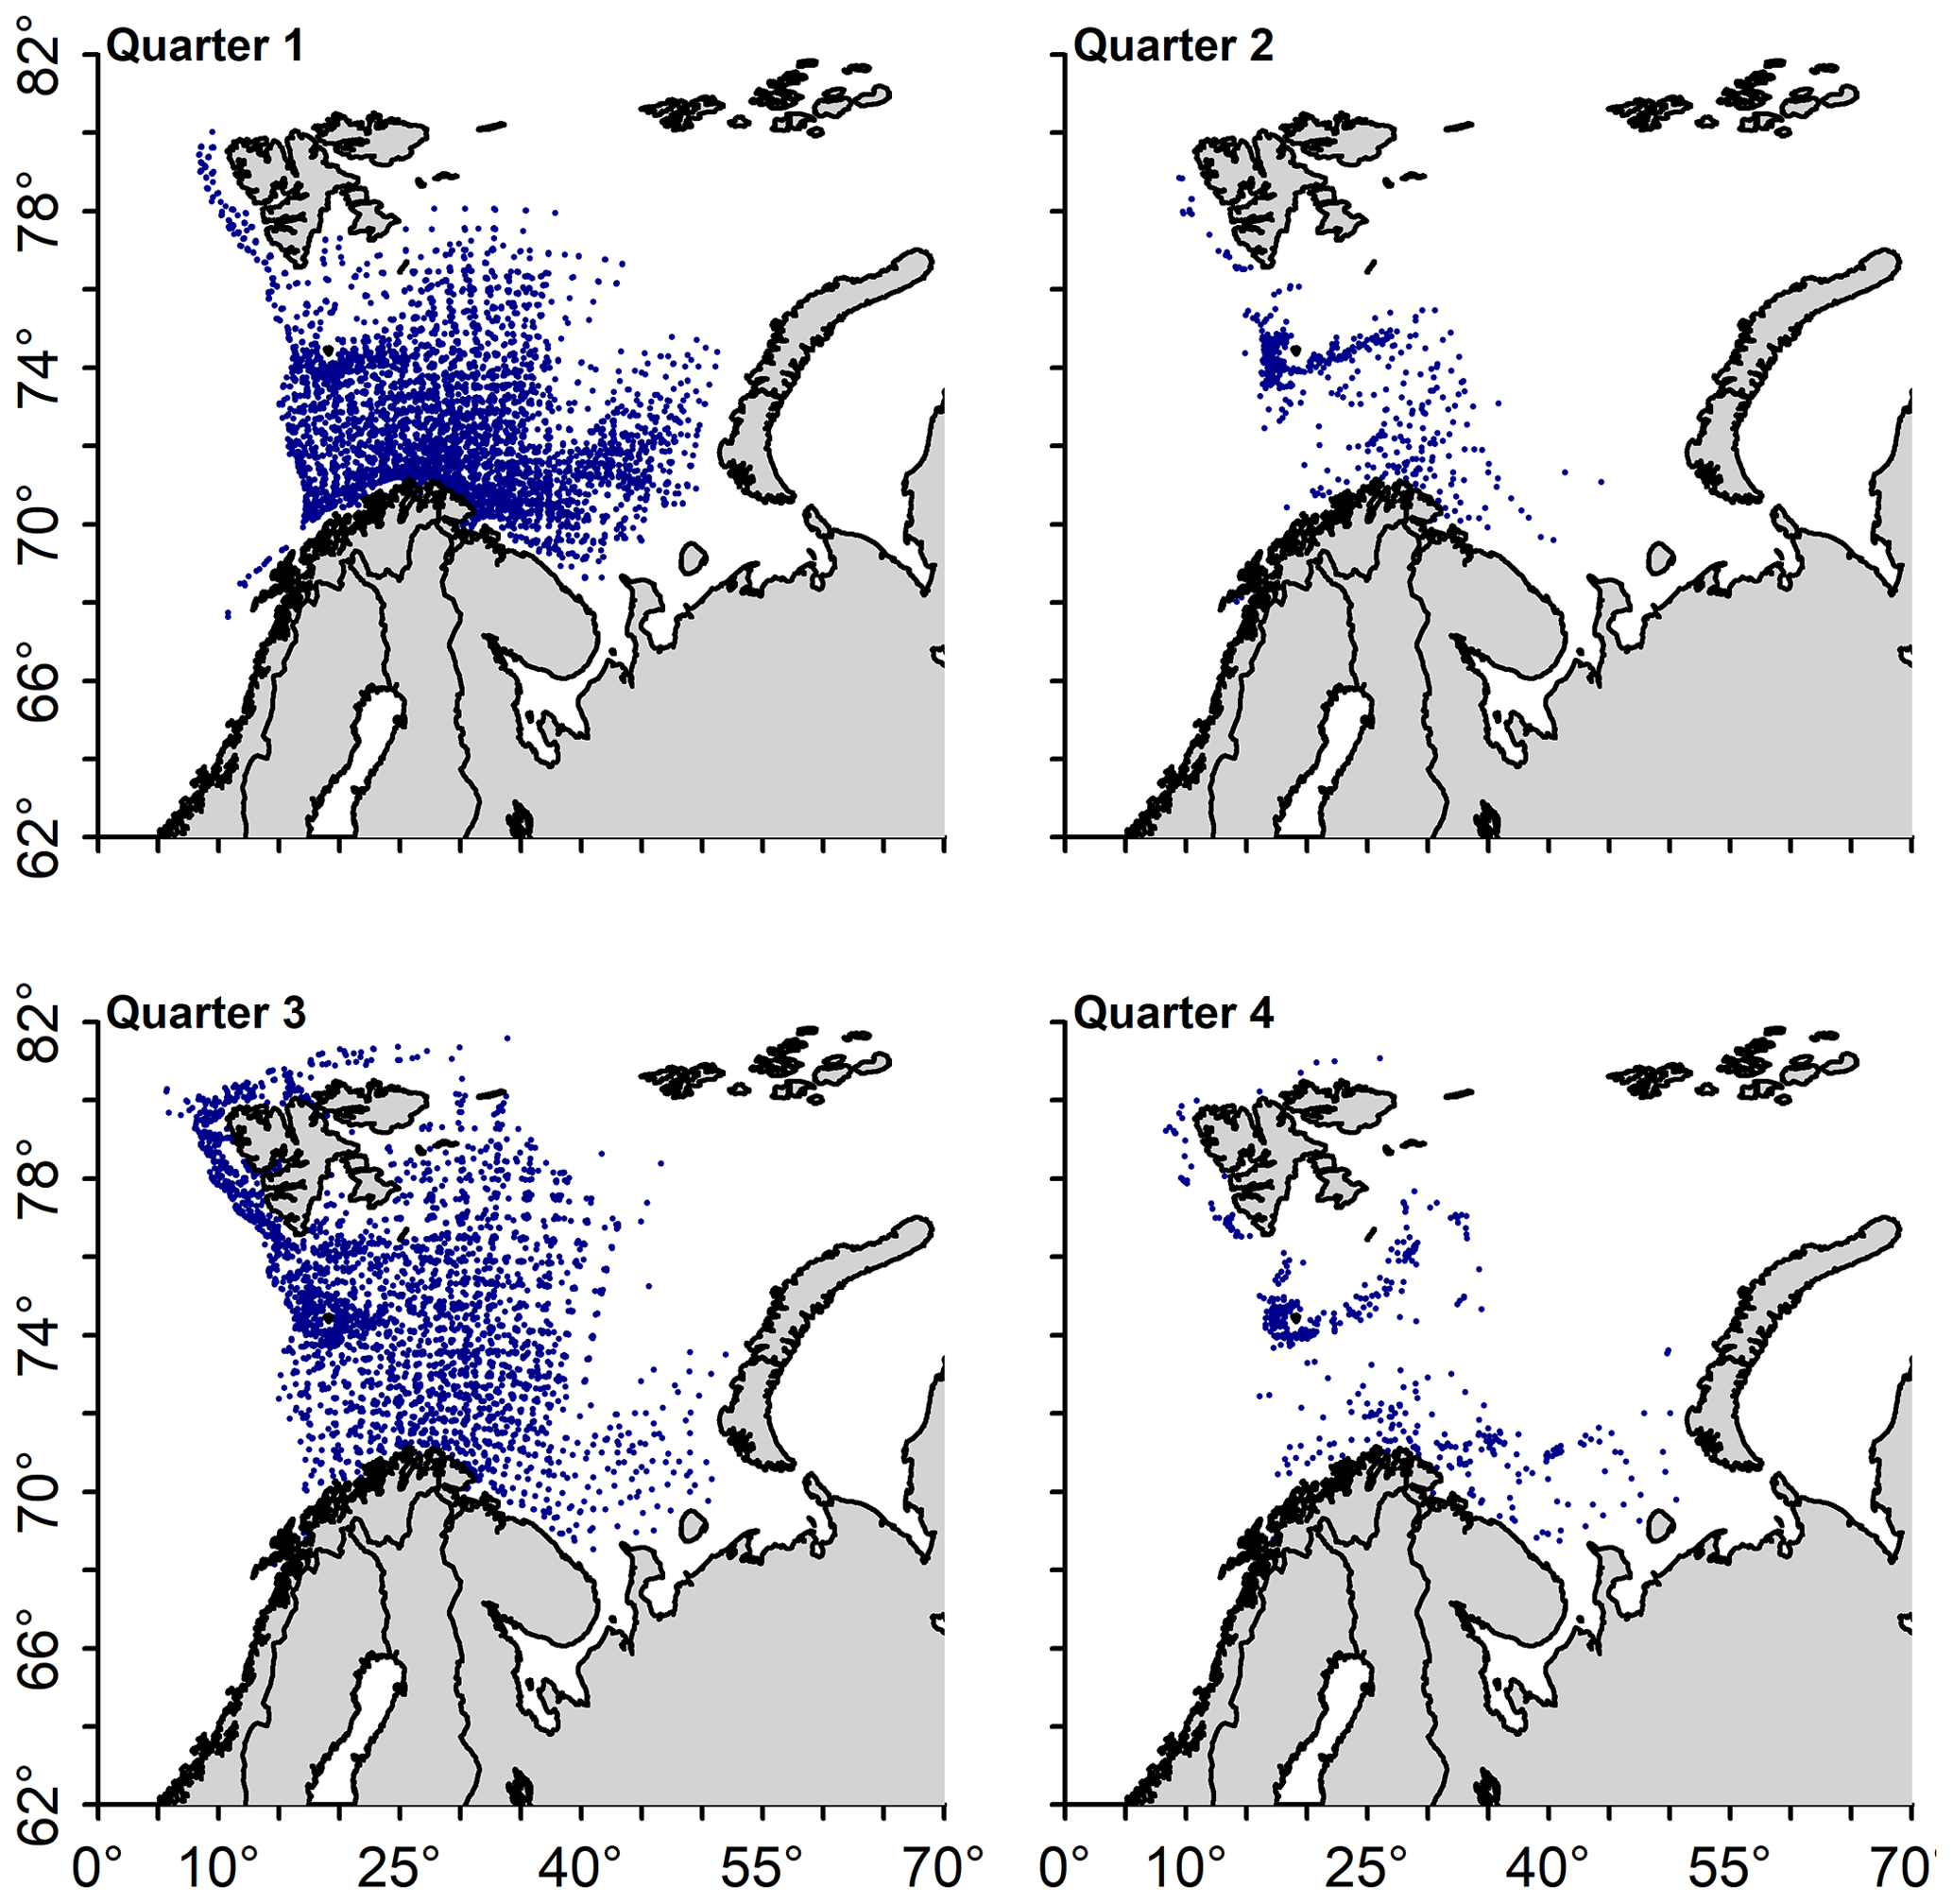
Figure 4Sampling coverage in each quarter over all years combined. Each dot denotes a stomach sample.
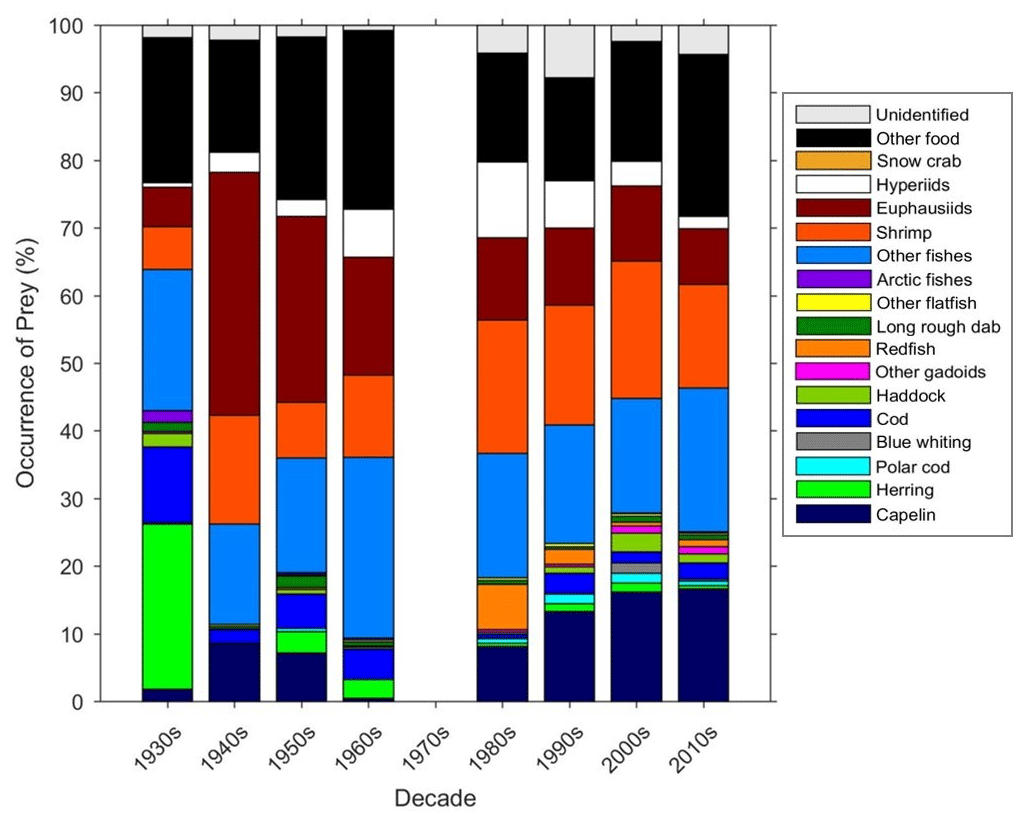
Figure 5The percentage occurrence of prey in each decade. The percentage occurrence of each prey item is calculated based on the total prey items in each decade and excludes empty stomachs.
The four main prey species of cod (cannibalism), capelin, euphausiids and shrimp were caught across the whole geographical area of the surveys (Fig. 7). All of these species are caught up to the northern limits of the surveys, around Spitsbergen and across the Barents Sea.
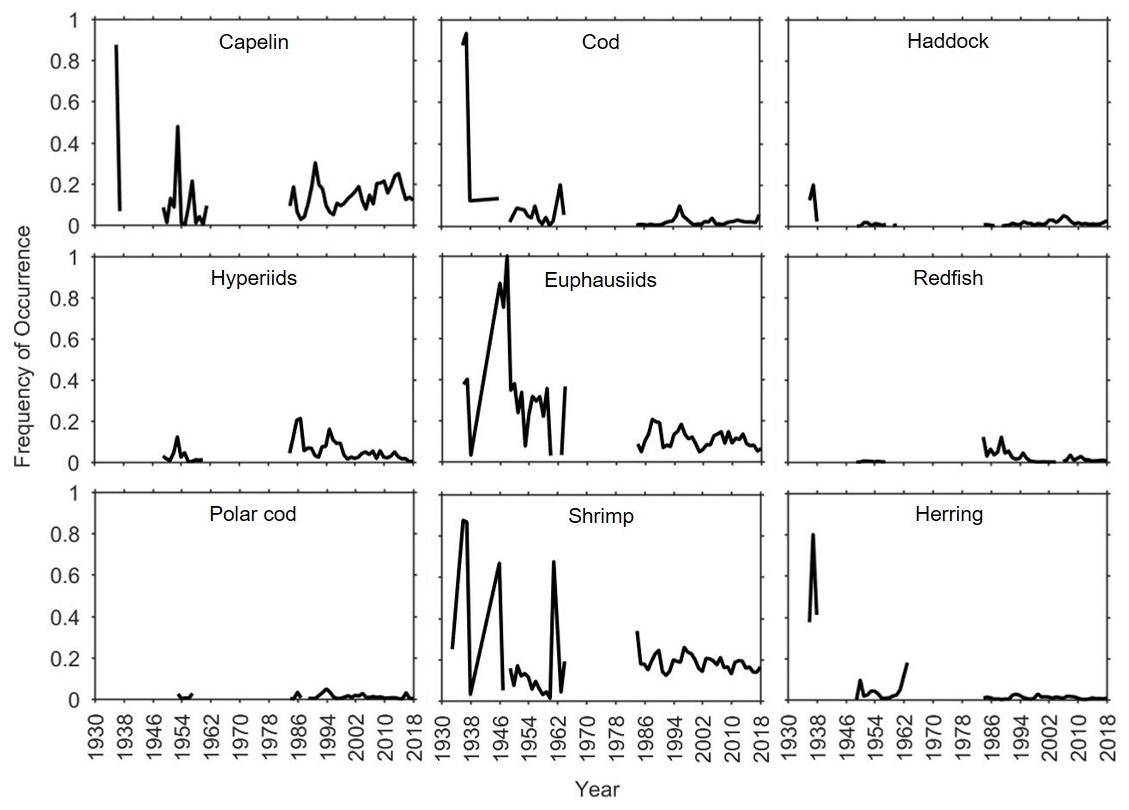
Figure 6Time series of occurrence of the main prey items in the dataset, excluding empty stomachs. The frequency of occurrence of each prey item is calculated based on the total number of stomachs in each year.
2.4 Russian data on cod diet in the Barents Sea
In addition to the joint Norway–Russia research programme, since 1947, a Russian sampling programme has collected observations on cod diet in the Barents Sea throughout the year from commercial and research vessels. During sampling, the degree of stomach fullness was recorded using a five-division scale, ranging from zero (empty stomach) to four (stomach expanded and unfolded by food), as well as the presence of different prey items (capelin, juvenile cod, redfish, herring, shrimp, euphausiids and other) in the stomach. This qualitative method, named “field feeding analysis”, was widely used in Russian investigations of different fish species including cod (see references in Dolgov et al., 2007, and Yaragina and Dolgov, 2011). From 9000 to 45 000 cod stomachs were analysed each year during 1947–1979. As yet, the qualitative Russian stomach samples for the years 1947–1983 are not fully digitized, and so only the digitized data are presented in the Supplement.
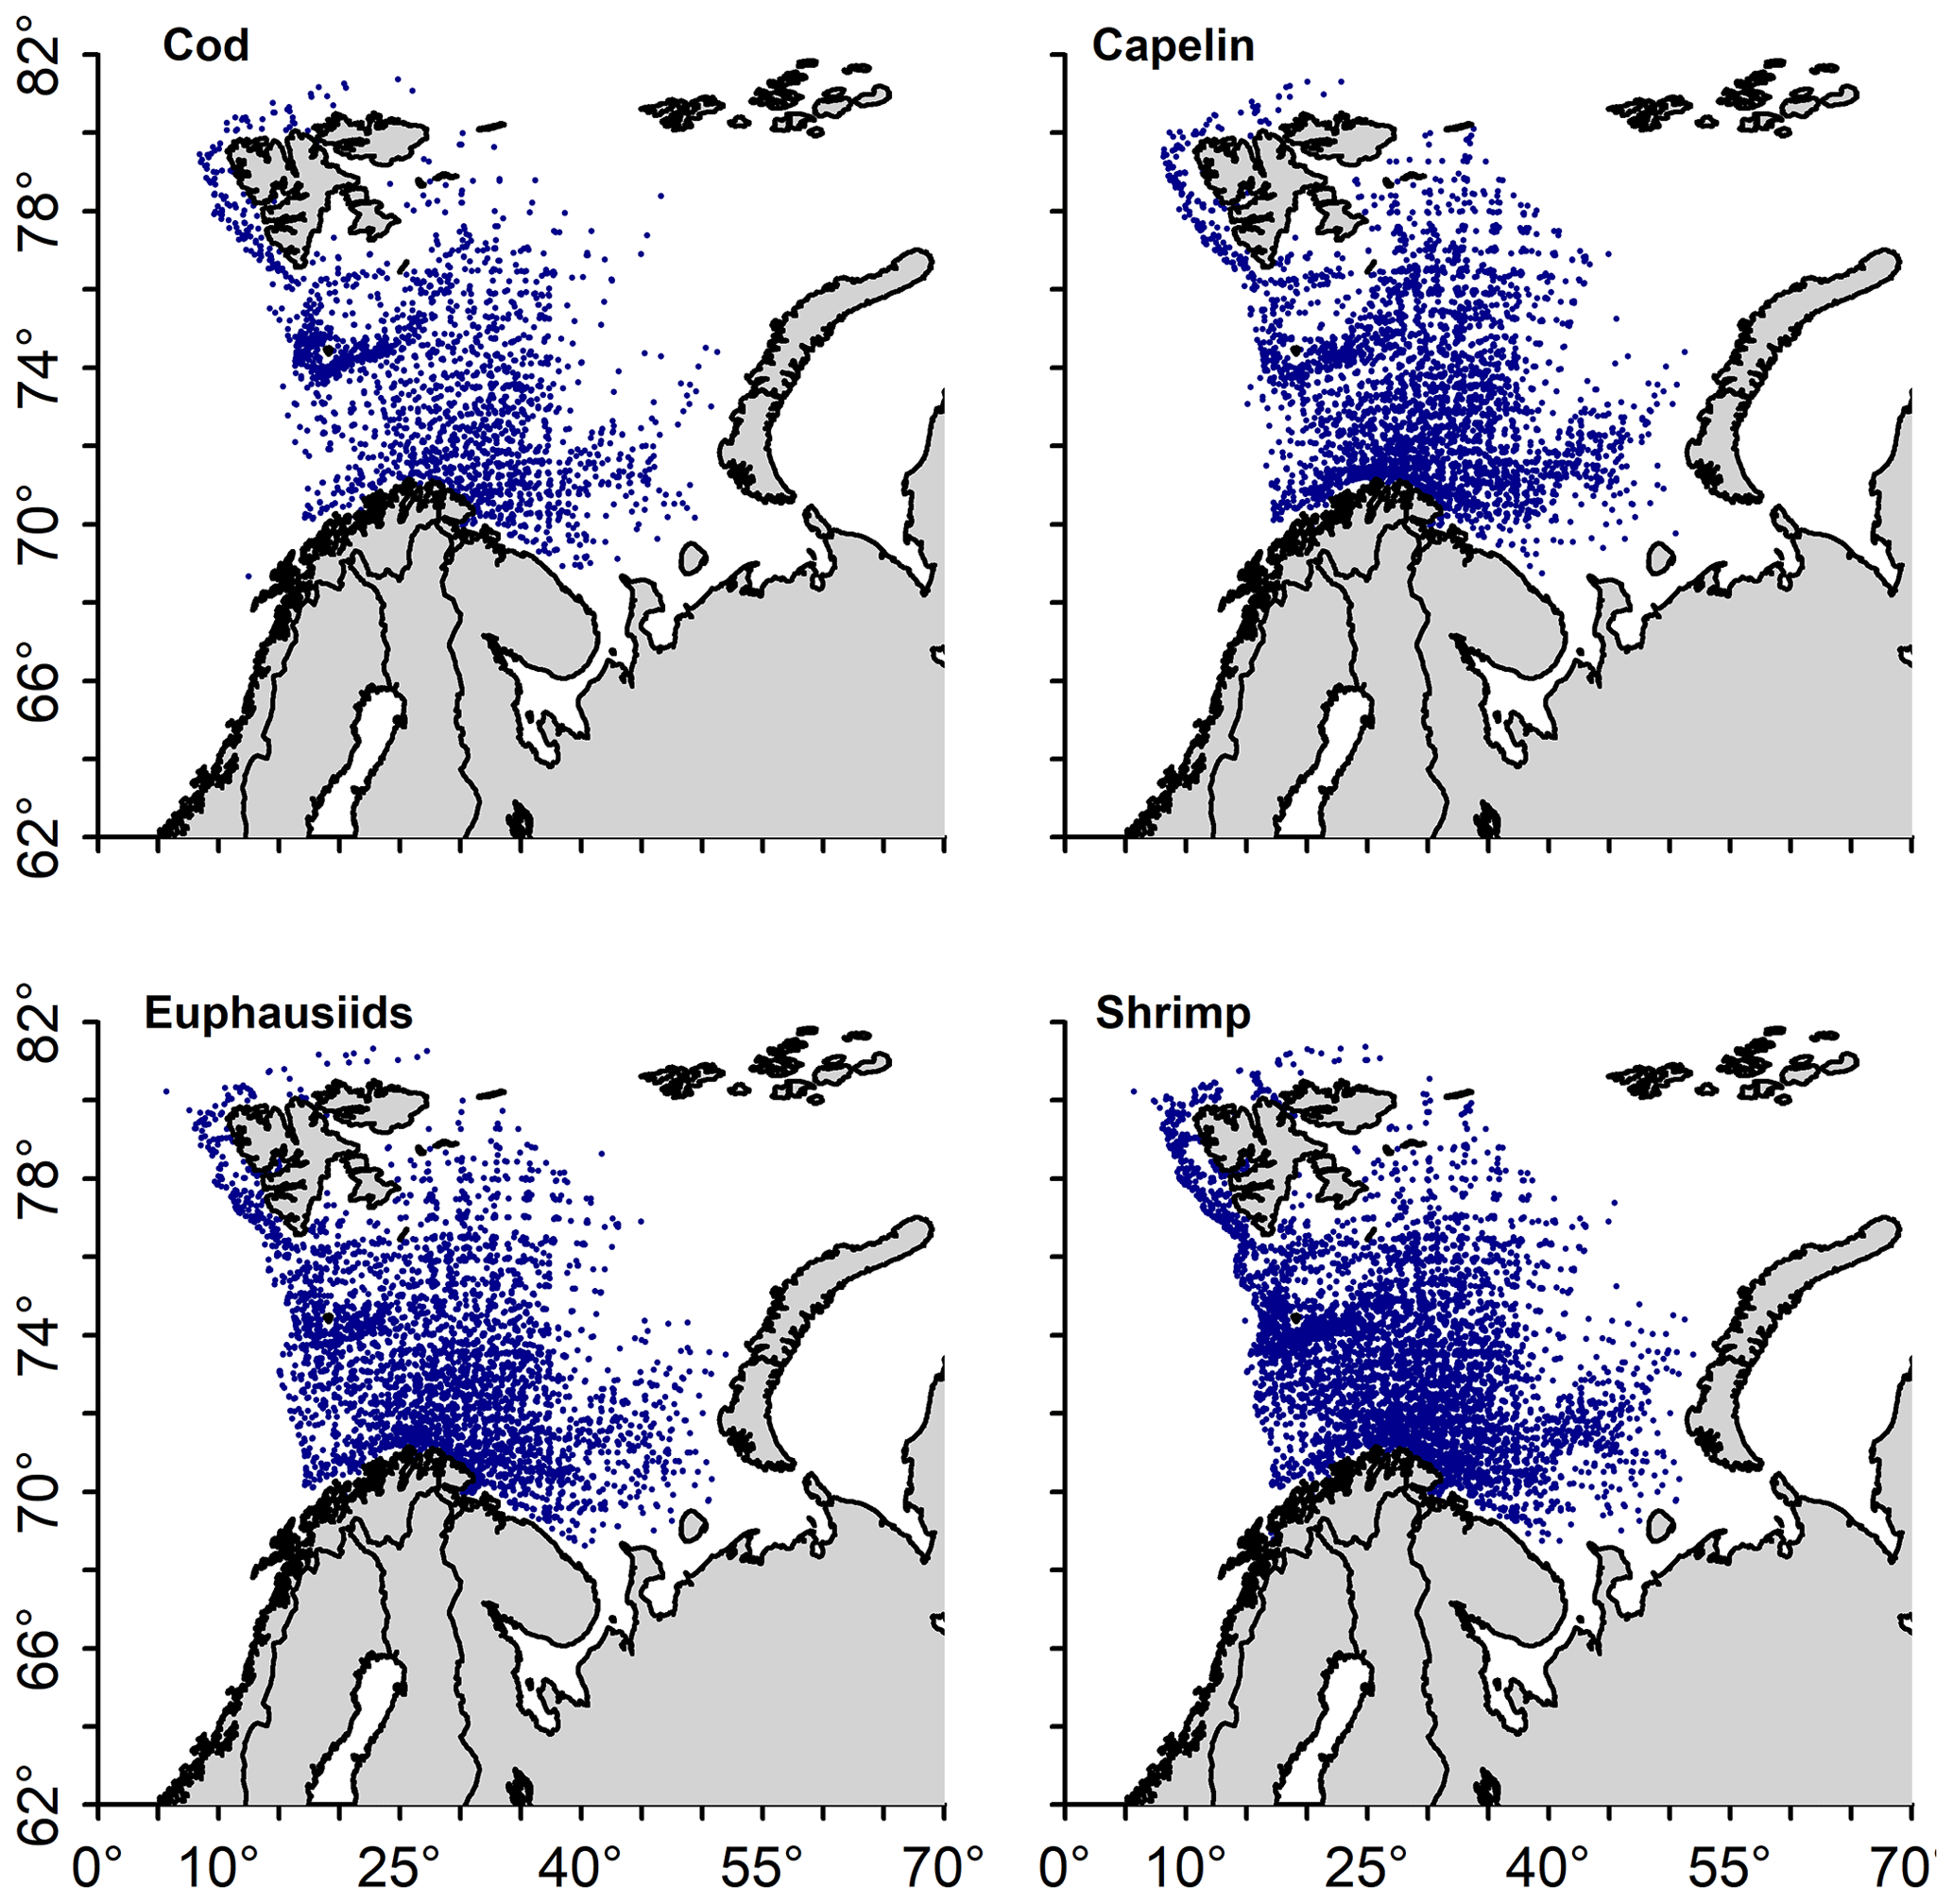
Figure 7The presence of the main prey species in stomachs over all years combined. Each dot denotes a stomach sample.
There are 24 457 quantitative and 2 599 421 qualitative Russian stomach samples, and the Russian data extend further east and northeast than the Norwegian or UK data. The Russian data are not available for publication but are described and presented in a number of papers and reports (e.g. Zatsepin and Petrova, 1939; Mehl and Yaragina, 1992; Dolgov et al., 2007, and references therein; Yaragina et al., 2009; Yaragina and Dolgov, 2011, and references therein; Holt et al., 2019). They are available under joint research projects. Further information about the Russian data is provided in Supplement 3. The locations of the samples are shown in Fig. S3.1; the location in each decade is shown in Fig. S3.2; the total number of stomachs in each year, including empty stomachs, is shown in Fig. S3.3; the percentage occurrence of prey in each decade is shown in Fig. S3.4; and the time series of occurrence of the main prey is provided in Fig. S3.5.
Analysis of the early Russian data also shows that the diets of cod have changed considerably from the 1930s to the 2000s (Yaragina et al., 2009; Yaragina and Dolgov, 2011), reflecting the trends seen in the Barents Sea diet database for herring, cod, capelin and polar cod in Figs. 5 and 6, although not for haddock. The earliest Russian investigations into cod diets from the 1930s (Zatsepin and Petrova, 1939) show similar fluctuations in prey, with interannual asynchronous fluctuations in capelin and euphausiids (Yaragina and Dolgov, 2011), which is also shown in the data in Fig. 6.
IMR/PINRO data have been used in numerous publications and assessments, such as Holt et al. (2019), who investigated how cod diet changes over time, across seasons and with ontogeny. The role of macroplankton in the diet has been studied by Orlova et al. (2005). The data were used to extrapolate cod cannibalism information back to the 1940s (Yaragina et al., 2018). Furthermore, these data were used to explore intra- and inter-specific interactions between top predators in the Barents Sea (Durant et al., 2014). The Arctic Fisheries Working Group has used the cod diet data to estimate cod predation on northeast Arctic cod and haddock and Barents Sea capelin in their stock assessments (ICES, 2019). Spatial dynamics of cod and their main prey were determined by Johannesen et al. (2012), and seasonal variations in feeding and growth by Johannesen et al. (2015). The role of herring and capelin as prey sources has been studied in detail, particularly in relation to size-dependent predation (Johansen, 2002, 2003; Johansen et al., 2004). The stomach data have also been used to assess Ctenophora abundance in the Barents Sea, by using cod as a Ctenophora sampling tool (Eriksen et al., 2018). They found that Ctenophora are increasing in abundance in cod stomachs in recent years, coinciding with warm seas. The UK dataset covers the period of the 1940s, when temperatures in the Barents Sea were similar to those found today (Boitsov et al., 2012). Analysis of this earlier dataset has shown how prey choice is influenced by temperature, with implications for the present-day cod population (Townhill et al., 2015). By combining the early and recent years, this new long-term dataset will allow further comparison of temperature regimes throughout the past century. Also, by using cod as a sampling tool, the data can be used to investigate occurrence and trends in any of the species on which they prey. This has been done, e.g., by Holt et al. (2021) for cod predation on snow crab (Chionoecetes opilio), which is a newly established species in the Barents Sea. UK data have been used to investigate diets in the last century and the role of sea temperature (Townhill et al., 2015). This analysis of the UK data alone found that temperature has a large role to play in explaining the presence of capelin and herring in cod diets. The Russian data were very useful for the understanding of the fluctuations in the ecosystem (e.g. Yaragina and Dolgov, 2011) and for the development of multispecies models. By combining these datasets, we can further understand how the environment and ecosystems are responding to climatic changes, and what influences the diet and prey switching of cod which are evident in the data. Such a long time series will enable trends in temperature and variability indices to be tested against the occurrence of different prey items and investigation of whether fishing pressure on cod and the stocks of their prey affect the diet composition. The dataset will also enable us to improve parametrization of food web models and to forecast how Barents Sea fisheries may respond in the future to management and to climate change.
3.1 Limitations
The UK data contain pooled data of up to 198 stomachs in one record, where the stomach data for all of the cod at one sample station were recorded as one record. These data can be used for qualitative analysis and exploratory analysis of the first half of the 20th century. The stomach contents from the pooled data have been previously presented by Brown and Cheng (1946). The UK data are not as robust as more recent data in that a statistically designed survey was not carried out, and instead the vessels sought the highest catches of cod that they could. This must be taken into account in any analysis of the dataset, but nonetheless the data are still valuable and are a record of cod diets in a certain place and time. There is more detail included in the Norwegian–Russian dataset, such as fullness of stomachs and length and weight of prey. Where such information is required in analysis, the UK data may be less useful. However, there is a lot of value in the combined dataset, even with fewer parameters recorded for the earlier years. The UK data show similar trends in cod diet to quantitative Russian data for the same time period (Yaragina and Dolgov, 2011), showing that these qualitative data are still useful in investigating trends in cod diets.
The quantitative Norwegian and Russian data are more robust than the UK data, and full details of the sampling methods are available (Dolgov et al., 2007, 2011). The main limitation is that bottom trawls are generally used, and so the cod are not well sampled if they are high in the water column. However, cod are generally a demersal species, and therefore bottom trawling is the most effective sampling method. Also, the sampling is limited in the Lofoten–Vesterålen area, an important spawning location for Barents Sea cod. Analysis of the stomachs of spawning cod has only been possible for certain years, owing to the low number of survey stations in the area (Michalsen et al., 2008). As such, cod stomachs sampled south of 70∘ N and west of 18∘ E (Lofoten and nearby areas) were excluded from the dataset and our analyses, as spawning cod is mainly found in this coastal area (Michalsen et al., 2008). This analysis showed that herring dominated the diet, and stomach fullness was found to be lower in this area during the spawning period (March and April). Thus, the location of the cod should be considered when using this Barents Sea cod diet dataset.
The Barents Sea cod diet database (Townhill et al., 2020) can be accessed and data downloaded from https://doi.org/10.21335/NMDC-2139169383. The prey categories and metadata for the database are found in Supplement 1 and 2 respectively. The Russian quantitative data from the joint database (1984–2018) and the qualitative Russian diet data (1947–1983), which are not yet fully digitized, are not publicly available due to the institution policy, but access to these data is granted through contracted collaboration in joint projects with the Polar Branch of VNIRO. Summaries, descriptions and analyses of the Russian data can be found in the following publications: Zenkevich and Brotskaya (1931), Zatsepin and Petrova (1939), Mehl and Yaragina (1992), Dolgov et al. (2007), Yaragina and Dolgov (2011), Holt et al. (2019), Yaragina et al. (2009), and Yaragina and Dolgov (2011).
The release of the Barents Sea cod diet dataset is a significant contribution to the study of Atlantic cod ecology and feeding and the Barents Sea ecosystem as a whole. The data have been used in numerous analyses, which has helped scientists gain a detailed understanding of the stock, mainly analysis of separate datasets. Now, with the population at a high level, this combined dataset, covering almost 90 years and stretching back to 1930, can be used to investigate how climate may be affecting the dynamics of the stock, how this may have knock-on effects within the food web, and what implications this may have for the future of this ecologically and economically important cod stock.
The supplement related to this article is available online at: https://doi.org/10.5194/essd-13-1361-2021-supplement.
BLT conceived the idea for the paper. BB, EJ, JKP, NY and AD were all involved in data collection and survey organization. REH and BLT formed, cleaned and prepared the new Barents Sea Cod diet database. REH and BLT prepared the figures for the paper. BLT wrote the paper with contributions from all co-authors.
The authors declare that they have no conflict of interest.
The authors acknowledge the contribution of all those involved in design of these surveys and data collection, across Norway, Russia and the UK.
We further thank everyone involved in initiating, establishing and updating the joint Norwegian–Russian and the UK stomach content databases, not least the colleagues undertaking the enormous practical task of identifying the stomach contents.
This research was supported by The Research Council of Norway (RCN) through a MARINFORSK grant “CoDINA–Cod: Diet and food web dyNAmics” (project no. 255460). Geir Ottersen was also supported by a grant from the European Research Council through the H2020 “Integrated Arctic Observation System” (INTAROS) project (no. 727890). Digitization of the UK data was also supported by Cefas Seedcorn project Trawling Through Time (DP332).
This paper was edited by Dirk Fleischer and reviewed by one anonymous referee.
Boitsov, V. D., Karsakov, A. L., and Trofimov, A. G.: Atlantic water temperature and climate in the Barents Sea 2000–2009, ICES J. Mar. Sci., 69, 933–840, https://doi.org/10.1093/icesjms/fss075, 2012.
Brown, W. W. and Cheng, C.: Investigations into the food of the cod (Gadus callarias L.) off Bear Island and of the cod and haddock (G. aeglefinus L.) off Iceland and the Murman Coast, Hull Bull. Mar. Ecol, 3, 35–71, 1946.
Cefas: Cefas Fish Stomach Records, available at: https://www.cefas.co.uk/data-and-publications/fish-stomach-records/, last access: 25 March 2014.
Cushing, D. H.: The Arctic cod. A study of research into British trawl fisheries. The Commonwealth and International Library, Pergamon Press Ltd., London, 1966.
Dolgov, A. V., Yaragina, N. A., Orlova, E. L., Bogstad, B., Johannesen, E., and Mehl, S.: 20th anniversary of the PINRO-IMR cooperation in the investigations of fish feeding in the Barents Sea – results and perspectives. In Long term bilateral Russian-Norwegian scientific co-operation as a basis for sustainable management of living marine resources in the Barents Sea, Proceedings of the 12th Norwegian-Russian Symposium, Tromsø, 21–22 August 2007, IMR/PINRO report series 5/2007, 44–78, 2007.
Dolgov, A. V., Orlova, E. L., Johannesen, E., and Bogstad, B.: Piscivorous fish, in: The Barents Sea – Ecosystem, Resources, Management – Half a Century of Russian-Norwegian Cooperation, edited by: Jakobsen, T. and Ozhigin, V. K., Tapir, Academic Press, Trondheim, Norway, 466–484, 2011.
Durant, J. M., Skern-Mauritzen, M., Krasnov, Y. V., Nikolaeva N. G, Lindstrom, U., and Dolgov, A.: Temporal dynamics of top predators interactions in the Barents Sea, Plos One, 9, e110933, https://doi.org/10.1371/journal.pone.0110933, 2014.
Eriksen, E., Bogstad, B., Dolgov, A., and Beck, I. M.: Cod diet as an indicator of Ctenophora abundance dynamics in the Barents Sea, Mar. Ecol. Prog. Ser., 591, 87-100, https://doi.org/10.3354/meps12199, 2018.
Fossheim, M., Primicerio, R., Johannesen, E., Ingvaldsen, R. B., Aschan, M. M., and Dolgov, A. V.: Recent warming leads to a rapid borealization of fish communities in the Arctic, Nat. Clim. Change, 5, 673–677, https://doi.org/10.1038/nclimate2647, 2015.
Graham, M.: English Fishery Research in Northern Waters, Arctic Institute of North America, 6, 252–259, 1953.
Holt, R. E., Bogstad, B., Durant, J. M., Dolgov, A. V., and Ottersen, G.: Barents Sea cod (Gadus morhua) diet composition: long-term interannual, seasonal, and ontogenetic patterns, ICES J. Mar. Sci. 76, 1641–1652, https://doi.org/10.1093/icesjms/fsz082, 2019.
Holt, R. E., Hvingel, C., Agnalt, A.-L., Dolgov, A. V., Hjelset, A. M., and Bogstad, B.: Snow crab (Chionoecetes opilio), a new food item for North-east Arctic cod (Gadus morhua) in the Barents Sea, ICES J. Mar. Sci., https://doi.org/10.1093/icesjms/fsaa168, 2021.
Hylen, A.: Fluctuations in abundance of Northeast Arctic cod during the 20th century: ICES Mar. Sci. Symp., 215, 543–550, 2002.
Hyslop, E. J.: Stomach content analysis – a review of methods and their application, J. Fish Biol., 17, 411–429, https://doi.org/10.1111/j.1095-8649.1980.tb02775.x, 1980.
ICES: Report of the Arctic Fisheries Working Group (AFWG), ICES Sci. Rep., 1, 1–934, https://doi.org/10.17895/ices.pub.5292, 2019.
Johannesen, E., Lindstrøm, U., Michalsen, K., Skern-Mauritzen, M., Fauchald, P., Bogstad, B., and Dolgov, A: Feeding in a heterogenous environment: spatial dynamics in summer foraging Barents Sea cod, Mar. Ecol. Prog. Ser., 458, 181–197, https://doi.org/10.3354/meps09818, 2012.
Johannesen, E., Johansen, G. O., and Korsbrekke, K.: Seasonal variation in cod feeding and growth in a changing sea, NRC Res. Press, 73, 235–245, https://doi.org/10.1139/cjfas-2015-0052, 2015.
Johansen, G. O.: Temporal and spatial variation in predation on juvenile herring (Clupea harengus L.) by Northeast Arctic cod (Gadus morhua L.) in the Barents Sea in 1984–1997, ICES J. Mar. Sci., 59, 270–292, 2002.
Johansen, G. O.: Size-dependent predation on juvenile herring (Clupea harengus L.) by North-east Arctic cod (Gadus morhua L.) in the Barents Sea, SARSIA, 88, 136–153, https://doi.org/10.1080/0036482031000148, 2003.
Johansen, G. O., Bogstad, B., Mehl, S., and Ulltang, Ø.: Consumption of juvenile herring (Clupea harengus) by cod (Gadus morhua) in the Barents Sea: a new approach to estimating consumption in piscivorous fish, Can. J. Fish. Aquat. Sci., 61, 343–359, https://doi.org/10.1139/F03-168, 2004.
Kjesbu, O. S., Bogstad, B., Devine, J. A., Gjøsæter, H., Howell, D., Ingvaldsen, R. B., Nash, R. D. M., and Skjæraasen, J. E.: Synergies between climate and management for Atlantic cod fisheries at high latitudes, P. Natl. Acad. Sci. USA, 111, 3478–3483, https://doi.org/10.1073/pnas.1316342111, 2014.
Link J. S. and Garrison, L. P.: Trophic ecology of Atlantic cod Gadus morhua on the northeast US continental shelf, Mar. Ecol. Prog. Ser., 227, 109–123, https://doi.org/10.3354/meps227109, 2002.
Link, J. S., Bogstad, B., Sparholt, H., and Lilly, G. R.: Role of Atlantic cod in the Ecosystem, Fish Fish, 10, 58–87, https://doi.org/10.1111/j.1467-2979.2008.00295.x, 2009.
Mehl, S.: Stomach contents of North-East Arctic cod and possible changes in the diet the last years, International Council for the Exploration of the Sea, ICES CM 1986/G:29, 26 pp., 1986.
Mehl, S. and Yaragina, N. A.: Methods and results in the joint PINRO-IMR stomach sampling program, in: Interrelations between Fish Populations in the Barents Sea, Proceedings of the 5th Soviet-Norwegian Symposium, edited by: Bogstad, B. and Tjelmeland, S., Murmansk, 12–16 August 1991, 5–16, 1992.
Michalsen, K., Johannesen, E., and Bogstad, B.: Feeding of mature cod (Gadus morhua L.) at the spawning grounds in Lofoten, ICES J. Mar. Sci., 65, 571–580, https://doi.org/10.1093/icesjms/fsn019, 2008.
Neuenfeldt, S. and Beyer, J. E.: Environmentally driven predator–prey overlaps determine the aggregate diet of the cod Gadus morhua in the Baltic Sea, Mar. Ecol. Prog. Ser., 310, 151–163, https://doi.org/10.3354/meps310151, 2006.
Orlova, E. L., Dolgov, A. V., Rudneva, G. B., and Nesterova, V. N.: The effect of abiotic and biotic factors on the importance of macroplankton in the diet of Northeast Arctic cod in recent years, ICES J. Mar. Sci., 62, 1463e1474, https://doi.org/10.1016/j.icesjms.2005.08.003, 2005.
Ottersen, G., Bogstad, B., Yaragina, N. A., Stige, L. C., Vikebø, F. B., and Dalpadado, P.: A review of early life history dynamics of Barents Sea cod (Gadus morhua), ICES J. Mar. Sci., 71, 2064–2087, 2014.
Pálsson, Ó. K. and Björnsson, H.: Long-term changes in trophic patterns of Iceland cod and linkages to main prey stock sizes, ICES J. Mar. Sci., 68, 1488–1499, https://doi.org/10.1093/icesjms/fsr057, 2011.
Pinnegar, J. K.: DAPSTOM–An Integrated Database & Portal for Fish Stomach Records, Version 4.7. Centre for Environment, Fisheries & Aquaculture Science, Lowestoft, UK, 39 pp., 2014.
Pinnegar, J. K.: DAPSTOM–An Integrated Database & Portal for Fish Stomach Records, Version 5.5, Centre for Environment, Fisheries & Aquaculture Science, Lowestoft, UK., 34 pp., 2019.
Pinnegar, J. K., Goñi, N., Trenkel, V. M., Arrizabalaga, H., Melle, W., Keating, J., and Óskarsson, G.: A new compilation of stomach content data for commercially important pelagic fish species in the northeast Atlantic, Earth Syst. Sci. Data, 7, 19–28, https://doi.org/10.5194/essd-7-19-2015, 2015.
Townhill, B. L., Maxwell, D., Engelhard, G. H., Simpson, S. D., and Pinnegar, J. K.: Historical Arctic Logbooks Provide Insights into Past Diets and Climatic Responses of Cod, Plos One, 10, e0135418, https://doi.org/10.1371/journal.pone.0135418, 2015.
Townhill, B. L., Holt, R. E., Bogstad, B., Durant, J. M., Pinnegar, J. K., Johannesen, E., and Ottersen, G.: 2020 Barents Sea Cod Diet Data, Norwegian Marine Data Centre, https://doi.org/10.21335/NMDC-2139169383, 2020.
Tsou, T. S. and Collie, J. S.: Estimating predation mortality in the Georges Bank fish community, Can. J. Fish. Aq. Sci., 58, 908–922, https://doi.org/10.1139/f01-044, 2001.
Willis, T. V., Wilson, K. A., Alexander, K. E., and Leavenworth, W. B.: Tracking cod diet preference over a century in the northern Gulf of Maine: historic data and modern analysis, Mar. Ecol. Prog. Ser., 474, 263–276, https://doi.org/10.3354/meps10068, 2013.
Yaragina, N. A. and Dolgov, A. V.: Long-term variations in the importance of prey species for demersal fish in the Barents Sea under conditions of climate change. In Climate change and effects on the Barents Sea marine living resources, Proceedings of the 15th Russian-Norwegian Symposium, Longyearbyen, 7–8 September 2011, edited bu: Haug, T., Dolgov, A., Drevetnyak, K., Røttingen, I., Sunnanå., K., and Titov, O., Institute of Marine Research, Bergen, Norway, Polar Research Institute of Marine Fisheries and Oceanography – PINRO, IMR/PINRO report series 2/2011, 290 pp, 160–180, 2011.
Yaragina, N. A., Bogstad, B., and Kovalev, Y. A.: Variability in cannibalism in northeast Arctic cod (Gadus morhua) during the period 1947–2006, Mar. Biol. Res., 5, 75–85, https://doi.org/10.1080/17451000802512739, 2009.
Yaragina, N. A., Kovalev, Y., and Chetyrkin, A.: Extrapolating predation mortalities back in time: an example from North-east Arctic cod cannibalism, Mar. Biol. Res., 14, 203–216, https://doi.org/10.1080/17451000.2017.1396342, 2018.
Zenkevich, L. A. and Brotskaya, V. A.: Materials on the feeding of the Barents Sea fishes, Proceedings of the 1st session GOIN, 4, 1–35, 1931 (in Russian).
Zatsepin, V. I. and Petrova, N. S.: The food of the commercial stocks of cod in the southern part of the Barents Sea (from observations made in 1934-1938) [Original title: Pitanie promyslovykh kosiakov treski v yuzhnoi chasti Barentsova Moria (po nabliudeniiam v 1934-1938 g.g.) From: Trudy Poliarnogo N.-I. Instituta Morskogo Rybnogo Khoziaistva i Okeanografii imeni N.M. Knipovicha (PINRO)], Fisheries Research Board of Canada Translation Series 1064 No. 498., 170 pp., 1939.