the Creative Commons Attribution 4.0 License.
the Creative Commons Attribution 4.0 License.
 | 26 Mar 2021
Hydrometeorological data from a Remotely Operated Multi-Parameter Station network in Central Asia
Julia Illigner
Nico Stolarczuk
Torsten Queißer
Matthias Köppl
Heiko Thoss
Alexander Zubovich
Azamat Sharshebaev
Kakhramon Zakhidov
Khurshid Toshpulatov
Yusufjon Tillayev
Sukhrob Olimov
Zabihullah Paiman
Katy Unger-Shayesteh
Abror Gafurov
Bolot Moldobekov
The regional research network Water in Central Asia (CAWa) funded by the German Federal Foreign Office consists of 18 remotely operated multi-parameter stations (ROMPSs) in Central Asia. These stations were installed by the German Research Centre for Geosciences (GFZ) in Potsdam, Germany, in close cooperation with the Central-Asian Institute for Applied Geosciences (CAIAG) in Bishkek, Kyrgyzstan; the national hydrometeorological services in Tajikistan and Uzbekistan; the Ulugh Beg Astronomical Institute in Tashkent, Uzbekistan; and the Kabul Polytechnic University, Afghanistan. The primary objective of these stations is to support the establishment of a reliable data basis of meteorological and hydrological data especially in remote areas with extreme climate conditions for applications in climate and water monitoring in Central Asia. Up to now, 10 years of data have been provided for an area of scarce station distribution and with limited open-access data which can be used for a wide range of scientific or engineering applications. The data described in this paper are made publicly available with the digital object identifier (DOI) https://doi.org/10.5880/GFZ.1.2.2020.002 (Zech et al., 2020) or via the Sensor Data Storage System (SDSS) at http://sdss.caiag.kg (last access: 22 February 2021).
- Article
(15618 KB) - Full-text XML
- BibTeX
- EndNote


Central Asia with its former Soviet republics Kazakhstan, Kyrgyzstan, Tajikistan, Turkmenistan and Uzbekistan is a region that varies from high mountains to deep valleys, vast deserts and fertile river basins. Due to this wide range of natural diversity, large differences in climate forming factors like temperature, precipitation and snow cover occur. In particular, the high mountains such as the Pamir Mountains and Tian Shan where most of the water originates from glaciers and snowpacks provide important water resources for the entire region (Unger-Shayesteh et al., 2013). During the Soviet time, a large number of manually controlled monitoring stations for meteorological and hydrological observations were operated for extended periods of time. Specifically, the river discharge data were used to infer the meltwater of the snow-covered mountains of Tajikistan and Kyrgyzstan with the demand for water in the arid but agriculturally used land of Kazakhstan, Turkmenistan and Uzbekistan in exchange for coal, oil and gas (Bernauer and Siegfried, 2012). After the collapse of the Soviet Union in 1991, the sharing of resources became difficult and thus subject to frequent disputes between the now-independent countries. In particular, the water availability and its different utilization are the most challenging problems. While the water from the mountainous areas is used for the generation of hydropower due to the lack of other energy-providing resources in the upstream countries, the demand for agricultural irrigation in the downstream countries in summer contrasts with the release of water from the reservoirs during the winter season (Siegfried et al., 2012). Additionally, after 1991, the monitoring network degraded significantly in this region (Finaev, 2009; Glazirin, 2009; Kuzmichenok, 2009) mainly due to economic shortening resulting in a lack of information urgently needed for water availability decisions (Unger-Shayesteh et al., 2015). To support the Central Asian countries in transboundary water resource management based on reliable in situ and remote sensing data and to make water a subject of peaceful cooperation, the German Federal Foreign Office launched the German Water Initiative for Central Asia “Berlin Process” in April 2008. The primary goal was to assist the cooperation between the Central Asian countries with regard to energy and water management on the political, scientific–technical and educational level.
The scientific–technical level aimed at achieving the establishment of a reliable data basis for hydrological and meteorological data and the implementation of new technical monitoring and data distribution solutions. These goals were addressed by the regional research network Water in Central Asia (CAWa) funded by the German Federal Foreign Office and coordinated by the German Research Centre for Geosciences (GFZ) in Potsdam, Germany. To support the reconstruction of the degraded network of meteorological and hydrological station infrastructure and to provide near-real-time hydrometeorological data, the Remotely Operated Multi-Parameter Station (ROMPS) network (Schöne et al., 2013) together with a remote-sensing monitoring system of rivers, reservoirs, and lake levels (Schöne et al., 2018a) has been established over the past 10 years. To support the activities and to strengthen the geoscientific cooperation between the five Central Asian countries and Afghanistan, additional funding has been provided by GFZ through the Global Change Observatory Central Asia (GCO-CA) and the Advanced Remote Sensing – Ground Truth Demo and Test Facilities (ACROSS) projects of the Helmholtz Association (Helmholtz Society, 2015). While some of these stations have been installed to additionally monitor the tectonically active parts of the Pamir Mountains and Tian Shan areas with a global navigation satellite system (GNSS) (Zubovich et al., 2016), others are dedicated to monitoring glacier dynamics and glacier lake outburst floods (Zech et al., 2016) and to re-establishing glacier monitoring for mass balance studies (Hoelzle et al., 2012).
The objective of this paper is to describe the near-real-time meteorological and hydrological observations provided by the CAWa, GCO-CA and ACROSS station network. An overview of the station locations, the methods of data collection including their known quality issues and further documentation are given in the next sections.
To support the construction of new hydrometeorological stations, close cooperation between different agencies and institutes in Central Asia has been developed. One of the main partners is the Central-Asian Institute for Applied Geosciences (CAIAG) in Bishkek, Kyrgyzstan, which was founded in 2004 by the government of the Kyrgyz Republic and the GFZ. Additionally, cooperation with the national hydrometeorological services (hydromet services) in Kyrgyzstan (KgHM), Tajikistan (TjHM) and Uzbekistan (UzHM) the Ulugh Beg Astronomical Institute (UBAI) in Tashkent, Uzbekistan, as well as with the Kabul Polytechnic University (KPU), Afghanistan, has been established. In joint collaboration with these partners, 18 stations have been installed altogether and are jointly operated. Thereof, 8 stations from Kyrgyzstan, 3 stations from Uzbekistan, 2 stations from Tajikistan and 1 station from Afghanistan are providing data. Figure 1 shows the station distribution in Central Asia.
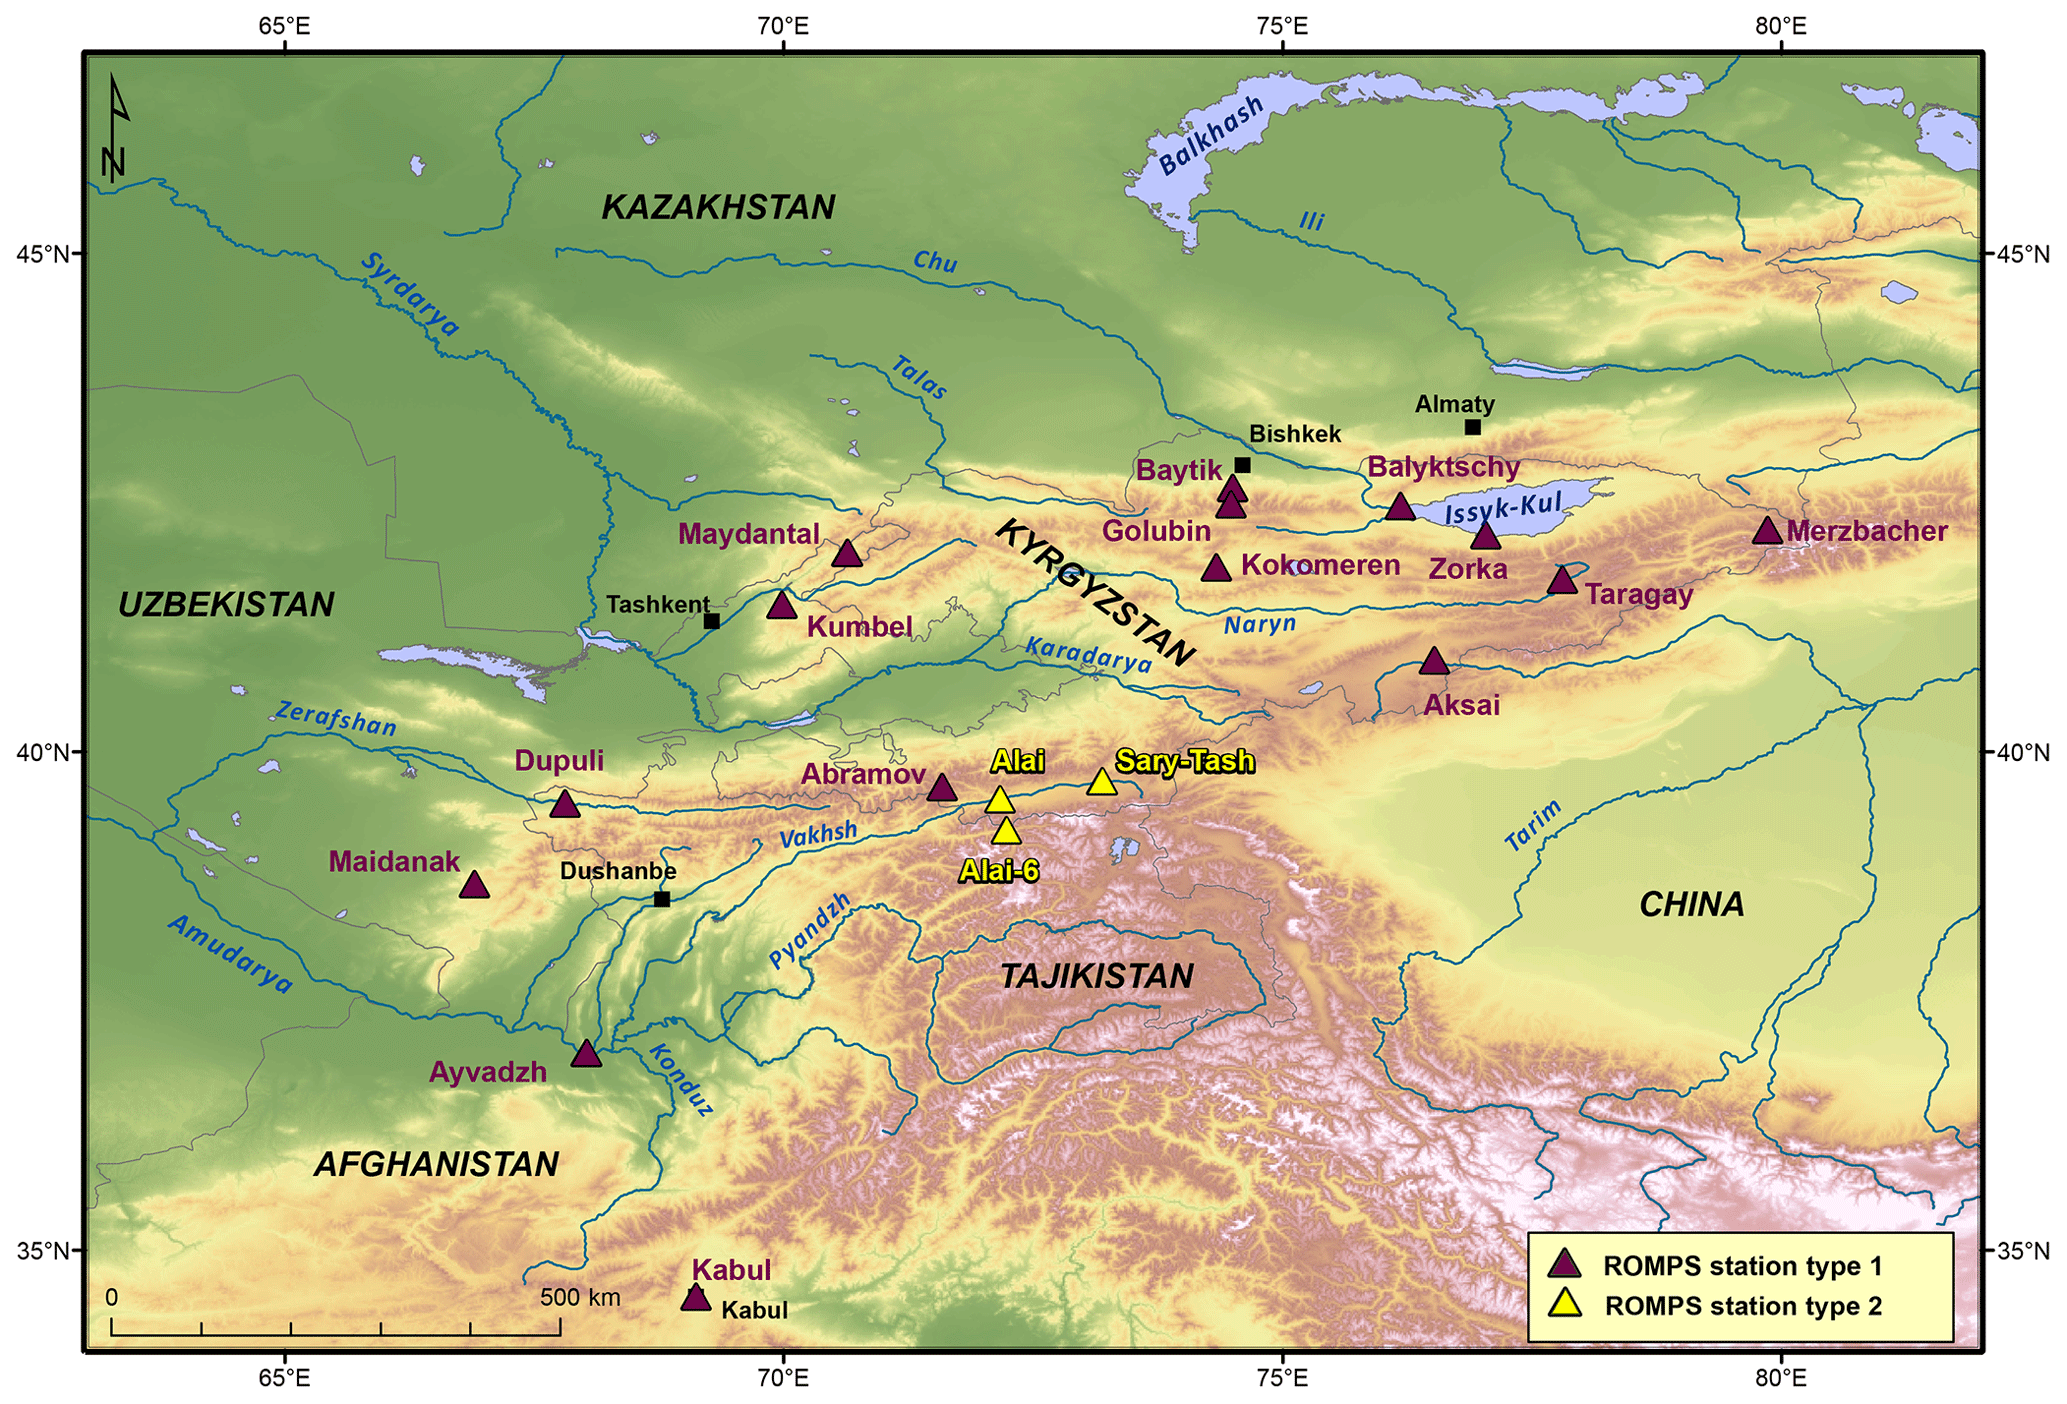
Figure 1ROMPS network in Central Asia with the two different station types (see Sect. 3) marked in purple for station type one with individual sensors and in yellow for station type two with the compact weather transmitter (credit to NOAA for the DEM).
The stations are located in different climatic regions, reaching from high altitudes (4124 m a.s.l.) in the mountains and at glaciers down to low elevations (318 m a.s.l.) in flat and dry areas covering three different Central Asian countries and Afghanistan (Schöne et al., 2018b; Schöne et al., 2019). The station locations were selected together with the hydromet services and partners with regard to previous network coverage, meteorological information content, possibility of satellite data transfer and station security aspects. However, some stations have been installed at existing meteorological stations or “hydroposts” with manual readings performed by a local operator. The intention was to combine and compare the manual with the digital measurements as well as to ensure the safety of the equipment.
The stations are designed for operation in remote areas and high altitudes, especially under extreme climate conditions with temperatures ranging from +60 to −60 ∘C (Schöne et al., 2013). To keep the maintenance efforts low, the general technical setup of all ROMPSs is identical at most locations. The system operates independently and automatically in order to reduce the need for manual interventions of a local operator. All stations consist of outside connected sensors and a waterproof (IP66) station main box (see Fig. 6) integrating the central electronic components for the general operation such as the station computer system, independent (solar) power supply and data communication systems. Two alternative communication lines were chosen: either two different satellite systems (very small aperture terminal – VSAT – and Iridium) or, depending on the signal coverage, one satellite (VSAT) and one ground communication line (Global System for Mobile Communication – GSM). Due to their independence from local infrastructures (power, data transmission and manual interaction), the stations are suitable for remote areas with difficult accessibility.
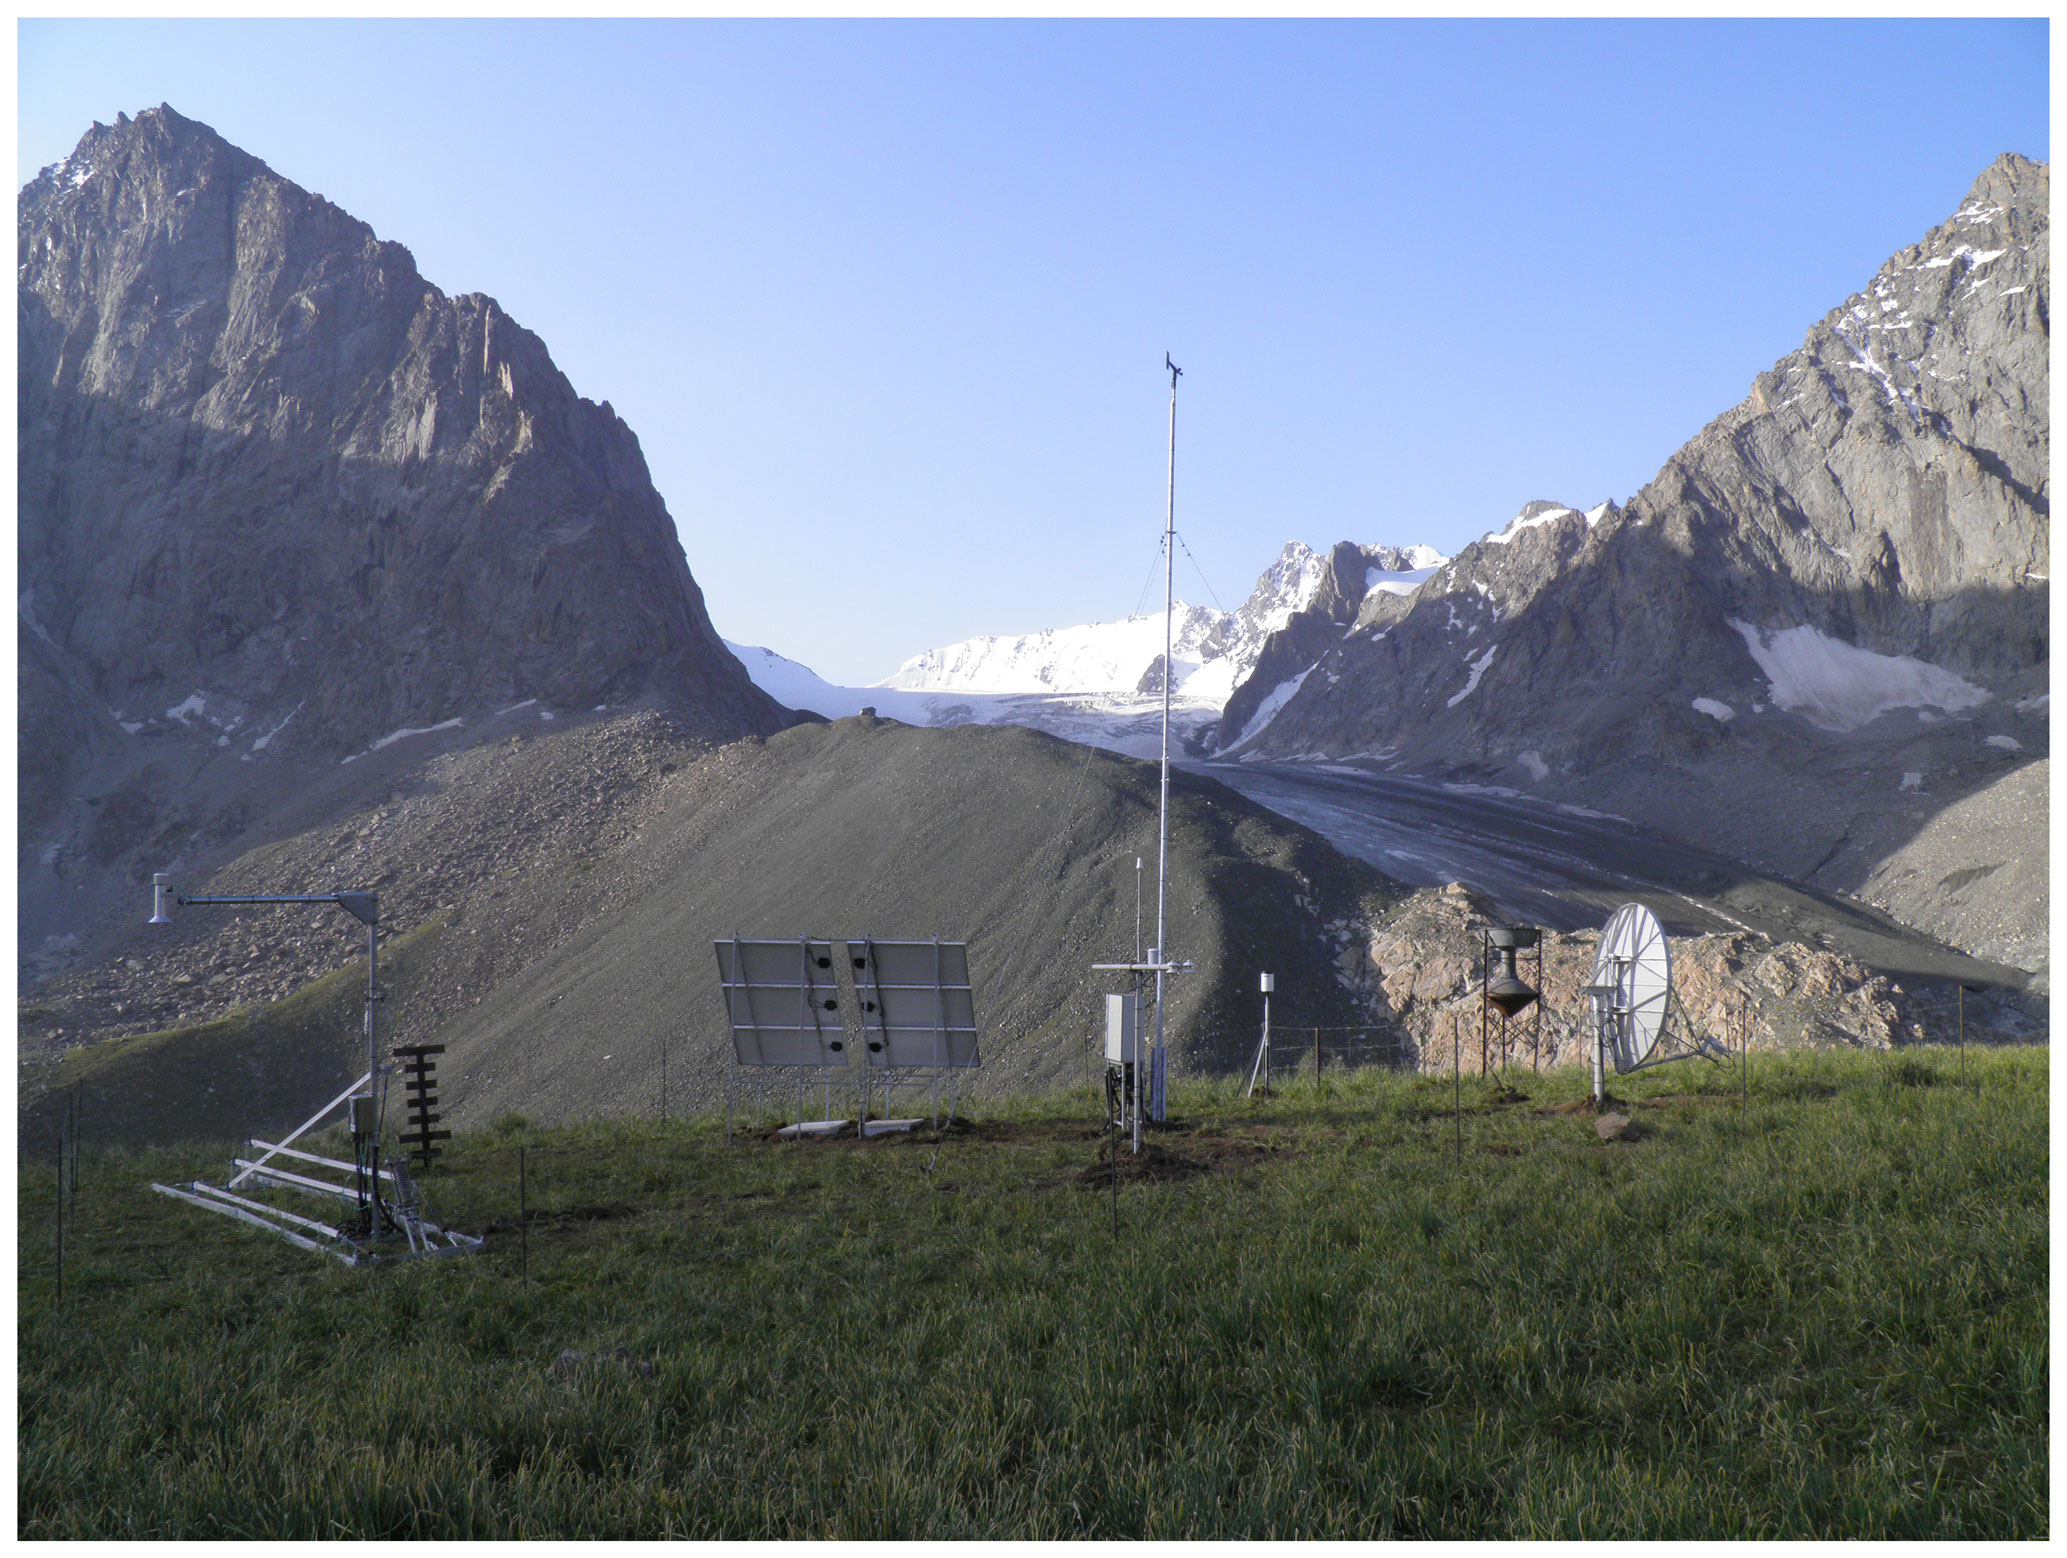
Figure 2Station type one with meteorological sensors and a snow pack analyser (SPA, front left) at the station Golubin Glacier (GOLU).
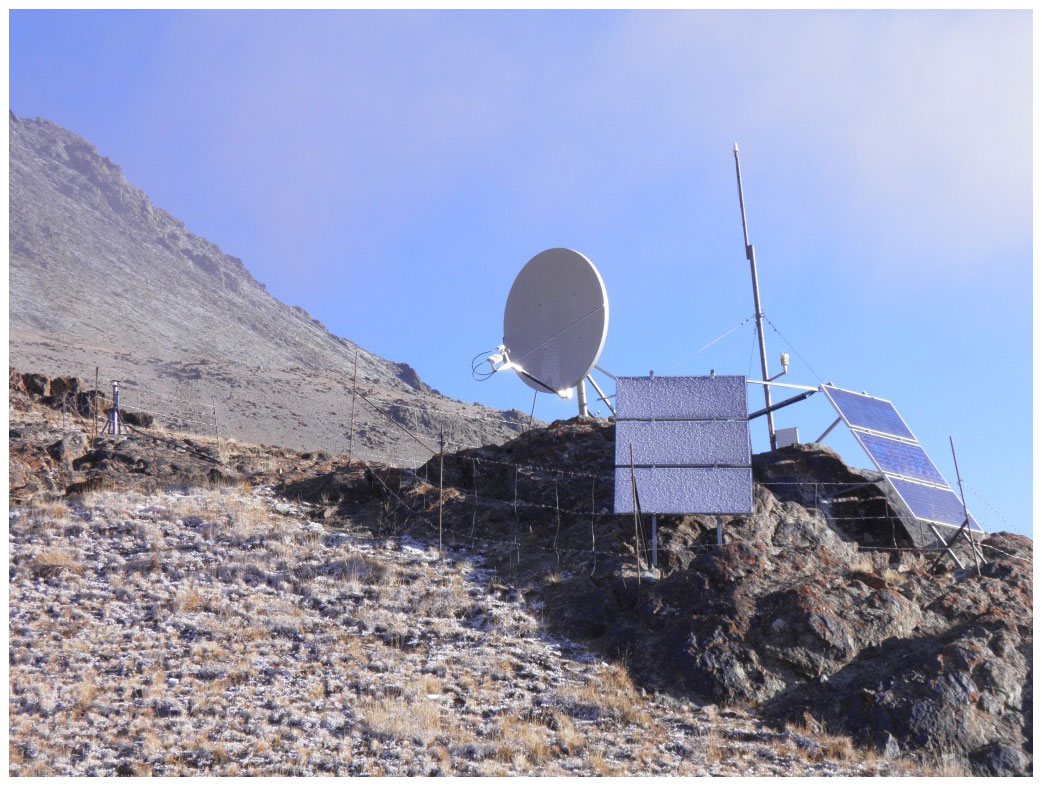
Figure 3Station type two with a compact weather transmitter connected at the pole between the solar panels at the station Alai-6 (ALA6).
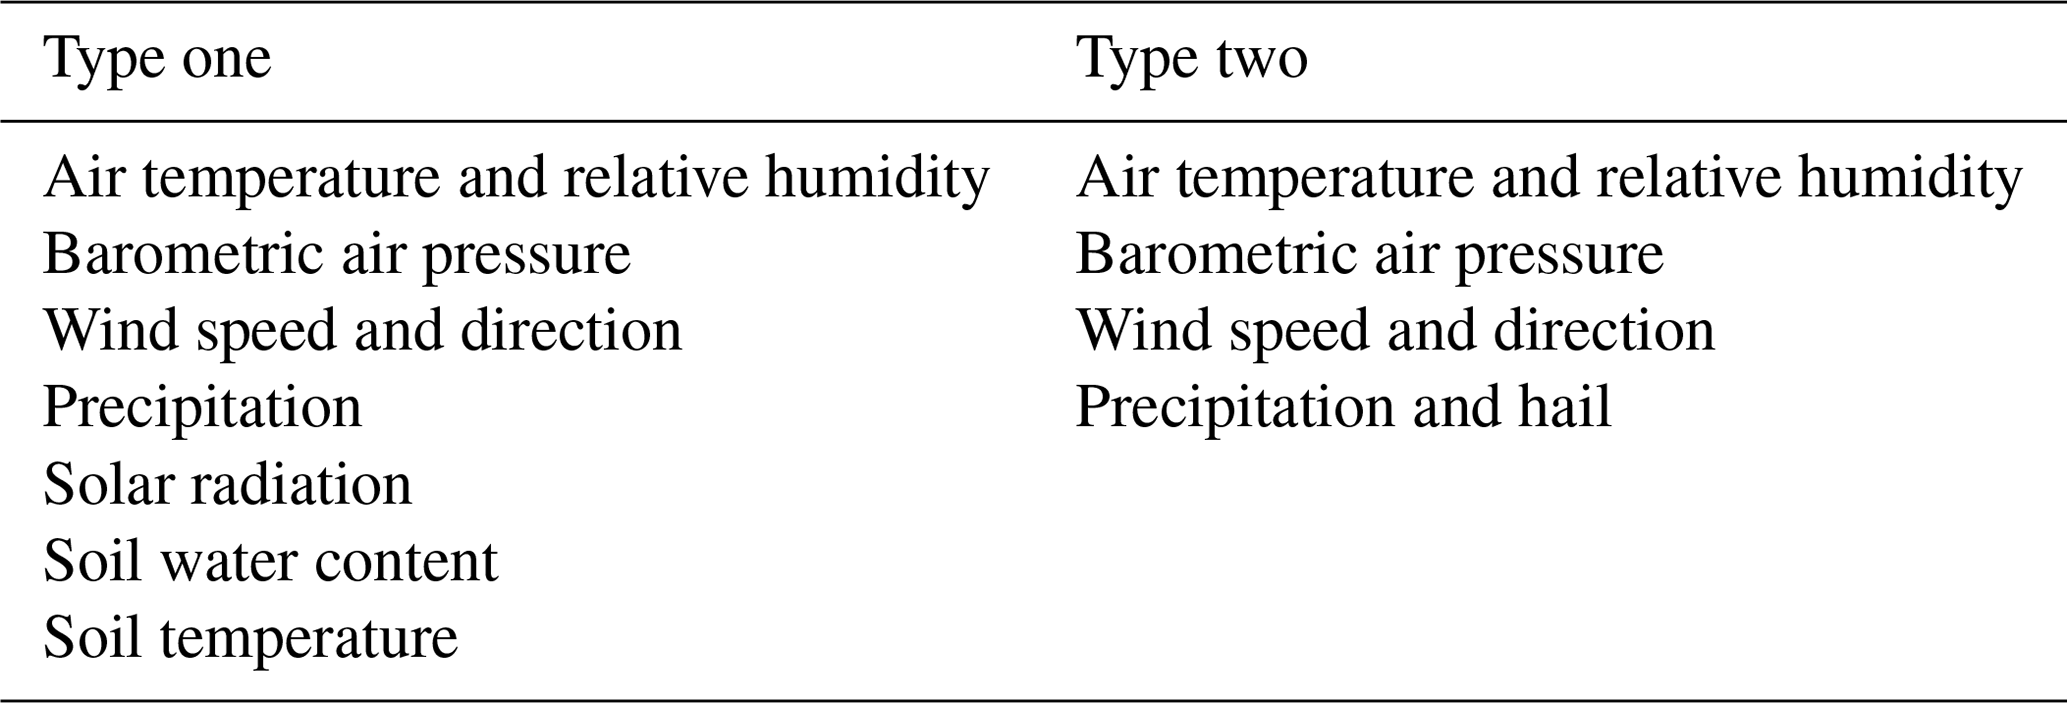
The station outline is determined by the selection of meteorological sensors and can be differentiated into two types. The first type consists of a set of separate sensors complying with the World Meteorological Organization (WMO) requirements (WMO, 2018b) that are arranged around the station main box to avoid interferences with each other (Fig. 2). At the second type of station (Fig. 3), a compact weather transmitter is used. Figure 4 shows a typical station outline for station type one, but depending on the local environment, the sensors are arranged differently at other stations.
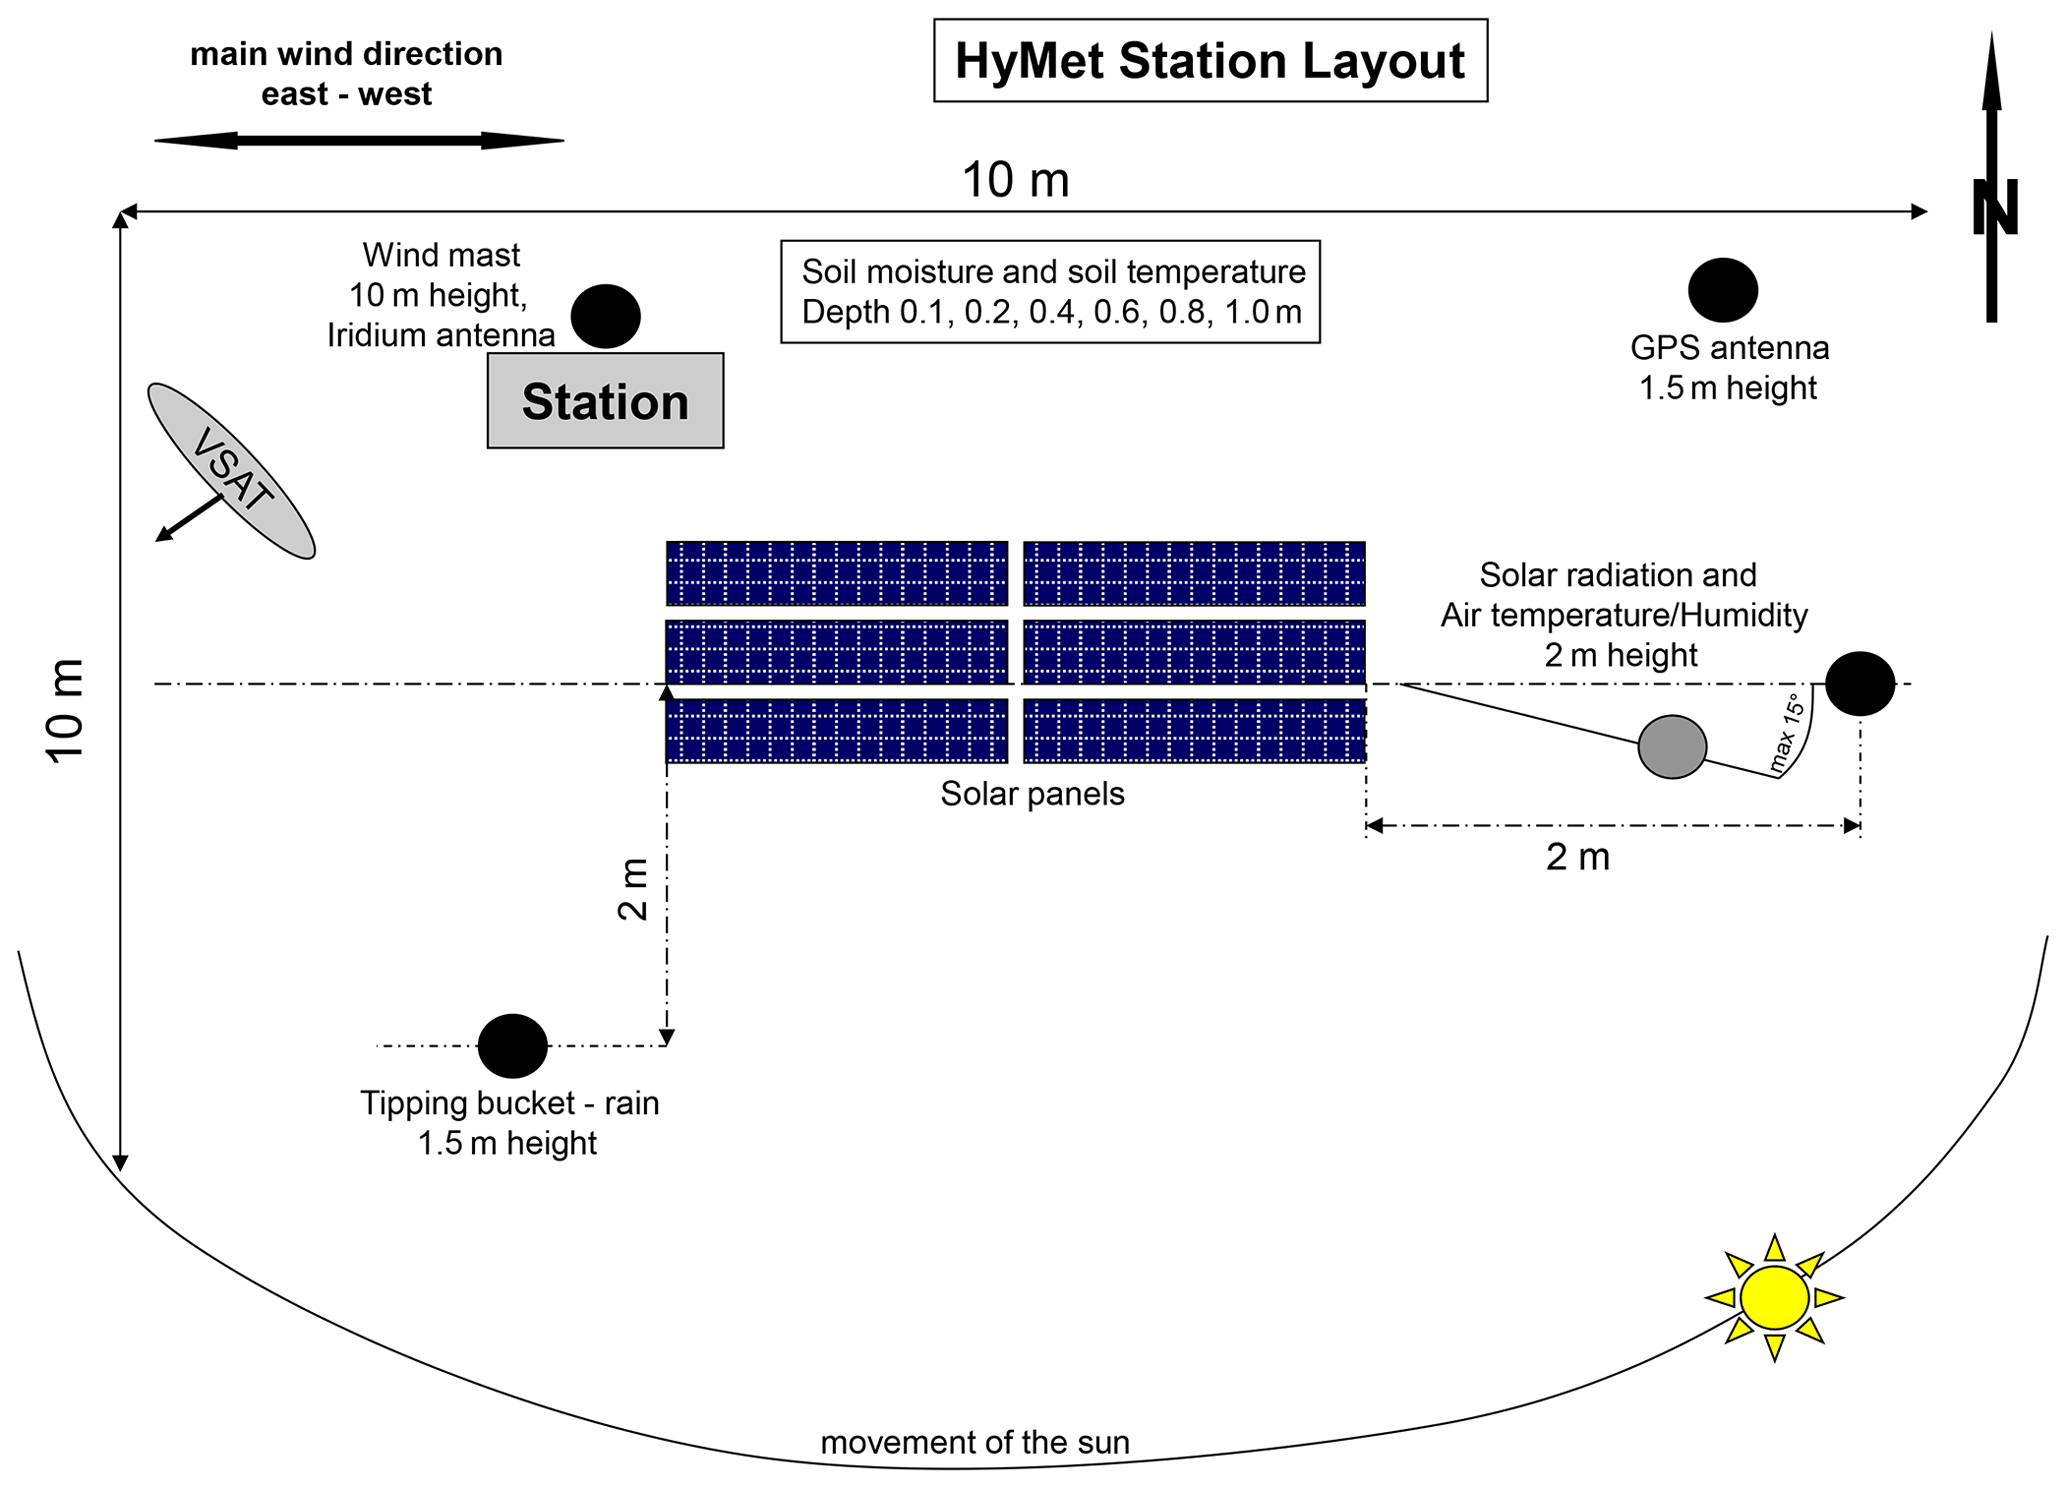
Figure 4Typical station outline for station type one with the arrangement of sensors around the station area to avoid interferences or shadowing from other technical equipment.
All stations are equipped with a standard set of meteorological sensors. Table 1 lists the measured parameters for each station type.
At selected locations, the stations have been augmented with a river discharge monitoring system and/or a snow measuring system. While the snow system is usually located adjacent to the other sensors (see Fig. 2 to the left), the discharge system is installed directly at rivers which can be separated from the station main box (see Fig. 5) by several hundred metres. This system consists of an independent power supply, and the data are transmitted in regular intervals by a radio link to the main station. The snow system measures the following parameters:
-
snow depth (reversed distance),
-
content of liquid water and ice,
-
snow density, and
-
snow water equivalent (SWE).
The river discharge system provides the following parameters:
-
water level,
-
surface flow velocity, and
-
(computed) river discharge volume.

Figure 5River discharge system at station MTAL with a solar panel and the boom for the sensor.
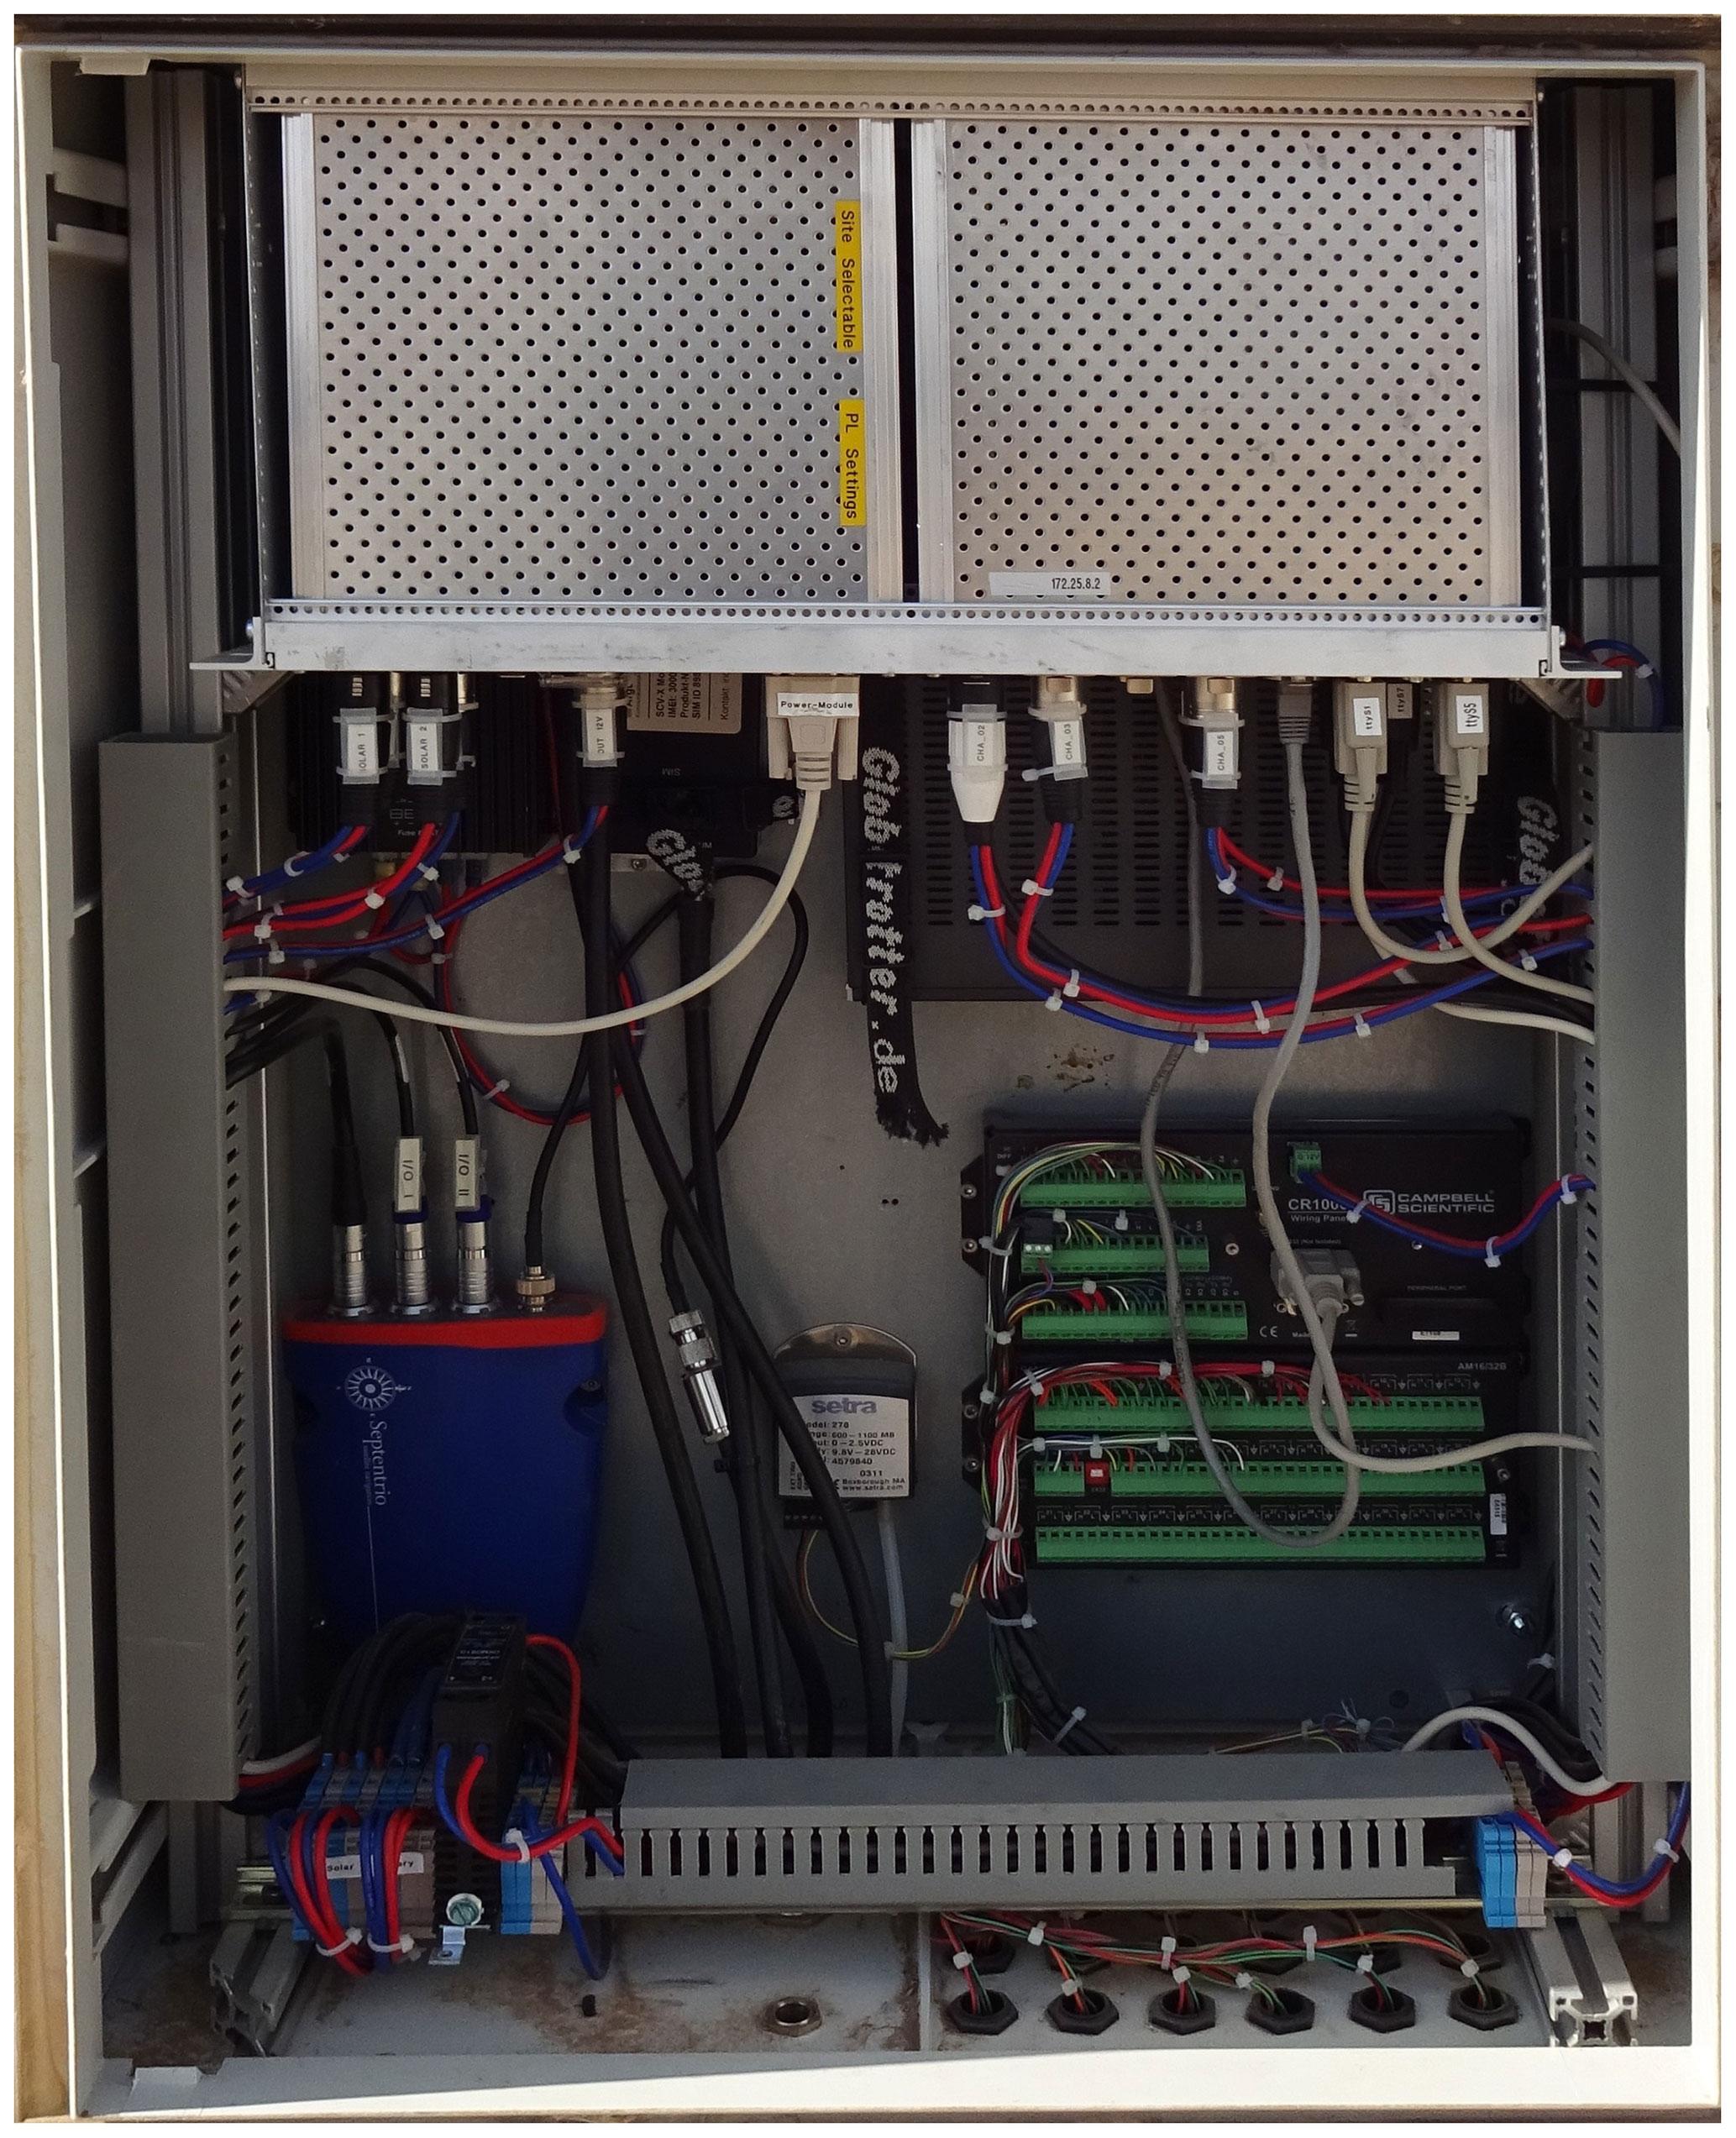
Figure 6Station main box. Topside: the computer and power module is visible. The VSAT and Iridium modem are located at the back. Below is the GNSS receiver (left), the barometric sensor (middle) and the Campbell data logger (Schöne et al., 2013).
The primary service of the CAWa ROMPS network is to provide meteorological and hydrological data (Schöne et al., 2018b, 2019), especially from the high-mountain areas of Central Asia supporting the national hydromet services and the regional and international scientific community. The stations with their installed sensor systems and start-of-operation dates are listed in Table 2. The start of operation does not necessarily match with the start of all sensor systems. In some cases, individual sensors were installed at a later date.
Table 2Station list with their start of operation dates and the installed sensors systems. While the column “Meteo. sensors” refers to various individual sensors, the “Weather sensor” column refers to the compact weather transmitter (station type two).

* OYGA (Oygaing) consists of a river discharge system only that is located close to and connected to the station MTAL (Maydantal).
Additionally to the hydrometeorological data acquisition, some stations integrate other sensors, such as broadband seismometers for the GEOFON network (GEOFON, 2020); automated cameras for glacier monitoring and mass balance calculations (Hoelzle et al., 2017) operated by the University of Fribourg, Switzerland (UniFr); GNSS receivers for investigation of glacier dynamics and glacier lake outburst flood (GLOF) monitoring (Zech et al., 2016 and 2018) operated by GFZ or measurements of snow water equivalent (SWE) with cosmic-ray neutron sensing (e.g. Schattan et al., 2018) installed by the University of Innsbruck, Austria (UIbk). Table 3 gives an overview of the sites of the additionally installed sensors.
Table 3Station list with additionally installed sensors. The column “Partner” in this table does not refer to the institute that is operating the station but to the owner of the additionally installed sensor.

3.1 Meteorological sensors
The compact weather transmitter (Vaisala WXT520 or WXT530) offers six meteorological parameters in one compact unit. It measures wind speed and direction, precipitation, atmospheric pressure, air temperature, and relative humidity. The wind is estimated by transit time through three equally spaced ultrasonic transducers on a horizontal plane. The precipitation sensor on top of the transmitter detects the impact of individual raindrops by noise detection with a piezoelectric sensor. Each raindrop produces a signal that can be converted directly to accumulated rainfall and hail (Vaisala WXT520, 2012) and to rain or hail intensity and duration. The PTU (pressure, temperature, humidity) module measures the atmospheric pressure, air temperature and humidity with a capacitive silicon element for the pressure, a capacitive ceramic element for the temperature and a capacitive thin film polymer element for the humidity. The PTU component is fixed inside a radiation shield to protect the sensor from direct sunlight.
The combined temperature and humidity sensor (Vaisala HMP45, Vaisala HMP155, Campbell Scientific CS215 or Galltec+Mela KPK 1/5 ME) provides air temperature and relative humidity data. The humidity measurement is based on the capacitive thin-film polymer probe which either absorbs or releases water vapour that changes the dielectric properties and, therefore, the capacitance of the sensor. The temperature measurement is based on the resistive platinum probe. Both probes are located at the tip of the sensor and are protected by a sintered Teflon filter. The sensor is fixed inside a radiation shield to protect the sensor from direct sunlight and is mounted on a steel mast.
The barometric pressure transducer (Setra 278 or Campbell Scientific CS115) measures the actual local atmospheric pressure. The sensor is fixed inside the station main box but is led to the outside of the box with a connecting air tube.
The alpine wind monitor (RM Young 05103-45) is used to measure the horizontal wind speed and direction. The wind speed is measured with a helicoid-shaped, four-blade propeller. The rotation of the propeller produces a signal proportional to the wind speed. The position of the vane is transmitted by a potentiometer, and its output voltage is proportional to the wind direction. The wind sensor is mounted on top of a 10 m steel mast.
The tipping bucket rain gauge (RM Young 52203 or Thies 5.4032.35.008) measures liquid precipitation with a tipping bucket mechanism. The measured liquid rain drains through a collection tube for verification of the total rainfall by mechanically tipping a scale. As the tipping bucket is not heated, winter precipitation is strongly biased in regions with frequent temperatures around or below 0 ∘C. The rain sensor is installed on a steel mast which is fixed with tensioning wires to reduce the influence of wind-induced vibrations.
The net radiometer (Hukseflux NR01) measures the incoming shortwave and longwave infrared radiation as well as the surface-reflected shortwave and outgoing longwave infrared radiation. It consists of a pyranometer and a pyrgeometer pair that faces upward and a complementary pair that faces downward. The pyranometers and pyrgeometers measure the shortwave and the far-infrared radiation, respectively. The sensor is fixed at a steel mast.
The water content reflectometer (Campbell Scientific CS616) measures the volumetric water content of porous media. It uses time-domain measurement methods that are sensitive to the dielectric permittivity of the used medium which changes with the water content of the soil material. In our installations, typically six sensors are installed in the ground at different depths.
The soil temperature probe (Campbell Scientific T107) uses a thermistor to measure the temperature and, therefore, can be used in air, water and soil. Typically, six sensors are installed in the ground at different depths adjacent to the water content reflectometers.
3.2 Hydrological sensors
The discharge measurement system (Sommer RQ-24) enables the contact-free measurement of the surface flow velocity plus the water level and automatically calculates the discharge quantity of the water using a user-defined river cross section. The measurement of flow velocity is based on the Doppler shift principle. The sensor calculates local flow by comparing an emitted frequency with the frequency reflected by the water surface (Doppler shift). The water level is measured by using time-delay measurements. The pulse radar emits impulses with a specific length in the lower micro-second range perpendicular to the water surface. The time delay between emission and reception of the impulse is proportional to the distance from the water surface. The calculation of the discharge is based on the continuity equation and determined from the cross section depending on the measured water level, the measured surface velocity and a pre-defined related k factor which represents the hydraulic properties of the river (e.g. roughness of river bed). While the water level and surface velocity are measured continuously, the cross section and k factor are pre-defined during the installation or changed during maintenance visits.
The snow pack analyser (Sommer SPA) in combination with a snow depth sensor (Sommer USH-8) provides different parameters of snow (see Fig. 7) like snow density, snow water equivalent (SWE) as well as contents of liquid water and ice. The snow depth is measured with an ultrasonic pulse as a distance between the sensor and the (snow) surface. To estimate the volume contents of the individual snow elements (ice, water, air), the complex impedance along a flat ribbon sensor is measured with different frequencies in the snowpack. Since the individual components have different dielectric constants, the volume contents of the liquid water and ice can be determined (Sommer SPA, 2010). The specific volume contents and the liquid water and ice content in the snow are used to calculate the snow density. A combination of the snow depth and the snow density defines the SWE. The content of liquid water and ice is measured at different positions in the snowpack with one sloping sensor (sensor 1) and three horizontal sensors with typical positions of 10 cm (sensor 2), 30 cm (sensor 3) and 50 cm (sensor 4) above the ground. Therefore, the sensor provides four different values for the snow density, the SWE, and content of liquid water and ice. The USH-8 snow depth sensor can also be operated independently without the SPA. In that case, only the snow depth is measured.
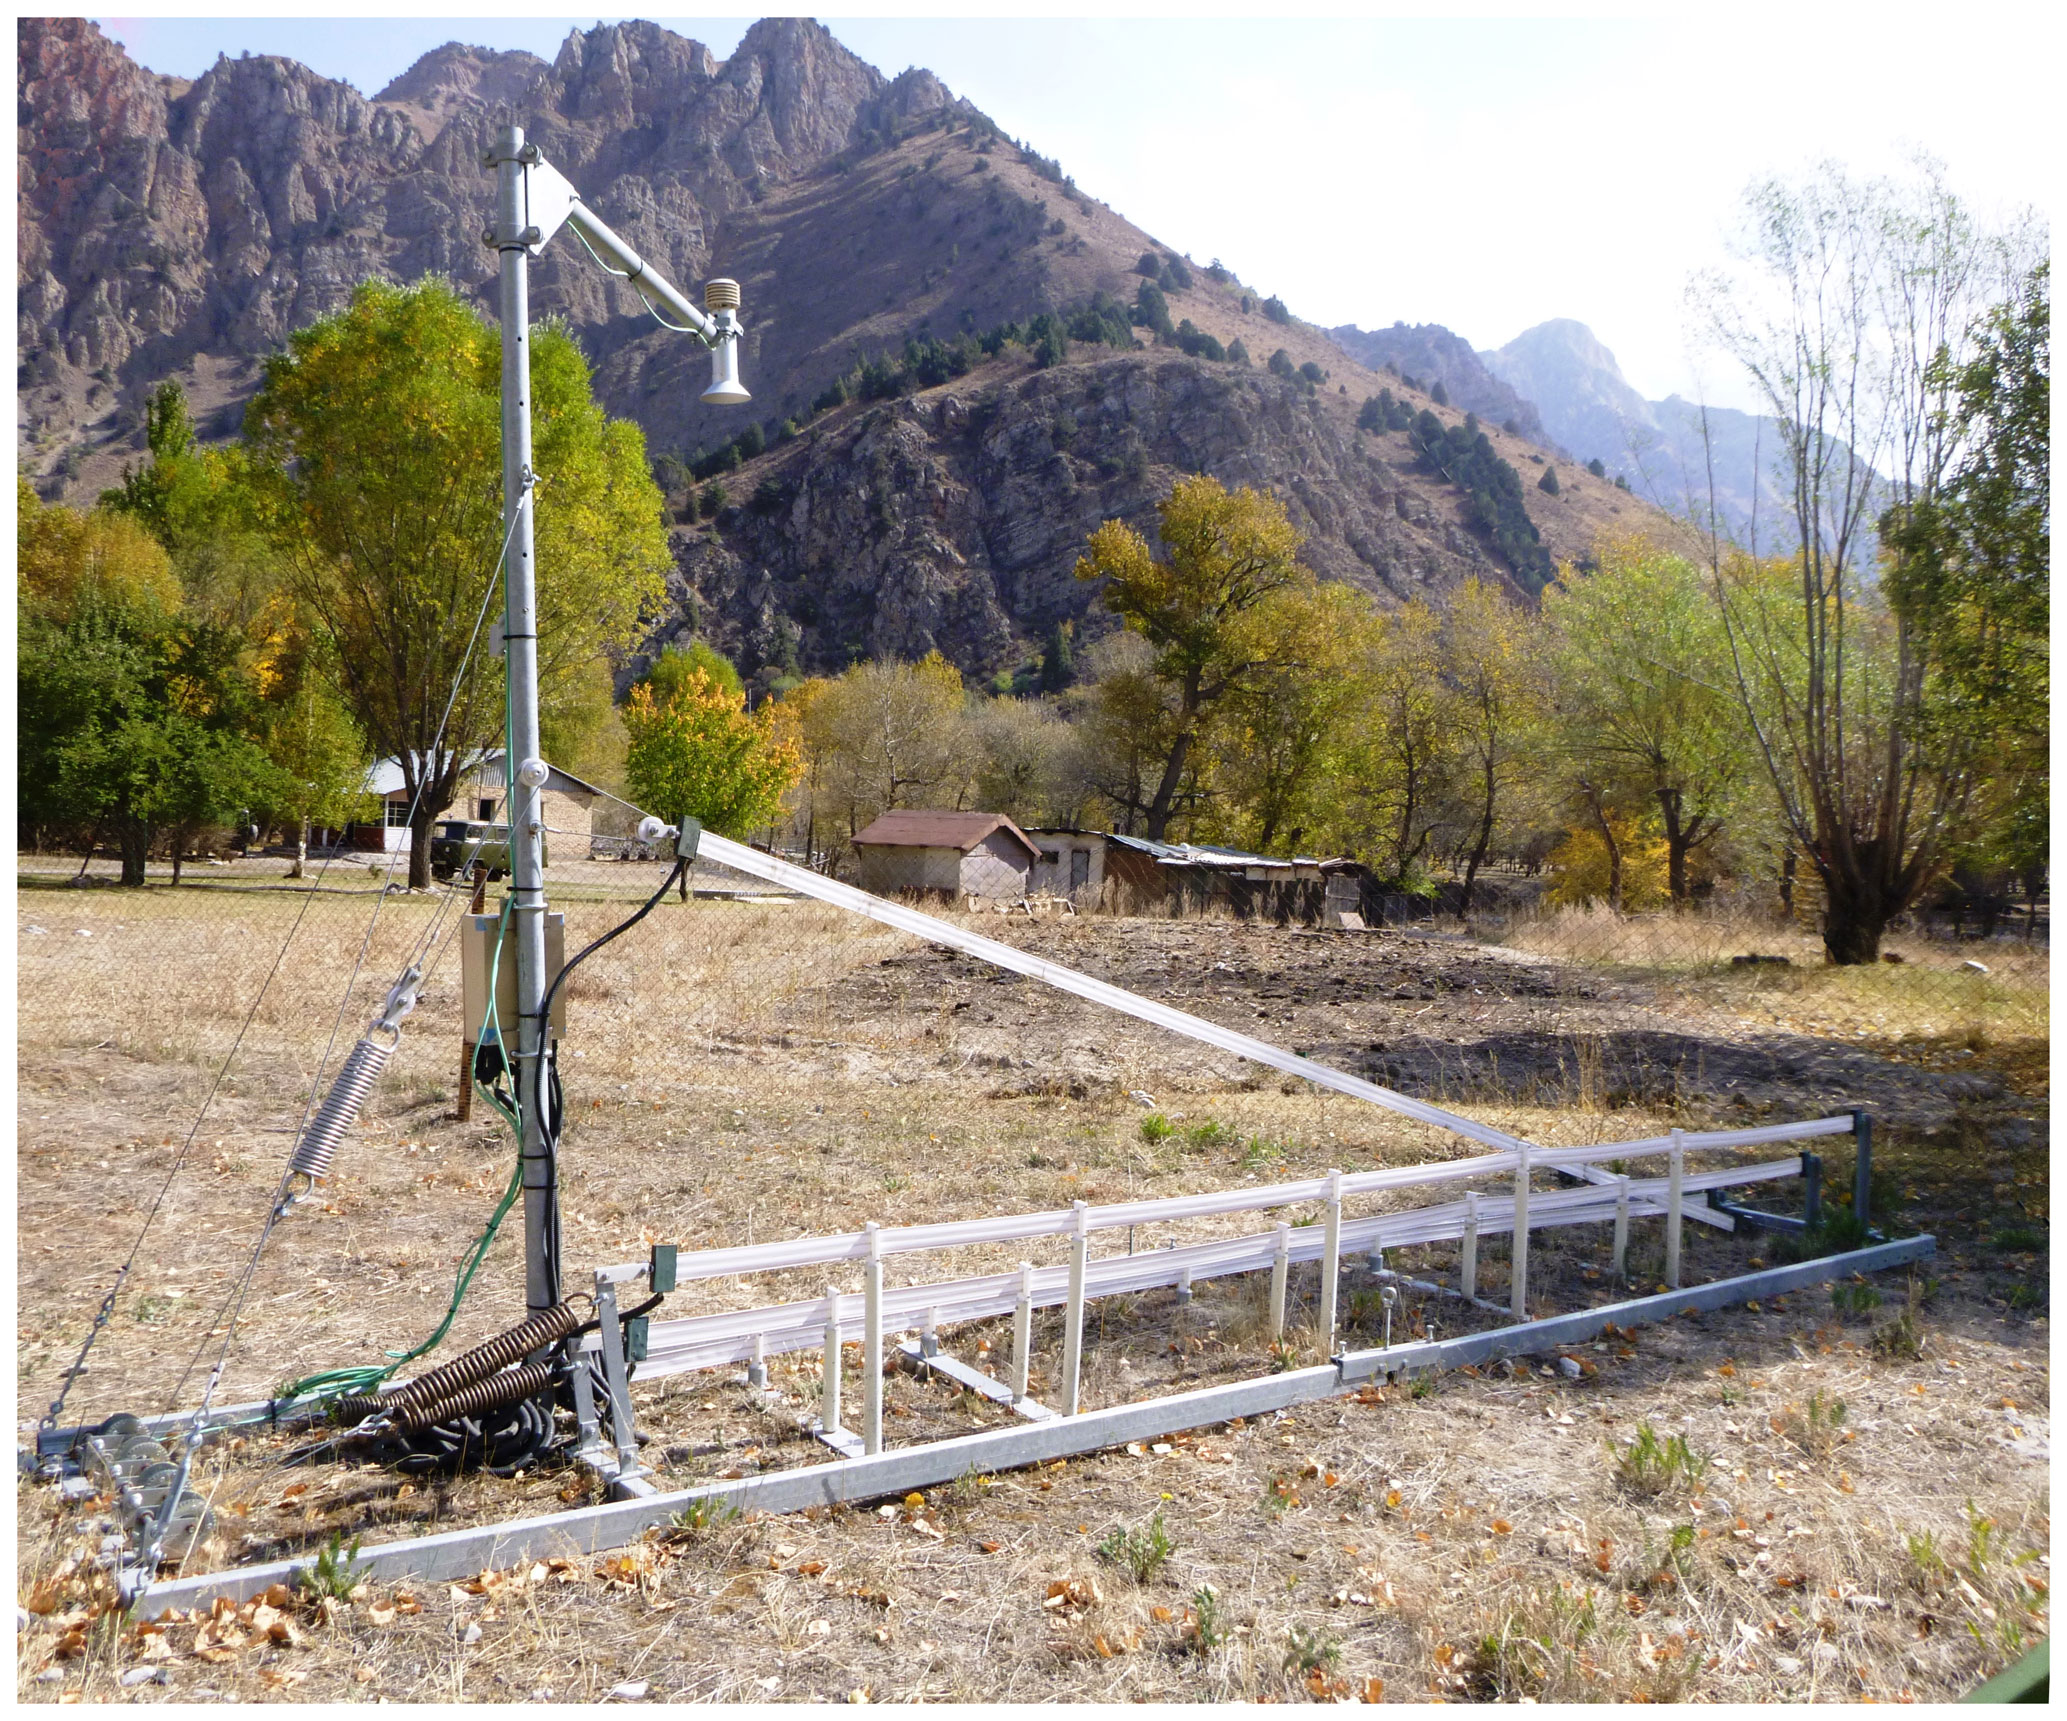
Figure 7Snow pack analyser (SPA) with the ultrasonic snow depth sensor (USH-8) and the four flat ribbon sensors (three horizontal and one sloping sensor) at the station Maydantal (MTAL).
Due to the remoteness of most stations, regular calibrations of sensors could not be performed. But sensors were exchanged when problems occurred. Notes to the station documentation can be found in Sect. 6.
The datasets comprise the data from all stations and their different sensor systems. The meteorological data have been sampled in 1 min intervals and then converted (average “_Avg”, maximum “_Max”, time of maximum “_TMax”, minimum “_Min”, or total “_Tot”) to 5 min data that are stored in meteorological files separated for each station. The time consistency is achieved by synchronizing the system daily with a GPS time signal.
4.1 Meteorological data
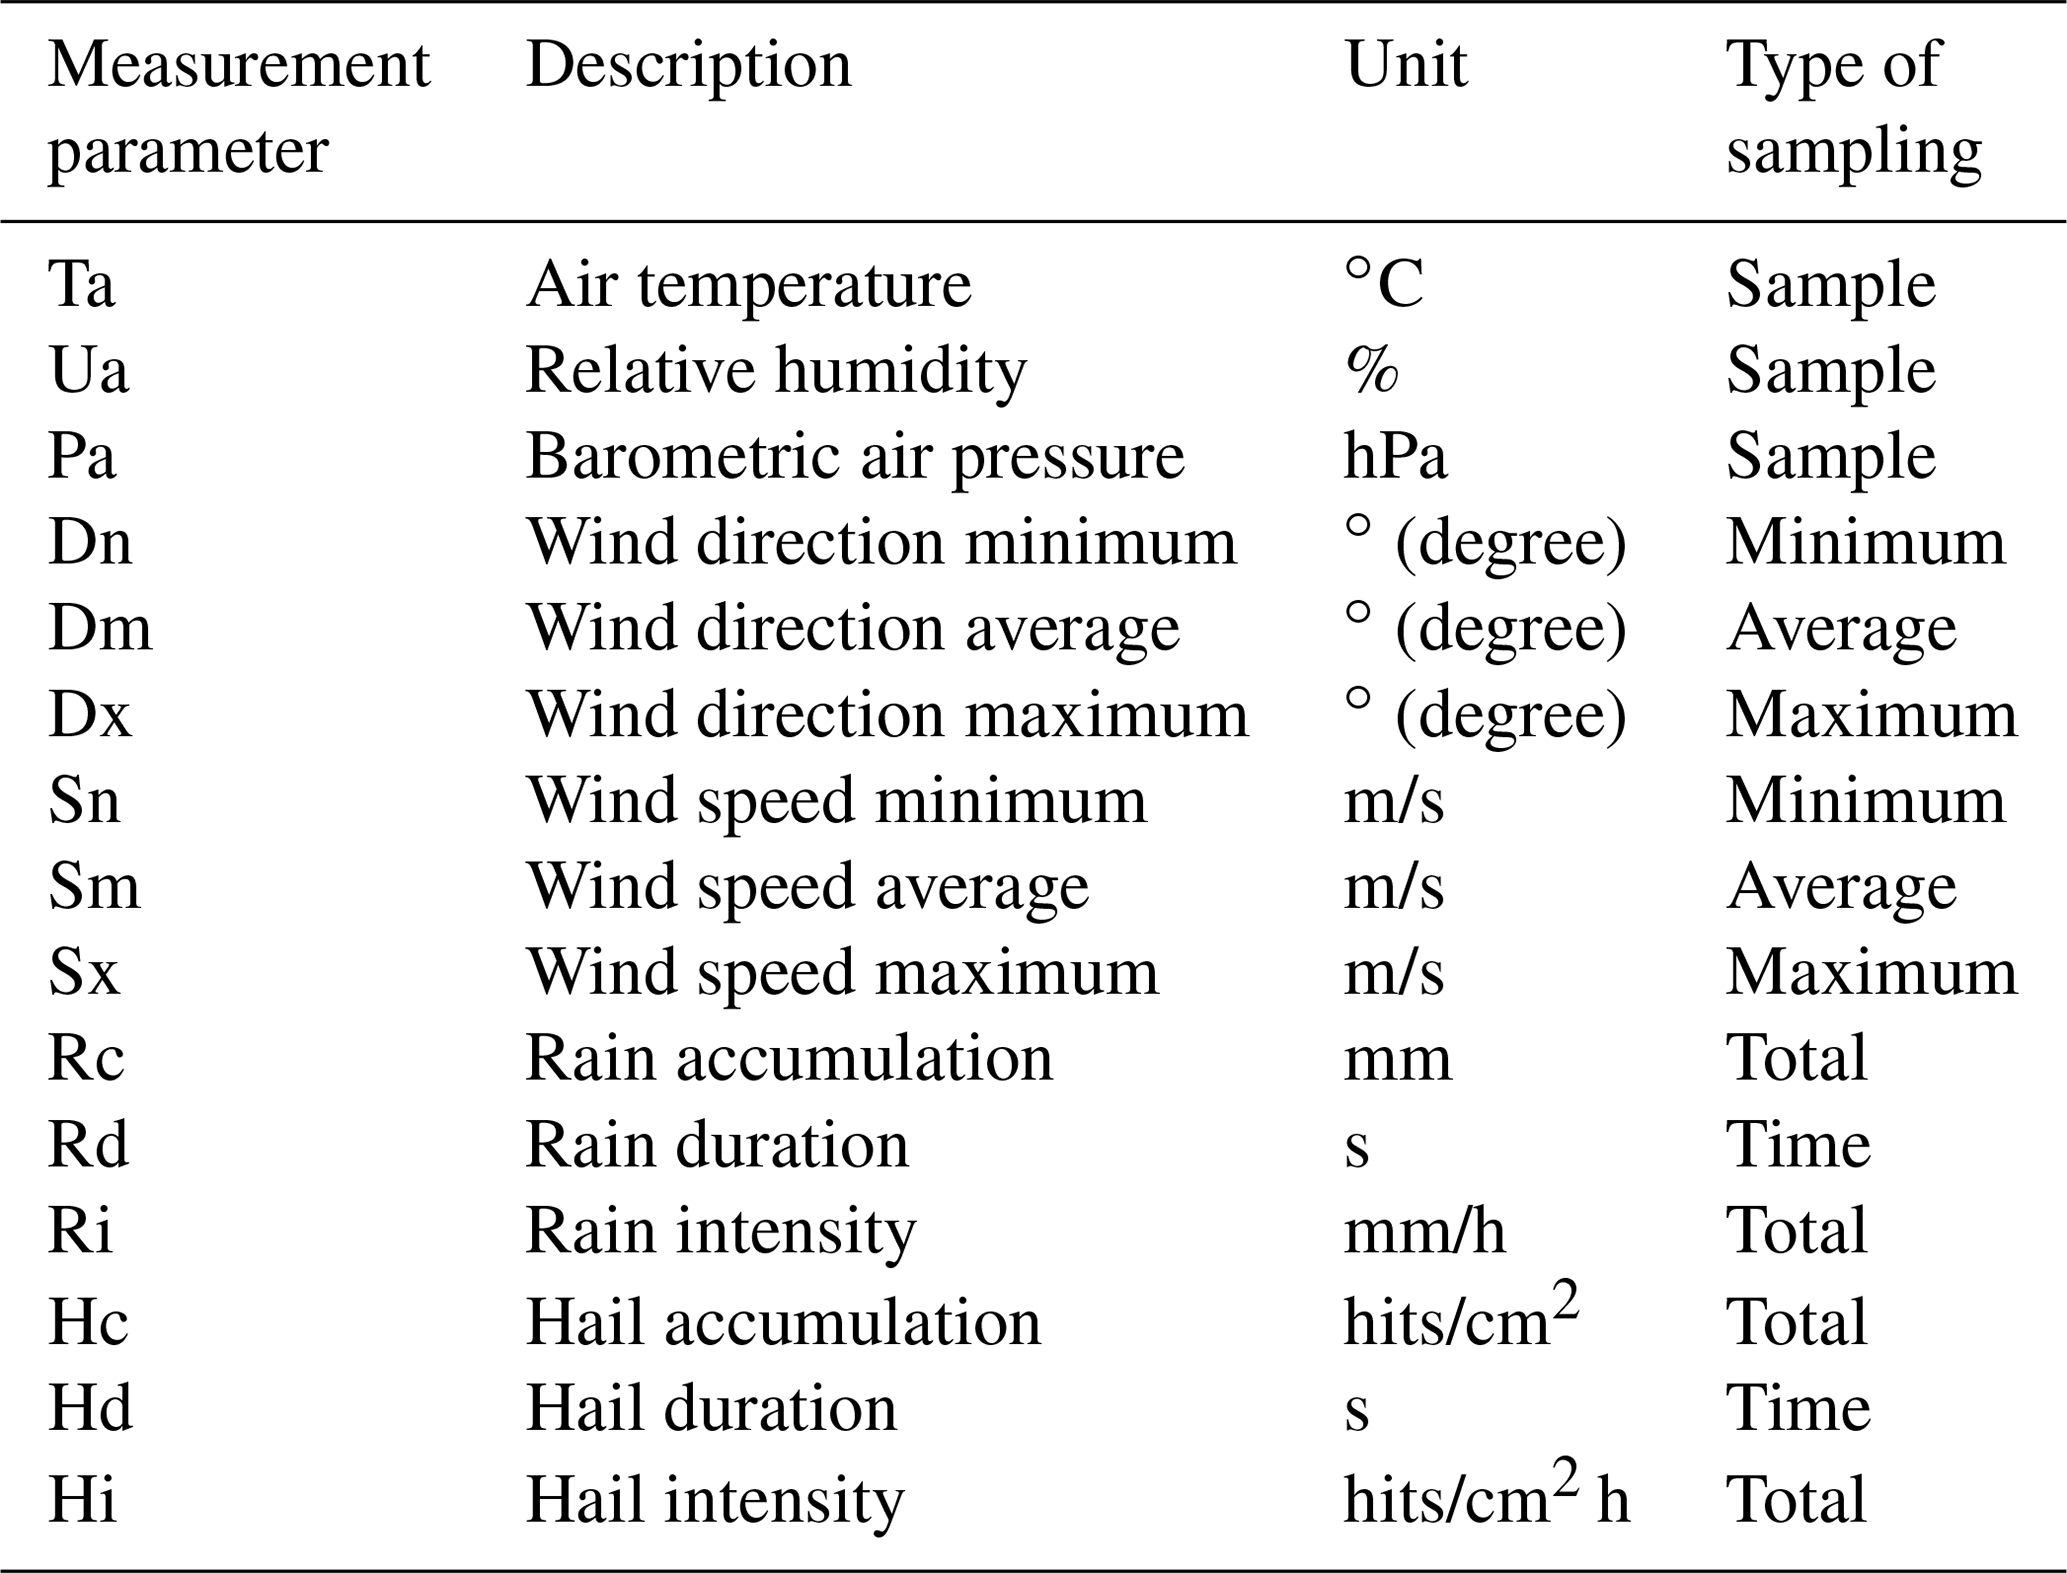
Table 4 lists all meteorological parameters for the first type of station (individual sensors) for each parameter with their abbreviation, unit and type of sampling to a 5 min value.
Table 4List of meteorological parameters measured by the individual sensors (station type one).

a These values are calculated by the data logger according to the manufacturer's instructions. b The # symbol indicates the sensor number (1–6) which corresponds to the local position in the ground (20–100 cm).
Within the datasets of all meteorological sensors, additional technical values (e.g. battery voltage, record number) are provided but not listed in Tables 4 and 5. Detailed information can be found in the data format specification which is part of the supporting material. Table 5 lists all meteorological parameters for the compact weather transmitter (station type two).
Table 5List of meteorological parameters measured by the compact weather transmitter (station type two).
4.2 Hydrological data
The snow parameters are measured every 15 min and stored in files, separately from the meteorological data. Table 6 lists the parameters of the snow system that are mainly used for hydrological studies. The system provides additional technical parameters to control the system. A detailed description can be found in the data format specification which is part of the supporting material.
Table 6List of snow parameters.
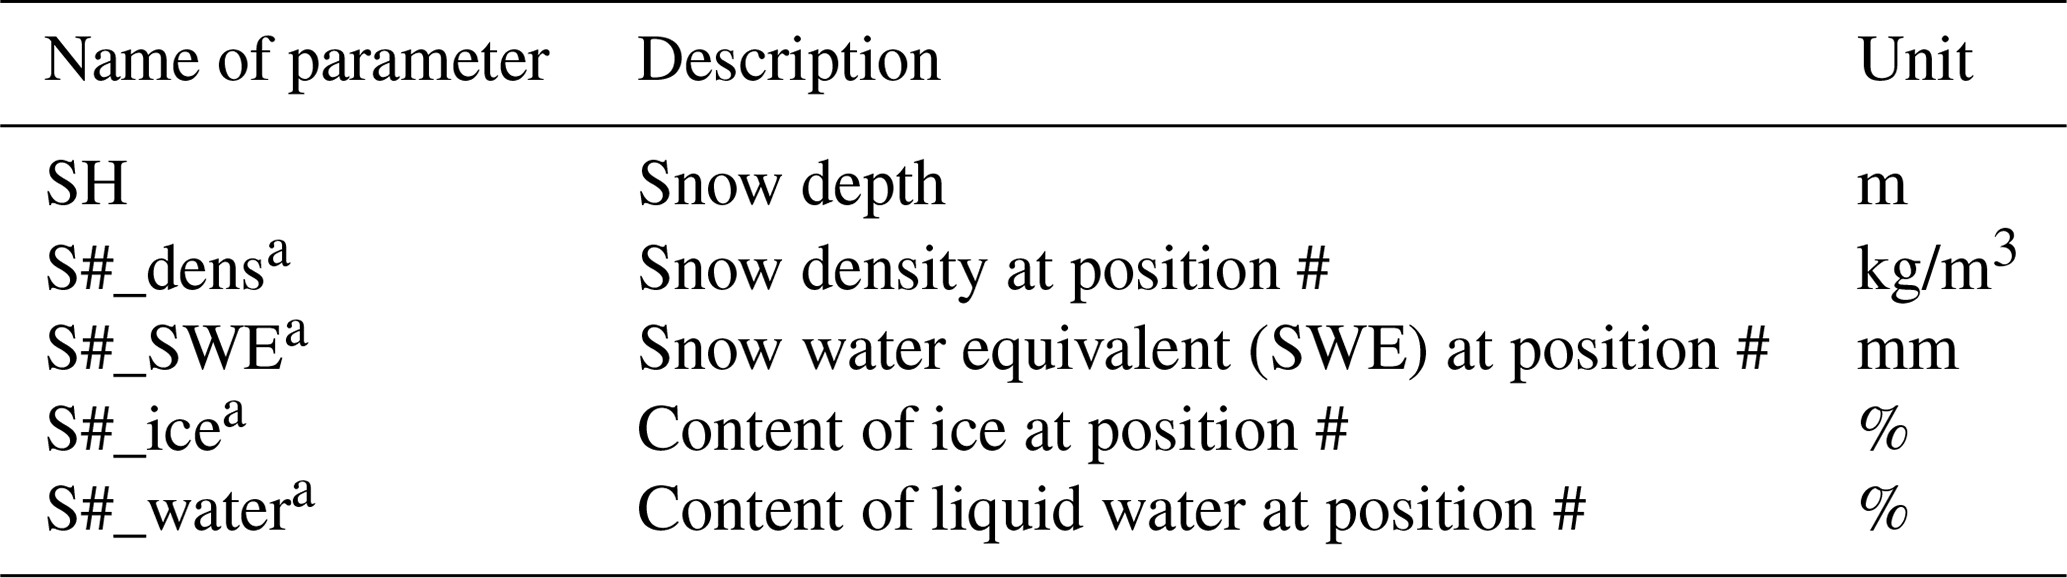
a The # symbol indicates the sensor number (1–4).
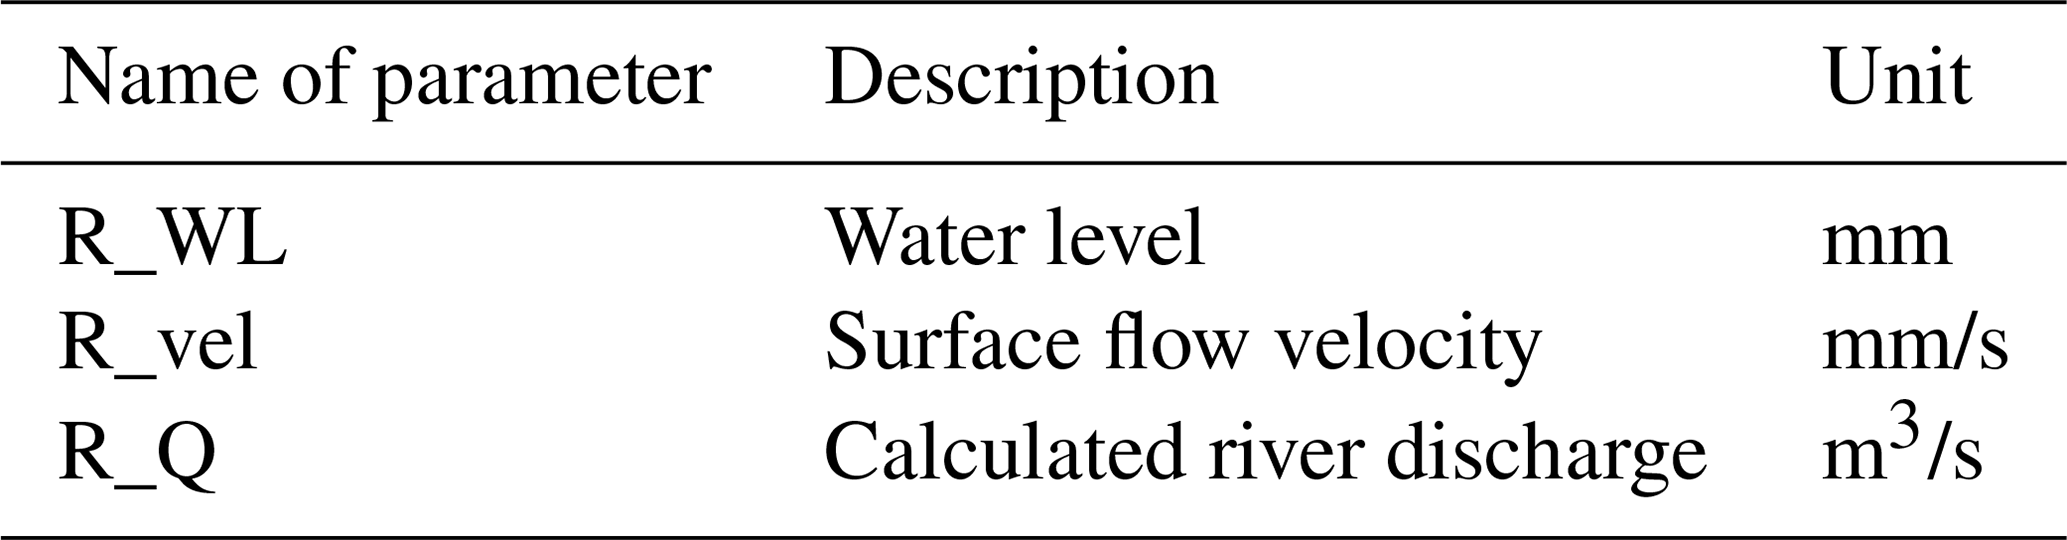
The river discharge system performs several consecutive scans of the water surface and checks the reflected value for spikes and weak signals before providing the measurement result. This can cause different measurement intervals depending on the turbulence of the water surface. Like the snow parameters, the discharge measurements are stored in separated files. Table 7 lists the hydrological parameters of the river discharge system. The system provides additional technical parameters to monitor the system state. A detailed description can be found in the data format specification which is part of the supporting material.
4.3 Sensor Data Storage System
The easy and open-access provision of meteorological and hydrological data has been the main objective of the ROMPS network operation. The data are open access for usage in environmental research and public information services, such as those the hydromet services provide, and to support information-based decision-making processes especially in the fields of water and land management and climate adaption. The files from the stations are forwarded directly to the open-access Sensor Data Storage System (SDSS) developed and hosted at CAIAG in Bishkek, Kyrgyzstan, and are therefore immediately available to the public. A graphical user interface (in English, Russian and German) offers the possibility of requesting the data interactively by selecting particular stations on a map or from a list of parameters. These values can be displayed as time series and downloaded as an Extensible Markup Language (XML) file. The SDSS web page is accessible through the following link: http://sdss.caiag.kg (last access: 22 February 2021).
4.4 Data completeness
All stations have been supplying data continuously since they were installed. But it should be noted that most of the stations are located in remote areas and could not be visited regularly or immediately after technical problems occurred. Therefore, failover procedures to check for stalled software programs and automatic restart scripts have been implemented to minimize or avoid resolvable errors or gaps. Nonetheless, hardware cannot always be secured against outages, especially in remote areas. Major data problems or severe sensor failures that emerged are listed in Sect. 5.
Additionally, due to errors in the data logger configuration, the data were not always sampled in 5 min intervals. At some stations, the data were sampled every minute or with other intervals which especially had an impact on the rain value and the wind speed maximum (gust) that should be a total over 5 min instead of over e.g. 1 min.
The available data have to be considered raw data that come directly from the stations and have not undergone any quality control (QC). The primary purpose of the network is to provide near-real-time data for the hydromet services without major time delay. Consistency in or QC on this dataset is beyond the scope of the network operation. QC should be performed at each hydromet service, as these are the responsible national agencies for the data exchange or, accordingly, for each single user.
5.1 General problems
Despite not undergoing QC, there are known quality issues that emerged during the operation of the stations, and they are mentioned in this paper to support further user quality management procedures. In particular the known problems such as incorrect configurations, wrong sensor installations or sensor failures that are not obvious for data users are explained below.
The rain sensor with a tipping bucket measurement principle is installed on a steel pillar which tends to vibrate during strong gusts. This can cause the tipping beam to tilt and hence falsely produce a tip, particularly in areas exposed to strong winds. As a consequence, all rain sensors were equipped with additional supporting crossbars to avoid this problem during the years 2013 and 2016. In the wintertime, the measurement of snow or the differentiation between snow and rain is challenging as the sensor is not heated. While parts of the snow in the sensor's cone evaporate, other parts melt and are registered as a measurement. Furthermore, the water from the raindrops has to pass a small funnel to reach the tipping bucket. This funnel can become blocked due to leaves or other dirt which may hamper the measurements and can lead to underestimated or delayed rain data. As there are no local operators at most stations or operators do not live close to the station, the rain sensors could be cleaned only during maintenance visits.
The soil sensors tend to have jumps in the measurements for reasons that are so far unknown and different time spans although the sensors have not been touched. In some areas, these sensors are affected by animals (e.g. at TARA by marmots) that nibble the cables. These jumps and sensor failures will not be mentioned in the following listings as these erroneous data are clearly identifiable.
All calculated values (see Table 4) of the solar radiation sensor and especially the albedo provide suspicious values close to sunrise and sunset. The albedo is calculated by the data logger as the quotient from the reflected and the incoming shortwave radiation. This can lead to erroneous results when the incoming values tend to be close to zero when it is (nearly) dark.
5.2 Problems in the meteorological measurements
Most problems resulted from sensor failures, errors or inconsistencies in the configuration, or incorrect technical installations of sensors. Table 8 lists all known problems of meteorological sensors at the stations. Erroneous data have not been removed from this dataset as they are the raw data coming directly from the station without any quality control. Details about sensor changes or cleaning of sensors can be found in the station documentation (Sect. 6).
Table 8List of problems in the meteorological data.

a May have been broken at any time between the maintenance visits on 24 July 2014 and 8 July 2015. b May have been broken at any time between the maintenance visits on 29 July 2017 and 13 August 2019.
5.3 Problems in the hydrological measurements
Besides incorrectly configured or connected sensors, problems with the snow depth sensor (values SH) occurred when referencing the time-delay distance measurement to a zero level of the snow or ground, respectively. Due to the accuracy of the system of ±4 mm and the condition of the ground reflection during the referencing process (e.g. fresh vegetation in spring or flat and dry in autumn), negative values close to zero can occur. Furthermore during the summer season at some places, growing grass can affect the measurement by producing a feigned snow depth. The signals of growing grass and sometimes the cutting of grass are clearly visibly as well as the time delay between melting of the snow and growing of grass or first snow in spring and autumn, respectively.
The calculated discharge values provided by the river discharge system are the combination from the measurements of the water level and surface velocity with the cross profile of the river and a k factor which accounts for the hydraulic model of the river flow. In particular, the river cross profile could not always be determined directly at the sensor's installation side but only some metres away. In addition, the cross-section profile may change over time leading to different k factors. Therefore, these values should be used with caution. The discharge values are always influenced by the inaccuracy of the cross profile of the river. Table 9 lists the known problems with the snow and the river discharge system.
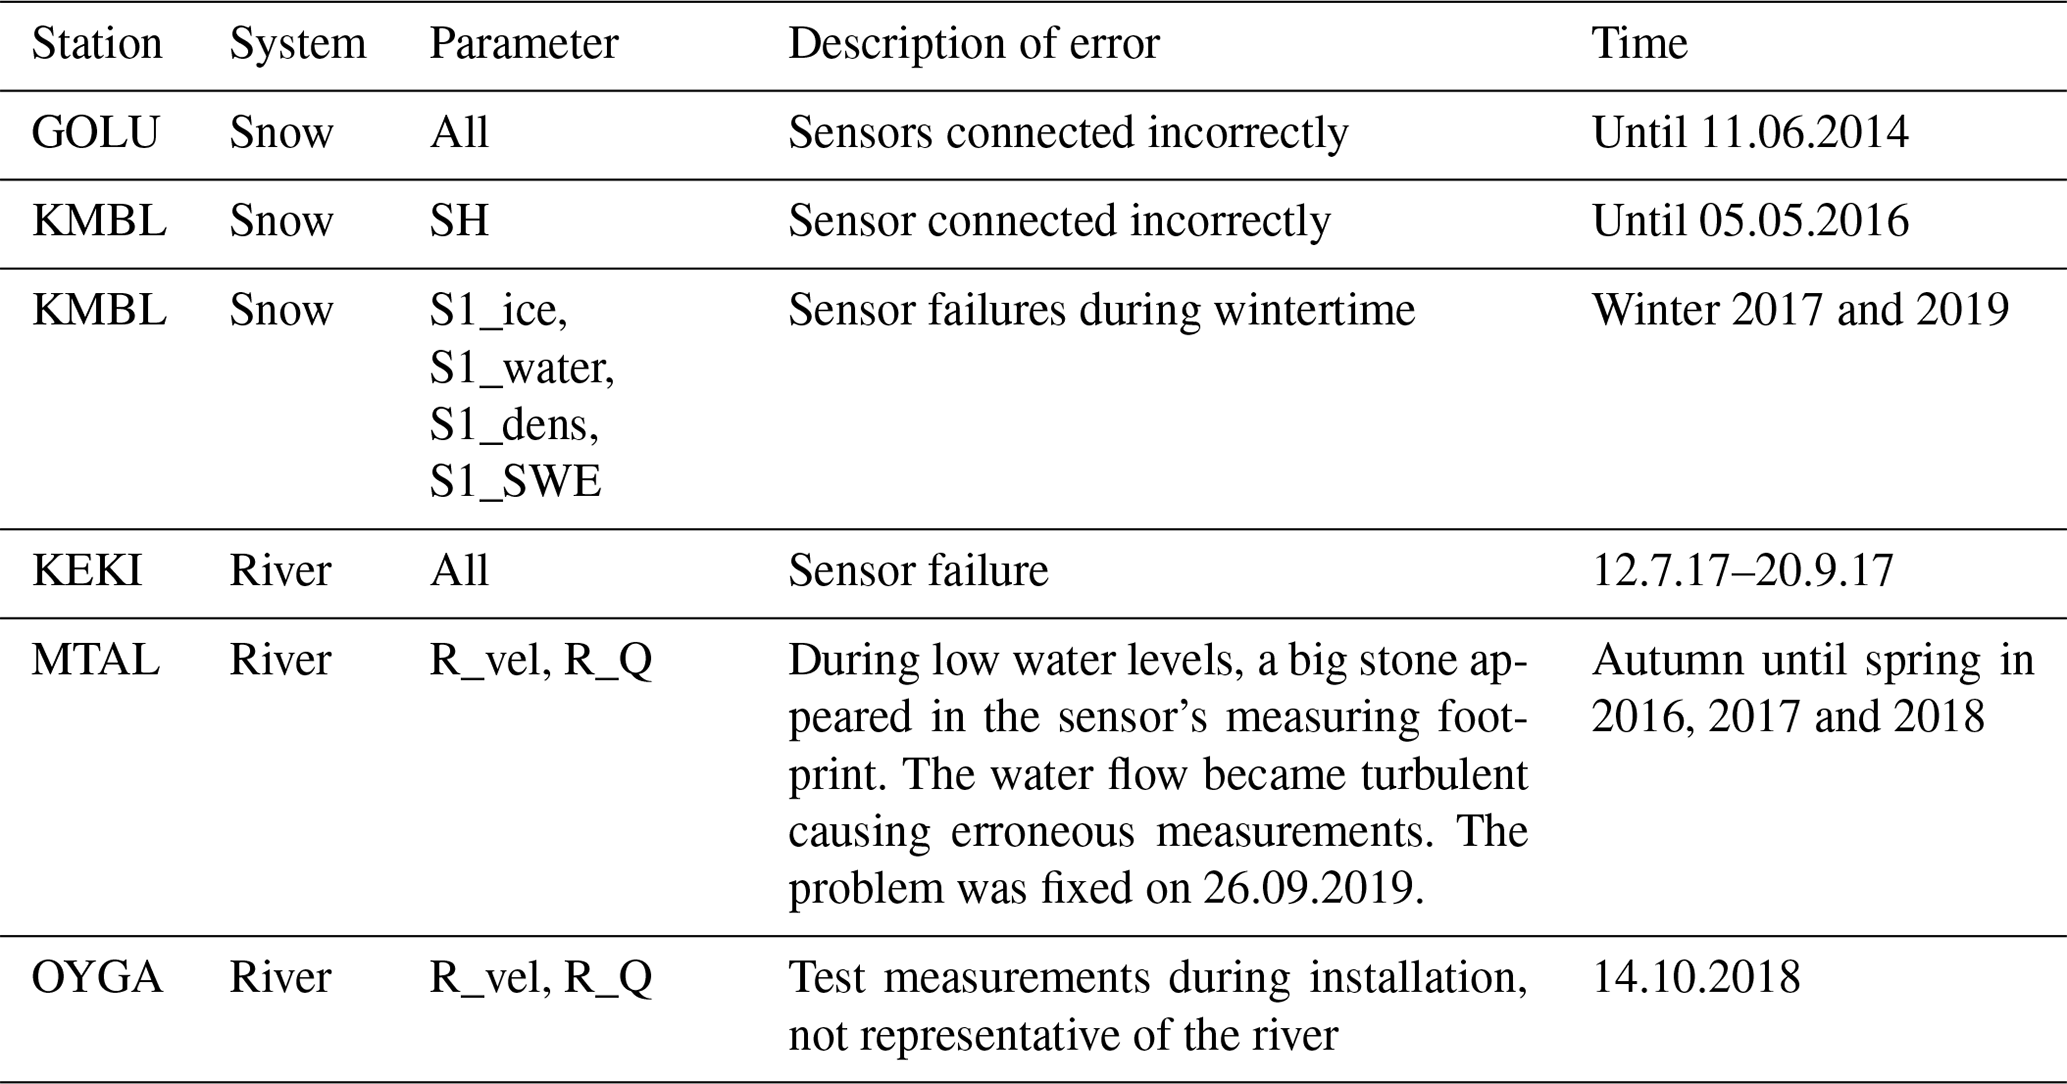
These are only the known and documented errors. This list is not intended to be exhaustive. For further usage of the data, different quality control procedures following the WMO or national standards should be implemented. An outlook and suggestions are given in Sect. 8. Additionally, more detailed information about the stations and installed sensors is provided by the station documentation (Sect. 6).
For each station extensive documentation exists describing the location and its surrounding, the technical installation of the station, and the local conditions which might be useful to further interpret certain variations in the sensor data. As the installations had to be adjusted to the local environment, installation maps and specific sensor installation (e.g. height or depth of sensors) are included in the documentation. Due to the stations' spatial expanse and difficult accessibility, maintenance activities could not be performed on a regular basis. Therefore, the documentation also lists all station visits and exchanges of sensors. The file containing the documentation is named as follows: XXXX-HMT-SED-GFZ.pdf with
-
XXXX being a four-letter code for station name,
-
HMT being the hydrometeorological station,
-
SED being a station exposure description, and
-
GFZ being the agency of originator.
These files are part of the supporting material.
7.1 File names
All data are stored in files in the American Standard Code for Information Interchange (ASCII) format containing typically 1 h of data (with sometimes different storage intervals). The different data types are separated into different files. The file name convention provides unique identifiers to distinguish between the different types of measurements as follows: XXXX-<type-of-data>-<timestamp>.log with
-
XXXX being a four-letter leading identifier for the station abbreviation (see Table 2);
-
<type of data> being
-
hymetd for meteorological parameters (station type one),
-
meteod for meteorological parameters (station type two),
-
RQ24 for river discharge parameters,
-
snow for snow parameters, and
-
USH8 for snow depth values; and
-
-
<timestamp> being the Unix time (seconds since 1 January 1970).
Due to historical reasons, a second file name convention exists which is used for the second type of station. These files are named as follows: XXXXWWWWD.met with
-
XXXX being a four-letter leading identifier for the station abbreviation (see Table 2);
-
WWWW being the GPS week (weeks since 6 January 1980); and
-
D being the day of week, where Sunday is 0.
The individual data files are packed into an archive with tar (Petersen, 2007) that contains 1 month of data files. This monthly file is additionally compressed with bzip2 (Petersen, 2007) to reduce the memory requirements.
The monthly archive files are named as follows: XXXX-<type-of-data>-<year>-<month>.tar.bz2 with
-
XXXX being a four-letter leading identifier for the station abbreviation (see Table 2);
-
<type of data> being
-
hymetd for meteorological parameters (station type one),
-
meteod for meteorological parameters (station type two),
-
RQ24 for river discharge parameters,
-
snow for snow parameters, and
-
USH8 for snow depth values;
-
-
<year> being the four-digit year; and
-
<month> being the two-digit month of the year.
After 1 year, these 12 monthly files are further archived and compressed into one file. The yearly files follow the same file name convention as the monthly files, but the month is missing in this file name:
XXXX-<type-of-data>-<year>.tar.bz2.
7.2 Data format
Two data formats exist for the different station types. As the sensors for station type one are connected to a Campbell data logger, the file format largely corresponds to the ASCII Campbell data format. It can be separated into header and data sections. The header section can be further divided into four parts containing one line each as follows:
-
general station information,
-
types of measured parameters listed with their abbreviation,
-
units of measured parameters, and
-
quantity representation (type of sampling) of measured parameters.
After this header section, the data section follows starting with date and time. All values corresponding to the same measurement time are written in one line and are comma-separated. A detailed description of all parts of the data format can be found in the data format specification (Schöne et al., 2020b) which is part of the supporting material.
The sensor at station type two provides data from a compact Vaisala weather transmitter retrieved directly on the PC by dedicated software. Therefore, the ASCII data format is different but can be also divided into a header and a data section.
The header section provides information about the following parameters:
-
requesting program name and version,
-
date and starting time of the measurements in this file,
-
sensor type, and
-
sampling rate.
After this section, the data section follows with the time of the measurement. All values are comma-separated but are divided into several lines depending on the meteorological parameter. A detailed description of all parts of the data format can be found in the data format specification (Schöne et al., 2020a) which is part of the supporting material.
To monitor the quality of the sensor data prior to their use in computation of climate variables, basic QC procedures should be applied. In accordance with international guidelines on QC procedures (WMO, 2017, 2004, 2018a) different levels of QC procedures are suggested and should be considered before using the data. The provided data can be seen as raw data without any QC implied. We recommend performing the following QC steps before using the data:
-
Integrity and syntax check.
Test to search for gross errors in the data (e.g. transmission or data storage errors like wrong characters).
-
Plausibility check (tolerance test for each sensor).
All instantaneous values should be checked against configurable range limits (e.g. sensor range limit specification). These limits are different for each meteorological or hydrological parameter.
-
Time consistency check.
Check the rate of change from the previous value, to test for the maximum allowed variability.
-
Persistence check.
Check the rate of change from the previous values, to test for the minimum required variability.
-
Internal consistency check.
Test to check parameters against each other for plausibility.
Initial efforts have already been made to implement the first two tests in the SDSS, but the remaining tests have not been developed yet. Additionally, the authors intend to prepare a publication of a quality controlled dataset at a later time.
The data described in this paper will be made publicly available as monthly and yearly data files separated for each station with the DOI https://doi.org/10.5880/GFZ.1.2.2020.002 (Zech et al., 2020). Additionally, the near-real-time data can be displayed and downloaded without any registration from the user interface SDSS at http://sdss.caiag.kg (last access: 22 February 2021).
In Central Asia, access to hydrometeorological data especially from remote areas is still limited. Within the CAWa project funded by the German Federal Foreign Office and with the support of the Global Change Observatory Central Asia (GCO-CA, GFZ) and the ACROSS (Helmholtz Association) initiative, the Remotely Operated Multi-Parameter Station (ROMPS) network has been installed in Kyrgyzstan, Tajikistan, Uzbekistan and Afghanistan. The technical concept has proven to withstand harsh and varying climate conditions without the necessity of permanent human interaction. The data presented in this paper are the result of the operation of these stations in the past 10 years. The stations provide raw hydrometeorological information such as air temperature, relative humidity, air pressure, wind speed and direction, precipitation, solar radiation, soil moisture, and soil temperature as well as snow and river discharge information where available. The data can be used for different applications ranging from scientific investigations of climate change, ground-truthing of remote-sensing-based technologies and improvement of weather forecasts to more politically based decisions on water management considerations and climate adaption strategies.
The supporting material to this article consists of the data format specification and the station documentation for each station. As most stations are operational, changes in these documents will occur but will be specified in the change log of each document. The supporting material is provided with the DOI https://doi.org/10.5880/GFZ.1.2.2020.002 (Zech et al., 2020).
-
Campbell Scientific CS115 (RPT410F-3143): available at: https://s.campbellsci.com/documents/us/product-brochures/b_cs115.pdf, last access: 27 May 2020.
-
Campbell Scientific CS215: available at: https://s.campbellsci.com/documents/af/manuals/cs215.pdf, last access: 27 May 2020.
-
Campbell Scientific CS616: available at: https://s.campbellsci.com/documents/eu/product-brochures/b_cs616.pdf, last access: 29 April 2020.
-
Campbell Scientific T107: available at: https://s.campbellsci.com/documents/us/product-brochures/b_107.pdf, last access: 29 April 2020.
-
Galltec+Mela KPK 1/5-ME: available at: https://www.galltec-mela.de/productsheet/meteorological-design/pc-me-rc-me/c24_en.pdf, last access: 27 May 2020.
-
Hukseflux NR01: available at: https://www.hukseflux.com/uploads/product-documents/NR01_v1727.pdf, last access: 29 April 2020.
-
RM Young 05103: available at: http://www.youngusa.com/products/7/5.html, last access: 17 September 2020.
-
RM Young 52203: available at: http://www.youngusa.com/products/3/18.html, last access 29 April 2020.
-
Setra: available at: https://www.setra.com/hubfs/Product_Data_Sheets/Setra_Model_278_Data_Sheet.pdf, last access: 29 April 2020.
-
Vaisala HMP155: available at: https://www.vaisala.com/en/file/97181/download?token=z1TJ7VhF, last access: 17 September 2020.
-
Vaisala WXT520: available at: https://s.campbellsci.com/documents/eu/product-brochures/b_wxt520.pdf, last access: 29 April 2020.
-
Sommer USH-8: available at: https://www.sommer.at/en/service-support/downloads/category/35-productleaflets-and-datasheets, last access: 27 May 2020.
-
Sommer SPA: available at: https://www.sommer.at/en/service-support/downloads/category/35-productleaflets-and-datasheets, last access: 17 September 2020.
-
Thies 5.4032.35.008: available at: https://www.thiesclima.com/db/dnl/THIES-catalog-precipitation-e-010131-07-11.pdf, last access: 27 May 2020.
CZ organized several fieldwork trips for station installation and maintenance works, compiled the data archives, the known quality issues, and the supplementary documentation with support by JI and TS. The continuous station operation was performed jointly by CZ, JI and TS. NS, TQ, MK and HT prepared and assembled the technical parts of the system and supported the on-site technical installations. AZ designed and implemented the SDSS and keeps it operational. The partners from the Central Asian countries Kyrgyzstan, Tajikistan, Uzbekistan and Afghanistan provided the necessary permits for the station installations and essential support for building and maintaining the stations and for continuous data transmission during the last few years in their countries. This applies in particular to AZ and AS for the stations ABRA, ALAI, ALA6, ASAI, BALY, GOLU, HM01, KEKI, MRZ1, SARY, TAR and ZOKA in Kyrgyzstan; KZ and KT for the stations MTAL, OYGA and KMBL in Uzbekistan; YT for the station MADK in Uzbekistan; SO for the stations DUPU and AYVA in Tajikistan; and ZP for the station KABU in Afghanistan. KUS drafted the very first version of this paper many years ago. AG fostered the cooperation and negotiations especially between Uzhydromet and GFZ and supported the fieldwork. BM enabled the numerous station installations in Kyrgyzstan by providing support from CAIAG. CZ wrote this paper with essential support by TS. All authors revised and approved the content of the paper.
The authors declare that they have no conflict of interest.
The presented data and activities have been generously funded in the frame of the CAWa project (http://www.cawa-project.net, last access: 22 February 2021) by the German Federal Foreign Office as part of the German Water Initiative for Central Asia (the so-called Berlin Process, grant AA7090002). Additional funding for the installation and the long-term operation of the monitoring network was and is being provided by the GFZ German Research Centre for Geosciences in the frame of the Global Change Observatory Central Asia (GCO-CA) and the Advanced Remote Sensing – Ground Truth Demo and Test Facilities (ACROSS) projects of the Helmholtz Association.
We appreciate the close cooperation with our partners such as the Central-Asian Institute for Applied Geosciences (CAIAG) in Kyrgyzstan; the national hydrometeorological services of Kyrgyzstan, Tajikistan and Uzbekistan; the Ulugh Beg Astronomical Institute at the Academy of Sciences of the Republic of Uzbekistan; and the Kabul Polytechnic University of Afghanistan. Their generous support and help made the site selections and station installations possible. In particular, at CAIAG the support of Abdysamat Shakirov, Mikhail Borisov, Talant Altynbek uulu and Zholdoshbek Okoev is highly appreciated. We also thank Alexander Merkushkin for various discussions and his help during the Abramov installation and his colleagues Tokhir Gafurov, Evgeniy Pavlov, Vasiliy Proxorov, Dmitriy Soloyd, Djura Sadikov, Anatholy Skorokhodov and Olga Mokh of UzHM (Uzbekistan) for supporting all station activities in Uzbekistan. From TjHM we appreciate the help and support from Muhiddin Yakubov.
In addition, we would like to thank the researchers of the University of Fribourg (World Glacier Monitoring Service) for inspiring cooperation and interesting discussions, in particular Martin Hoelzle for the proposal to integrate an optical camera system for glacier monitoring at Abramov Glacier and his team including Martina Barandun and David Sciboz for the support during and after the installation of the Abramov and Golubin stations. This work is supported through the Capacity Building and Twinning for Climate Observing Systems Program (CATCOS) of the Swiss Agency for Development and Cooperation. Furthermore, the help and support of Najibullah Kakar of the Norwegian Afghanistan Committee for the already-installed station as well as the station which is in progress in Afghanistan is highly appreciated. At GFZ, we would like to thank the GEOFON team and all other colleagues who supported the station preparation and various travels to Central Asia.
This research has been supported by the German Federal Foreign Office (grant no. AA7090002).
This paper was edited by David Carlson and reviewed by four anonymous referees.
Bernauer, T. and Siegfried, T.: Climate change and international water conflict in Central Asia, J. Peace Res., 49, 227–239, https://doi.org/10.1177/0022343311425843, 2012.
Finaev, A.: Review of hydrometeorological observations in Tajikistan for the period of 1990–2005, Assessment of Snow, Glacier and Water Resources in Asia, edited by: Braun, L. N., Hagg, W., Severskiy, I. V., and Young, G., Selected papers from the Workshop in Almaty, Kazakhstan, 2006, UNESCO-IHP and German IHP/HWRP National Committee, IHP/HWRP-Berichte 8, 55–64, Koblenz, 2009.
GEOFON: KC Seismic Network, available at: https://geofon.gfz-potsdam.de/waveform/archive/network.php?ncode=_KC, last access: 29 April 2020.
Glazirin, G. E.: Review of hydrometeorological observations in Tajikistan for the period of 1990–2005, Assessment of Snow, Glacier and Water Resources in Asia, edited by: Braun, L. N., Hagg, W., Severskiy, I. V., and Young, G., Selected papers from the Workshop in Almaty, Kazakhstan, 2006, UNESCO-IHP and German IHP/HWRP National Committee, IHP/HWRP-Berichte 8, 55–64, Koblenz, 2009.
HELMHOLTZ Society: Helmholtz-Roadmap für Forschungsinfrastrukturen, available at: https://www.helmholtz.de/fileadmin/user_upload/publikationen/Helmholtz_Roadmap_2015_web_korr_150921.pdf (last access: 17 September 2020), 2015.
Hoelzle, M., Azisov, E., Barandun, M., Hagg, W., Huss, M., Kriegel, D., Machguth, H., Mandychev, A., Merkushkin, A., Moldobekov, B., Schöne, T., Thoss, H., Vorogushyn, S., and Zemp, M.: Re-establishment of long-term glacier monitoring in Kyrgyzstan and Uzbekistan, Central Asia, Geophys. Res. Abstr., Vol. 14, EGU2012-10206, EGU General Assembly 2012, Vienna, Austria, 2012.
Hoelzle, M., Azisov, E., Barandun, M., Huss, M., Farinotti, D., Gafurov, A., Hagg, W., Kenzhebaev, R., Kronenberg, M., Machguth, H., Merkushkin, A., Moldobekov, B., Petrov, M., Saks, T., Salzmann, N., Schöne, T., Tarasov, Y., Usubaliev, R., Vorogushyn, S., Yakovlev, A., and Zemp, M.: Re-establishing glacier monitoring in Kyrgyzstan and Uzbekistan, Central Asia, Geosci. Instrum. Method. Data Syst., 6, 397–418, https://doi.org/10.5194/gi-6-397-2017, 2017.
Kuzmichenok, V.: Review of hydrometeorological observations in Tajikistan for the period of 1990–2005, Assessment of Snow, Glacier and Water Resources in Asia, edited by: Braun, L. N., Hagg, W., Severskiy, I. V., and Young, G., Selected papers from the Workshop in Almaty, Kazakhstan, 2006, UNESCO-IHP and German IHP/HWRP National Committee, IHP/HWRP-Berichte 8, 55–64, Koblenz, 2009.
Petersen, R.: Linux: The Complete Reference, McGRaw-Hill Education, 6th Edn., 2007.
Schattan, P., Baroni, G., Oswald, S., Fey, C., Schöber, J., and Achleitner, S.: Vom Punkt zur Fläche in der Messung des Wasseräquivalents der Schneedecke – Mehrwert von Cosmic-Ray Neutron Sensoren in der regionalen Schneemodellierung, Österr. Wasser Abfallw., 70, 497–506, https://doi.org/10.1007/s00506-018-0500-x, 2018.
Schöne, T., Zech, C., Unger-Shayesteh, K., Rudenko, V., Thoss, H., Wetzel, H.-U., Gafurov, A., Illigner, J., and Zubovich, A.: A new permanent multi-parameter monitoring network in Central Asian high mountains – from measurements to data bases, Geosci. Instrum. Method. Data Syst., 2, 97–111, https://doi.org/10.5194/gi-2-97-2013, 2013.
Schöne, T., Dusik, E., Illigner, J., and Klein, I.: Water in Central Asia: Reservoir Monitoring with Radar Altimetry Along the Naryn and Syr Darya Rivers, in: International Symposium on Earth and Environmental Sciences for Future Generations, International Association of Geodesy Symposia, 147, Cham, Springer Verlag, 349–357, https://doi.org/10.1007/1345_2017_265, 2018a.
Schöne, T., Zubovich, A., Zech, C., Illigner, J., Sharshebaev, A., Mandychev, D., Shakirov, A., Moldobekov, B., Lauterjung, J.: Water monitoring in Central Asia – the Central Asian water project (CAWA) = in: Novel methods and results of landscape research in Europe, Central Asia and Siberia, Vol. I Landscapes in the 21th Century: Status Analyses, Basic Processes and Research Concepts, edited by: Sychev, V. G. and Mueller, L., Moscow, Russian Academy of Science, 90–94, https://doi.org/10.25680/2697.2018.71.90.013, 2018b.
Schöne, T., Zubovich, A., Zech, C., Illigner, J., Sharshedaev, A., Mandychev, D., Shakirov, A., Stolarczuk, N., Haghshenas Haghighi, M., Gerlitz, L., Gafurov, A., Moldobekov, B., and Lauterjung, J.: In Situ and Remote Water Monitoring in Central Asia – The Central Asian Water (CAWa) Network, in: Current Trends in Landscape Research, Innovations in Landscape Research, edited by: Müller, L. and Eulenstein, F., Cham, Springer, 599–610, https://doi.org/10.1007/978-3-030-30069-2_27, 2019.
Schöne, T., Zech, C., and Illigner, J.: GITW-SSP-FMT-GFZ-003: Remotely Operated Multi-Parameter Stations, System Software Output Format Specification; METEOD, Potsdam: GFZ German Research Centre for Geosciences, available at: https://gfzpublic.gfz-potsdam.de/pubman/item/item_5002432_6 (last access: 5 December 2020a.
Schöne, T., Zech, C., and Illigner, J.: CAWA-SSP-FMT-GFZ-006: Remotely Operated Multi-Parameter Stations; System Software Output Format Specification, CRD, Potsdam, GFZ German Research Centre for Geosciences, available at: https://gfzpublic.gfz-potsdam.de/pubman/item/item_5002433_4 (last access: 5 December 2020b.
Siegfried, T., Bernauer, T., Guiennet, R., Sellars, S., Robertsdorn, A., Mankin, J., Bauer-Gottwein, P., and Yakovlev, A.: Will climate change exacerbate water stress in Central Asia?, Climatic Change, 112, 881–899, https://doi.org/10.1007/s10584-011-0253-z, 2012.
Sommer SPA: Snow Pack Analyser, available at: https://www.hydrologicalusa.com/fileadmin/user_upload/User_manual_SPA_V01_03_V03_28_ENG.pdf (last access: 3 March 2021), 2010.
Unger-Shayesteh, K., Vorogushyn, S., Farinotti, D., Gafurov, A., Duethmann, D., Mandychev, A., and Merz, B.: What do we know about past changes in the water cycle of Central Asian headwaters? A review, Global Planet. Change, 110, 4–25, https://doi.org/10.1016/j.gloplacha.2013.02.004, 2013.
Unger-Shayesteh, K., Conrad, C., Schöne, T., and Moldobekov, B.: Reasonable Decision-Making on Land and Water Management in Central Asia: how earth observation technologies can contribute, analytical notes from the “German Water Initiative for Central Asia”, Potsdam, GFZ German Center for Geosciences, 6 pp., https://doi.org/10.2312/5.4.2015.001e, 2015.
WMO: Guidelines on Quality Control Procedures for Data from Automatic Weather Stations, 2004, World Meteorological Organization, Commission for Instruments and Methods of Observation, Geneva, Switzerland, 204.
WMO: Guide to the Global Observing System, WMO-No 488, 2010 Edn. updated 2017, World Meteorological Organization, Geneva, Switzerland, 2017.
WMO: Guide to Climatological Practices, WMO-No. 100, 2018, World Meteorological Organization, Geneva, Switzerland, 2018a.
WMO: Guide to Instruments and Methods of Observation, Volume I – Measurement of Meteorological Variables, WMO-No. 8, 2018, World Meteorological Organization, Geneva, Switzerland, 2018b.
Zech, C., Schöne, T., Neelmeijer, J., Zubovich, A., and Galas, R.: Geodetic Monitoring Networks: GNSS-derived Glacier Surface Velocities at the Global Change Observatory Inylchek (Kyrgyzstan), in: IAG 150 Years: Proceedings of the IAG Scientific Assembly in Potsdam, Germany, 2013, edited by: Rizos, C. and Willis, P., International Association of Geodesy Symposia, Cham, Springer International Publishing, 143, 557–563, https://doi.org/10.1007/1345_2015_38, 2016.
Zech, C., Schöne, T., Neelmeijer, J., and Zubovich, A.: Continuous Kinematic GPS Monitoring of a Glacier Lake Outburst Flood, in: International Symposium on Earth and Environmental Sciences for Future Generations, (International Association of Geodesy Symposia, Cham, Springer, 147, 339–347, https://doi.org/10.1007/1345_2016_246, 2018.
Zech, C., Schöne, T., Illigner, J., Stolarczuk, N., Queisser, T., Köppl, M., Thoss, H., Zubovich, A., Sharshebaev, A., Zakhidov, K., Toshpulatov, Kh., Tillayev, Y., Olimov, S., Paiman, Z., Unger-Shayesteh, K., Gafurov, A., and Moldobekov, B.: Hydrometeorological data from a Remotely Operated Multi-Parameter Station network in Central Asia, V. 1.0, GFZ Data Services, https://doi.org/10.5880/GFZ.1.2.2020.002, 2020.
Zubovich, A., Schöne, T., Metzger, S., Mosienko, O., Mukhamediev, S., Sharshebaev, A., and Zech, C.: Tectonic interaction between the Pamir and Tien Shan observed by GPS, Tectonics, 35, 283–292, https://doi.org/10.1002/2015TC004055, 2016.
- Abstract
- Introduction
- Station network
- Instruments and data storage
- Datasets
- Data quality
- Station documentation
- File name convention and data format
- Outlook
- Data availability
- Summary
- Supporting material
- Appendix A: Data sheets
- Author contributions
- Competing interests
- Acknowledgements
- Financial support
- Review statement
- References