the Creative Commons Attribution 4.0 License.
the Creative Commons Attribution 4.0 License.
 | 24 Mar 2021
High-resolution global map of smallholder and industrial closed-canopy oil palm plantations
Adrià Descals
Serge Wich
Erik Meijaard
David L. A. Gaveau
Stephen Peedell
Zoltan Szantoi
Oil seed crops, especially oil palm, are among the most rapidly expanding agricultural land uses, and their expansion is known to cause significant environmental damage. Accordingly, these crops often feature in public and policy debates which are hampered or biased by a lack of accurate information on environmental impacts. In particular, the lack of accurate global crop maps remains a concern. Recent advances in deep-learning and remotely sensed data access make it possible to address this gap. We present a map of closed-canopy oil palm (Elaeis guineensis) plantations by typology (industrial versus smallholder plantations) at the global scale and with unprecedented detail (10 m resolution) for the year 2019. The DeepLabv3+ model, a convolutional neural network (CNN) for semantic segmentation, was trained to classify Sentinel-1 and Sentinel-2 images onto an oil palm land cover map. The characteristic backscatter response of closed-canopy oil palm stands in Sentinel-1 and the ability of CNN to learn spatial patterns, such as the harvest road networks, allowed the distinction between industrial and smallholder plantations globally (overall accuracy %), outperforming the accuracy of existing regional oil palm datasets that used conventional machine-learning algorithms. The user's accuracy, reflecting commission error, in industrial and smallholders was 88.22 ± 2.73 % and 76.56 ± 4.53 %, and the producer's accuracy, reflecting omission error, was 75.78 ± 3.55 % and 86.92 ± 5.12 %, respectively. The global oil palm layer reveals that closed-canopy oil palm plantations are found in 49 countries, covering a mapped area of 19.60 Mha; the area estimate was 21.00 ± 0.42 Mha (72.7 % industrial and 27.3 % smallholder plantations). Southeast Asia ranks as the main producing region with an oil palm area estimate of 18.69 ± 0.33 Mha or 89 % of global closed-canopy plantations. Our analysis confirms significant regional variation in the ratio of industrial versus smallholder growers, but it also confirms that, from a typical land development perspective, large areas of legally defined smallholder oil palm resemble industrial-scale plantings. Since our study identified only closed-canopy oil palm stands, our area estimate was lower than the harvested area reported by the Food and Agriculture Organization (FAO), particularly in West Africa, due to the omission of young and sparse oil palm stands, oil palm in nonhomogeneous settings, and semi-wild oil palm plantations. An accurate global map of planted oil palm can help to shape the ongoing debate about the environmental impacts of oil seed crop expansion, especially if other crops can be mapped to the same level of accuracy. As our model can be regularly rerun as new images become available, it can be used to monitor the expansion of the crop in monocultural settings. The global oil palm layer for the second half of 2019 at a spatial resolution of 10 m can be found at https://doi.org/10.5281/zenodo.4473715 (Descals et al., 2021).


Crops that produce vegetable oils, such as soy, rapeseed, oil palm, and sunflower, take up ca. 6 % of all agricultural land and ca. 2.3 % of the total global land area and are among the world's most rapidly expanding crop types (OECD, 2018). Demand for vegetable oils is increasing with one estimate foreseeing an increase from 205 Mt in 2019 (OECD, 2018) to 310 Mt in 2050 (Byerlee et al., 2017). This has created a need to optimize land use for vegetable oil production in order to minimize environmental impacts and maximize socioeconomic benefits. One of the requirements for this is accurate global maps for all oil-producing crops. The most comprehensive maps available (International Food Policy Research Institute, 2019) map these crops by disaggregating crop statistics identified at national and subnational units for the year 2005 to 5 arcmin grid cells, which is a relatively coarse spatial resolution. Direct identification of crops from satellite imagery is likely to result in more accurate maps that delineate where different crops have been planted. One of the most extensively mapped crops is oil palm (Elaeis guineensis) because of societal concerns about the associated environmental impacts on tropical forests and social disruption. However, only the global extent of industrial plantations is reasonably well known, while the more heterogeneous plantings at smallholder scales remain largely unmapped (Meijaard et al., 2018).
A global map of oil palm at each production scale provides critical insights into the current debate about the social and environmental sustainability of the crop (Meijaard et al., 2018, 2020b). What would allow for a more accurate determination of the environmental impacts from oil palm expansion, for example, is assessing the deforestation that preceded oil palm development and the related carbon emissions, as well as the impacts on species' distributions, key biodiversity areas, and socioeconomic impacts. As total and local production volumes of palm oil are reasonably well known, a comparison to the total planted area would allow more accurate average yield estimates and regional variations in yield. Similarly, accurate maps of planted oil palm can determine the extent to which oil palm development has displaced other food crops, an important element in the policy debate in the European Union regarding the use of palm oil in biofuels (Meijaard and Sheil, 2019). Such information is important for comparing oil palm to other vegetable oil crops, such as soy, rapeseed, sunflower, groundnut, and coconut, once global maps for these crops become available. The challenge is thus to develop a method to accurately map large industrial plantations, as well as smallholder oil palm areas.
Previous studies have demonstrated the usefulness of radar imagery for the detection of closed-canopy oil palm stands. Palm-like trees have a characteristic backscatter response which consists of a low vertical transmit and vertical receive (VV) and high vertical transmit and horizontal receive (VH) in Sentinel-1 or a high horizontal transmit and vertical receive (HV) and low horizontal transmit and horizontal receive (HH) in PALSAR imagery (Miettinen and Liew, 2011). This characteristic backscatter response is a consequence of the canopy structure of palm-like trees and allows for the detection of closed-canopy palm plantations, particularly oil palm. Several studies have taken advantage of this characteristic backscatter response for mapping oil palm at the local and the regional scale (Koh et al., 2011; Lee et al., 2016; Nomura et al., 2019; Oon et al., 2019) and similarly for using supervised classification models (Descals et al., 2019; Shaharum et al., 2020; Xu et al., 2020).
The mapping of oil palm plantations by typology (smallholder versus industrial) with remotely sensed data presents a more challenging classification problem than the detection of only closed-canopy oil palm. In addition to the backscatter response of radar data, texture analysis also offers a complementary method to distinguish between smallholders and industrial-scale plantations (Descals et al., 2019). Contextual information, such as the presence and shape of harvesting road network and drainage structures, can be included as predictive variables for the classification of industrial and smallholder plantations.
Deep learning, in particular semantic segmentation, is a subfield of machine learning with characteristics suitable for the distinction of smallholder and industrial oil palm plantations. Deep learning employs a series of models for computer vision that excel in very complex classification scenarios (LeCun et al., 2015), and, in particular, convolutional neural networks (CNNs) have recently been embraced by the remote-sensing community due to the ability to recognize intricate patterns in the images (Ma et al., 2019). To date, there are no studies that consider CNNs for the land use classification of oil palm plantations at regional or global scales. One study used deep learning for object detection, focusing on the identification of single palm trees (Li et al., 2017).
The aim of this study is to (i) present an up-to-date map of oil palm plantations by typology (industrial versus smallholder plantations) at the global scale and with unprecedented detail (10 m resolution) for the year 2019 and (ii) show the suitability of deep learning in remote sensing for complex classification scenarios in which contextual information may be useful.
2.1 Overview
The classification model for oil palm plantations used the Sentinel-1 and Sentinel-2 half-yearly composites as input images (Fig. 1). The maps presented in this study correspond to the second half of 2019. We used a deep-learning model that was trained with 296 images of 1000 × 1000 pixels distributed throughout the main oil-palm-producing regions and applied over Sentinel-1 and Sentinel-2 composites in the potential area (Fig. 2) where oil palm can grow. Table 1 shows the geospatial data used in the study. The links to the datasets appear in Sect. 6. The processing steps depicted in Fig. 1 were implemented in different computing environments (Appendix Fig. A1) depending on the convenience of the processing. The annual compositing of Sentinel-1 and Sentinel-2 images was done in Google Earth Engine (GEE) (Gorelick et al., 2017) since a cloud-processing platform was suited for this task considering the high amount of satellite data required in the compositing. The visual interpretation of training and validation data was also done in GEE. The training of the CNN and the classification of images, however, was performed with a local computer using Matlab 2019a since the implementation of the CNN model was less feasible in GEE. The CNN model can also be trained and used for the prediction of images with Python (code accessible through Sect. 5). The Sentinel-1 and Sentinel-2 images taken in 2019 are the only data necessary to reproduce the results of the global oil palm map. The rest is auxiliary data used for the identification of the oil palm distribution, the visual interpretation of oil palm plantation, and the comparison with other oil palm maps.
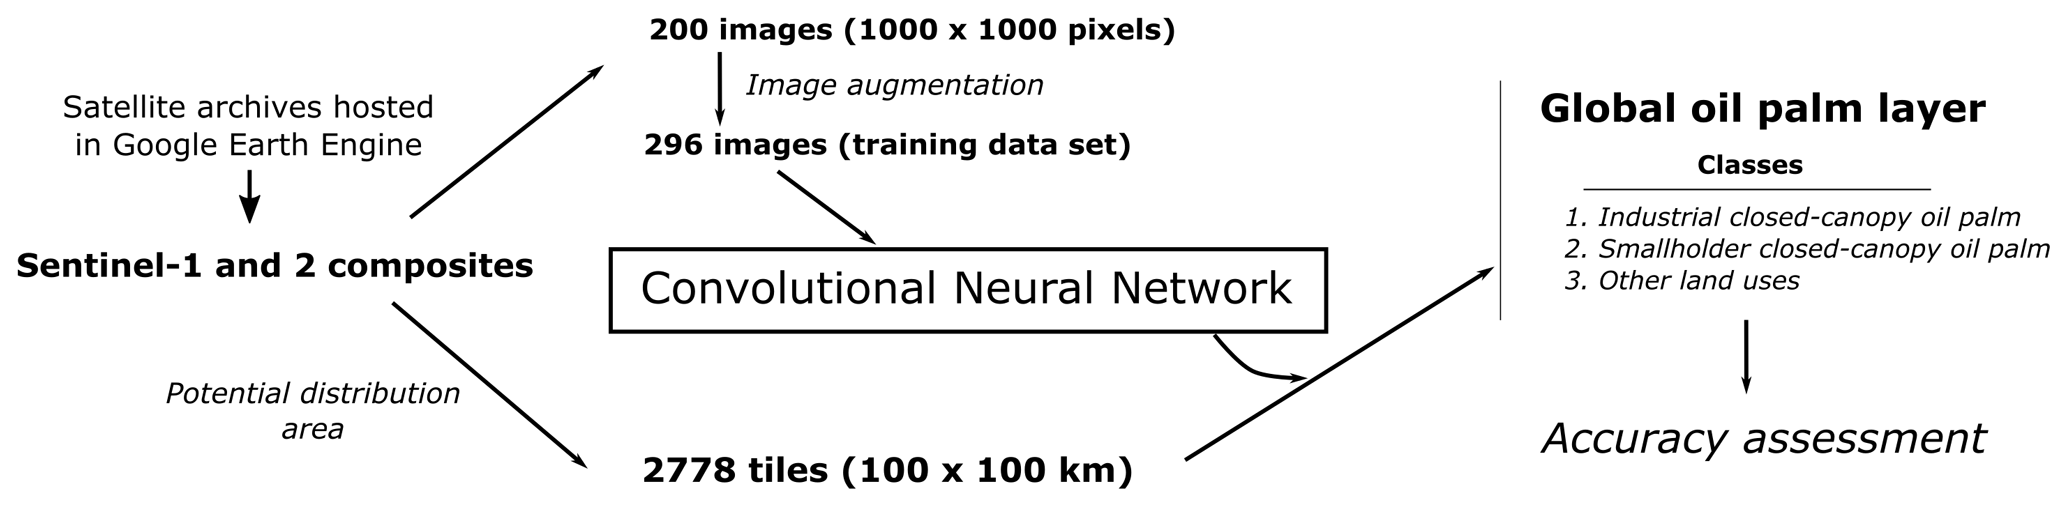
Figure 1Diagram of the algorithm used to generate the global oil palm layer. The input images, Sentinel-1 and Sentinel-2 half-yearly composites, were obtained from Google Earth Engine on a grid of 100 × 100 km. The Sentinel-1 and Sentinel-2 tiles were classified with a convolutional neural network (CNN). The CNN model was trained with labeled images with constant size (1000 × 1000 pixels). The output classification layer was validated with 13 495 points that were randomly distributed.
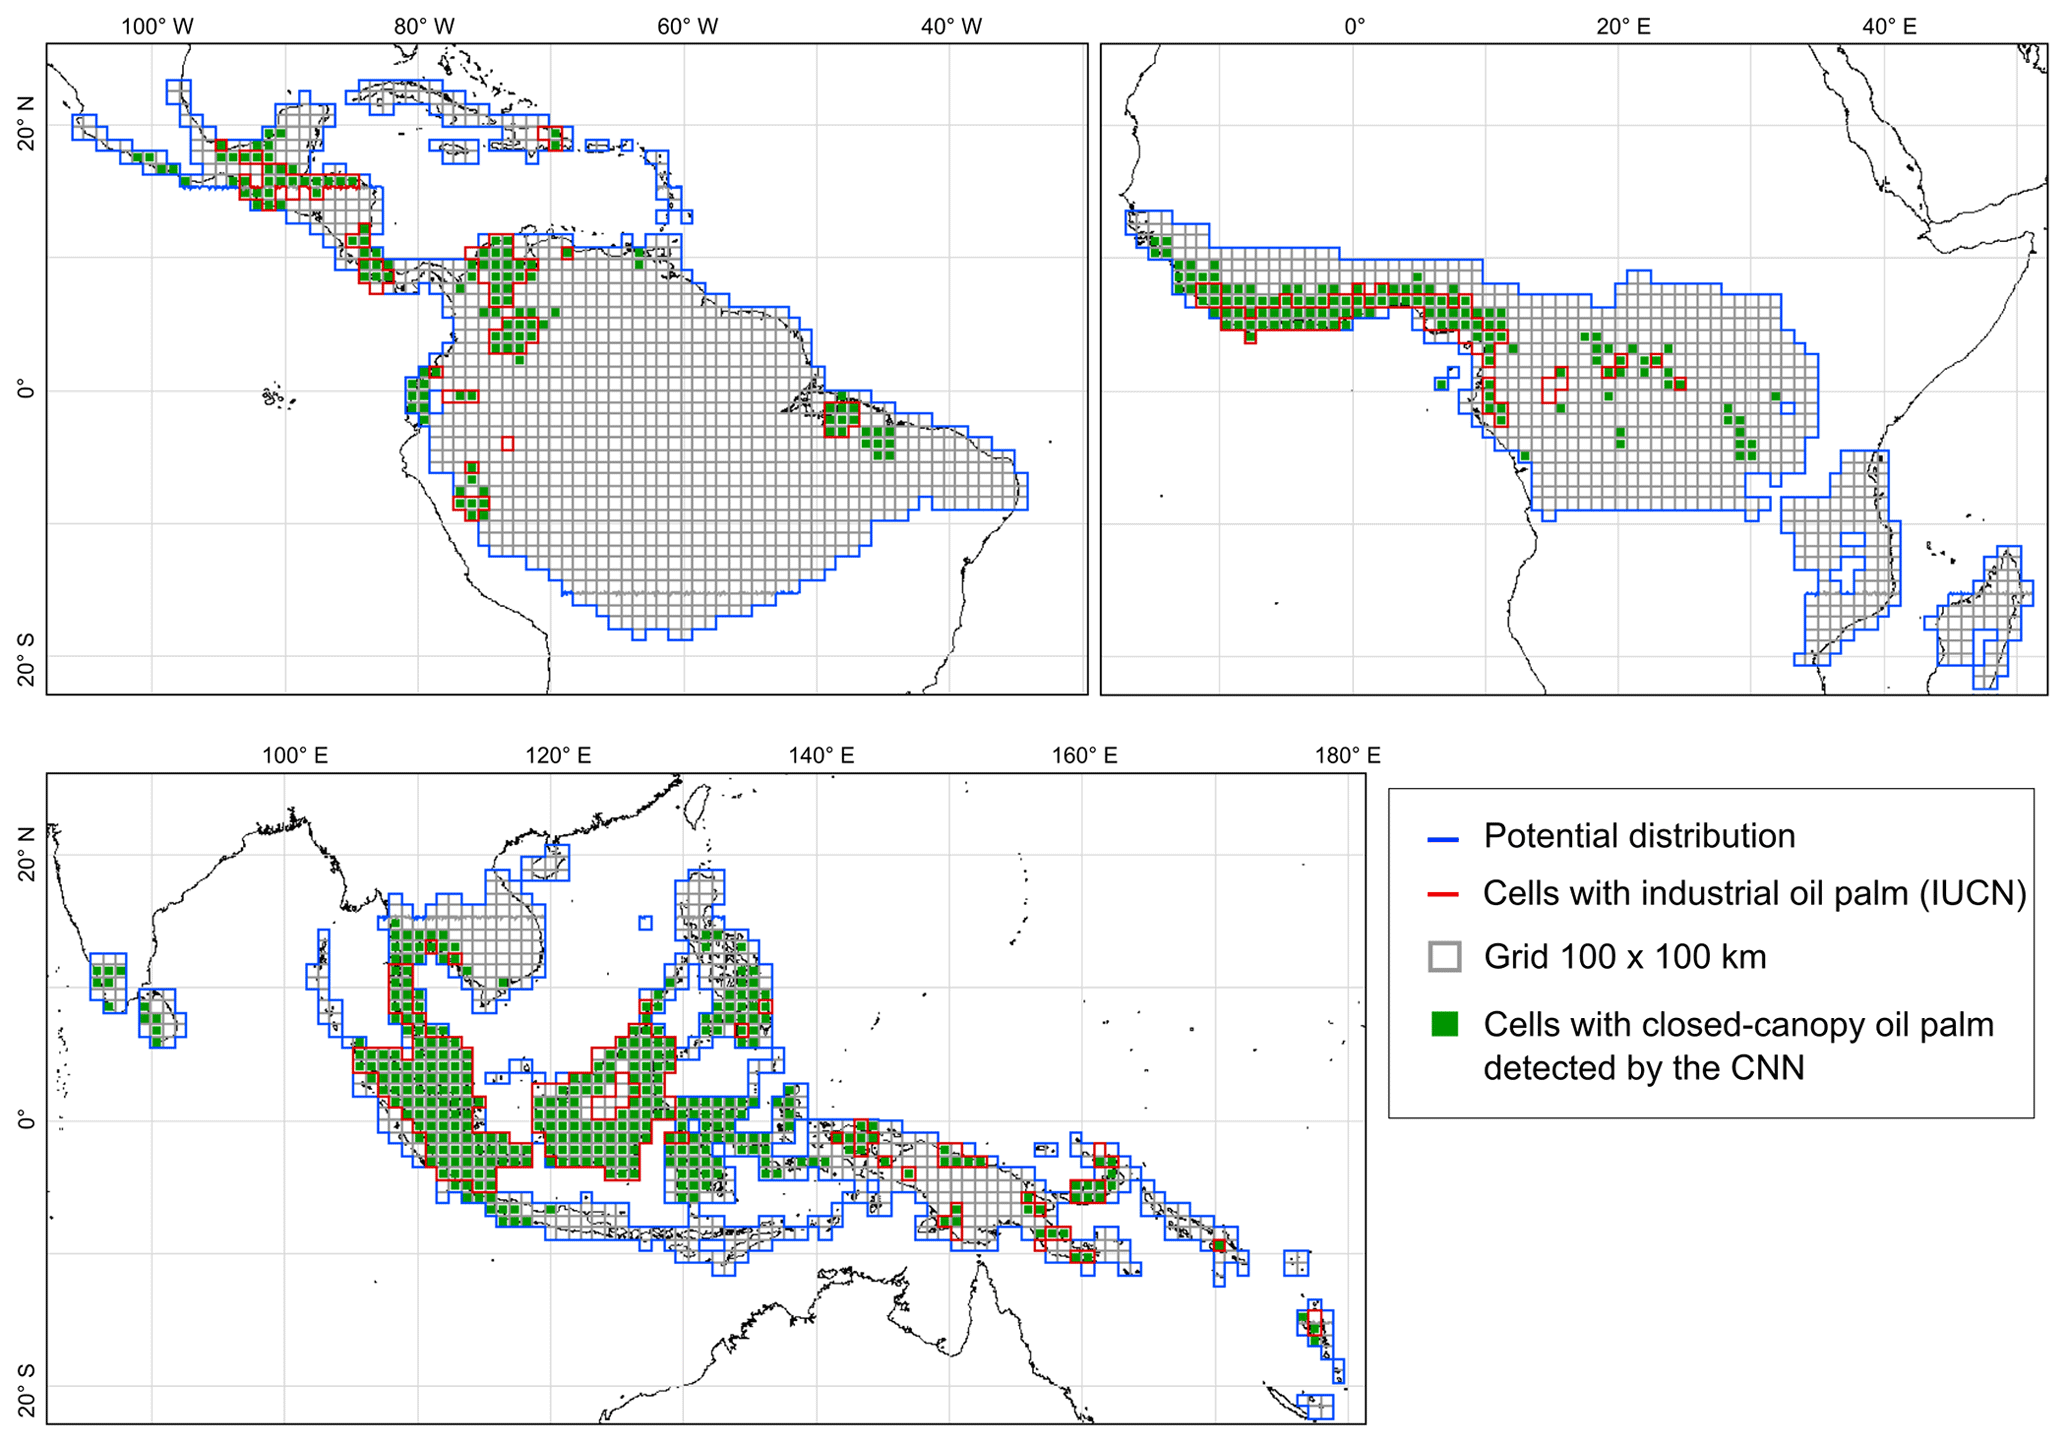
Figure 2Localization map of the grid cells where the convolutional neural network (CNN) was applied for the classification of industrial and smallholder plantations. The grid cells cover a potential distribution area (blue line) over seven tropical regions of the world where oil palm can grow: Central and South America, Central and West Africa, South and Southeast Asia, and the Pacific. Cells in red depict the areas where there is the presence of industrial oil palm plantations in the IUCN layer. Cells filled with green signify areas where closed-canopy oil palm was detected by the CNN.
Table 1Data sources used in the study.
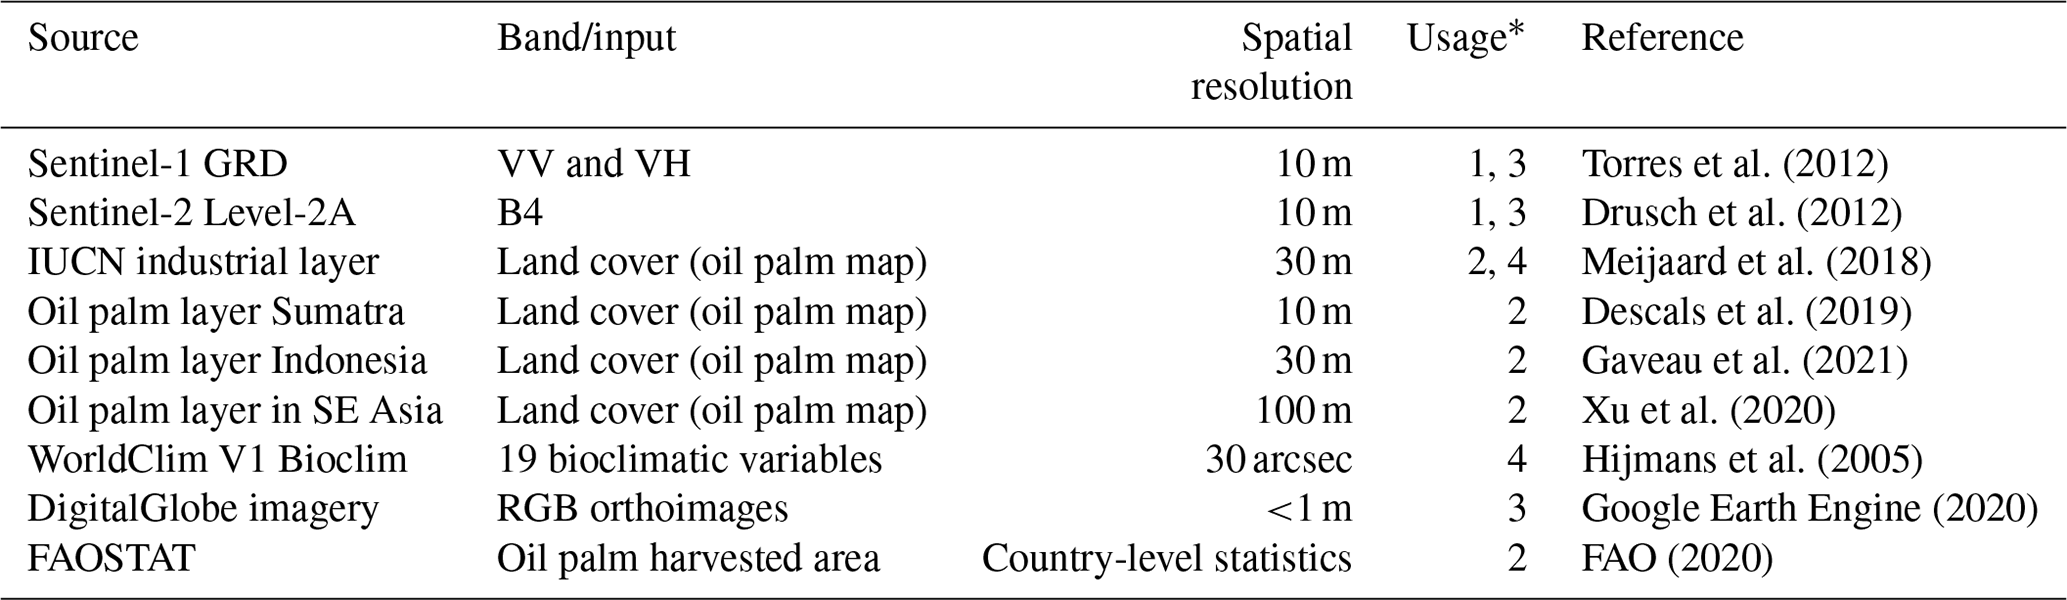
* The column describes how the data were used in the study: (1) input of the convolutional neural network (CNN), (2) used for comparison with the results of the CNN, (3) base layers for the visual interpretation of oil palm plantations, and (4) used for the identification of the potential distribution of oil palm.
2.2 Potential distribution of oil palm
The classification of oil palm plantations was restricted to those areas where the climatic conditions were favorable for oil palm growth. In order to delimit the potential distribution of oil palm, we used climate data and an existing global oil palm dataset. The climate dataset was obtained from WorldClim V1 Bioclim (Hijmans et al., 2005), which provides 19 gridded variables at a spatial resolution of 30 arcsec that are generated from monthly temperature and precipitation. This study's existing oil palm layer was obtained from the International Union for Conservation of Nature (IUCN; Meijaard et al., 2018) and shows the industrial oil palm plantations at the global scale (link to the IUCN layer is available in Sect. 6). This map was derived from a compilation of all published spatial data on oil palm combined with the manual digitization of characteristic spatial signatures of industrial-scale oil palm using cloud-free Landsat mosaics acquired in 2017 and created in GEE.
The potential area where oil palm can grow was estimated with the climate variable range in the IUCN layer. We estimated the histogram of the 19 bioclimatic variables in the areas that were classified as industrial oil palm plantations in the IUCN layer. Appendix Table A1 shows the minimum and maximum of each bioclimatic variable for the industrial plantations. A pixel in the WorldClim dataset was considered favorable for oil palm growth when at least 17 out of the 19 bioclimatic variables fell within the climate range observed in the IUCN layer (Appendix Fig. A2). The resulting potential oil palm distribution map encompasses similar areas as used in previous studies (Pirker et al., 2016; Strona et al., 2018; Wich et al., 2014). The classification of oil palm plantations was processed in a grid of 100 × 100 km that covers the area with favorable conditions for oil palm growth (Fig. 2).
2.3 Sentinel-1 and Sentinel-2 preprocessing
The CNN classifies radar and optical images collected by Sentinel-1 (C-band) (Torres et al., 2012) and Sentinel-2 (multispectral) (Drusch et al., 2012) satellites, respectively, both of which missions were launched by the European Space Agency and were part of the Copernicus Programme (https://www.copernicus.eu, last access: 17 March 2021). The images were preprocessed and downloaded from GEE (code is available in Sect. 5, Descals, 2021). We used the Sentinel-1 synthetic aperture radar (SAR) Ground Range Detected (GRD), which has a temporal resolution of 12 d, in both ascending and descending orbits. We used the Interferometric Wide Swath images processed at a spatial resolution of 10 m. The scenes were processed with the local incident angle (LIA) correction, and then the median value was computed over the second half of 2019 for the ascending and descending scenes separately. The final composite is the average of the two orbit composites.
We also used Band 4 (red band; central wavelength = 665 nm) of Sentinel-2 Level 2A (surface reflectance). Different feature selection algorithms highlighted the relevance of Band 4 for predicting industrial and oil palm plantations in a previous study (Descals et al., 2019). Band 4 is the 10 m resolution band that best shows the roads in industrial plantations because of the high contrast in terms of reflectance between the road and the surrounding oil palm. The high light scattering of vegetation in the near-infrared spectrum makes the recognition of roads less feasible in the 10 m near-infrared band (Band 8). The Sentinel-2 images were masked with the quality flag provided in Level 2A, which is produced by the ATCOR algorithm and provides information about the clouds, cloud shadows, and other non-valid observations (Drusch et al., 2012). The images were aggregated for the second half of 2019 using the normalized difference vegetation index as the quality mosaic. The 5 d revisit time of Sentinel-2 allowed for the generation of cloud-free composites over the study area.
2.4 Image labeling
Semantic segmentation models require input images with a constant size for both training and prediction. The size of the input images in this study was set to 1000 × 1000 pixels, which corresponds to an area of 10 × 10 km in a 10 m resolution image. We set an input size of 10 km because it captures the contextual spatial information necessary for identifying smallholders and industrial plantations (e.g., harvesting road network). Consequently, the model was trained with Sentinel-1 and Sentinel-2 half-yearly annual composites of 10 × 10 km. The oil palm plantations that were present within the Sentinel composites were labeled by visual interpretation. We digitized the oil palm plantations also by interpreting the very high-resolution DigitalGlobe images that are displayed as the base layer in GEE. The DigitalGlobe images have a sub-meter spatial resolution and are displayed as true-color composites in GEE. These images are updated regularly, and the date depends on the location, but usually the images were taken during the past 1 to 2 years. The DigitalGlobe images were used as complementary data to the Sentinel-1 and Sentinel-2 composites in the visual interpretation. We used the geometry editing tool in GEE for labeling smallholder and industrial plantations. Once the training areas were labeled, we downloaded the truth images from GEE along with the Sentinel-1 and Sentinel-2 composites for the second half of 2019. The image labeling was carried out in 84 different regions of the world where oil palm is cultivated (Appendix Fig. A3) and resulted in 200 training images.
Deep-learning algorithms require large amounts of data to ensure good performance, and data augmentation is a technique used to improve the performance of the models when the size of the training data is small (Shorten and Khoshgoftaar, 2019). Data augmentation aims to generate a more diverse training dataset with certain affine transformations applied to the original training data. Data augmentation techniques have been used in remote-sensing studies (Yu et al., 2017), in which affine transformations, such as flips, translations, and rotations, have improved the accuracy results of deep-learning models. We used the rotation of images (90∘ clockwise) as the data augmentation technique for this study (Appendix Fig. A4). The rotation was applied only to the training images that presented more than 10 % of the pixels labeled as smallholders in order to reduce the class imbalance between industrial and smallholder plantations. We also clipped the central area of 4 × 4 blocks of labeled images and rotated them by an angle of 45∘. This process resulted in 96 additional images that were added to the 200 original training images.
2.5 Definition of industrial and smallholder plantations
Definitions of smallholders and industrial plantations differ per country, and many variations within each of these classes exist (Bronkhorst et al., 2017; Glenday and Gary, 2015; Meijaard and Sheil, 2019). For the current study, we used the following generalized classifications. An industrial oil palm plantation typically covers several thousand hectares of land and is very well structured and homogeneous in tree age. It consists of an area bounded by long linear, sometimes rectangular boundaries. It has a dense trail and a road and/or canal network. Roads in industrial plantations are developed at the start of plantation development and, therefore, equidistantly placed for optimal harvesting. In flat surface plantations, the harvesting trails are usually built in straight lines and thus form a rectilinear grid (Fig. 3a). In contrast, the industrial plantations that are constructed over steep terrain usually present curvy trails (Fig. 3b). A smallholder oil palm plantation must be typically smaller than 25 ha to be recognized as “small” by the Indonesian government. These definitions vary by country, with Malaysia using a 4 ha cut-off, while in Cameroon, this varies from 8 to 40 ha (for an overview, see Table 2 in Meijaard et al., 2018). Compared to an industrial plantation, a smallholder plantation tends to be less structured in shape and more heterogeneous in tree age. Smallholder plantations tend to form a landscape mosaic composed of small plantations of varying shape and size mixed with other types of land cover (e.g., idle land or other plantation types) (Fig. 3d). When smallholder plantations form a large homogenous cluster, this cluster has a less dense trail network than industrial plantations (Fig. 3a, c).
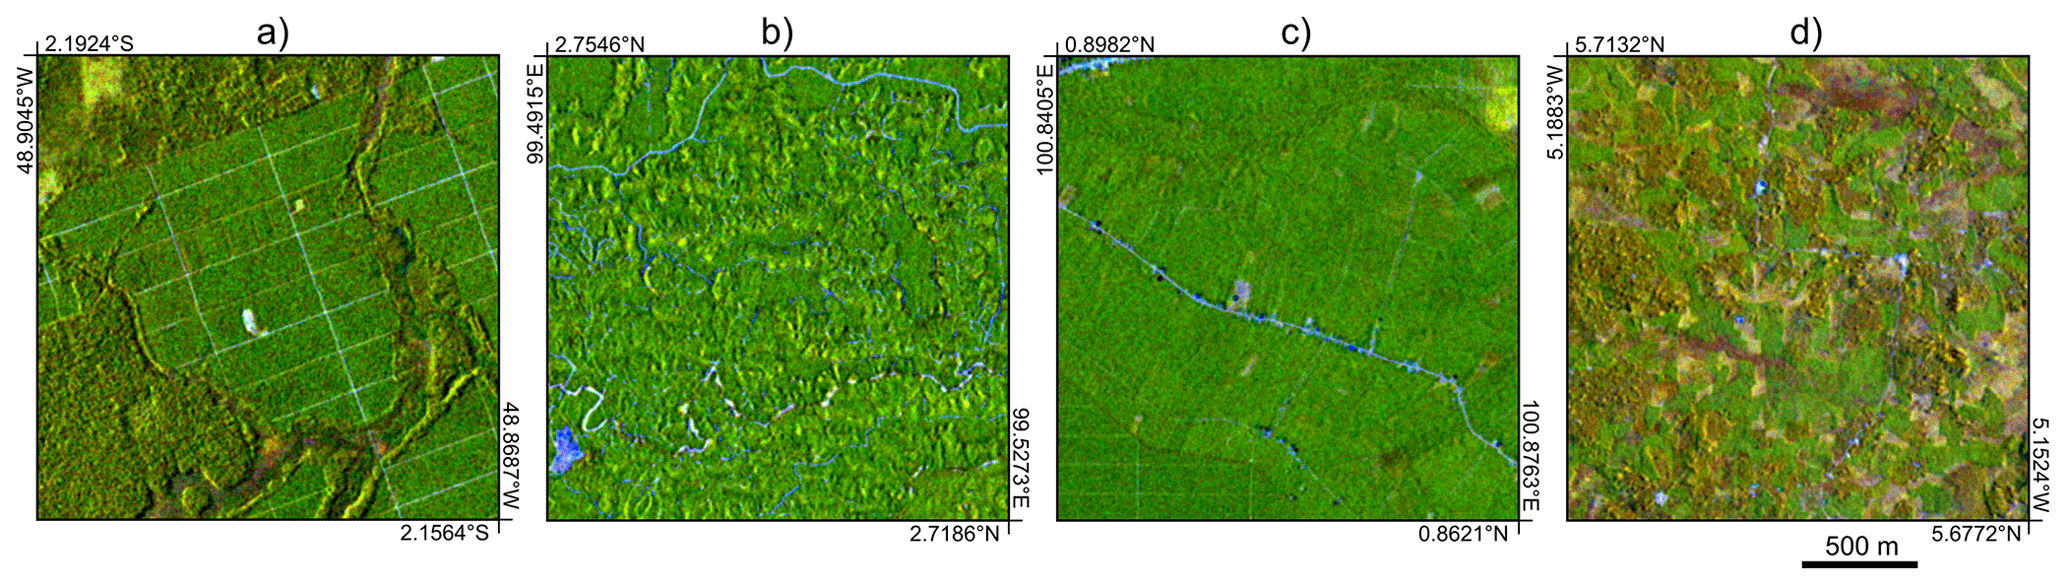
Figure 3Examples of industrial and smallholder oil palm plantations seen by a 10 m resolution Sentinel-1 and Sentinel-2 composite (red channel: VV; green channel: VH; and blue channel: Band 4). The VV and VH bands were transformed and stretched so that the closed-canopy oil palm appears in green. (a) An industrial plantation on a flat surface in Brazil with harvesting trails built in straight lines and thus forming rectilinear grids. (b) An industrial plantation on hilly terrain in Indonesia, with curvy harvesting trails. (c) Smallholder plantations forming a large homogeneous cluster in Indonesia. (d) Smallholder plantations of varying shape, size, and tree age in Côte d'Ivoire (image source: Copernicus Sentinel data 2019).
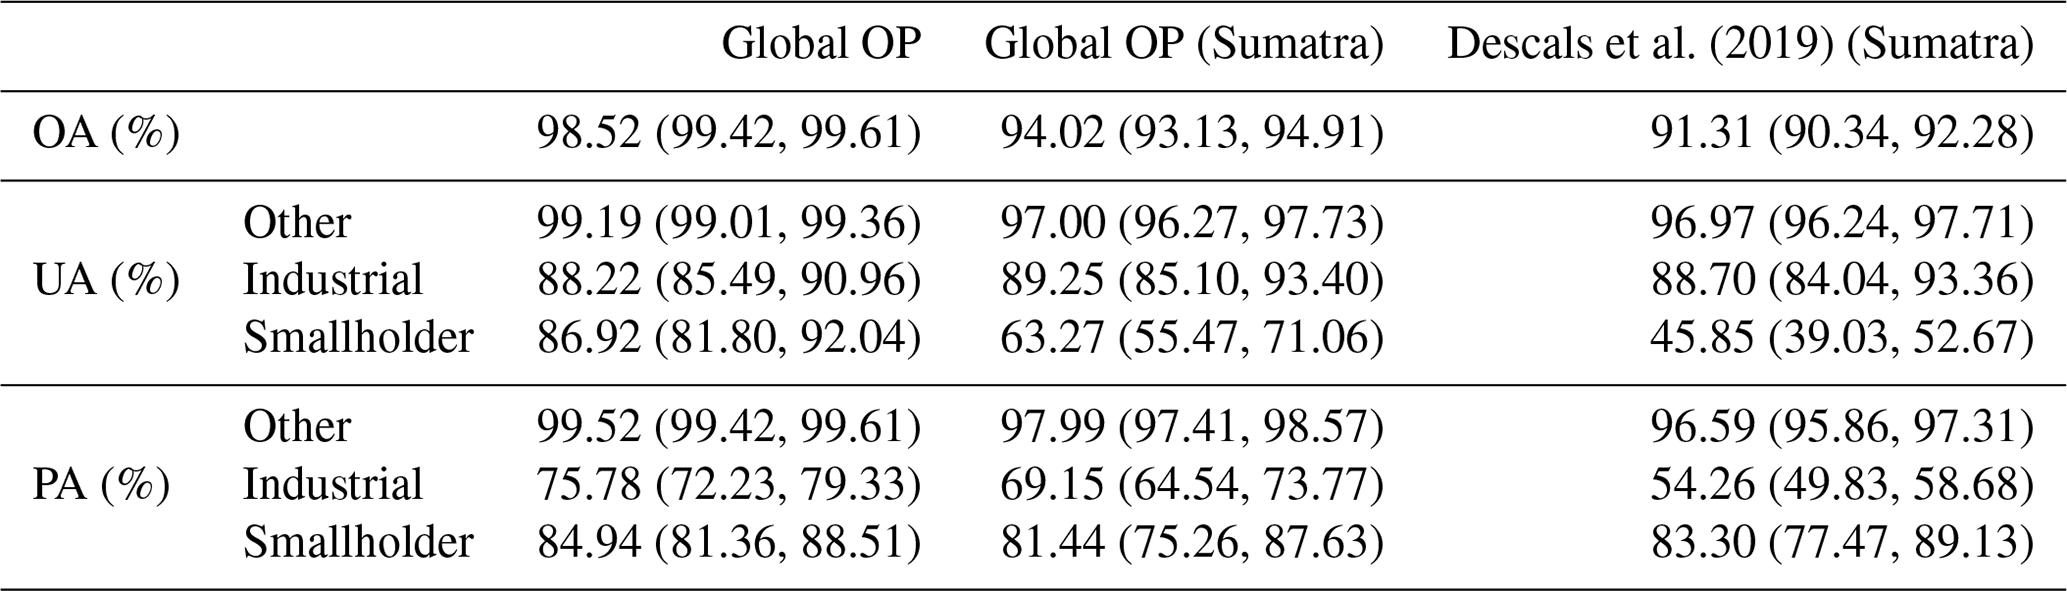
Table 2Accuracy assessment of the global oil palm layer for the second half of 2019 and comparison of the global layer with the results of a previous study (Descals et al., 2019) which used a random forest in Sumatra for the same year. The accuracy metrics of the global layer were estimated with 10 816 points randomly distributed in the main oil-palm-producing areas in the world, while the comparison used only the validation points that were located in Sumatra (2463 points). The reported metrics are the overall accuracy (OA), the user's accuracy (UA), and the producer's accuracy (PA). The accuracy metrics are reported with a confidence interval (95 % confidence level).
2.6 Semantic segmentation
Image segmentation is the subfield of deep learning that aims to link each pixel of an image to a class label. Thus, semantic segmentation is the analog of the standard pixel-wise machine-learning algorithms that are used in remote sensing for image classification (Ma et al., 2019). The difference is that semantic segmentation, as any model based on a CNN, automatically learns and exploits the spatial patterns within the image by tuning the parameters of different convolutional operations.
This study employed the classification model DeepLabv3+ (Chen et al., 2017, 2018) with the MobileNetV2 (Sandler et al., 2018) as a backbone network. DeepLab has a series of versions for semantic segmentation. DeepLabv3+ is the latest version (link to the code in Sect. 5). The model uses an encoder–decoder architecture in which the image is downsampled with max-pooling layers during the encoder part and spatial information is retrieved during the decoder part. A characteristic of DeepLabv3+ is that the CNN uses atrous convolutions which enhance the field of view of filters to incorporate a larger spatial and informational context. The second-last layer of the CNN shows the probability that a pixel belongs to a certain class, and the last operation of the CNN assigns the class with the maximum value in the probability layers, resulting in the final classification layer.
2.7 Validation
The accuracy of the global oil palm classification layer was evaluated with 10 816 reference points: 544 points were industrial plantations, 305 were smallholders, and 9967 were other types of land uses. The points were randomly distributed using a simple random sampling, which means that each pixel on the map had an equal chance of being selected, and were distributed in the 100 × 100 km cells where the IUCN oil palm layer showed the presence of industrial plantations (cells outlined in red in Fig. 2). This sample method led to a high imbalance between the points labeled as “Other land uses” and the points labeled as oil palm, both industrial and smallholder, since oil palm plantations present a rare occurrence in the study area. The rare occurrence of oil palm implied that the probability of randomly selecting an oil palm plantation was also low. This low representation of oil palm plantations in the simple random sampling resulted in a high uncertainty in the oil palm area estimates at the regional and country level. For this reason, we included 2679 points that were distributed with a stratified random sampling in order to achieve a minimum sample size in the industrial and smallholder oil palm classes. The size of each stratum was 977 points in the class industrial oil palm and 802 in the class smallholder oil palm, and 900 were other types of land uses. The 2679 stratified points were merged with the 10 816 simple random points, making a total of 13 495 points that were used to calculate the oil palm area estimates.
Since the study aims to classify closed-canopy oil palm against other land uses, we included young oil palm and plantations that have not reached the full canopy coverage in the class “Other land uses”. The points were visually interpreted using the Sentinel-1 and Sentinel-2 annual composites of the year 2019 (See Sect. 2.3) and the DigitalGlobe orthoimages (<1 m spatial resolution) that are displayed as the base layer in the GEE code editor.
The accuracy metrics that we reported were the overall accuracy (OA), the user's accuracy (UA), and the producer's accuracy (PA) (Olofsson et al., 2014). The OA is the proportion of reference points that have been correctly classified and is calculated by summing the number of correctly classified points and dividing by the total number of points. The OA represents the probability that a randomly sampled pixel is correctly classified. The PA results from dividing the number of correctly classified points in each class by the number of visually interpreted points for each class. The PA is the complement of the omission error: PA = 100 % – omission error. Thus, the PA for the classes “industrial” and “smallholder” is a relevant accuracy metric that shows the rate at which the oil palm plantations were missed in the classification image. On the other hand, the UA results from dividing the number of correctly classified points in each class by the number of points classified in each class. The UA is the complement of the commission error: UA = 100 % – commission error). The UA for the classes “industrial” and “smallholder” indicates the rate at which land uses have been incorrectly classified as oil palm plantations.
The accuracy metrics were evaluated following the good practices for estimating area and assessing accuracy reported by Olofsson et al. (2014). The practices explain the post-stratified estimation of the OA, PA, and UA with a confidence interval. Olofsson et al. (2014) also describe the formulation for the area estimation for the classes that are present in the land cover map. The area estimates are also calculated with a confidence interval (here, a 95 % confidence interval for both accuracy metrics and area estimates was utilized). Here, we used the term “area mapped” for the total area classified as a given class and the term “area estimate” for the estimation of the actual area and the associated uncertainty following the practices in Olofsson et al. (2014). The area mapped is subject to the good accuracy of the classification; for instance, a high omission rate in the class “industrial closed-canopy oil palm” would potentially lead to a small area mapped, which would represent an underestimate of the actual industrial oil palm area. The area estimate and its confidence interval, however, cover the actual area with a given confidence level.
Owing to the high imbalance in the validation dataset, we tested whether the overall accuracy of the CNN was higher than the no-information rate. The no-information rate was computed as the overall accuracy obtained if all pixels were classified as the major class, which is the class “Other land uses” in our study. The hypothesis test evaluates whether the overall accuracy obtained in the CNN classification is significantly higher than the no-information rate with a 95 % confidence level. If the null hypothesis is rejected (OA > no-information rate), we can be assured that the CNN did better than predicting indiscriminately all pixels with the class “Other land uses”.
2.8 Comparison with other oil palm datasets
The accuracy of the CNN classification was compared with existing oil palm maps of Sumatra for the year 2019 (Descals et al., 2019) and Southeast Asia for the year 2016 (Xu et al., 2020). Also, we compared our oil palm area estimates with the oil palm harvested area included in Food and Agriculture Organization of the United Nations (FAOSTAT) data at the country level and with the area estimates obtained from an oil palm map developed in Gaveau et al. (2021) over Indonesia for the year 2019. The oil palm maps in Descals et al. (2019) and Xu et al. (2020) were generated with a random forest classification, while the map developed by Gaveau et al. (2021) was generated by digitizing the oil palm plantations in Landsat and SPOT6 images.
In order to compare the current results with our previous study in Descals et al. (2019), we reclassified the young oil palm classes in this existing dataset to the class “Other land uses”. We also kept only the validation points that cover Sumatra; this resulted in 2463 points out of the 13 495 total points. For the comparison with Xu et al. (2020), we used our CNN model to classify Sentinel-1 and Sentinel-2 composites for the second half of 2016. Moreover, we reclassified the smallholders and industrial plantations as a single class since the oil palm map in Xu et al. (2020) does not make distinctions between oil palm typology (industrial versus smallholder plantations). We also removed the validation points that were placed in young plantations because the temporal analysis in Xu et al. (2020) aimed to detect young oil palm and the plantations that had been clear-cut in the previous years. Note that the dataset of Xu et al. (2020) includes a 100 m multi-year classification for the years 2001–2016 and that we only compared the last year (2016) to ensure data availability in Sentinel-1 and Sentinel-2 over the study area.
The global map of industrial and smallholder plantations reveals the importance of high-resolution images (10 m) for the accurate delimitation of smallholder plantations. Figure 4 shows the degree of detail of the classification image obtained with Sentinel-1 and Sentinel-2 composites. The figure also exemplifies the classification of industrial plantations with the characteristic road network and the surrounding smallholder plantations. Appendix Fig. A5 shows examples of landscape types of oil palm plantations that were successfully detected and others that were omitted.
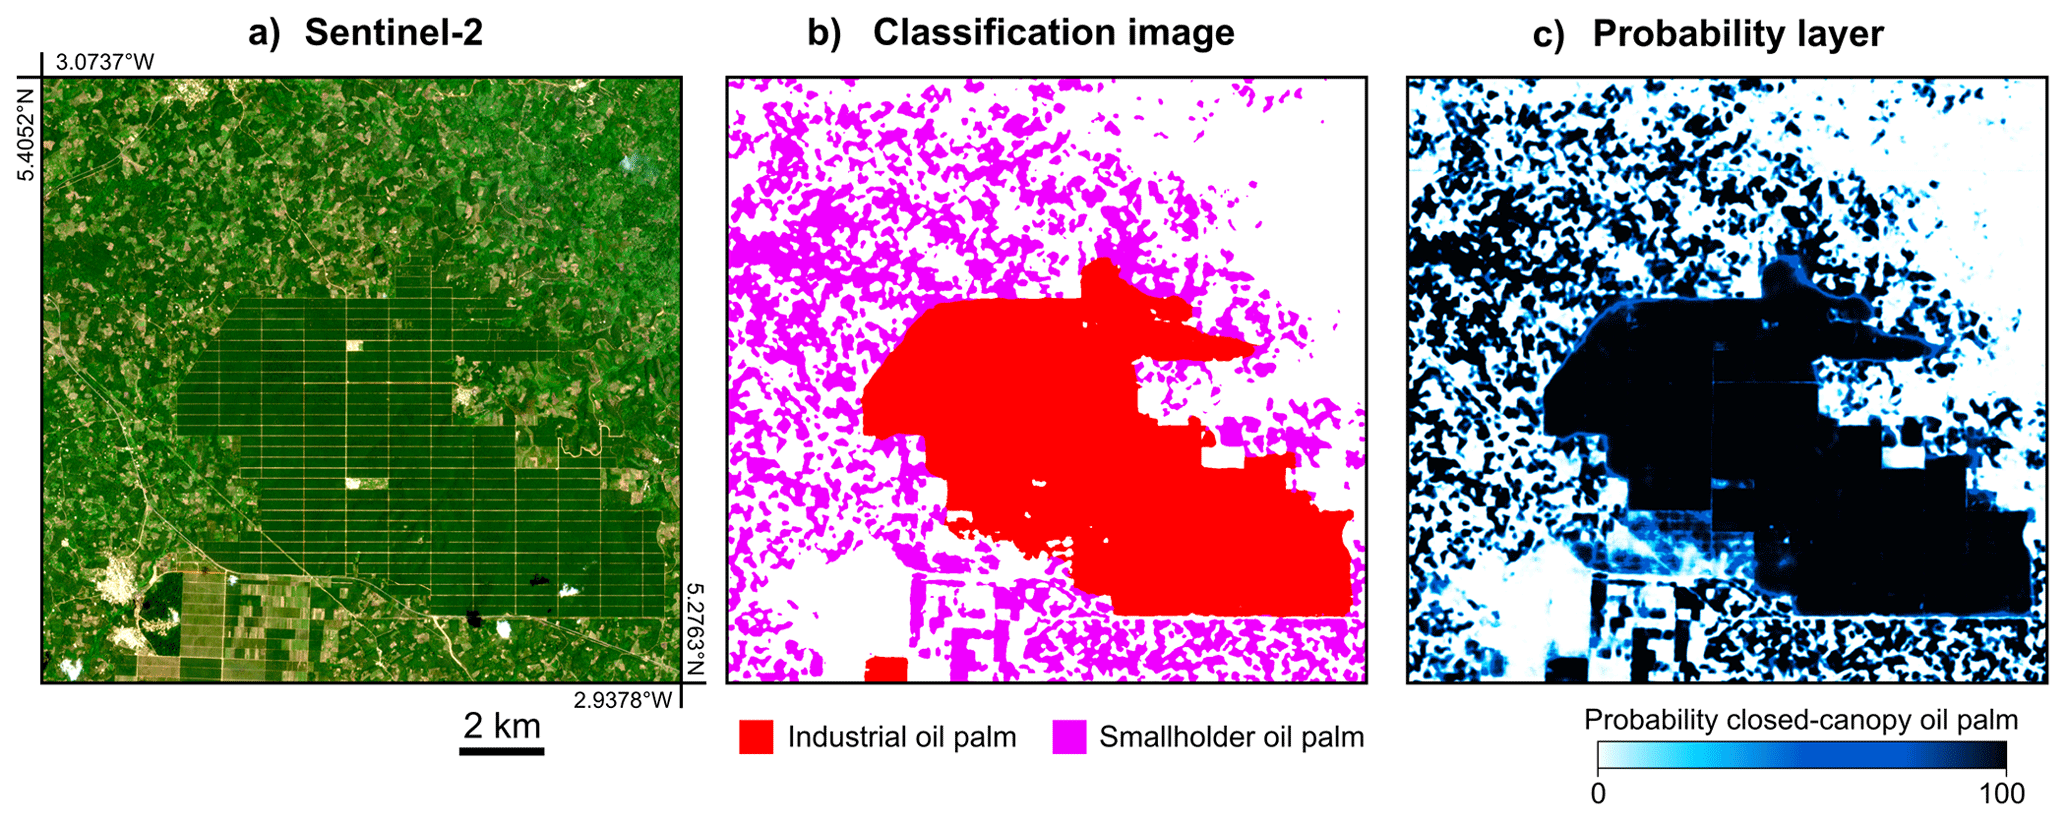
Figure 4Example of the global oil palm layer in Côte d'Ivoire. Panel (a) shows a Sentinel-2 true color image. Panel (b) shows the resulting classification image obtained with a convolutional neural network (CNN). The classification image depicts an industrial plantation (red) surrounded by smallholder plantations (purple). The CNN learns contextual information, such as the rectilinear road network in the industrial plantation, which is noticeable in the Sentinel-2 composite. Panel (c) shows the probability of closed-canopy oil palm. The probability layer was generated from the second-last layer of the CNN which reflects the probability of each class (image source: Copernicus Sentinel data 2019).
We estimated the global area of planted closed-canopy oil palm at 21.00 ± 0.42 Mha, of which 15.26 ± 0.40 Mha (72.7 %) was industrial plantations and 5.72 ± 0.22 Mha (27.3 %) was smallholders. The map confirms that Southeast Asia is the highest-producing region in the world (Fig. 5) with a total surface area of 18.69 ± 0.33 Mha. It is followed by South America (0.91 ± 0.06 Mha), West Africa (0.79 ± 0.11 Mha), Central America (0.52 ± 0.04 Mha), Central Africa (0.21 ± 0.6 Mha), and the Pacific (0.14 ± 0.00 Mha). Oil palm plantations were found in 49 tropical countries (see Appendix Table A2). However, the estimated oil palm area varies greatly among countries, with Indonesia and Malaysia representing the bulk of the total surface area, while most other countries have a plantation area below 2 Mha (Fig. 6).
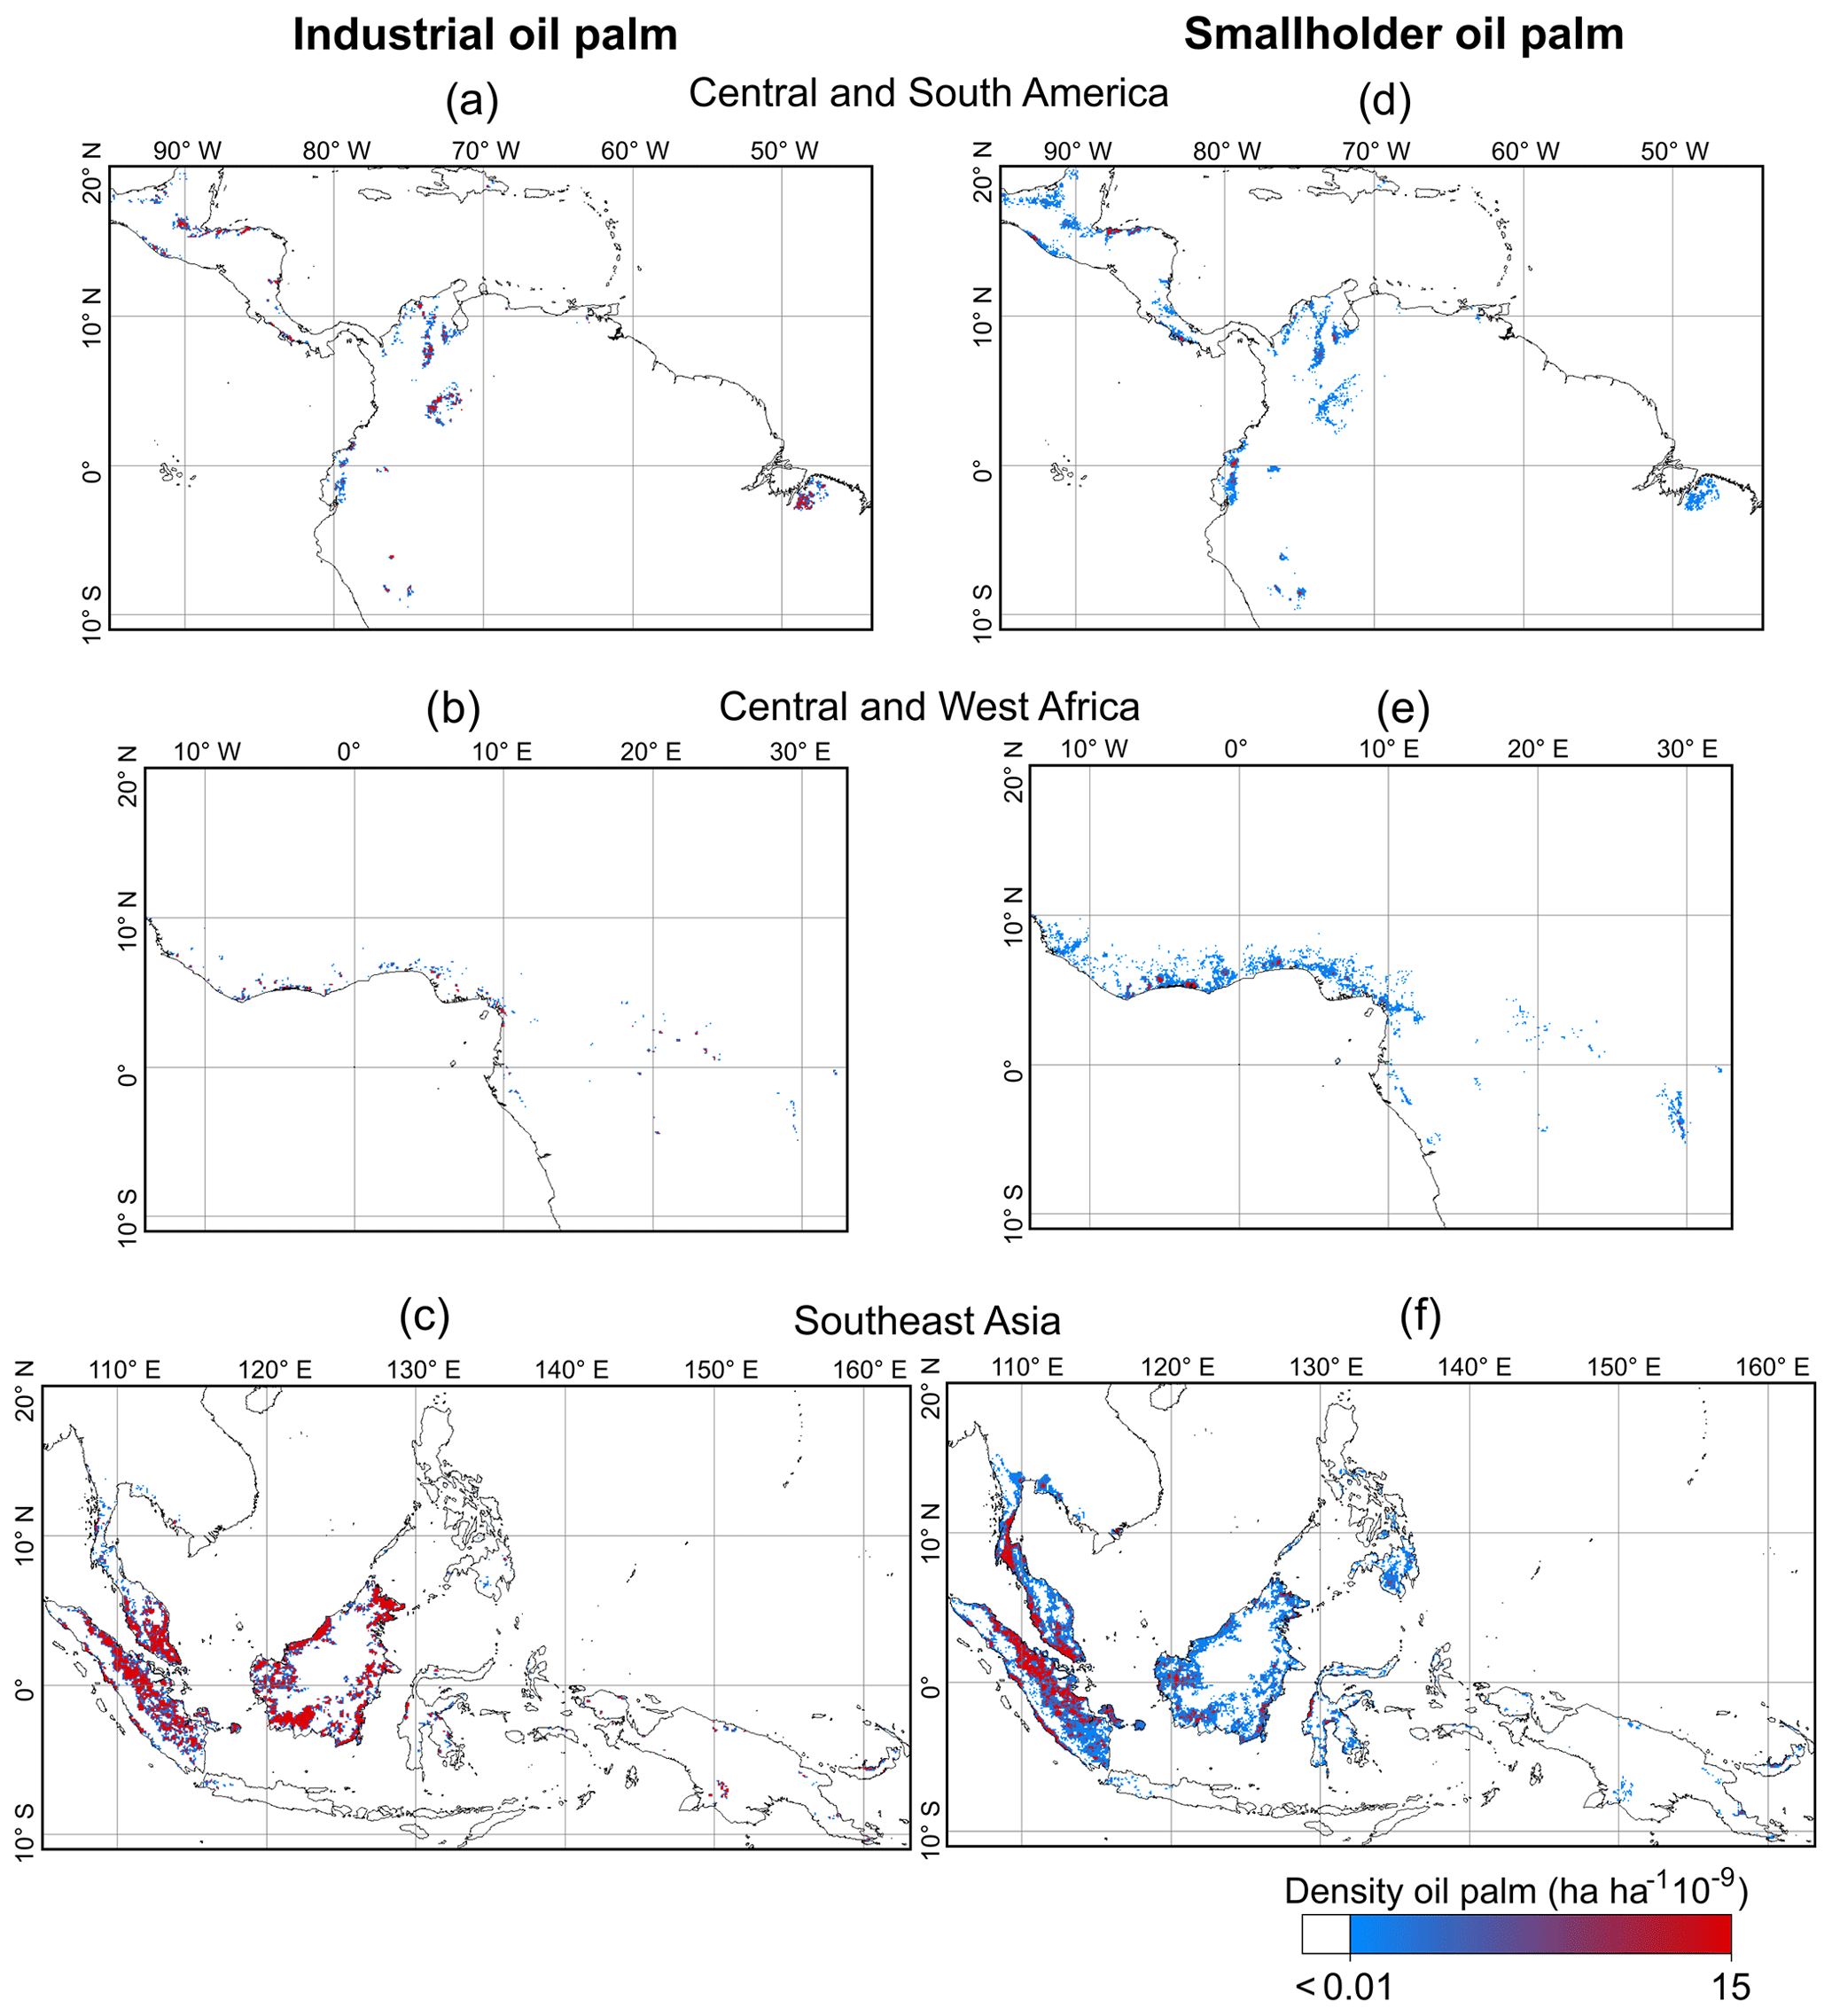
Figure 5Density maps generated with the global oil palm layer. Panels (a, b, c) show the density maps of industrial oil palm plantations, and panels (d, e, f) show the density maps for smallholder plantations. The maps have a spatial resolution of 10 km and represent the surface of closed-canopy oil palm, in hectares, in an area of 109 hectares. The values on the map were obtained by dividing the area of the oil palm within the 10 km pixel by the total area covered in the pixel.
The region with the highest percentage of smallholder oil palm was West Africa (68.7 % of total plantings; Appendix Fig. A6). Elsewhere, the percentage of smallholders varied from 14.5 % in Central Africa to 26.8 % in the Pacific. As Fig. 6 illustrates, however, countries in the same region might show different proportions of smallholders and industrial plantations. For instance, Thailand showed the highest proportion of smallholders (71.5 %), which differed from the low ratio in neighboring Malaysia (15.4 %). Countries in Southeast Asia also showed the highest oil palm surface per total land area, followed by smaller countries that allocate the majority of their cropland to oil palm production (Guatemala, Honduras, Costa Rica, and São Tomé and Príncipe).
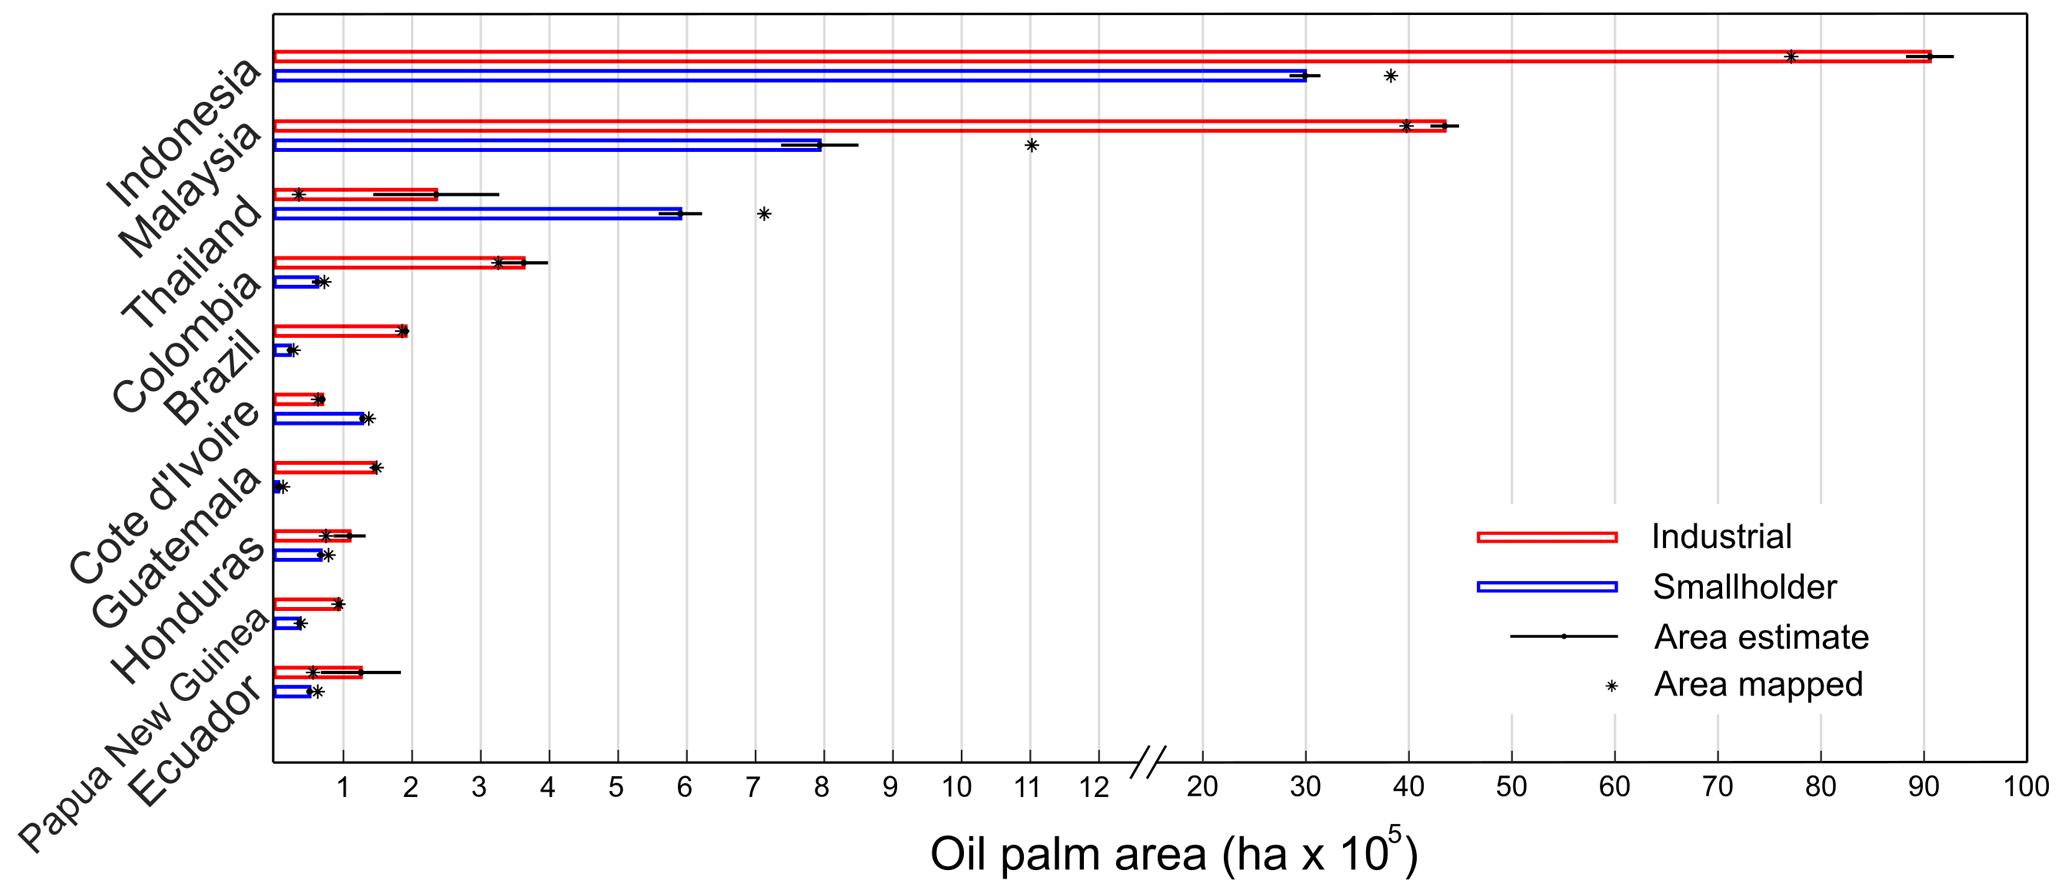
Figure 6Oil palm plantation area per typology (industrial versus smallholder) for the second half of 2019 in the 10 first countries with the largest oil palm area. The figure reflects the area mapped (asterisk mark), which resulted from the classification of Sentinel-1 and Sentinel-2, and the area estimate with a confidence level of 95 %.
The accuracy metrics obtained with the 10 816 points show an OA of 98.52 ± 0.20 % (Table 2) for the global oil palm map (Appendix Table A3 shows the confusion matrix). This OA is significantly higher than the no-information rate (92.00 ± 0.51 %), and, thus, we can be assured that the CNN classification did better than assigning the major class to all the validation points. The UA and PA were lower in industrial and smallholder plantations than the same accuracies obtained in the class “Other land uses”. Smallholder plantations showed the lowest UA (76.56 ± 4.53 %), while the industrial plantations showed the lowest PA (75.78 ± 3.55 %). The UA and PA accuracies were lower when evaluated only in Sumatra (smallholder UA = 63.27 ± 7.82 % and industrial PA = 69.15 ± 4.62 %). However, these accuracies were considerably lower in Descals et al. (2019), which presented a UA = 45.85 ± 6.84 % for smallholders and PA = 54.26 ± 4.42 % for industrial plantations. The state-of-the-art methodology using CNN also showed a higher overall accuracy than the random forest classification for the case study in Sumatra (91.31 ± 0.97 % compared to the 94.02 ± 0.89 % in the current study).
Our results (OA = 96.59 ± 0.50 %) performed better than the classification image (OA = 91.35 ± 0.69 %) of Xu et al. (2020) for 2016 (Appendix Table A4). The producer's accuracy for industrial plantations in the results (PA = 76.41 ± 3.08 %) of Xu et al. (2020) is higher than our results (PA = 73.65 ± 2.94 %), although this difference is not significant for a confidence level of 95 %. The main difference between the datasets, however, was found in the user's accuracy for smallholders, in which our results excelled (UA = 96.60 ± 0.51 % compared to 57.36 ± 3.76 % in the dataset of Xu et al., 2020). The comparison with the data of Xu et al. (2020), however, only reflects the accuracies for closed-canopy oil palm plantations; the multi-annual analysis in Xu et al. (2020) also included the detection of disturbances in the time series to classify young plantations (Fig. 7). Similar to the data of Xu et al. (2020), the dataset produced in Gaveau et al. (2021) also mapped young oil palm and areas that were clear-cut for oil palm plantation in Indonesia. For this reason, our closed-canopy oil palm area estimate was 12.05 ± 0.23 Mha in Indonesia – area mapped was 11.54 Mha with 7.71 Mha (66.8 %) industrial and 3.83 Mha (33.2 %) smallholder – but, by comparison, Gaveau et al. (2021) found a higher oil palm area for Indonesia for the same year: 16.26 Mha. Despite this difference, Gaveau et al. (2021) found a similar ratio between industrial and smallholder plantation extent: 10.33 Mha industrial (64 %) and 5.93 Mha smallholder (36 %).

Figure 7Comparison of the classification image obtained with the convolutional neural network (CNN) and the last year of the multiannual analysis presented in Xu et al. (2020). Panel (a) shows a Sentinel-1 composite (VV-VH-VV) for the second half of 2016 in Riau province (Indonesia). The VV and VH bands were transformed and stretched so that closed-canopy oil palm appears in green. Panel (b) shows the classification image that results from the CNN using the Sentinel-1 and Sentinel-2 composites for 2016. Panel (c) shows the oil palm layer presented in Xu et al. (2020) for the year 2016 (image source: Copernicus Sentinel data 2019).
The comparison with inventories from FAOSTAT is also evidence of a large omission of oil palm plantations in West Africa (Appendix Fig. A7). The total surface reported as harvested area in FAOSTAT is 4.16 Mha in West Africa, while our oil palm area estimate was 0.79 ± 0.11 Mha and the area mapped 0.42 Mha. The country with the highest difference is Nigeria with an area estimate of 3.02 Mha reported by FAOSTAT that contrasts with the 0.01 Mha classified by the CNN and the 0.25 ± 0.07 Mha total closed-canopy oil palm area estimate.
The results confirm previous findings on the suitability of radar satellite data for mapping closed-canopy oil palm plantations at the regional scale (Miettinen and Liew, 2011) and the improved accuracies obtained with the combined use of radar and optical data for mapping smallholder and industrial oil palm plantations (Descals et al., 2019). Our study further shows that these plantations can be mapped globally and by typology at high spatial resolution (10 m). The results obtained with the CNN outperformed previous studies and provide evidence that deep learning is more suitable than standard machine-learning algorithms, such as random forests, when contextual information is required for class prediction. Overall, the results show a high accuracy (OA = 97.46 ± 0.26 %). The accuracy assessment and the comparison with other products also provide evidence of uncertainties associated with the oil palm definition: young plantations, plantations that have open canopies, and plantations mixed with non-palm tree species, such as semi-wild oil plantations in Africa.
We compared our findings with three studies, Descals et al. (2019), Xu et al. (2020), and the dataset developed by Gaveau et al. (2021). Our CNN model applied to Sentinel-1 and Sentinel-2 classified closed-canopy oil palm stands with higher detail (10 m spatial resolution) than existing datasets, although, at a coarser resolution (100 m spatial resolution), the temporal analysis used in Xu et al. (2020) aimed to detect disturbances (e.g., land clearing and burning) that may or may not result in the development of oil palm plantations. Thus, Xu et al. (2020) classified open-canopy plantations that remained undetected in our classification. Accordingly, the omission error for oil palm was lower in the case of Xu et al. (2020), although this difference was not significant. However, Xu et al. (2020) detected much more than oil palm plantation, including scrubs and grasslands, and, therefore, the commission error for oil palm was significantly higher in the map of Xu et al. (2020) (UA = 57.36 ± 3.76 % compared to 96.55 ± 1.92 % in our study).
Gaveau et al. (2021) did not directly measure planted areas, but instead, they identified areas that were “cleared to develop plantations”. An area may have been cleared for oil palm and left idle because of several constraints, or the area may have been planted, but the plantation may have failed. The comparison with the maps of Xu et al. (2020) and Gaveau et al. (2021) provides evidence for an important shortcoming with our method: the classification of oil palm with radar data can only detect closed-canopy oil palm stands and, thus, excludes areas cleared for oil palm that have been left idle or where oil palm trees died. Moreover, oil palm must be at least 3 years old (Descals et al., 2019) to reach the full canopy closure. Therefore, it is likely that our maps missed young oil palm plantations developed after 2016. The dataset developed in Gaveau et al. (2021) is more suited to verify the impacts of the oil palm industry on forests, while our method is more suited to map the productive planted area, i.e., closed-canopy oil palm stands >3 years old. In contrast, the dataset of Gaveau et al. (2021) was produced mostly by the visual interpretation and manual delimitation of oil palm development, while our method consisted of a supervised learning algorithm; our trained CNN can automatically classify remotely sensed data into oil palm maps for future land cover monitoring.
Since our method classified only closed-canopy oil palm, it also struggled to detect oil palm in nonhomogeneous settings (e.g., oil palm mixed with other crops), plantations with low canopy coverage, and naturally occurring and semi-wild oil palm trees, known as feral oil palm, that are present in Africa. These semi-wild oil palm plantations explain the large difference with the harvested area reported by FAOSTAT in West Africa. This means that our global estimate of total planted oil palm areas (21.00 ± 0.42 Mha) is an underestimate which considers only closed-canopy oil palm plantations. It is difficult to say by how much we underestimate the total planted area if considering young, nonhomogeneous settings and sparse oil palm plantations, but, assuming constant planting rates and an average palm age of 25 years before replanting, we could miss 3/25 = 12 % of the total planted area.
Despite the caveats regarding the total areas of planted oil palm, our findings of the ratio between smallholders and industrial-type plantings are still relevant as both types of oil palm are similarly affected by omission in our analysis (except the oil palm we miss in agroforestry-type settings, which is mostly smallholders). Evidence of this is that the ratios reported by Gaveau et al. (2021) are similar to our estimates in Indonesia. Globally, our data indicate that 72.7 % of planted oil palm is under industrial-scale management and 27.3 % is managed by smallholders. These percentages diverge from the commonly stated claim that 40 % of the palm oil produced globally is from smallholders (Meijaard et al., 2018). Not only is the land managed in smallholder-type settings less than 40 %, but there is also a significant yield gap between industrial-scale and smallholder-scale operators. Smallholder yields are often 40 % or lower than yields in industrially managed plantations (Woittiez et al., 2017), which suggests that the overall contribution of smallholders to global palm oil production is about 18 % rather than 40 %. Industrial-scale operators thus appear to produce about 82 % of the global palm oil. We note that this excludes the locally produced palm oil in agroforestry-type settings in the African tropics, where oil palm is traditionally produced for local consumption.
Our findings on the ratio between smallholder- and industrial-scale oil palm are different from those reported by various governments. For example, the government of Indonesia estimates that 40.8 % of the country's oil-palm-planted area is developed under smallholder licenses, whereas our analysis of the typical characteristics of planted crops indicate that this ratio is 66.8 % industrial and 33.2 % smallholder for the country. To qualify as a “smallholder farmer” in Indonesia, according to the government, farms must be less than 25 ha. Those that cultivate less than 25 ha of oil palm are required to apply for a plantation registration certificate (STD-B), while those producers cultivating more than 25 ha require a plantation business license (IUP-B; Jelsma et al., 2017). The latter involves more complex procedures and regulatory requirements, such as an environmental impact assessment (Paoli et al., 2013). Those with an STD-B are exempted from most of these requirements (Jelsma et al., 2017). This creates an incentive for producers to classify their plantations as nonindustrial scale because the paperwork and licensing involve fewer hurdles. This mismatch between land occupancy (de facto) and legal allocation (de jure) was also noted by Gaveau et al. (2017) in Sumatra, who noted unregistered medium-sized landowners operating like companies in terms of their approach to oil palm development but without formal company status. Missing young plantations cannot explain the large difference we noticed in Indonesia between our planted area estimate and FAO harvested area because expansion has gone down in recent years (Gaveau et al., 2019). In important producing regions (Riau, Sumatra), only 15 % of all agricultural land parcels have a national-level registration, and 26 % of all oil palm plantations were only registered at the village level (Meijaard et al., 2018). Unregistered plantations explain why we found more plantations than FAOSTAT. Discrepancies between this study's findings and those of various governments on the ratio between smallholder- and industrial-scale oil palm could result from underestimations by authorities as identified by Oon et al. (2019). As with Indonesia, it indicates how difficult it is to accurately map smallholder oil palm because of the heterogeneous characteristics of this land use, the lack of legal registration of smallholder lands, and potentially vested interests in running large-scale operations under smallholder-type licenses (Appendix Fig. A8).
The CNN model trained for the year 2019 is planned to be used for follow-up monitoring once a year to generate global oil palm maps. The shortcomings of deep learning include the high computational cost for training the models and the high cost for gathering labeled data compared to the standard machine-learning algorithms commonly used in remote sensing, such as random forest. In this study, 296 images of 1000 × 1000 pixels were used as a training dataset, consisting of 200 labeled images and 96 augmented images, and the computing time for training a pretrained DeepLabv3+ was nearly 8 d with an office computer. Despite this, the computing time and the size of our training dataset were considerably lower than state-of-the-art deep-learning studies in computer vision (i.e., more than 200 000 labeled images in the Common Objects in Context, COCO, dataset) in which the number of classes and complexity of the classification problem surpasses the current study.
The code that generates the Sentinel-1 and Sentinel-2 composites can be found at: https://doi.org/10.5281/zenodo.4617748 (Descals, 2021).
The original code of the semantic segmentation model DeepLabv3+ can be found at: https://github.com/tensorflow/models/tree/master/research/deeplab GitHub (2021).
The dataset presented in this study is freely available for download at https://doi.org/10.5281/zenodo.4473715 (Descals et al., 2021). The dataset contains 634 100 × 100 km tiles covering areas where oil palm plantations were detected. The file grid.shp contains the grid that covers the potential distribution of oil palm. The file grid_withOP.shp shows the 100 × 100 grid squares with the presence of oil palm plantations. The classified images (oil_palm_map folder, in GeoTIFF format) are the output of the convolutional neural network based on Sentinel-1 and Sentinel-2 half-yearly composites. The images have a spatial resolution of 10 m and contain three classes: (1) industrial closed-canopy oil palm plantations, (2) smallholder closed-canopy oil palm plantations, and (3) other land covers and/or uses that are not closed-canopy oil palm. The file Validation_points_GlobalOilPalmLayer_2019.shp includes the 13 495 points that were used to validate the product. Each point includes the attribute “Class”, which is the labeled class assigned by visual interpretation, and the attribute “predClass”, which reflects the predicted class by the convolutional neural network. The “Class” and “predClass” values are the same as the raster files: (1) industrial closed-canopy oil palm plantations, (2) smallholder closed-canopy oil palm plantations, and (3) other land covers/uses that are not closed-canopy oil palm.
The data can be visualized online at the BIOPAMA application portal: https://apps.biopama.org/oilpalm/ (last access: 18 March 2021). The BIOPAMA application portal also includes the probability layer, which shows the probability (from 0 to 100) that a pixel is a closed-canopy oil palm plantation. The data can also be visualized on the Google Earth Engine (GEE) experimental app: https://adriadescals.users.earthengine.app/view/global-oil-palm-map-2019 (last access: 18 March 2021). The global oil palm map is hosted in GEE as an Image Collection: https://code.earthengine.google.com/?asset=users/adriadescals/shared/OP/global_oil_palm_map_v1 (last access: 18 March 2021).
The Sentinel-1 SAR GRD and Sentinel-2 Level-2A used in this study (scenes taken in the second half of 2019 in the tropics and second half of 2016 in Sumatra) are available at https://scihub.copernicus.eu/ (last access: 18 March 2021) and can be retrieved in GEE. When using GEE, the Sentinel-1 and Sentinel-2 data are hosted and accessed in the Earth Engine data catalog (the links to the data are https://developers.google.com/earth-engine/datasets/catalog/COPERNICUS_S1_GRD, last access: 18 March 2021, Earth Engine Data Catalog, 2014, and https://developers.google.com/earth-engine/datasets/catalog/COPERNICUS_S2_SR, last access: 18 March 2021, Earth Engine Data Catalog, 2017, respectively). Despite the fact that the data are hosted by GEE, these satellite data are the same as those accessed via the official portal (Copernicus Open Access Hub: https://scihub.copernicus.eu/, last access: 18 March 2021); data ingested and hosted in GEE are always maintained in their original projection, resolution, and bit depth (Gorelick et al., 2017).
The WorldClim bioclimatic variables (WorldClim V1 Bioclim) (Hijmans et al., 2005) were also accessed through GEE: https://developers.google.com/earth-engine/datasets/catalog/WORLDCLIM_V1_BIO (last access: 18 March 2021). The data can be accessed in the official portal at https://www.worldclim.org/data/v1.4/worldclim14.html (last access: 18 March 2021).
The IUCN industrial oil palm layer (Meijaard et al., 2018) can be found at https://doi.org/10.5061/dryad.ghx3ffbn9 (Meijaard and Gaveau, 2021). The oil palm layer of Indonesia and Malaysia for the year 2016 (Xu et al., 2020) can be found at https://doi.org/10.5281/zenodo.3467071 (Xu et al., 2019). The oil palm layer of Sumatra for the year 2019, developed with the same methodology as in Descals et al. (2019) for Riau province (Indonesia), is hosted as a GEE asset at https://code.earthengine.google.com/?asset=users/adriadescals/shared/Sumatra_oilPalm_L2_Descals_et_al_2019 (last access: 18 March 2021).
Very high-resolution images (spatial resolution <1 m) from DigitalGlobe can be visualized in the GEE code editor or Google Maps (i.e., https://www.google.com/maps/@-3.969372,105.048514,782m/data=!3m1!1e3, last access: 18 March 2021; Google, 2021).
The country-wide harvested area of oil palm was extracted from the FAOSTAT database (accessed on 10 Jun 2020): http://www.fao.org/faostat/en/ (FAO, 2020).
This study presents the first global map of oil palm plantations for the year 2019 derived from remotely sensed data with a spatial resolution of 10 m. We classified Sentinel-1 and Sentinel-2 data onto a map that discriminates between smallholders and industrial oil palm plantations. We obtained high accuracies with user's and consumer's accuracy generally above 80 % thanks to the use of cutting-edge deep-learning algorithms. The method is deployable and can generate yearly maps for oil palm monitoring in a cloud processing environment and based on freely available satellite imagery.
Our global oil palm map makes an important contribution to the palm oil debate. It will be useful to solve or at least clarify a range of social and environmental debates. We know that oil palm plantations are a major cause of deforestation in Indonesia and Malaysia (Austin et al., 2019; Gaveau et al., 2019), but the share of oil-palm-driven deforestation to global tropical forest loss is not known. This map will help to inform the debate on oil-palm-driven deforestation globally. Forest clearing for oil palm is associated with negative socioeconomic impacts on forest-dependent communities (Santika et al., 2019). This map validates a novel approach to mapping where oil palm is grown by smallholders who generate direct income or consumption from their own plantations as opposed to industrial-scale oil palm (or industrial-scale plantings disguised as smallholdings) where plantations provide labor opportunity, but profits are primarily channeled to company owners and the government (through taxes). The data can thus guide better planning for maximizing socioeconomic benefits from oil palm. The global oil palm layer also assists in the discussion about environmental impacts of oil palm, including on biodiversity (Fitzherbert et al., 2008; Meijaard et al., 2018) and regional climate (McAlpine et al., 2018). These negative impacts are real but need to be considered in the light of meeting the global demand for vegetable oil through the optimal allocation of land not just to oil palm but to all major oil-producing crops. This requires high-resolution spatial data for all oil seed crops (Meijaard et al., 2020a) so that informed decisions can be made about land use based on yield differences, past environmental and social impacts of different crops, and the different characteristics of oils from different crops and their particular end uses. Finally, and relevant to the current COVID-19 pandemic, our global map can help localize areas where zoonotic diseases can originate from, especially in areas where oil palm expansion was associated with recent deforestation. Such insights are essential for the health of people and the economy (Wardeh et al., 2020).
Table A1Range of climate values in industrial plantations. These ranges represent the minimum and the maximum values of the WorldClim bioclimatic variables observed in the industrial oil palm plantations of the IUCN layer. The variable names bio05 and bio06 represent the maximum temperature of the warmest month and the minimum temperature of the coldest month.
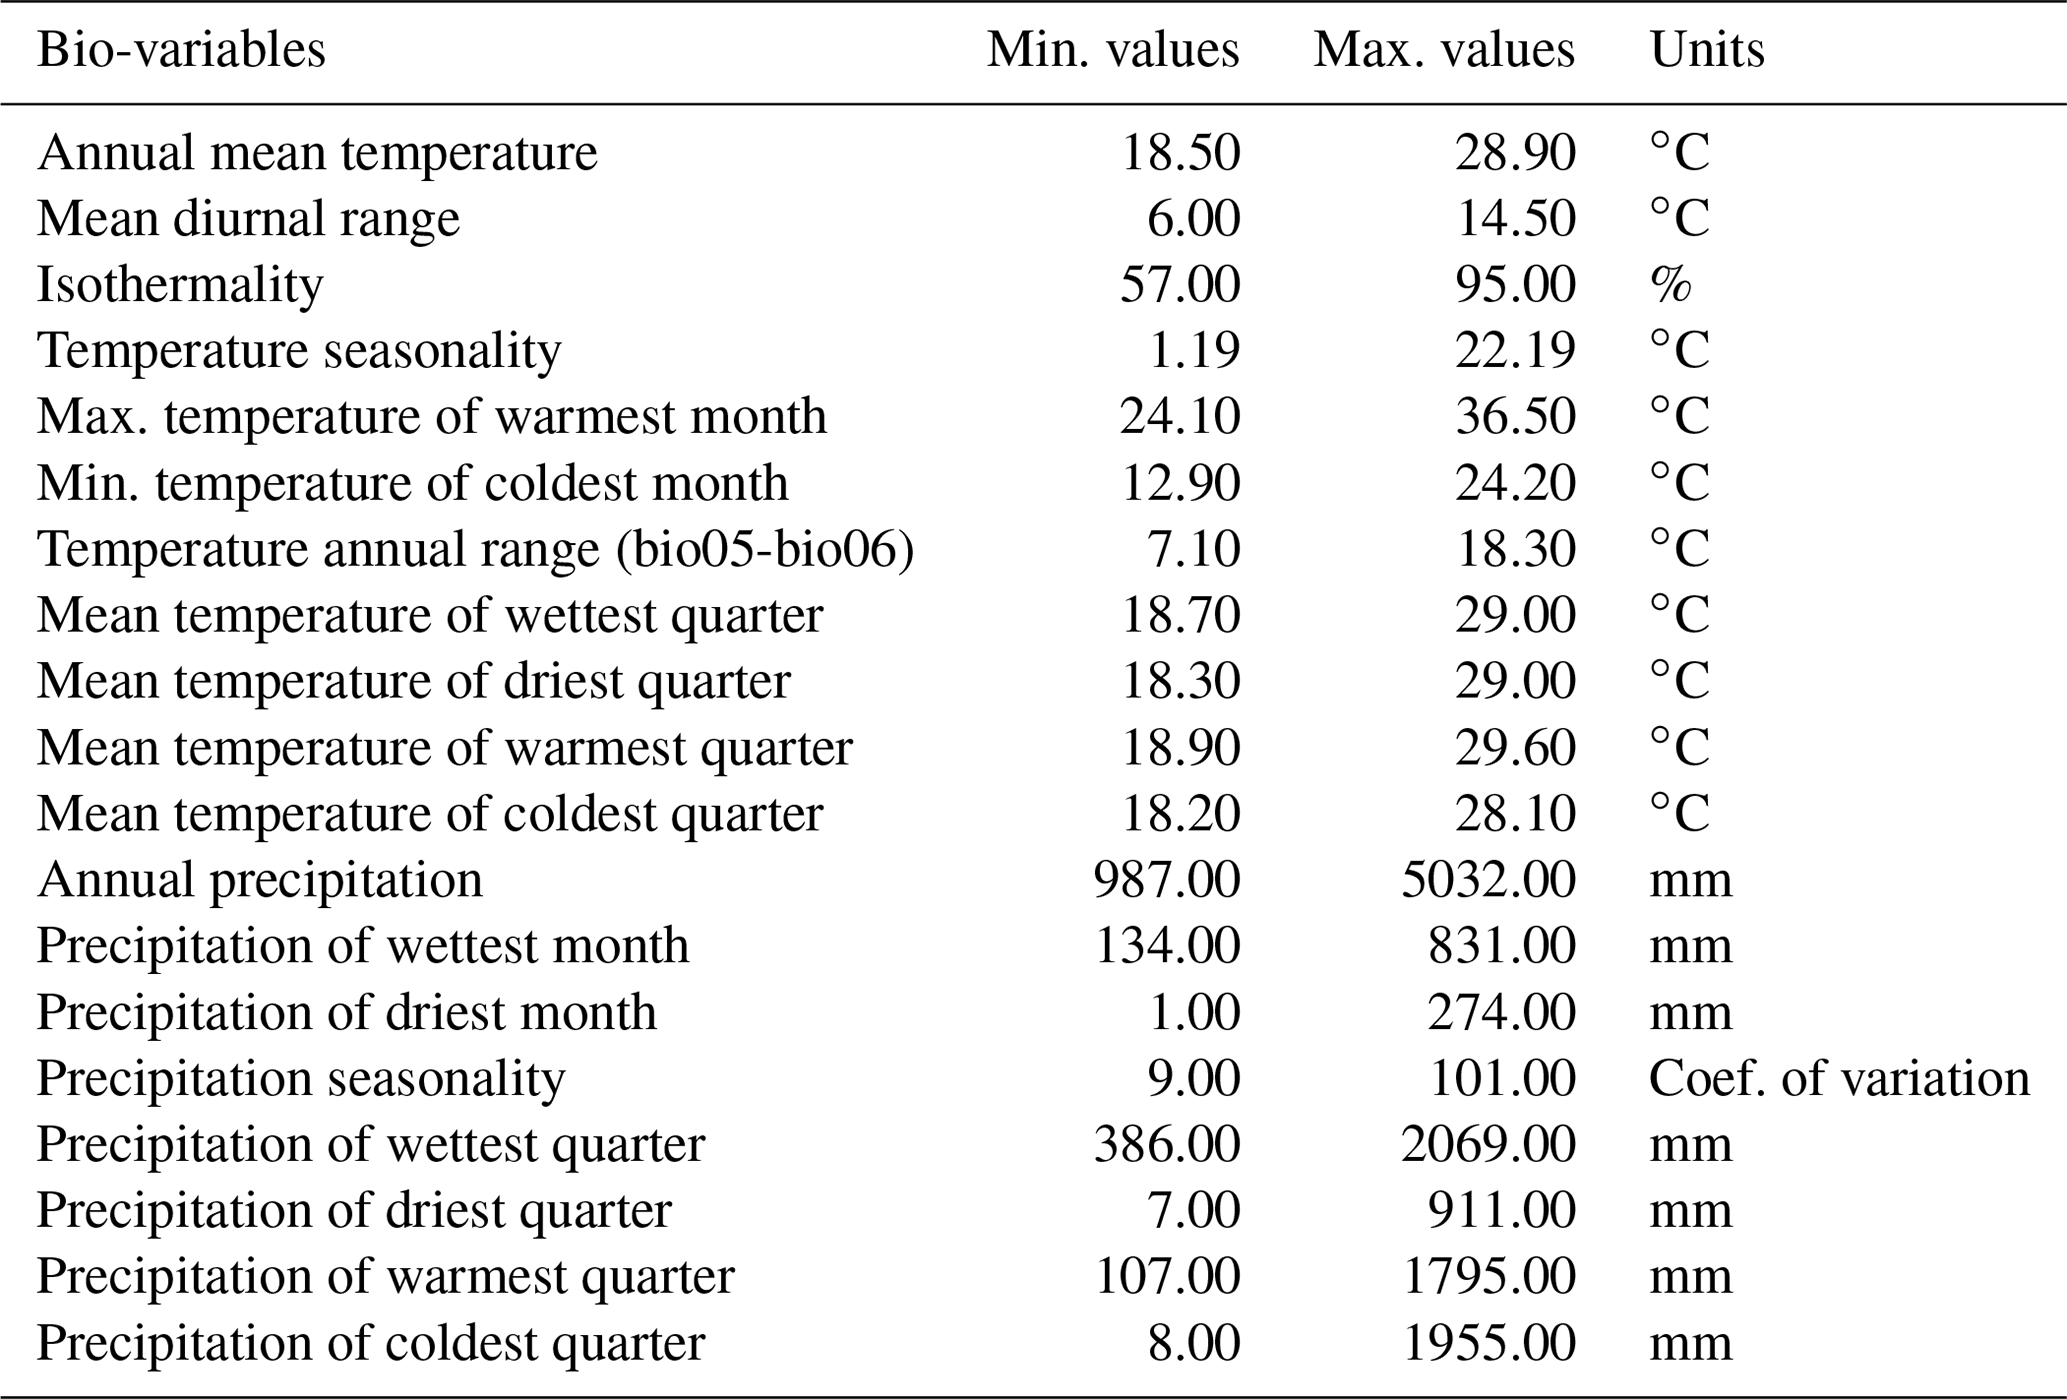
Table A2List of countries where we confirmed the presence of oil palm plantations with the global oil palm layer for the second half of 2019.
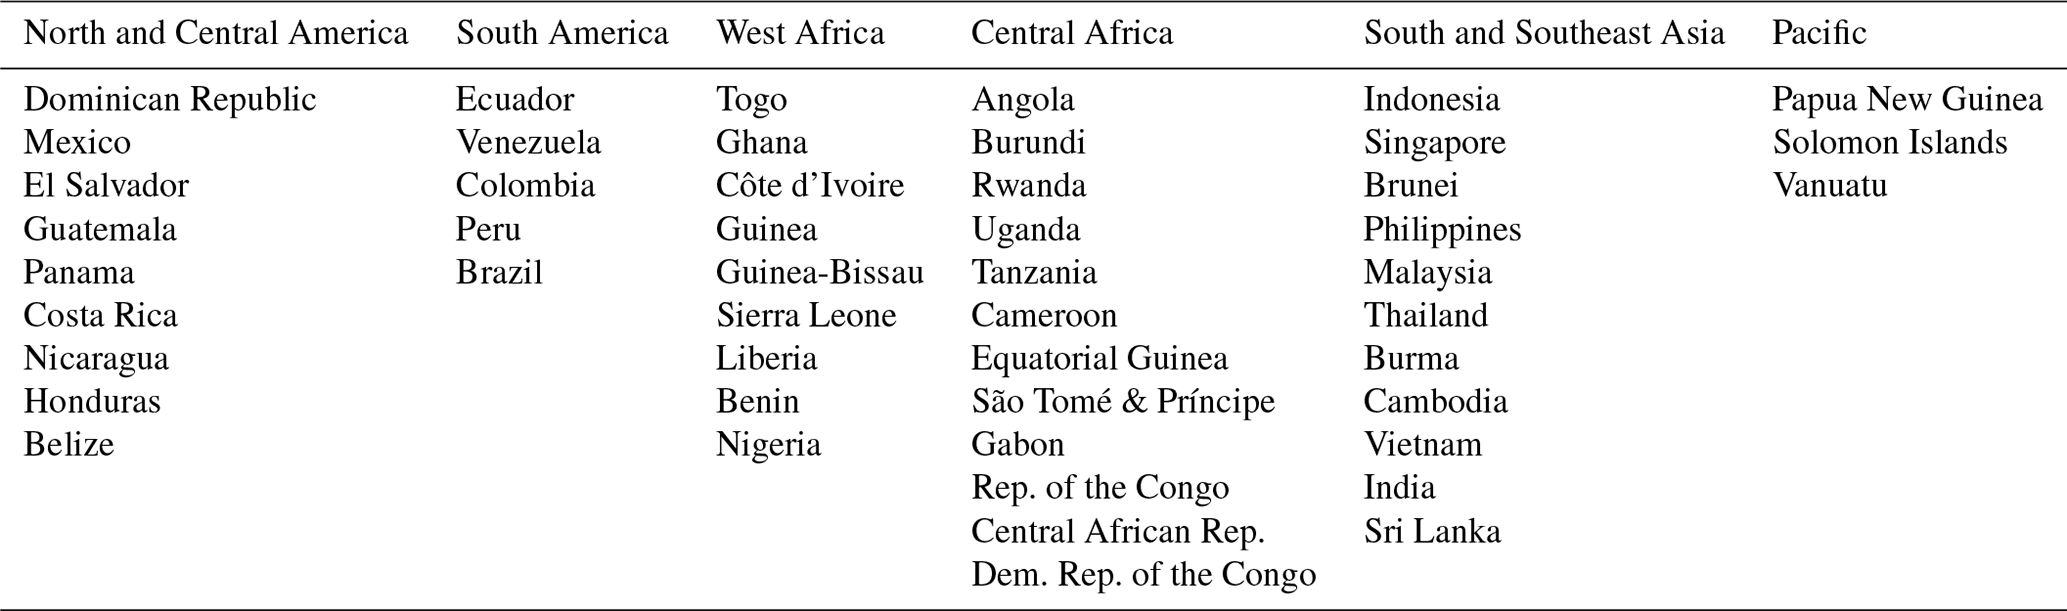
Table A3Confusion matrix of the global oil palm layer (second half of 2019) validated with 10 816 points. Columns represent the mapped classes, and rows are the true label.
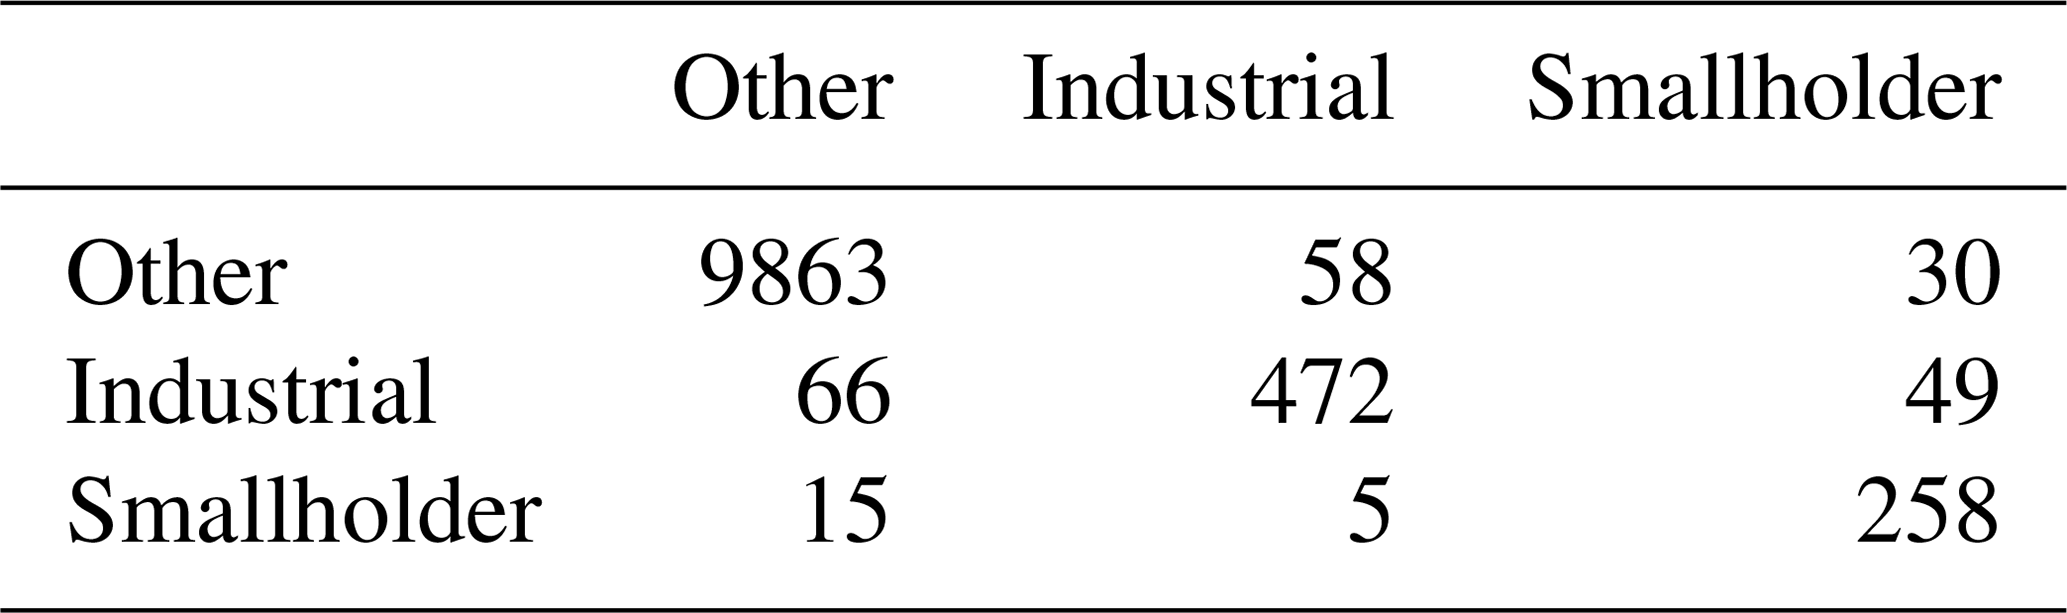
Table A4Comparison of the classification image obtained with the convolutional neural network (CNN) and the classification image presented in Xu et al. (2020) for 2016. In order to compare both methodologies, we applied the CNN to Sentinel-1 and Sentinel-2 composites of the second half of 2016, which corresponds to the last year of the multi-annual analysis in the dataset of Xu et al. (2020). We used 5199 points randomly distributed in the study area, which covers Malaysia, Sumatra, and Borneo. The accuracy metrics are reported with a confidence interval (95 % confidence level).
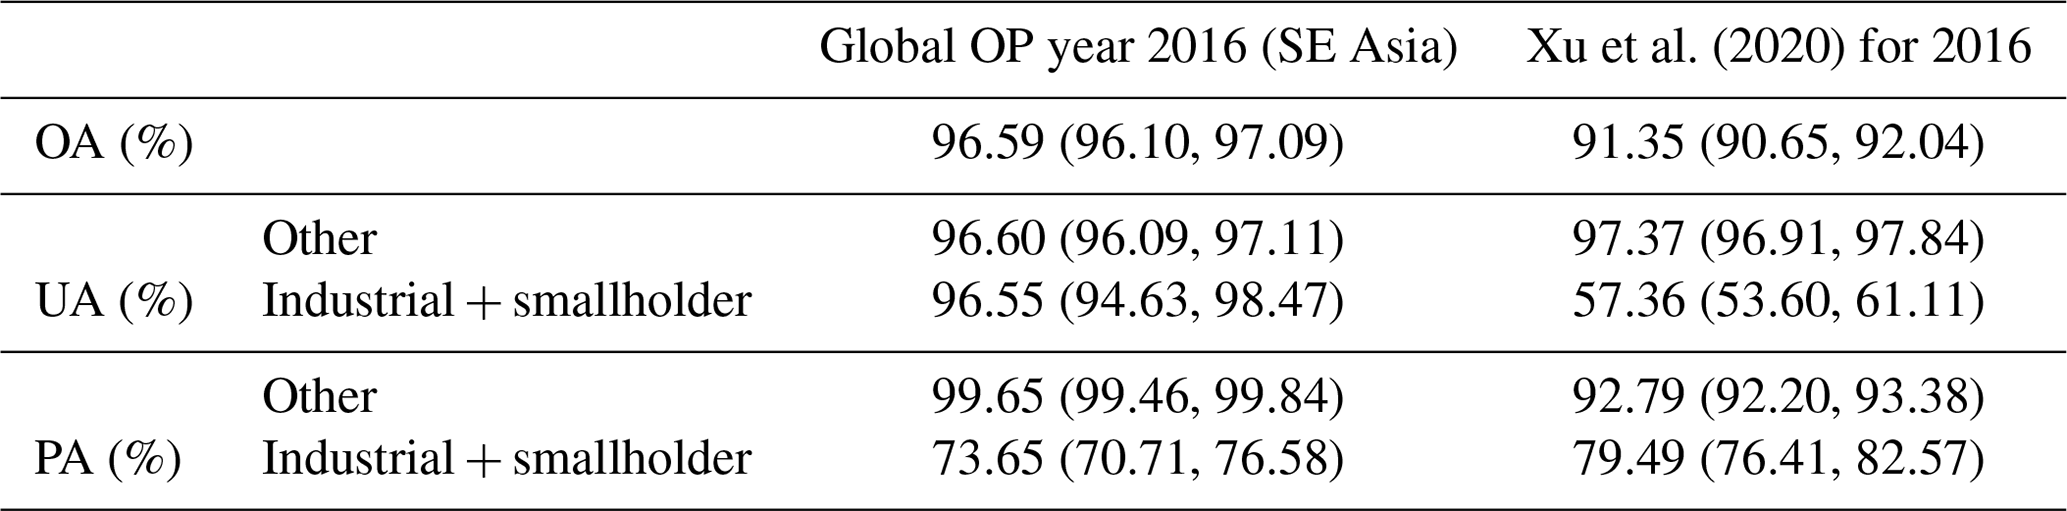
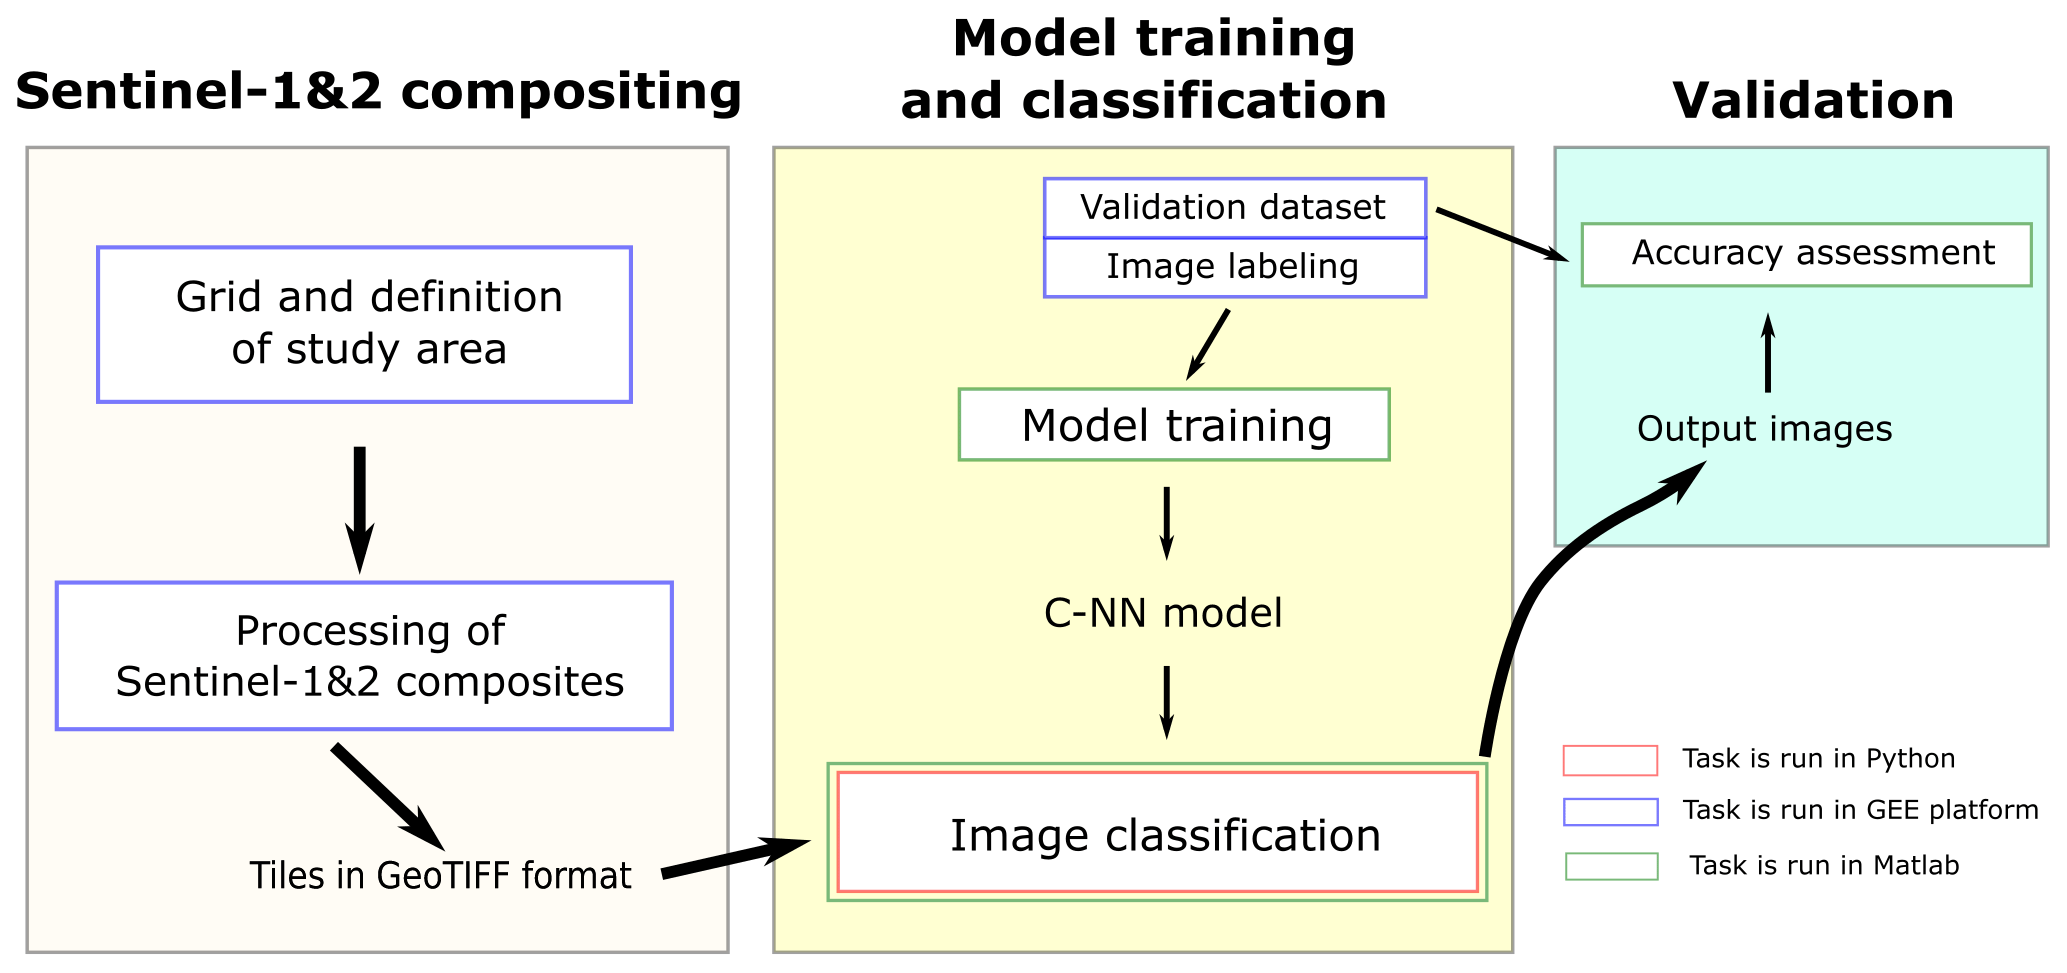
Figure A1Diagram of the workflow for the generation of the oil palm map. The color of the square that surrounds the processing steps depicts the programming environment used. The classification of satellite images was done with Matlab 2019a, but alternatively, the images can be classified with the code distributed in Python.
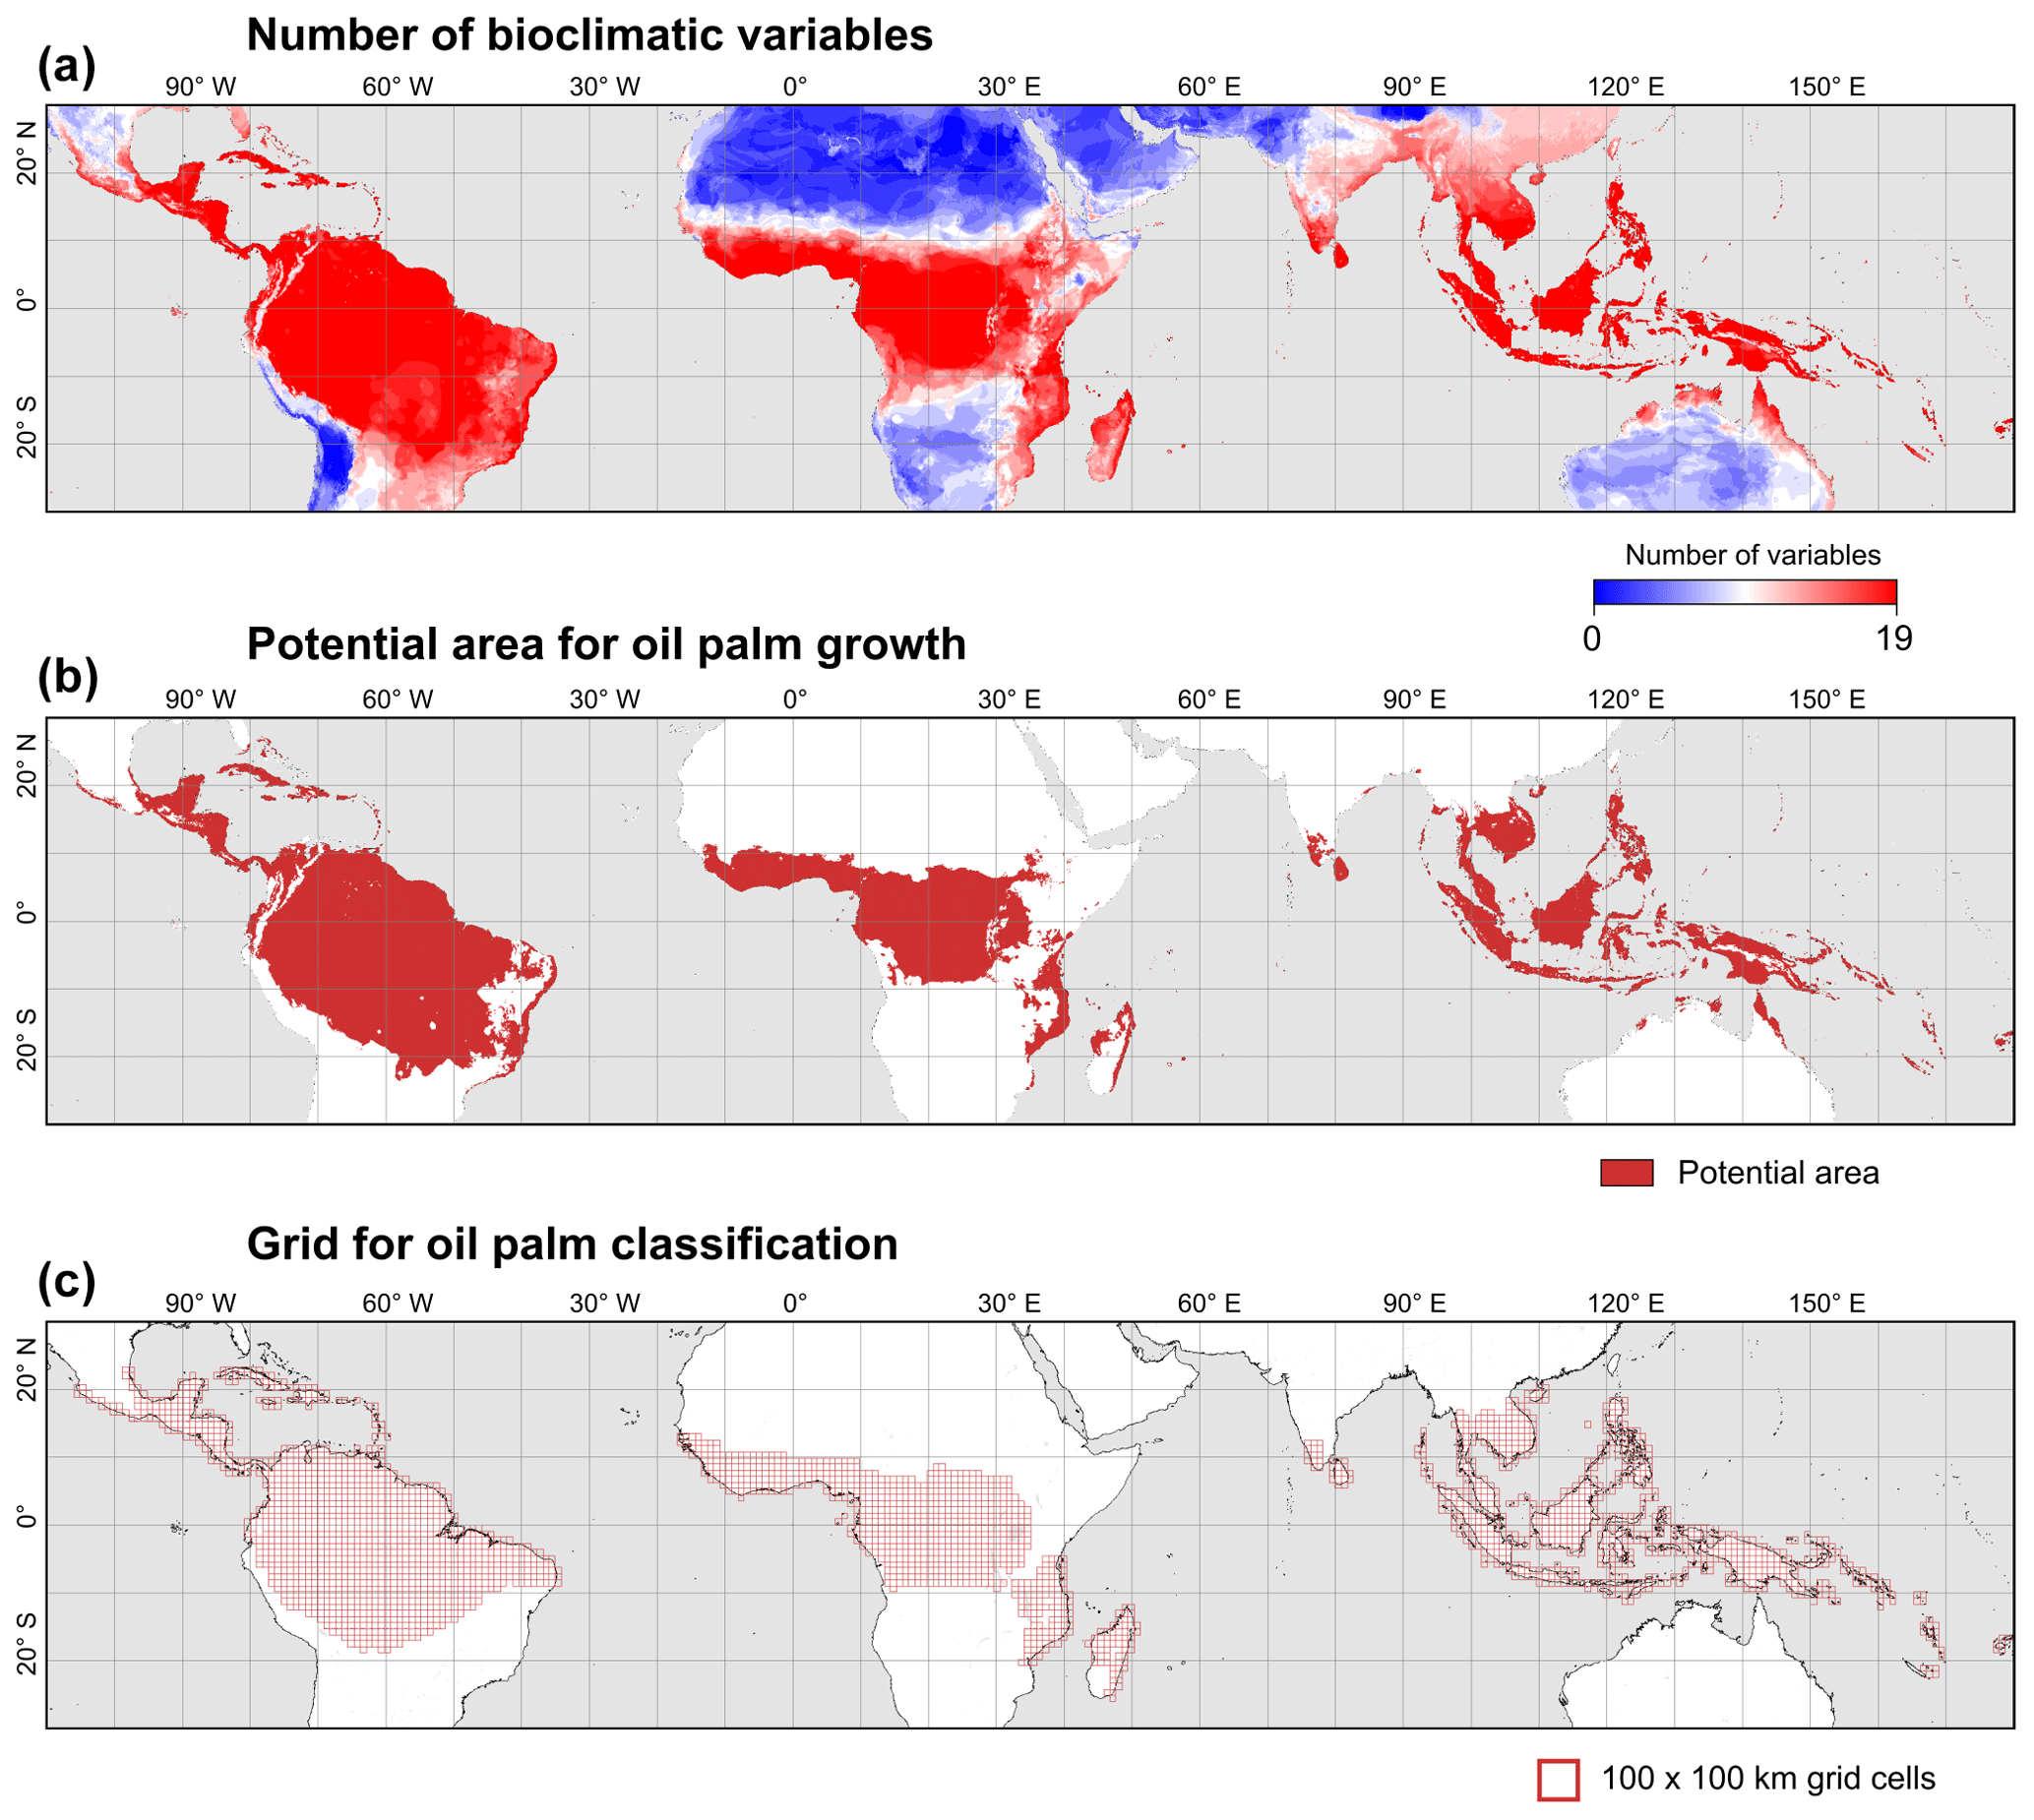
Figure A2Maps generated for the estimation of the study area. The upper map (a) shows the number of WorldClim bioclimatic variables that fall within the range observed in the industrial oil palm plantations (IUCN layer). The middle map (b) shows the potential area for oil palm growth, which represents the pixels with more than 17 bioclimatic variables out of 19 falling within the range observed in the IUCN layer. The lower map (c) reflects the grid used to cover the study area.
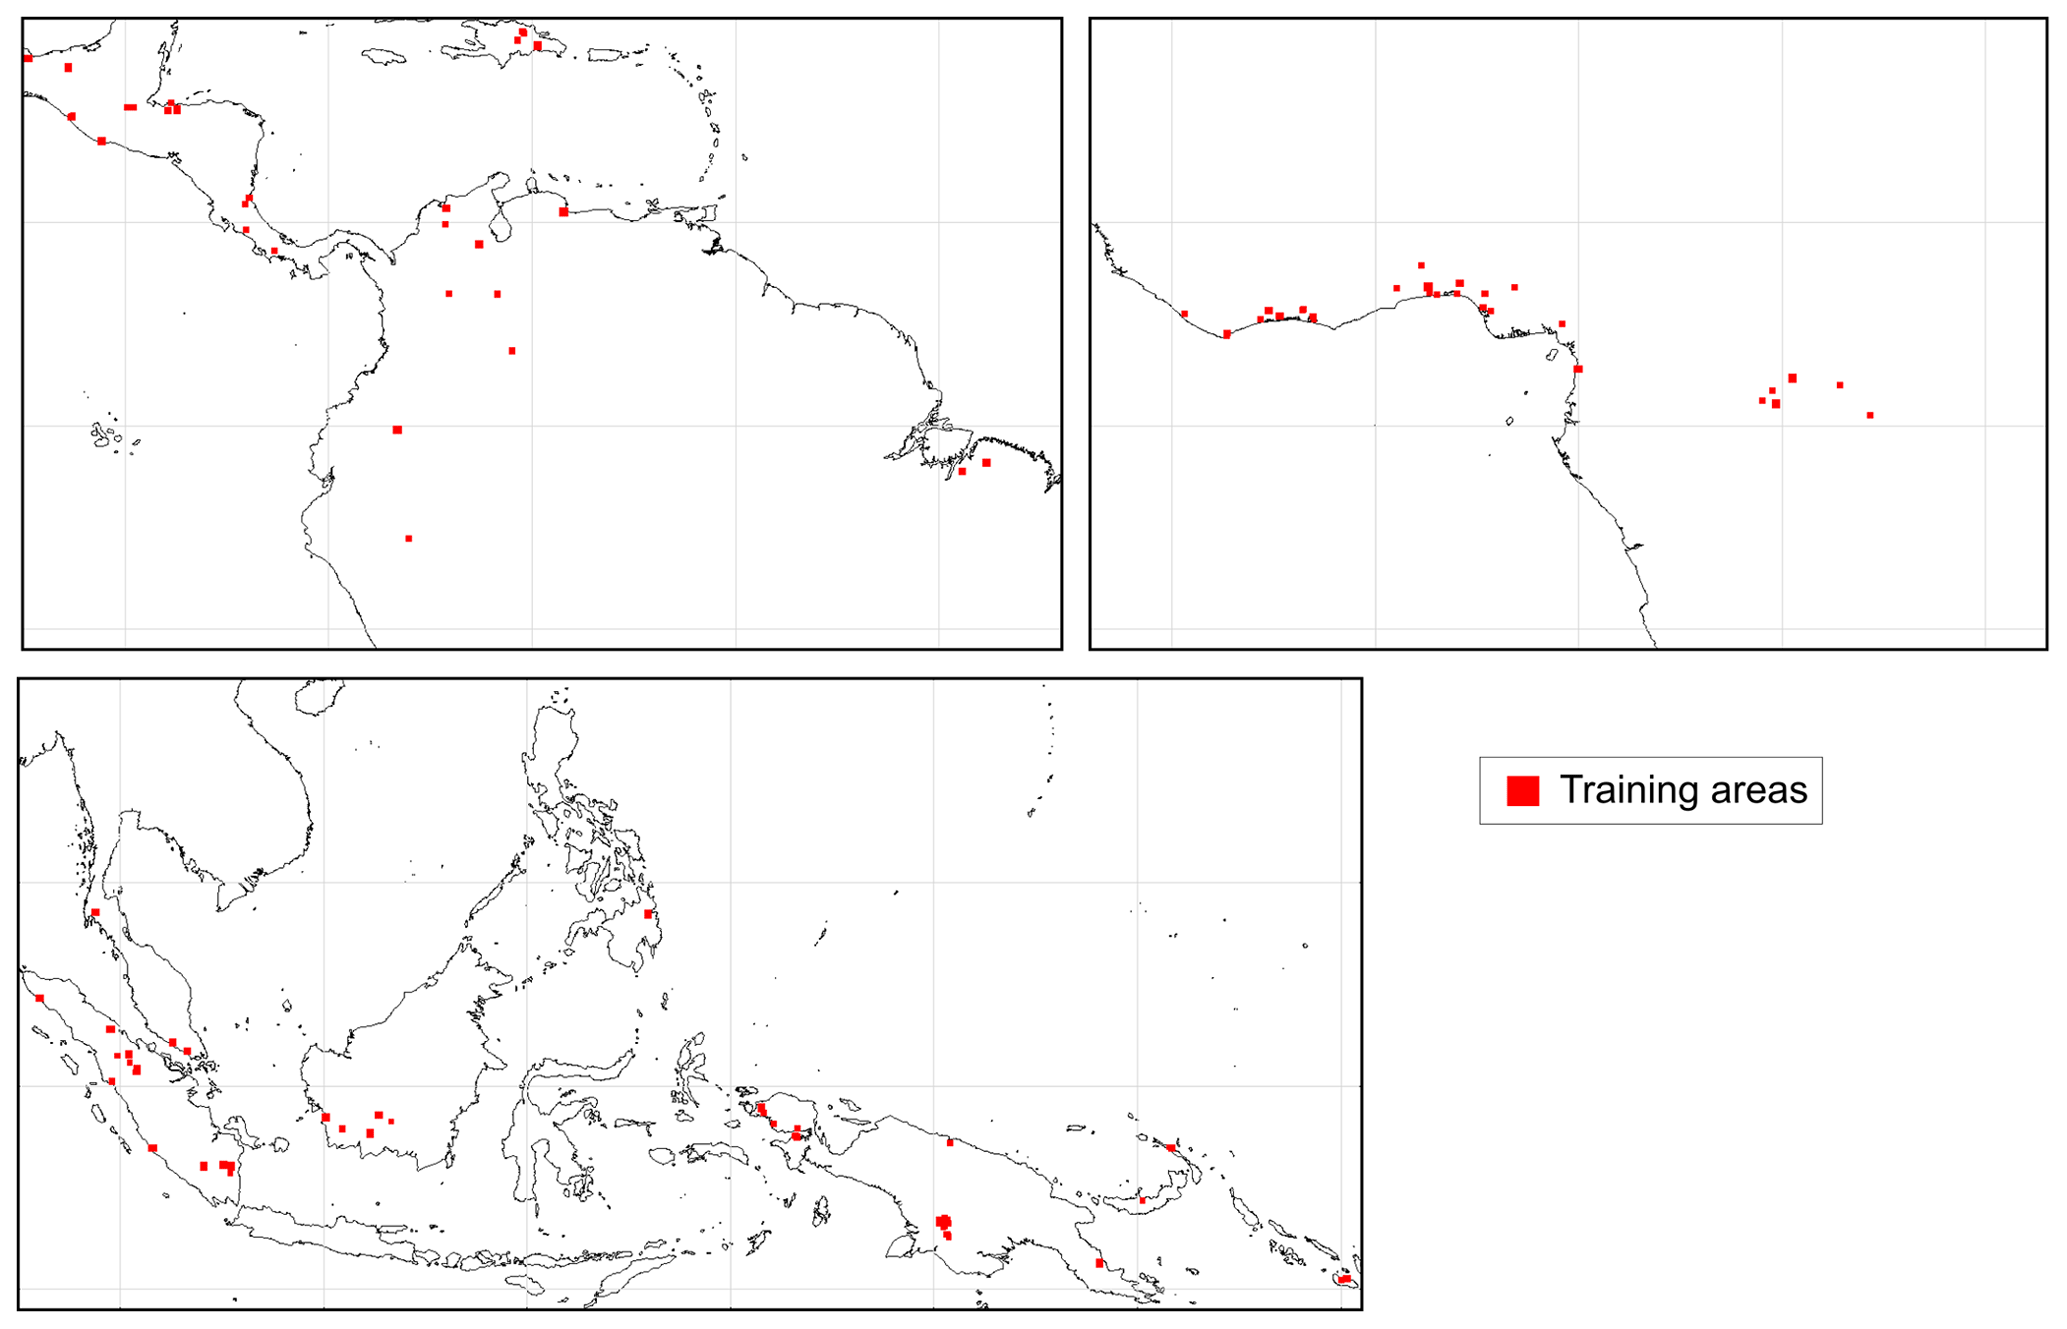
Figure A3Location of areas where Sentinel-1 and Sentinel-2 was collected for training the convolutional neural network.
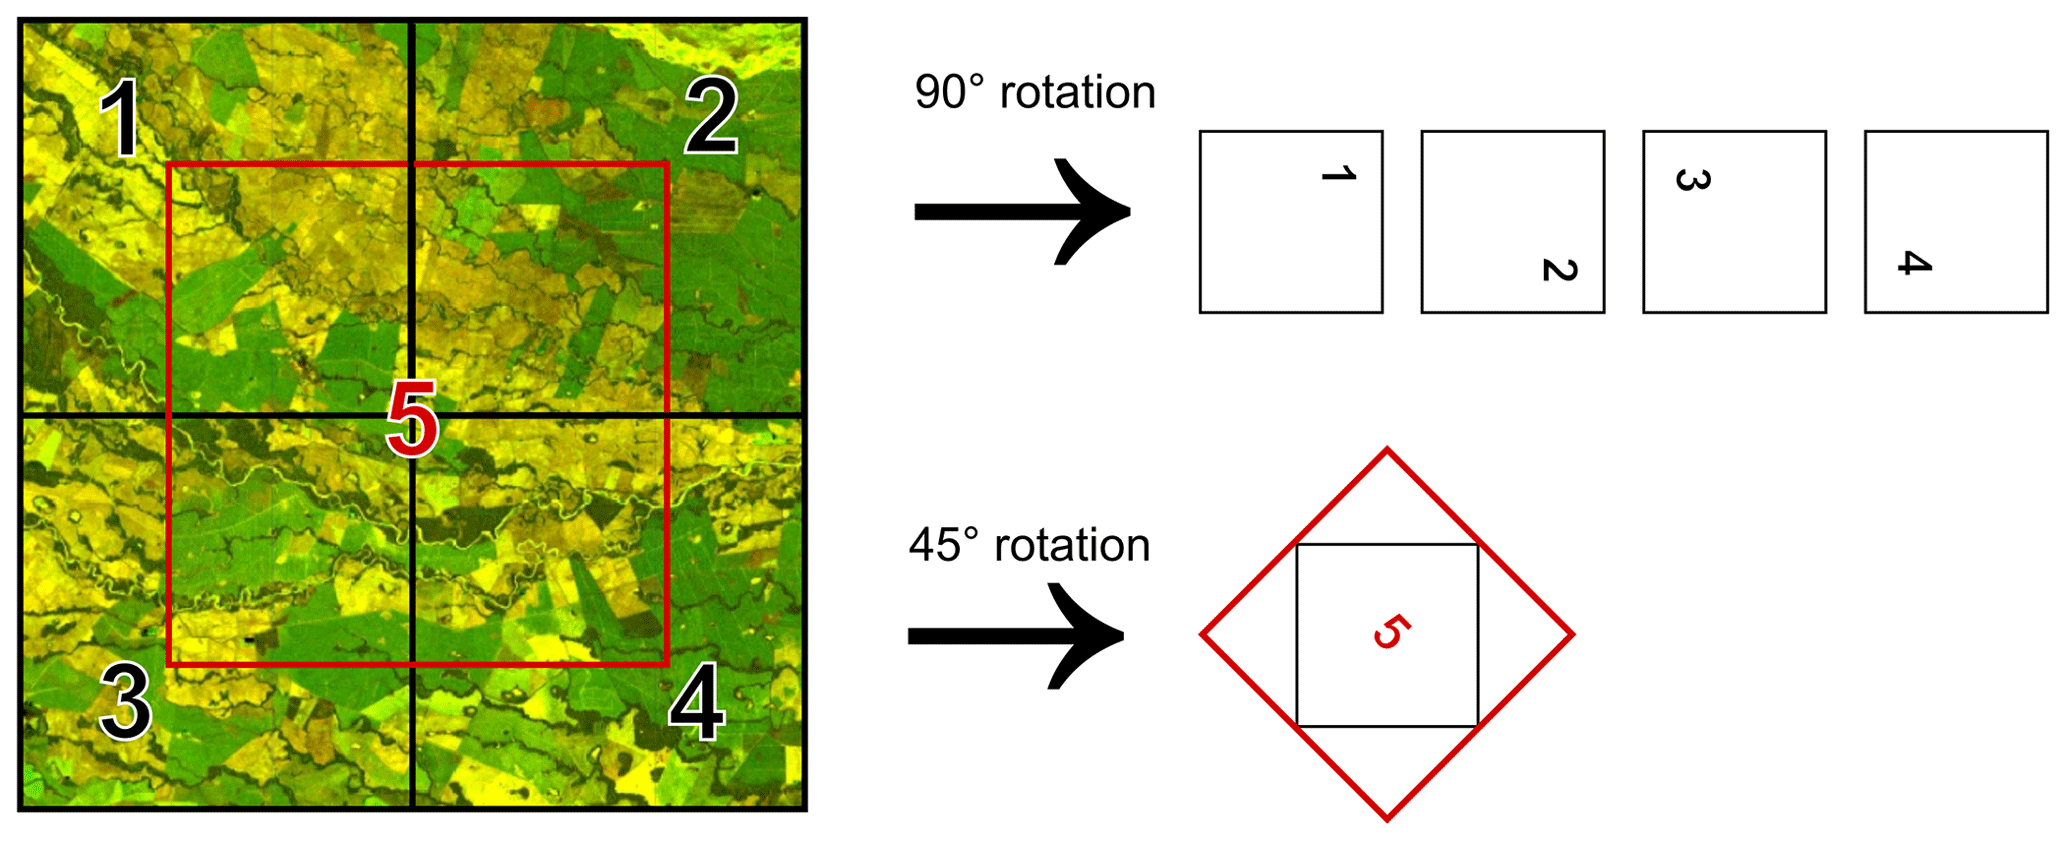
Figure A4Data augmentation used in the training data. Sentinel-1 and Sentinel-2 were labeled in images 1000 × 1000 pixels in size. These training images were rotated 90∘ clockwise to increase the size and quality of the training dataset. We also applied a rotation of 45∘ in labeled images 2000 × 2000 pixels in size (image source: Copernicus Sentinel data 2019).
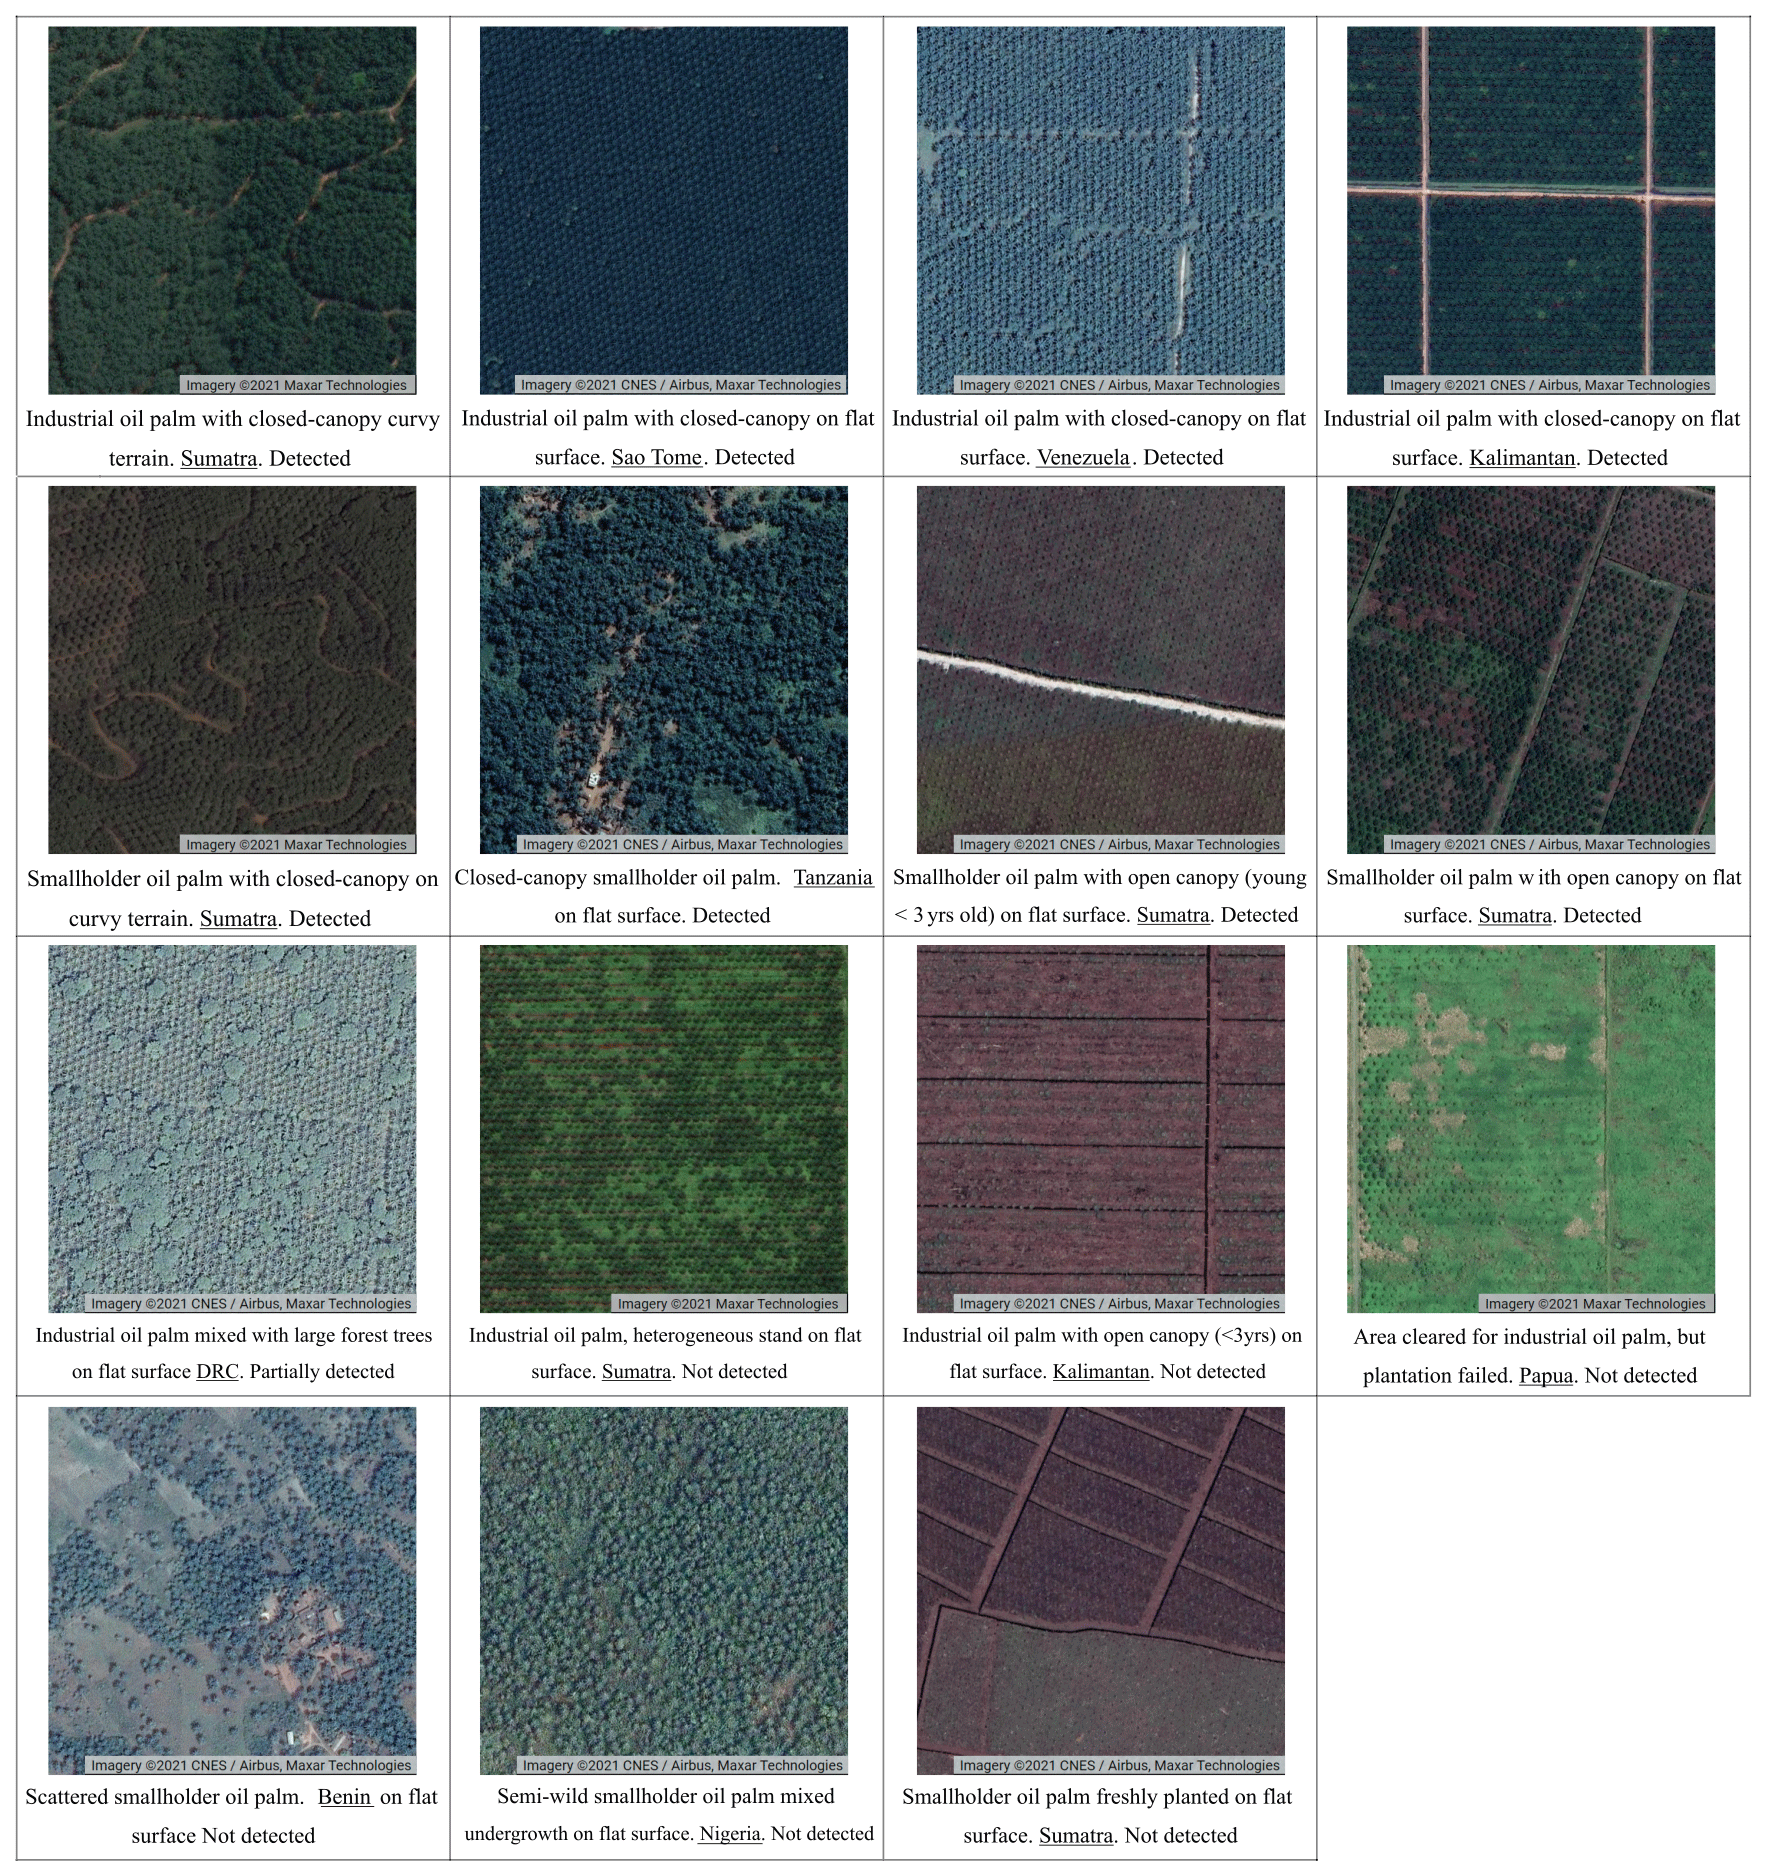
Figure A5Examples of oil palm plantations around the world that have been detected or not detected by the model. One square is about 390 m × 390 m = 15 ha. Source: see individual images and map data from © Google Earth 2021.
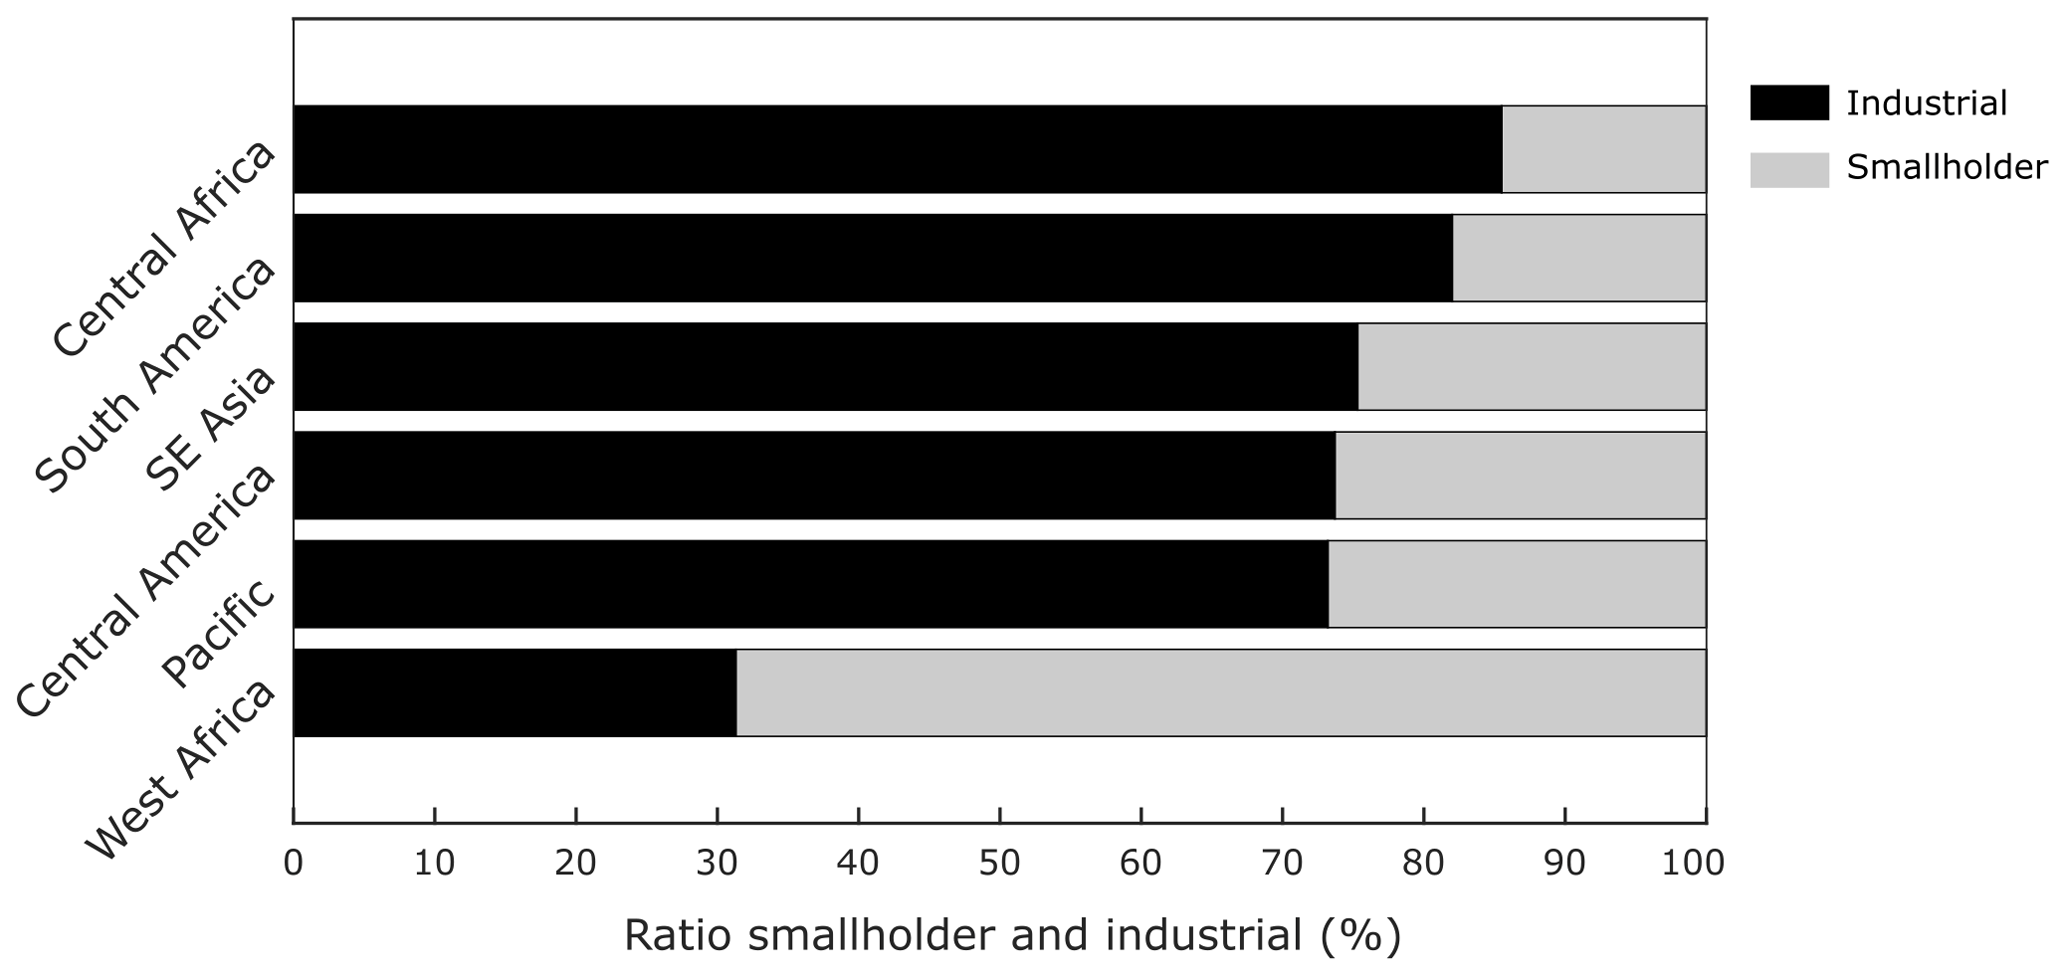
Figure A6Ratio of smallholder and industrial plantations at the sub-continental scale. The ratio was obtained with the global oil palm layer for the second half of 2019.
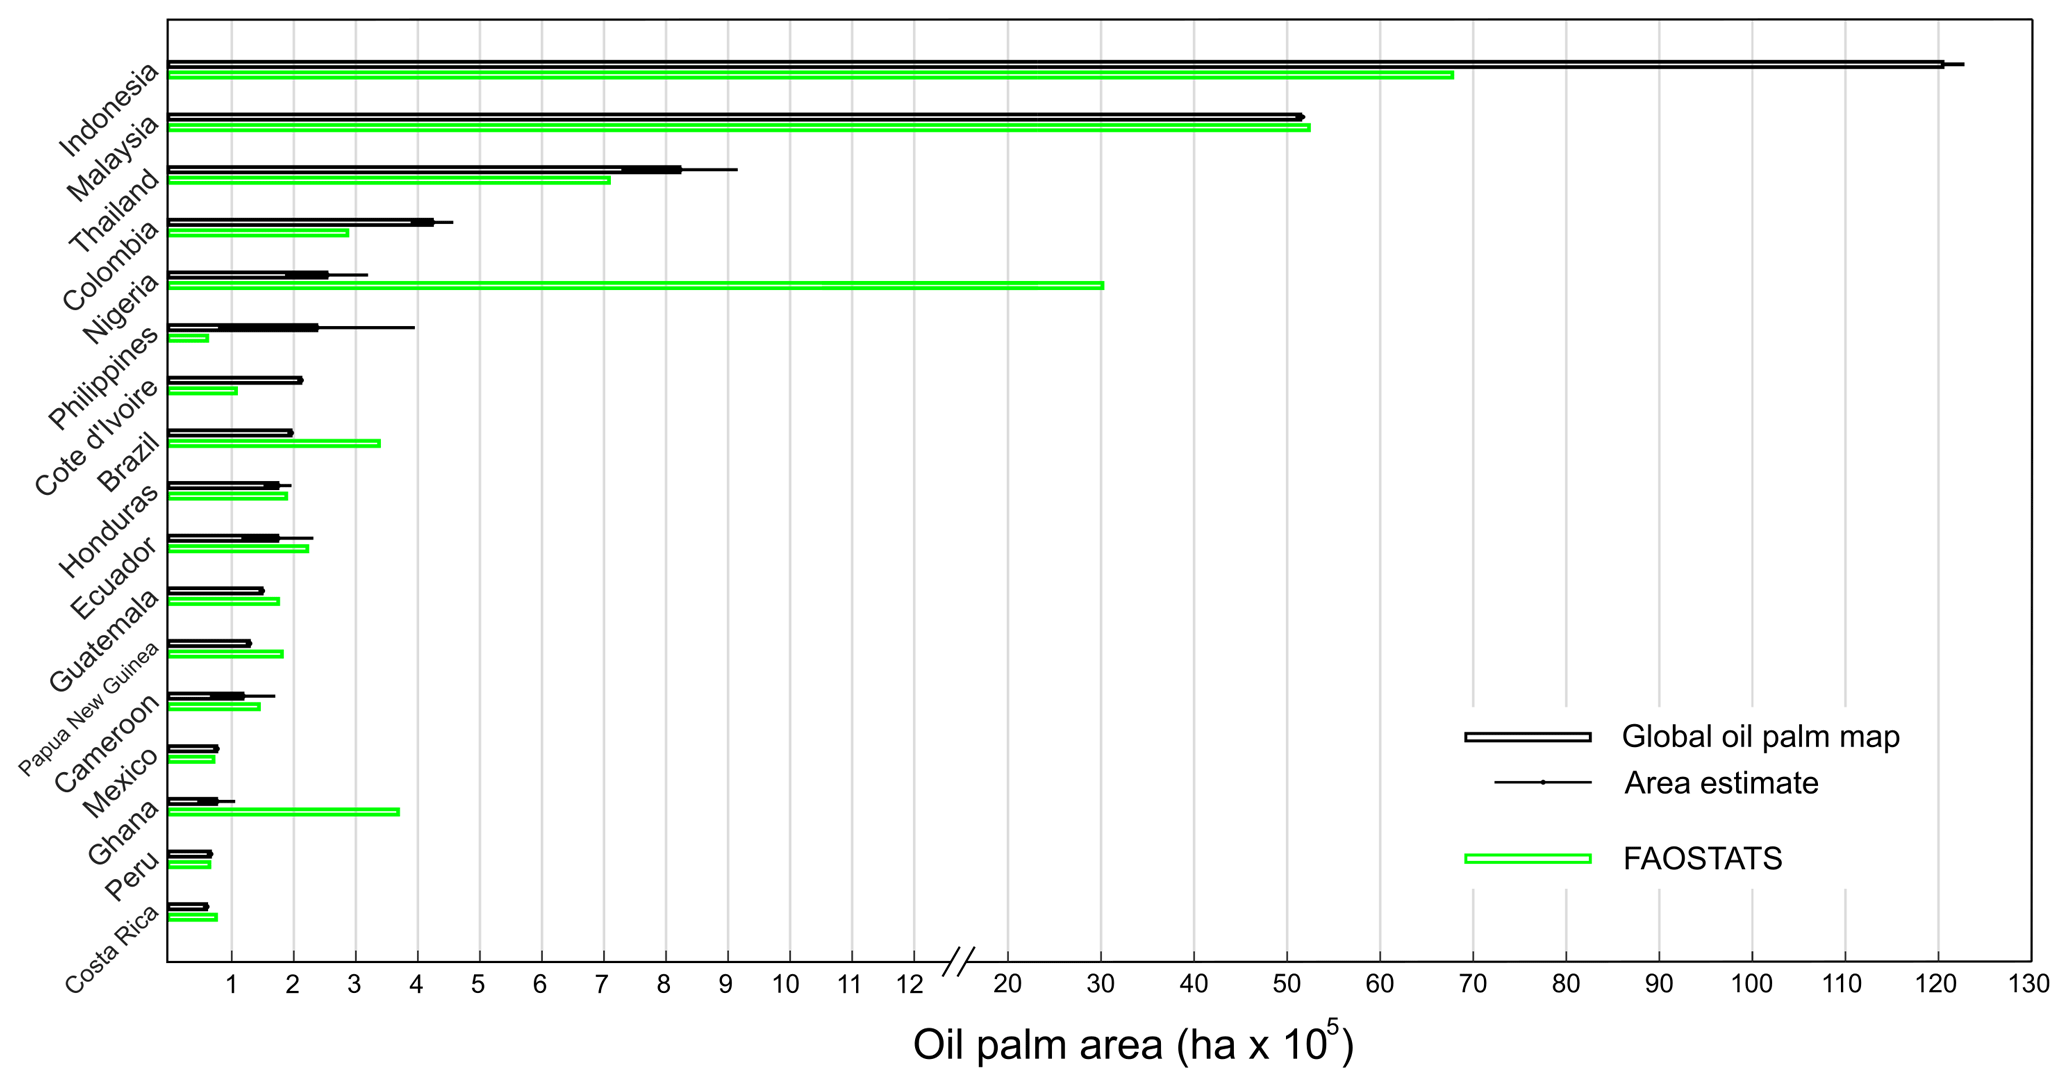
Figure A7Oil palm surface per country generated with the global oil palm map (2019) and extracted from the FAOSTAT “harvested area” for the year 2018. The error bar in the global oil palm map shows the confidence interval with a confidence level of 95 %.
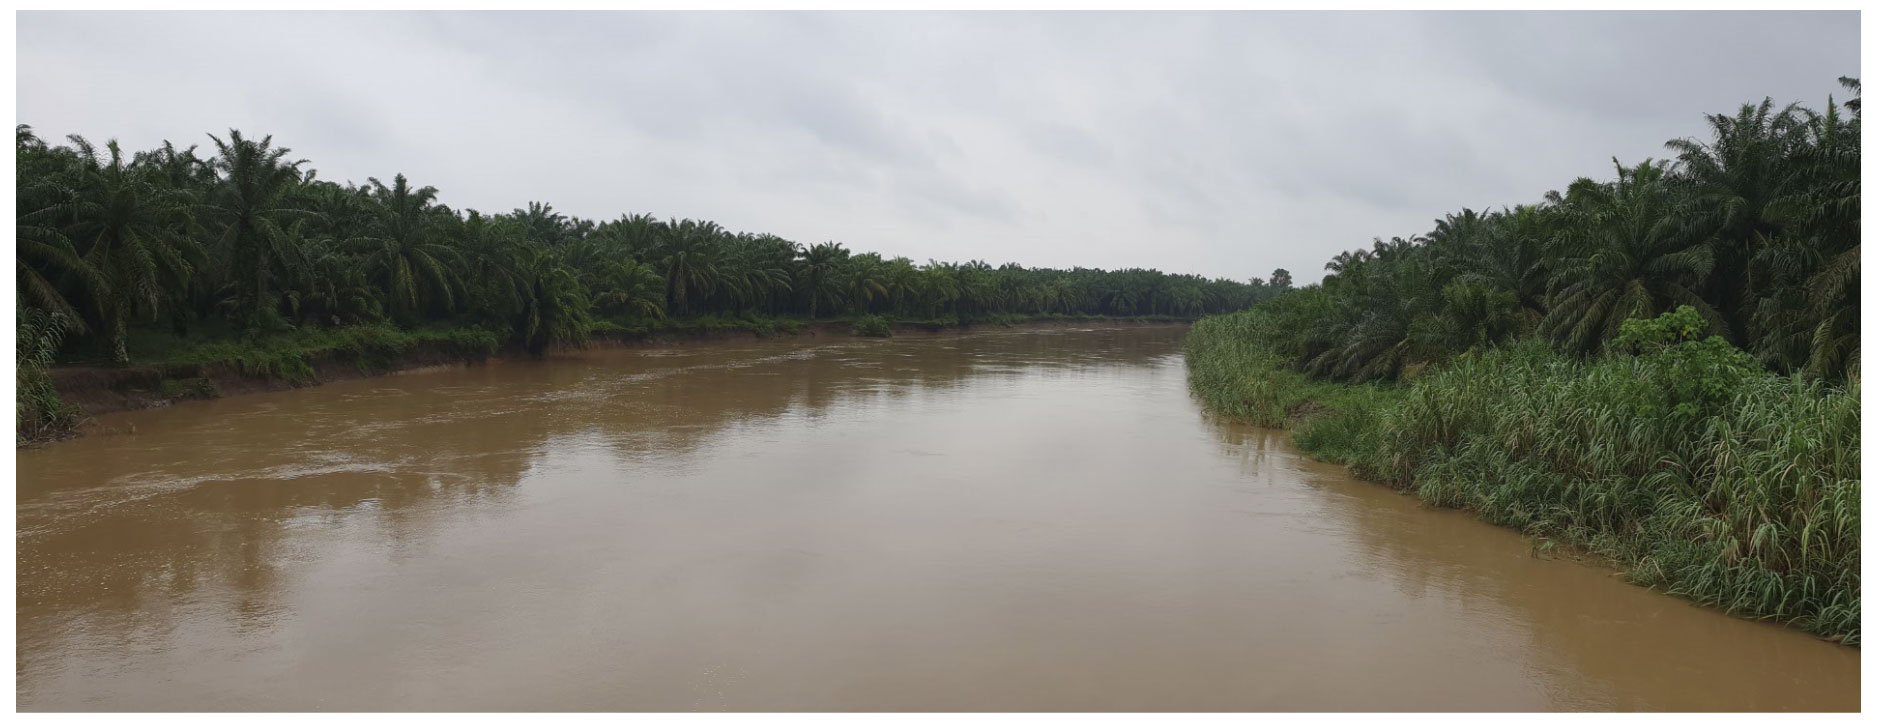
Figure A8Smallholder oil palm planted right up to the river edge in Sumatra. These large areas of industrial-scale oil palm plantings are operated under smallholder licenses, potentially making it easier to bypass environmental legislation to prohibit the planting of oil palm within 50 m of river banks (Foto: Erik Meijaard).
The concept for this work originated from ZS during scientific project discussions with SW, EM, and SP for the goal of providing the scientific and policy-making community with up-to-date and repeatable monitoring capabilities of oil palm plantations. AD and ZS designed the study, AD collected the training data, and AD and SW collected the validation points. AD implemented the data processing workflow. AD, ZS, SW, EM, DLAG, and SP were involved in the analysis, writing, and the revision of the manuscript, and AD generated the figures and tables.
Adrià Descals performed remote-sensing consulting work for the ICT & GIS department at PT Austindo Nusantara Jaya Tbk. Serge Wich received research funding from PT Austindo Nusantara Jaya Tbk, is a member of the IUCN Oil Palm Task Force, and has done oil-palm-related work for this task force. Erik Meijaard chairs and has received funding from the IUCN Oil Palm Task Force, and he has done work paid for by palm oil companies and the Roundtable on Sustainable Palm Oil. David Gaveau is a member of the IUCN Oil Palm Task Force, a group tasked by the IUCN to investigate the sustainability of palm oil, and he has done oil-palm-related work for this task force and Greenpeace.
All features and data are provided “as is” with no warranties of any kind. The views expressed are purely those of the writers and may not in any circumstance be regarded as stating an official position of the European Commission.
The authors would like to thank the BIOPAMA (European Commission, Joint Research Centre) technical developer team members' effort with the online visualization tool (Luca Battistella, Martino Boni, James Davy). The authors also thank Aaron McKinnon (Copernicus Emergency Management Service and Global Land Service – Communication Manager) for proofreading the paper.
This study was supported by the Biodiversity and Protected Areas Management (BIOPAMA) program, an initiative of the Organization of African, Caribbean, and Pacific Group of States financed by the 10th and 11th European Development Funds of the European Union and co-managed by the European Commission Joint Research Centre and the International Union for Conservation of Nature.
This paper was edited by David Carlson and reviewed by two anonymous referees.
Austin, K. G., Schwantes, A., Gu, Y., and Kasibhatla, P. S.: What causes deforestation in Indonesia?, Environ. Res. Lett., 14, 024007, https://doi.org/10.1088/1748-9326/aaf6db, 2019.
Bronkhorst, E., Cavallo, E., van Dorth tot Medler, M., Klinghammer, S., Smit, H. H., Gijsenbergh, A., and van der Laan, C.: Current practices and innovations in smallholder palm oil finance in Indonesia and Malaysia: Long-term financing solutions to promote sustainable supply chains, Center for International Forestry Research (CIFOR), Bogor, Indonesia, https://doi.org/10.17528/cifor/006612, 2017.
Byerlee, D., Falcon, W. P., and Naylor, R.: The tropical oil crop revolution: food, feed, fuel, and forests, Oxford University Press, Oxford, UK, 2017.
Chen, L.-C., Papandreou, G., Kokkinos, I., Murphy, K., and Yuille, A. L.: Deeplab: Semantic image segmentation with deep convolutional nets, atrous convolution, and fully connected crfs, IEEE T. Pattern Anal., 40, 834–848, 2017.
Chen, L.-C., Zhu, Y., Papandreou, G., Schroff, F., and Adam, H.: Encoder-Decoder with Atrous Separable Convolution for Semantic Image Segmentation, in: Computer Vision – ECCV 2018. ECCV 2018. Lecture Notes in Computer Science, vol 11211, edited by: Ferrari, V., Hebert, M., Sminchisescu, C., and Weiss, Y., Springer, Cham, https://doi.org/10.1007/978-3-030-01234-2_49, 2018.
Descals, A.: oil_palm_global v1.0 (Version 1.0), Zenodo, https://doi.org/10.5281/zenodo.4617748, 2021.
Descals, A., Szantoi, Z., Meijaard, E., Sutikno, H., Rindanata, G., and Wich, S.: Oil Palm (Elaeis guineensis) Mapping with Details: Smallholder versus Industrial Plantations and their Extent in Riau, Sumatra, Remote Sens.-Basel, 11, 2590, https://doi.org/10.3390/rs11212590, 2019.
Descals, A., Wich, S., Meijaard, E., Gaveau, D., Peedell, S., and Szantoi, Z.: High resolution global industrial and smallholder oil palm map for 2019 (Version v0) [Data set], Zenodo, https://doi.org/10.5281/zenodo.4473715, 2021.
Drusch, M., Del Bello, U., Carlier, S., Colin, O., Fernandez, V., Gascon, F., Hoersch, B., Isola, C., Laberinti, P., Martimort, P., Meygret, A., Spoto, F., Sy, O., Marchese, F., and Bargellini, P. G.: Sentinel-2: ESA's optical high-resolution mission for GMES operational services, Remote Sens. Environ., 120, 25–36, 2012.
Earth Engine Data Catalog: Sentinel-1 SAR GRD: C-band Synthetic Aperture Radar Ground Range Detected, log scaling, available at: https://developers.google.com/earth-engine/datasets/catalog/COPERNICUS_S1_GRD (last access: 17 March 2021), 2014.
Earth Engine Data Catalog: Sentinel-2 MSI: MultiSpectral Instrument, Level-2A, available at: https://developers.google.com/earth-engine/datasets/catalog/COPERNICUS_S2_SR (last access: 17 March 2021), 2017.
FAO: FAOSTAT statistical database, available at: http://www.fao.org/faostat/en/, last access: 10 June 2020.
Fitzherbert, E. B., Struebig, M. J., Morel, A., Danielsen, F., Brühl, C. A., Donald, P. F., and Phalan, B.: How will oil palm expansion affect biodiversity?, Trends Ecol. Evol., 23, 538–545, 2008.
Gaveau, D., Pirard, R., Salim, M. A., Tonoto, P., Yaen, H., Parks, S. A., and Carmenta, R.: Overlapping land claims limit the use of satellites to monitor no-deforestation commitments and no-burning compliance, Conserv. Lett., 10, 257–264, 2017.
Gaveau, D., Locatelli, B., Salim, M. A., Yaen, H., Pacheco, P., and Sheil, D.: Rise and fall of forest loss and industrial plantations in Borneo (2000–2017), Conserv. Lett., 12, e12622, https://doi.org/10.1111/conl.12622, 2019.
Gaveau, D., Locatelli, B., Salim, M., Husnayaen, H., Manurung, T., Descals, A., Angelsen, A., Meijaard, E., and Sheil D.: Slowing deforestation in Indonesia follows declining oil palm expansion and lower oil prices, 15 January 2021, PREPRINT (Version 1), https://doi.org/10.21203/rs.3.rs-143515/v1, 2021.
GitHub: DeepLab: Deep Labelling for Semantic Image Segmentation, available at: https://github.com/tensorflow/models/tree/master/research/deeplab, last access: 18 March 2021.
Glenday, S. and Gary, P.: Indonesian oil palm smallholder farmers: A typology of organizational models, needs, and investment opportunities, Daemeter Consult., Bogor, Indonesia, 22 pp., 2015.
Google: Industrial oil palm in Sumatra, available at: https://www.google.com/maps/@-3.969372,105.048514,782m/data=!3m1!1e3, last access: 18 March 2021.
Google Earth Engine: DigitalGlobe imagery, available at: https://code.earthengine.google.com, last access: 1 August 2020.
Gorelick, N., Hancher, M., Dixon, M., Ilyushchenko, S., Thau, D., and Moore, R.: Google Earth Engine: Planetary-scale geospatial analysis for everyone, Remote Sens. Environ., 202, 18–27, 2017.
Hijmans, R. J., Cameron, S. E., Parra, J. L., Jones, P. G., and Jarvis, A.: Very high resolution interpolated climate surfaces for global land areas, Int. J. Climatol., 25, 1965–1978, https://doi.org/10.1002/joc.1276, 2005 (data available at: https://developers.google.com/earth-engine/datasets/catalog/WORLDCLIM_V1_BIO, last access: 18 March 2021).
International Food Policy Research Institute: Global Spatially-Disaggregated Crop Production Statistics Data for 2010 Version 2.0, Harvard Dataverse, V4, Washington, D.C., USA, https://doi.org/10.7910/DVN/PRFF8V, 2019.
Jelsma, I., Schoneveld, G. C., Zoomers, A., and Van Westen, A.: Unpacking Indonesia's independent oil palm smallholders: An actor-disaggregated approach to identifying environmental and social performance challenges, Land Use Policy, 69, 281–297, 2017.
Koh, L. P., Miettinen, J., Liew, S. C., and Ghazoul, J.: Remotely sensed evidence of tropical peatland conversion to oil palm, P. Natl. Acad. Sci. USA, 108, 5127–5132, https://doi.org/10.1073/pnas.1018776108, 2011.
LeCun, Y., Bengio, Y., and Hinton, G.: Deep learning, Nature, 521, 436–444, 2015.
Lee, J. S. H., Wich, S., Widayati, A., and Koh, L. P.: Detecting industrial oil palm plantations on Landsat images with Google Earth Engine, Remote Sens. Appl. Soc. Environ., 4, 219–224, 2016.
Li, W., Fu, H., Yu, L., and Cracknell, A.: Deep learning based oil palm tree detection and counting for high-resolution remote sensing images, Remote Sens.-Basel, 9, 22, https://doi.org/10.3390/rs9010022, 2017.
Ma, L., Liu, Y., Zhang, X., Ye, Y., Yin, G., and Johnson, B. A.: Deep learning in remote sensing applications: A meta-analysis and review, ISPRS J. Photogramm., 152, 166–177, 2019.
McAlpine, C. A., Johnson, A., Salazar, A., Syktus, J., Wilson, K., Meijaard, E., Seabrook, L., Dargusch, P., Nordin, H., and Sheil, D.: Forest loss and Borneo's climate, Environ. Res. Lett., 13, 044009, https://doi.org/10.1088/1748-9326/aaa4ff, 2018.
Meijaard, E. and Sheil, D.: The moral minefield of ethical oil palm and sustainable development, Frontiers in Forests and Global Change, 2, 22, https://doi.org/10.3389/ffgc.2019.00022, 2019.
Meijaard, E. and Gaveau, D.: Global oil palm map, Dryad, Dataset, https://doi.org/10.5061/dryad.ghx3ffbn9, 2021.
Meijaard, E., Garcia-Ulloa, J., Sheil, D., Wich, S., Carlson, K. M., Juffe-Bignoli, D., and Brooks, T. M.: Oil palm and biodiversity: a situation analysis by the IUCN Oil Palm Task Force, IUCN, Gland, Switzerland, 116, ISBN 9782831719108, 2018.
Meijaard, E., Abrams, J., Juffe-Bignoli, D., Voigt, M., and Sheil, D.: Coconut oil, conservation and the conscientious consumer, Curr. Biol., 20, R757–R758, https://doi.org/10.1016/j.cub.2020.05.059, 2020a.
Meijaard, E., Brooks, T. M., Carlson, K. M., Slade, E. M., Garcia-Ulloa, J., Gaveau, D. L., Lee, J. S. H., Santika, T., Juffe-Bignoli, D., Struebig, M. J., Wich, S., Ancrenaz, M., Pin Koh, L., Zamira, N., Abrams, J., Prins, H. H. T., Sendashonga, C. N., Murdiyarso, D., Furumo, P. R., Macfarlane, N., Hoffmann, R., Persio, M., Descals, A., Szantoi, Z., and Sheil, D.: The environmental impacts of palm oil in context, Nat. Plants, 6, 1418–1426, https://doi.org/10.1038/s41477-020-00813-w, 2020b.
Miettinen, J. and Liew, S. C.: Separability of insular Southeast Asian woody plantation species in the 50 m resolution ALOS PALSAR mosaic product, Remote Sens. Lett., 2, 299–307, 2011.
Nomura, K., Mitchard, E. T., Patenaude, G., Bastide, J., Oswald, P., and Nwe, T.: Oil palm concessions in southern Myanmar consist mostly of unconverted forest, Sci. Rep.-UK, 9, 1–9, 2019.
OECD: OECD-FAO Agricultural Outlook 2018–2027, OECD Publishing, Paris/FAO, Rome, available at: https://doi.org/10.1787/agr_outlook-2018-en (last access: 18 March 2021), 2018.
Olofsson, P., Foody, G. M., Herold, M., Stehman, S. V., Woodcock, C. E., and Wulder, M. A.: Good practices for estimating area and assessing accuracy of land change, Remote Sens. Environ., 148, 42–57, 2014.
Oon, A., Ngo, K. D., Azhar, R., Ashton-Butt, A., Lechner, A. M., and Azhar, B.: Assessment of ALOS-2 PALSAR-2L-band and Sentinel-1 C-band SAR backscatter for discriminating between large-scale oil palm plantations and smallholdings on tropical peatlands, Remote Sens. Appl. Soc. Environ., 13, 183–190, 2019.
Paoli, G. D., Gillespie, P., Wells, P. L., Hovani, L., Sileuw, A., Franklin, N., and Schweithelm, J.: Oil palm in Indonesia: governance, decision making and implications for sustainable development, The Nature Conservancy Indonesia Program, Jakarta, 2013.
Pirker, J., Mosnier, A., Kraxner, F., Havlík, P., and Obersteiner, M.: What are the limits to oil palm expansion?, Global Environ. Chang., 40, 73–81, 2016.
Sandler, M., Howard, A., Zhu, M., Zhmoginov, A., and Chen, L.-C.: Mobilenetv2: Inverted residuals and linear bottlenecks, in: 2018 IEEE/CVF Conference on Computer Vision and Pattern Recognition, Salt Lake City, UT, USA, 2018, 4510–4520, https://doi.org/10.1109/CVPR.2018.00474, 2018.
Santika, T., Wilson, K. A., Budiharta, S., Kusworo, A., Meijaard, E., Law, E. A., Friedman, R., Hutabarat, J. A., Indrawan, T. P., St. John, F. A., and Struebig, M. J.: Heterogeneous impacts of community forestry on forest conservation and poverty alleviation: Evidence from Indonesia, People Nat., 1, 204–219, 2019.
Shaharum, N. S. N., Shafri, H. Z. M., Ghani, W. A. W. A. K., Samsatli, S., Al-Habshi, M. M. A., and Yusuf, B.: Oil palm mapping over Peninsular Malaysia using Google Earth Engine and machine learning algorithms, Remote Sens. Appl. Soc. Environ., 17, 100287, https://doi.org/10.1016/j.rsase.2020.100287, 2020.
Shorten, C. and Khoshgoftaar, T. M.: A survey on image data augmentation for deep learning, J. Big Data, 6, 60, https://doi.org/10.1186/s40537-019-0197-0, 2019.
Strona, G., Stringer, S. D., Vieilledent, G., Szantoi, Z., Garcia-Ulloa, J., and Wich, S. A.: Small room for compromise between oil palm cultivation and primate conservation in Africa, P. Natl. Acad. Sci. USA, 115, 8811–8816, 2018.
Torres, R., Snoeij, P., Geudtner, D., Bibby, D., Davidson, M., Attema, E., Potin, P., Rommen, B., Floury, N., Brown, M., Navas Traver, I., Deghaye, P., Duesmann, B., Rosich, B., Miranda, N., Bruno, C., L'Abbate, M., Croci, R., Pietropaolo, A., Huchler, M., and Rostan, F.: GMES Sentinel-1 mission, Remote Sens. Environ., 120, 9–24, 2012.
Wardeh, M., Sharkey, K. J., and Baylis, M.: Integration of shared-pathogen networks and machine learning reveals the key aspects of zoonoses and predicts mammalian reservoirs, P. R. Soc. B, 287, 20192882, https://doi.org/10.1098/rspb.2019.2882, 2020.
Wich, S. A., Garcia-Ulloa, J., Kühl, H. S., Humle, T., Lee, J. S., and Koh, L. P.: Will oil palm's homecoming spell doom for Africa's great apes?, Curr. Biol., 24, 1659–1663, 2014.
Woittiez, L. S., van Wijk, M. T., Slingerland, M., van Noordwijk, M., and Giller, K. E.: Yield gaps in oil palm: A quantitative review of contributing factors, Eur. J. Agron., 83, 57–77, 2017.
Xu, Y., Yu, L., Li, W., Ciais, P., Cheng, Y., and Gong, P.: Annual oil palm plantation maps in Malaysia and Indonesia from 2001 to 2016 [Data set], Zenodo, https://doi.org/10.5281/zenodo.3467071, 2019.
Xu, Y., Yu, L., Li, W., Ciais, P., Cheng, Y., and Gong, P.: Annual oil palm plantation maps in Malaysia and Indonesia from 2001 to 2016, Earth Syst. Sci. Data, 12, 847–867, https://doi.org/10.5194/essd-12-847-2020, 2020.
Yu, X., Wu, X., Luo, C., and Ren, P.: Deep learning in remote sensing scene classification: a data augmentation enhanced convolutional neural network framework, Gisci. Remote Sens.,, 54, 741–758, https://doi.org/10.1080/15481603.2017.1323377, 2017.