the Creative Commons Attribution 4.0 License.
the Creative Commons Attribution 4.0 License.
 | 22 Mar 2021
Facility-scale inventory of dairy methane emissions in California: implications for mitigation
Deanne Meyer
Marc L. Fischer
Seongeun Jeong
Talha Rafiq
Michelle Carr
Francesca M. Hopkins
Dairies emit roughly half of total methane (CH4) emissions in California, generating CH4 from both enteric fermentation by ruminant gut microbes and anaerobic decomposition of manure. Representation of these emission processes is essential for management and mitigation of CH4 emissions and is typically done using standardized emission factors applied at large spatial scales (e.g., state level). However, CH4-emitting activities and management decisions vary across facilities, and current inventories do not have sufficiently high spatial resolution to capture changes at this scale. Here, we develop a spatially explicit database of dairies in California, with information from operating permits and California-specific reports detailing herd demographics and manure management at the facility scale. We calculated manure management and enteric fermentation CH4 emissions using two previously published bottom-up approaches and a new farm-specific calculation developed in this work. We also estimate the effect of mitigation strategies – the use of mechanical separators and installation of anaerobic digesters – on CH4 emissions. We predict that implementation of digesters at the 106 dairies that are existing or planned in California will reduce manure CH4 emissions from those facilities by an average of 26 % and total state CH4 emissions by 5 % (or ∼36.5 Gg CH4/yr). In addition to serving as a planning tool for mitigation, this database is useful as a prior for atmospheric observation-based emissions estimates, attribution of emissions to a specific facility, and validation of CH4 emissions reductions from management changes. Raster files of the datasets and associated metadata are available from the Oak Ridge National Laboratory Distributed Active Archive Center for Biogeochemical Dynamics (ORNL DAAC; Marklein and Hopkins, 2020; https://doi.org/10.3334/ORNLDAAC/1814).
- Article
(1285 KB) - Full-text XML
-
Supplement
(241 KB) - BibTeX
- EndNote


Methane (CH4) is a greenhouse gas with a large influence on the rate of short-term warming due to its high global warming potential, roughly 85 times that of CO2 in a 20-year time frame (Dlugokencky et al., 2011). Climate mitigation policy in California targets a reduction in CH4 emissions by 40 % below 2013 inventory levels by 2030 (State of California, 2016). Dairies provide a major opportunity for CH4 reduction, as roughly half of state-total CH4 emissions come from nearly equal contributions of enteric fermentation by ruminant gut microbes and anaerobic decomposition of dairy manure (Charrier, 2016). The primary method by which California currently plans to reduce dairy CH4 emissions is through installation of anaerobic digesters, which capture manure CH4 emissions for subsequent use as a renewable biofuel (State of California, 2016). However, facility-level measurements of both the magnitude of total emissions and relative contributions of enteric fermentation versus manure management are only available for a few dairies in the state (Arndt et al., 2018). Indeed, uncertainty in CH4 emissions from the dairy industry in California and globally makes it difficult to optimize mitigation actions at the spatial scales relevant to policy and to establish an emissions baseline against which mitigation efforts can be measured.
CH4 emissions are often estimated by bottom-up (calculated activity-based) or top-down (atmospheric observation-based) methods (NASEM, 2018). Bottom-up inventories, including those used by the US Environmental Protection Agency (US EPA, 2017) and the California Air Resources Board (Charrier, 2016), estimate dairy emission rates at the state level based on the total number of cows and herd demographics and on the average statewide manure management approach, CH4 emissions factor, and climate. However, livestock emissions, especially from dairies, remain one of the largest uncertainties in these inventories (Maasakkers et al., 2016), as there is no comprehensive information source for the number of cows or manure management strategies. In addition, the lack of spatial and temporal detail in these inventories makes it difficult to verify their accuracy with observational data, particularly given high levels of spatial variability observed for CH4 emissions (NASEM, 2018).
Top-down estimates of emissions measure atmospheric CH4 enhancements at farm to regional scales using one or a combination of ground, aircraft, and satellite observations (Arndt et al., 2018; Cui et al., 2017; Wecht et al., 2014). Top-down studies often report CH4 emissions for dairies up to 2 times higher than bottom-up measurements (Cui et al., 2017; Jeong et al., 2016; Miller et al., 2013; NASEM, 2018; Trousdell et al., 2016; Wolf et al., 2017). However, these comparisons are complicated by uncertainties in source attribution, atmospheric transport models, and the spatial and temporal mismatch that commonly exists between top-down estimates and bottom-up inventories.
Previous bottom-up inventories have estimated national (e.g., US EPA 2017 Greenhouse Gas Inventory, US EPA, 2017) and statewide (e.g., CARB Greenhouse Gas Inventory, Charrier, 2016) emissions based on the number of cows at the state and county levels, respectively. These inventories have been downscaled to 0.1×0.1∘ gridded inventories of CH4 emissions using a combination of California Regional Water Quality Control Board data of dairy-specific herd size and county-level livestock data in the CALGEM inventory (Jeong et al., 2016, 2012) or county-level dairy cow counts from the US Environmental Protection Agency (EPA) Inventory of US Greenhouse Gas Emissions and Sinks alone (Maasakkers et al., 2016; USEPA, 2017). While these gridded products provide finer spatial detail than statewide inventories, there are limitations to the livestock maps that distribute dairies within a county. For example, some gridded products estimate CH4 production from dairies in the Sierra Nevada range (Maasakkers et al., 2016), while in reality these animals exist further west in the Central Valley. In another example, although regional-scale top-down studies (Cui et al., 2017; Jeong et al., 2016) suggest bottom-up inventories underestimate dairy CH4 emissions, a comparison of bottom-up and top-down CH4 emissions at the facility scale (two dairies) was much more comparable (Arndt et al., 2018). This facility-scale comparison suggests the discrepancy might be due to spatial scale. Dairy-level inventories of CH4 emissions are also needed to be relevant to management and mitigation actions that are implemented at the facility level.
To improve the spatial distribution of CH4 emissions from dairies, we describe a new, farm-level database called Vista-California (CA) Dairies, based on the existing database Vista-CA (Rafiq et al., 2020). In this analysis, we disaggregate the CARB inventory to the facility level by (1) developing a spatially explicit map of dairy locations, (2) applying facility-level information from regulatory permit data and county-level animal inventories to estimate herd sizes; and (3) estimating enteric and manure CH4 emissions from dairy facilities based on manure management from permit data and regional norms. Vista-CA Dairies is hence the first spatially explicit inventory at the scale at which management and mitigation decisions are made. Compared to previous inventories, we significantly improve (1) spatial resolution of dairy CH4 emissions using more accurate farm-level herd demographics and (2) spatial variation in partitioning of emissions between enteric and manure sources by incorporating information on manure management practices at a finer scale than used in typical inventories. These improvements are critical for accurately attributing local- to regional-scale CH4 emissions to their sources, identifying high-priority areas for mitigation management, and assessing progress towards achieving mitigation goals (e.g., State of California, 2016).
To demonstrate the utility of this facility-scale product in monitoring mitigation outcomes, we apply the inventory to address the effectiveness of mechanical separators and anaerobic digesters – two climate mitigation strategies that the state is pursuing – in reducing manure methane emissions (CDFA, 2020a, b). Mechanical separators separate out larger-sized solid particles from the liquid manure pathway, reducing the amount of manure entering lagoon treatment systems that are the major source of manure methane (CDFA, 2020a). Digesters, as described above, promote the production of methane from liquid manure waste through anaerobic conditions but capture it for use as a fuel. First, we perform a sensitivity analysis on the efficiency of mechanical separators in removing solids and quantify the uncertainty in their reduction in emissions. Second, we quantify the projected effect of anaerobic digesters on total CH4 emissions and on the ratio of enteric CH4 to manure CH4 at the farm and regional scale. Since 2015, cap and trade funds have supported 106 anaerobic digesters in an effort to reduce manure CH4 emissions (CDFA, 2020b). This dataset provides the facility-level inventory of methane emissions, critical for attributing methane plumes to dairy sources and for monitoring methane reduction strategies.
We determined the locations of dairy farms in California and estimated the herd numbers for each farm. We estimated the enteric and manure CH4 emissions in three different ways each and the uncertainty in each parameter affecting emission estimates at the facility and state scales. These data were compiled in the database Vista-CA and compared to other methane emission maps in the same domain. Finally, we evaluated the efficacy of two manure management CH4 mitigation strategies that are currently being implemented in California: mechanical separators and anaerobic digesters (Meyer, 2019).
2.1 Dairy locations
We used Google Earth satellite imagery to determine the locations of 1330 dairy farms in California, by identifying metal-topped shelters alongside manure lagoons and corrals (further details given in Duren et al., 2019). We used addresses to determine the approximate location of each dairy and manually adjusted the location to the center of a dairy farm using satellite imagery in Google Earth (Duren et al., 2019; Rafiq et al., 2020). These dairy locations are publicly available as part of the Vista-CA methane mapping project on the Oak Ridge National Laboratory Distributed Active Archive Center for Biogeochemical Dynamics (https://daac.ornl.gov/cgi-bin/dsviewer.pl?ds_id=1726, last access: 26 January 2021).
We determined which facilities are still operational by checking the data against the list of facilities that paid 2019 State Water Resources Control Board Confined Animal Facility fees (CAF fees; California State Water Quality Control Board, personal communication, 22 November 2019). We assumed that all dairies with permits and/or paying CAF fees are currently operational. This assumption is untrue, as there are an unknown number of facilities with cattle that do not pay fees (likely <20 facilities; new facilities since 2007). It is not currently possible to confidently confirm which dairies are functioning and which are not, since dairy closures are tracked by a variety of agencies, with some lag time, but this information is not accessible or consistent. Milk production statistics show that there are roughly 1400 commercial dairies in CA, including 162 dairies in northern California (CDFA, 2018).
We grouped dairies into three geographic categories by county (Table S3), North Coast (153 dairies), Central Valley (1102 dairies), and Southern California (75 dairies), to account for differences in climate, animal housing, and primary manure management styles among these three regions (Meyer, 2019).
2.2 Herd populations and demographics
We determined herd population sizes primarily from the 2019 CAF fees list. However, some dairies did not pay a fee in 2019, but still have animals, so for these facilities we integrated data from three sources to estimate herd numbers and demographic categories at each dairy: Regional Water Quality Control Board (RWQCB) permits, San Joaquin Valley Air Pollution Control District (SJVAPCD) permits, and individual facility documentation. The RWQCB permits are required for dairies that existed in October 2007 (California Regional Water Quality Control Board, 2013), and we used a collection of permit lists from 2014–2018 to determine the number of lactating cows. Some dairies in the Central Valley that are either new or expanded since 2007 have inaccurate or incomplete data, so we determined the number of lactating animals from the SJVAQPCD and reading individual facility documentation. The SJVAPCD permits include the maximum number of cattle in each class at a given facility in 2011, rather than the number of animals, and these dairies may have expanded since then. These data represent our best estimates, but they represent specific points in time that are not consistent between data sources. Based on milk shipments, we know that at the time of this publication, there are roughly 1.7 million lactating cows in California (Ross, 2019). Additionally, we compared our list with the 2017 United States Department of Agriculture (USDA) National Agricultural Statistics Survey (USDA NASS, 2017), which provides the number of farms and the number of cows in different dairy size classes in each county, though the NASS Census data include farms that are not commercial dairies.
For dairies with RWQCB reports, we use the number of milk cows, dry cows, heifers, and calves as the number of cattle in each class. Given that we are calculating an annual CH4 emission rate for each farm, we assume the population and demographics of each farm are constant in time, though in reality these fluctuate as cattle are sold or born. The Central Valley RWQCB assumes the population size of the lactating and dry cows varies by 15 % or less (California Regional Water Quality Control Board, 2013).
We also estimate the populations of non-lactating animals, though these data are less reliable than data for lactating animals. The RWQCB reports provide the number of dry cows, bred heifers, heifers, calves 0–3 months, and calves 4–6 months (California Regional Water Quality Control Board, 2013). From these data, we determine the median ratio of dry cows to the number of milk cows to estimate the number of dry cows for dairies without RWQCB reports. Calf and heifer populations are less reliable than mature cow populations (lactating + dry cows), as these replacement animals may or may not be at the same facility as the animals they will replace. We assume that replacement animal populations are 10 % higher than the mature cow populations (Deanne Meyer, personal communication, 7 February 2020) and are evenly distributed among the 0–23-month-old animals. For this analysis, we assume that the replacements are on the same dairies as the lactating cows in order to not double count the heifer ranches; these animals do exist but may not be present on the dairies. We also estimated the effect of this assumption on overall emissions. Enteric fermentation emissions equations also distinguish between replacement heifers <227 kg (calves) and replacement heifers >227 kg. We assume the populations are split equally between the size classes.
2.3 Enteric fermentation emissions
We estimated enteric fermentation in three ways, which have previously been used to estimate emissions at the state or national levels: (E1) according to the method used in California's greenhouse gas emission inventory (Charrier, 2016), (E2) a method used for estimating emissions for the continental US (Hristov et al., 2017) and (E3) a method suggested by recent research done in California (Appuhamy, 2018). These three methods increase in their complexity: method E1 is based solely on the population and a statewide emissions factor, E2 is based on a statewide emission factor and diets, and E3 is based on diet as well as the quality of milk provided. We performed each of these calculations with lactating cows only (subscript l) and total cattle, including calves, replacement heifers, and dry cows (subscript t).
The first method, E1, is based on the calculations used by CARB for the official statewide greenhouse gas emission inventory (Charrier, 2016), which is in turn based on the IPCC Tier 1 Guidelines (IPCC, 2006). For this method, we estimate total enteric emissions (CH4,e1) based on the number of cattle (n) and a standard emission factor for each cattle type (Eq. 1). Method E1 assumes enteric fermentation emissions (ef1) are 114.61 kg CH4 per lactating dairy cow per year (ef1,l; Table 3).
For all cattle, the total enteric emissions are the sum of the product of the number of cattle (n) and the emission factor (Eq. 2). Method E1 assumes that the emissions factors are 11.63 kg CH4 per dairy calf per year (ef1c), 43.53 kg CH4 per replacement heifer aged 7–12 months per year, and 65.71 kg CH4 per replacement heifer aged 12–24 months per year (Charrier, 2016). We use a weighted mean of 58.32 kg CH4 per replacement heifer per year (ef1h). Here i represents the classes of cattle, including milk cows, calves, and replacement heifers. The CARB inventory does not provide an emission factor for dry cows, so we exclude those from this analysis (Charrier, 2016).
The second method, E2, is based off of calculations in Hristov et al. (2017). For this method, we estimate the total enteric emissions (CH4,e2) as the product of the number of cattle (n), dry matter intake (DMI), and an emission factor (ef2; Eq. 3) (Hristov et al., 2017). Method E2 assumes DMI is 22.9 kg per head per day for lactating cows, 12.7 kg per head per day for dry cows, 8.5 kg per head per day for dairy replacement heifers, and 3.7 kg per head per day for calves, and emission factors are 436, 280, 161, and 70 g per head per day for lactating cows, dry cows, dairy replacement heifers, and calves, respectively (Table 3).
The third method, E3, is based on calculations by Appuhamy (2018). For this method, we estimate the total enteric emissions including the number of cattle (n), dry matter intake (DMI), neutral detergent fiber (NDF) in the diet, and milk fat (mf) (Appuhamy and Kebreab, 2018; Table 3). We also include factors for DMI (fDMI), NDF (fNDF), and milk fat (fmf). Here, emissions are the sum of emissions due to DMI, neutral detergent, and milk fat content (Eq. 4).
Note that Appuhamy (2018) consider mature cows to be dry cows for 60 d of the year (16.4 %) and lactating cows the remainder of the year, while we count the dry and lactating cows separately. For the other cattle classes (i, including dry cattle, replacement heifers, and calves), the E3 emissions are the product of DMI and a DMI factor (fDMI), times 365 d per year as in E2 (Eq. 5).
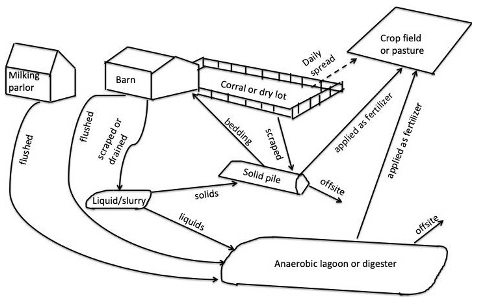
Figure 1Diagram of manure flows on a dairy farm. Dashed lines indicate North Coast dairies only. Modified from Owen and Silver (2014) and Meyer et al. (2011). Types of manure management include anaerobic digester, large containment system or covered lagoon designed for capturing methane and carbon dioxide for use as fuel; anaerobic lagoon, designed storage system for stabilizing waste; daily spread, the collection of manure that is spread onto field or pasture within 24 h of deposition, drylot: an open confined area where manure may be removed occasionally; pasture land covered in grass that the animals eat; solid storage dried manure stored in unconfined stacks; liquid/slurry manure stored with some water added, with a typical residence time of less than 1 year (IPCC, 2006). Fractions of manure entering each management type are shown in Tables 1 and S1.
2.4 Manure management emissions
We estimated manure emissions for each dairy three ways: (M1) according to the method used in California's greenhouse gas emission inventory (Charrier, 2016), (M2) a method used for estimating emissions for the continental US (Hristov et al., 2017), and (M3) a method suggested by recent manure management research done in California (Meyer, 2019; Fig. 1). Methods M1 and M2 are based on average statewide manure management, while method M3 is based on facility-level or regional manure management. We perform each of these calculations first with milk cows only and then including calves, dry cows, and heifers. All three methods follow the same general equation, though they have differences in the specific variables used in Eq. (6).
In this equation, n is the number of cows, is the density of CH4, a conversion factor of m3 CH4 to kg CH4, which is a constant 0.662 kg CH4/m3 as reported by CARB and the IPCC (IPCC, 2006). VSprod is the total amount of volatile solids (VSs) produced per animal (kg per head per day), Bo is the maximum methane production capacity per unit of VS in dairy manure (0.24 m3 CH4/kg VS), MCF is the methane conversion factor for each system, and fsystem is the fraction of manure going into each manure management system (Table 4). The different systems include pasture, daily spread, solids, liquid/slurry, lagoon, and drylot (Fig. 1; IPCC, 2006).
The first method, M1, is based on the method used in the CARB greenhouse gas inventory. For M1, methane emissions from manure management are calculated for each dairy facility based on the fraction of manure in each management system, the total VS production, the CH4 density, Bo, and the methane conversion factor for each system (CARB, 2014; IPCC, 2006; US EPA, 2017). For method M1, we assume that a constant proportion of manure is in each management type on each dairy according to statewide proportions, which are described in Fig. 1 (CARB, 2014). The methane conversion factor for each system is shown in Table 4 (Charrier, 2016). VS production is an animal-specific constant among management types.
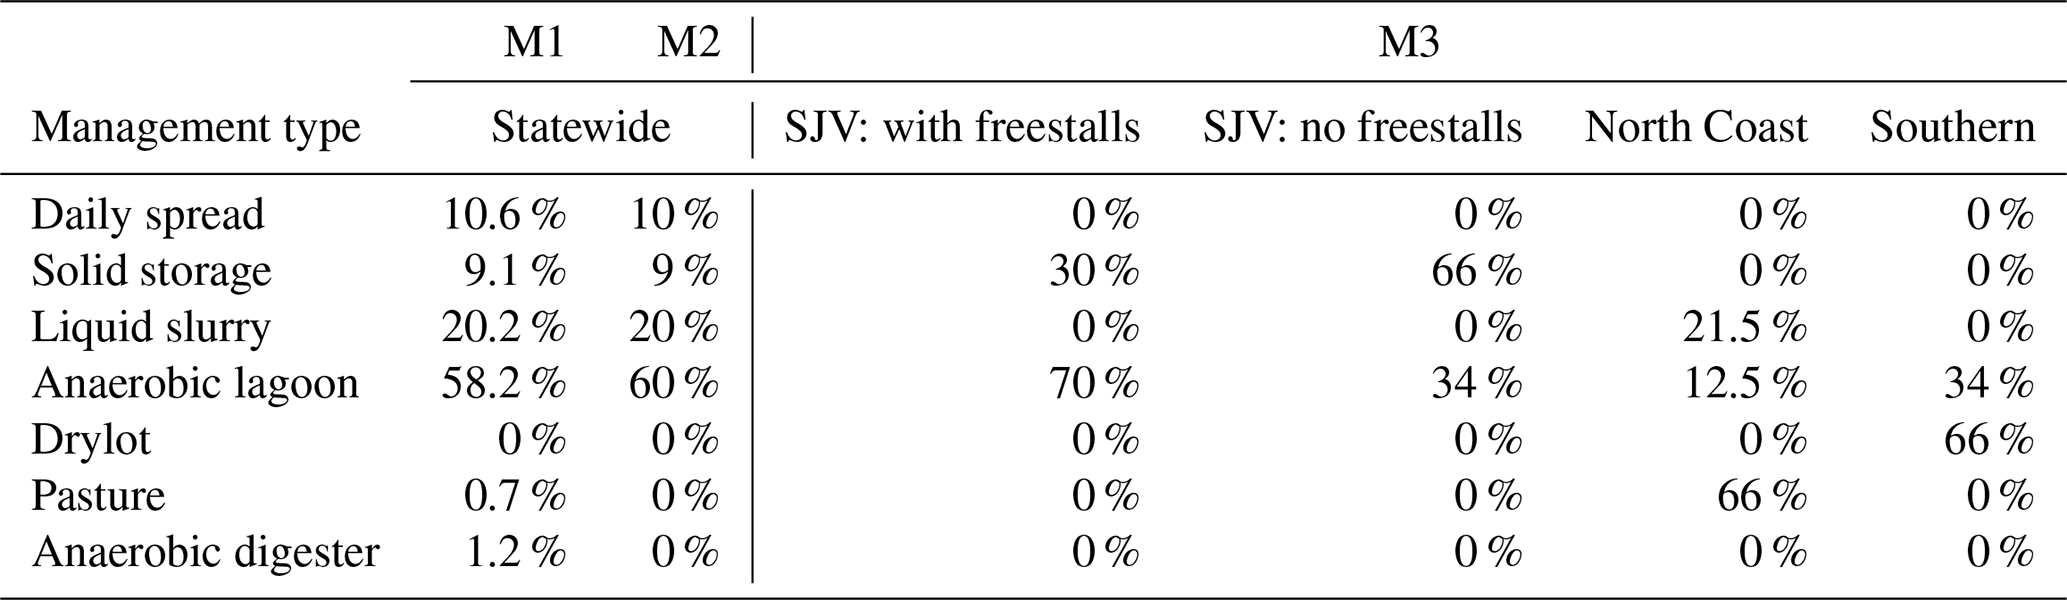
Table 1Fraction of manure entering each management type for dairy cows for M1, M2, and M3. For M3, the fraction is different for San Joaquin Valley with and without freestalls, the North Coast, and the Southern dairies.
The second method, M2, is based on the methodology used by Hristov and colleagues (Hristov et al., 2017). These are the product of the VSs excreted, the methane generation potential, the waste management system distribution in the state, the methane conversion factor (MCF) for the state, and the methane density (Eq. 7). The percentages of waste entering daily spread, solid storage, liquid slurry, and anaerobic lagoon are shown in Table 1, with corresponding MCFs shown in Table 4. VS excreted and Bo are defined in Appendix A.
For the third method, M3, we estimate manure management based on data from the SJVAPCD air quality permits and regional differences in manure management as follows below (Eq. 7) and shown in Fig. 1. CH4 emissions for each manure management system were determined according to CARB emission factors described above and summed for each farm. As described previously, only dairies in the San Joaquin Valley with >500 cows in 2011 have SJVAPCD permits. For these dairies, we estimate manure emissions based on the reported dairy management practices documented in permits, though this information represents facilities inconsistently. These permits report the presence of corrals or freestalls as housing types; flush, scrape, or vacuum systems for manure collection; and mechanical separator, settling basin, or weeping wall as solid–liquid separator systems (Table S1 in the Supplement). Housing type typically determines the fraction of manure that is processed by the manure handling system, which can be quantified as the percentage of time cows spend on concrete. For dairies with corrals or freestalls present, we assume time on concrete to be 70 % (Meyer, 2019). For dairies without freestalls, we assume time on concrete to be 30 % (Meyer, 2019). We assume that time in the milking parlor is 12.5 % of total time, which is almost always flushed or hosed out into a liquid manure handling system (i.e., liquid/slurry or lagoon). For the remainder of the time on concrete, we assume that for facilities with scrape or vacuum systems reported, the manure is stored as solids; for facilities with only flush systems reported, we assume that this manure is flushed into lagoons. We assume that the remaining manure (time not spent in housing) is not collected and remains as solids in the open lot or pasture. For dairies with solid–liquid separator systems reported, manure that is flushed to lagoon is diverted to solid storage based on the mechanical separator efficiency (0.05 for mechanical separator; 0.225 for settling basin; 0.25 for weeping wall). We also estimate the effect of using manure solids as bedding. The majority of manure solids are used as bedding, as it is a cost-effective and easily available option to keep the animals comfortable, though some solids are land applied or removed off farm (Chang et al., 2004). Previous research suggests that solid manure loses roughly 33 % of its C as CO2 in the first month (Ahn et al., 2011); we assume that on dairies with lagoons, solid manure remains in the manure pile for at least 1 month to dry out and that half of the remaining 67 % of the manure C returns to the housing facility and ultimately ends up in the lagoon. The fraction of manure entering the lagoon, fbed, is therefore 33 %. We assume that all heifer manure is scraped, though in reality some heifer lanes may be flushed (Table S2).
Given that air district data only exist for the San Joaquin Valley, we made assumptions about housing and manure management in the other regions in California for method M3. For the remaining Central Valley dairies without air quality permits, we used the mean partitioning of solid vs. liquids from permitted dairies in each county. In the Southern California dairies, open-lot-style farms are predominant (Deanne Meyer, personal communication, 7 February 2020), and most do not even flush the feed lane. On these dairies, we assume that only the milking parlor is flushed, at 12.5 % of the time, and the rest of the manure is either dry scraped or remains in the open lot. In the North Coast, pasture dairies are prevalent, though many dairies have some housing for cows. Here, we assume time on concrete is 39 %: on average 2 months inside in the winter and 30 % of the rest of the year. During the winter months, the manure is scraped into pits. In the summer, the manure is dried and stacked. In the North Coast, we assumed that only the milking parlor was flushed (12.5 %). Nevertheless, even with accurate accounting, the different climatic, animal housing, manure management, and biogeochemical factors in each dairy affect the actual CH4 emissions at any given time (Hamilton et al., 2006).
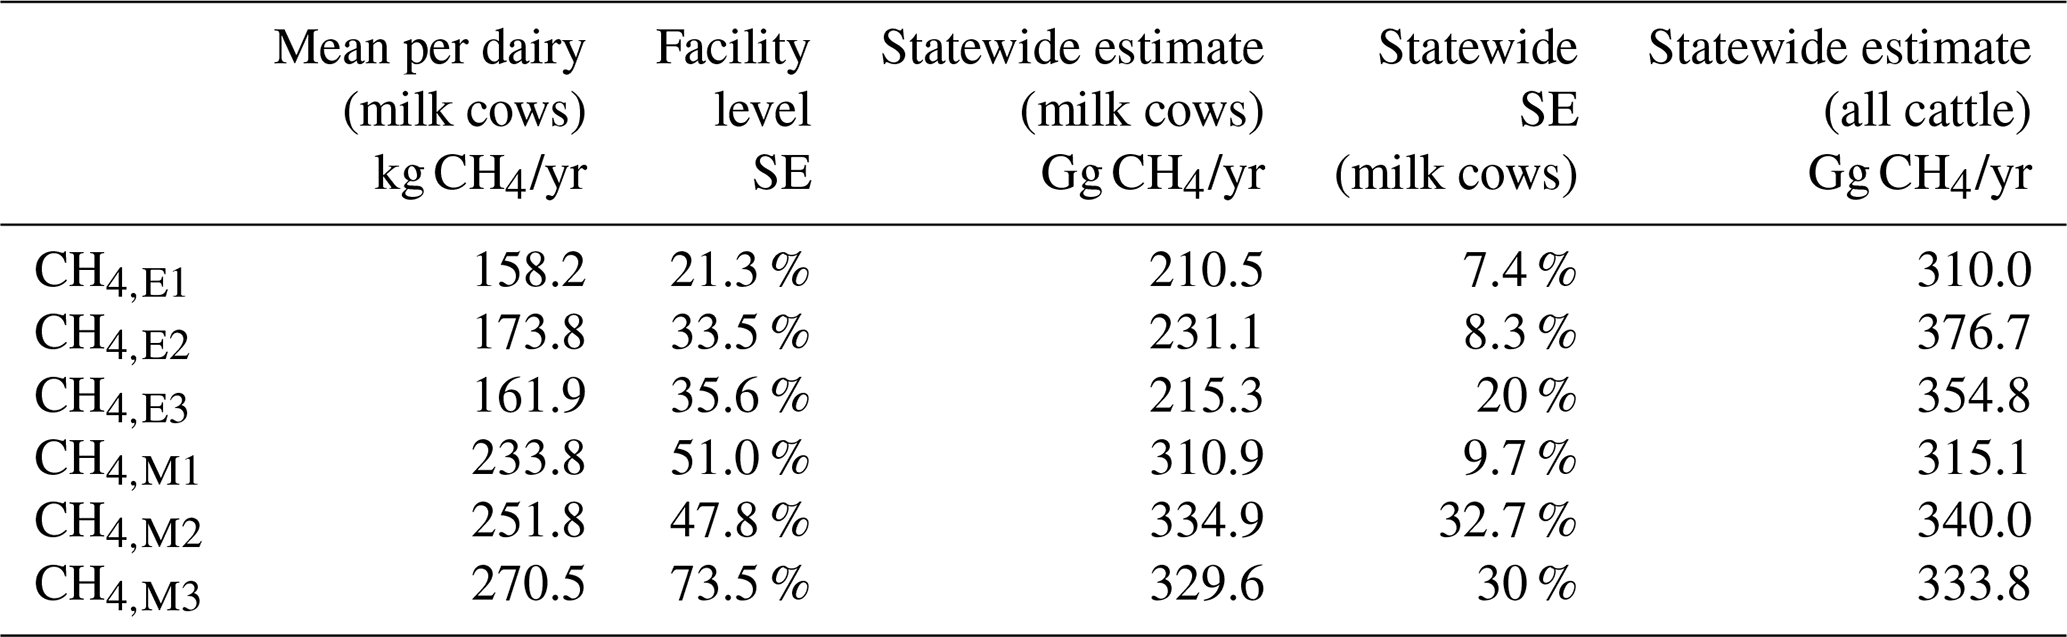
Table 2Enteric and manure CH4 emissions and standard error at the facility and statewide scales.
2.5 Uncertainty and sensitivity analysis
We estimated facility-level uncertainty in the number of cows as 20 %, as suggested by the IPCC (IPCC, 2006, Sect. S1 in the Supplement). We estimated facility-scale uncertainty for enteric fermentation emissions for each of the three methods (Table 2, Sect. S1). The methods for calculating the standard errors of each variable are shown in the Supplement. For E1, we calculated the standard error in ef1 and n. For method E2, we calculated the standard error in DMI, n, and ef2. For E3, we calculated the standard error in DMI, NDF, milk fat, fDMI, fNDF, and fmf for lactating cows and DMI only for nonlactating animals. We propagated the standard error of each variable through the emissions calculation equations, assuming the errors were uncorrelated (Sect. S1.1).
We estimate the facility-scale uncertainty in manure management emissions by propagating uncertainty in the terms ncows, fraction of time on concrete, VSprod, methane conversion factor (MCF), Bo, and fbed. We did not address uncertainty in , as it is considered to be a constant (US EPA, 2017). Uncertainty for time on concrete was determined from variance observed in a recent study (Meyer, 2019) that describes four Central Valley dairies: two with freestalls and two without freestalls. We assume for our analysis that the time on concrete is equal to the fraction of manure produced that passes through the lagoon (flagoon). We also assume that the remainder of the manure (1−flagoon) is stored as a solid in the Central Valley, in pasture in the North Coast, and drylot in the Southern dairies. We assumed that the North Coast dairies had freestalls or loafing barns for the winter, and the Southern dairies had no barn housing; however, there are exceptions to these generalizations we did not consider as we have little systematic data on dairies outside of the Central Valley apart from expert knowledge. We estimated the uncertainty in the VS production rate based on the variability reported for lactating cattle and heifers over 13 years (2000–2012) in the CARB inventory (CARB, 2014). We calculated the mean and standard error for VS production for each of these two populations. We estimated the uncertainty of the MCFs using data reported by Owen and Silver (Owen and Silver, 2014). We estimated the uncertainty of Bo, the theoretical maximum methane production, using data from a meta-analysis (Miranda et al., 2016). We estimated the error uncertainty of fbed to be 100 %, as this value may range from including no manure as bedding to including all solid manure as bedding. To propagate the errors in total for the manure management system, we rearranged Eq. (8) with two factors to be as follows, where MCFx is the MCF for either solids, pasture, or drylot, and given that .
We used the sum of the squared partial derivatives of each variable times the variance of that variable to propagate the uncertainty in facility-scale manure emissions (Sect. S1.1). To determine the relative effect of manure and enteric emissions from E3 and M3 on facility-level emissions, we propagated the uncertainty associated with the two emissions in quadrature.
Due to the large number of dairies, propagating the facility-level uncertainty to the state level using standard methods produces unrealistically low statewide uncertainty estimates (<1 %). This suggests that the uncertainties at the facility level are not independent. Therefore, we used previously published estimates for state-scale uncertainties for each of the six methods, from the EPA (E1, M1; US EPA, 2017), Hristov et al. (2017) (E2, M2), and the IPCC (E3, M3, IPCC, 2006).
We performed a sensitivity analysis on each of the methods. We calculate sensitivity (δ(x|y)) of emissions (x) to each parameter (y) as
where is the partial derivative of emissions (x) with respect to each variable (y) in the emissions equation and σy is the uncertainty in each parameter y (i.e., fractional uncertainty times the value). We calculate fractional uncertainty as each uncertainty divided by the sum of all uncertainties, as in Eq. (12).
We also determined the relative sensitivity of total emissions to manure and enteric emissions.
2.6 Spatial patterns of CH4 emissions and comparison with existing spatial inventories
We converted the Vista-CA dairy database into a raster image using R (R Core Team, 2013). We then convert the image to a 0.1∘ × 0.1∘ grid in WGS84 to match CALGEM (Jeong et al., 2012) and the Spatial EPA (Maasakkers et al., 2016) inventories. We subtract the values from the CALGEM, Hristov, and Maasakkers emission inventories from the Vista-CA map to observe spatial variations between inventories.
2.7 Alternative manure management strategy assessment
2.7.1 Solid separators
Solid separators, including mechanical separators, weeping walls, and settling basins, are an alternative methane mitigation manure management practice in California (CDFA, 2020a). Separating out solids from liquid manure reduces CH4 emissions by removing a fraction of the carbon content by aerobic decomposition prior to entering anaerobic storage. Mechanical separators, settling basins, and weeping walls remove approximately 5 %, 22.5 %, and 25 % of volatile solids, respectively (Meyer et al., 2011).
2.7.2 Anaerobic digesters
We determined the 106 dairies that have installed or are planning to install anaerobic digesters from reports from the CDFA Dairy Digester Reports in 2017–2019 (CDFA, 2020b). We used our database to estimate the effects of anaerobic digesters on CH4 emissions from these 100 dairies in the Central Valley. We assumed a 75 % efficiency of CH4 capture in anaerobic digesters (Charrier, 2016; US EPA, 2017).
3.1 Herd populations and demographics
The 2017 USDA Dairy Census reports the number of milk cows in California to be 1 750 329. We report a total of 1 712 229 mature cows in Vista-CA, including 1 455 395 lactating cows and 217 400 dry cows, distributed across 1330 dairy farms. We also report a total of 1 380 040 heifers, and 1 639 966 calves. We assume a 20 % error in our uncertainty in the number of cattle, as recommended by the IPCC (2006).
The data regarding the number of cows are proprietary information that are not consistently reported by any one agency, and the agencies do not communicate with each other. Regulatory agencies should strive to identify facilities and the number of animals in a timely manner, and they should communicate with each other. Further, the number of milk cows varies interannually (as they only lactate for part of the year and are considered dry cows the remainder of the year), and the animals are sold and traded. These factors make this information surprisingly difficult to estimate.
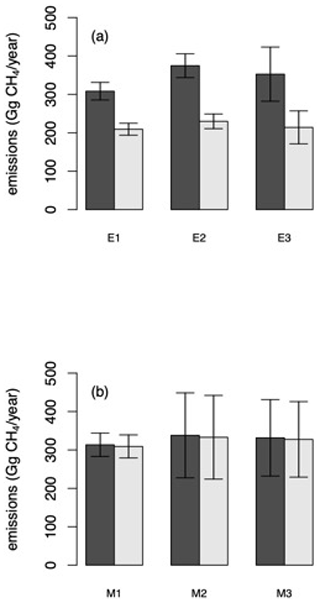
Figure 2Total state (a) enteric and (b) manure CH4 emissions for each of the three calculations. Dark bars include all cattle, while light bars include only milk cows. The lack of significant difference between the three methods supports the validity of the farm-scale method.
3.2 Enteric fermentation
Total enteric emissions for all cattle are 310.0±22.9 Gg CH4/yr for method E1, 376.7±31.2 Gg CH4/yr for method E2, and 354.8±71.0 Gg CH4/yr for method E3. We did not find statistically significant differences between the three methods of calculations of enteric CH4 emissions for either milk cows or all cattle in the state (Table 2, Fig. 2a). Statewide enteric emissions for milk cows only are 210.5±15.6 Gg CH4/yr for method E1, 231.1±19.2 Gg CH4/yr for method E2, and 215.3±43.1 Gg CH4/yr for method E3. We found relatively consistent proportions of enteric fermentation CH4 emissions of milk cows to total cattle. Milk cows account for 71 %, 67 %, and 61 % of total enteric emissions based on methods E1, E2, and E3, respectively. The difference in enteric emissions between the milk cows and total cows is due to the fact that non-milk cows produce significant amounts of enteric methane emissions.
3.3 Manure management emissions
Total manure management emissions for all cattle are 315.1±30.6 Gg CH4/yr based on M1, 340.0±111.2 Gg CH4/yr based on M2, and 368.0±110.4 Gg CH4/yr based on M3, the farm-specific method. We did not find statistically significant differences in manure management emissions between the methods of calculations for either milk cows or all cattle (Table 2, Fig. 2b). Total manure management emissions for milk cows only are 310.9±30.2 Gg CH4/yr based on M1, 334.9±109.5 Gg CH4/yr based on M2, and 359.8±107.9 Gg CH4/yr based on M3. The fraction of manure emissions that comes from the milk cows is greater than 98 % for all three methods. This is because the manure of non-milk cows is primarily managed in ways with very low methane emissions, including daily spread, on drylots, or on pasture. The difference between the emissions from milk cows alone and emissions from the total dairy herd is smaller than the uncertainties in manure emissions.
Table 3Estimated input variables and standard error as a percentage of the mean for each of the methods to calculate enteric fermentation methane emissions at the farm scale, along with sensitivity to each input variable.
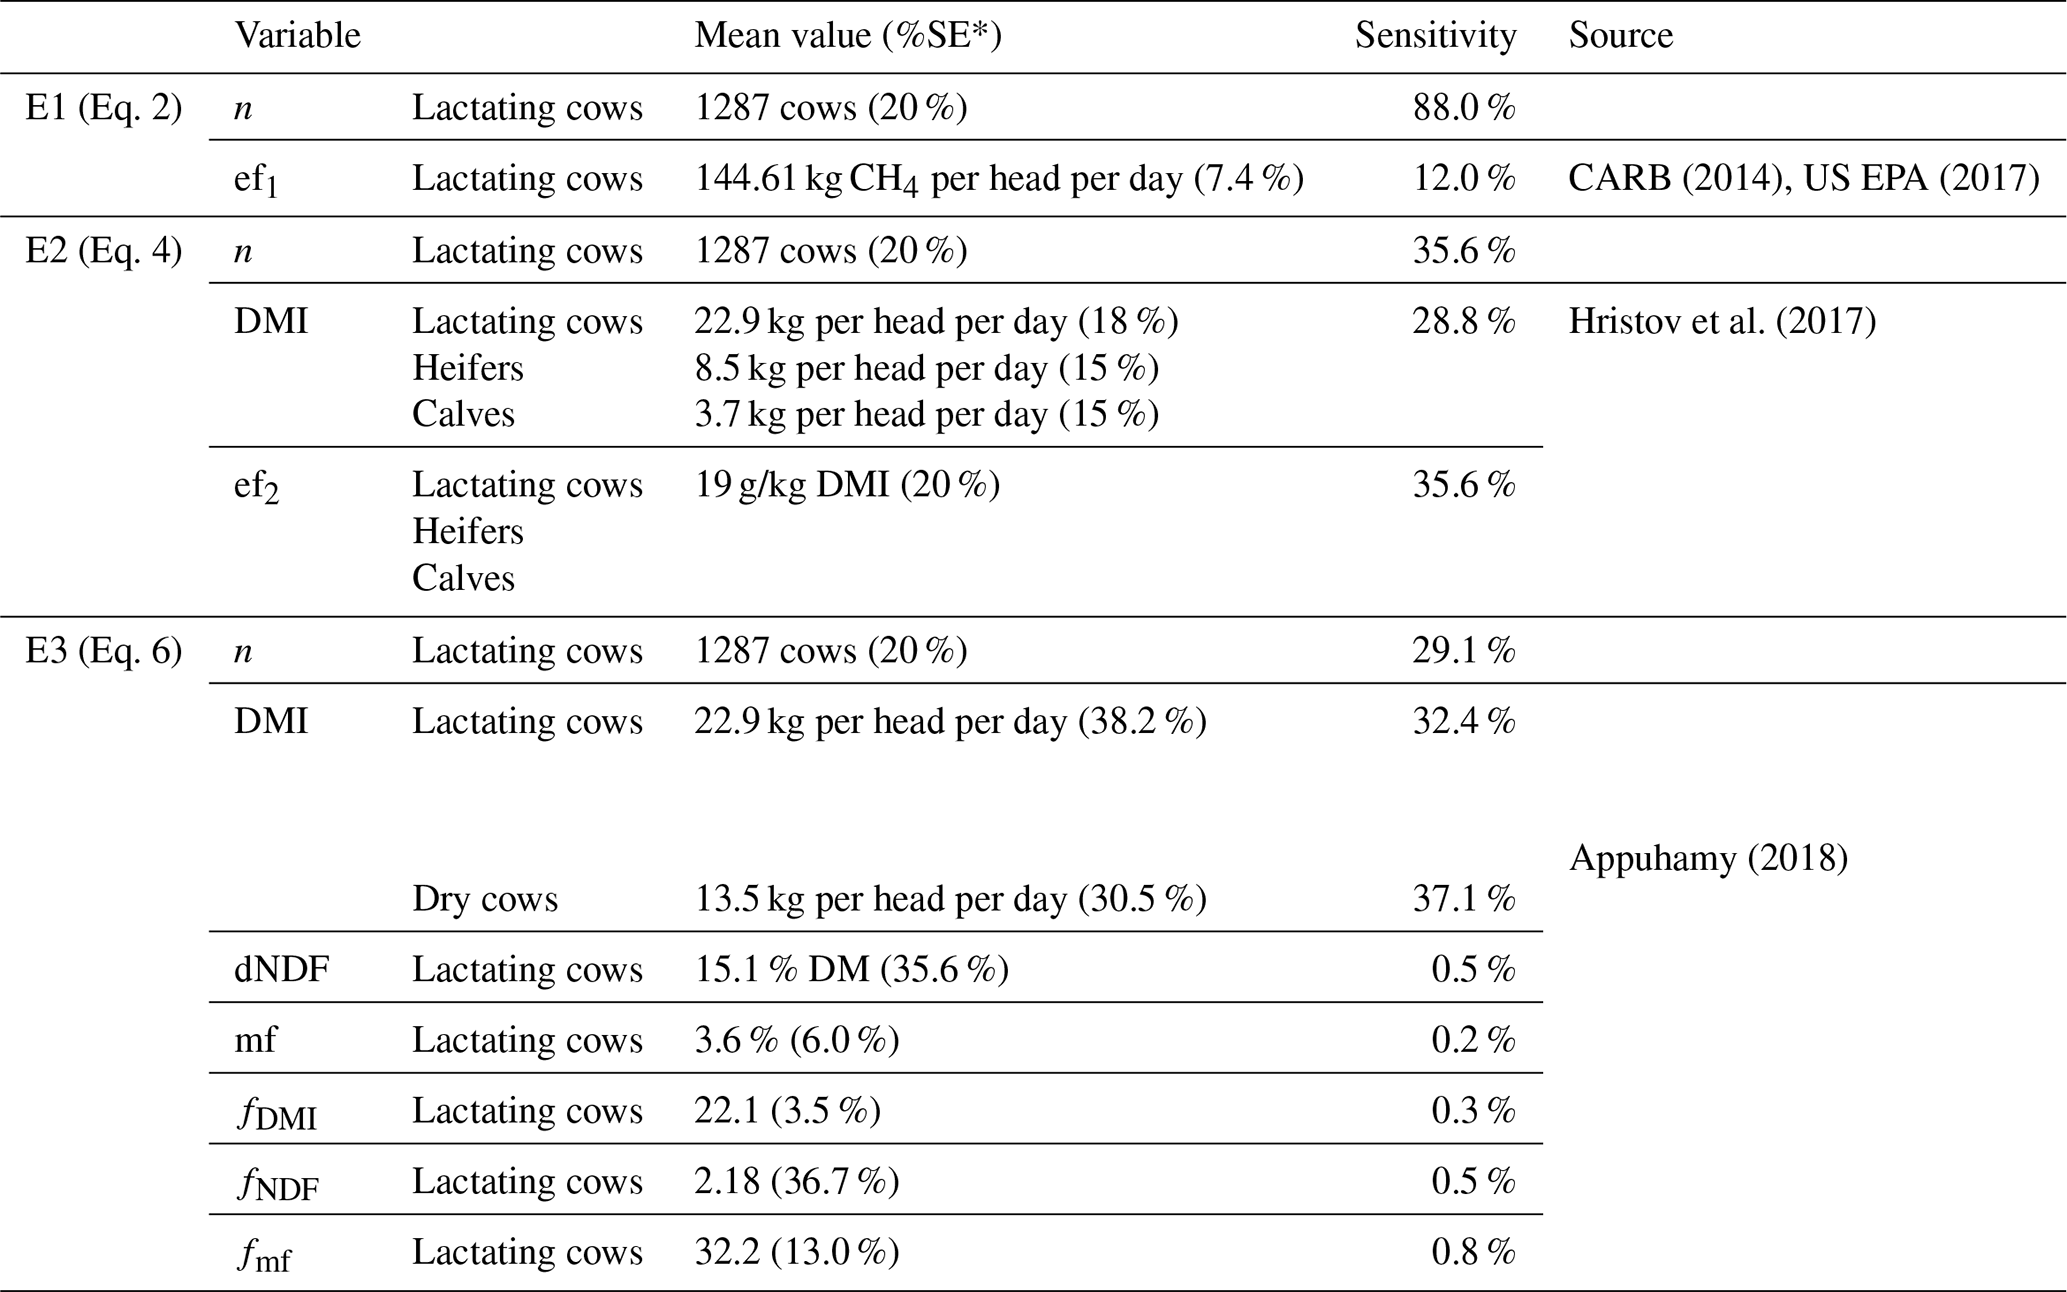
* Description of SE calculations are provided in Sect. S1.
3.4 Sensitivity analysis
We report the statewide uncertainty in enteric emissions to be 7.4 %, 8.3 %, and 20 % for E1, E2, and E3, respectively (Table 2). The facility-level standard errors for enteric fermentation we calculated are 21.3 % for E1, 33.5 % for E2, and 35.6 % for E3. We find that sensitivities in enteric fermentation differ between the three methods (Table 3). E1 is most sensitive to the number of cows (n) at a facility. E2 is equally sensitive to n and ef2, followed by the DMI of lactating cows. E3 is most sensitive to DMI, followed by n.
Table 4Estimated input variables and standard error as a percentage of the mean for each of the methods to calculate manure methane emissions at the farm scale, along with sensitivity to each input variable.
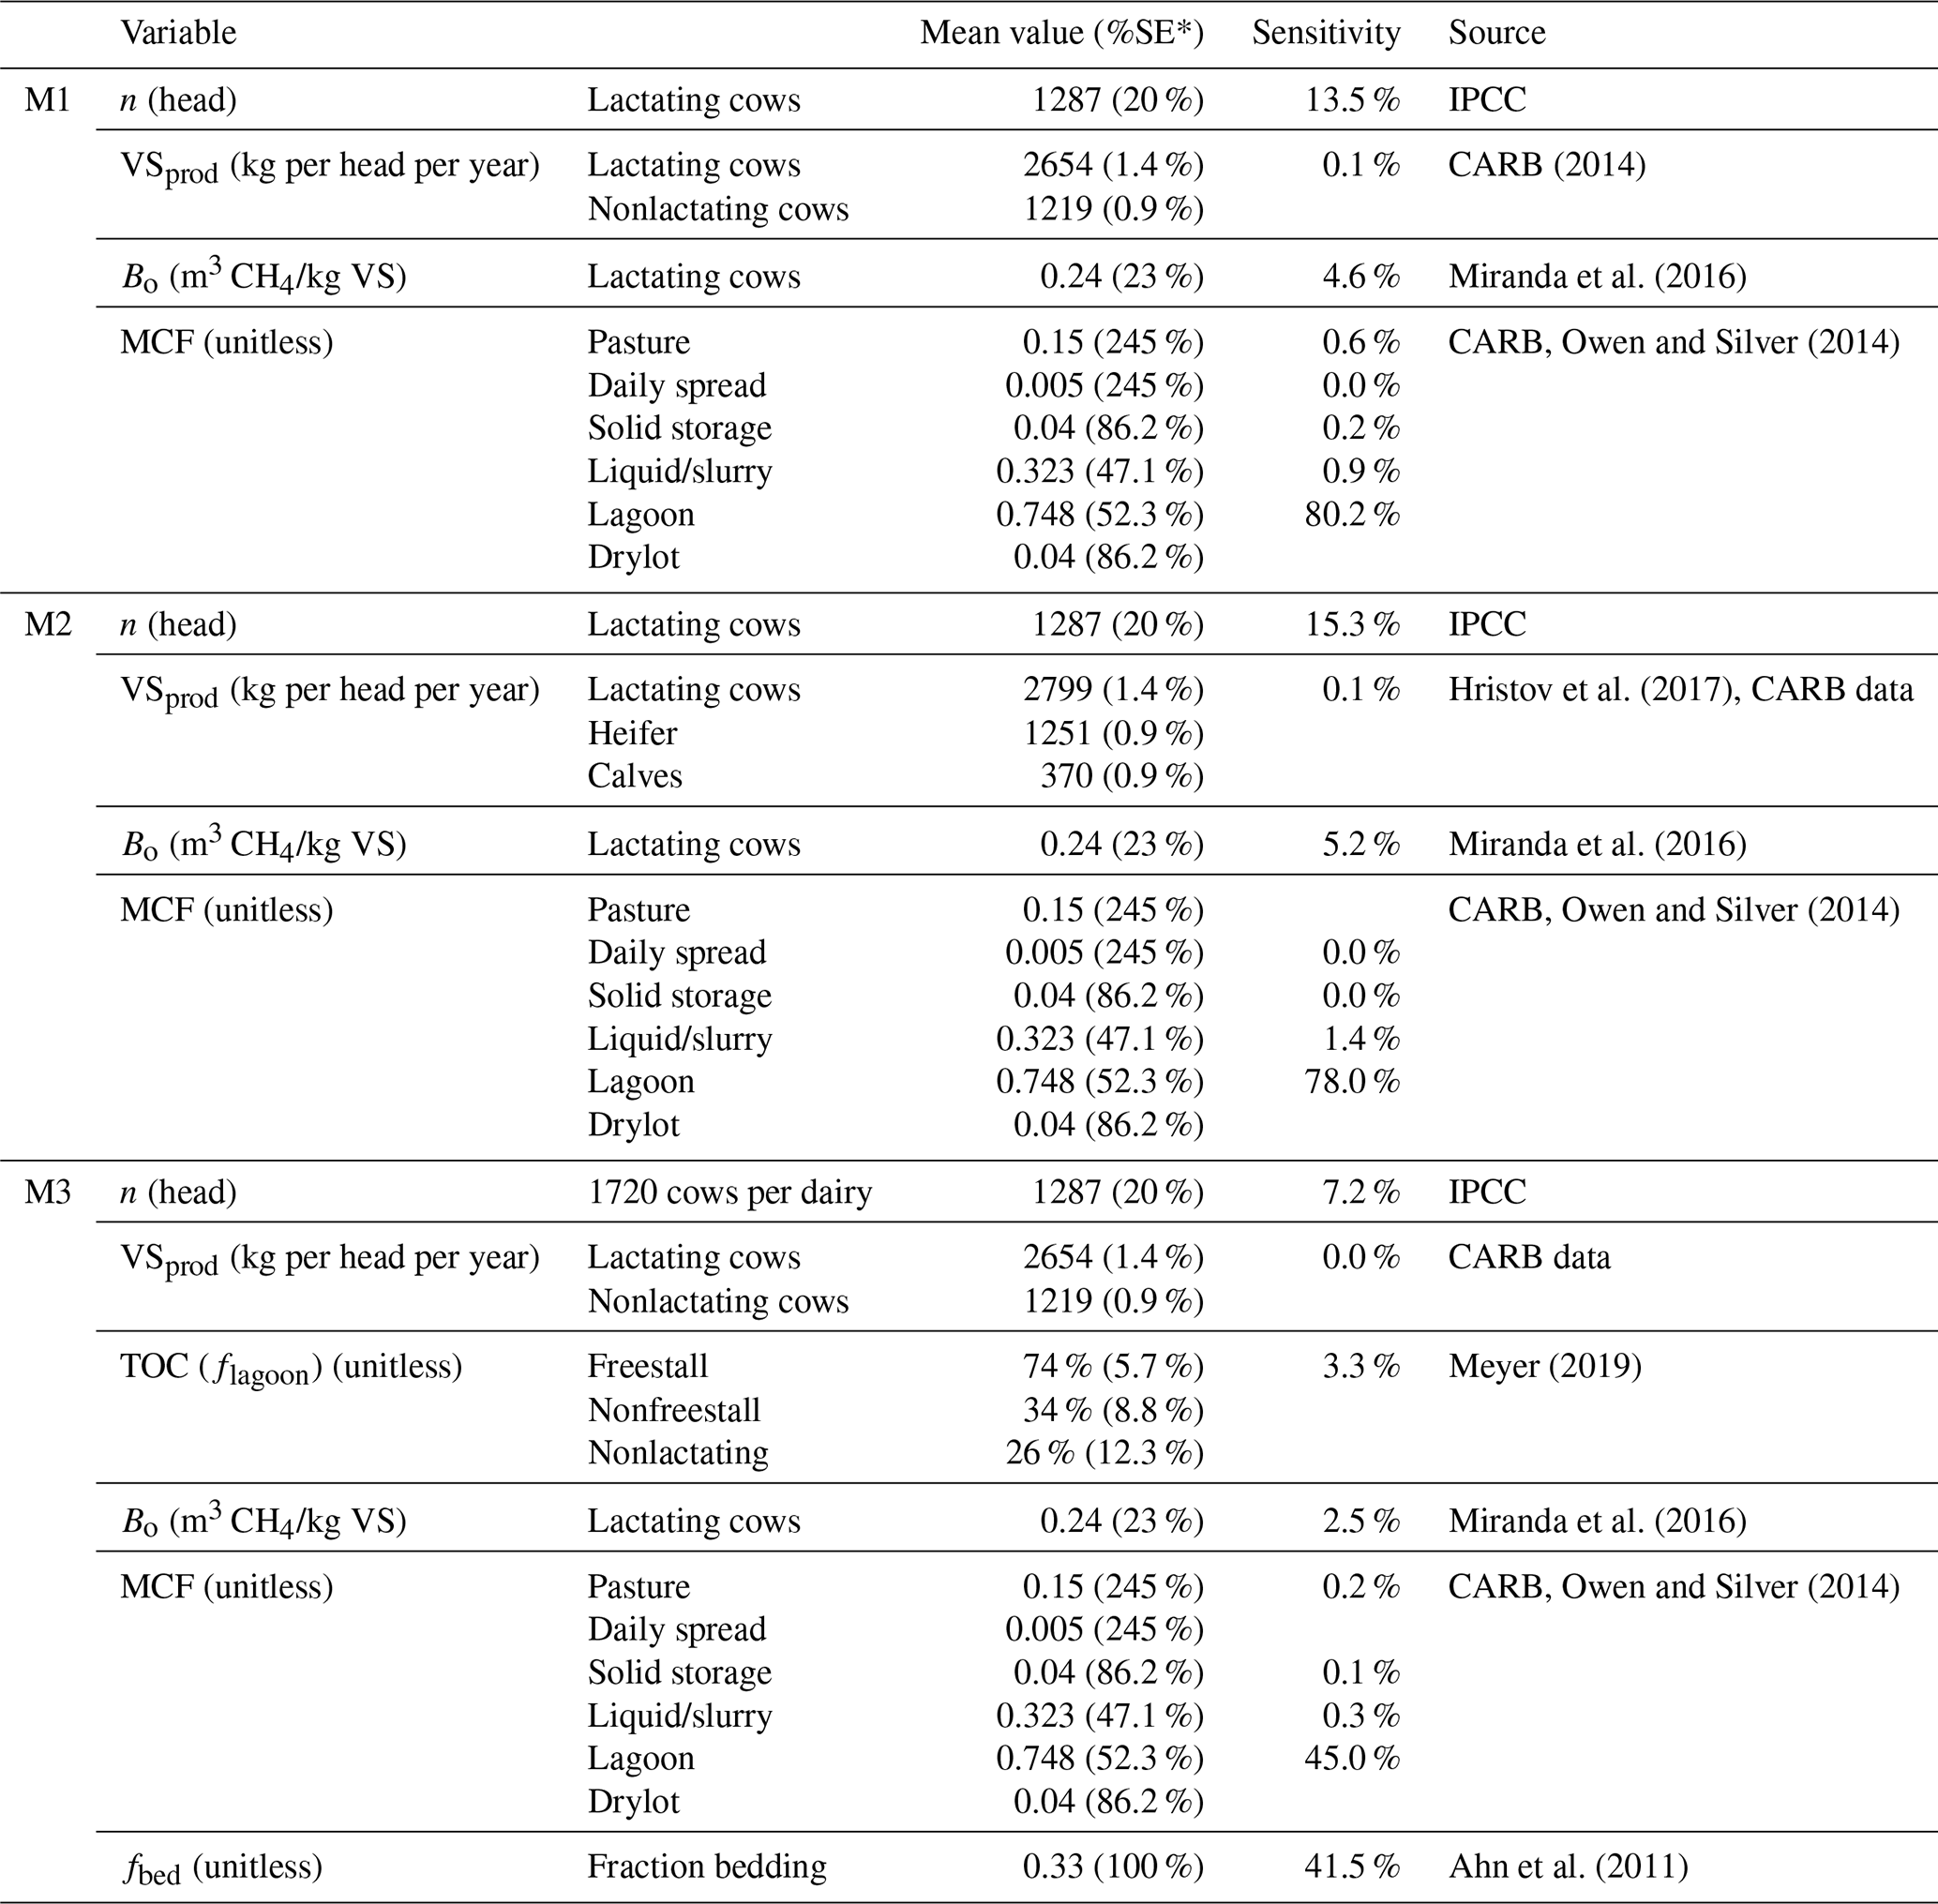
* Description of SE calculations are provided in the Supplement.
We report the statewide uncertainty in manure emissions to be 9.7 %, 32.7 %, and 30 % for M1, M2, and M3, respectively (Table 4). The facility-level standard errors for manure emissions we calculated are 51.0 % for M1, 47.8 % for M2, and 73.5 % for M3. While the uncertainty for M1 is smaller than M2 and M3, this is due to the relative simplicity of the equation, with fewer propagated errors, rather than being the inherently best model. A recent report determined that the CARB methodology underestimates manure methane emissions (NASEM, 2018). Here, all three of our methods are most sensitive to the lagoon MCF (45.0 %–80.2 %), followed by n cows (7.2 %–15.3 %), except for M3, which is sensitive to the fraction of manure allocated to bedding (41.5 %) (Table 4). Our data on MCF for lagoons are only based on nine observational studies from outside California (Owen and Silver, 2014), so more measurements are needed to reduce this uncertainty. Further, there is little information on the amount of manure used for bedding. Overall, our uncertainty analysis is based on limited data from very few dairies.
Total uncertainty in CH4 emissions at the facility scale (E3 + M3) is 35.6 %; 81.9 % of the uncertainty is due to uncertainty in manure emissions, while 18.1 % of the uncertainty is due to enteric emissions. The higher uncertainty in the manure emissions than enteric emissions is due primarily to our uncertainty in facility-level manure management practices and the limited information on lagoon MCF.
3.5 Spatial patterns of CH4 emissions
Using the farm-specific method (E3 and M3), the two largest sources of CH4 from California dairy farms are manure emissions from lagoons (34.8 %) and enteric fermentation (51.5 %) statewide. Of manure management CH4 emissions, 96.3 % came from lagoons statewide, 1.8 % from solid storage, 0.4 % from liquid/slurry, 0.2 % from pasture, and 0.0 % from drylot and solid spread. Of the three geographic regions, the majority of manure management CH4 emissions came from the Central Valley (94.9 %), with only 1.7 % of manure emissions from the North Coast and 3.4 % from Southern California. Per-cow manure management emissions were also highest in the Central Valley (0.24 Tg CH4 per milk cow per year) due to the predominance of lagoons as manure management practice, compared to the North Coast (0.12 Tg CH4 per milk cow per year) and Southern regions (0.15 Tg CH4 per milk cow per year). In the 153 North Coast dairies, the 46 931 cows encompassed 1.7 % of calculated manure emissions and 3.2 % of calculated enteric emissions. The 75 dairies with a total of 77 122 cows in the Southern dairies made up 3.4 % of calculated manure emissions and 5.3 % of calculated enteric emissions.
With these emissions data, we also calculated enteric–manure ratios, which can be useful for methane mitigation planning. Mitigation strategies for dairy methane generally target either enteric or manure emissions, affecting this ratio. Manure management emissions per cow are much more variable than enteric emissions regionally, as manure practices vary more than feeding regimes. Therefore, differences in enteric–manure emissions are likely due to differences in manure management. The enteric–manure ratio of CH4 emissions in the North Coast is the highest, at 2.0, the enteric–manure ratio in the Southern dairies is 1.7, and in the Central Valley the ratio is 1.0 (Fig. 4). These differences are primarily due to the differences in manure management and cow housing type across regions: the Central Valley primarily uses flush systems, storing a large percentage of manure in lagoons, while North Coast and Southern California dairies tend to have scrape systems and drylots, respectively. Because lagoons have the highest MCF, the Central Valley has the highest per-cow emissions and lowest enteric–manure CH4 ratios. The CARB inventory also shows a statewide enteric–manure ratio of 1.08, which is primarily influenced by the large number of dairies in the Central Valley (CARB, 2014). The enteric–manure ratio also has implications for verifying mitigation effectiveness, as strategies that reduce either enteric or manure emissions should alter this ratio. If emission signatures of enteric fermentation differ from those of manure management, such as the δ13C–CH4 isotopic signature, it may be possible to use downwind or regional measurements of these signatures and their changes with mitigation to quantify enteric–manure ratios.
3.6 Comparison with existing spatial inventories
We compare this spatially explicit facility-level database with three other existing bottom-up spatial inventories, the spatially explicit EPA model (Maasakkers et al., 2016; comparable to E1 + M1), the Hristov model (Hristov et al., 2017, comparable to E2 + M2), and the CALGEM model (Jeong et al., 2012, 2016), by aggregating these estimates to 0.1∘ × 0.1∘ resolution to match the spatial scale of these other products (Fig. 4). The EPA model and the Hristov model were both developed for the contiguous United States, while CALGEM was developed for California only. First, we note that there are no significant differences in the statewide total methane emissions or methane emissions on a per-cow basis amongst the three products. However, there are differences in how manure is treated. CARB estimates that 76 % of manure is stored as a liquid, in either lagoon or liquid/slurry, while Hristov assumes that all manure is in lagoon or liquid/slurry, which are the manure treatments with the two highest emissions factors (Hristov et al., 2017). Thus the Hristov estimates are consistently higher than those of CARB and this farm-scale estimate.
We determined Pearson's correlation coefficients using R to test differences in spatial patterns between inventories. CALGEM is the closest to Vista-CA emissions (E3 + M3), with a Pearson's correlation coefficient of 0.77. The estimate of Hristov et al. (2017) is the second closest, with a Pearson's correlation coefficient of 0.58, but it tends to overestimate emissions in the Central Valley, including hotspots of methane emissions. The estimate of Maasakkers et al. (2016) matches the least, with a Pearson's correlation coefficient of 0.25, and tends to underestimate the hotspots of methane emissions in the Central Valley. The other models also have emissions in areas where Vista-CA does not have dairies (shown in gray in Fig. 4). The estimate of Hristov et al. (2017) includes the largest emissions area where Vista-CA does not show dairies, mostly in the lower Central Valley and Southern regions, though also in the North Coast. The estimate of Maasakkers et al. (2016) follows, with additional emitting areas primarily in the lower Central Valley. CALGEM has the fewest areas that are not in Vista-CA, mostly in the North Coast and Southern regions of California.
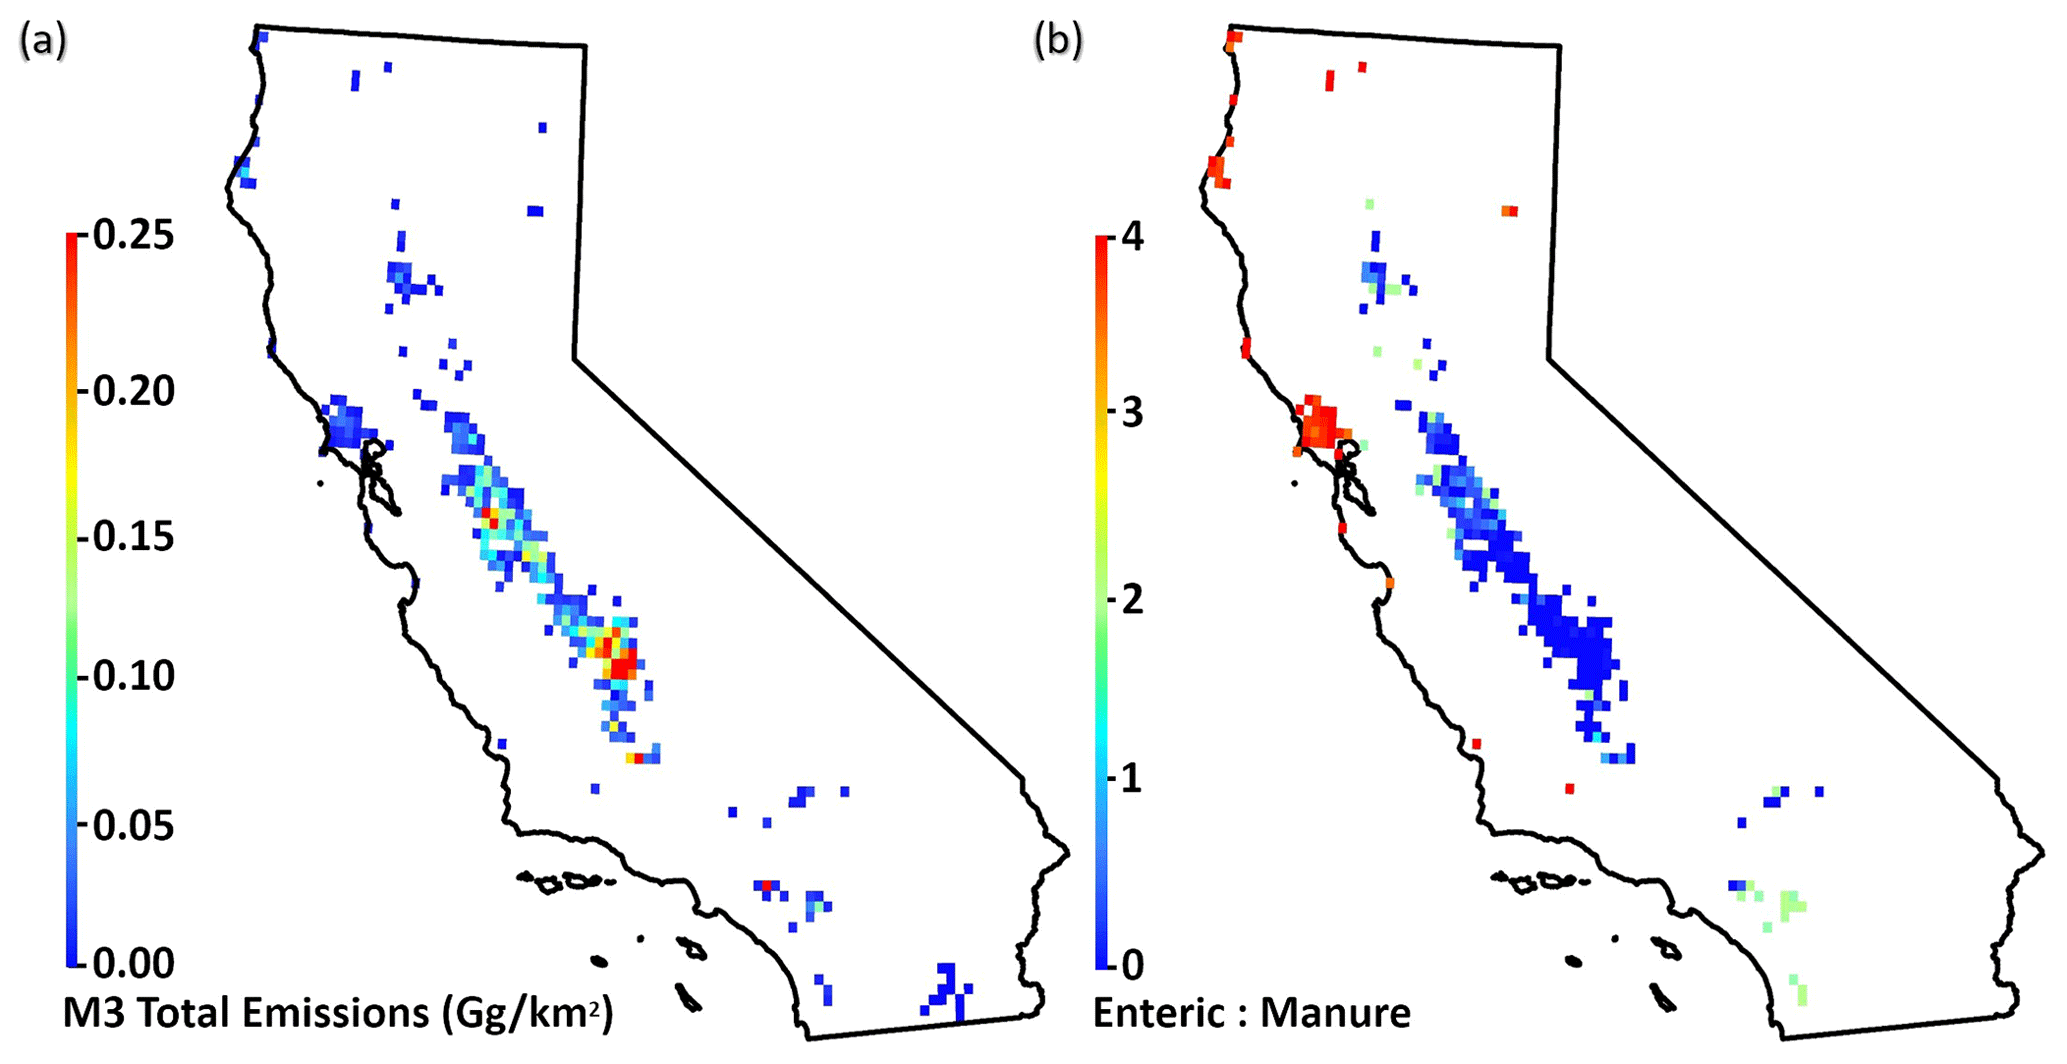
Figure 3Map of (a) total methane emissions and (b) ratio of enteric fermentation emissions to manure emissions in California. In panel (a), red indicates high total methane emissions and blue indicates low total methane emissions. In panel (b), red indicates relatively high enteric fermentation emissions, while blue indicates relatively high manure management emissions.
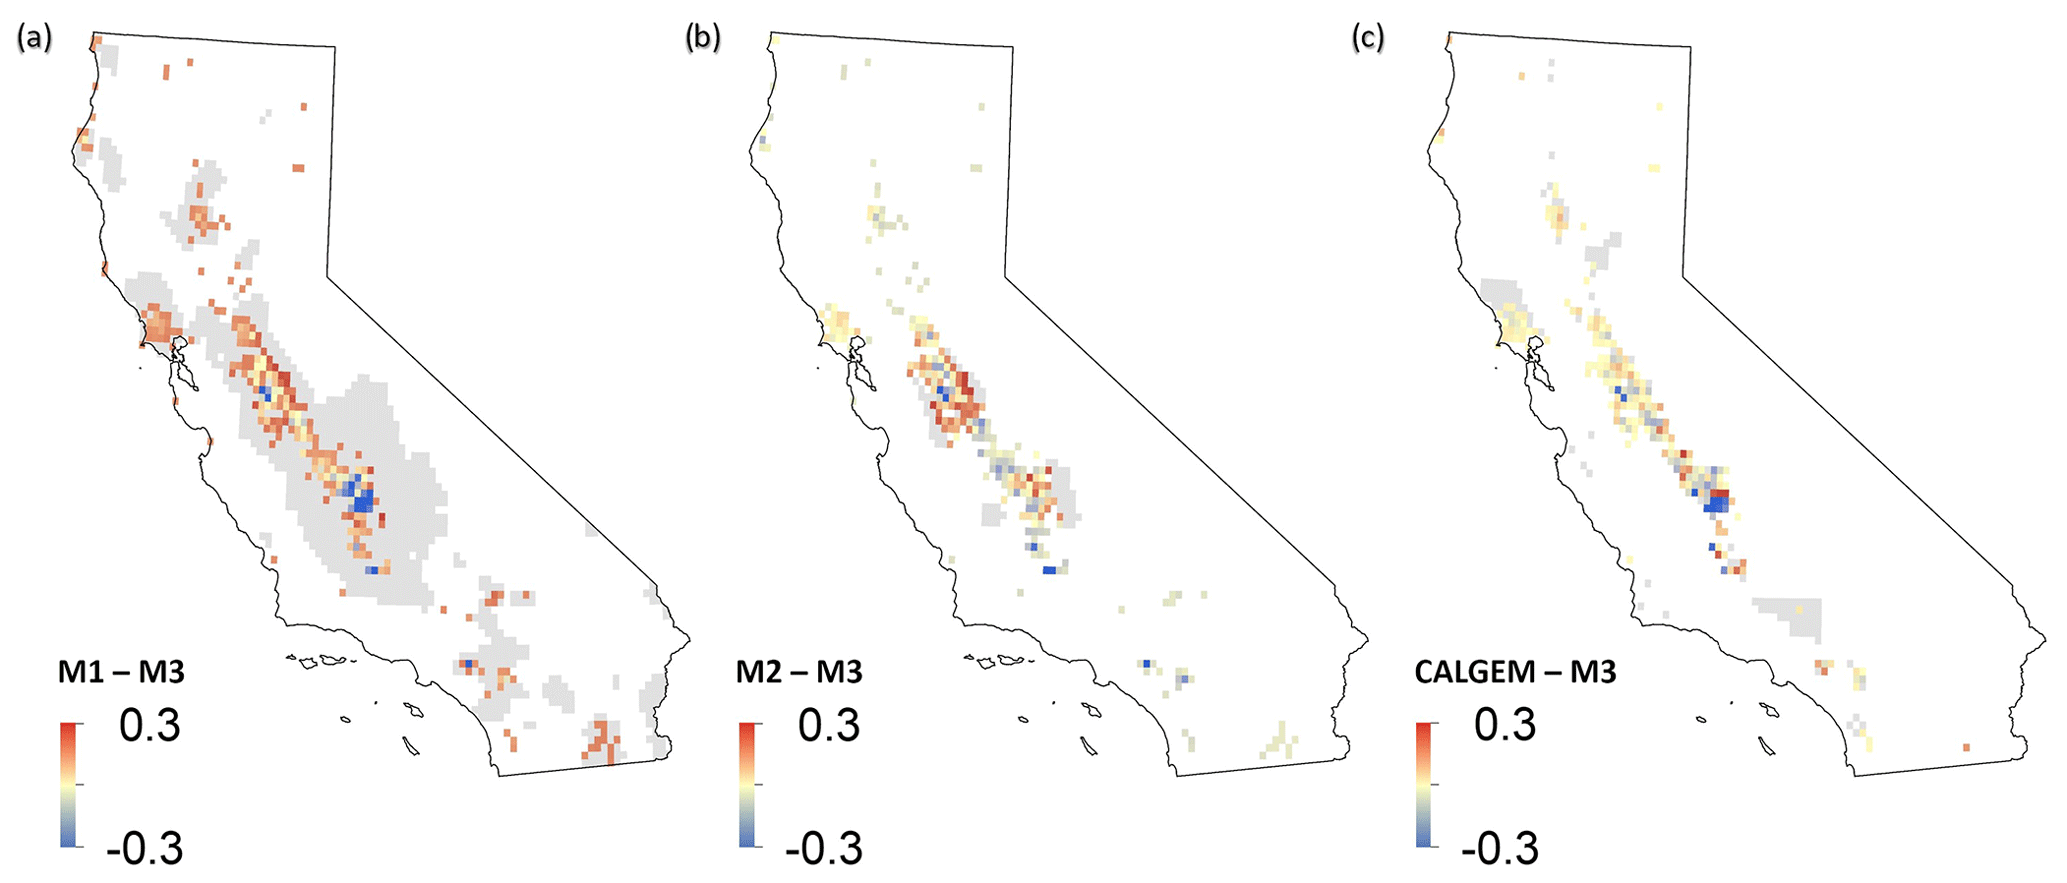
Figure 4Map of the difference between facility-scale (M3) measurements and (a) M1 (Masakkers et al., 2017), (b) M2 (Hristov et al., 2017), and (c) CALGEM (Jeong et al., 2016) in California. Positive (red) numbers indicate M1, M2, and CALGEM are higher than M3 measurements, while negative (blue) values indicate M3 is higher than M1, M2, or CALGEM. Gray values show where M1, M2, and CALGEM show dairy emissions but M3 does not. The color bar represents absolute differences between the methods in gigagrams per square kilometer, where red indicates M3 is lower than the other method, and blue indicates that M3 is larger than the other method.
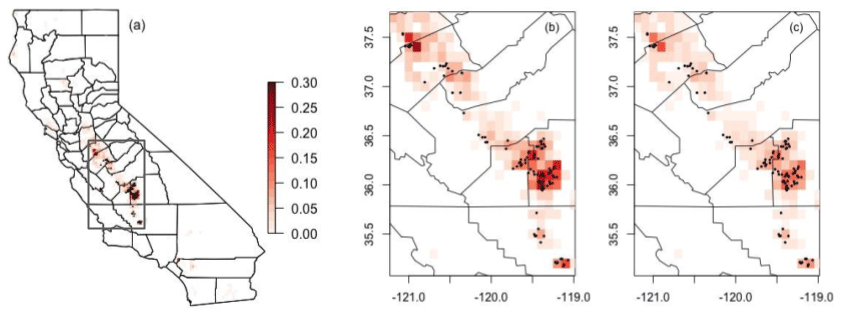
Figure 5Total methane emissions of California San Joaquin Valley in gigagrams per square kilometer (a, b) before and (c) after installation of anaerobic digesters. Darker red shows higher emissions. The box in panel (a) is expanded in panels (b) and (c).
3.7 Alternative manure management strategy assessment
We found that existing solid separators reduce statewide manure CH4 emissions by 26.2 (8.0 %). This estimate assumes that half of all separated solids are used as bedding, and one-third of the C of separated solids is emitted as CO2, rather than CH4, as with other solids.
We estimated the effects of anaerobic digesters on CH4 emissions at 100 dairies in the Central Valley that have or are scheduled to have anaerobic digesters in 2017–2019 (CDFA, 2020b, Fig. 5). Following the USEPA, we assume a 75 % efficiency in anaerobic digesters (Lory et al., 2010; Charrier, 2016). We predict a total reduction of CH4 emissions by 36.5 Gg CH4/yr. This represents a 51.9 % decrease in manure emissions and a 25.9 % reduction in total (manure + enteric) emissions from dairies with these digesters, resulting in a 10.9 % decrease in statewide manure emissions and a 5.3 % decrease in total (enteric + manure) statewide dairy emissions. However, limited data exist on farm-scale emissions before and after digesters, or on the efficiency of digesters.
Our estimate provides a baseline against which the effectiveness of digester systems to reduce CH4 emissions can be assessed. Current top-down measurements of CH4 emissions in California are associated with large uncertainty and are not likely to capture signals of this magnitude. Jeong et al. (2016) inversion modeling posteriors suggest a 25 % error in CH4 emissions in the California Central Valley, but grid-scale error is much higher. The 95 % confidence intervals for the Central Valley are 1020–1740 Gg CH4/yr (Jeong et al., 2016), where the uncertainty in emissions is an order of magnitude larger than the reduction we expect to see from the digesters.
Raster files at 0.1∘ resolution of methane emissions from the Vista-CA Dairy dataset and associated metadata are open access and are available in the Oak Ridge National Laboratory Distributed Active Archive Center for Biogeochemical Dynamics (ORNL DAAC) (Marklein and Hopkins, 2020; https://doi.org/10.3334/ORNLDAAC/1814).
The farm-specific Vista-CA Dairies emission product is the first spatially explicit database of CH4 emissions from dairies at the farm scale. By separately mapping enteric fermentation emissions and manure management emissions, our product is valuable for source attribution and for determining the effects of changes to management on greenhouse gas budgets. At the state level, manure and enteric fermentation CH4 emissions from the farm-specific method were not significantly different than previous analyses (Appuhamy, 2018; CARB, 2014; Hristov et al., 2017; Maasakkers et al., 2016), which supports the validity of the farm-specific methodology. However, at the facility scale, state- or county-level assumptions by EPA and CARB often do not match on-farm reality (Arndt et al., 2018), particularly given that they use statewide average emissions factors that cannot capture regional differences in climate or management.
The farm-specific data also explicitly include manure management practices, which can vary with climate, geography, and regional policy. The spatial differences in per-cow emissions are particularly pronounced because of regional patterns in manure management strategies. Because the Central Valley primarily uses flush systems, storing a large percentage of manure in lagoons, while North Coast and Southern California dairies tend to have scrape systems and open lots, the Central Valley has higher per-cow emissions and lower enteric–manure CH4 emissions (Fig. 3).
We are most confident in the estimates in the San Joaquin Valley region, where air quality permits and water board reports exist, providing facility-level information on the herd sizes and manure management practices. Major uncertainties exist in both bottom up and top down estimates of CH4 emissions from dairies, including methane conversion factors, the number of cows, the amount of manure entering different waste streams, the time on concrete for the cattle, the functionality and efficiency of solid-separator systems, and the amount of manure solids used as bedding. Further, manure management strategies were not defined consistently in the reports, so permit information may not be directly comparable between dairies.
Nevertheless, this dataset is the first comprehensive, facility-scale inventory of CH4 emissions and can be easily updated as more data become available. This includes addition or removal of dairies, updated information on herd demographics, and information on manure management. We can also update the database with new estimates for CH4 emissions as more data emerge and models become more accurate. More facility-scale information could be gained through either policy initiatives that require more detailed reports or thorough data mining of spatial images. For example, including an account of different types of feed will improve enteric fermentation emission predictions (NRC report 2018 24987-2). Mitigation activities including digesters, diet changes, and manure management are implemented at the facility scale. With emissions detail at the facility and process level, the Vista-CA database is therefore useful for predicting and verifying the effects of mitigation activities.
| Bo | Maximum methane production capacity (0.24, 0.17, and 0.17 m3 CH4/kg VS for dairy cows, replacement heifers, and calves, respectively) |
| Calf | 0–6-month-old cattle (n=1 637 339) |
| CH4 | Methane |
| DMI | Dry matter intake (22.9 kg per head per day for lactating cows, 12.7 for dry cows, 8.5 for dairy replacement heifers, and 3.7 for calves) |
| dNDF | Digestible neutral detergent fiber |
| Dry cow | Cattle that have calved that are not lactating; includes mature cows 15 % of the time (n=216 155) |
| ef1 | Emission factor associated with method E1 (114.61 kg CH4 per head per year for lactating cows, 58.32 kg CH4 per replacement heifer per year, and 11.63 kg CH4 per dairy calf per year) |
| ef2 | emission factor associated with method E2 (436 g per head per day for lactating cows, 280 g per head per day for dry cows, 161 g per head per day for replacement heifers, and 70 g per head per day for calves) |
| fbed | Fraction of manure that is used as bedding (0.33) |
| fDMI | Emissions factor for dry matter intake (22.1) |
| flagoon | Fraction of manure that enters the lagoon |
| fmf | Factor associated with milk fat (32.2) |
| fNDF | Factor associated with dNDF (2.18) |
| Heifer | 6–24-month-old cattle (n=1 372 160) |
| i | Class of animal |
| Lactating cow | Cattle that have calved that are lactating; includes mature cows 85 % of the time (n=1 447 088) |
| Mature cow | Cattle that have calved that may or may not be lactating (n=1 702 456) |
| mf | Milk fat content (3.6 %) |
| MCF | Methane conversion factor for manure emissions (0.15 for pasture, 0.005 for daily spread, 0.04 for solid storage, 0.323 for liquid/slurry, 0.748 for lagoon, 0.04 for drylot) |
| nAQ | Population of cattle included in air quality (AQ) permits |
| ni | Population of animal class i |
| nUSDA | Population of cattle in USDA NASS census |
| nWB | Population of cattle included in RWQCB reports |
| TOC | Time on concrete |
| TOMP | Time in milking parlor |
| VS | Volatile solid |
| VSprod | Volatile solids produced by each animal class (kg per head per day) |
| Density of methane (0.662 kg CH4/m3) |
The supplement related to this article is available online at: https://doi.org/10.5194/essd-13-1151-2021-supplement.
FMH conceived of the presented idea. ARM developed the methods and analyzed the data with input from FMH, DM, SJ, and MLF. ARM, SJ, and MLF performed the statistics. MC and TR compiled the data. DM provided guidance on the methods and all other aspects of the manuscript. ARM prepared the manuscript with contributions from all authors. FMH supervised the project.
The authors declare that they have no conflict of interest.
The authors acknowledge the dairy farmers who provided information on the permits and reports, Patricia Price for helping obtain the dairy locations and herd populations, and the San Joaquin Valley and Santa Ana Air Quality Control Boards, California Integrated Water Quality System, and Regional Water Quality Control Boards.
This research has been supported by the UCOP grant (grant no. LFR-18-548581) and NASA's Advancing Collaborative Connections for Earth System Science (ACCESS) Methane Source Finder (grant no. 15-ACCESS15-0034).
This paper was edited by Nellie Elguindi and reviewed by two anonymous referees.
Ahn, H. K., Mulbry, W., White, J. W., and Konrad, S. L.: Pile mixing increases greenhouse gas emissions during composting of dairy manure, Bioresource Technol., 102, 2904–2909, https://doi.org/10.1016/j.biortech.2010.10.142, 2011.
Appuhamy, R. and Kebreab, E.: Characterizing California-specific cattle feed rations and improved modeling of enteric fermentation for California's greenhouse gas inventory 2018, 1–41, available at: https://ww2.arb.ca.gov/sites/default/files/classic//research/apr/past/16rd001.pdf (last access: 4 March 2021), 2018.
Arndt, C., Leytem, A. B., Hristov, A. N., Zavala-Araiza, D., Cativiela, J. P., Conley, S., Daube, C., Faloona, I., and Herndon, S. C.: Short-term methane emissions from 2 dairy farms in California estimated by different measurement techniques and US Environmental Protection Agency inventory methodology: A case study, J. Dairy Sci., 101, 11461–11479, https://doi.org/10.3168/jds.2017-13881, 2018.
California Air Resources Board: 2014 Edition California's 2000–2012 Greenhouse Gas Emissions Inventory Technical Support Document State of California Air Resources Board Air Quality Planning and Science Division, 1–168, available at: https://ww3.arb.ca.gov/cc/inventory/doc/methods_00-14/ghg_inventory_00-14_technical_support_document.pdf (last access: 4 March 2021), 2014.
California Department of Food and Agriculture: Annual Statistics Report 2017–2018, available at: https://www.cdfa.ca.gov/statistics/PDFs/2017-18AgReport.pdf (last access: 12 March 2020), 2018.
California Department of Food and Agriculture: Alternative Manure Management Program, available at: https://www.cdfa.ca.gov/oefi/AMMP/ (last access: 12 March 2020), 2020a.
California Department of Food and Agriculture: Dairy Digester Research and Development Program, available at: https://www.cdfa.ca.gov/oefi/ddrdp/ (last access: 12 March 2020), 2020b.
California Integrated Water Quality System: California Integrated Water Quality System Regulated Facility Reports, available at: https://ciwqs.waterboards.ca.gov/ciwqs/readOnly/CiwqsReportServlet?inCommand=reset&reportName=RegulatedFacility (last access: 4 March 2021), 2019.
California Integrated Water Quality System: Regulated Facility Reports, https://ciwqs.waterboards.ca.gov/ciwqs/readOnly/CiwqsReportServlet?inCommand=reset&reportName=RegulatedFacility, 2017.
California Regional Water Quality Control Board: Reissued waste discharge requirements general order for existing milk cow dairies, 1–167, available at: https://www.waterboards.ca.gov/centralvalley/board_decisions/adopted_orders/general_orders/r5-2013-0122.pdf (last access: 4 March 2021), 2013.
Chang, A., Harter, T., Letey, J., Meyer, D., Meyer, R. D., Mastthews, M. C., Mitloehner, F., Pettygrove, S., Robinson, P., and Zhang, R.: Managing Dairy Manure in the Central Valley of California, available at: http://groundwater.ucdavis.edu/files/136450.pdf (last access: 4 March 2021), 2004.
Charrier, J.: 2016 Edition California's 2000–2014 Greenhouse Gas Emission Inventory Technical Support Document, State of California Air Resources Board, Air Quality Planning and Science Division, September 2016, 1–174, available at: https://ww3.arb.ca.gov/cc/inventory/pubs/reports/2000_2014/ghg_inventory_00-14_technical_support_document.pdf (last access: 4 March 2021), 2016.
Cui, Y. Y., Brioude, J., Angevine, W. M., Peischl, J., McKeen, S. A., Kim, S.-W., Neuman, J. A., Henze, D. K., Bousserez, N., Fischer, M. L., Jeong, S., Michelsen, H. A., Bambha, R. P., Liu, Z., Santoni, G. W., Daube, B. C., Kort, E. A., Frost, G. J., Ryerson, T. B., Wofsy, S. C., and Trainer, M.: Top-down estimate of methane emissions in California using a mesoscale inverse modeling technique: The San Joaquin Valley, J. Geophys. Res.-Atmos., 122, 3686–3699, https://doi.org/10.1002/2016JD026398, 2017.
Dlugokencky, E. J., Nisbet, E. G., Fisher, R., and Lowry, D.: Global atmospheric methane: budget, changes and dangers, Philos. Trans. R. Soc. London A, 369, 2058–2072, https://doi.org/10.1098/rsta.2010.0341, 2011.
Duren, R. M., Thorpe, A. K., Foster, K. T., Rafiq, T., Hopkins, F. M., Yadav, V., Bue, B. D., Thompson, D. R., Conley, S., Colombi, N. K., Frankenberg, C., McCubbin, I. B., Eastwood, M. L., Falk, M., Herner, J. D., Croes, B. E., Green, R. O., and Miller, C. E.: California's methane super-emitters, Nature, 575, 180–184, https://doi.org/10.1038/s41586-019-1720-3, 2019.
Hamilton, D. W., Fathepure, B., Fulhage, C. D., Clarkson, W., and Lalman, J.: Treatment lagoons for animal agriculture, in: Animal Agriculture and the Environment: National Center for Manure and Animal Waste Management White Papers, edited by: Rice, J. M., Caldwell, D. F., and Humenik, F. J., ASABE, St. Joseph, Michigan, Pub. Number 913C0306, 547–574, 2006.
Hristov, A. N., Harper, M., Meinen, R., Day, R., Lopes, J., Ott, T., Venkatesh, A., and Randles, C. A.: Discrepancies and Uncertainties in Bottom-up Gridded Inventories of Livestock Methane Emissions for the Contiguous United States, Environ. Sci. Technol., 51, 13668–13677, https://doi.org/10.1021/acs.est.7b03332, 2017.
IPCC: IPCC Guidelines for National Greenhouse Gas Inventories. Volume 4 – Agriculture, Forestry and Other Land Use, Chapter 10: Emissions from Livestock and Manure Management, available at: https://www.ipcc-nggip.iges.or.jp/public/2006gl/pdf/4_Volume4/V4_10_Ch10_Livestock.pdf (last access: 4 March 2021), edited by: Eggleston, H. S., Buendia, L., Miwa, K., Ngara, T., and Tanabe, K., IGES, Japan, 2006.
Jeong, S., Zhao, C., Andrews, A. E., Bianco, L., Wilczak, J. M., and Fischer, M. L.: Seasonal variation of CH4 emissions from central California, J. Geophys. Res., 117, D11306, https://doi.org/10.1029/2011JD016896, 2012.
Jeong, S., Newman, S., Zhang, J., Andrews, A. E., Bianco, L., Bagley, J., Cui, X., Graven, H., Kim, J., Salameh, P., LaFranchi, B. W., Priest, C., Campos-Pineda, M., Novakovskaia, E., Sloop, C. D., Michelsen, H. A., Bambha, R. P., Weiss, R. F., Keeling, R., and Fischer, M. L.: Estimating methane emissions in California's urban and rural regions using multitower observations, J. Geophys. Res.-Atmos., 121, 13031–13049, https://doi.org/10.1002/2016JD025404, 2016.
Lory, J. A., Massey, R. E. and Zulovich, J. M.: An Evaluation of the USEPA Calculations of Greenhouse Gas Emissions from Anaerobic Lagoons, J. Environ. Qual., 39, 776–778, https://doi.org/10.2134/jeq2009.0319, 2010.
Maasakkers, J. D., Jacob, D. J., Sulprizio, M. P., Turner, A. J., Weitz, M., Wirth, T., Hight, C., DeFigueiredo, M., Desai, M., Schmeltz, R., Hockstad, L., Bloom, A. A., Bowman, K. W., Jeong, S., and Fischer, M. L.: Gridded National Inventory of U.S. Methane Emissions, Environ. Sci. Technol., 50, 13123–13133, https://doi.org/10.1021/acs.est.6b02878, 2016.
Marklein, A. R. and Hopkins, F. M.: Dairy Sources of Methane Emissions in California, ORNL DAAC, Oak Ridge, Tennessee, USA, https://doi.org/10.3334/ORNLDAAC/1814, 2020.
Meyer, D.: Characterize Physical and Chemical Properties of Manure in California Dairy Systems to Improve Greenhouse Gas Emission Estimates, 1–70, available at: https://ww2.arb.ca.gov/sites/default/files/classic/research/apr/past/16rd002.pdf (last access: 4 March 2021), 2019.
Meyer, D., Price, P. L., Rossow, H. A., Silva-del-Rio, N., Karle, B. M., Robinson, P. H., DePeters, E. J., and Fadel, J. G.: Survey of dairy housing and manure management practices in California, J. Dairy Sci., 94, 4744–4750, https://doi.org/10.3168/jds.2010-3761, 2011.
Miller, S. M., Wofsy, S. C., Michalak, A. M., Kort, E. A., Andrews, A. E., Biraurd, S. C., Dlugokencky, E. J., Eluszkiewicz, J., and Fischer, M. L.: Anthropogenic emissions of methane in the United States, P. Natl. Acad. Sci. USA, 575, 180–184, https://doi.org/10.1073/pnas.1314392110, 2013.
Miranda, N. D., Granell, R., Tuomisto, H., and Mcculloch, M. D.: Meta-analysis of methane yields from anaerobic digestion of dairy cattle manure, Biomass Bioenerg., 86, 65–75, https://doi.org/10.1016/j.biombioe.2016.01.012, 2016.
NASEM (National Academies of Sciences, Engineering, and Medicine): Improving Characterization of Anthropogenic Methane Emissions in the United States, National Academies Press, Washington, D.C., 2018.
Owen, J. J. and Silver, W. L.: Greenhouse gas emissions from dairy manure management: a review of field-based studies, Glob. Change Biol., 21, 550–565, https://doi.org/10.1111/gcb.12687, 2014.
Rafiq, T., Duren, R. M., Thorpe, A. K., Foster, K., Patarsuk, R., Miller, C. E., and Hopkins, F. M.: Attribution of Methane Point Source Emissions using Airborne Imaging Spectroscopy and the Vista-California Methane Infrastructure Dataset, Environ. Res. Lett., 15, 2020.
R Core Team: A language and environment for statistical computing. R Foundation for Statistical Computing, Vienna, Austria, available at: http://www.R-project.org/ (last access: 4 March 2021), 2013.
Ross, K.: California Agricultural Statistics Review, 1–121, available at: https://www.nass.usda.gov/Statistics_by_State/California/Publications/Annual_Statistical_Reviews/2019/2018cas-all.pdf (last access: 4 March 2021), 2019.
State of California: Senate Bill 1383, available at: https://leginfo.legislature.ca.gov/faces/billNavClient.xhtml?bill_id=201520160SB1383 (last access: 4 March 2021), 2016.
Trousdell, J. F., Conley, S. A., Post, A., and Faloona, I. C.: Observing entrainment mixing, photochemical ozone production, and regional methane emissions by aircraft using a simple mixed-layer framework, Atmos. Chem. Phys., 16, 15433–15450, https://doi.org/10.5194/acp-16-15433-2016, 2016.
USDA NASS: Census of Agriculture, 1–20, available at: http://www.nass.usda.gov/AgCensus (last access: 4 March 2021), 2017.
US EPA, O. C. C. D.: Inventory of U.S. Greenhouse Gas Emissions and Sinks: 1990–2015 – Annexes, 1–475, available at: https://www.epa.gov/sites/production/files/2017-02/documents/2017_all_annexes.pdf (last access: 4 March 2021), 2017.
Wecht, K. J., Jacob, D. J., Sulprizio, M. P., Santoni, G. W., Wofsy, S. C., Parker, R., Bösch, H., and Worden, J.: Spatially resolving methane emissions in California: constraints from the CalNex aircraft campaign and from present (GOSAT, TES) and future (TROPOMI, geostationary) satellite observations, Atmos. Chem. Phys., 14, 8173–8184, https://doi.org/10.5194/acp-14-8173-2014, 2014.
Wolf, J., Asrar, G. R., and West, T. O.: Revised methane emissions factors and spatially distributed annual carbon fluxes for global livestock, Carbon Balance and Management, 12, 16, https://doi.org/10.1186/s13021-017-0084-y, 2017.