the Creative Commons Attribution 4.0 License.
the Creative Commons Attribution 4.0 License.
 | 16 Apr 2020
Annual oil palm plantation maps in Malaysia and Indonesia from 2001 to 2016
Philippe Ciais
Yuqi Cheng
Peng Gong
Increasing global demand of vegetable oils and biofuels results in significant oil palm expansion in southeastern Asia, predominately in Malaysia and Indonesia. The land conversion to oil palm plantations has posed risks to deforestation (50 % of the oil palm was taken from forest during 1990–2005; Koh and Wilcove, 2008), loss of biodiversity and greenhouse gas emission over the past decades. Quantifying the consequences of oil palm expansion requires fine-scale and frequently updated datasets of land cover dynamics. Previous studies focused on total changes for a multi-year interval without identifying the exact time of conversion, causing uncertainty in the timing of carbon emission estimates from land cover change. Using Advanced Land Observing Satellite (ALOS) Phased Array type L-band Synthetic Aperture Radar (PALSAR), ALOS-2 PALSAR-2 and Moderate Resolution Imaging Spectroradiometer (MODIS) datasets, we produced an annual oil palm area dataset (AOPD) at 100 m resolution in Malaysia and Indonesia from 2001 to 2016. We first mapped the oil palm extent using PALSAR and PALSAR-2 data for 2007–2010 and 2015–2016 and then applied a disturbance and recovery algorithm (Breaks For Additive Season and Trend – BFAST) to detect land cover change time points using MODIS data during the years without PALSAR data (2011–2014 and 2001–2006). The new oil palm land cover maps are assessed to have an accuracy of 86.61 % in the mapping step (2007–2010 and 2015–2016). During the intervening years when MODIS data are used, 75.74 % of the detected change time matched the timing of actual conversion using Google Earth and Landsat images. The AOPD revealed spatiotemporal oil palm dynamics every year and shows that plantations expanded from 2.59 to 6.39×10⁶ ha and from 3.00 to 12.66×10⁶ ha in Malaysia and Indonesia, respectively (i.e. a net increase of 146.60 % and 322.46 %) between 2001 and 2016. The higher trends from our dataset are consistent with those from the national inventories, with limited annual average difference in Malaysia (0.2×10⁶ ha) and Indonesia (−0.17×10⁶ ha). We highlight the capability of combining multiple-resolution radar and optical satellite datasets in annual plantation mapping to a large extent by using image classification and statistical boundary-based change detection to achieve long time series. The consistent characterization of oil palm dynamics can be further used in downstream applications. The annual oil palm plantation maps from 2001 to 2016 at 100 m resolution are published in the Tagged Image File Format with georeferencing information (GeoTIFF) at https://doi.org/10.5281/zenodo.3467071 (Xu et al., 2019).
- Article
(15329 KB) - Full-text XML
-
Supplement
(9816 KB) - BibTeX
- EndNote


The global demand for vegetable oil and its derivative products calls for an increase in palm oil production, leading to oil palm expansion and intensification in southeastern Asia (Sayer et al., 2012). According to the Food and Agriculture Organization (FAO), Malaysia and Indonesia account for 81.90 % of the global oil palm fruit production in 2017, an increase of 179.72 % from 2000 to 2017 (see http://faostat.fao.org, last access: 20 December 2019) that is projected to continue in the future (Murphy, 2014). The boom of oil palm industries caused and also raised the deforestation risks (Austin et al., 2018; Vijay et al., 2018). In Malaysia and Indonesia, more than 50 % of the oil palm plantations were converted from forest during 1990–2005 (Koh and Wilcove, 2008), and industrial plantations dominated by oil palm (72.5 % of all plantations) caused a ∼60 % decrease in peatland forest from 2007 to 2015 (Miettinen et al., 2016). A series of consequences includes but is not limited to biodiversity decline (Fitzherbert et al., 2008), peatland loss (Koh et al., 2011) and carbon emission (Guillaume et al., 2018).
Quantifying the spatiotemporal details of oil palm expansion is important for understanding the deforestation process and its impacts on ecosystem services and promotes progress in environmental governance and policy decisions (Gibbs et al., 2010; Koh and Wilcove, 2008). However, annual information on the expansion of oil palm plantations is poorly documented in Malaysia and Indonesia. The statistical records (e.g. FAO, United States Department of Agriculture – USDA) give neither the detailed spatial distribution nor the young oil palm trees and smallholder plantations. Many efforts have been made to characterize the oil palm extent (Cheng et al., 2018; Gaveau et al., 2016; Miettinen et al., 2017). For example, the Roundtable on Sustainable Palm Oil (RSPO), whose members manage one-third of the world's oil palm, provided spatial information on oil palm distribution in Malaysia and Indonesia (Gunarso et al., 2013). The continuous mapping of oil palm on peatland in 1990, 2000, 2007 and 2010 described the dynamic change of oil palm on peat during the past 30 years (Miettinen et al., 2012). But these maps are given for a certain year or several time phases without capturing the exact time of oil palm changes. Dynamic global vegetation models use gross land-use change and thus require high-resolution grid-cell-based annual oil palm conversion maps rather than country-level inventories and bi-decadal land cover maps (Yue et al., 2018a, b). A lack of continuous change information may cause a wrong interpretation of land cover change time and significant bias in global carbon dynamic studies (Zhao and Liu, 2014; Zhao et al., 2009). As a result, oil palm plantation maps at high temporal and spatial resolutions in Malaysia and Indonesia are urgently needed.
Remote sensing has been used in oil palm monitoring since the 1990s. Progress has been made in oil palm mapping and change detection, including (1) data sources from optical satellite earth observations (Lee et al., 2016; Srestasathiern and Rakwatin, 2014) to microwave datasets such as the Phased Array type L-band Synthetic Aperture Radar (PALSAR; Cheng et al., 2018; Dong et al., 2015), (2) spatiotemporal resolutions from the regional to national scale (Miettinen et al., 2017) and from single to multi-decadal mapping (Gaveau et al., 2016; Miettinen et al., 2016), (3) interpretation methods from manual to semi-automatic and fully automatic identification (Baklanov et al., 2018; Cheng et al., 2019; W. Li et al., 2017; Mubin et al., 2019; Ordway et al., 2019), and (4) products going from oil palm land cover maps to more detailed datasets on plantation structure, e.g. tree counting (Li et al., 2019; Cheang et al., 2017) age, yield estimation (Balasundram et al., 2013; Tan et al., 2013), etc. A few studies also focused on the continuous oil palm change detection (Carlson et al., 2013; Gaveau et al., 2016; Vijay et al., 2018). These studies adopted visual or semi-automatic interpretation for oil palm plantations, which is labour-intensive and not appropriate for long-term annual oil palm plantation monitoring. Automatic identification can overcome this difficulty by using classification algorithms based on Landsat and PALSAR and PALSAR-2 data, which were successfully applied to produce the 2015 land cover map of insular southeastern Asia with discrimination of oil palm plantations (Miettinen et al., 2017). So far, however, the annual dynamics of oil palm plantations (expansion and shrinkage) remains unquantified for Malaysia and Indonesia.
The annual oil palm mapping in tropical areas such as insular southeastern Asia is a challenge due to the persistent cloudy conditions (Gong et al., 2013; Yu et al., 2013). Multi-temporal optical images can help reduce cloud effects (Yu et al., 2013), but it is still difficult to obtain effective optical observations in Malaysia and Indonesia (51.88 % of the region is without annual Landsat images; Fig. S1 in the Supplement). Microwave remote sensing is not affected by clouds and is considered to be the most efficient source in separating forested vegetation and oil palms (Ibharim et al., 2015; Teng et al., 2015). The long time span of 25 m resolution PALSAR and PALSAR-2 data provides opportunities for mapping oil palm at high spatiotemporal resolutions. Recently the PALSAR and PALSAR-2 data have been successfully used in characterizing oil palm change for the whole country of Malaysia for 6 years using PALSAR (2007–2010) and PALSAR-2 (2015–2016; Cheng et al., 2019). However, the gap years (2011–2014) between PALSAR and PALSAR-2 hampered continuous tracking of oil palm plantation dynamics. One potential way to achieve annual mapping is to use optical earth observation data, e.g. Landsat images for the PALSAR gap period (Chen et al., 2018; Shen et al., 2019). However, this requires abundant Landsat images (>4; Xu et al., 2018a) that are not available in the humid tropical regions and may cause “false changes” and “inter-annual inconsistency” (Broich et al., 2011). Recently, a super-resolution mapping method (X. Li et al., 2017; Qin et al., 2017; Xu et al., 2017) was used to reconstruct missing forest cover change during 2011–2014 (Zhang et al., 2019) by fusing the PALSAR and PALSAR-2 and the Moderate Resolution Imaging Spectroradiometer (MODIS) normalized difference vegetation index (NDVI) with dense temporal resolution and phenological information. However, it is difficult to separate oil palm and natural forest with similar NDVI variation using such classification-based fusion. A new approach based on change detection in a given period using time-series observations (i.e. MODIS NDVI, GIMMS NDVI) was successfully applied to fill the years with missing data in developing a nominal 30 m annual China land-use and land cover dataset (Xu et al., 2020). This approach takes advantage of dense observations by detecting break points in a time series using change-detection algorithms, combined with the pre-existing knowledge from the mapped years, and thus reduces the inter-annual inconsistency.
The objectives of this study are (i) to develop a robust and consistent approach capable of detecting annual oil palm changes in southeastern Asia using multiple remote-sensing datasets based on image classification and break point detection, (ii) to produce a nominal 100 m annual oil palm area dataset (AOPD) in Malaysia and Indonesia from 2001 to 2016, and (iii) to quantify the spatial and temporal patterns of oil palm change dynamics since 2001. Specifically, we developed the annual oil palm plantation dataset in Malaysia and Indonesia by using a two-stage method. The first step is random forest-based image classification using PALSAR during 2007–2010 and PALSAR-2 data during 2015–2016 (the periods with PALSAR and PALSAR-2 data available). Combined with the oil palm maps produced in the first step during the years with PALSAR coverage, MODIS NDVI was used in a change-detection algorithm called Breaks For Additive Seasonal and Trend (BFAST; Verbesselt et al., 2010a) to fill the data-gap years (2011–2014) outside the PALSAR years and extend the oil palm land cover mapping period back to 2001. Oil palm in this study refers to both young and mature oil palm trees from industrial plantations and smallholders with the minimum size of 1 ha (oil palm smallholders are defined as 50 ha or less of cultivated land producing palm oil controlled by smallholder farmers – the definition used by the RSPO – with an average of 2 ha; World Bank; 2010).
2.1 Study area
Insular southeastern Asia was originally occupied by evergreen moist tropical forest, which is one of the most biologically diverse terrestrial ecosystems on Earth. The natural environment, with humid tropical climates and low-lying topography, is suitable for the oil palm (Elaeis guineensis; Fitzherbert et al., 2008). Since 1911, when the first commercial oil palm plantation in southeastern Asia was founded in Sumatra, oil palm plantations expanded rapidly in Sumatra and peninsular Malaysia and then spread to Sarawak and Sabah in Malaysia and Kalimantan in Indonesia (Corley and Tinker, 2008). Industrial oil palm plantations spurred the economic sectors in southeastern Asian countries but also raised concerns on the negative social and environmental impacts (Obidzinski et al., 2012; Sayer et al., 2012). Recently, oil palm plantation expansion became one of the dominant drivers of deforestation in Malaysia and Indonesia (Austin et al., 2018; Gaveau et al., 2016). Thus, we chose as a study area the whole area of Malaysia and Sumatra and Kalimantan in Indonesia, which encompass 96 % of the total oil palm production in Indonesia (Petrenko et al., 2016). Oil palm plantations in these two countries account for 67.51 % of world's total oil palm plantation area (FAOSTAT, 2017), and dramatic land cover conversion happened in this region due to human-induced modifications.
2.2 Overview of the AOPD production
The development of AOPD includes two major stages: (1) oil palm mapping using PALSAR and PALSAR-2 data (Sect. 2.3) and (2) change-detection-based oil palm updating using MODIS NDVI during the gap years in operation between Advanced Land Observing Satellite (ALOS) and ALOS-2 (Sect. 2.4). The first stage aimed at producing the oil palm maps for 2007, 2008, 2009 and 2010 using PALSAR and 2015 and 2016 using PALSAR-2 datasets. The detailed procedures include the pre-processing of the original PALSAR and PALSAR-2 data, training sample collection and image classification, and final production of oil palm maps for the target years after post-processing using ancillary datasets. In the second stage, we combined oil palm maps produced in the first stage with MODIS NDVI data. Time series of MODIS NDVI data and change maps were prepared in the data preparation step, followed by the break point test using the change-detection algorithm, BFAST, to detect the change year (change from other land cover types to oil palm and the reverse) in the PALSAR and PALSAR-2 missing-data period. After the post-processing, we derived the oil palm maps in these gap years and traced the oil palm distribution back to 2001. Combining the results from the two stages, we obtained the annual oil palm plantation maps from 2001 to 2016 at 100 m spatial resolution, forming the AOPD. The whole workflow is shown in Fig. 1.
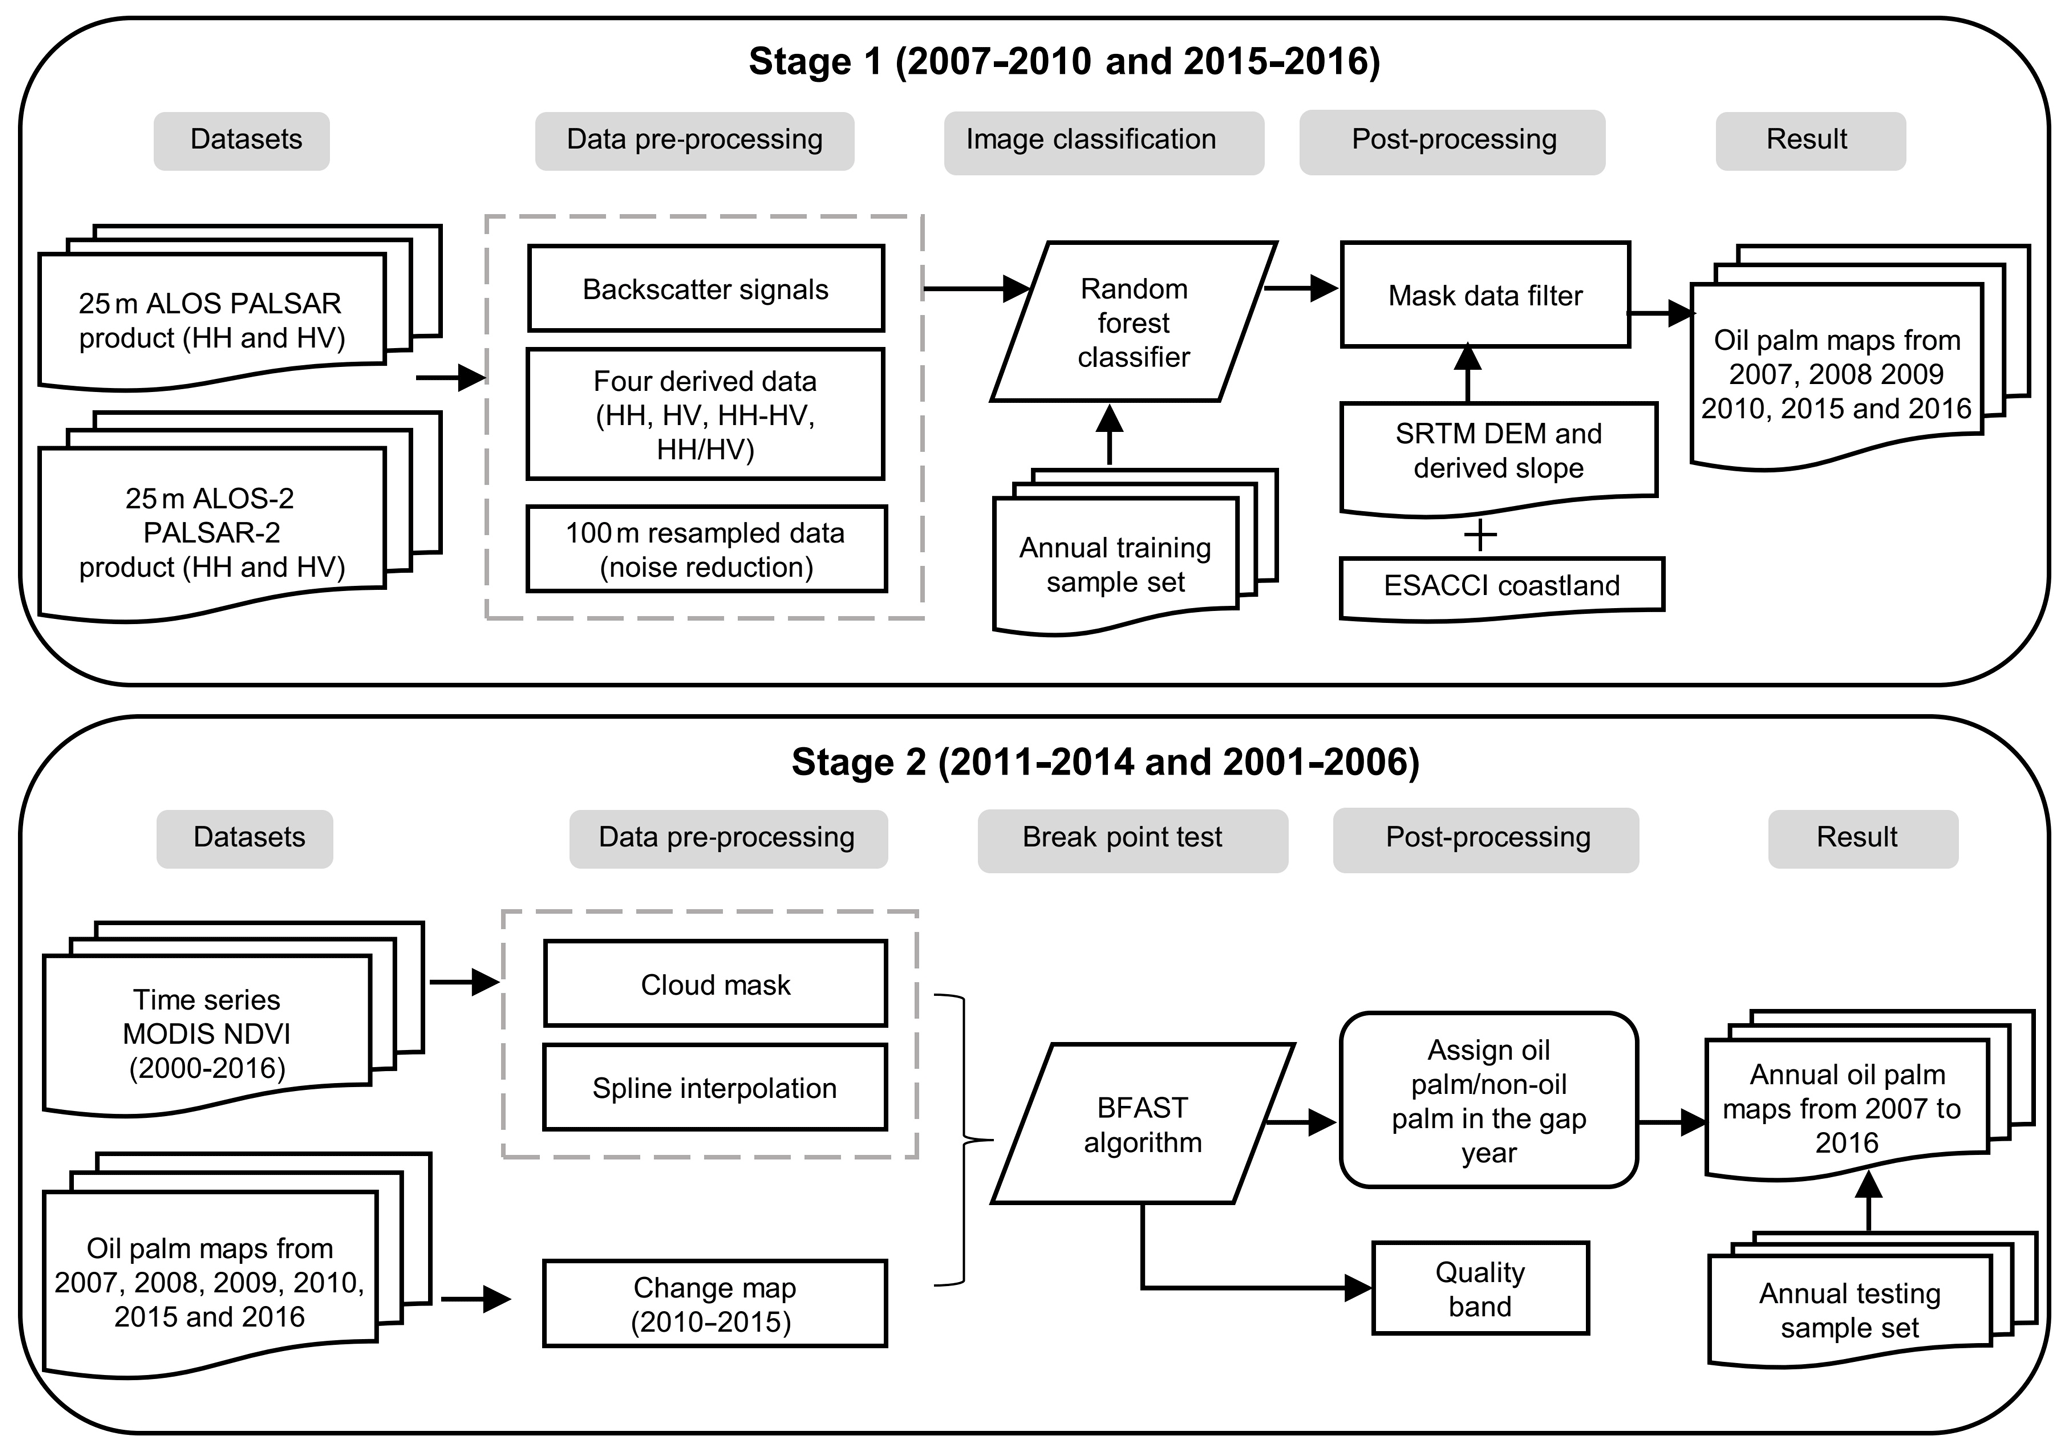
Figure 1Workflow of the annual oil palm mapping procedure. Stage 1 stands for oil palm mapping using PALSAR and PALSAR-2 data, and Stage 2 stands for change-detection-based oil palm maps updated using MODIS NDVI.
2.3 Oil palm mapping using PALSAR and PALSAR-2 data
2.3.1 PALSAR and PALSAR-2 product and data preparation
We used multi-source remote-sensing images to fully cover the study area; these included images from ALOS PALSAR, ALOS-2 PALSAR-2 and MODIS NDVI. The Landsat archives were not used because of the low data availability in this region caused by frequent thick cloud cover (Fig. S1 in the Supplement). The Japan Aerospace Exploration Agency (JAXA) provided the 25 m resolution global PALSAR and PALSAR-2 mosaic by mosaicking SAR images of the backscattering coefficient (http://www.eorc.jaxa.jp/ALOS/en/palsar_fnf/data/index.htm, last access: 20 May 2019). Although the product was compiled at an annual frequency, one product a year is sufficient to identify the oil palm changes, since oil palm is a perennial crop without significant phenological variations in the tropics. To cover the whole study area, 15 patches of PALSAR and PALSAR-2 grids for 6 years (2007, 2008, 2009 and 2010 from PALSAR; 2015 and 2016 from PALSAR-2) were used. Since ALOS stopped working in 2011, no data were available between 2011 and 2014 until the operation of ALOS-2. The product contains data of HH (i.e. horizontal transmit and horizontal receive) and HV (i.e. horizontal transmit and vertical receive) digital numbers (DNs) acquired by PALSAR and PALSAR-2 in Fine Beam Dual (FBD) mode with ortho-rectification and topographic correction. For PALSAR and PALSAR-2, HH and HV DN values were converted to normalized backscattering coefficients (unit: decibel – dB) using the following formula (Rosenqvist et al., 2007):
where CF is a calibration factor (−83.0 dB) in PALSAR and PALSAR-2 data (Shimada et al., 2009). Two additional layers, the difference and ratio, were produced by calculating the ratio and difference from the HH and HV DN of decibels, following
Although ALOS PALSAR and ALOS-2 PALSAR-2 have different satellite microwave sensor properties (e.g. frequency, off-nadir angle), the backscatter signals are relatively stable for the given period (2007–2010 and 2015–2016), as seen by comparing the distribution of backscattering values (HH and HV) of 250 000 randomly generated pixels (using ArcGIS 10.3) in the study area between different years (see Fig. S2). The similar findings for the stability of PALSAR and PALSAR-2 data were also given in previous studies (Cheng et al., 2019; Qin et al., 2017). Meanwhile, the HH and HV values for oil palm and forest are also shown in Fig. S3 and indicate the separability between the two land cover types for both PALSAR and PALSAR-2 data. Therefore, the consistency between ALOS PALSAR and ALOS-2 PALSAR-2 allows tracking the oil palm changes in the study period. One problem of using PALSAR and PALSAR-2 data, however, is the “salt-and-pepper” noise (Zhang et al., 2019), which may cause misclassification and false changes in the subsequent process. Previous studies showed that the resampling method reached higher accuracy and better visual results in oil palm mapping compared to the commonly used filter method (Cheng et al., 2018). The identification and area estimation of oil palm plantations have also been proven to perform better at 100 m resolution (Cheng et al., 2018). Therefore, we resampled the original 25 m PALSAR and PALSAR-2 images to 100 m resolution for every year to reduce salt-and-pepper noise.
2.3.2 Training sample collection and image classification
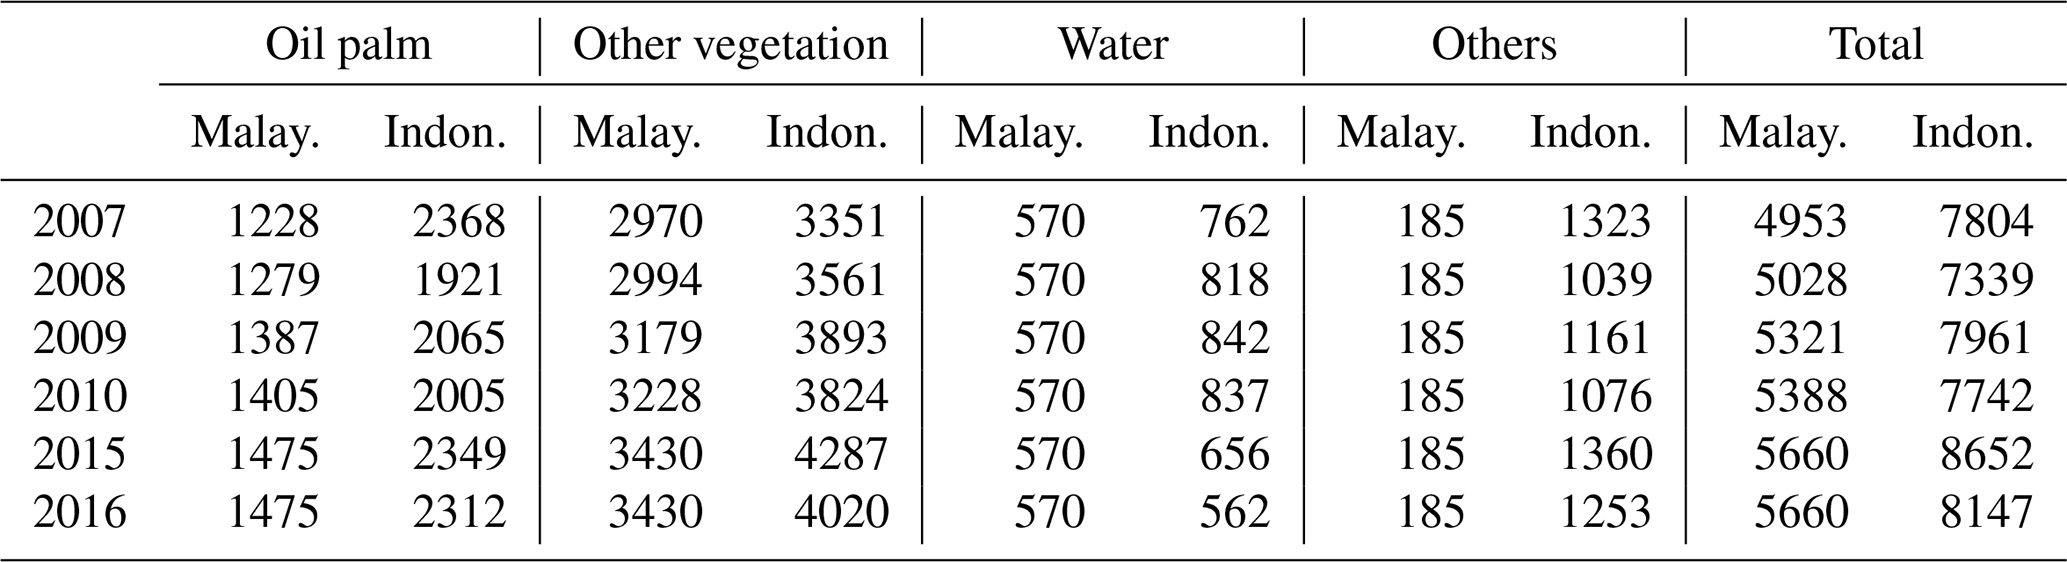
In this study, a multi-year training sample set (2007–2010, 2015 and 2016) was used to map the oil palm extent in Indonesia and Malaysia from 2007 to 2016. We used the training sample set for Malaysia from our previous study (Cheng et al., 2017) and interpreted the training datasets for Indonesia using the same interpretation method. The sample collection was mainly based on the high-resolution (<1 m) images from Google Earth with the assistance of PALSAR and PALSAR-2 images. We first visually interpreted the samples in 2015 and then manually checked the land cover types before and after 2015 if change happened. Here we used 636 and 748 polygonal regions of interest (ROIs; 4953–5660 and 7804–8147 pixels) for Malaysia and Indonesia as the training inputs instead of point sample-based training, since it achieved better results in regular plantations. Four land cover types in this training sample set were included: oil palm (mature and young oil palm – identified by the canopy shape using very high resolution images from Google Earth), water, other vegetation (forest, shrubland and other plantations such as rubber) and others (impervious, cropland and bare land). Mixed land cover types were found in “other vegetation” and “others” because it is difficult to further separate these types within the categories. The detailed distribution of training data is presented in Table 1. Other vegetation types consist of ∼52.9 % of the total sample, followed by the oil palm samples (26.7 %), while “others” and water types only account for ∼20.4 % of the total training samples, which is consistent with the real land cover distribution.
Table 1The distribution of training data (unit: pixel). Malay.: Malaysia. Indon.: Indonesia.
Thereafter, we used a random forest (RF) classifier in the image classification step. The HH and HV digital number of decibels and the derived difference (HH − HV) and ratio (HH ∕ HV) images were all used as inputs to the RF classifier to derive the original annual oil palm maps for the 6 years. The MODIS NDVI is not used as input to the RF model for classification because of the similarity between tropical forest and oil palm and the low resolution, which may negate the benefits of our classification based on higher-spatial-resolution PALSAR data.
2.3.3 Post-processing and oil palm map
Post-processing after the initial results is necessary because of the limitation in the training set, unavoidable classification errors and the difficulty in describing heterogeneous real land surface. To obtain a reliable oil palm dataset, we adopted several steps, including mode filtering, terrain filtering, and intact forest and mangrove filtering in post-processing to improve the final oil palm maps in Stage 1 for 2007, 2008, 2009, 2010, 2015 and 2016.
Mode filtering is used for the very small patches (mainly single pixels) in the initial results, since it is more likely to be errors or noise induced by PALSAR and PALSAR-2 data rather than real oil palm plantations. The topographic factors such as slope and elevation will cause the confusion of backscattering signals from satellite sensors, particularly in area with undulating terrain. Therefore, we applied terrain filtering to reduce the confusion by the topographic factor using the Shuttle Radar Topography Mission (SRTM) 30 m digital elevation model (DEM). The altitude threshold of 1000 m was applied, since the oil palm is mainly distributed in the lowlands (mostly <300 m), and regions higher than 1000 m are not suitable for oil palm cultivation (Austin et al., 2015; Carlson et al., 2013; Corley and Tinker, 2008). Subsequently, we used two additional layers, intact forest landscape (IFL) in 2016 from (Potapov et al., 2008) and the Global Mangrove Atlas (GMA; available at: http://geodata.grid.unep.ch/results.php, last access: 15 March 2020) to filter out non-oil palm areas and reduce the misclassification. The intact forest map denotes natural forest ecosystems, without human-caused disturbances, where oil palm plantations are not supposed to be cultivated. The mangrove swamp area is subsequently flooded by seawater, which is not suitable for oil palm cultivation due to the significant negative impact on the fresh fruit bunches and oil production (Henry and Wan, 2012).
Another problem when developing oil palm maps is the replantation of oil palm trees. Oil palm has a long life cycle of 25 to 30 years. After that, the trees will be cleared and replaced because of a decrease in palm oil yield (Röll et al., 2015). However, from the satellite observations, the land cover type is bare land at the time of oil palm logging, whereas the land-use property remains unchanged as oil palm plantations when checked before and after oil palm logging. Given the limitation of satellite observation, we provided two versions of our oil palm datasets. The first version is the oil palm datasets after the post-processing mentioned above. Here replantation is not considered, and this version includes conversion from other land cover types to oil palm (oil palm expansion) as well as the opposite (oil palm shrinkage). In the second version, we assumed that oil palm expansion is a unidirectional activity due to the growing demand of palm oil. The time-series filtering was conducted by using the 2007 oil palm extent to filter all pixels classified as “non-oil palm” in the subsequent years. As a result, this version of the oil palm plantation dataset has shown continuously expanding areas from 2007 to 2016. The second version includes the impact of oil palm replantation and the thriving oil palm industry in southeastern Asian countries but ignored any possible decrease in oil palm (e.g. abandonment, conversion to cropland) in some areas.
2.4 Change-detection-based oil palm updating using MODIS NDVI
2.4.1 MODIS NDVI time series and data preparation
MODIS NDVI is an important index of vegetation conditions and has been widely used in vegetation and land cover change studies (Clark et al., 2010; Ding et al., 2016; Estel et al., 2015). NDVI in the recent updated MODIS vegetation index data (MOD13Q1) collection 6 from 2000 to 2007 and from 2010 to 2015 (downloaded from https://lpdaac.usgs.gov/, last access: 20 July 2019) was used to fill the gap years (2000–2006 and 2011–2014) of PALSAR and PALSAR-2 datasets using change-detection algorithms. The MOD13Q1 product has a spatial resolution of 250 m and is composited every 16 d. In total, six MODIS tiles with 23 scenes per year (181 and 138 scenes for the two study periods: 2000–2007 – P1 – and 2010–2015 – P2) were required to cover the study area (h27v08, h27v09, h28v08, h28v09, h29v08 and h29v09). All the MODIS images were projected from its original sinusoidal projection to a geographic grid with a WGS 1984 spheroid and resized to 100 m to match the resolution of the oil palm maps using the nearest-neighbour resampling approach. The pixel quality and reliability layers in the MOD13Q1 product were used to further exclude the poor-quality pixels. During the whole study period, 53.64 % of the observations are of high quality, while 46.36 % are interpolated using spline interpolation. For those pixels with less than 30 high-quality observations (4.79 % in P1 and 9.64 % in P2 of the total change area), we did not apply the BFAST algorithm. For the remaining area, 61.67 % (P1) and 58.24 % (P2) of pixels had 12 (∼50 % in 23) high-quality observations annually.
A change map for the microwave data gap period between PALSAR and PALSAR-2 (2011–2014) was extracted using the change pixels in 2010 and 2015 oil palm maps with spatial locations and “from–to” types. Here, we assumed that the change from classification was reliable because of the high resolution of PALSAR data. We then sought the exact change year within the intervals in the next step (Sect. 2.4.2) using temporal NDVI files extracted from each change pixel. Frequent changes such as two or three shifts during the gap years were assumed to be of low probability and thus not considered in this study. For the period during 2001–2006 without PALSAR and PALSAR-2 data and oil palm distribution in 2000, we assumed a unidirectional expansion of oil palm, and the oil palm extent in 2007 was used as the potential change regions in the next step. In total, we derived two versions of change maps (one with bi-directional change and the other with only unidirectional oil palm expansion) for the two periods.
2.4.2 Break point test using change-detection algorithm, BFAST
Change-detection analysis was conducted in the change pixels derived from the last step to identify the exact change time within the two periods (2011–2014 and 2001–2006) based on the time series MODIS NDVI from 2010 to 2015 and 2000 to 2007, respectively. Here we aimed to capture abrupt NDVI changes (break points) in the two given periods, which are assumed to be caused by the conversion of the original land cover type to the oil palm cultivation. Many change-detection algorithms and their derivatives have been developed in recent years to detect subtle or abrupt changes in dense time-series satellite profiles (Broich et al., 2011; Kennedy et al., 2010; Verbesselt et al., 2010b). Most of these algorithms were applied in forest change monitoring, and all reach high consistency in detecting significant change (Cohen et al., 2017). A recent algorithm, the Bayesian estimator of abrupt change, seasonal change and trend (BEAST), aggregating the competing models and then the conventional single best model, performed well in capturing multiple and subtle phenological changes (Y. Zhao et al., 2019b). Here we used BFAST to capture the oil palm conversion time within the two study periods (2011–2014 and 2001–2006).
BFAST has been successfully applied in monitoring forest disturbance and regrowth and has proved robust with different sensors (DeVries et al., 2015; Verbesselt et al., 2012). Based on the structural change methods, the BFAST algorithm is able to find the structural break point between different segments in the observation time series (DeVries et al., 2015) and thus can be used to detect the time and number of abrupt or gradual changes as well as to characterize the magnitude and direction. The BFAST method decomposes the time series into trend, seasonality and residual sections (Verbesselt et al., 2010b). The model can be expressed as
where Yt is the observed value at time t, Tt is the trend section, St is the seasonal section and et is the noise section.
An ordinary least-square-residual-based moving-sum test (OLS-MOSUM; Zeileis, 2005) was used to test whether break points occurred in the trend or seasonal components. Then, the test was conducted to determine the number and optimal position of the breaks using the Bayesian information criterion (BIC) and the minimum of the residual sum of squares. The trend and seasonal coefficients were then computed using robust regression. A harmonic seasonality model (with three harmonic terms) was used to describe the seasonality of the satellite data (Eq. 6; Verbesselt et al., 2010b). For each piecewise linear model (Tt) from to , where is the assumed break points which define the p+1 segment, Tt can be expressed as follows:
where i is the index of the breaks, and . αi and βi are the intercept and slope of the fitted piecewise linear model.
For the seasonal break points, St is the harmonic model for to :
where . k is the number of harmonic terms in the periodic model (default value of 3), αj,k is the amplitude, f is the frequency and δj,k is the time phase. For the MODIS NDVI used in this study, the f value was 23 (i.e. 23 observations of MODIS observations per year; Verbesselt et al., 2010b). Here, the maximum number of breaks was artificially set to 1 because of the assumption of one time change for each period based on prior knowledge from the oil palm maps. Figure 2a shows two examples of the break point detection of the MODIS NDVI using the BFAST algorithm. In the first example, no obvious break is detected in the low-resolution time series, whereas significant change was captured in the trend section after time-series decomposition in the second example (Fig. 2b). More details of the BFAST algorithm are referenced in Verbesselt et al. (2010b, 2012). To evaluate the validity of using coarse MODIS time series in oil palm change detection, we visually interpreted an extra 100 change points based on the PALSAR images from 2007 to 2010 and applied the BFAST algorithms using the MODIS NDVI. An example of the comparison between the BFAST-based change results and visual interpretation from PALSAR images was shown in Fig. S4. The break time detected from MODIS NDVI showed the similar conversion year compared with the microwave satellite images (a total of 86 % agreement with 62 % matched the same change year and 24 % within a 1-year interval). Moreover, we did a test using the subsequent NDVI fragments to replace the original NDVI fragments after the detected break time and compared the break results to show the robustness of the algorithm considering the effect of the oil palm plantation standing age (Fig. S5).
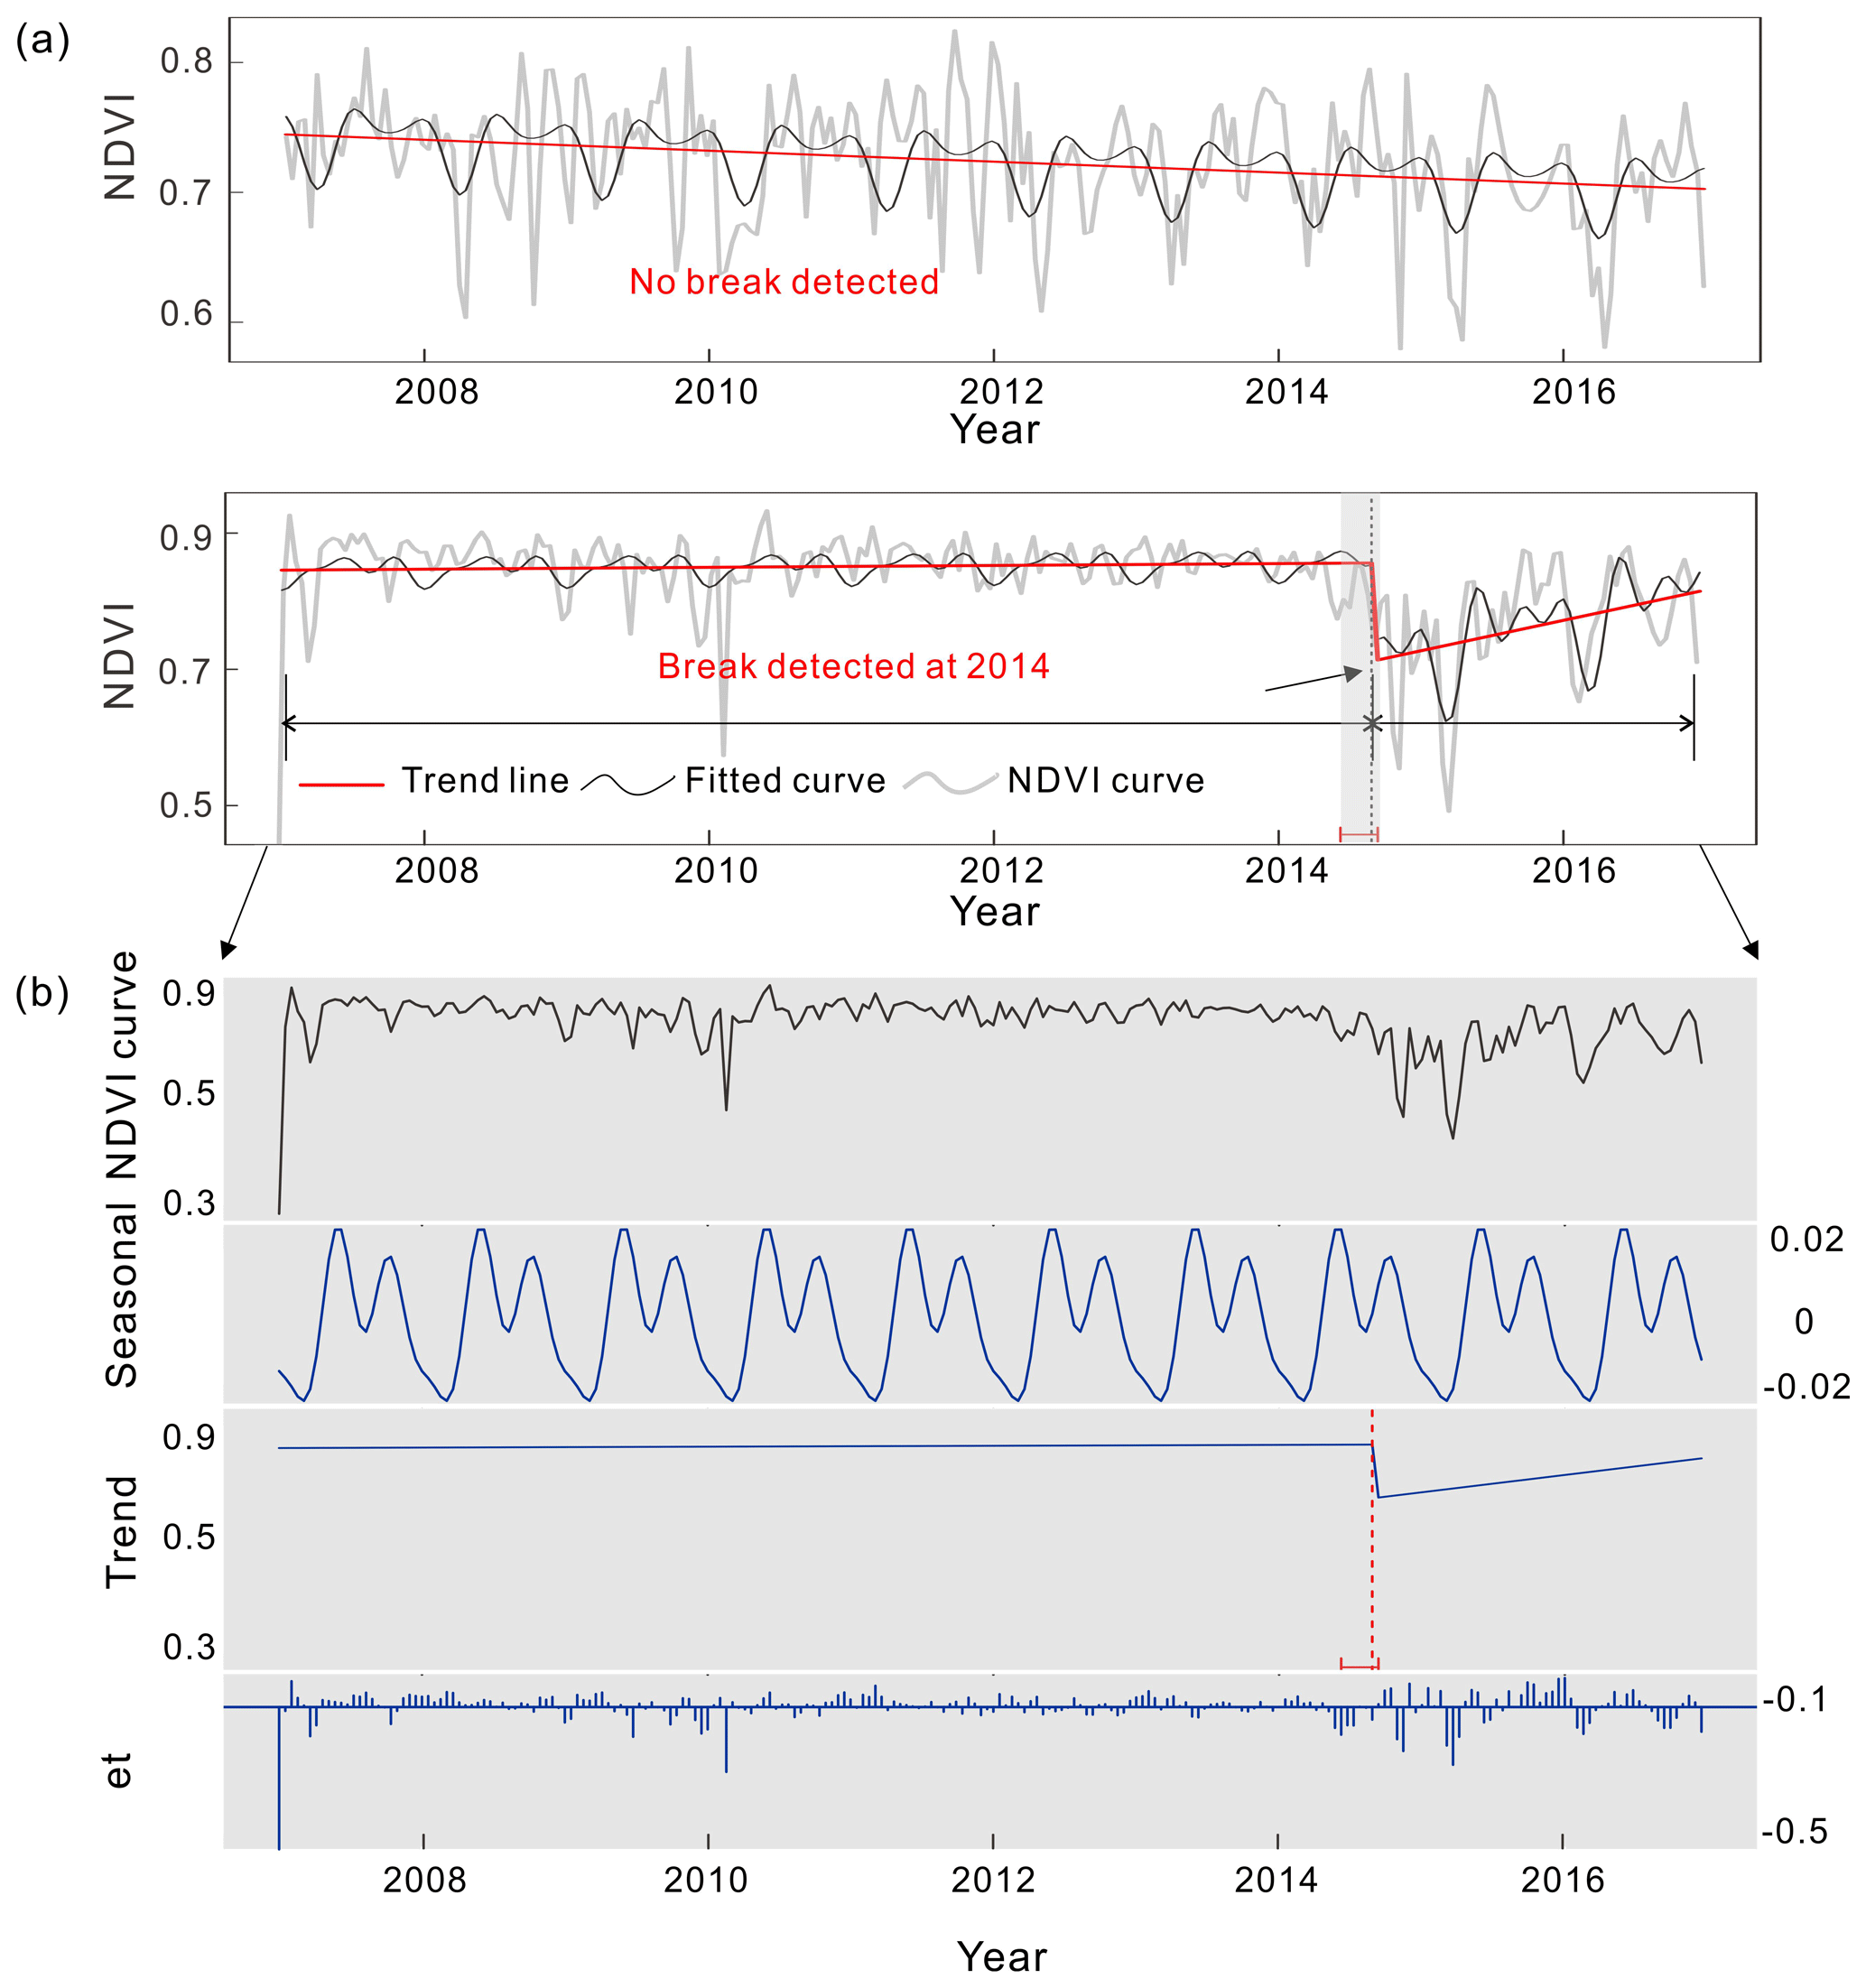
Figure 2Examples of the break point detection in the MODIS time series using the BFAST algorithm. (a) The two cases present when the algorithm is able to detect the break in the NDVI time series. The NDVI curve is the original 16 d composite MODIS NDVI time series. The fitted curve is the pre-processed NDVI after cloud masking and spline interpolation. Trend line shows the fitted trend for each segment after seasonal-trend decomposition using BFAST. (b) The seasonal-trend decomposition of the 16 d NDVI time series using BFAST for the second example. The algorithm decomposes the time series into three components: trend, seasonality and residuals (et).
2.4.3 Updating annual oil palm results
The previous steps generated annual oil palm maps for 6 years (Sect. 2.3) and the oil palm change time in the missing periods (2011–2014 and 2001–2016; Sect. 2.4.1 and 2.4.2). In the final step, all these data were combined to update the continuous oil palm dataset from 2001 to 2016 following Xu et al. (2020). For the gap period from 2011 to 2014, the oil palm updating was based on the from–to land cover types (L1 and L2) of the start (t1) and the end years (t2) with the detected change time (ti). Then L2 was allocated between ti and t2, while L1 was assigned before ti (t1 to ti). For example, if a pixel were forest in 2010 and oil palm in 2015 with a change year of 2013, then the land cover type would be forest during 2010–2013 and oil palm during 2014–2015, following the updating process. The rest of the area without oil palm changes remained unchanged from 2010 to 2015 (assigned L1). For the gap period during 2001–2006, the oil palm map in 2007 from PALSAR data was used as the potential change area (as mentioned in Sect. 2.4.2) without from–to types. Thus the land cover type between 2001 and change time (ti) was classified as non-oil palm, and oil palm was assigned to the period after ti (ti to t2). Thereafter, the oil palm maps between 2001 to 2016 were updated. Quality maps (Figs. S6 and S7) were also generated to indicate the availability of valid NDVI values (i.e. not under cloud cover), the spatial resolution of the dataset used and the consistency of change time detection from different break point test approaches in BFAST algorithms (the OLS-MOSUM), the supremum of a set of Lagrange multiplier statistics (SupLM) and BIC test (Zeileis, 2005). The annual oil palm updating process was applied in both the bi-directional and unidirectional versions, and two versions of the oil palm datasets (AOPD-bi and AOPD-uni) were developed.
2.5 Evaluation
Our product of annual oil palm maps, AOPD, was evaluated for three aspects: (1) the independent annual oil palm sample set for Malaysia (2007, 2008, 2009, 2010, 2015 and 2016) and Indonesia (2010–2016) to evaluate the annual mapping results for the classified maps using PALSAR and PALSAR-2 data and gap years using the change-detection method, (2) a change sample set aimed at assessing the accuracy of detected change years, and (3) comparison with statistical inventories (e.g. FAO, USDA, Malaysian Palm Oil Board – MPOB – 2011–2016, Badan Pusat Statistik – BPS-Statistics Indonesia – 2011–2015, the existing oil palm maps from Gaveau et al., 2016, and the Landsat-based deforestation maps – Hansen et al., 2013). FAO and USDA agricultural statistical data provided the harvested area of oil palm using data collected by official and unofficial outlets. MPOB is a government agency providing oil palm plantation area in Malaysia based on the data reported by state agencies, institutions, private estates and independent smallholders. BPS-Statistics Indonesia, a non-ministry government agency, provided statistical data for the public including oil palm plantation area compiled from the quarterly (SKB17-Oil Palm) and annual (SKB17-Annual) plantation estate survey, custom documents from the Directorate General of Customs, and secondary data from the Directorate General of Estate Crops.
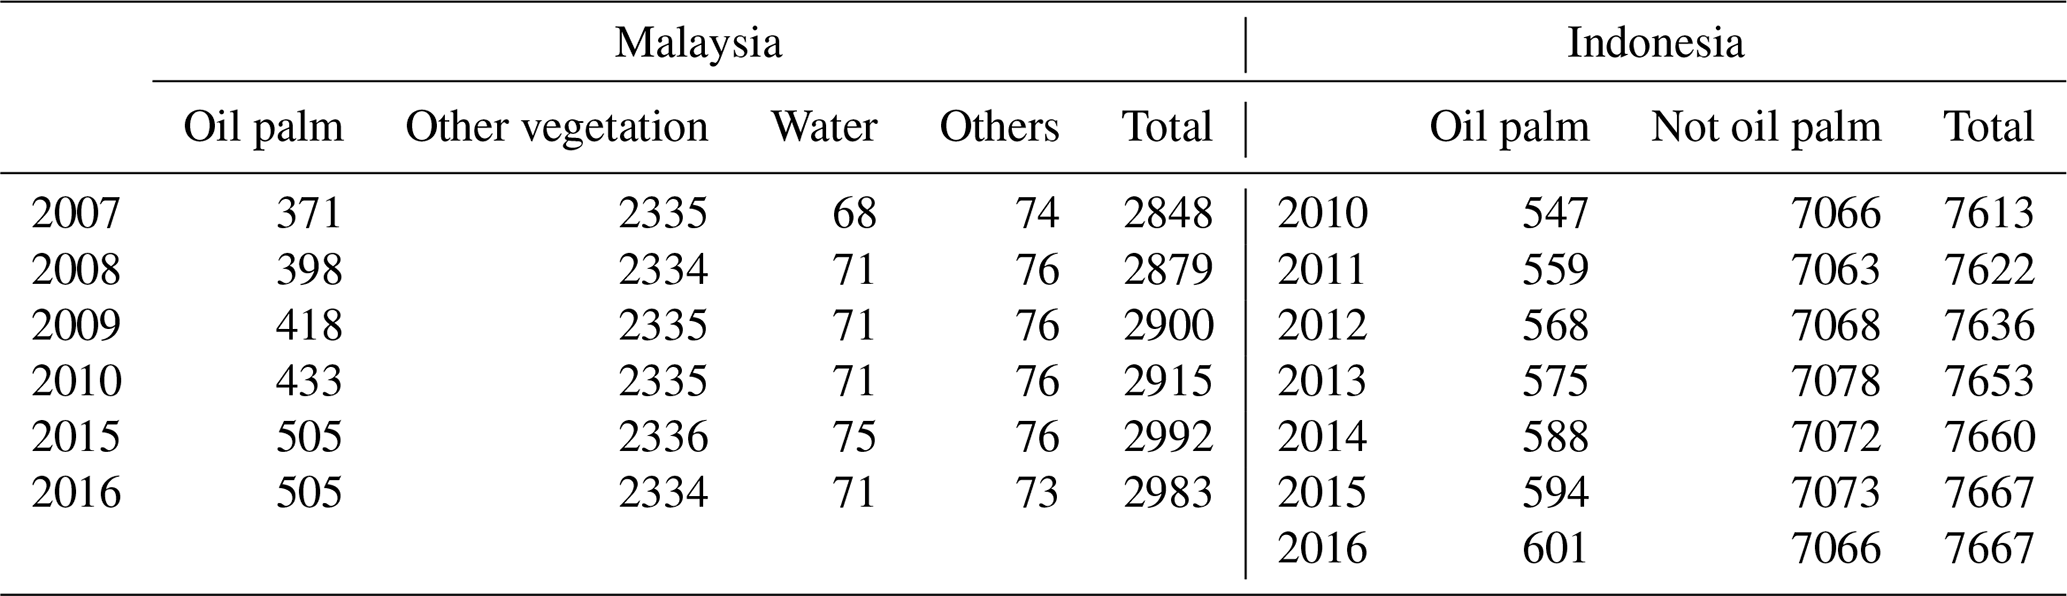
Two sets of annual oil palm samples set were used to validate the mapping results in Malaysia and Indonesia according to the sampling protocol of Gong et al. (2013). The independent annual sample set in Malaysia was from the previous studies (Cheng et al., 2019, 2017). All pixel-based samples were randomly produced in an equal-area hexagonal grid (95.98 km2 for each grid cell); therefore the distribution of the samples among different land cover types has minimal bias with the real land cover composition. All the testing samples were manually checked using high-quality Google Earth (<1 m) images in the first round and then double-checked by the time-series PALSAR images (25 m), since it is easy to identify the crown of palm trees in the high-resolution datasets and recognize the regular oil palm plantations in the microwave satellite datasets. Once the start and the end of the period of oil palm are determined from Google Earth images or PALSAR data, the middle years can be checked by the stable spectral- and backscatter-coefficient information in the continuous PALSAR images. The annual sample set contains ∼3000 samples with four land cover types (∼16 % were oil palm samples), and it covers the whole country of Malaysia (see the green points in Fig. 3; only oil palm samples presented). The second annual Indonesian sample set was developed following the protocol of Cheng et al. (2017). This sample set contains 7663 samples in total (601 were oil palms, and the rest were non-oil palm types) during 2010 to 2016 (see the blue points in Fig. 3). The details of the number and spatial distribution of validation samples are presented in Fig. 3 and Table 2. More information on the randomized sampling method can be found in Cheng et al. (2019, 2017).
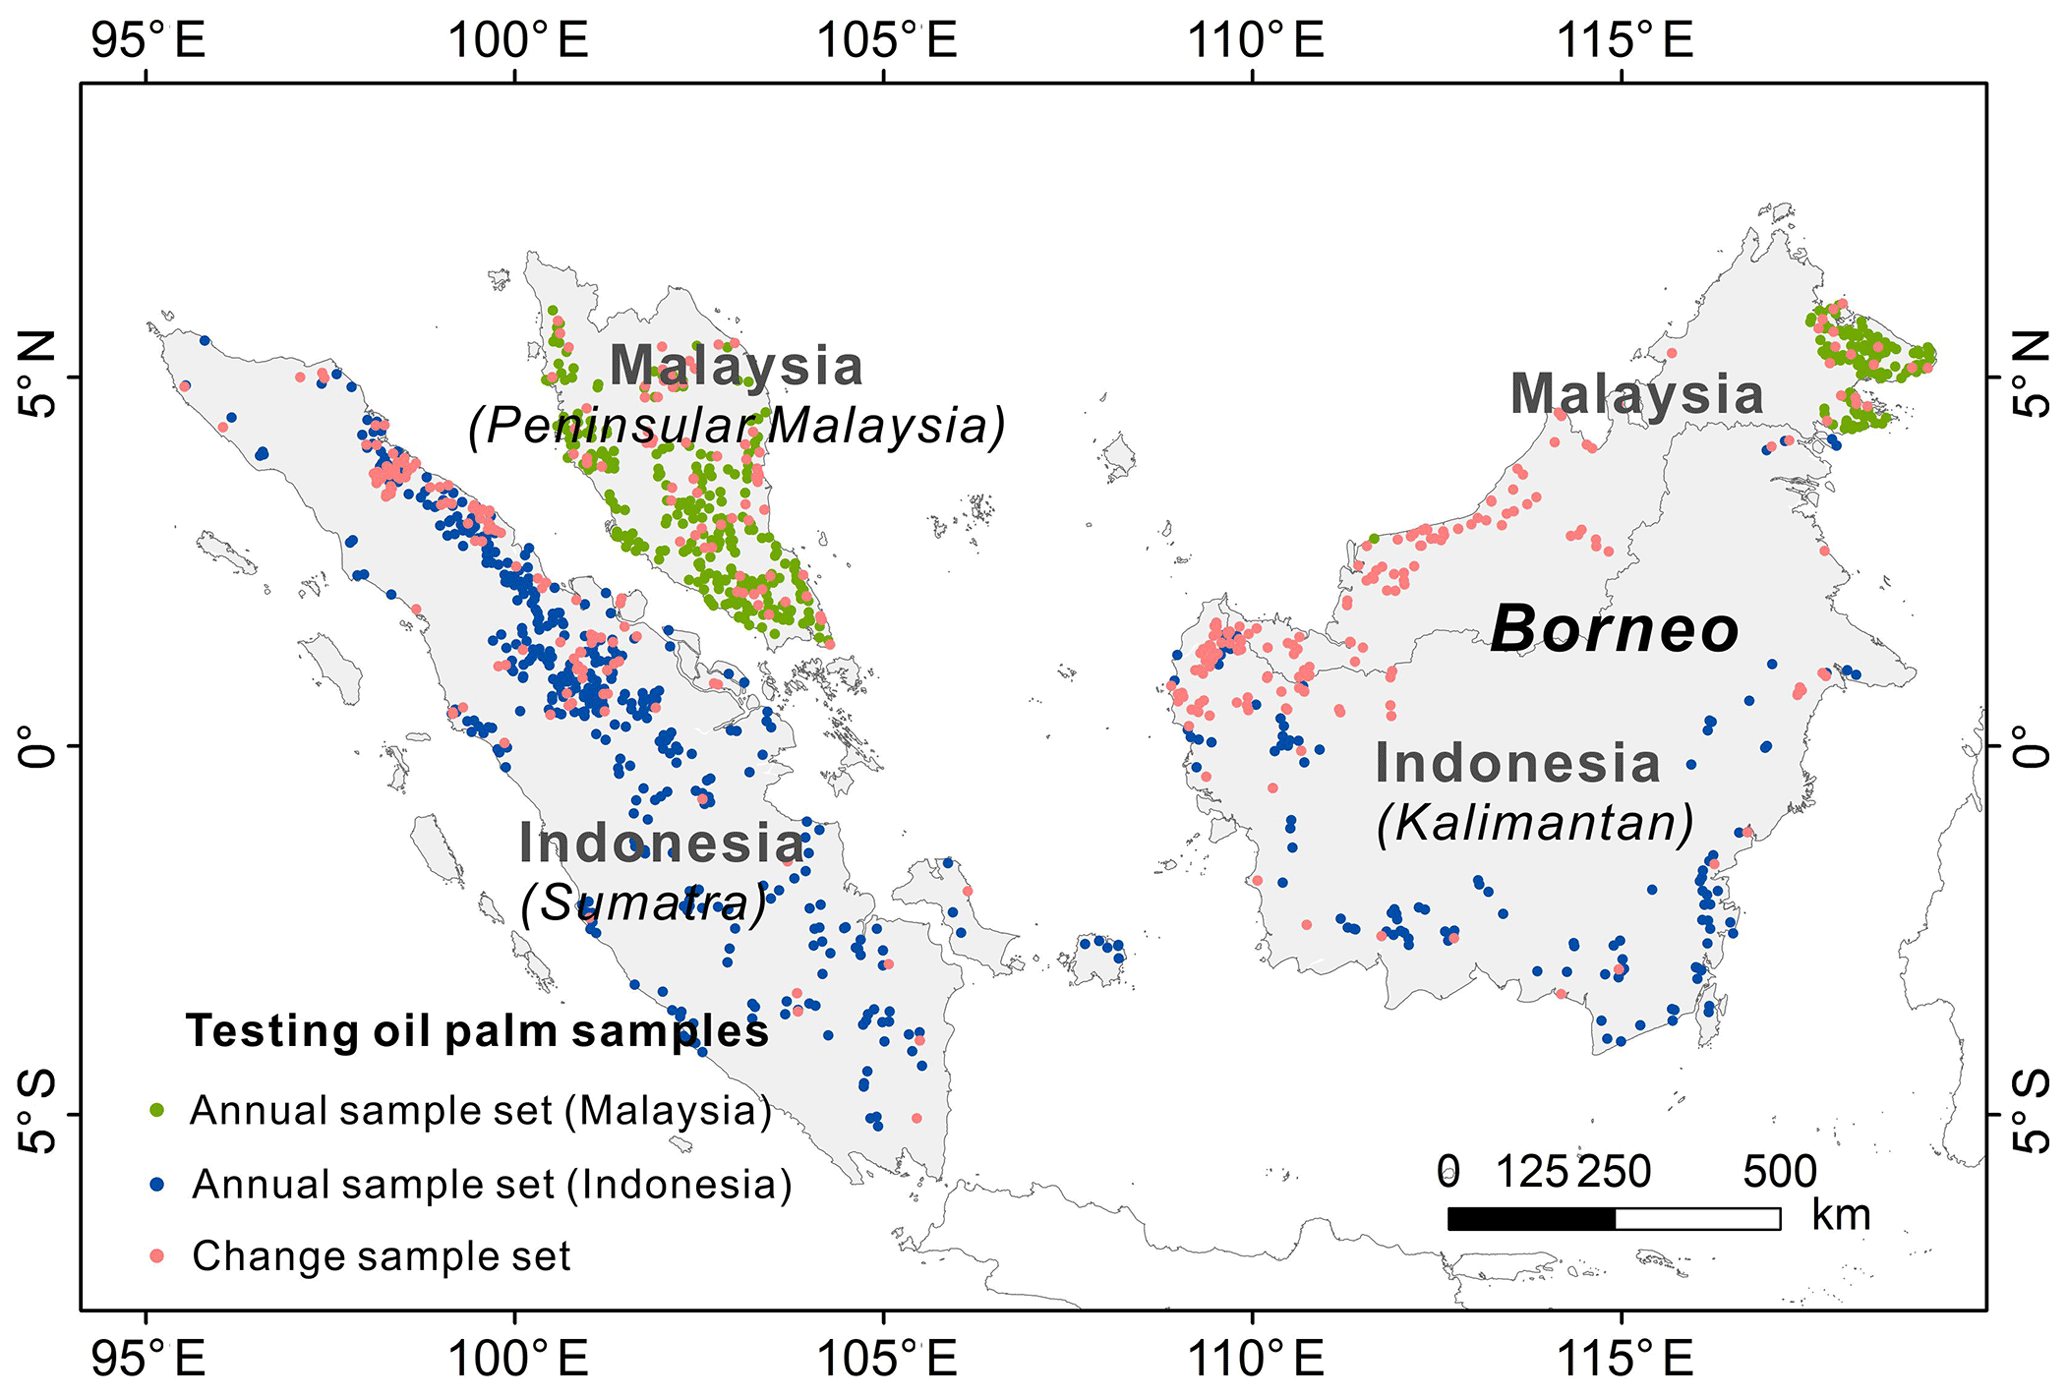
Figure 3Spatial distribution of oil palm samples in the two validation datasets. The annual sample set contains 2986 (in 2016) samples in Malaysia, which were interpreted for 2007, 2008, 2009, 2010, 2015 and 2016, and 7667 (in 2016) samples in Indonesia, interpreted from 2010 to 2016. These samples were used to validate the annual maps developed from PALSAR and PALSAR-2 data. Of the annual sample set in Malaysia, oil palm samples consist of 16.92 % (505), while the forest, water and others consist of 78.16 %, 2.48 % and 2.44 %, respectively. The Indonesian annual sample set contains 601 (7.84 %) oil palm samples, and the rest (92.16 %) were other types. The change sample set includes 370 oil palm samples which were converted in the interpolated period (2001–2006 and 2011–2014). This sample set, with change year labelled, is used to assess the change detection result in the gap years.
Table 2The distribution of annual validation sample set for Malaysia and Indonesia (unit: pixel).
The change sample set was developed to evaluate the detected change year by the break point detection analysis. Time lapses of high-resolution imagery from Google Earth covering the change period were used to check the change time detected by the BFAST algorithm. We randomly selected 5000 points (implemented with ArcGIS 10.3 software) in the change area, but there were only limited samples (370, 25.07 % of the total 1476 oil palm samples) with continuous high-resolution images from Google Earth and cloud-free Landsat time series. We compared our detected change years with the actual oil palm conversion time for these test samples. A confidence interval of ±1 years was used considering uncertainty in visual interpretation of the change time (Dara et al., 2018). Detailed distribution of the testing samples can be seen in Fig. 3.
3.1 Spatial and temporal characteristics of oil palm expansion
The annual changes of oil palm plantations from 2001 to 2016 are shown in Fig. 4. The spatial and temporal dynamics of oil palm changes vary in Malaysia and Indonesia. In the study area, most oil palm plantations are located in lowland areas (elevation <250 m, slope <2.5∘), and a few are distributed in gently undulating hills (elevation >500 m, slope >5∘; Fig. S8). The newly developed oil palm has similar elevation and slope distribution to that in 2007 (slope: 1.97∘ in 2007 and 1.99∘ in 2016; elevation: 228.98 m in 2007 and 230.10 m in 2016). Specifically, the oil palm plantations are mostly found in the southwestern coastal regions in peninsular Malaysia, northeast of Sumatra and coastal regions in Borneo (Fig. 4a).
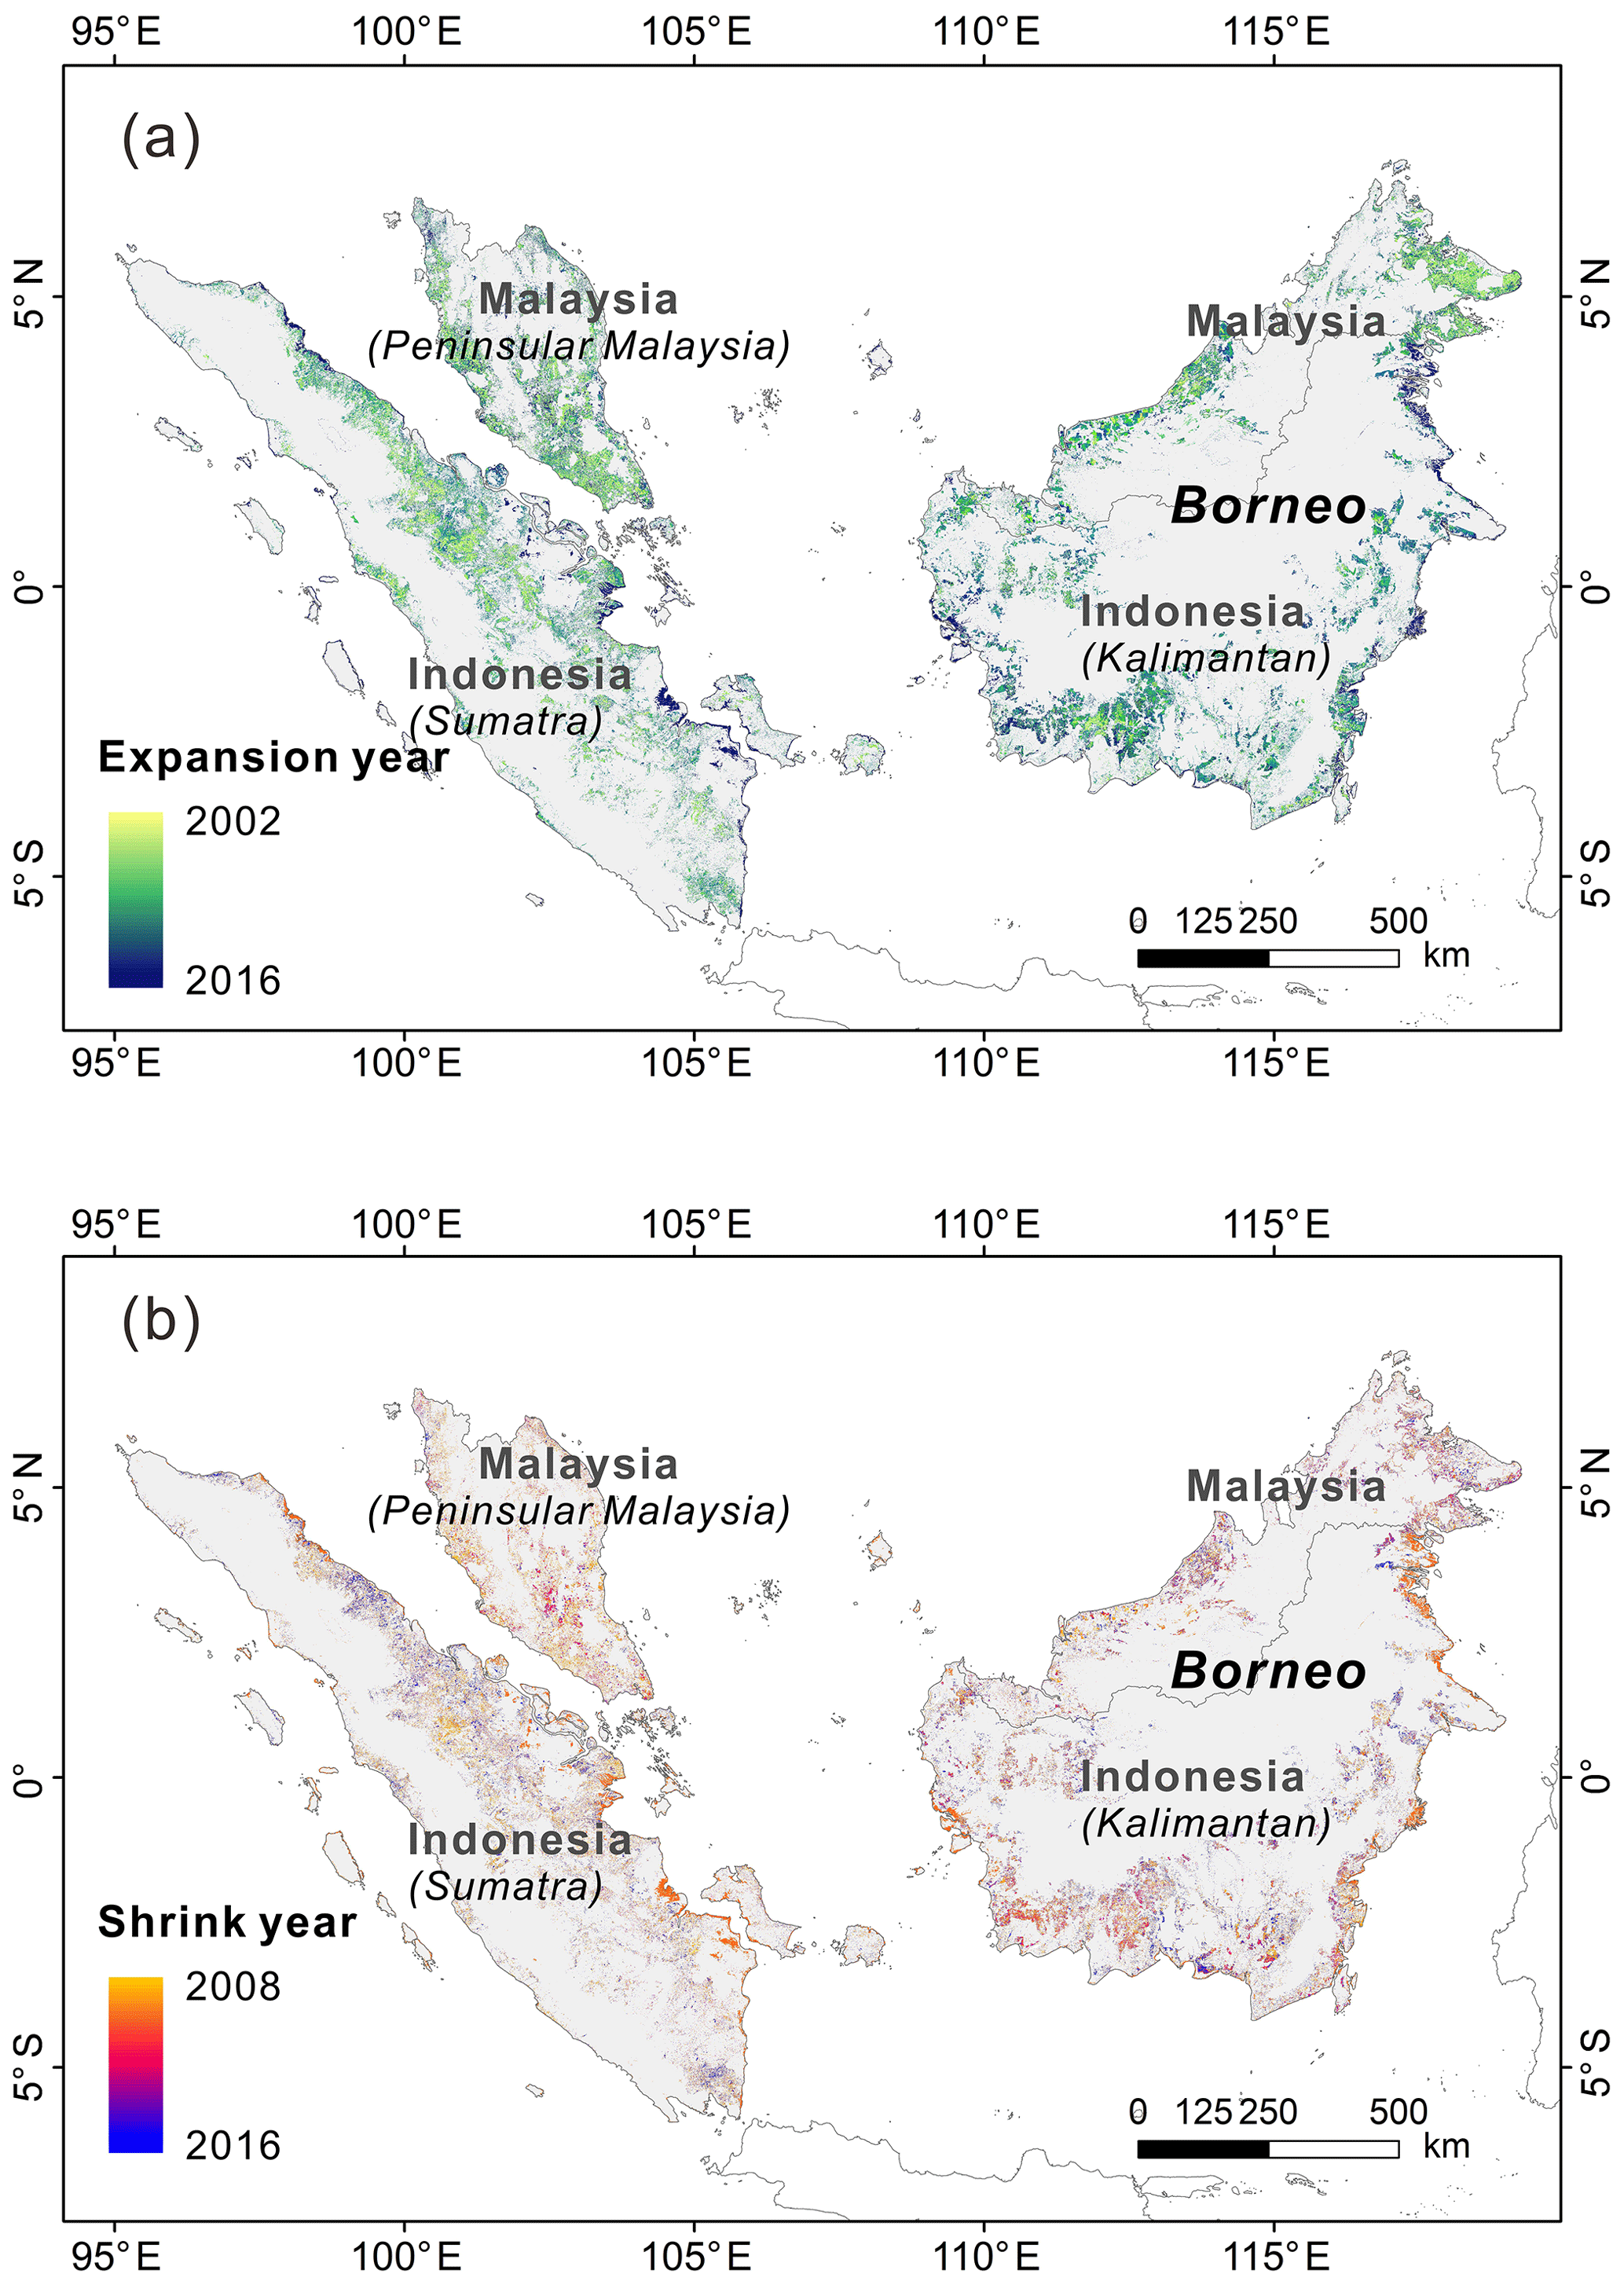
Figure 4Year of oil palm change at 100 m resolution in the study area from 2002 to 2016. (a) Expansion (2002–2016) and (b) shrinkage (2008–2016). During 2011–2014, the from–to types of the change pixels were pre-defined in the 2010 and 2015 land cover maps derived from PALSAR and PALSAR-2 data, respectively. Therefore, both the expansion and shrinkage year of oil palm were available in this period using the change-detection method. During 2001–2006, the oil palm distribution of the start year is unknown. Here we assumed one-way expansion of oil palm before 2007 and adopted the change-detection algorithms in the 2007 oil palm extent. Thus, the expansion year was traced back to 2002. The grey background refers to the study area.
Light colours in Fig. 4 indicate the oil palm changes (expansion and shrink) in early years, while the dark colours are the changes in more recent years. Oil palm plantations expanded rapidly during the study period in peninsular Malaysia and Sumatra and Borneo. In Indonesia, rapid expansion first occurred in Sumatra and was then surpassed by Kalimantan (Gunarso et al., 2013; Petrenko et al., 2016). This can also be observed in our maps, where more changes happened in earlier years in Sumatra (lighter colours in Fig. 4) and later in Kalimantan (darker colours). The decrease in oil palm plantations was also detected (Fig. 4b), although it is difficult to separate the oil palm replantation after one rotation (i.e. still oil palm in land use) from the permanent oil palm loss (i.e. change to other land-use types). Compared to the period before 2007 using change detection in NDVI data, our data product in the gap period of 2011–2014 would be of higher quality, since the net changes were constrained by the oil palm maps in 2010 and 2015 derived from PALSAR and PALSAR-2 data, respectively.
Figure 5 displays the annual total area of oil palm in Malaysia and Indonesia from 2001 to 2016, with uncertainty ranges (shaded area with boundary lines) during 2001–2006 and 2011–2014. This uncertainty range is from the change-detection step; 9.45 % of the total changes from 2010 to 2015 were not captured in the MODIS NDVI using the BFAST algorithm because of the low resolution, cloud contamination, the mapping error from the base maps, etc. Assuming that these missing changes all happened from 2010 to 2011, the oil palm area of the gap years should follow the trajectory of the upper boundary line. If all the missing changes happened in the last year of the period, the oil palm area curve would be the lower boundary line. Since the distribution of oil palm in 2001 was unknown, large uncertainty may exist before 2007. Here, the uncertainty range during 2001–2006 was determined based on the data availability of MODIS NDVI and consistency of change time detection from the quality maps (Figs. S6 and S7). The oil palm area before 2007 follows the upper boundary curve if the same breaks were detected in all three structural change methods (OLS-MOSUM, SupLM, BIC) and there are more than 60 % valid NDVI values available in this time period. If all the breaks were counted regardless of the number of valid MODIS NDVI values and the consistency of change methods, the oil palm area would be the lower boundary line.
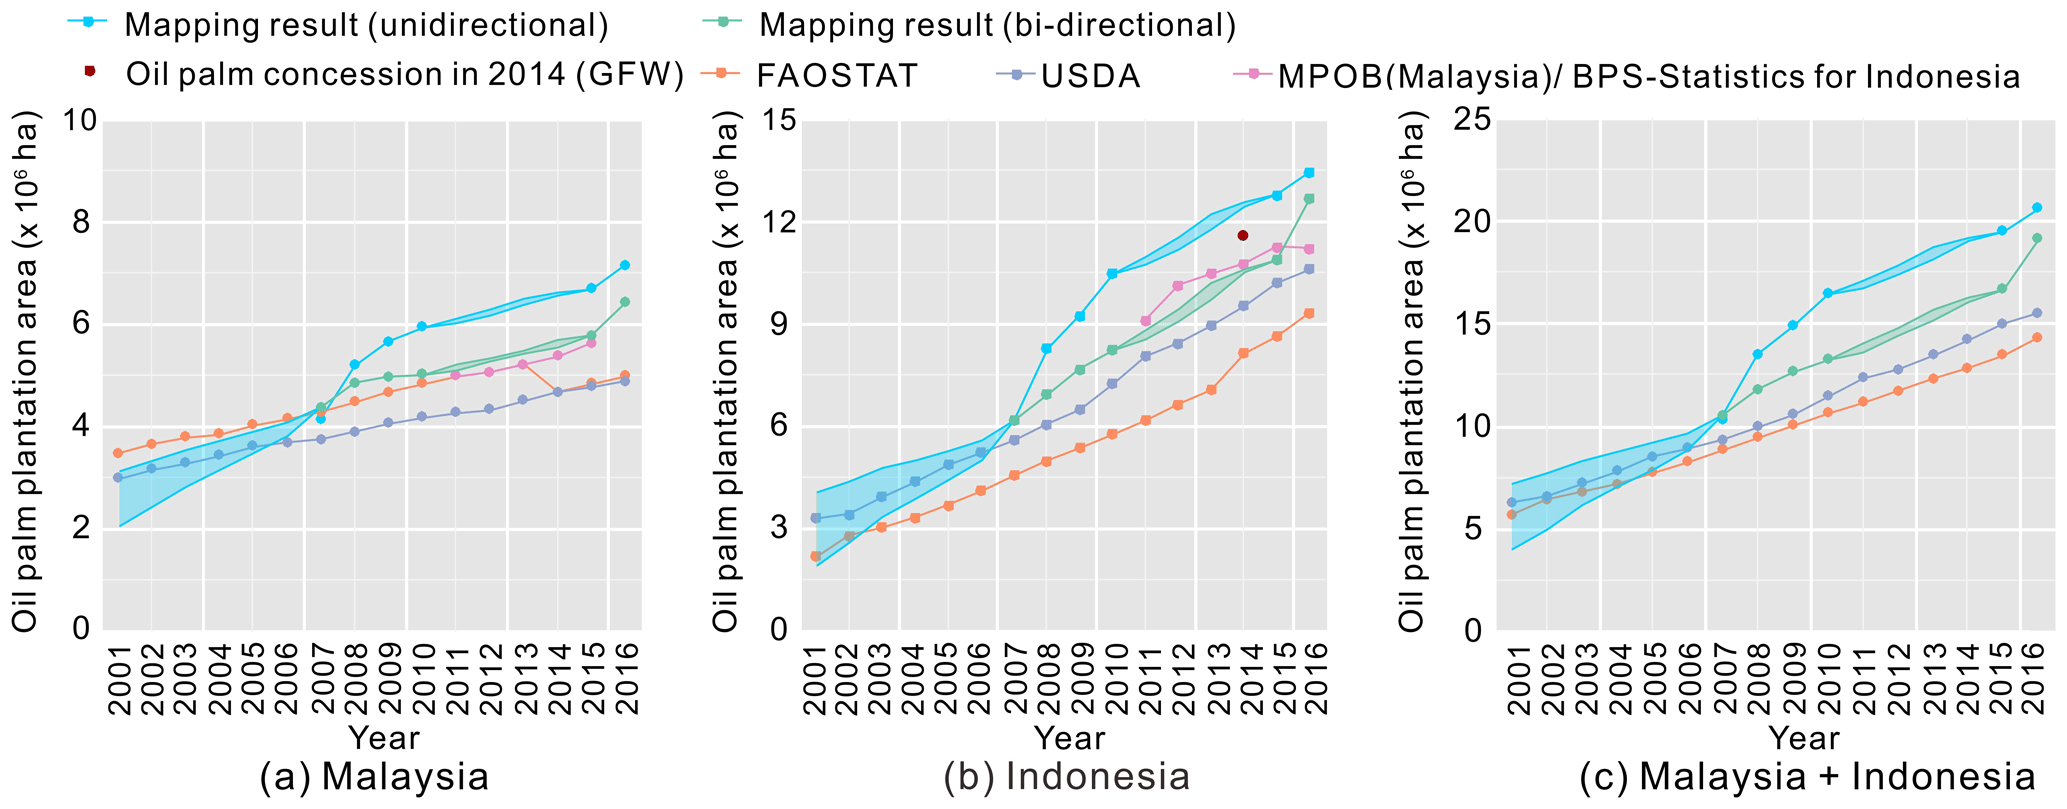
Figure 5Comparison of the annual oil palm plantation area among FAO and USDA statistics, MPOB records for Malaysia, BPS-Statistics and oil palm concessions from GFW for Indonesia and our mapping results in (a) Malaysia, (b) Indonesia, and (c) Malaysia and Indonesia from 2001 to 2016. The blue lines represent the gross gain (unidirectional expansion), while the green lines show the net changes of oil palm from 2007 to 2016. The shaded area within the two boundary lines is the uncertainty range of the oil palm area. The upper boundary lines represent the upper limit area of oil palm within the two periods (2011–2014 and 2001–2006), whereas the lower boundary lines are the lower limit according to our results. Note that during the gap between the two periods, no uncertainty could be derived, which does not mean that the uncertainty was small.
Generally, the net oil palm plantation area shows a monotonous increasing trend from 2001 to 2016 for Malaysia (Fig. 5a) and Indonesia (Fig. 5b) in both the bi-directional (green lines) and unidirectional (blue lines) versions. During the past 16 years, the net oil palm area across Malaysia increased from ∼2.59×10⁶ ha (2.05–3.13×10⁶ ha) to 6.39×10⁶ ha, which is a net increase of 146.60 % (103.99 %–211.71 %). Indonesia has a much higher increase in oil palm area, from ∼3.00×10⁶ ha (1.92–4.07×10⁶ ha) to 12.66×10⁶ ha (∼4 fold). Correspondingly, the increasing trend in oil palm plantations in Indonesia was greater than Malaysia (0.573–0.716×10⁶ ha yr−1 compared to 0.217–0.289×10⁶ ha yr−1 according to our mapping results), which illustrates the quick expansion of oil palm plantations in Indonesia in recent years. The unidirectional version has a higher increase in net area planted with oil palm in Malaysia and Indonesia (71.71 % and 117.64 %) from 2007 to 2016 than the bi-directional version (46.62 % and 105.37 %). This is because the unidirectional version is temporally filtered based on the assumption of one-way expansion of oil palm plantations, while the bi-directional version considered the conversion from oil palm to other land cover types (Sect. 2.3.3).
3.2 Accuracy assessment
The mapping performance of AOPD was evaluated first using an independent annual oil palm sample set for 2007, 2008, 2009, 2010, 2015 and 2016. The mapping accuracy from the previously developed datasets over Malaysia (Cheng et al., 2019) was also compared. The results of the annual accuracy (F score) with producer accuracy (PA) and user accuracy (UA) are shown in Tables 3 and 4. PA shows how correctly the reference samples are classified and indicated the omission error (1-PA), while UA represents the percentage of the classes that have been correctly classified and is linked with commission error (1-UA). The average annual accuracy for oil palm areas in Malaysia reached 86.22 %, which is 8.27 % higher than the annual maps from the previous study (Cheng et al., 2019). The improvement of the oil palm mapping performance is mainly due to the different post-processing (one-way expansion and bi-directional oil palm change strategies) and the introduction of the ancillary data (IFL and GMA). Meanwhile, there is no significant difference in the oil palm mapping accuracy among the 6 years in Malaysia (all above 85 % with less than 2 % difference; Table 3), indicating the stability and robustness of AOPD. The evaluation using the second annual oil palm sample set in Indonesia shows the average mapping accuracy of 74.20 % and the F score of 0.74 during 2010–2016. The oil palm mapping accuracy was relatively stable during the gap years and the classified years (higher than 72 % with 3 % fluctuation; Table 4).
Table 3The comparison of the oil palm accuracy between our mapping results and Cheng et al. (2019) for the 6 mapping years in Malaysia. UA: user's accuracy. PA: producer's accuracy.
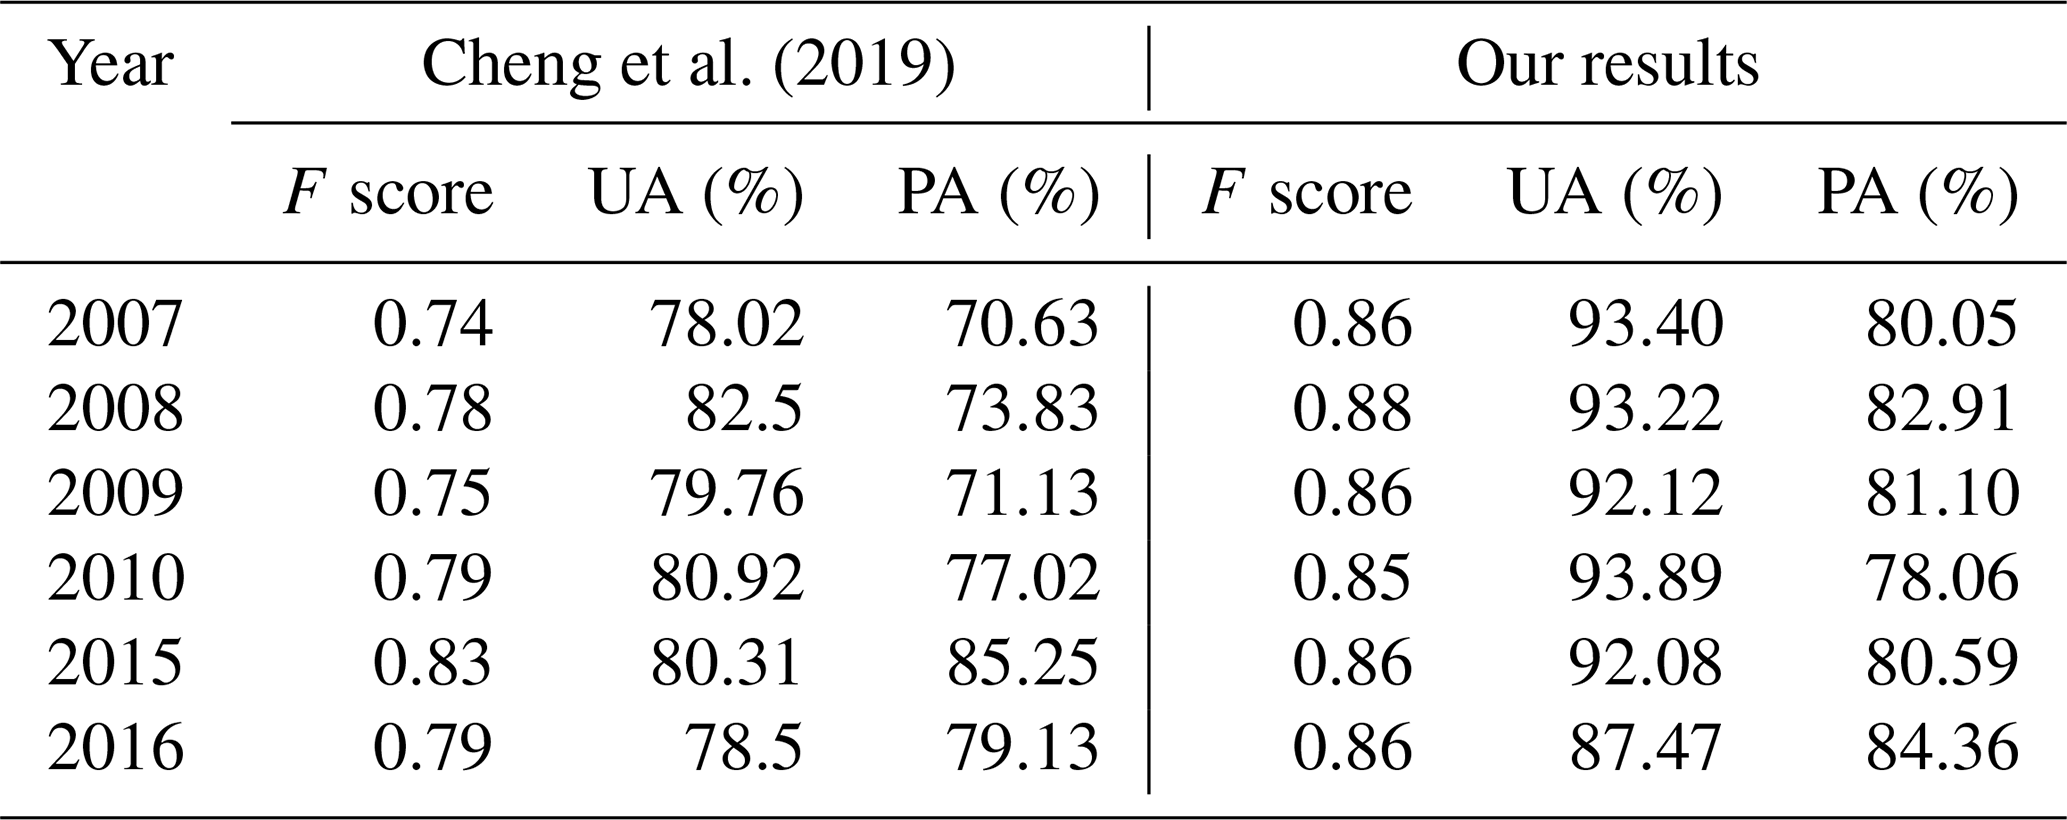
Table 4The oil palm accuracy in Indonesia from 2010–2016. UA: user's accuracy. PA: producer's accuracy.
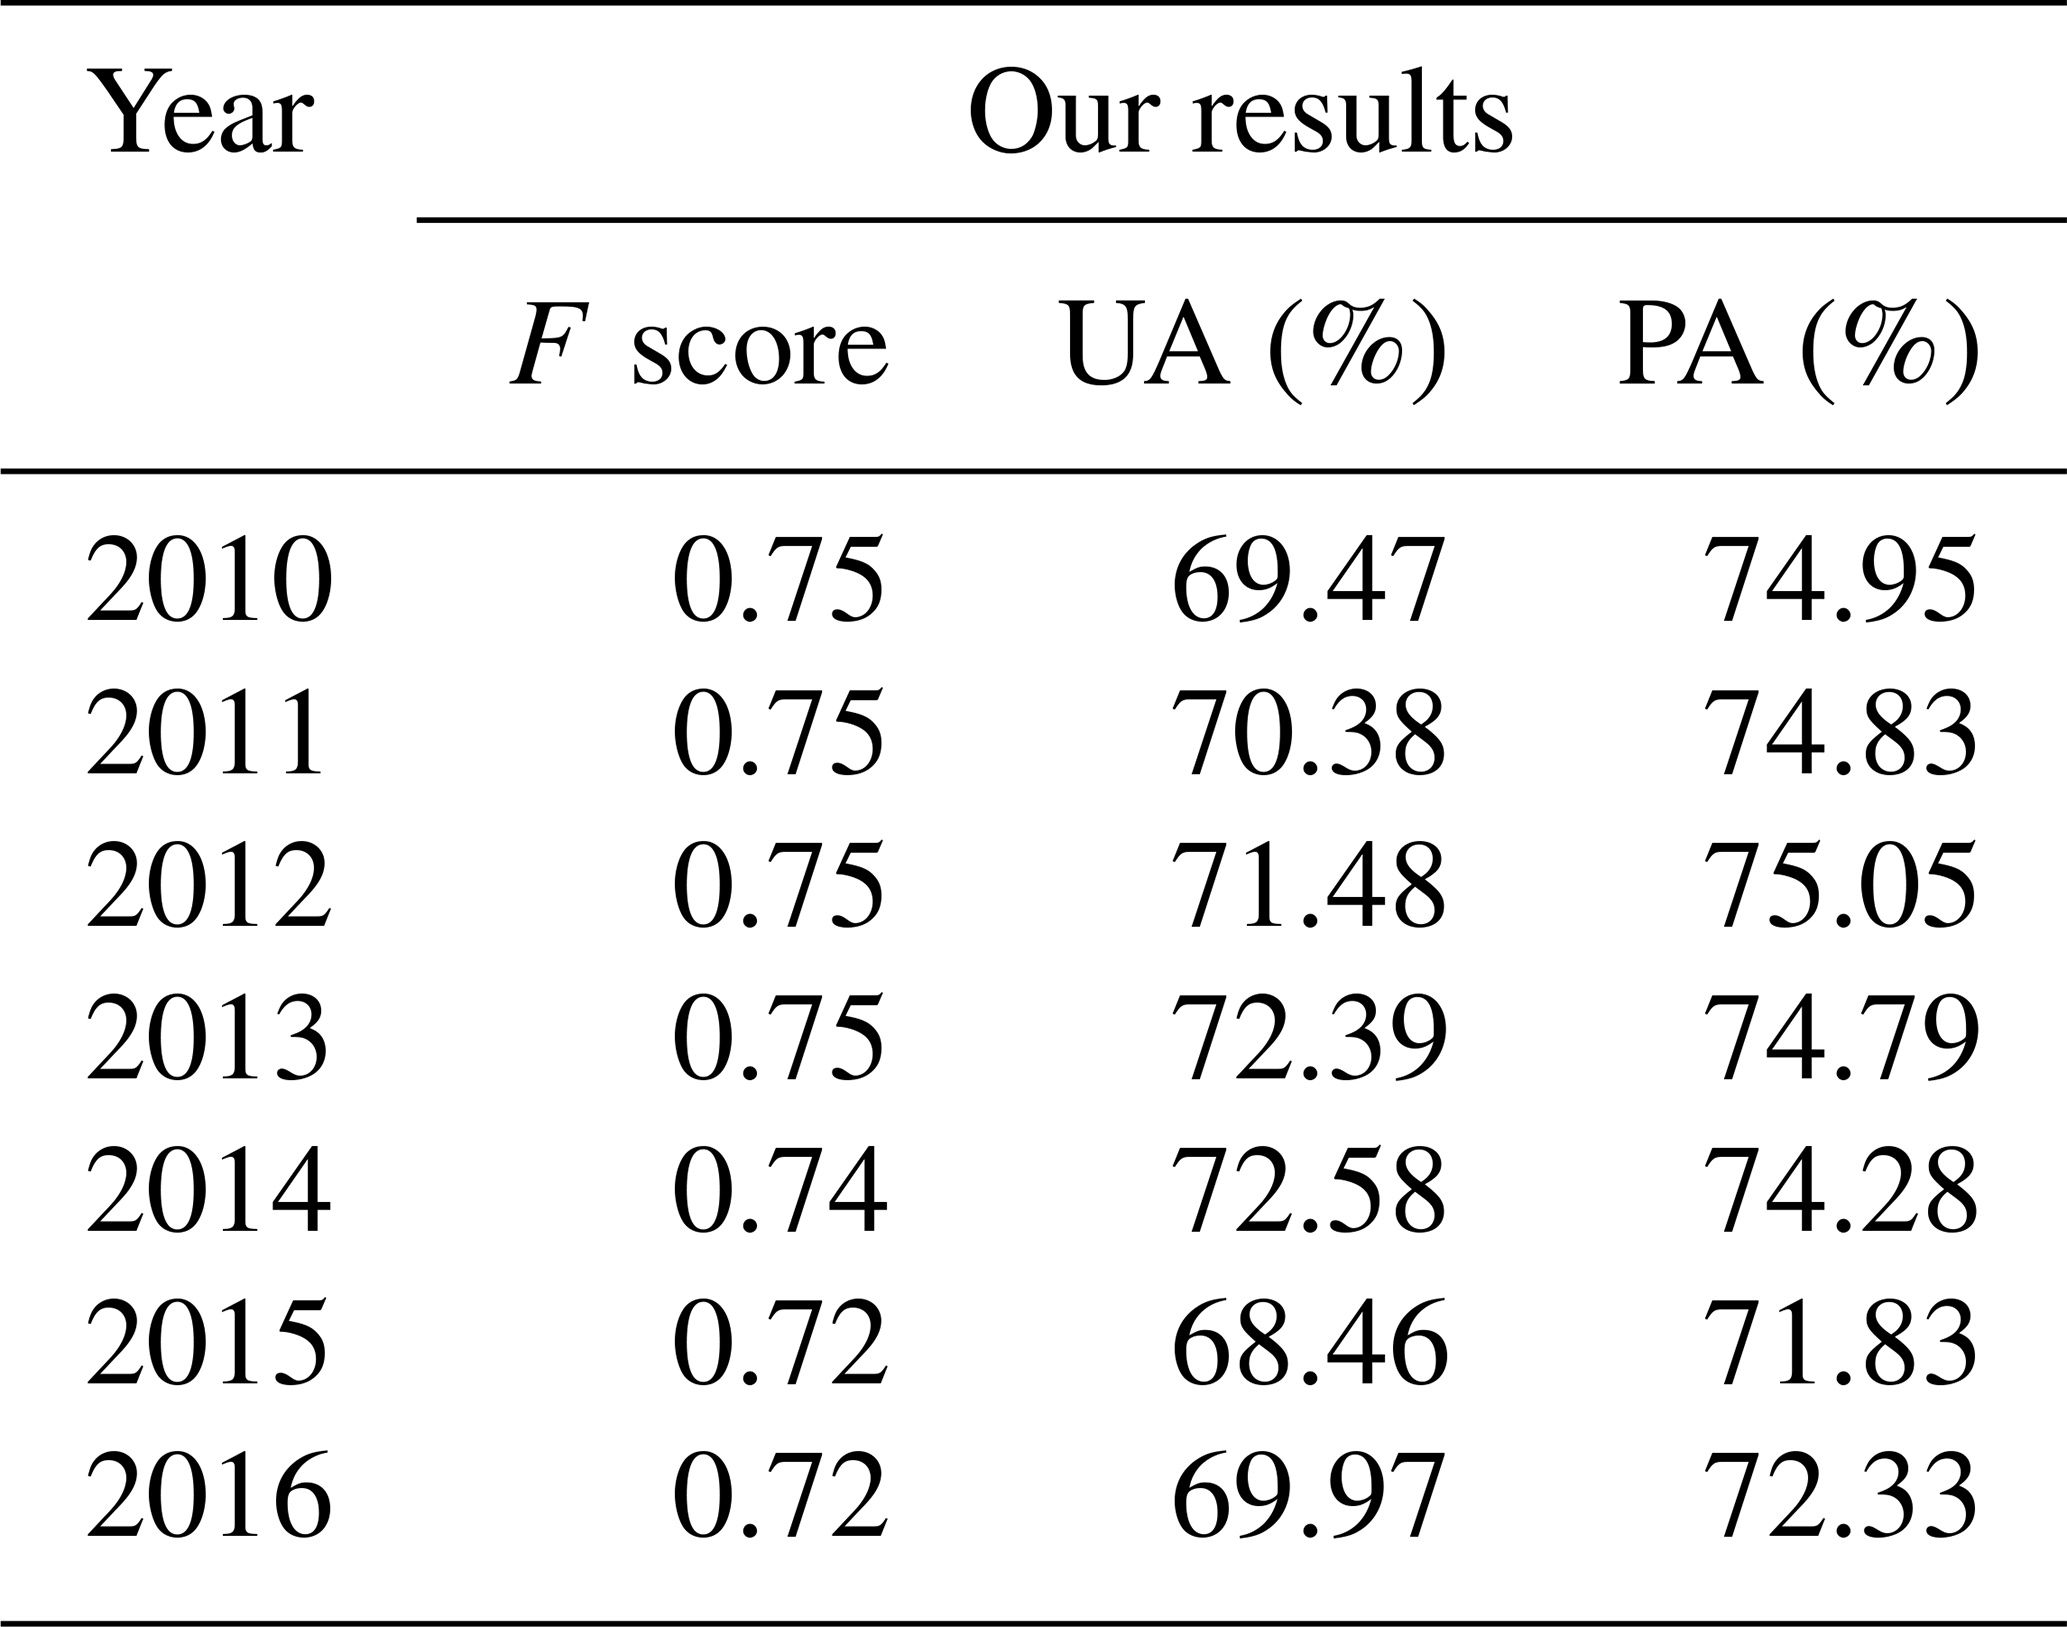
Figure 6 shows the direct comparison of the change maps with the images from Google Earth and Landsat, which document the change process. We use time lapse of images when the annual high-resolution images from Google Earth were not available. Here time lapse means the images obtained for intervals of >1 year. For example, there are no high-resolution images from Google Earth in 2011, so we used the 2010 images as a substitute in Fig. 6d, and the actual change time is limited within the period (2010–2013). The first three selected regions in Sarawak, Malaysia (Fig. 6a and b), and West Kalimantan, Indonesia (Fig. 6c), represent the typical process of oil palm change, i.e. the clearance of primary forest and the replantation of oil palm cultivations. Overall, most of the changes were captured within the range defined by time lapse of the Google Earth images (see the detected change years in the highlighted regions; red shapes). Different from the first three cases (Fig. 6a–c), Fig. 6d presents another type of oil change, from cropland to oil palm, in North Sumatra, Indonesia.
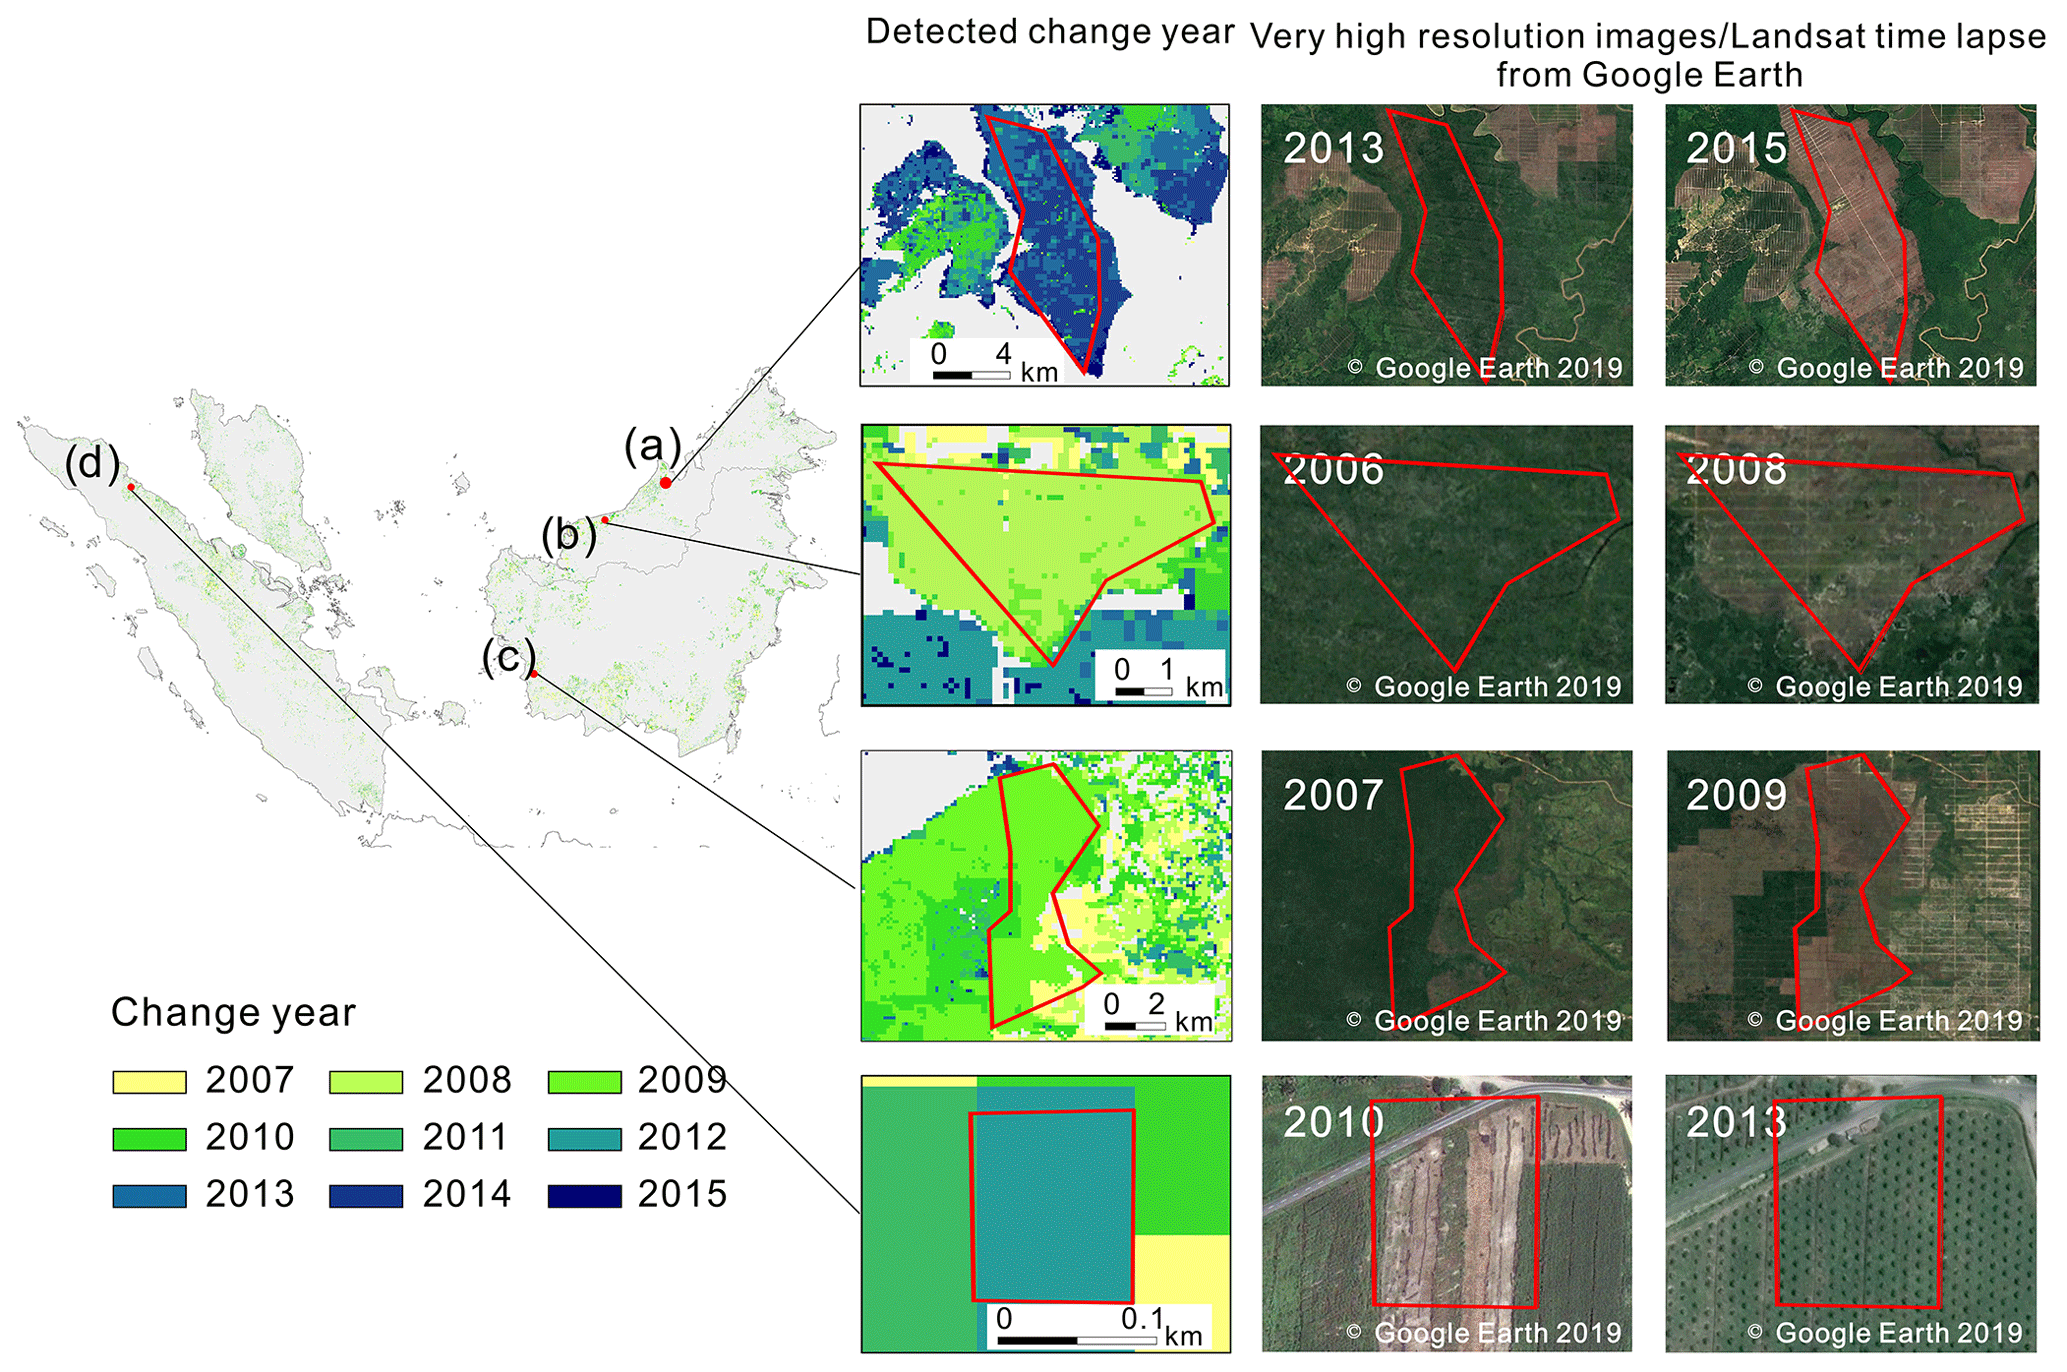
Figure 6Visual comparison of the detected change years with the high-resolution images and medium-resolution Landsat images from Google Earth. The colour of the first column represents the change-detected time in our results. The red shape highlights the change areas. Panels (a) and (b) are two selected regions located in Sarawak, Malaysia. The Landsat images in the right indicate that the deforestation and plantations of oil palm occurred between 2013 and 2015 and 2006 and 2008, respectively, and the change times (2014 and 2008) were captured in the result maps. Panel (c) is an example of change detected in 2009 in West Kalimantan, Indonesia, where forest type is presented in the Landsat images in 2007 and oil palm plantations shown in 2009; (d) is a case showing the conversion of cropland to oil palm in North Sumatra, Indonesia, according to the high-resolution images from Google Earth. The young oil palm trees in the 2013 image indicate that the conversion may have occurred 1 or 2 years before, which matched the results in our maps (detected change time in 2012).
Our detected change time is also consistent with the timing of change interpreted from Google Earth and Landsat images. The deviation of the detected change years – during 2001–2006 (grey) and 2011–2014 (blue) – from the validation samples (change sample set) is shown in Fig. 7. Limited change samples from 2001 to 2006 were collected because of few high-resolution images being available during the early years. Overall, an agreement between the detected and the actual change time was found in 75.74 % of the samples (two-thirds of the detected change time matched the actual change time, while one-third was within a 1-year interval). Further, the change time tended to be more accurate during 2011–2014 (78.20 %) compared to 2001–2006 (67.07 %), given the constraints of the from–to type and the range of exact change area of oil palm from 2011 to 2014.
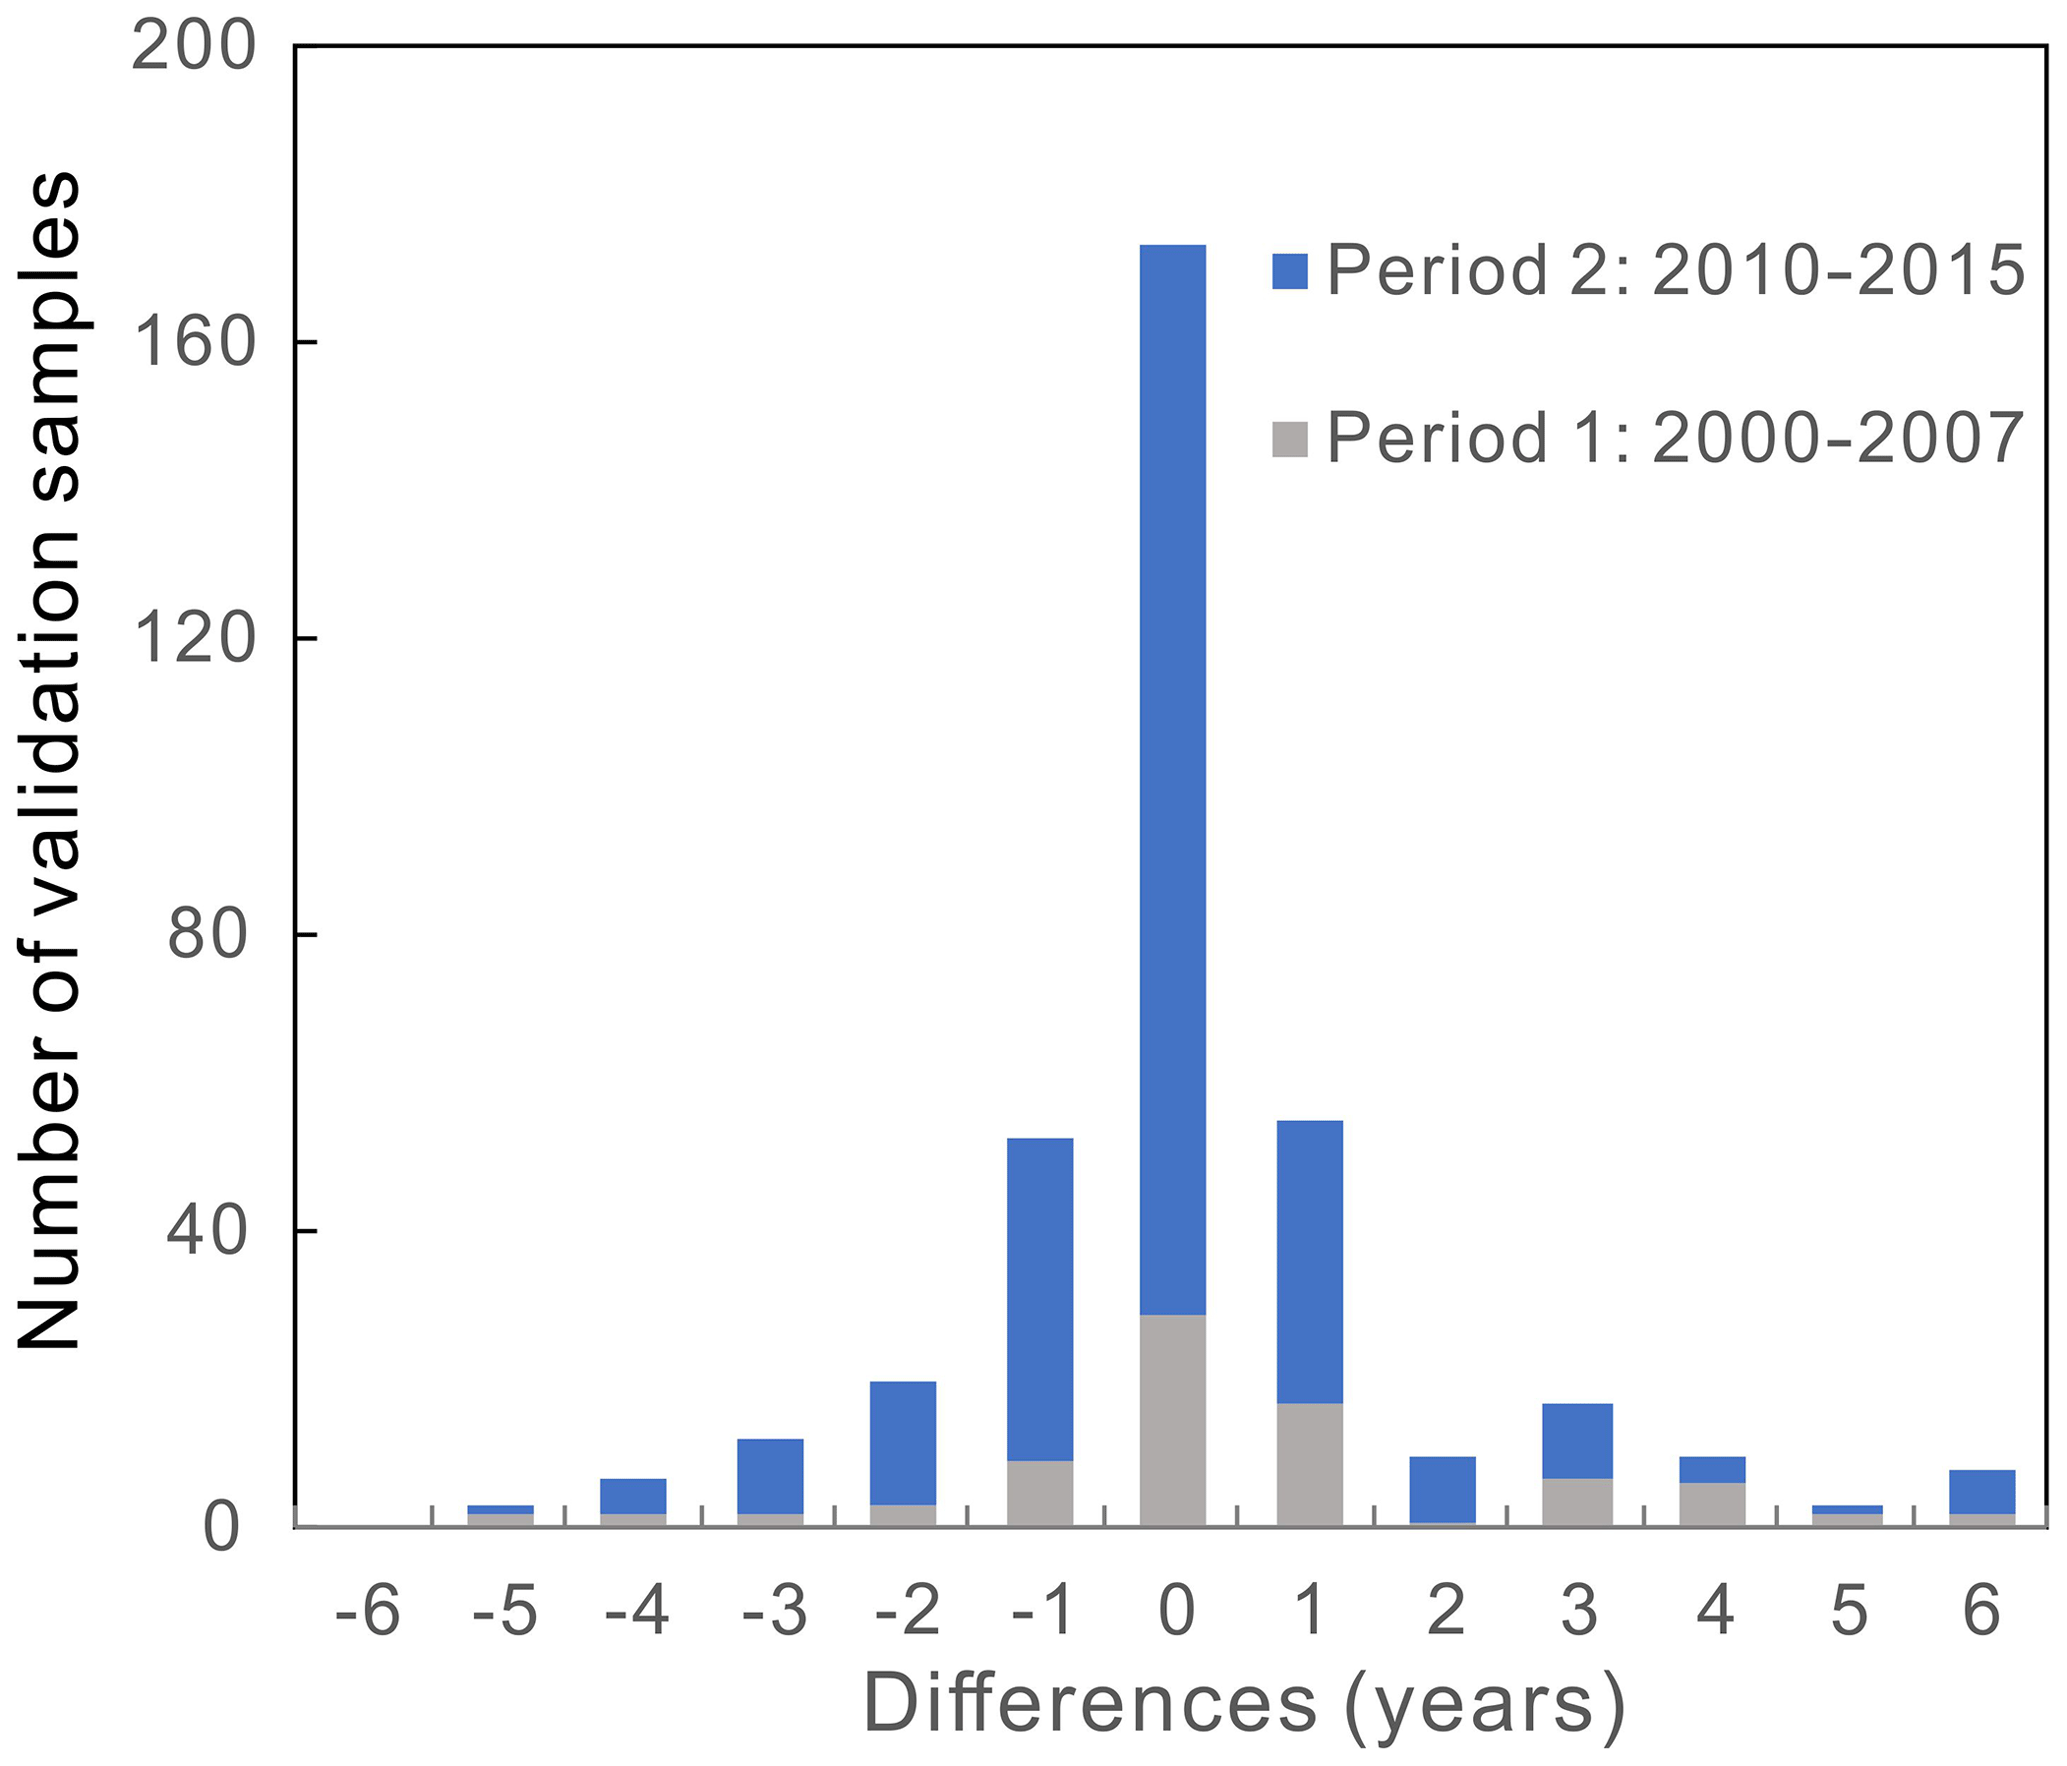
Figure 7Difference between the detected change years using MODIS NDVI dataset and the exact change years from the reference dataset (Google Earth and Landsat). Negative values on the x axis refer to the detected year being earlier than the actual change year.
3.3 Comparison of our results with statistics and other products
We first compared the oil palm plantation area from our AOPD product with oil palm harvested area from FAO and USDA and the oil palm plantation area from MPOB (data available from 2011 to 2015) and BPS-Statistics Indonesia (available from 2011 to 2016; Fig. 5). Note that the FAO inventory data for Malaysia from 2011 to 2015 and the USDA statistics from 2011 to 2014 were derived from MPOB (mainly mature area). The FAO statistics included both mature and immature oil palm area during 2011–2013 but only mature oil palm area during 2014–2015, resulting in an abrupt decline in area in the FAO inventory in 2014 (the orange line in Fig. 5a). Therefore, the areas from FAO inventory should be used with caution due to the lack of reliable on-field data sources (Ordway et al., 2019).
Compared to FAO and USDA statistics, the annual mean differences from 2001 to 2016 of our results in Malaysia and Indonesia are positive and amount to 2.00 and 1.18×10⁶ ha, respectively. The differences were limited to an average of 0.08×10⁶ ha (FAO) and 0.55×10⁶ ha (USDA) in Malaysia but were relatively higher in Indonesia (1.88×10⁶ ha compared to FAO and 0.60×10⁶ ha compared to USDA), probably because of more confusion from other plantations (i.e. coconuts, rubber and acacia) and/or more smallholder growth in Indonesia (Lee et al., 2014). There are also small differences in oil palm plantation area in comparison with local national statistics: MPOB (average annual difference of 0.20×10⁶ ha) and BPS-Statistics Indonesia (−0.17×10⁶ ha). These differences only consist of 3.14 % and 1.37 % of the total oil palm plantation area in 2016 in the two countries.
Trends of oil palm expansion in our mapping results (upper and lower boundary lines) are also compared with statistical data (FAO and USDA from 2001 to 2016, MPOB and BPS-Statistics from 2011 to 2015; Table S1 in the Supplement). Generally, the overall trends of our mapping results (0.758–0.941×10⁶ ha yr−1) are higher than the FAO (0.561×10⁶ ha yr−1) and USDA (0.630×10⁶ ha yr−1) records during the past 16 years, with larger discrepancy in Malaysia (47.07 %–59.40 % higher than FAO and 39.45 %–53.55 % higher than USGS) than Indonesia (16.84 %–31.68 % higher than FAO and 5.99 %–22.76 % higher than USGS). The higher estimation may be induced by the confusion in other woody plantations such as coconuts and pulp. Although there is high separability between rubber, wattles and palms in PALSAR data (Miettinen and Liew, 2011), the coconuts which belong to palm trees and have a fan-like shape showed fewer differences with oil palm compared to other plantations. Another possible reason is the difference in the oil palm plantation definitions (mature and immature oil palm or only mature oil palm included in FAO inventory). Compared to FAO and USDA statistics, increasing trends in our mapping results (0.148–0.178×10⁶ ha yr−1) are more consistent with national statistics from MPOB (0.160×10⁶ ha yr−1) in Malaysia, which include both the mature and immature oil palm during 2011–2015. We should also note that the unidirectional version would have a higher estimation of oil palm plantation area since the assumption of one-way growth. The annual increasing rates of oil palm plantations between our mapping results and other datasets also showed smaller differences in a recent period (2011–2015 with national statistics) compared to the whole study period (2001–2016). For example, the increasing oil palm expansion rate of 0.534–0.610×10⁶ ha yr−1 during 2011–2015 in our product is close to the statistical inventory data, particularly the USDA records (0.536×10⁶ ha yr−1), while the increasing rate of 0.573–0.674×10⁶ ha yr−1 is relatively higher than the USDA (0.520×10⁶ ha yr−1) and FAO (0.460×10⁶ ha yr−1) inventory during 2001–2016 in Indonesia. This is also consistent with the higher uncertainty in the early period and higher reliability in recent years. During the study period, the oil palm export price (total export value / export amount; data source: FAOSTAT) rapidly increased from 402.67 USD per tonne in 2006 to the peak (1080.72 USD per tonne) in 2011 (Fig. S9) but subsequently fell. The crop price is closely related to demand and may further impact the oil palm market and production (Turner et al., 2011). However, although there is a ∼10 %–20 % slowdown of the conversion rate, oil palm plantation area continuously increased after 2011. The land conversion to oil palm may also be affected by multiple factors such as agricultural rent, wages and market-mediated effects (such as tax; Furumo and Aide, 2017; Taheripour et al., 2019), and the relationship between oil palm expansion and price fluctuation still requires further exploration.
An industrial oil palm plantation dataset developed by a previous study (Gaveau et al., 2016; Fig. 8) was also used to compare our mapping results. The oil palm plantation in Gaveau's dataset was visually interpreted using Landsat datasets in 1973, 1990, 1995, 2000, 2005, 2010 and 2015 in Borneo. The overall distribution of oil palm extent in Borneo is similar between our mapping results (the unidirectional version) and Gaveau's results (Fig. 8a and b). The differences were scattered across the whole island, with more oil palm plantation areas in our results than in Gaveau's results in the south of Borneo (Fig. 8c; aggregated to proportional maps at 5 km×5 km to zoom in on the difference). Generally, 7.45, 9.23 and 9.86×10⁶ ha of oil palm plantation area was mapped in AOPD for Borneo during 2010, 2015 and 2016, which is 23.98 %, 12.61 % and 18.83 % larger than the estimates from Gaveau's dataset. Our higher estimation of oil palm plantation area is possibly because some of the smallholder oil palm plantations (1–50 ha in size) are captured in our results, whereas only industrial plantations were visually interpreted in Gaveau's results. Misclassification (commission errors) in our results may, however, also contribute to our estimation being higher.
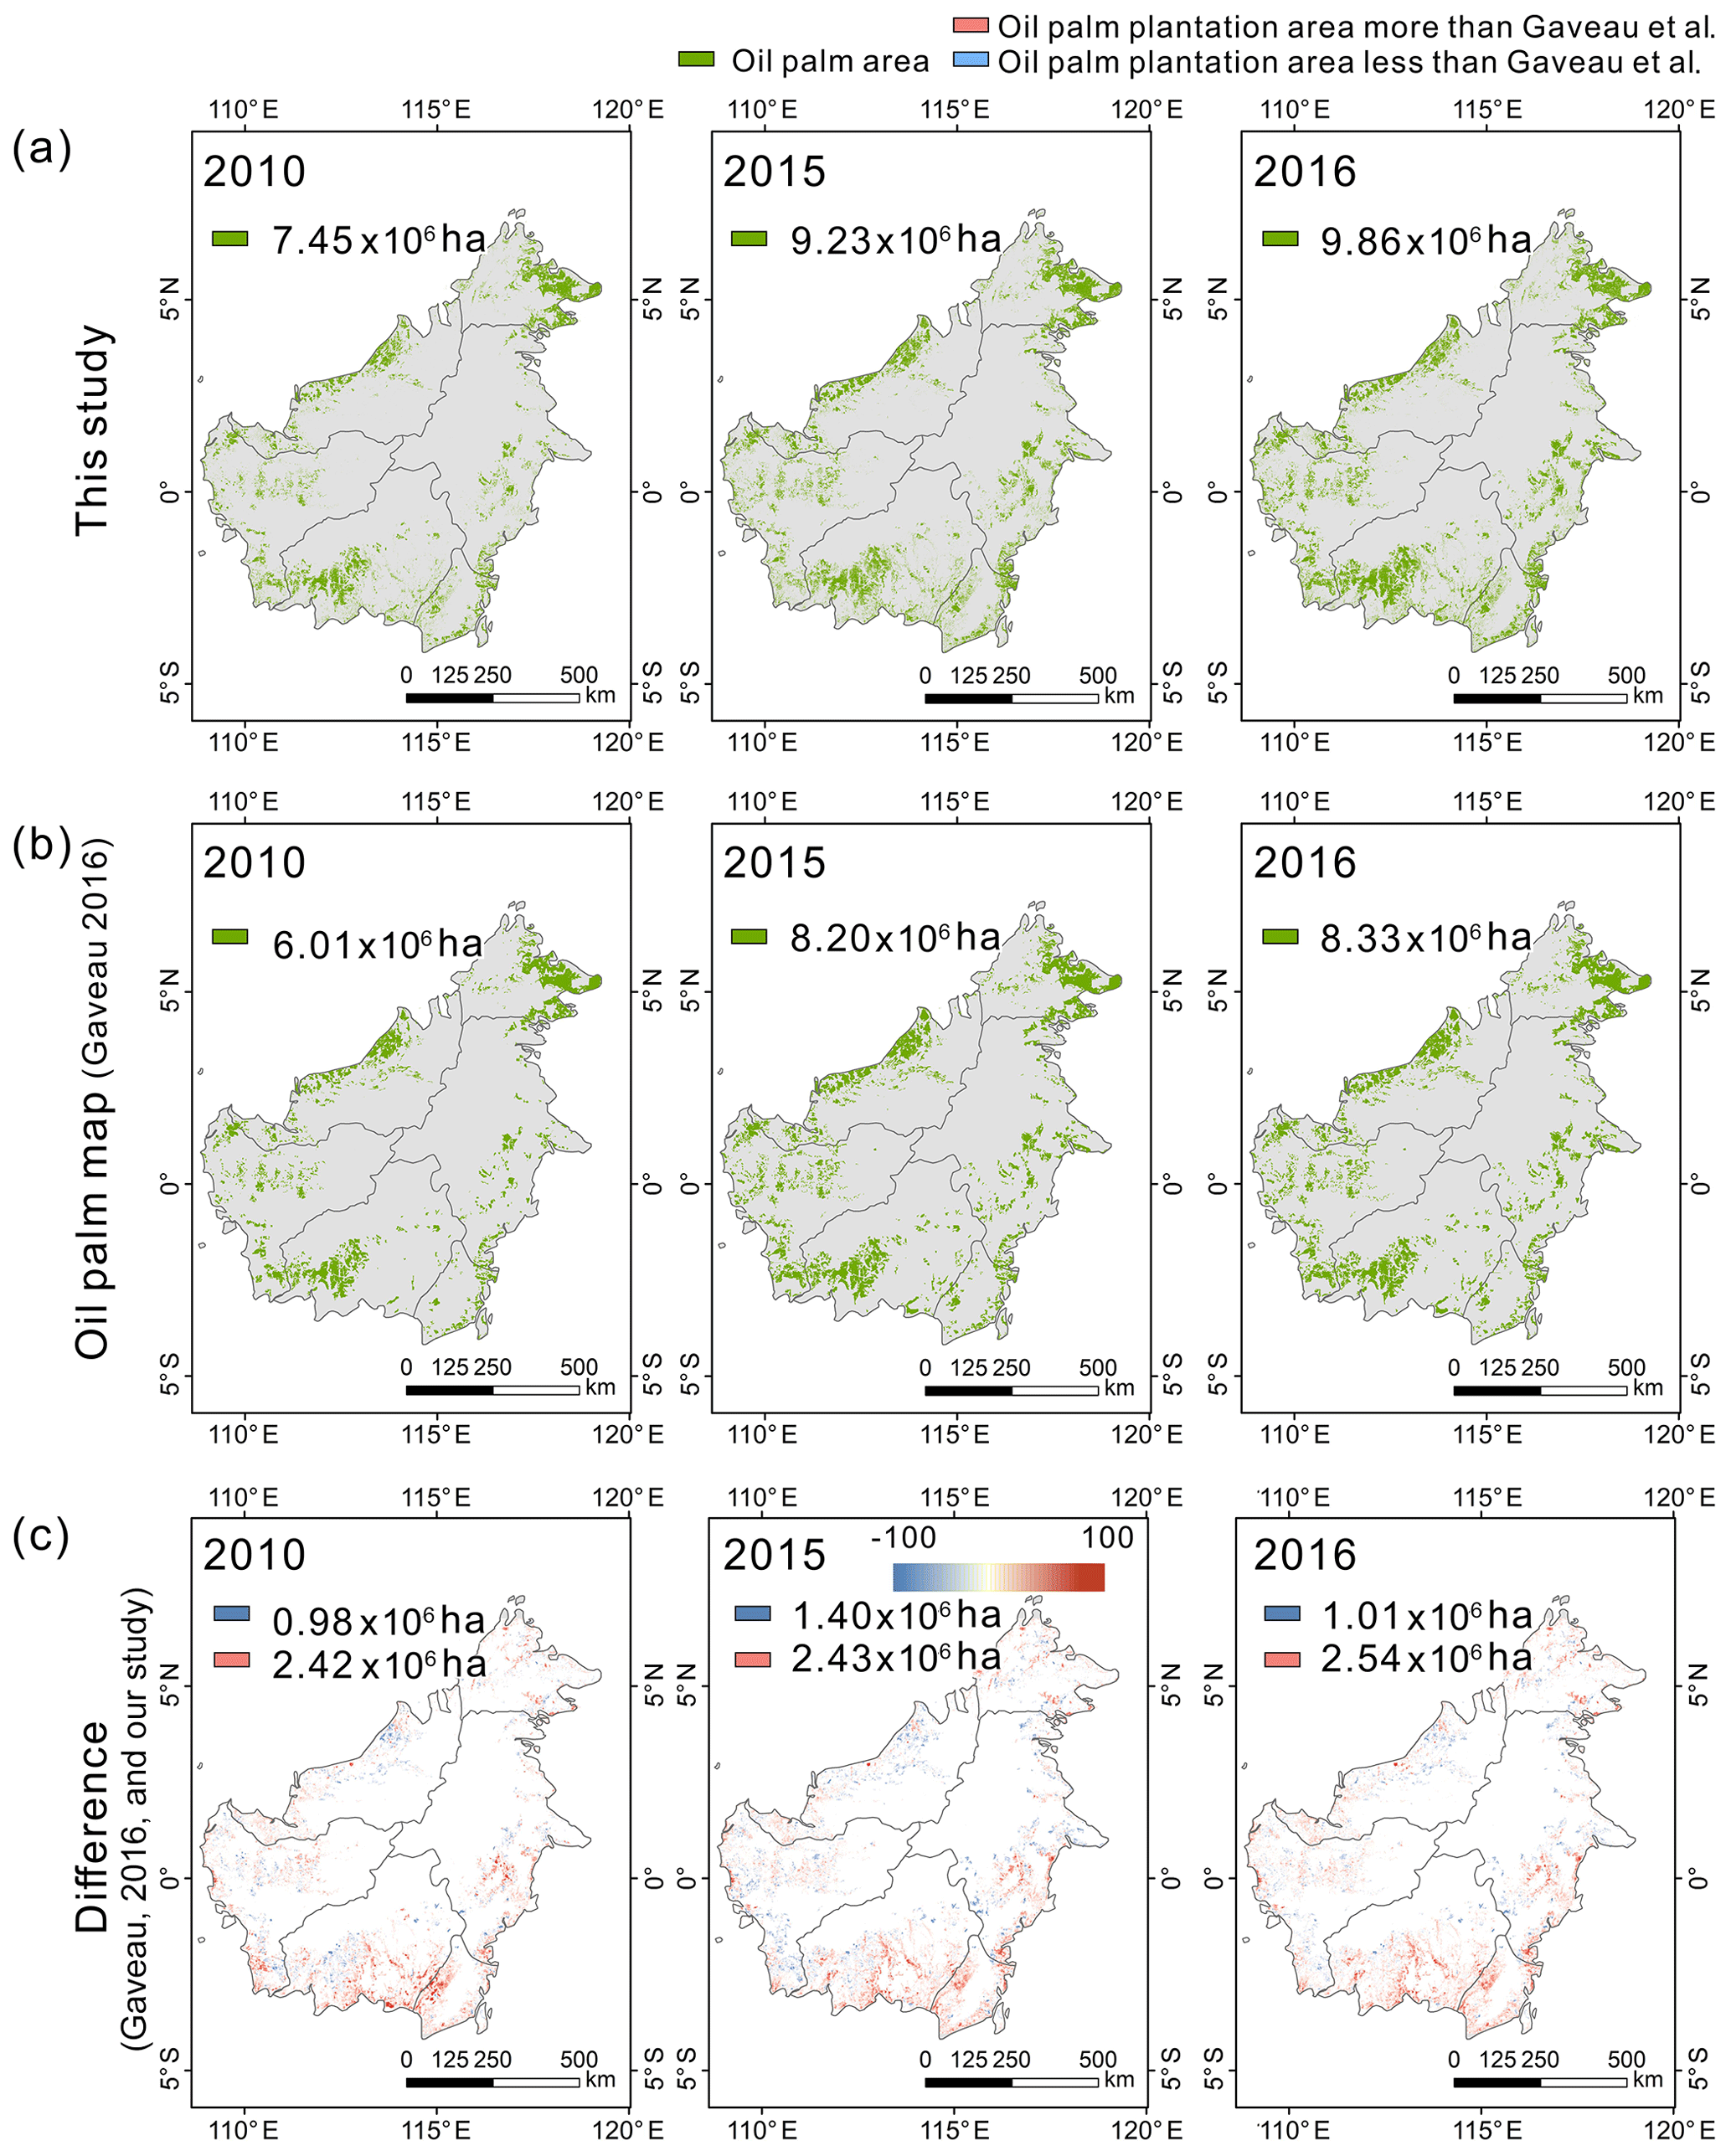
Figure 8Comparison with existing oil palm datasets in Borneo (Gaveau et al., 2016) for 2010, 2015 and 2016. The oil palm maps were aggregated to proportional maps at 5 km×5 km to visualize the difference in the third rows.
The oil palm concession area for Indonesia and Malaysia (Sarawak) for 2014 from Global Forest Watch (http://www.globalforestwatch.org, last access: 20 May 2019) is also used in the comparison. This dataset indicated the boundaries of areas allocated by government to companies for oil palm plantations. The oil palm concession area in Indonesia and Malaysia (Sarawak) for 2014 is 12.98×10⁶ ha, which is slightly higher (8.7 %) than our mapping results (11.85×10⁶ ha). However, since the concession data were compiled from various countries and sources (such as governments and other organizations) with different quality levels, some locations of the existing concessions may be inaccurate (Fig. 9a) or omitted (Fig. 9b) compared to our mapping results with PALSAR-2 data. Many concessions are not fully developed (i.e. not planted with oil palm yet), and the number reached more than half of the total 11×106 ha (∼5.5×10⁶ ha) on the islands of Sumatra and Kalimantan in 2010 (Slette and Wiyono, 2011). Another possible reason for the differences is the inclusion of very small oil palm plantations in our dataset of less than 50 ha, while most of the oil palm concessions (81.71 %) were larger than 1000 ha.
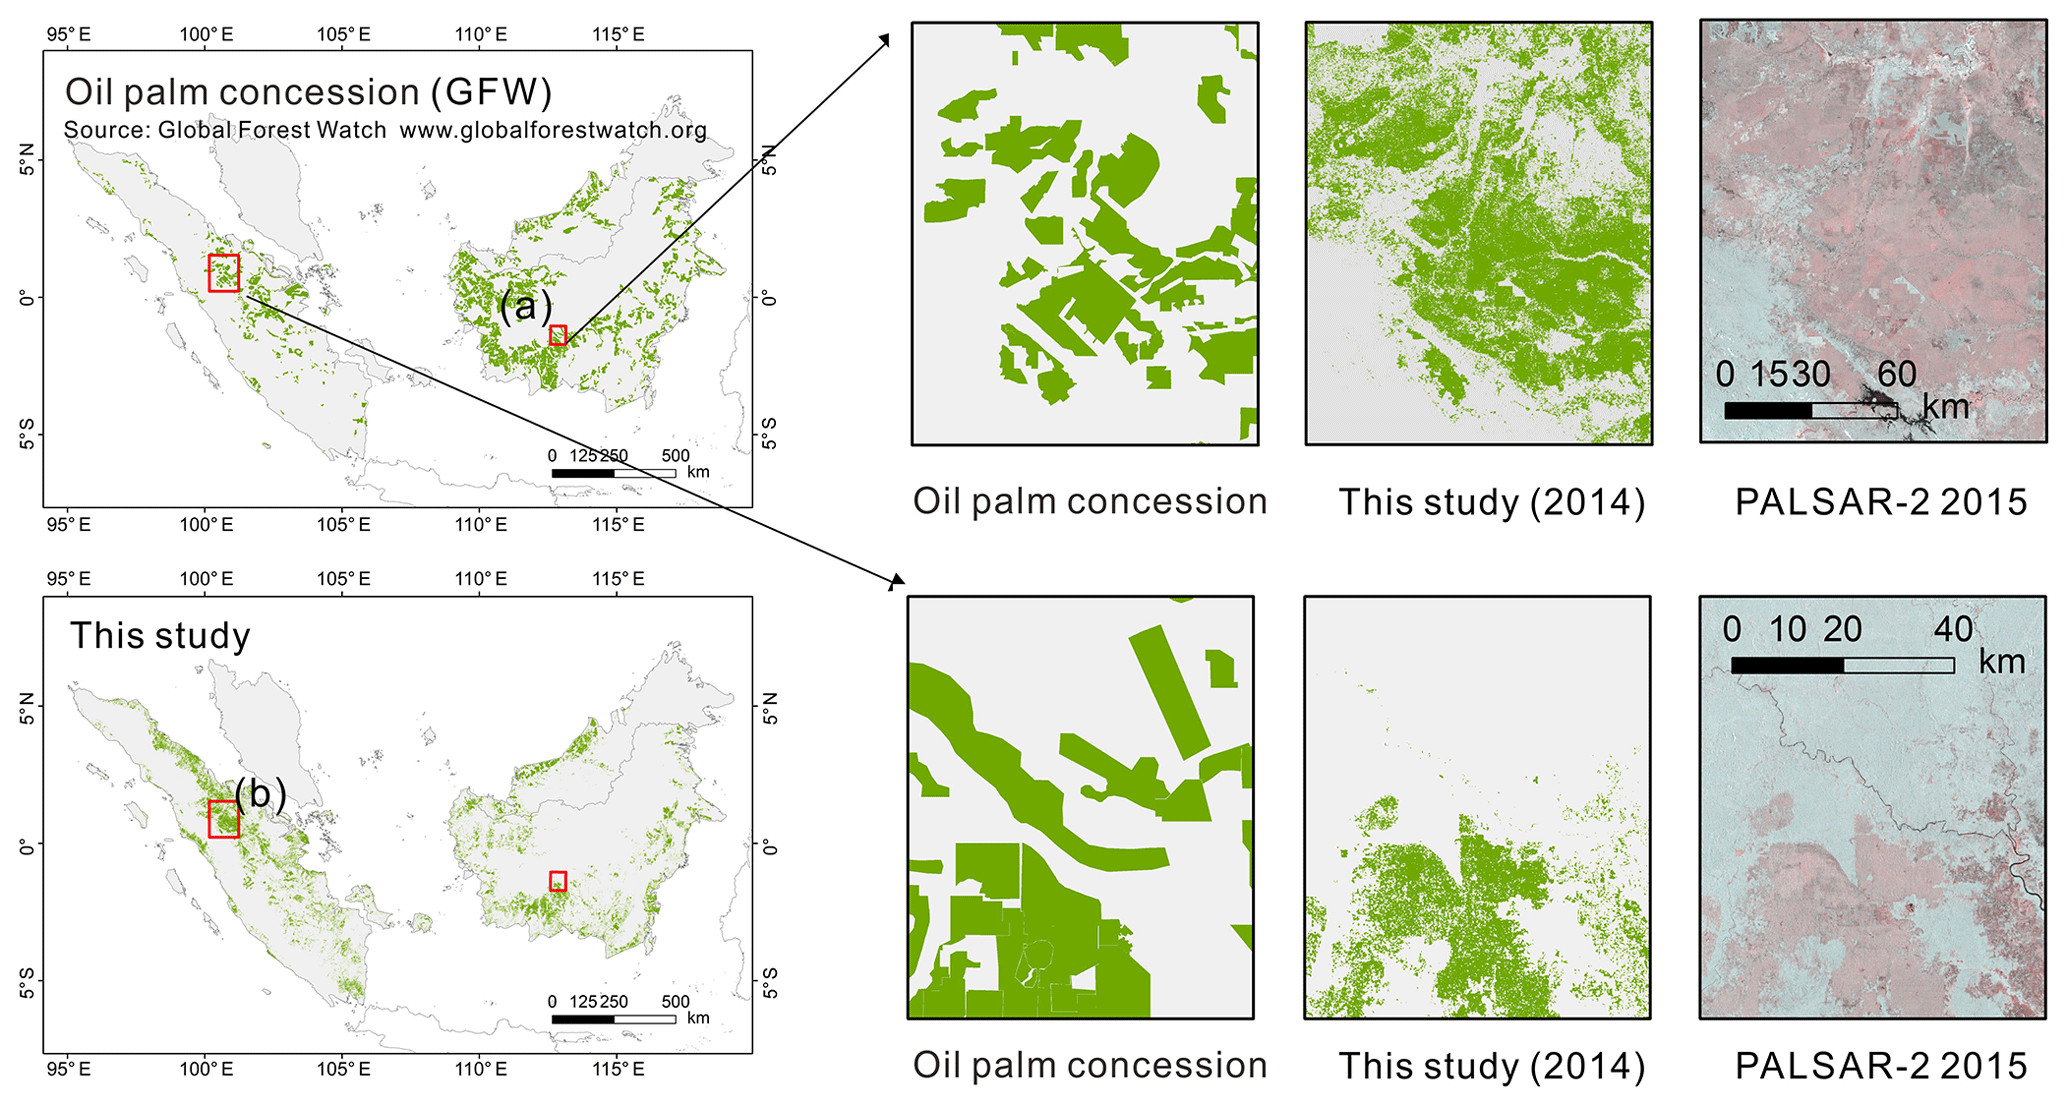
Figure 9Comparison with oil palm concession from Global Forest Watch (GFW) for 2014. The PALSAR-2 images were composited in RGB format (HH, HV, HV).
Oil palm expansion is one of the major drivers of deforestation in the studied region (Austin et al., 2018). Therefore, the forest area loss map from Hansen et al. (2013) was overlaid with the AOPD map, and the results are shown for selected areas in Fig. 10a and c, where the year of oil palm expansion is roughly coincides with the year of forest clearance. In other cases such as in Fig. 10b, a larger discrepancy was found in the two maps because of different causes. For example, forest loss is not always caused by oil palm expansion but timber plantations, logging, fires, and conversion from forest to grassland and agriculture (Austin et al., 2018; Kamlun et al., 2016). Meanwhile, expansion of oil palm plantations occurred not only in forest area but also in non-forest area. In some regions, the oil palm was planted after the logging of forest immediately (area filled with same colour in Fig. 10), but in other regions, areas may first experience a forest clearance and then become oil palm plantations several years later (indicated by the patches filled with darker colour in AOPD than in the forest loss map; Fig. 10). However, the difference in the spatial resolution (30 m vs 100 m) may also cause some differences, particularly in smallholder and newly developed oil palms. According to our result, 28.20 % of total oil palm expansion area overlapped with Hansen's forest loss area (5.38 % with the exact same change time, 15.37 % later than forest loss year and the remaining 7.46 % earlier than the forest loss time). Among the overlapped area, 19.16 % of the area has the same change time, 23.67 % in 1-year intervals (may be caused by the time lag between clearance and cultivation), and 38.11 % of oil palm expanding areas in AOPD coincide with forest area loss, with a lag of at least 2 years. These 38.11 % areas may experience first forest clear-cutting for other applications or are logged and remained unused for several years and then converted to oil palm plantations.
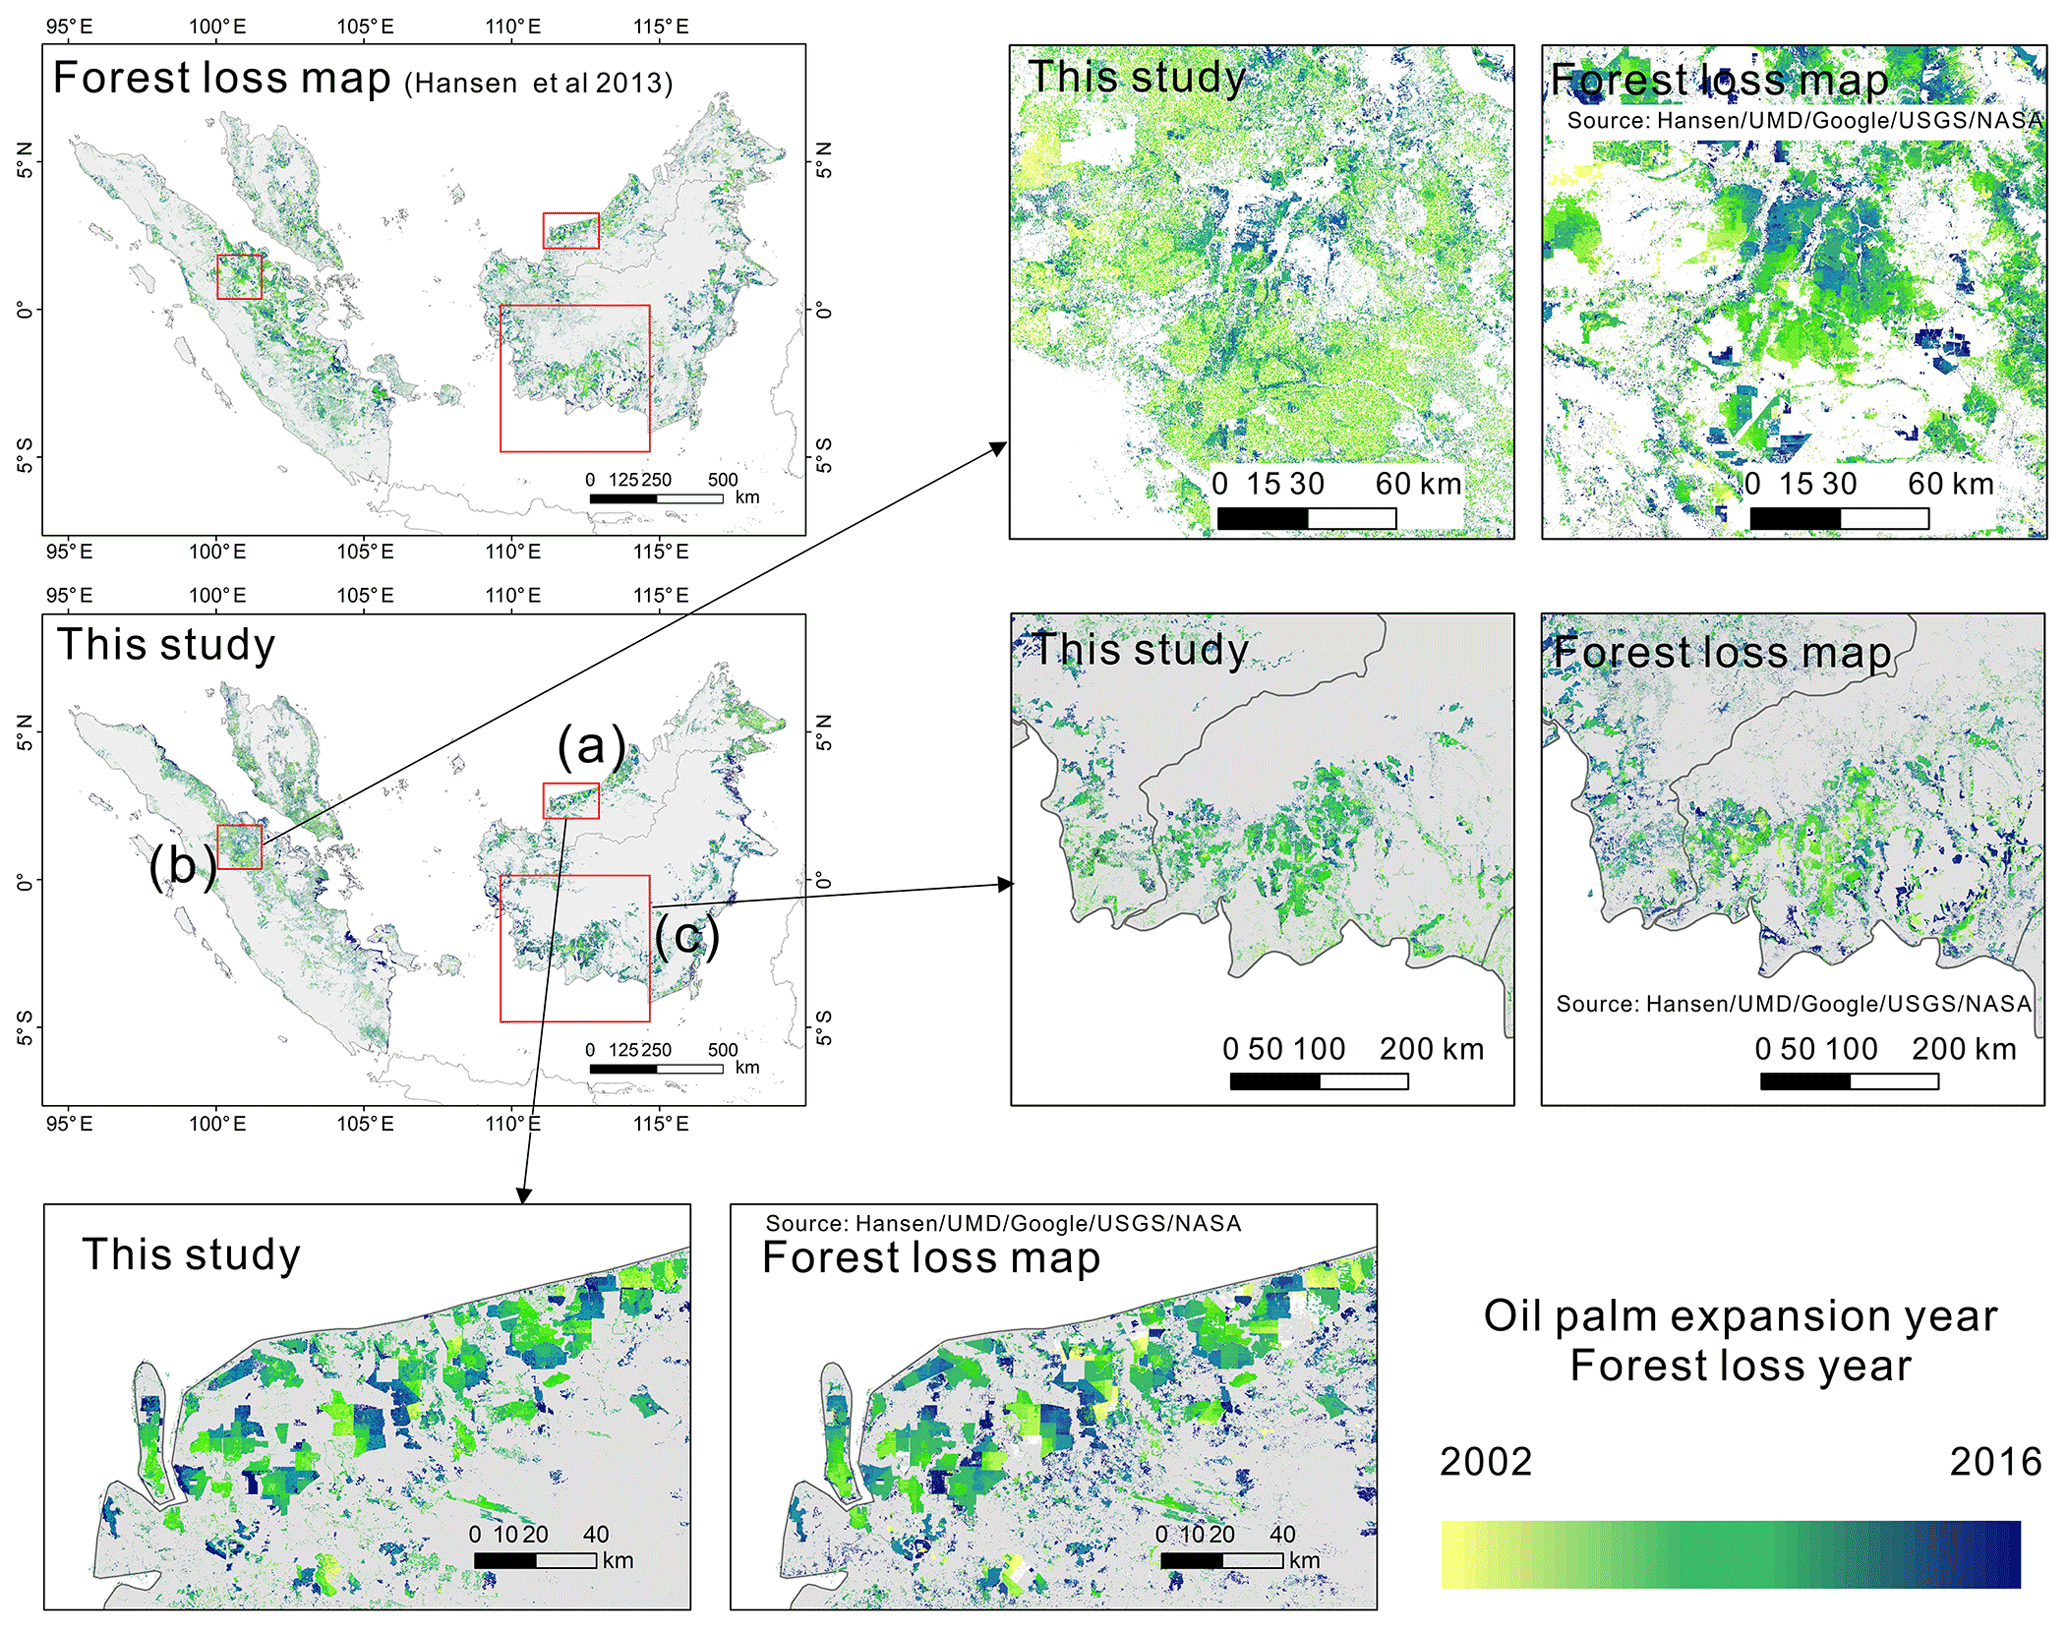
Figure 10Comparison of oil palm expansion map in this study with the Landsat forest area loss map (Hansen et al., 2013).
4.1 Uncertainty of AOPD
Mapping annual oil palm plantations using remote-sensing data in Malaysia and Indonesia is challenging. We developed the first annual oil palm land cover maps (AOPD) from 2001 to 2016 at 100 m resolution, combining optical and microwave satellite observations. However, the uncertainties of AOPD, coming from both mapping and change detection, should be acknowledged for the future applications of our dataset. In the mapping procedure, our results showed a good separation between primary forest and oil palm trees, but confusion may occur in some impervious area and plantations of other species such as coconuts. As a result, the accuracy of the change detection in the second step was also influenced by the oil palm maps generated from PALSAR and PALSAR-2 data in the first stage. Although oil palm maps for the 6 years of PALSAR and PALSAR-2 data reached high accuracy, at nearly 90 % in Malaysia and ∼75 % in Indonesia, inaccurate inputs in some pixels may lead to cumulative errors in the change detection during the PALSAR data gap years, particularly in Indonesia. The oil palm maps during 2001–2006 without from–to inputs, therefore, have more biases compared with the results from 2011 to 2014. Uncertainties could also be induced in the change-detection process. Even though the change pixels during the data gap period are constrained by the 100 m oil palm maps from PALSAR before and after that period, the use of moderate-resolution MODIS data at 250 m may cause the loss of spatial information and false identification of the change times. Some studies suggested that the fusion of low- and high-resolution satellite data requires high-resolution images at a certain frequency (Zhang et al., 2017). However, when aiming to conduct consecutive mapping and changes detection, there will always be a trade-off between spatial and temporal resolution (Yin et al., 2018), considering the availability of satellite data such as MODIS and Landsat data (i.e. MODIS has denser observations but lower spatial resolution than Landsat data). In addition to the satellite data, the change-detection algorithm may also bring uncertainties. Because the accuracy of the detected change time by BFAST within a time series is influenced by the signal-to-noise ratio (Verbesselt et al., 2010b), cloud contamination and low data quality in some regions from MODIS reduced the amount of valid information. And the bias may also be found in the gap years when no break point could be found using BFAST algorithm and the errors were accumulated to years when switching to MODIS before and after PALSAR. However, it is difficult to identify whether the errors originated from the classification during PALSAR period or the change detection in the gap period. Further improvement could be the use of algorithms which combine the different models (i.e. BEAST) rather than the single best model (K. Zhao et al., 2019). When applying the change-detection algorithms, we assumed one-time change in two periods (2001–2007 and 2011–2014). However, multiple changes may occur in the deforestation area when the logging activity is applied first and followed by the replantation of oil palm several years later. More importantly, oil palm will be cut down and replanted after 20 to 25 years for the next rotation in order to make the maximum profit. This would cause confusion with the transitions between oil palm and other land-use types. Therefore, we provided two versions of AOPD: one is the original results with bi-directional oil palm area change, and the other is the unidirectional datasets by assuming that all the oil palm loss is from rotation and that a loss is followed by a new oil palm plantation.
Despite of these uncertainties, the AOPD annual oil palm maps integrated the strengths of microwave (SAR) and optical satellite observations. SAR has the capability to identify the oil palm from forest regardless of the weather conditions, and MODIS time series has a hyper-temporal density and long time span. Also, our study gives a good example of integrating fine and coarse datasets. Instead of directly using the coarse dataset, the oil palm maps combined the overall change information for the whole data gap period from fine PALSAR and PALSAR-2 data and the detection of exact change year using coarse MODIS data. In recent years, there is a transition from annual classification to change information mining in remote-sensing interpretation to reduce the false changes (Xu et al., 2018b). This method can be used not only in monitoring global oil palm dynamics but also in producing annual land cover maps where only discrete high-resolution observations are available. Since the data scarcity of successive Landsat imagery is common across the world, the algorithm described in this study provides an effective way of combining coarse data to update the annual land cover change. Further, inventory compilation and manual visualization of oil palm change to a large extent would remain labour-intensive and time-consuming (Gaveau et al., 2016; Miettinen et al., 2016; Vijay et al., 2018). Our semi-automatic algorithm in oil palm mapping may thus help to establish long-term monitoring for oil palm that can be improved over time with regular validation using ground-based observation or very high resolution images such as Google Earth.
4.2 Applications of AOPD
The 100 m annual oil palm maps from AOPD produced in this study can be used in a number of applications. First of all, it can be used as cross-validation reference data for other regional oil palm datasets (e.g. FAO inventory). Second, the annual data can be further used to quantify the spatiotemporal characteristics of oil palm change, estimate the annual oil palm yields, identify the potential area planted with oil palm and predict the boundary of oil palm expansion in the future, and so on. Overlapping the AOPD with forest maps, peatland maps and other land cover maps can give a clue to how the oil palm expansion influences different ecosystems and their carbon balance. For example, oil palm expansion is the largest single driver of deforestation in Indonesia, which contributed to 2.08×10⁶ ha of deforestation (23 %) in Indonesia from 2001 to 2016 (Austin et al., 2018). The protected areas were also at long-term risk of deforestation from oil palm cultivation (Vijay et al., 2018). Previous studies revealed that oil palm directly replaced 3.1×10⁶ ha (27 %) of peatland in peninsular Malaysia, Sumatra and Borneo from 2007 to 2015 (Miettinen et al., 2016), causing the carbon-rich tropical peatland to become a strong carbon source (Miettinen et al., 2017a). AOPD at high spatiotemporal resolution can also serve as land-use-change-forcing data in the bookkeeping models (Hansis et al., 2015; Houghton and Nassikas, 2017) and possibly dynamic global vegetation models (DGVMs; Sitch et al., 2015; provided that those models include a specific plant functional type – PFT – to represent oil palm; Fan et al., 2015) to better simulate the carbon emissions and hydrology dynamics. It would improve the carbon budget greatly in southeastern Asia if DGVMs could systematically simulate biomass, litter and soil carbon changes caused by shifts in oil palm plantations, primary forest, peatlands and fire using accurate and compatible land-use change data.
Another vision lies in the sustainable future of oil palm industry. As the major contributor to the economy that supports thousands of people in the tropical countries, the developing oil palm industry has been one of the priorities in these countries (Mahmud et al., 2010; Sayer et al., 2012). At the same time, the possible environmental and ecological consequences of monocultures need to be taken into account for the sustainable development of oil palm industry. For example, the Roundtable on Sustainable Palm Oil (RSPO) was established to formulate the standards for the industrial oil palm plantations in southeastern Asia, followed by the foundation of the Africa Palm Oil Initiative. Voluntary zero-deforestation commitments in the palm oil industry have also been implemented since 2010 (Focus, 2016). However, the number of large corporations and the extent to which they pay real attention to the rights of local populations remain unknown (Barr and Sayer, 2012).
It is crucial to find a balance between the rural economic development and environmental protection, especially in the regions with high-biodiversity primary forest and carbon-rich peatlands like southeastern Asia. More complete information on oil palm plantations (e.g. spatiotemporal changes of oil palm and its consequences) would help to reduce the disputes and provide strategies for oil palm's sustainable development. Our annual oil palm maps would thus contribute to the policy formulation as well as policy evaluation (e.g. national moratorium on new permits for the oil palm conversion from primary natural forests and peatlands; Busch et al., 2015).
The AOPD in Malaysia and Indonesia from 2001 to 2016 at 100 m resolution is available to the public at https://doi.org/10.5281/zenodo.3467071 (Xu et al., 2019). The dataset includes a set of GeoTIFF images in the WGS_1984_World_mercator projected coordinate system. It can be opened and reprocessed in GIS applications (e.g. QGIS, ArcGIS) and other opening computing environments (R, MATLAB, etc.). Value 1 represents oil palm, while value 0 is a null value. In this study, we used PALSAR and PALSAR-2 and MODIS NDVI datasets to produce AOPD and SRTM DEM; intact forest landscape (IFL) and the Global Mangrove Atlas (GMA) were used to filter the results in the post-processing. The 25 m resolution PALSAR and PALSAR-2 data provided by the Japan Aerospace Exploration Agency (JAXA) from 2007 to 2010 and 2015 to 2016 are available at http://www.eorc.jaxa.jp/ALOS/en/palsar_fnf/data/index.htm (last access: 20 May 2019, Shimada et al., 2014) after entering basic information. MODIS vegetation index data (MOD13Q1 NDVI) collection 6 (250 m) from 2000 to 2015 and SRTM DEM (30 m) were obtained from the Land Processes Distributed Active Archive Center (https://lpdaac.usgs.gov/, last access: 20 July 2019, Didan, 2019; NASA, 2013). IFL is available from http://www.intactforests.org/ (last access: 20 May 2019, Potapov et al., 2008), and GMA can be downloaded from http://geodata.grid.unep.ch/results.php (last access: 15 March 2020, UNEP, 2020).
Combining the optical and microwave satellite observations, we developed the first annual oil palm maps (AOPD) in Malaysia and Indonesia from 2001 to 2016 at 100 m resolution using the image classification and change-detection analysis. The dataset reached high accuracy in both annual classification and change detection. As a result, this dataset provided insights and details on dynamic oil palm changes for Malaysia and Indonesia from the perspective of remote sensing and can serve as a supplement for statistics. Further applications of the dataset include but are not limited to regional carbon studies, water and agricultural management, biodiversity and conservation protection, and the sustainable development of the oil palm industry. The annual updating method in this study that fully used information from discrete high-resolution data and continuous low-resolution data is also expected to be applicable in other regions facing data scarcity.
The supplement related to this article is available online at: https://doi.org/10.5194/essd-12-847-2020-supplement.
YX and LY conceived the study. YX analysed the data and drafted the paper. WL, PC, YC and PG supported the generation of the dataset and the analysis of the results.
The authors declare that they have no conflict of interest.
This research has been supported by the National Key R&D Program of China (grant nos. 2017YFA0604401 and 2019YFA0606601) and the Tsinghua University Initiative Scientific Research Program (grant no. 2019Z02CAU).
This paper was edited by David Carlson and reviewed by two anonymous referees.
Austin, K. G., Schwantes, A. M., Gu, Y., and Kasibhatla, P.: What causes deforestation in Indonesia?, Environ. Res. Lett., 14, 024007, https://doi.org/10.1088/1748-9326/aaf6db, 2018.
Baklanov, A., Khachay, M., and Pasynkov, M.: Application of fully convolutional neural networks to mapping industrial oil palm plantations, International Conference on Analysis of Images, Social Networks and Texts, 11179, 155–16, https://doi.org/10.1007/978-3-030-11027-7_167, 2018.
Balasundram, S. K., Memarian, H., and Khosla, R.: Estimating oil palm yields using vegetation indices derived from Quickbird, Life Sci. J., 10, 851–860, 2013.
Barr, C. M. and Sayer, J. A.: The political economy of reforestation and forest restoration in Asia–Pacific: Critical issues for REDD+, Biol. Conserv., 154, 9–19, 2012.
Broich, M., Hansen, M. C., Potapov, P., Adusei, B., Lindquist, E., and Stehman, S. V.: Time-series analysis of multi-resolution optical imagery for quantifying forest cover loss in Sumatra and Kalimantan, Indonesia, Int. J. Appl. Earth Obs., 13, 277–291, https://doi.org/10.1016/j.jag.2010.11.004, 2011.
Busch, J., Ferretti-Gallon, K., Engelmann, J., Wright, M., Austin, K. G., Stolle, F., Turubanova, S., Potapov, P. V., Margono, B., and Hansen, M. C.: Reductions in emissions from deforestation from Indonesia's moratorium on new oil palm, timber, and logging concessions, P. Natl. Acad. Sci. USA, 112, 1328–1333, 2015.
Carlson, K. M., Curran, L. M., Asner, G. P., Pittman, A. M., Trigg, S. N., and Adeney, J. M.: Carbon emissions from forest conversion by Kalimantan oil palm plantations, Nat. Clim. Change, 3, 283–287, https://doi.org/10.1038/nclimate1702, 2013.
Cheang, E. K., Cheang, T. K., and Tay, Y. H.: Using convolutional neural networks to count palm trees in satellite images, arXiv preprint arXiv:1701.06462, 2017.
Chen, B., Xiao, X., Ye, H., Ma, J., Doughty, R., Li, X., Zhao, B., Wu, Z., Sun, R., Dong, J., Qin, Y., and Xie, G.: Mapping Forest and Their Spatial–Temporal Changes From 2007 to 2015 in Tropical Hainan Island by Integrating ALOS/ALOS-2 L-Band SAR and Landsat Optical Images, IEEE J. Sel. Top. Appl., 11, 852–867, https://doi.org/10.1109/JSTARS.2018.2795595, 2018.
Cheng, Y., Yu, L., Zhao, Y., Xu, Y., Hackman, K., Cracknell, A. P., and Gong, P.: Towards a global oil palm sample database: design and implications, Int. J. Remote Sens., 38, 4022–4032, 2017.
Cheng, Y., Yu, L., Xu, Y., Lu, H., Cracknell, A. P., Kanniah, K., and Gong, P.: Mapping oil palm extent in Malaysia using ALOS-2 PALSAR-2 data, Int. J. Remote Sens., 39, 432–452, 2018.
Cheng, Y., Yu, L., Xu, Y., Lu, H., Cracknell, A. P., Kanniah, K., and Gong, P.: Mapping oil palm plantation expansion in Malaysia over the past decade (2007–2016) using ALOS-1/2 PALSAR-1/2 data, Int. J. Remote Sens., 40, 7389–7408, 2019.
Clark, M. L., Aide, T. M., Grau, H. R., and Riner, G.: A scalable approach to mapping annual land cover at 250 m using MODIS time series data: A case study in the Dry Chaco ecoregion of South America, Remote Sens. Environ., 114, 2816–2832, https://doi.org/10.1016/j.rse.2010.07.001, 2010.
Cohen, W., Healey, S., Yang, Z., Stehman, S., Brewer, C., Brooks, E., Gorelick, N., Huang, C., Hughes, M., and Kennedy, R.: How similar are forest disturbance maps derived from different Landsat time series algorithms?, Forests, 8, 98, https://doi.org/10.3390/f8040098, 2017.
Corley, R. H. V. and Tinker, P. B.: The oil palm, 5th Edn, John Wiley & Sons, https://doi.org/10.1002/9781118953297, 2008.
Dara, A., Baumann, M., Kuemmerle, T., Pflugmacher, D., Rabe, A., Griffiths, P., Hölzel, N., Kamp, J., Freitag, M., and Hostert, P.: Mapping the timing of cropland abandonment and recultivation in northern Kazakhstan using annual Landsat time series, Remote Sens. Environ., 213, 49–60, https://doi.org/10.1016/j.rse.2018.05.005, 2018.
DeVries, B., Decuyper, M., Verbesselt, J., Zeileis, A., Herold, M., and Joseph, S.: Tracking disturbance-regrowth dynamics in tropical forests using structural change detection and Landsat time series, Remote Sens. Environ., 169, 320–334, https://doi.org/10.1016/j.rse.2015.08.020, 2015.
Didan, K.: MOD13Q1 MODIS/Terra Vegetation Indices 16-Day L3 Global 250m SIN Grid V006: distributed by NASA EOSDIS Land Processes DAAC, https://doi.org/10.5067/MODIS/MOD13Q1.006, 2015.
Ding, M., Chen, Q., Xiao, X., Xin, L., Zhang, G., and Li, L.: Variation in Cropping Intensity in Northern China from 1982 to 2012 Based on GIMMS-NDVI Data, Sustainability, 8, 1123, https://doi.org/10.3390/su8111123, 2016.
Dong, X., Quegan, S., Yumiko, U., Hu, C., and Zeng, T.: Feasibility study of C-and L-band SAR time series data in tracking Indonesian plantation and natural forest cover changes, IEEE J. Sel. Top. Appl., 8, 3692–3699, 2015.
Estel, S., Kuemmerle, T., Alcántara, C., Levers, C., Prishchepov, A., and Hostert, P.: Mapping farmland abandonment and recultivation across Europe using MODIS NDVI time series, Remote Sens. Environ., 163, 312–325, https://doi.org/10.1016/j.rse.2015.03.028, 2015.
Fan, Y., Roupsard, O., Bernoux, M., Le Maire, G., Panferov, O., Kotowska, M. M., and Knohl, A.: A sub-canopy structure for simulating oil palm in the Community Land Model (CLM-Palm): phenology, allocation and yield, Geosci. Model Dev., 8, 3785–3800, https://doi.org/10.5194/gmd-8-3785-2015, 2015.
FAOSTAT: Oil palm fruit production, available at: http://faostat.fao.org (last access: 17 March 2019), 2017.
Fitzherbert, E. B., Struebig, M. J., Morel, A., Danielsen, F., Brühl, C. A., Donald, P. F., and Phalan, B.: How will oil palm expansion affect biodiversity?, Trends Ecol. Evol., 23, 538–545, https://doi.org/10.1016/j.tree.2008.06.012, 2008.
Focus, C.: Progress on the New York Declaration on Forests: Eliminating Deforestation from the Production of Agricultural Commodities–Goal 2 Assessment Report, prepared by: Climate Focus in cooperation with the NYDF Assessment Coalition with support from the Climate and Land Use Alliance and the Tropical Forest Alliance, 2020, 2016.
Furumo, P. R. and Aide, T. M.: Characterizing commercial oil palm expansion in Latin America: land use change and trade, Environ. Res. Lett., 12, 024008, https://doi.org/10.1088/1748-9326/aa5892, 2017.
Gaveau, D. L. A., Sheil, D., Husnayaen, Salim, M. A., Arjasakusuma, S., Ancrenaz, M., Pacheco, P., and Meijaard, E.: Rapid conversions and avoided deforestation: examining four decades of industrial plantation expansion in Borneo, Sci. Rep., 6, 32017–32017, https://doi.org/10.1038/srep32017, 2016.
Gibbs, H. K., Ruesch, A. S., Achard, F., Clayton, M. K., Holmgren, P., Ramankutty, N., and Foley, J. A.: Tropical forests were the primary sources of new agricultural land in the 1980s and 1990s, P. Natl. Acad. Sci. USA, 107, 16732–16737, 2010.
Gong, P., Wang, J., Yu, L., Zhao, Y. C., Zhao, Y. Y., Liang, L., Niu, Z. G., Huang, X. M., Fu, H. H., Liu, S., Li, C. C., Li, X. Y., Fu, W., Liu, C. X., Xu, Y., Wang, X. Y., Cheng, Q., Hu, L. Y., Yao, W. B., Zhang, H., Zhu, P., Zhao, Z. Y., Zhang, H. Y., Zheng, Y. M., Ji, L. Y., Zhang, Y. W., Chen, H., Yan, A., Guo, J. H., Yu, L., Wang, L., Liu, X. J., Shi, T. T., Zhu, M. H., Chen, Y. L., Yang, G. W., Tang, P., Xu, B., Giri, C., Clinton, N., Zhu, Z. L., Chen, J., and Chen, J.: Finer resolution observation and monitoring of global land cover: first mapping results with Landsat TM and ETM+ data, Int. J. Remote Sens., 34, 2607–2654, https://doi.org/10.1080/01431161.2012.748992, 2013.
Guillaume, T., Kotowska, M. M., Hertel, D., Knohl, A., Krashevska, V., Murtilaksono, K., Scheu, S., and Kuzyakov, Y.: Carbon costs and benefits of Indonesian rainforest conversion to plantations, Nat. Commun., 9, 2388, https://doi.org/10.1038/s41467-018-04755-y, 2018.
Gunarso, P., Hartoyo, M., Agus, F., and Killeen, T.: Oil palm and land use change in Indonesia, Malaysia and Papua New Guinea, Reports from the Technical Panels of the 2nd greenhouse gas working Group of the Roundtable on Sustainable Palm Oil (RSPO), 29, 2013.
Hansen, M. C., Potapov, P. V., Moore, R., Hancher, M., Turubanova, S. A., Tyukavina, A., Thau, D., Stehman, S. V., Goetz, S. J., Loveland, T. R., Kommareddy, A., Egorov, A., Chini, L., Justice, C. O., and Townshend, J. R. G.: High-Resolution Global Maps of 21st-Century Forest Cover Change, Science, 342, 850–853, https://doi.org/10.1126/science.1244693, 2013.
Hansis, E., Davis, S. J., and Pongratz, J.: Relevance of methodological choices for accounting of land use change carbon fluxes, Global Biogeochem. Cy., 29, 1230–1246, 2015.
Henry, W. and Wan, H. H.: Effects of salinity on fresh fruit bunch (FFB) production and oil-to-bunch ratio of oil palm (Elaeis guineensis) planted in reclaimed mangrove swamp areas in Sabah, Oil Palm Bulletin, 65, 12–20, 2012.
Houghton, R. and Nassikas, A. A.: Global and regional fluxes of carbon from land use and land cover change 1850–2015, Global Biogeochem. Cy., 31, 456–472, 2017.
Ibharim, N., Mustapha, M. A., Lihan, T., and Mazlan, A.: Mapping mangrove changes in the Matang Mangrove Forest using multi temporal satellite imageries, Ocean Coast. Manage,, 114, 64–76, 2015.
Kamlun, K. U., Bürger Arndt, R., and Phua, M.-H.: Monitoring deforestation in Malaysia between 1985 and 2013: Insight from South-Western Sabah and its protected peat swamp area, Land Use Policy, 57, 418–430, https://doi.org/10.1016/j.landusepol.2016.06.011, 2016.
Kennedy, R. E., Yang, Z., and Cohen, W. B.: Detecting trends in forest disturbance and recovery using yearly Landsat time series: 1. LandTrendr – Temporal segmentation algorithms, Remote Sens. Environ., 114, 2897–2910, https://doi.org/10.1016/j.rse.2010.07.008, 2010.
Koh, L. P. and Wilcove, D. S.: Is oil palm agriculture really destroying tropical biodiversity?, Conserv. Lett., 1, 60–64, 2008.
Koh, L. P., Miettinen, J., Liew, S. C., and Ghazoul, J.: Remotely sensed evidence of tropical peatland conversion to oil palm, P. Natl. Acad. Sci. USA, 108, 5127–5132, https://doi.org/10.1073/pnas.1018776108, 2011.
Lee, J. S. H., Ghazoul, J., Obidzinski, K., and Koh, L. P.: Oil palm smallholder yields and incomes constrained by harvesting practices and type of smallholder management in Indonesia, Agron. Sustain. Dev., 34, 501–513, https://doi.org/10.1007/s13593-013-0159-4, 2014.
Lee, J. S. H., Wich, S., Widayati, A., and Koh, L. P.: Detecting industrial oil palm plantations on Landsat images with Google Earth Engine, Remote Sensing Applications: Society and Environment, 4, 219–224, https://doi.org/10.1016/j.rsase.2016.11.003, 2016.
Li, W., Fu, H., Yu, L., and Cracknell, A. J. R. S.: Deep learning based oil palm tree detection and counting for high-resolution remote sensing images, 9, 22, https://doi.org/10.3390/rs9010022, 2017.
Li, W., Dong, R., and Fu, H.: Large-Scale Oil Palm Tree Detection from High-Resolution Satellite Images Using Two-Stage Convolutional Neural Networks, Remote Sensing, 11, 11, https://doi.org/10.3390/rs11010011, 2019.
Li, X., Ling, F., Foody, G. M., Ge, Y., Zhang, Y., and Du, Y.: Generating a series of fine spatial and temporal resolution land cover maps by fusing coarse spatial resolution remotely sensed images and fine spatial resolution land cover maps, Remote Sens. Environ., 196, 293–311, https://doi.org/10.1016/j.rse.2017.05.011, 2017.
Miettinen, J. and Liew, S. C.: Separability of insular Southeast Asian woody plantation species in the 50 m resolution ALOS PALSAR mosaic product, Remote Sens. Lett., 2, 299–307, 2011.
Miettinen, J., Hooijer, A., Tollenaar, D., Page, S., Malins, C., Vernimmen, R., Shi, C., and Liew, S. C. J. I. W. P.: Historical analysis and projection of oil palm plantation expansion on peatland in Southeast Asia, ICCT White Paper, 17, 2012.
Miettinen, J., Shi, C., and Liew, S. C.: Land cover distribution in the peatlands of Peninsular Malaysia, Sumatra and Borneo in 2015 with changes since 1990, Global Ecol. Conserv., 6, 67–78, 2016.
Miettinen, J., Shi, C., and Liew, S. C.: Towards automated 10–30 m resolution land cover mapping in insular South-East Asia, Geocarto Int., 34, 443–457, https://doi.org/10.1080/10106049.2017.1408700, 2017.
Mubin, N. A., Nadarajoo, E., Shafri, H. Z. M., and Hamedianfar, A.: Young and mature oil palm tree detection and counting using convolutional neural network deep learning method, Int. J. Remote Sens., 40, 7500–7515, https://doi.org/10.1080/01431161.2019.1569282, 2019.
Murphy, D. J.: The future of oil palm as a major global crop: opportunities and challenges, J. Oil Palm Res., 26, 1–24, 2014.
NASA JPL: NASA Shuttle Radar Topography Mission Global 1 arc second distributed by NASA EOSDIS Land Processes DAAC, https://doi.org/10.5067/MEaSUREs/SRTM/, 2013.
Obidzinski, K., Andriani, R., Komarudin, H., and Andrianto, A.: Environmental and social impacts of oil palm plantations and their implications for biofuel production in Indonesia, Ecol. Soc., 17, 25, https://doi.org/10.5751/ES-04775-170125, 2012.
Ordway, E. M., Naylor, R. L., Nkongho, R. N., and Lambin, E. F.: Oil palm expansion and deforestation in Southwest Cameroon associated with proliferation of informal mills, Nat. Commun., 10, 114, https://doi.org/10.1038/s41467-018-07915-2, 2019.
Petrenko, C., Paltseva, J., and Searle, S.: Ecological impacts of palm oil expansion in Indonesia, Washington, International Council on Clean Transportation, 2016.
Potapov, P., Yaroshenko, A., Turubanova, S., Dubinin, M., Laestadius, L., Thies, C., Aksenov, D., Egorov, A., Yesipova, Y., and Glushkov, I.: Mapping the world's intact forest landscapes by remote sensing, Ecol. Soc., 13, 51, available at: http://www.ecologyandsociety.org/vol13/iss2/art51/ (last access: 20 May 1019), 2008.
Qin, Y., Xiao, X., Dong, J., Zhou, Y., Wang, J., Doughty, R. B., Chen, Y., Zou, Z., and Moore, B.: Annual dynamics of forest areas in South America during 2007–2010 at 50 m spatial resolution, Remote Sens. Environ., 201, 73–87, https://doi.org/10.1016/j.rse.2017.09.005, 2017.
Röll, A., Niu, F., Meijide, A., Hardanto, A., Hendrayanto, Knohl, A., and Hölscher, D.: Transpiration in an oil palm landscape: effects of palm age, Biogeosciences, 12, 5619–5633, https://doi.org/10.5194/bg-12-5619-2015, 2015.
Rosenqvist, A., Shimada, M., Ito, N., and Watanabe, M.: ALOS PALSAR: A pathfinder mission for global-scale monitoring of the environment, IEEE T. Geosci. Remote, 45, 3307–3316, 2007.
Sayer, J., Ghazoul, J., Nelson, P., and Klintuni Boedhihartono, A.: Oil palm expansion transforms tropical landscapes and livelihoods, Global Food Secur.-Agr., 1, 114–119, https://doi.org/10.1016/j.gfs.2012.10.003, 2012.
Shen, W., Li, M., Huang, C., Tao, X., Li, S., and Wei, A.: Mapping Annual Forest Change Due to Afforestation in Guangdong Province of China Using Active and Passive Remote Sensing Data, Remote Sensing, 11, 490, https://doi.org/10.3390/rs11050490, 2019.
Shimada, M., Isoguchi, O., Tadono, T., and Isono, K.: PALSAR radiometric and geometric calibration, IEEE T. Geosci. Remote, 47, 3915–3932, 2009.
Sitch, S., Friedlingstein, P., Gruber, N., Jones, S. D., Murray-Tortarolo, G., Ahlström, A., Doney, S. C., Graven, H., Heinze, C., Huntingford, C., Levis, S., Levy, P. E., Lomas, M., Poulter, B., Viovy, N., Zaehle, S., Zeng, N., Arneth, A., Bonan, G., Bopp, L., Canadell, J. G., Chevallier, F., Ciais, P., Ellis, R., Gloor, M., Peylin, P., Piao, S. L., Le Quéré, C., Smith, B., Zhu, Z., and Myneni, R.: Recent trends and drivers of regional sources and sinks of carbon dioxide, Biogeosciences, 12, 653–679, https://doi.org/10.5194/bg-12-653-2015, 2015.
Slette, J. P. and Wiyono, I. E.: Oilseeds and Products Update, 2011, USDA Foreign Agricultural Service, 2011.
Srestasathiern, P. and Rakwatin, P.: Oil palm tree detection with high resolution multi-spectral satellite imagery, Remote Sensing, 6, 9749–9774, 2014.
Taheripour, F., Hertel, T. W., and Ramankutty, N.: Market-mediated responses confound policies to limit deforestation from oil palm expansion in Malaysia and Indonesia, P. Natl. Acad. Sci. USA, 116, 19193, https://doi.org/10.1073/pnas.1903476116, 2019.
Tan, K. P., Kanniah, K. D., and Cracknell, A. P.: Use of UK-DMC 2 and ALOS PALSAR for studying the age of oil palm trees in southern peninsular Malaysia, Int. J. Remote Sens., 34, 7424–7446, 2013.
Teng, K. C., Koay, J. Y., Tey, S. H., Lim, K. S., Ewe, H. T., and Chuah, H. T.: A dense medium microwave backscattering model for the remote sensing of oil palm, IEEE T. Geosci. Remote, 53, 3250–3259, 2015.
Turner, E. C., Snaddon, J. L., Ewers, R. M., Fayle, T. M., and Foster, W. A.: The impact of oil palm expansion on environmental change: putting conservation research in context, 10, 20263, https://doi.org/10.5772/20263, 2011.
UNEP: The UNEP Environmental Data Explorer, as compiled from United Nations Environment Programme/World Conservation Monitoring Center (UNEP-WCMC), United Nations Environment Programme, available at: http://ede.grid.unep.ch, last access: 15 March 2020.
Verbesselt, J., Hyndman, R., Newnham, G., and Culvenor, D.: Detecting trend and seasonal changes in satellite image time series, Remote Sens. Environ., 114, 106–115, https://doi.org/10.1016/j.rse.2009.08.014, 2010a.
Verbesselt, J., Hyndman, R., Zeileis, A., and Culvenor, D.: Phenological change detection while accounting for abrupt and gradual trends in satellite image time series, Remote Sens. Environ., 114, 2970–2980, https://doi.org/10.1016/j.rse.2010.08.003, 2010b.
Verbesselt, J., Zeileis, A., and Herold, M.: Near real-time disturbance detection using satellite image time series, Remote Sens. Environ., 123, 98–108, https://doi.org/10.1016/j.rse.2012.02.022, 2012.
Vijay, V., Reid, C. D., Finer, M., Jenkins, C. N., and Pimm, S. L.: Deforestation risks posed by oil palm expansion in the Peruvian Amazon, Environ. Res. Lett., 13, 114010, https://doi.org/0.1088/1748-9326/aae540, 2018.
World Bank: Improving the livelihoods of palm oil smallholders: the role of the private sector, International Finance Corporation, World Bank Group, Washington, DC, USA, 2010.
Xu, Y., Lin, L., and Meng, D.: Learning-Based Sub-Pixel Change Detection Using Coarse Resolution Satellite Imagery, Remote Sensing, 9, 709, https://doi.org/10.3390/rs9070709, 2017.
Xu, Y., Yu, L., Peng, D., Cai, X., Cheng, Y., Zhao, J., Zhao, Y., Feng, D., Hackman, K., Huang, X., Lu, H., Yu, C., and Gong, P.: Exploring the temporal density of Landsat observations for cropland mapping: experiments from Egypt, Ethiopia, and South Africa, Int. J. Remote Sens., 39, 7328–7349, https://doi.org/10.1080/01431161.2018.1468115, 2018a.
Xu, Y., Yu, L., Zhao, F. R., Cai, X., Zhao, J., Lu, H., and Gong, P.: Tracking annual cropland changes from 1984 to 2016 using time-series Landsat images with a change-detection and post-classification approach: Experiments from three sites in Africa, Remote Sens. Environ., 218, 13–31, 2018b.
Xu, Y., Yu, L., Li, W., Ciais, P., Cheng, Y., and Gong, P.: Annual oil palm plantation maps in Malaysia and Indonesia from 2001 to 2016, version 1, Zenodo, https://doi.org/10.5281/zenodo.3361762, 2019.
Xu, Y., Yu, L., Peng, D. L., Zhao, J. Y., Cheng, Y. Q., Liu, X. X., Li, L., Meng, R., Xu, X. L., and Gong, P.: Annual 30 m land use/ land cover maps of China for 1980–2015 from the integration of AVHRR, MODIS and Landsat data using the BFAST algorithm, Science China Earth Sciences, https://doi.org/10.1007/s11430-019-9606-4, online first, 2020.
Yin, H., Prishchepov, A. V., Kuemmerle, T., Bleyhl, B., Buchner, J., and Radeloff, V. C.: Mapping agricultural land abandonment from spatial and temporal segmentation of Landsat time series, Remote Sens. Environ., 210, 12–24, https://doi.org/10.1016/j.rse.2018.02.050, 2018.
Yu, L., Wang, J., and Gong, P.: Improving 30 m global land-cover map FROM-GLC with time series MODIS and auxiliary data sets: a segmentation-based approach, Int. J. Remote Sens., 34, 5851–5867, https://doi.org/10.1080/01431161.2013.798055, 2013.
Yue, C., Ciais, P., and Li, W.: Smaller global and regional carbon emissions from gross land use change when considering sub-grid secondary land cohorts in a global dynamic vegetation model, Biogeosciences, 15, 1185–1201, https://doi.org/10.5194/bg-15-1185-2018, 2018a.
Yue, C., Ciais, P., Luyssaert, S., Li, W., McGrath, M. J., Chang, J., and Peng, S.: Representing anthropogenic gross land use change, wood harvest, and forest age dynamics in a global vegetation model ORCHIDEE-MICT v8.4.2, Geosci. Model Dev., 11, 409–428, https://doi.org/10.5194/gmd-11-409-2018, 2018b.
Zeileis, A.: A Unified Approach to Structural Change Tests Based on ML Scores, F Statistics, and OLS Residuals, Economet. Rev., 24, 445–466, 2005.
Zhang, L., Weng, Q., and Shao, Z.: An evaluation of monthly impervious surface dynamics by fusing Landsat and MODIS time series in the Pearl River Delta, China, from 2000 to 2015, Remote Sens. Environ., 201, 99–114, https://doi.org/10.1016/j.rse.2017.08.036, 2017.
Zhang, Y., Ling, F., Foody, G. M., Ge, Y., Boyd, D. S., Li, X., Du, Y., and Atkinson, P. M.: Mapping annual forest cover by fusing PALSAR/PALSAR-2 and MODIS NDVI during 2007–2016, Remote Sens. Environ., 224, 74–91, https://doi.org/10.1016/j.rse.2019.01.038, 2019.
Zhao, K., Wulder, M. A., Hu, T., Bright, R., Wu, Q., Qin, H., Li, Y., Toman, E., Mallick, B., and Zhang, X.: Detecting change-point, trend, and seasonality in satellite time series data to track abrupt changes and nonlinear dynamics: A Bayesian ensemble algorithm, Remote Sens. Environ., 232, 111181, https://doi.org/10.1016/j.rse.2019.04.034, 2019a.
Zhao, S. and Liu, S.: Scale criticality in estimating ecosystem carbon dynamics, Glob. Change Biol., 20, 2240–2251, 2014.
Zhao, S. Q., Liu, S., Li, Z., and Sohl, T. L.: Ignoring detailed fast-changing dynamics of land use overestimates regional terrestrial carbon sequestration, Biogeosciences, 6, 1647–1654, https://doi.org/10.5194/bg-6-1647-2009, 2009.
Zhao, Y., Feng, D., Yu, L., Cheng, Y., Zhang, M., Liu, X., Xu, Y., Fang, L., Zhu, Z., and Gong, P.: Long-Term Land Cover Dynamics (1986–2016) of Northeast China Derived from a Multi-Temporal Landsat Archive, Remote Sensing, 11, 599, https://doi.org/10.3390/rs11050599, 2019b.