the Creative Commons Attribution 4.0 License.
the Creative Commons Attribution 4.0 License.
 | 18 Feb 2020
The Tall Tower Dataset: a unique initiative to boost wind energy research
Llorenç Lledó
Núria Pérez-Zanón
Albert Soret
Francisco J. Doblas-Reyes
A dataset containing quality-controlled wind observations from 222 tall towers has been created. Wind speed and wind direction measurements covering the 1984–2017 period have been collected from existing tall towers around the world in an effort to boost the utilization of these non-standard atmospheric datasets, especially within the wind energy and research fields. Observations taken at several heights greater than 10 m above ground level have been retrieved from various sparse datasets and compiled in a unique collection with a common format, access, documentation and quality control. For the last, a total of 18 quality control checks have been considered to ensure the high quality of the wind records. Non-quality-controlled temperature, relative humidity and barometric pressure data from the towers have also been obtained and included in the dataset. The Tall Tower Dataset (Ramon and Lledó, 2019a) is published in the repository EUDAT and made available at https://doi.org/10.23728/b2share.136ecdeee31a45a7906a773095656ddb.
- Article
(2955 KB) - Full-text XML
-
Supplement
(5411 KB) - BibTeX
- EndNote


Renewable energies have experienced the fastest growth among all electricity sources in the last few years (OECD/IEA, 2018, 2019). Together with solar photovoltaic, the wind power sector is leading this development, and the number of new wind farms and the installed capacity is currently facing an important increase worldwide (WindEurope, 2018; AWEA, 2019).
With higher shares of electricity generation depending on wind speed conditions, it is crucial to advance understanding of wind speed conditions at heights between 50 and 150 m above ground – where current wind turbines are installed – and at multiple timescales ranging from turbulence to mesoscale circulations, seasonal to decadal oscillations and climate change impacts. To characterize these features, high-quality meteorological observations are needed.
Vast numbers of surface wind measurements taken at the standard height of 10 m above surface level do already exist, and efforts have been made to compile the existing surface wind observations (Lott, 2004; Dunn et al., 2012; Klein Tank et al., 2002; Lucio-Eceiza et al., 2018a, b). However, meteorological data at turbine hub heights are much scarcer than surface observations. To take those measurements, a tall tower or met mast needs to be installed and instrumented. The basic structure of these masts consists of a high vertical tower reaching heights of 100 to 200 m above ground with several platforms distributed along the vertical structure. It allows the placement of several wind sensors (i.e. anemometers and wind vanes) at different heights so that the vertical wind shear can be profiled. In addition, it is also typical to install several horizontal booms at each measuring height oriented to different directions. Thus, more than one sensor per measurement level can be installed to correct or replace data from one of these redundant sensors in case it is affected by a technical failure or by the wind shadow produced by the mast itself. The physical structure of a tall tower, as well as a typical instrumentation layout, is illustrated in Fig. 1.

Figure 1(a) Measuring levels at University of Hamburg meteorological mast (Germany). Source: https://icdc.cen.uni-hamburg.de (last access: February 2020).(b) Arrangement of the instrumentation in booms at Hyytiälä forest met tower (Finland). Courtesy of Jesús Yus-Díez.
Recently, the usage of remote sensing devices to measure atmospheric profiles has increased as an alternative to the tall tower in situ measurements. Atmospheric lidars, for example, are becoming more popular due to their easy installation and maintenance when compared to tall towers. However, the lack of historical lidar data limits their utilization in long-term assessment studies. One more example of that new trend is the lidar-based satellite Aeolus, which was launched by the European Space Agency in 2018, and has just started acquiring profiles of Earth’s wind on a global scale (https://www.esa.int/Applications/Observing_the_Earth/Aeolus, last access: February 2020).
Hub-height observations are widely used in different initiatives to (a) evaluate the wind resource characteristics and derive wind power generation estimates (Brower et al., 2013); (b) study local wind shear, turbulence and the dynamics of the planetary boundary layer, PBL (Li et al., 2010); (c) enhance or verify reanalysis products (Ramon et al., 2019; Decker et al., 2012); (d) correct meteorological forecasts (Baker et al., 2003) and climate predictions (Torralba et al., 2017); or (e) calibrate and verify wind atlas products (e.g. Troen and Petersen, 1989; Fernando et al., 2018; Tammelin et al., 2013).
Most of the existing met masts are owned by private companies mainly from the wind energy industry. Wind energy companies need to take those measurements prior to the construction of a new wind farm to characterize the wind speeds in the area and eventually ensure the return of the initial investment. In addition, some local effects such as topographic channelling, sea breezes, turbulence or vertical wind shear must be inferred because they can have a substantial impact on the electricity production (Hansen et al., 2012). Since the maintenance costs of these large and complex structures are rather expensive, the energy industry typically takes measurements for a relatively short period (1 or 2 years usually). Then the towers are decommissioned, so the lack of long records of tall tower data reduces the possibilities to study, for example, wind variability at seasonal to decadal timescales. In addition, private companies are usually reluctant to share the tall tower data with third parties, obstructing their further usage even more.
Fortunately, many of the initiatives from (a) to (e) also take tall tower measurements for their research and then the data are usually made freely accessible for non-commercial purposes. Derived from these diverse efforts devoted to boosting the utilization of tall tower records, there exist various sparse datasets containing measurements from instrumented towers. Regrettably, they are often difficult to find or access, and the lack of coordination in terms of formats, metadata, data access and quality control (QC) hinder their usability outside the owner institution.
The INDECIS (http://www.indecis.eu/, last access: February 2020) project is making attempts to collect existing non-standard meteorological observations, among other efforts. In this paper, a dataset is presented, and the QC of the wind data is further detailed. The reader is referred to Ramon and Lledó (2019b) to find complete information on the identification and collection of towers, data formatting and documentation. Section 2 of this article describes the main features of the dataset, as well as the data characteristics. The QC software suite is defined in Sect. 3. Then, a wrap-up of the results after running the QC checks is presented in Sect. 4. The benchmark experiment carried out to test the robustness of the QC software is shown in Sect. 5. Finally, conclusions are presented in Sect. 6.
The Tall Tower Dataset (Ramon and Lledó, 2019a) is a unique collection of data from 222 tall towers resulting from an exhaustive process of identification of existing masts and their later data retrieval. Figure 2 presents the global distribution of the sites, which is highly heterogeneous. Most of the masts are located in Asia (51 %), mainly clustered in Iran, resulting from a national campaign aimed to boost renewable energies at a country level. Then, tall towers appear more spatially distributed over North America (23 %) and Europe (16 %), mirroring the important deployment of wind power that is taking place in those regions. Africa (8 %), Oceania (1 %) and Antarctica (1 %) follow. Unfortunately, it has been hard to retrieve data from South America, so no records from this area can be found in the Tall Tower Dataset.
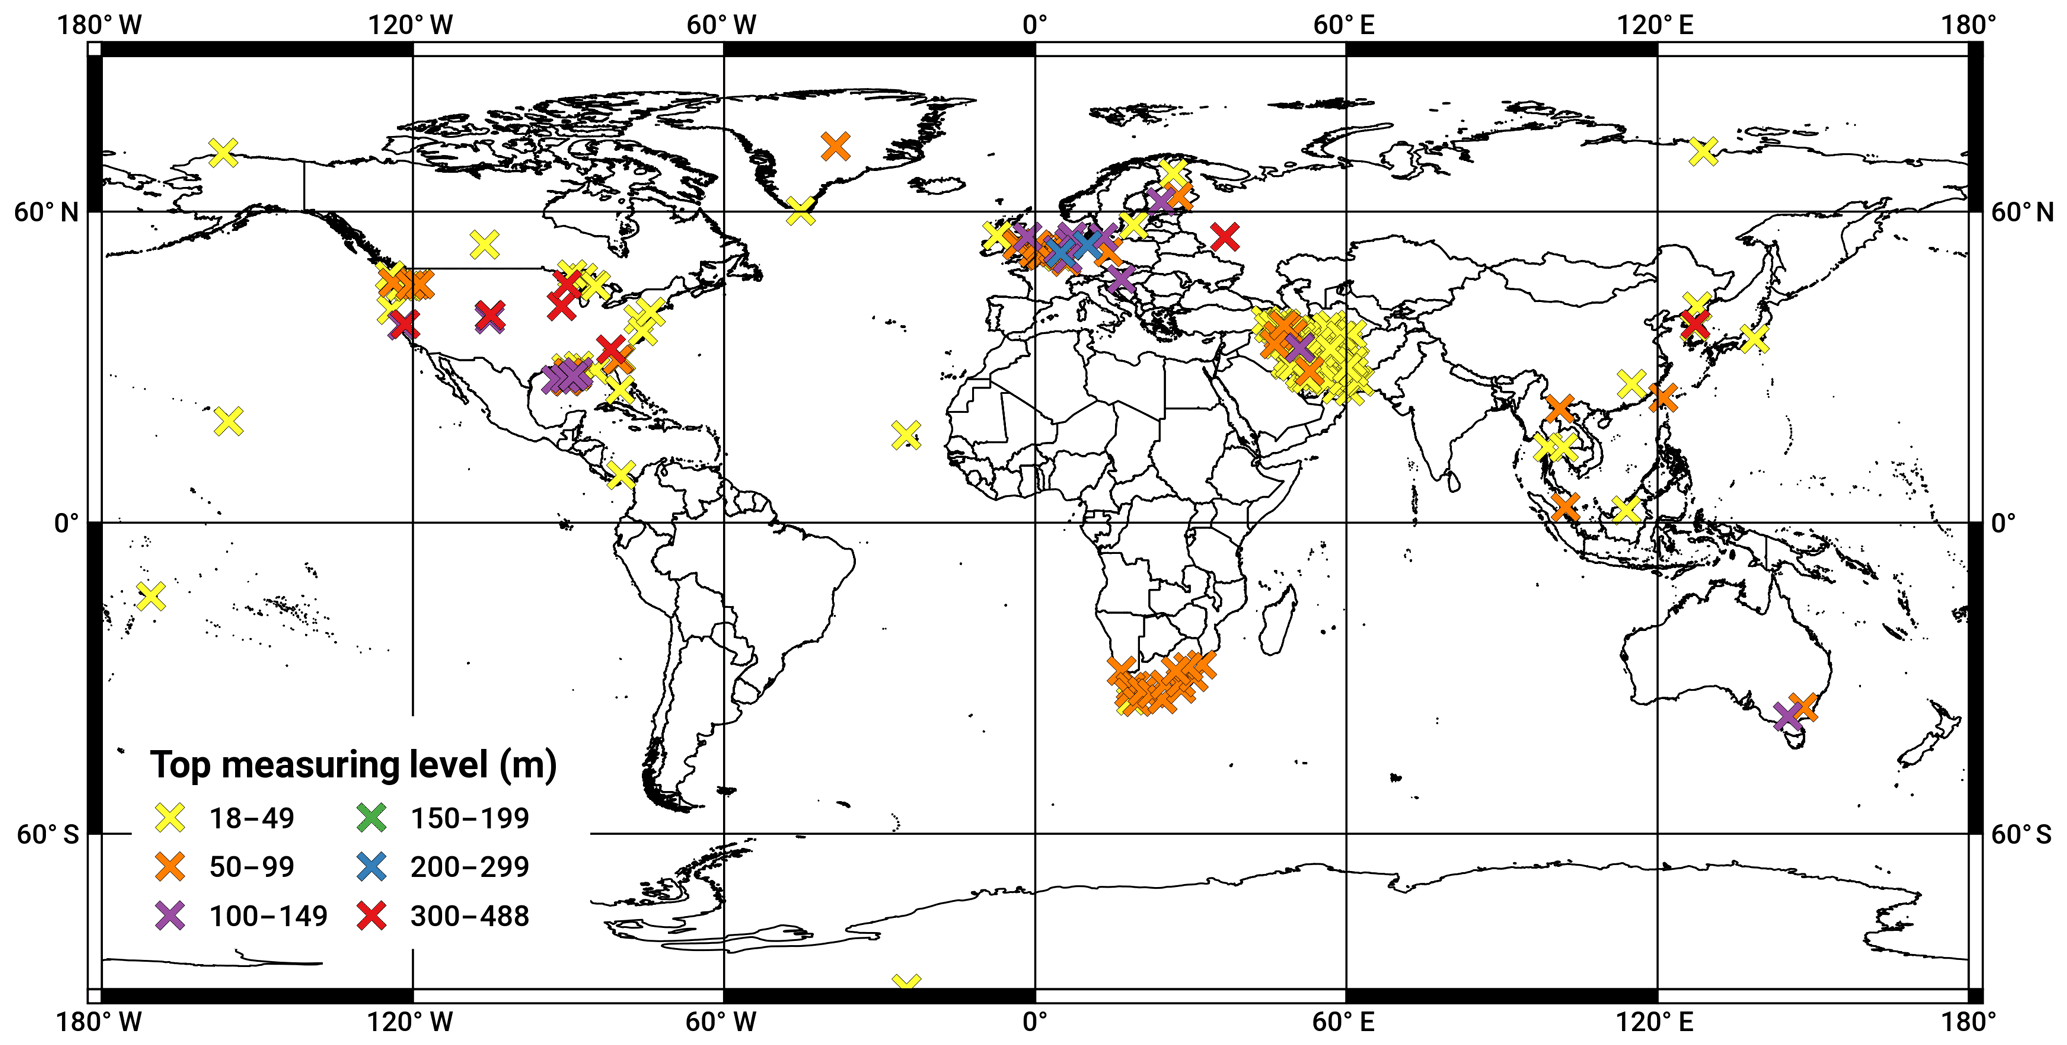
Figure 2Global distribution of the 222 tall tower locations within the Tall Tower Dataset. Colours indicate the top measuring level for each tower. Further information can be found in Sect. S1 of the Supplement.
The height above the surface where the top sensor is located for each tower is also depicted in Fig. 2. On the one hand, masts placed in historical observatories (i.e. often having more than 20 years of data) tend to be short, with heights ranging between 18 and 50 m above the ground and usually consisting of one measuring level at the top of the pole. Two examples are the American masts in Utqiaġvik (formerly known as Barrow) and Mauna Loa. On the other hand, modern towers often reach 100 to 200 m of altitude. Indeed, most of the masts in northern Europe have been installed during the last 15–20 years and are generally taller than 80 m, usually reaching 150 to 200 m. However, the tallest structures are located in the USA, reaching the exceptional height of 500 m, allowing the placement of sensors at that height. The top anemometer at Walnut Grove tall tower in California is at 488 m above ground level. The number of measuring levels in these masts is almost always higher than three, and up to eight in the case of the FINO met masts.
A list of the towers included in the Tall Tower Dataset, as well as their main characteristics such as the owner institution, country, geographic coordinates or specific recording periods, can be found in Sect. S1 of the Supplement. The record lengths and other structural features such as height or instrumentation are quite diverse as they depend on the purpose they were designed for. Most of the towers are typically installed to provide in situ observations for experimental field campaigns within the research or industry fields. In this case, the tall towers are commonly referred to as meteorological masts or met masts, and they represent up to the 87 % of all the tall towers in the dataset. However, other sensors are installed over marine platforms (11 %) or at the top of lighthouses (1 %) to monitor the coastal weather conditions. Finally, 1 % of the towers are instrumented communication transmitters that take meteorological measurements at several platforms along with the antenna. Concerning the location, almost 80 % of these tall towers are found inland while the other 20 % are placed offshore.
Information indicating the representative features mentioned above is included in the dataset within the corresponding site metadata, which have been standardized for all the sites. This material was sometimes confusing, sparse or even missing in the datasets distributed by the owner data centres, especially when it comes to the conventions in which the initial data were prepared. For example, if the time zone in which the time stamps were delivered was not specified, it could be challenging to discern whether they are provided in local time or Coordinated Universal Time (UTC). Another example concerns the data units, which were not explicitly stated in a few cases either. In both of these confusing situations, the data provider was contacted to confirm the original convention. Further information on the diverse standards in which the data were provided as well as the final conventions employed in the Tall Tower Dataset can be found in Ramon and Lledó (2019b).
The time span of the 222 time series is depicted in Fig. 3a. First, we split the series according to their time resolution, which varies from every 10 min to once per hour. Most of the series, i.e. a total of 172, provide 10 min averaged data, meeting the WMO standard (WMO, 2007) for estimating mean wind speeds. The other 50 masts report 15 min, 20 min, 30 min or hourly data. Information on how these averages have been taken is hardly ever available. The fact is that resulting aggregated values vary depending on whether averages are taken over the horizontal wind components or speed and direction modules independently. WMO (2007) does not prefer one option over the other, as it may depend on the application or available instrumentation. Even though the effects of this choice are rather small, especially for higher wind speeds, it represents an additional source of uncertainty for the values themselves.
The total coverage of the Tall Tower Dataset ranges from 1984 to 2017. While the 90 % of the series span less than 20 years, 3 % cover 30 or more years. The precise beginning and end of recording periods can be found in Sect. S1 of the Supplement for each tall tower. Nevertheless, several of these masts have been recently installed, and measurements are currently operational. Missing data periods – 12.1 % of the dataset – appear sometimes embedded within the series.

Figure 3(a) Time coverage of the 222 tall towers depending on whether they report 10 min data (top) or lower resolutions up to 1 h data (bottom) and (b) time evolution of the total number of observations within the Tall Tower Dataset for wind speed (green), wind direction (blue), temperature (red), relative humidity (orange) and pressure (purple).
Concerning the data retrieval process, the initial efforts focused on collecting the largest number of wind observations possible. Those records have been complemented with temperature, relative humidity and surface pressure data also measured at the different platforms along the tower. The time evolution of the number of these five variables is plotted in Fig. 3b. Most of the data fall within the 21st century, with a significant increase at the beginning of the millennium. Up to 2.7 million wind speed records have been retrieved for one single month, i.e. December 2015, which constitutes the month with the maximum amount of wind speed data. In the case of wind direction, the month with the highest number of records is October 2012 (2.1 million measurements). A decrease in the number of observations has been noticed from 2017 onwards. Generally, some of the data providers prefer to keep the most recent data and release them once measurements are preliminarily checked for gross errors. Temperature, relative humidity and pressure are not always available. We note that the fewest records correspond to barometric pressure, which is usually measured only at surface level (i.e. 2 m above ground level).
To ensure the high quality of tall tower wind data and guarantee the accuracy of any result derived from these records, a QC procedure needs to be carried out. The scientific literature has devoted efforts to QC wind data taken at surface stations (e.g. Dunn et al., 2012; Lucio-Eceiza et al., 2018a, b). However, no QC software has been specifically designed to tackle the same problem with tall tower observations, whose features vary considerably when compared to surface wind data (e.g. measurements are taken at higher altitudes, the spatial density of stations is considerably lower). Unique measuring techniques, such as the parallel measurements at different platforms along the mast or sensor redundancy at a given height, can also be taken into account to complement and enhance the typical QC.
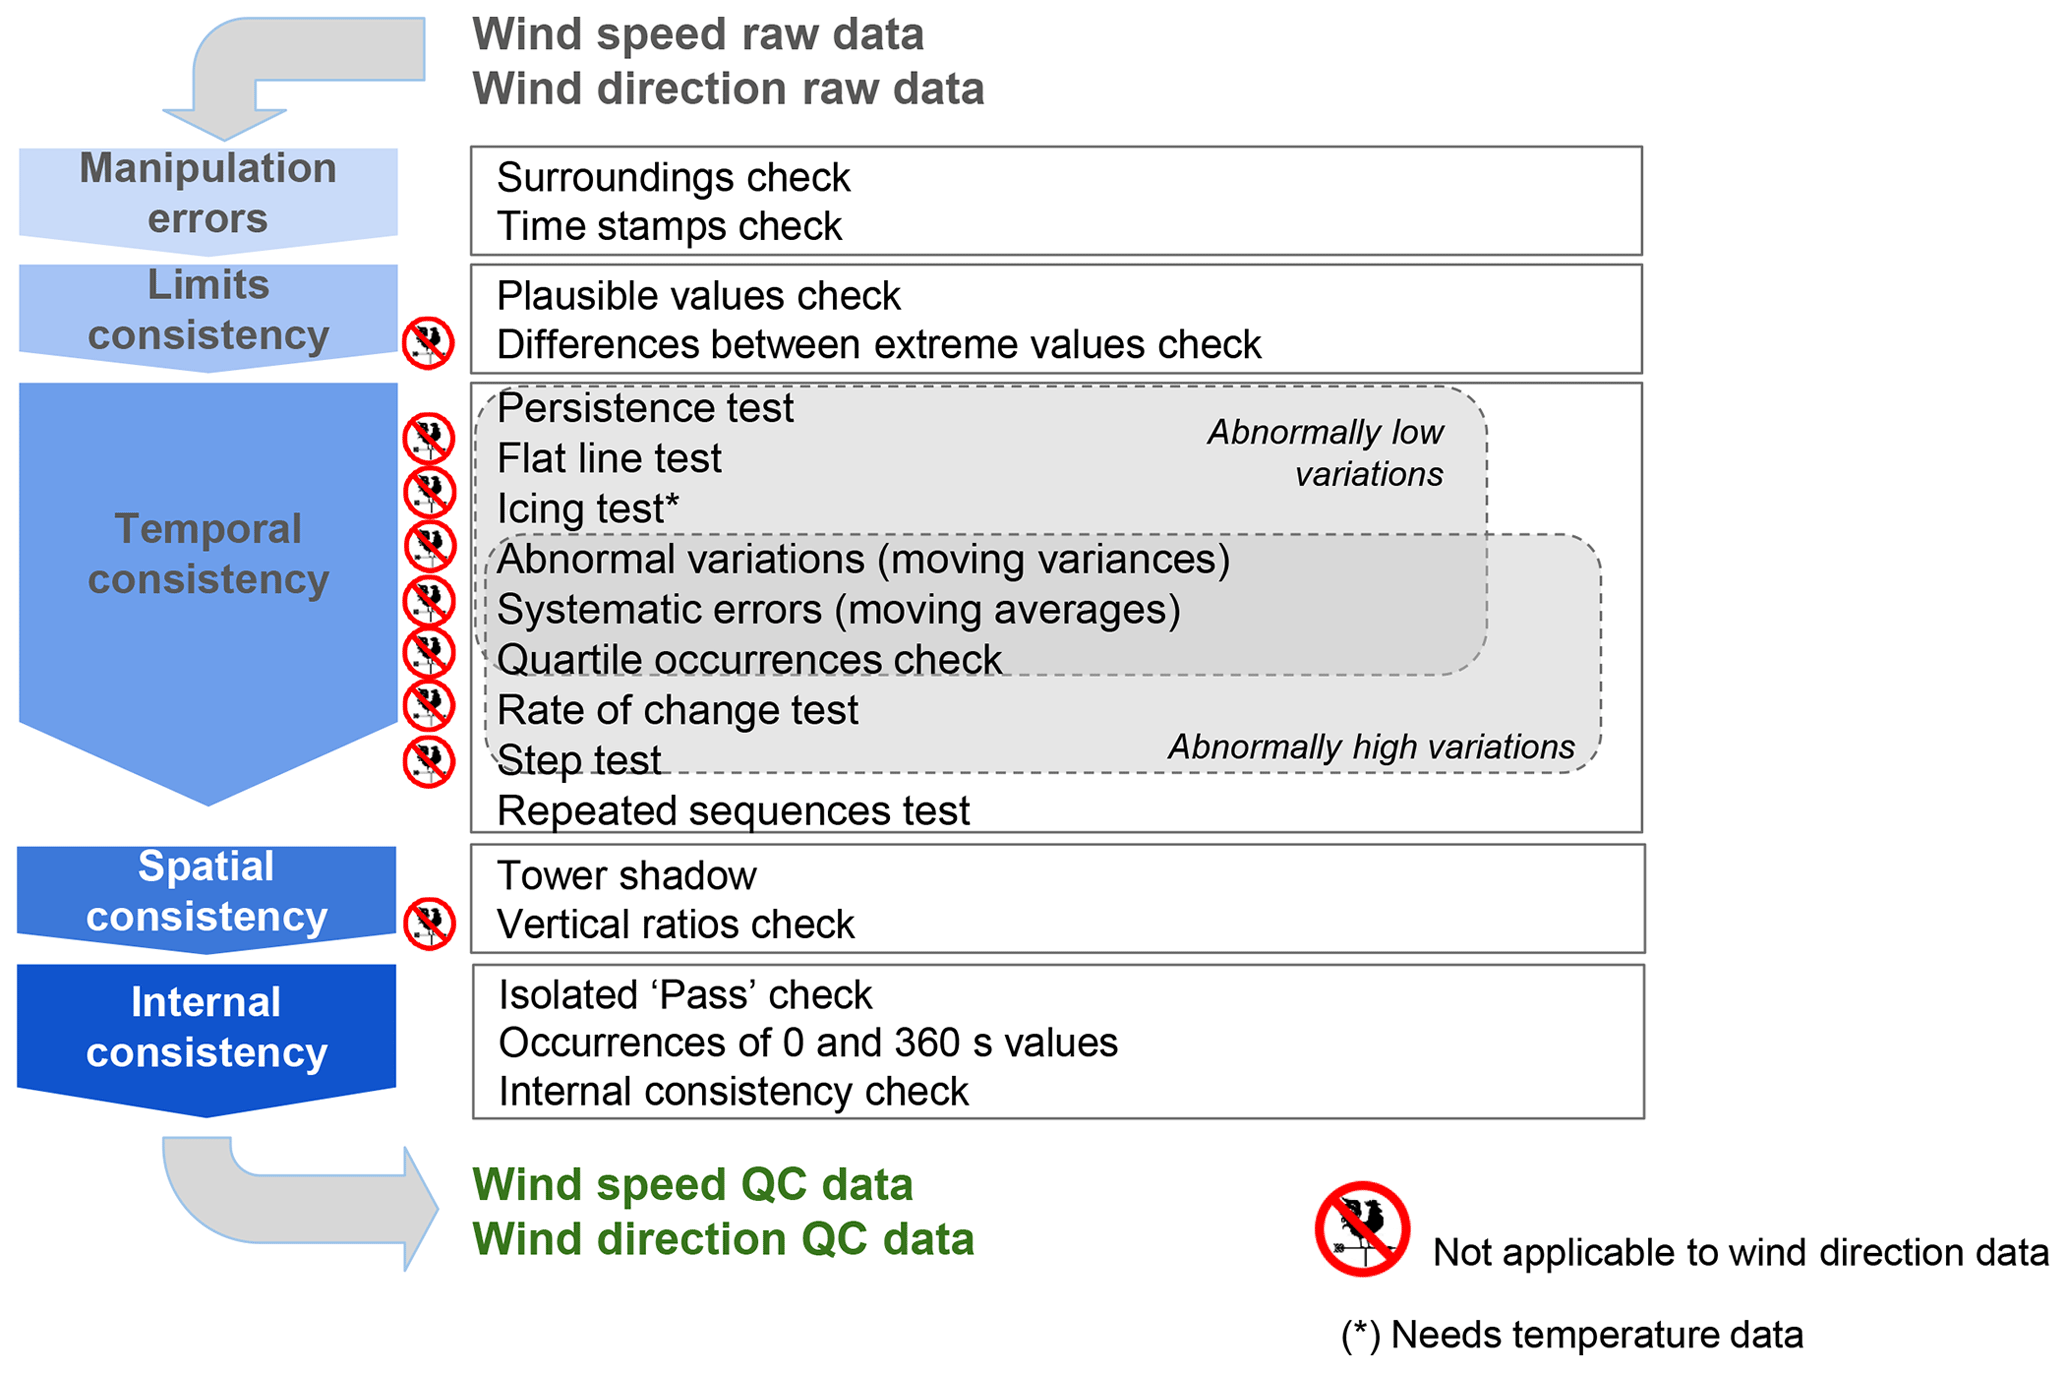
Figure 4Summary of the workflow of the QCSS4TT routines applied over wind data within the Tall Tower Dataset.
After a review process of the existing QC routines, a set of 18 sequential QC tests (two preliminary and 16 main tests) has been selected and designed to be performed over wind measurements. The Quality Control Software Suite for Tall Towers (QCSS4TT) designed here is applied to all the wind speed and wind direction data within the Tall Tower Dataset, regardless of whether they were previously quality controlled or not by the providing institution. A general description of the QCSS4TT is presented below in this section. The software is fully described in Sect. S2 in the Supplement.
The QC tests within the QCSS4TT are all intra-station checks, as they do not compare series from nearby tall towers. QC routines ingest entire time series of winds at a specific heights, whose time frequencies vary between 10 min and 1 h. The recommended sequence for the application of the QC tests is presented in Fig. 4. Checks are grouped in five categories depending on the purpose they were designed for. The two preliminary checks are designed to detect gross manipulation errors. Then, the 16 main QC tests ensure the limits, spatio-temporal and internal consistency of the wind speed and wind direction time series. We note that the routines can be run independently, with the exception of the quartile occurrences and isolated pass tests which feed on the output of other tests within the QCSS4TT. After deciding the appropriate order, the tests have been applied over the Tall Tower Dataset according to the flux diagram in Fig. 4.
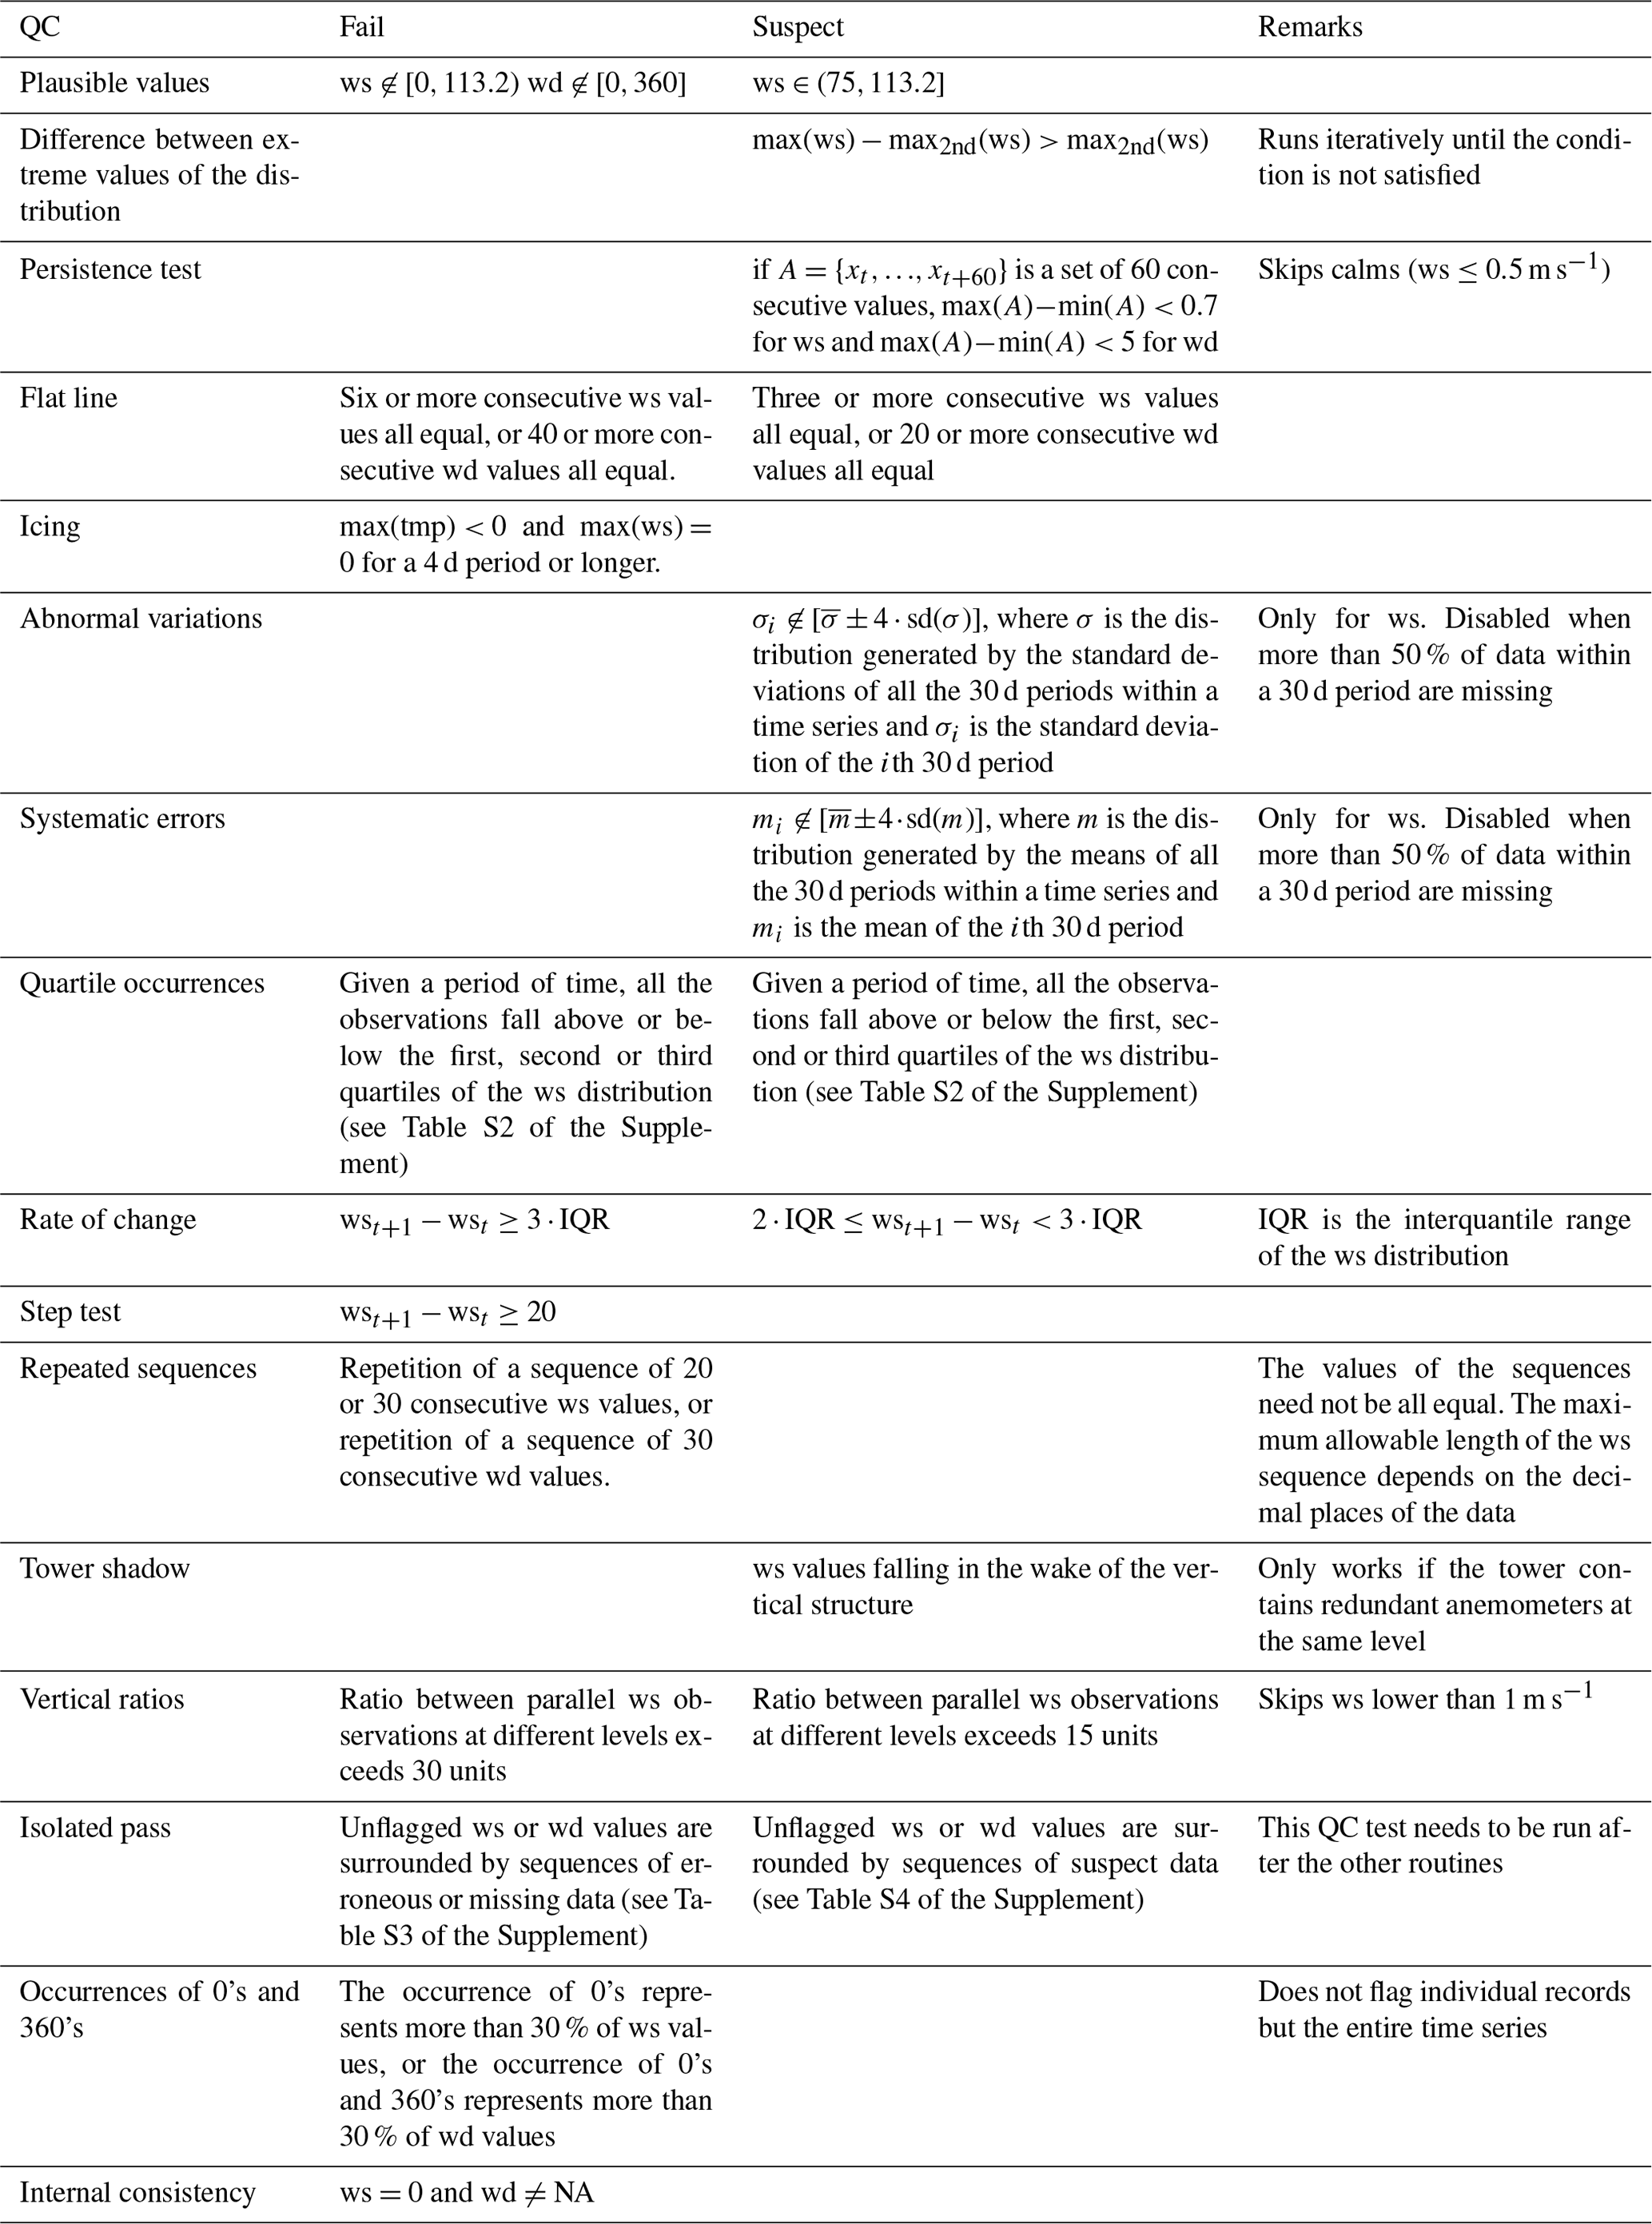
Table 1Main QC tests summary. The abbreviations ws, wd and tmp stand for wind speed (in metres per second), wind direction (in meteorological degrees) and temperature (in degrees Celsius), respectively. The reader is referred to Sect. S2 in the Supplement for detailed information on each of the tests.
The QCSS4TT starts with two preliminary tests. Firstly, the time stamp check is carried out during the data formatting process and ensures that all the time stamps are included in the dataset and equally sampled according to the tower reporting frequency. Those time stamps that are either duplicated or wrongly spaced have been discarded, and those missing have been included, setting the corresponding record to “not available” (NA). Secondly, the surroundings check is performed by detecting nearby elements that could potentially perturb the wind flow and then produce unreal records. To do so, detailed descriptions of the encircling area of the mast as well as its possible changes over time are required.
Then, the 16 main QC tests follow. A summary can be found in Table 1 and complete information can be found in Sect. S2 in the Supplement. Most of them are standard checks typically performed over wind and other Essential Climate Variables such as temperature or precipitation. However, we propose two new QC tests (the so-called tower shadow and vertical ratios checks, respectively) here to guarantee the spatial consistency of the data by considering the special characteristics of the tall tower measurements since classic inter-station comparisons appear challenging due to poor spatial density of sites.
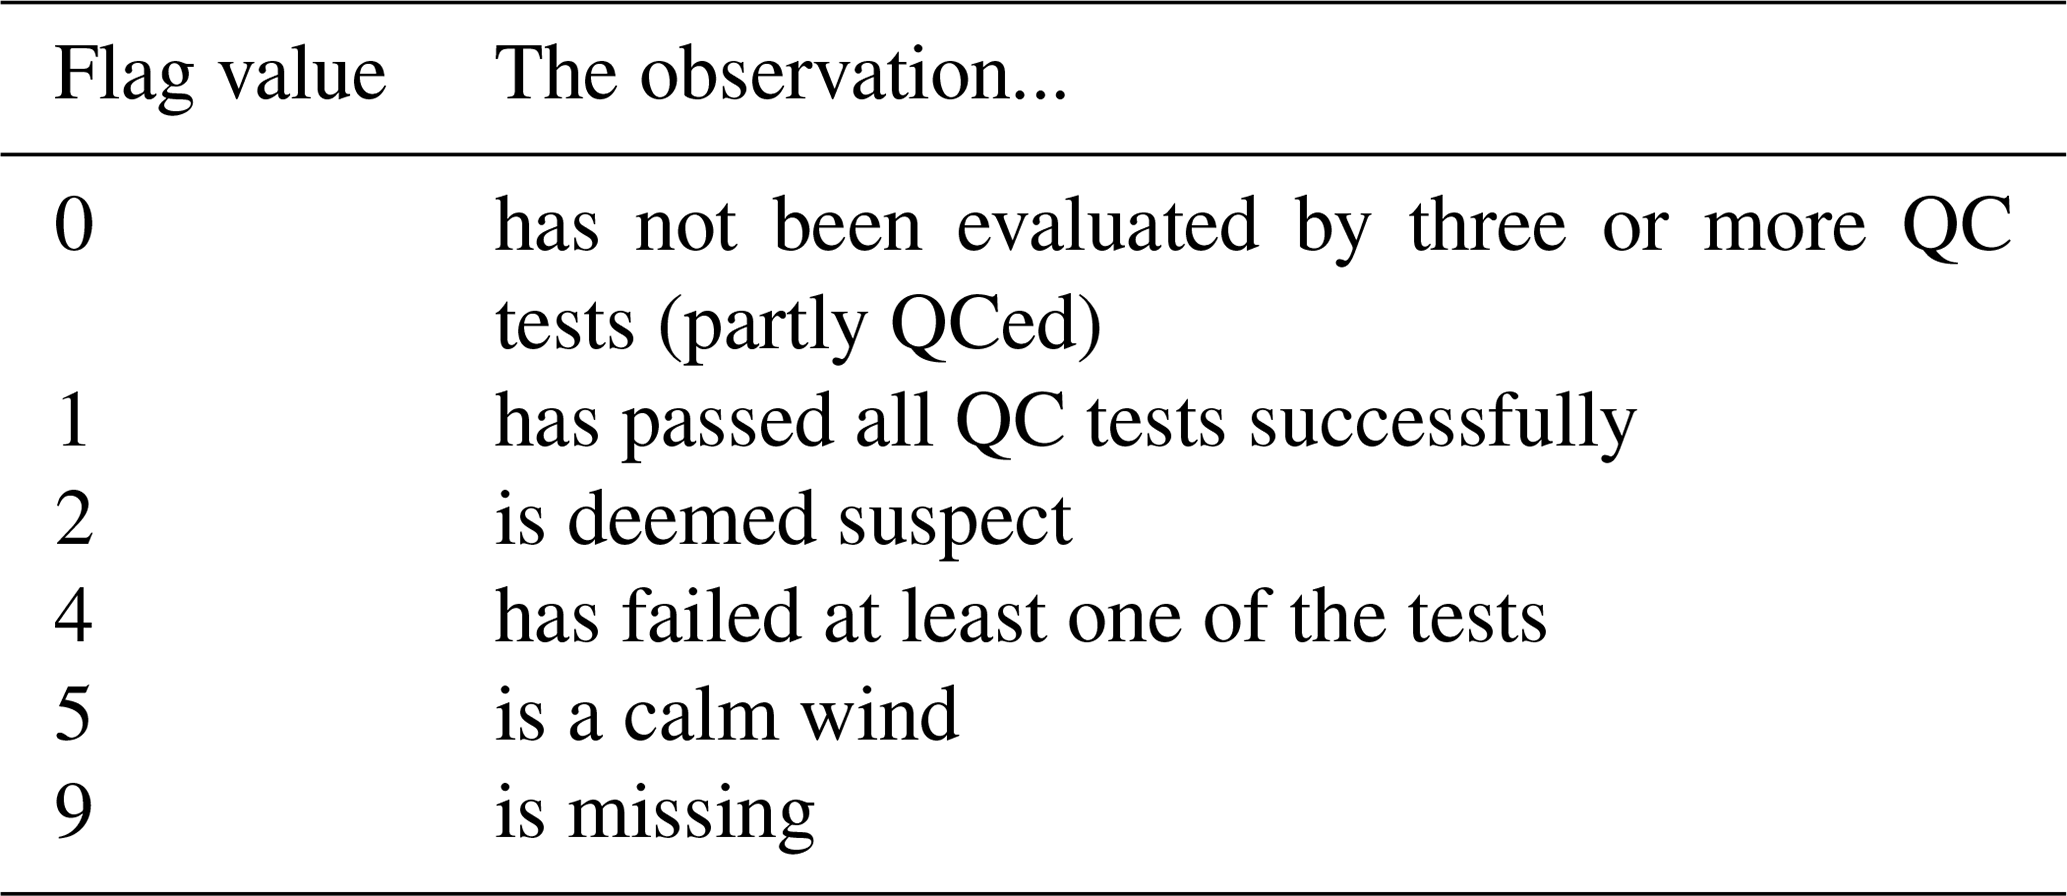
After running the QCSS4TT, a natural number (hereafter referred to as QC flag or flag; see Table 2) is attached to each observation according to its nature and/or level of confidence. To decide which flag should be assigned to each observation, different threshold values have been set for each of the QC routines. The threshold selection has been based on the World Meteorological Organization (WMO) standards (WMO, 2007; Aguilar et al., 2003), QC software manuals (IOSS, 2017) or state-of-the-art bibliography (e.g. Jiménez et al., 2010). Many of these standards, if not all, have been developed specifically for surface winds (i.e. 10 m winds), whose features vary importantly when compared with winds observed at higher altitudes, such as those from the present work. After a preliminary test of the thresholds over the wind data within the Tall Tower Dataset, it was noted that some tests considerably overestimated the amount of erroneous data (also known as Type I errors; see Hubbard et al., 2004). The WMO allows adjustment of some of the fixed-value limits proposed in the WMO (2007) to reflect singular climate conditions more accurately. As the QCSS4TT aims to clean data from towers located all over the world regardless of the prevailing climate conditions in the area, thresholds need to be adjusted manually to not deem wrong the general and particular climate features observed in a wide variety of world climates. It is also vital to take into account that this sensitive experiment should reduce the number of Type I errors without increasing the number of invalid data that have been accepted by the tests (also referred to as Type II errors).
Based on these thresholds and the nature of the individual wind records, six different categories have been defined (Table 2), and each datum is flagged appropriately. The quality of a record is inferred automatically by checking if it passes all the tests successfully (flagged as “1”), passes the tests but might need further checks such as a visual inspection (hereafter referred to as suspect and marked as “2”) or fails at least one of the tests (flagged as “4”). When an observation is not considered suspect or wrong by any of the QC tests, additional levels may indicate that the observation was not evaluated by three or more tests (indicated as “0”) or corresponds to a calm period (“5”). Finally, missing values are flagged uniformly (categorized as “9”).
Wind records flagged as “4” are deemed to be erroneous data and thus unreliable. They have been removed by changing the original record to NA. Suspect data as well as those observations that have not been evaluated by all the QC tests remain unaltered because they might be potentially correct and usable for some applications. But in case the user prefers to impose their own level of restriction, we also include the raw data jointly with the flag values resulting from the quality controlling. Therefore, the data user is able to filter the raw data based on the flag values. Still in those cases, we strongly discourage the usage of data marked as erroneous (“4”).
The QCSS4TT has been applied sequentially over the Tall Tower Dataset according to the flux diagram in Fig. 4. We present here the global results obtained from the quality controlling of the Tall Tower Dataset, as well as a summary of the performance of the main tests.
As stated in Sect. 3, the surroundings check needs detailed original metadata of the tower location. Unfortunately, this valuable information is not always available so the surroundings check cannot be carried out over all the tower sites. The unique case when this QC test confirms that a series of wind speeds were disturbed by the surrounding forest occurs at Wallaby Creek met mast. After running the main QC routines, long sequences of wind speeds measured at the lowermost level of this met mast – placed at 10 m above surface – have been flagged as wrong. A close look at the site metadata reveals that the canopy well exceeds the 10 m height during the whole recording period, considerably reducing the observed wind speeds. Hence, all the individual observations of the Wallaby Creek 10 m wind series have to be used with caution, even those that have not been considered problematic by other tests.
Then, the main QC routines have examined each of the 240 371 908 wind speed and wind direction values individually in the Tall Tower Dataset and flagged them accordingly. After this process, 228 780 679 values (95.2 % of the total data) passed successfully all the checks and can be considered reliable. Conversely, 6 827 880 observations (2.8 %) have been considered erroneous by at least one of the QC tests. They have been replaced by NA, increasing the total number of missing data from 12.1 % to 14.6 %. A total of 1.8 % of the dataset is flagged as suspect. Some of the QC tests, particularly those that compute period-aggregated statistics such as moving averages or variances, require a minimum amount of data. Due to this constraint, 0.2 % of the data have not been evaluated by three or more QC tests to avoid the computation of such statistics with reduced sample sizes. Records identified as calm (i.e. wind speeds under 0.5 m s−1) have also been skipped on purpose by a small group of tests, i.e. those that compute quotients between pairs of simultaneous observations. However, calm wind records can be trusted as they successfully passed all the other QC checks. The percentage of calm wind values is highly dependent on the geographical location of the tall tower. Met masts located in Southeast Asia contain the largest percentage of calm wind records, reaching up to 24 % of the total data.
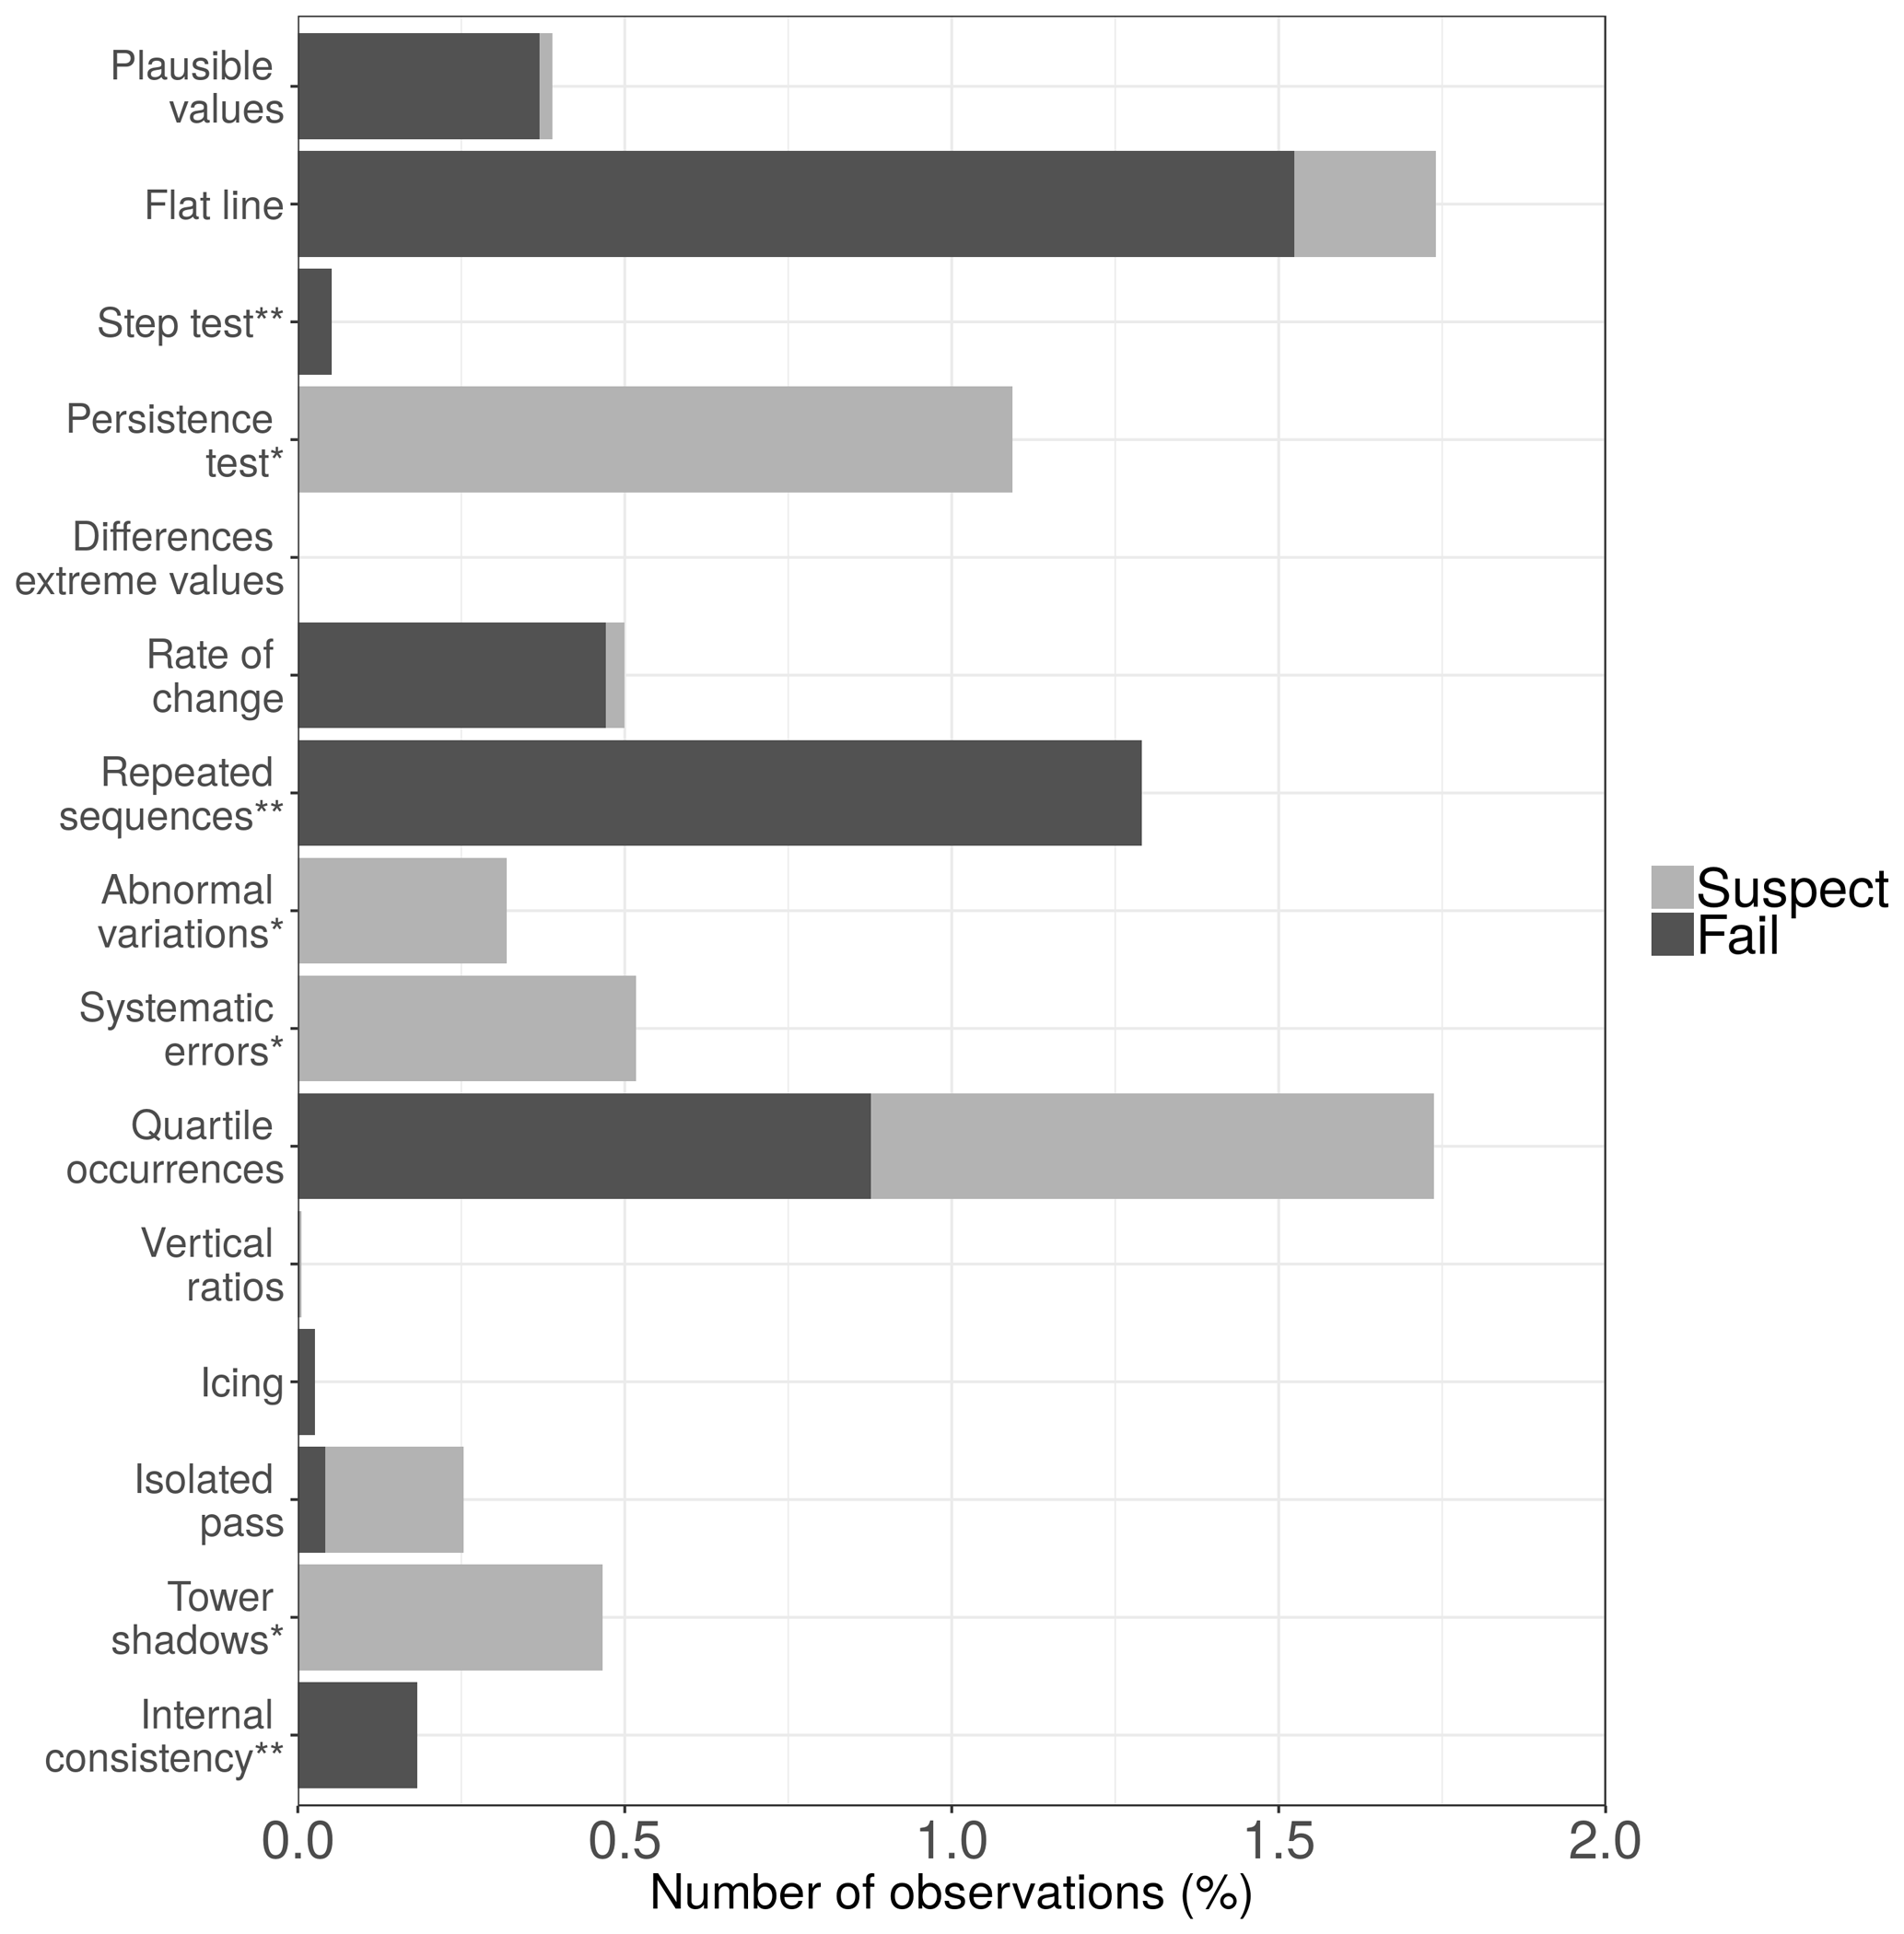
Figure 5Percentage of data flagged as “fail” (dark) and “suspect” (light) by 15 of the main QC tests within the QCSS4TT. Asterisk (*) indicates that the QC test only flags data as suspect. Double asterisk (**) denotes that the QC test only flags data as erroneous.
The amount of data flagged by each test is considerably different, as can be noticed in Fig. 5, which depicts the percentage of data flagged as erroneous and suspect by the main QC tests. We note that both the flat line and quartile occurrences checks have flagged the largest amount of data (1.74 %). The former detected the most substantial amount of erroneous data (1.52 %), followed by the repeated sequences and quartile occurrences tests (1.29 % and 0.88 %, respectively). The vertical ratios check has detected very few erroneous or suspect records, and the difference of extreme values test has flagged no data. The occurrences of 0 and 360 values tests is not included in Fig. 5 since this test does not flag individual records but the entire time series according to their quality. Results for this QC show that no wrong or suspicious time series have been detected after the inspection of the frequency of appearance of null wind speeds and 0 and 360 wind direction values.
The performance of the QCSS4TT needs to be assessed. Here, a benchmark experiment has been specifically designed to test the ability of the QCSS4TT in detecting wrong values. In the following, the preparation of the experiment and its results are described.
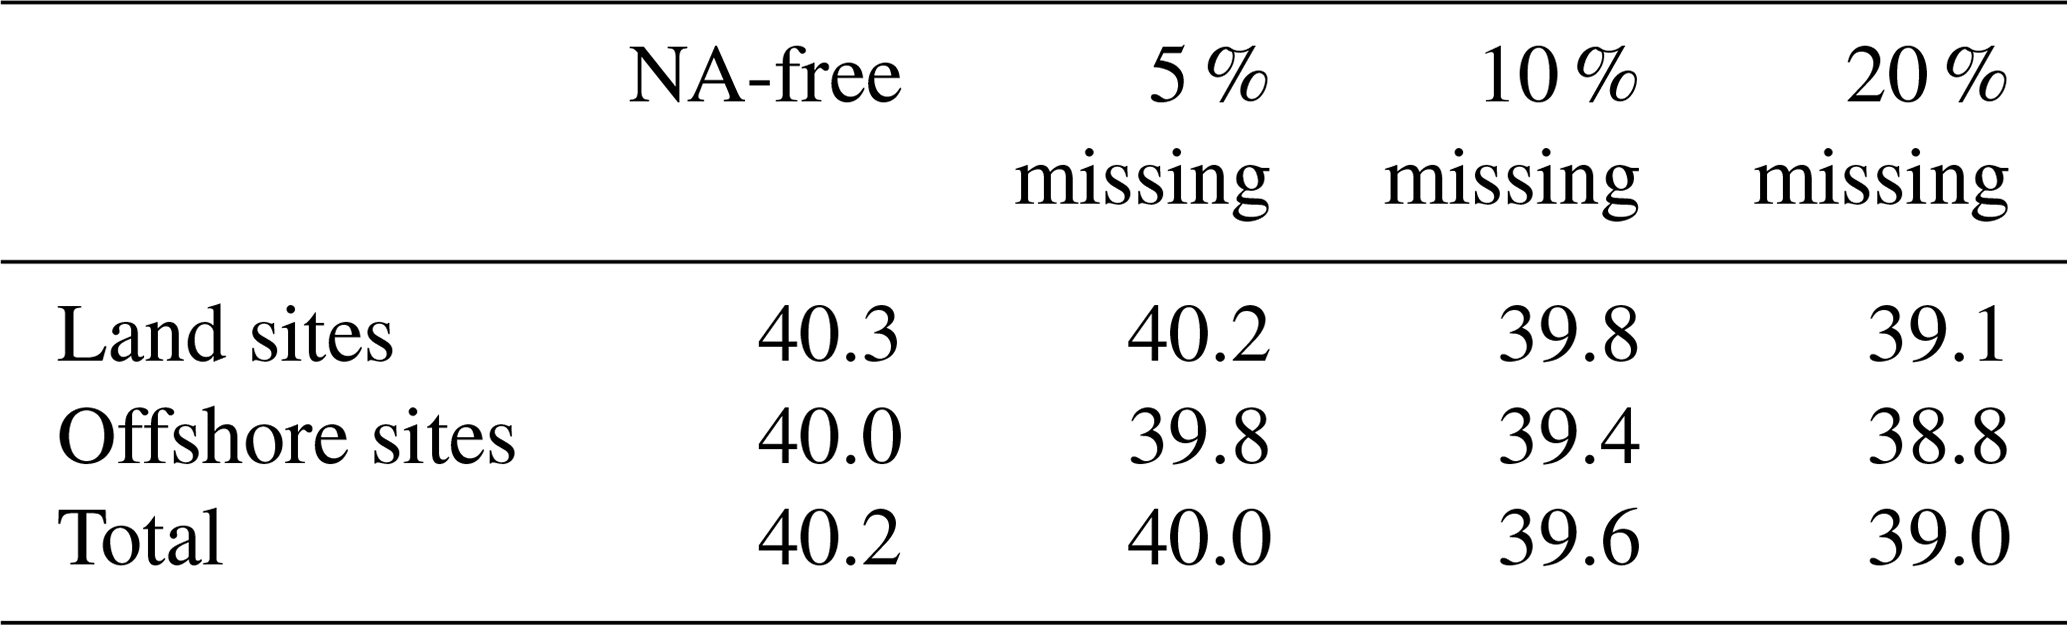
Table 3Percentage of the detected errors (%) depending on the proportion of data that were set to missing. The percentages of missing data are approximately 20 %, 10 %, 5 % and 0 % (NA-free). The table differentiates between land and offshore locations.
The setup of the experiment consists of generating a set of presumably QC-free time series where a set of errors will be purposely introduced later on. The time series have been extracted at 50 randomly selected points from the ERA5 reanalysis (Copernicus Climate Change Service (C3S), 2017) global grid at hourly frequency, thus meeting the requirements of the QCSS4TT concerning the time resolution. These time series span the 10-year period from 2007 to the end of 2016, which constitutes the time range with the largest number of records within the Tall Tower Dataset (Fig. 3b). To better emulate the features of the tall tower data, we retrieve two parallel series at each of the 50 points. These wind speeds are those provided at 10 and 100 m, respectively.
The set of 50 series is replicated fourfold. Three of these four groups of series are firstly modified by introducing missing data at random, either by erasing data individually or removing sequences of records. The percentages of missing data in these series are approximately 5 %, 10 % and 20 %. The introduction of missing records emulates the frequently observed sporadic sensor failures and no data periods within the wind speed series. Finally, the remaining group of series is left with no datum set to missing.

Figure 6Percentage of detection of seeded errors as a function of the magnitude of the random number r.
The error “seeding” process is carried out following the methodology in Hubbard et al. (2004), where the performance of a set of basic QC tests for temperature and precipitation data is assessed. In this publication, a subset of 2 % of the total data is selected to be modified by introducing an error of magnitude:
where σx is the standard deviation of the time series x and ri is a randomly selected number generated using a uniform distribution ranging from −3.5 to +3.5 specifically for the ith observation. Once the errors are inserted, the QCSS4TT is executed.
Table 3 summarizes the differences in the error detection depending on whether missing data are introduced or not into the wind series for both continental and oceanic locations. It is worth noting that the QCSS4TT shows a slight sensitivity to missing data, reducing the percentage of detected errors when the percentage of missing records increases. This decrease might be attributed to the fact that some QC tests are deactivated when a period with very sparse data is encountered. No important differences are noted between onshore and offshore sites, as the percentages of identified errors are quite similar. Results that follow in this section are presented for the set of series containing approximately 10 % of missing data, which is close to the average of absent records within the Tall Tower Dataset (12.5 %).
The QCSS4TT has detected on average nearly 40 % of all the seeded errors (see Table 3). Indeed, this result is at the average of the percentage of detection observed for precipitation data in Hubbard et al. (2004), which was 30 %–40 % for complex terrain sites and 40 %–50 % for the other locations.
At this stage of the experiment, it is important to study the role of the random number r, and particularly its magnitude, which subsequently influences the size of the error E. Values of r close to zero will introduce smaller errors, which will be less likely to be caught by any of the QC checks. Figure 6 presents the percentage of detection as a function of the r values, which have been grouped in intervals of 0.5 units. We note that the QC tests detect most of the biggest errors. However, the percentage of detection decreases as the magnitude of r does, as we expected. Thus, the smallest errors are usually skipped by all the QC tests. Indeed, this result mirrors the conservative philosophy employed in the threshold selection of the checks.
Finally, it has been observed that Type I errors have been made in 8 % of the total data, corresponding mainly to suspect flagging.
Records from 181 out of the 222 tall towers within the Tall Tower Dataset (Ramon and Lledó, 2019a) are publicly accessible through the following EUDAT repository: https://doi.org/10.23728/b2share.136ecdeee31a45a7906a773095656ddb. Data from the other 41 tall towers are not directly provided for download within the Tall Tower Dataset but can be downloaded from specific tower websites (mostly after registration). Links to all the 222 tall tower original sources are provided in a data catalogue website at http://talltowers.bsc.es (last access: February 2020), which also facilitates browsing the Tall Tower Dataset and visualizing the main climatic features of all the data.
The QCSS4TT code as well as an explanatory vignette on how to use it is also available via GitLab at: https://earth.bsc.es/gitlab/jramon/INDECIS-QCSS4TT (Ramon and Lledó, 2019c).
Hub-height wind data are vital to assess the local wind flow features at heights ranging from 20 to 120 m, where wind turbines are located. Nonetheless, the wind industry is not the only user of these observations; the research academy is also interested in retrieving hub-height winds for their studies such as PBL experiments or the verification of climate products. Unfortunately, these non-standard climate data appear sparsely, and the lack of standardized formats, quality and metadata jeopardizes their further usage. This is the first time efforts were devoted to gathering the most substantial possible amount of existing data measured at tall towers around the world and perform an exhaustive QC assessment to eventually make them publicly available for non-commercial purposes in a standard format and access point.
Wind speed, wind direction, temperature, pressure and relative humidity observations measured at different heights on 222 tall towers – owned mainly by public institutions such as universities, meteorological weather services or research centres – have been retrieved from sparse archives, compiled in a unique collection, quality controlled – in the case of wind speed and wind direction data – and released under the name of the Tall Tower Dataset. Data from of 181 of these sites are stored in the EUDAT data repository and can be publicly accessed. Records from the other 41 towers are not available there since the authors of the Tall Tower Dataset do not own the observations and the data providers do not grant rights to share with third parties. Although some initiatives such as the Climate Data Store (https://cds.climate.copernicus.eu/, last access: February 2020) are starting to boost the free utilization of climate observations, there is still some reluctance, mainly in Europe, to contribute to open initiatives that include data in public external archives, thus hindering their further usage.
To guarantee the reliability of the wind measurements, a QC software suite has been designed and applied over the Tall Tower Dataset, and the erroneous data have been removed. Some of the QC functions are coded to deal simultaneously with huge amounts of data so that the computation costs may be high, especially when considering high-resolution data. After the application of the QCSS4TT, the vast majority of the dataset (i.e, the 95.2 % of the wind data) passed all the tests successfully.
A benchmark experiment based on Hubbard et al. (2004) has been designed to assess the efficacy of the QCSS4TT in detecting wrong wind speed data. The exercise is based on the detection of a set of seeded errors introduced in 100 wind hourly time series at 50 randomly selected locations obtained using the ERA5 reanalysis. On average, 40 % of these seeded errors have been identified, even though the magnitude of the error is sometimes close to zero and therefore difficult to detect. This result agrees with those obtained by the previously mentioned publication, thus assuring the reliability of the QCSS4TT results. We do not perform any analogue experiment for wind direction data since the nature of these data requires a more complex exercise.
Even though some tall towers have been decommissioned recently due to several different reasons, most of the locations within the Tall Tower Dataset continue taking measurements that could be added to the collection in the near future. In addition, the authors of this work are open to receive useful input on new tower locations not included in Sect. S1 of the Supplement and whose data could be potentially added to the Tall Tower Dataset in future updates. Enlarging the collection of these non-standard climate data and increasing the density of stations may allow, for instance, further quality checks by means of inter-station comparisons with nearby tall towers.
The supplement related to this article is available online at: https://doi.org/10.5194/essd-12-429-2020-supplement.
JR retrieved and formatted the tall tower data, produced the QCSS4TT code and carried out the benchmark experiment. He also wrote the first draft of this manuscript. This work has been done under the supervision of LL, who conceived the research, gave advice on the data collection, and assisted JR in several IT issues and code debugging. NPZ came up with the design of the benchmark experiment as well as some of the graphics to visualize the results. AS and FJDR also supervised this work and facilitated the retrieval of data. All authors contributed to the analysis of the results and to the writing and editing of the paper.
The authors declare that they have no conflict of interest.
The Tall Tower Dataset is made available in good faith to be used for non-commercial purposes. In no event will the authors be liable to any user or third party for any damage or loss resulting from any use or misuse of these data.
Authors acknowledge the funding support from INDECIS co-funded by the H2020 ERA-net ERA4CS (GA 690462) and the MICINN grant BES-2017-082216 (“Ayudas para contratos predoctorales”). Exceptional thanks are given to Enric Aguilar for his useful advice on the QC production. The authors are grateful to Marina Conde, Isadora Jiménez, Pierre-Antoine Bretonnière and Javier Vegas for their technical support at different stages of this work. We also acknowledge the ECMWF ERA5 reanalysis production centre.
Finally, the authors would like to acknowledge all the principal investigators and owner institutions of the 222 tall towers within the Tall Tower Dataset for sharing their valuable climate data. We thank the National Data Buoy Center (NDBC), the Earth System Research Laboratory (ESRL) and the Physical Monitoring Program of the Smithsonian Tropical Research Institute (STRI). Special thanks are given to all the contributors to the national mast database by the Renewable Energy and Energy Efficiency Organization in Iran. NCAR/EOL provided BERMS Aspen data under the sponsorship of the National Science Foundation. We are grateful to Jinkyu Hong and Young-San Park (Korea Meteorological Administration) for facilitating Boseong mast data retrieval. Authors would like to thank the Bonneville Power Administration (BPA), the CESAR observatory and Fred Bosveld (KNMI) for providing Cabauw data, the South Africa Weather Service (SAWS), the Wind Atlas for South Africa project (WASA) and the United Kingdom Met Office (UKMO). Many thanks to Lena Kozlova (University of Exeter) for sharing Cabo Verde tall tower data. We acknowledge to The Crown Estate, the BMWi (Bundesministerium für Wirtschaft und Energie, Federal Ministry for Economic Affairs and Energy), the PTJ (Projektträger Jülich, project executing organization), the data contributors to the AsiaFlux database, Ingo Lange (University of Hamburg), Laszlo Haszpra (Hungarian Met Service), Jan Schween (University of Cologne) and Frank Beyrich (Deutscher Wetterdienst) for facilitating acquisition of University of Hamburg, Hegyhátsál, Jülich and Lindenberg mast data, respectively. We also acknowledge Rolf Neubert (University of Groningen), Met Éireann, the NREL National Wind Technology Center (NWTC, Jager and Andreas, 1996), Anna Rutgersson (Uppsala University), Gil Bohrer (The Ohio State University), and the NoordzeeWind B.V. (NZWBV) and its (sub)contractors. Thanks are also given to Ole Ziemer (Nukissiorfiit Hovedkontoret) for providing data and Kurt S. Hansen (DTU) for putting us in contact with the data providers. Park Falls tower data (Davis et al., 2003) was provided by AmeriFlux, whose funding was provided by the U.S. Department of Energy's Office of Science. Thanks are given to the FLUXNET community, who provided valuable data from different masts, and also to Christy Schultz (GMD Met – NOAA) for allowing us access to South Pole mast data. Credit is also given to the sources of the Tumbarumba met mast data and the Vielsalm data manager Anne de Ligne and data provider Tanguy Manise.
This research has been supported by the H2020 ERA-net ERA4CS (grant no. 690462).
This paper was edited by Kirsten Elger and reviewed by two anonymous referees.
Aguilar, E., Auer, I., Brunet, M., Peterson, T. C., and Wieringa, J.: Guidelines on climate metadata and homogenization, World Meteorological Organization, p. 55, 2003. a
AWEA: AWEA US Wind Industry Annual Market Report Year Ending 2018, Tech. rep., AWEA, 2019. a
Baker, I., Denning, A. S., Hanan, N., Prihodko, L., Uliasz, M., Vidale, P. L., Davis, K., and Bakwin, P.: Simulated and observed fluxes of sensible and latent heat and CO2 at the WLEF-TV tower using SiB2.5, Glob. Change Biol., 9, 1262–1277, https://doi.org/10.1046/j.1365-2486.2003.00671.x, 2003. a
Brower, M. C., Barton, M. S., Lledó, L., and Dubois, J.: A study of wind speed variability using global reanalysis data, Tech. Rep. May 2013, AWS True Power, available at: https://www.awstruepower.com/assets/A-Study-of-Wind-Speed-Variability-Using-Global-Reanalysis-Data.pdf (last access: February 2020), 2013. a
Copernicus Climate Change Service (C3S): ERA5: Fifth generation of ECMWF atmospheric reanalyses of the global climate, Copernicus Climate Change Service Climate Data Store (CDS), Tech. rep., ECMWF, 2017. a
Davis, K., Bakwin, P. S., Yi, C., Berger, B. W., Zhaos, C., Teclaw, R. M., and Isebrands, J. G.: The annual cycles of CO2 and H2O exchange over a northern mixed forest as observed from a very tall tower, Glob. Change Biol., 115, 1278–1293, https://doi.org/10.1029/2009JD012832, 2003. a
Decker, M., Brunke, M. A., Wang, Z., Sakaguchi, K., Zeng, X., and Bosilovich, M. G.: Evaluation of the reanalysis products from GSFC, NCEP, and ECMWF using flux tower observations, J. Climate, 25, 1916–1944, https://doi.org/10.1175/JCLI-D-11-00004.1, 2012. a
Dunn, R. J. H., Willett, K. M., Thorne, P. W., Woolley, E. V., Durre, I., Dai, A., Parker, D. E., and Vose, R. S.: HadISD: a quality-controlled global synoptic report database for selected variables at long-term stations from 1973–2011, Clim. Past, 8, 1649–1679, https://doi.org/10.5194/cp-8-1649-2012, 2012. a, b
Fernando, H., Mann, J., Palma, J., Lundquist, J., Barthelmie, R., BeloPereira, M., Brown, W., Chow, F., Gerz, T., Hocut, C., Klein, P., Leo, L., Matos, J., Oncley, S., Pryor, S., Bariteau, L., Bell, T., Bodini, N., Carney, M., Courtney, M., Creegan, E., Dimitrova, R., Gomes, S., Hagen, M., Hyde, J., Kigle, S., Krishnamurthy, R., Lopes, J., Mazzaro, L., Neher, J., Menke, R., Murphy, P., Oswald, L., Otarola-Bustos, S., Pattantyus, A., Rodrigues, C. V., Schady, A., Sirin, N., Spuler, S., Svensson, E., Tomaszewski, J., Turner, D., van Veen, L., Vasiljević, N., Vassallo, D., Voss, S., Wildmann, N., and Wang, Y.: The Perdigão: Peering into Microscale Details of Mountain Winds, B. Am. Meteorol. Soc., 100, 799–820, https://doi.org/10.1175/bams-d-17-0227.1, 2018. a
Hansen, K. S., Barthelmie, R. J., Jensen, L. E., and Sommer, A.: The impact of turbulence intensity and atmospheric stability on power deficits due to wind turbine wakes at Horns Rev wind farm, Wind Energ., 15, 183–196, https://doi.org/10.1002/we.512, 2012. a
Hubbard, K. G., Goddard, S., Sorensen, W. D., Wells, N., and Osugi, T. T.: Performance of quality assurance procedures for an applied climate information system, J. Atmos. Ocean. Technol., 22, 105–112, https://doi.org/10.1175/JTECH-1657.1, 2004. a, b, c, d
IOSS: Manual for Real-Time Quality Control of Wind Data, May, 2017. a
Jager, D. and Andreas, A.: NREL National Wind Technology Center (NWTC): M2 Tower; Boulder, Colorado (Data); NREL Report No. DA-5500-56489., Tech. rep., National Renewable Energy Laboratory, https://doi.org/10.5439/1052222, 1996. a
Jiménez, P. A., González-Rouco, J. F., Navarro, J., Montávez, J. P., and García-Bustamante, E.: Quality assurance of surface wind observations from automated weather stations, J. Atmos. Ocean. Tech., 27, 1101–1122, https://doi.org/10.1175/2010JTECHA1404.1, 2010. a
Klein Tank, A. M., Wijngaard, J. B., Können, G. P., Böhm, R., Demarée, G., Gocheva, A., Mileta, M., Pashiardis, S., Hejkrlik, L., Kern-Hansen, C., Heino, R., Bessemoulin, P., Müller-Westermeier, G., Tzanakou, M., Szalai, S., Pálsdóttir, T., Fitzgerald, D., Rubin, S., Capaldo, M., Maugeri, M., Leitass, A., Bukantis, A., Aberfeld, R., Van Engelen, A. F., Forland, E., Mietus, M., Coelho, F., Mares, C., Razuvaev, V., Nieplova, E., Cegnar, T., Antonio López, J., Dahlström, B., Moberg, A., Kirchhofer, W., Ceylan, A., Pachaliuk, O., Alexander, L. V., and Petrovic, P.: Daily dataset of 20th-century surface air temperature and precipitation series for the European Climate Assessment, Int. J. Climatol., 22, 1441–1453, https://doi.org/10.1002/joc.773, 2002. a
Li, Q. S., Zhi, L., and Hu, F.: Boundary layer wind structure from observations on a 325 m tower, Journal of Wind Engineering and Industrial Aerodynamics, 98, 818–832, https://doi.org/10.1016/j.jweia.2010.08.001, 2010. a
Lott, J. N.: The quality control of the Integrated Surface Hourly Database, paper presented at the 14th Conference on Applied Climatology, Am. Meteorol. Soc., Seattle, Wash, 10–16, 2004. a
Lucio-Eceiza, E. E., González-Rouco, J. F., Navarro, J., and Beltrami, H.: Quality control of surface wind observations in Northeastern North America. Part I: Data management issues, J. Atmos. Ocean. Tech., 35, 163–182, https://doi.org/10.1175/JTECH-D-16-0204.1, 2018a. a, b
Lucio-Eceiza, E. E., González-Rouco, J. F., Navarro, J., Beltrami, H., and Conte, J.: Quality control of surface wind observations in northeastern North America. Part II: Measurement errors, J. Atmos. Ocean. Tech., 35, 183–205, https://doi.org/10.1175/JTECH-D-16-0205.1, 2018b. a, b
OECD/IEA: Global Energy & CO2 Status Report 2017, Tech. Rep. March, IEA, available at: https://www.iea.org/ (last access: February 2020), 2018. a
OECD/IEA: Global Energy & CO2 Status Report 2018, Tech. rep., available at: https://www.iea.org/ (last access: February 2020), 2019. a
Ramon, J. and Lledó, L.: The Tall Tower Dataset https://doi.org/10.23728/b2share.136ecdeee31a45a7906a773095656ddb, 2019a. a, b, c
Ramon, J. and Lledó, L.: The Tall Tower Dataset. Technical Note, Tech. rep., Barcelona Supercomputing Center – Centro Nacional de Supercomputación, Barcelona, available at: https://earth.bsc.es/wiki/lib/exe/fetch.php?media=library:external:technical_memoranda:technical_report_talltower_database_v2.pdf (last access: February 2020), 2019b. a, b
Ramon, J. and Lledó, L.: The INDECIS-QCSS4TT, GitLab repository, available at: https://earth.bsc.es/gitlab/jramon/INDECIS-QCSS4TT/, 2019c. a
Ramon, J., Lledó, L., Torralba, V., Soret, A., and Doblas‐Reyes, F. J.: What global reanalysis best represents near‐surface winds?, Q. J. Roy. Meteorol. Soc., 145, 3236–3251, https://doi.org/10.1002/qj.3616, 2019. a
Tammelin, B., Vihma, T., Atlaskin, E., Badger, J., Fortelius, C., Gregow, H., Horttanainen, M., Hyvönen, R., Kilpinen, J., Latikka, J., Ljungberg, K., Mortensen, N. G., Niemelä, S., Ruosteenoja, K., Salonen, K., Suomi, I., and Venäläinen, A.: Production of the Finnish Wind Atlas, Wind Energ., 16, 19–35, https://doi.org/10.1002/we.517, 2013. a
Torralba, V., Doblas-Reyes, F. J., MacLeod, D., Christel, I., and Davis, M.: Seasonal climate prediction: A new source of information for the management of wind energy resources, J. Appl. Meteorol. Climatol., 56, 1231–1247, https://doi.org/10.1175/JAMC-D-16-0204.1, 2017. a
Troen, I. and Petersen, E. L.: European Wind Atlas, Risoe National Laboratory, available at: http://orbit.dtu.dk/files/112135732/European_Wind_Atlas.pdf (last access: February 2020), 1989. a
WindEurope: Offshore Wind in Europe. Key trends and statistics 2017, Tech. rep., available at: https://windeurope.org/wp-content/uploads/files/about-wind/statistics/WindEurope-Annual-Offshore-Statistics-2017.pdf (last access: February 2020), 2018. a
WMO: Guide to the Global Observing System. Third edition, Tech. rep., World Meteorological Organization, Geneva, available at: http://www.wmo.int/pages/prog/www/OSY/Manual/488_Guide_2007.pdf (last access: February 2020), 2007. a, b, c, d
- Abstract
- Introduction
- Tall Tower Dataset description
- The Quality Control Software Suite for Tall Towers (QCSS4TT)
- Results of the application of the QCSS4TT
- How reliable is the QCSS4TT?
- Code and data availability
- Conclusions
- Author contributions
- Competing interests
- Disclaimer
- Acknowledgements
- Financial support
- Review statement
- References
- Supplement