the Creative Commons Attribution 4.0 License.
the Creative Commons Attribution 4.0 License.
A 439-year simulated daily discharge dataset (1861–2299) for the upper Yangtze River, China
Buda Su
Valentina Krysanova
Qianyu Zha
Cai Chen
Gang Luo
Xiaofan Zeng
Jinlong Huang
Ming Xiong
Liping Zhang
The outputs of four global climate models (GFDL-ESM2M, HadGEM2-ES, IPSL-CM5A-LR and MIROC5), which were statistically downscaled and bias corrected, were used to drive four hydrological models (Hydrologiska Byråns, HBV; Soil and Water Assessment Tool, SWAT; Soil and Water Integrated Model, SWIM; and Variable Infiltration Capacity, VIC) to simulate the daily discharge at the Cuntan hydrological station in the upper Yangtze River from 1861 to 2299. As the performances of hydrological models in various climate conditions could be different, the models were first calibrated in the period from 1979 to 1990. Then, the models were validated in the comparatively wet period, 1967–1978, and in the comparatively dry period, 1991–2002. A multi-objective automatic calibration programme using a univariate search technique was applied to find the optimal parameter set for each of the four hydrological models. The Nash–Sutcliffe efficiency (NSE) of daily discharge and the weighted least-squares function (WLS) of extreme discharge events, represented by high flow (Q10) and low flow (Q90), were included in the objective functions of the parameterization process. In addition, the simulated evapotranspiration results were compared with the GLEAM evapotranspiration data for the upper Yangtze River basin. For evaluating the performances of the hydrological models, the NSE, modified Kling–Gupta efficiency (KGE), ratio of the root-mean-square error to the standard deviation of the measured data (RSR) and Pearson's correlation coefficient (r) were used. The four hydrological models reach satisfactory simulation results in both the calibration and validation periods. In this study, the daily discharge is simulated for the upper Yangtze River under the preindustrial control (piControl) scenario without anthropogenic climate change from 1861 to 2299 and for the historical period 1861–2005 and for 2006 to 2299 under the RCP2.6, RCP4.5, RCP6.0 and RCP8.5 scenarios. The long-term daily discharge dataset can be used in the international context and water management, e.g. in the framework of Inter-Sectoral Impact Model Intercomparison Project (ISIMIP) by providing clues to what extent human-induced climate change could impact streamflow and streamflow trend in the future. The datasets are available at: https://doi.org/10.4121/uuid:8658b22a-8f98-4043-9f8f-d77684d58cbc (Gao et al., 2019).
- Article
(9903 KB) - Full-text XML
- BibTeX
- EndNote
Global warming is the long-term rise in average temperature of the earth's climate system. Warming temperature alters global water circulation processes and could significantly influence the sustainability of society and economy (Jung et al., 2011). The variation in water resource availability in the context of global warming is acknowledged as a focus of many international research projects (Stagl et al., 2016; Råman Vinnå et al., 2018; Maisa et al., 2019). The long-term accurate (as much as possible) daily discharge time series are crucial for in-depth understanding of the changes in streamflow, and they are needed for subsequent climate change impact studies. However, discharge is monitored usually only for short observational periods in most river basins.
For generation of the long-term streamflow series, many data-mining techniques including the sedimentological method, the hydrological field survey method, and the documentary analysis method, can be applied (Longfield et al., 2018). Nevertheless, low temporal resolution and insufficient accuracy of these estimations can hardly meet the demands of practical and research applications. Instead, the observed climatic variables and the outputs of climate models have often been used to drive hydrological models to evaluate changes in streamflow in the context of climate change (Braud et al., 2010; Chen et al., 2017; Su et al., 2017; Dahl et al., 2018; Seneviratne et al., 2018). But there is lack of research on the quantitative estimation of long-term streamflow for periods longer than 400 years under different scenarios with and without anthropogenic climate change (Meaurio et al., 2017).
The Yangtze River is the longest river in China. It originates from the Tibetan Plateau and enters the East China Sea after flowing through 11 provinces. With a large topographic gradient and substantial water supply of approximately 10 000 m3 s−1 on average, the upper Yangtze River is rich in hydropower resources, but causes destructive flash floods. The Yangtze River has the longest hydrological observations in China. Data provided by the Cuntan hydrological station, which started operating in 1939, facilitates hydro-meteorological studies in the instrumental period (Su et al., 2008, 2017; Wang et al., 2008). As changes in streamflow at the Cuntan station directly influence inflow to the Three Gorges Reservoir, establishing long-term discharge series at the Cuntan station can support effective management of hydraulic projects. Furthermore, the longer discharge series can also provide the possibility to explore impacts of anthropogenic climate change on hydrology for the international climate change research community. Therefore, we simulated daily discharge at the Cuntan hydrological station in the upper Yangtze River in the period 1861–2299 using available climate model outputs.
The outputs of four downscaled general circulation models (GCMs; GFDL-ESM2M, HadGEM2-ES, IPSL-CM5A-LR and MIROC5) are utilized to drive four hydrological models (HBV, SWAT, SWIM and VIC) to simulate discharge at the Cuntan station. The climate forcing comprises (a) the scenario with anthropogenic climate change for the period 1861–2299, which is subdivided into the historical period (1861–2005) and the future period (2006–2299) under different Representative Concentration Pathways (RCPs), and (b) the preindustrial control scenario (piControl) for the period 1861–2299, which is used as a reference to detect the influence of anthropogenic climate change on streamflow in the upper Yangtze River.
The catchment area of the Cuntan hydrological station (29∘37′ N, 106∘36′ E) in the upper Yangtze River is approximately 860 000 km2, and 352.7 billion m3 of water flows through this point annually with average discharge of 109.34 m3 s−1 in the period of instrumental measurements beginning in 1939. Location of the Cuntan hydrological station, 311 GCM grids, meteorological stations, and spatial distribution of the land use and soil types in the upper Yangtze River basin are shown in Fig. 1. Prairie grassland and acid purple soil are the most widespread land use and soil type in the upper Yangtze River basin. The upper Yangtze River has complex geomorphic types and broken topography. Mountains and plateaus account for most of the region, and hills and plains are few. Influenced by the East Asian subtropical monsoon and a complex topography, climate varies across the basin with annual air temperature and precipitation being high in the southeast but low in the northwest headstream region. According to observational data, the areal averaged annual mean temperature and precipitation are 12.3∘ and 1018 mm, respectively, during 1961–2017 in the upper Yangtze River basin.
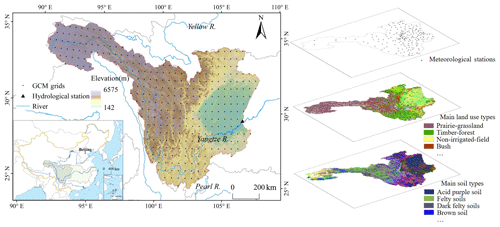
Figure 1Location of the Cuntan hydrological station, GCM grids, meteorological stations, and spatial distribution of the land use and soil types in the upper Yangtze River basin. We created the map with ArcGIS ourselves, the vector data of soil types were taken from the Institute of Soil Science, Chinese Academy of Sciences (CAS), and the land use map was downloaded from the Resource and Environment Data Cloud Platform (http://www.resdc.cn/, last access: November 2018).
3.1 Climate scenarios
The outputs of the GCMs (GFDL-ESM2M, HadGEM2-ES, IPSL-CM5A-LR and MIROC5) were statistically downscaled and bias corrected on a regular 0.5∘ × 0.5∘ resolution grid using a first-order conservative remapping scheme (Frieler et al., 2017; Lange, 2018). The GFDL model was developed by the Geophysical Fluid Dynamics Laboratory, Princeton University, USA, and all its integrations (approximately 100 in total), including GFDL-ESM2M and GFDL-ESM2G, were completed for the Coupled Model Intercomparison Project Phase 5 (CMIP5) protocol (Taylor et al., 2012). HadGEM2-ES is a coupled earth system model that was developed by the Met Office Hadley Centre, UK, for the CMIP5 centennial simulations (Jones et al., 2011). The IPSL-CM5A-LR model was developed by the Institute Pierre Simon Laplace, France, and the model was built around a physical core that includes atmosphere, land surface, ocean and sea ice components (Dufresne et al., 2013). MIROC5 is a new version of the atmosphere–ocean GCM that was developed by the Japanese research community (Watanabe et al., 2010).
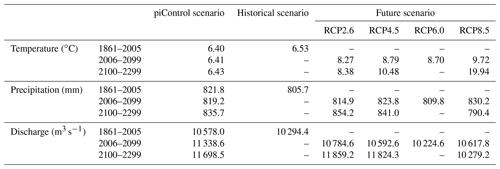
Lack of long-term homogeneous observational data and existence of confounding influence from socioeconomic drivers make GCM simulations rarely cover the preindustrial period. In this study, climate simulations include a piControl scenario, representing a climate with natural variability under stable CO2 concentration of 286 ppm; a historical scenario, representing the historical CO2 concentration; and future RCP scenarios, representing various future CO2 concentration pathways. The availability of climate scenarios for the different periods is shown in Table 1 (see also Frieler et al., 2017). Note that not all simulations cover the 22nd and 23rd centuries. Data after 2099 are available from three models under RCP2.6 and only from IPSL under RCP4.5 and RCP8.5, but no simulations are available under RCP6.0.
3.2 Observed meteorological and hydrological data
The observed daily meteorological data for 1951–2017 from 189 ground-based stations in the upper Yangtze River basin used in this study were quality controlled by considering changes in instrument type, station relocations and trace biases at the National Meteorological Information Centre of China Meteorological Administration (Ren et al., 2010), which was inputted into the hydrological models by spatial interpolation. During 1951–2017, annual precipitation shows a decreasing trend, with a multi-year average of 935 mm, and annual mean temperature has shown a positive trend with a multi-year average of 10.5∘. The daily discharge record at the Cuntan station in the upper Yangtze River is available for 1970–1999 from the China Hydrological Yearbook – Yangtze. The rest of the daily records for the periods 1939–1969 and 2000–2012 are collected from the Changjiang Water Resources Commission, Ministry of Water Resources in China.
The Yangtze River is prone to be flooded because of large inter- and inner-annual variations in precipitation. The most severe flood that can be tracked in the upper Yangtze River occurred in 1870, with a flood peak of approximately 100 500 m3 s−1 at the Yichang station located downstream of the Cuntan station (Changjiang Water Resources Commission, 2002). The peak flows reached 63 600 m3 s−1 and 64 600 m3 s−1 at the Cuntan station and the Yichang station, respectively, during the 1931 flood and 52 200 and 66 800 m3 s−1, respectively, during the 1954 flood (Hu and Luo, 1992; Luo and Le, 1996). During the strongest flood of the 20th century in the Yangtze River, the peak flow at the Cuntan station reached 68 500 m3 s−1 in 1998 (Changjiang Water Resources Commission, 2002).
3.3 GLEAM evapotranspiration data
Evapotranspiration data from the Global Land Evaporation Amsterdam Model (GLEAM) for 1986–2005 that were released by the University of Bristol (Miralles et al., 2011) are used in our study to cross-check the performances of the hydrological models by means of the geographic information system (GIS) tools. The GLEAM data were generated based on a variety of satellite-sensor products at monthly scale with a spatial resolution of 0.25∘. The spatial distributions of simulated evapotranspiration with those from GLEAM are compared by GIS techniques, and the kappa value of the confusion matrix is also applied to evaluate the accuracy of simulated evapotranspiration (taking VIC output as an example) by referring to GLEAM.
3.4 Hydrological models and parameterization
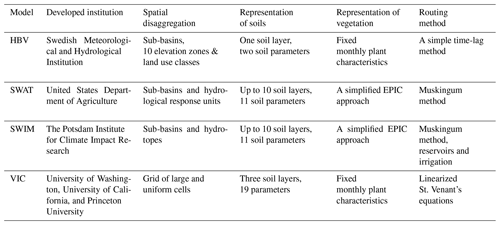
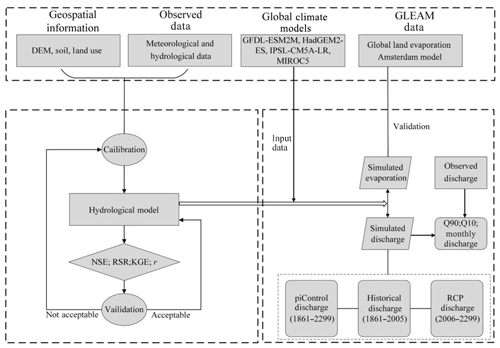
Four hydrological models, HBV (Bergström et al., 1973), SWAT (Arnold et al., 1998), SWIM (Krysanova et al., 2005) and VIC (Liang et al., 1994), are used to simulate river discharge at the Cuntan hydrological station, and a flow chart of the hydrological modelling process is shown in Fig. 2. A brief introduction to these four hydrological models is given in Table 2 (see also Hattermann et al., 2017).
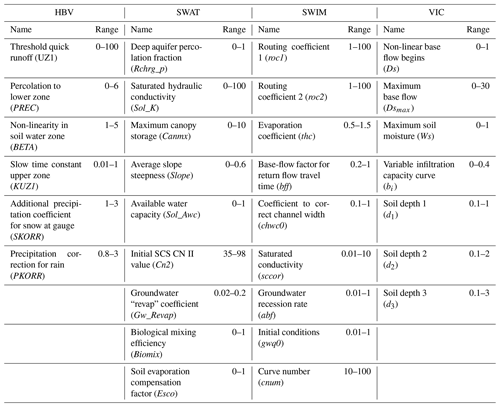
The univariate search technique, which can evaluate the informativeness of each feature individually, is used to calibrate the parameters. The objective functions include the Nash–Sutcliffe efficiency (NSE) of daily discharge (Nash and Sutcliffe, 1970) and the weighted least-squares function (WLS) of high flow (Q10) and low flow (Q90). To achieve the maximum NSE and the minimum gap between the observed and the simulated discharge, parameterization processes are iterated over 2000 times within the ranges of the valid parameter scopes in Table 3 (Lai et al., 2006).
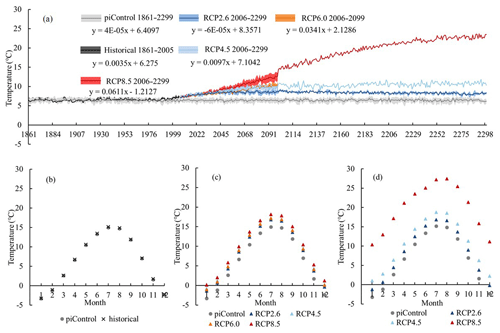
Figure 3Inter-annual (a) and long-term averaged monthly dynamics (b–d) of the surface air temperature in the upper Yangtze River basin: comparison of the piControl scenario with the anthropogenic climate change scenarios (periods: a: 1861–2299; b: 1861–2005; c: 2006–2099; and d: 2100–2299).
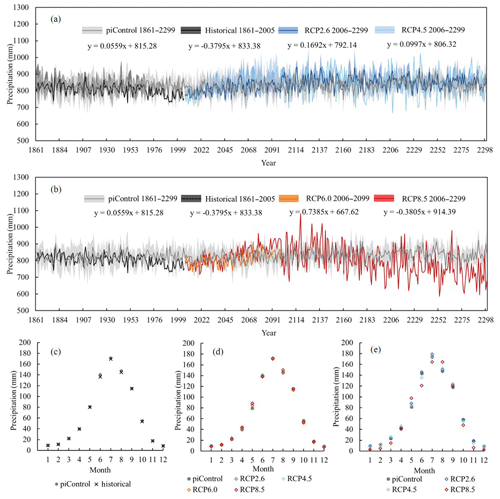
Figure 4Inter-annual (a, b) and long-term averaged monthly dynamics (c–e) of precipitation in the upper Yangtze River basin: comparison of the piControl scenario with the anthropogenic climate change scenarios (periods: a: 1861-2299; b: 1861-2299; c: 1861–2005; d: 2006–2099; and e: 2100–2299).
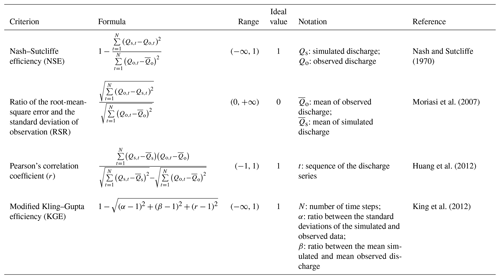
For evaluating daily hydrograph simulation, ratio of the root-mean-square error to the standard deviation of measured data (RSR) is recommended (Moriasi et al., 2007). In addition, the Kling–Gupta efficiency (KGE) was developed to provide diagnostic insights into the model performance by decomposing the NSE into three components: correlation, bias and variability (Gupta et al., 2009). In this study, four criteria, the NSE, RSR, Pearson's correlation coefficient (r) and KGE, are applied to the daily discharge series to evaluate the performance of hydrological models (Krysanova et al., 2018; Table 4). Thresholds of acceptance of four criteria are derived from the references (Nash and Sutcliffe, 1970; Moriasi et al., 2007; Huang et al., 2012; King et al., 2012).
3.5 Geospatial information
A digital elevation model (DEM) with a resolution of 90 m from the Shuttle Radar Topography Mission database is used in this study. The soil property data are obtained from the Harmonized World Soil Database of the Food and Agriculture Organization of the United Nations (http://www.fao.org/land-water/databases-and-software/hwsd/en/ last access: August 2018), and the spatial distribution of soil types (1 : 1 000 000) is taken from the Institute of Soil Science, Chinese Academy of Sciences (CAS). A land use map of 1990 (1 : 1 000 000) from the Data Center for Resource and Environmental Sciences, CAS is applied for all hydrological runs under various climate conditions including the piControl, the historical and the RCP scenarios.
4.1 Climate change in the upper Yangtze River basin
According to ensemble mean of four GCMs, annual mean temperature in the upper Yangtze River basin in the period 1986–2005 is 0.49 ∘C higher than that in the period 1861–1900, the increase is lower than the global average of 0.61 ∘C in the same period. Compared to the piControl scenario, annual mean temperature is projected to increase significantly in the 21st century, by 1.85–3.31 ∘C under RCPs. After 2100, surface air temperature will remain stable under RCP2.6 and increase only slightly under RCP4.5, but a significant increase in temperature will continue under RCP8.5, with an increase of up to 13.5 ∘C by 2299 compared to the piControl scenario (Fig. 3a, Table 5). The visible disruption in temperature in the year 2100 under RCP4.5 and RCP8.5 in Fig. 3a is due to the fact that only the IPSL model runs are available after 2100 for these scenarios.
The long-term average monthly dynamics of temperature show a single-peak curve, with July as the hottest month. In the period 1861–2005, the inner-annual distribution pattern of temperature is very similar for the piControl and the historical scenarios (Fig. 3b). However, differences in the monthly temperatures between RCPs and the piControl scenario become apparent with time (Fig. 3c, d). Taking the temperature in July as an example, the difference between the two scenarios is approximately 1.9–3.2 ∘C in the 21st century but will enlarge to 1.7–12 ∘C in the period 2100–2299.
Compared with precipitation under the piControl scenario, which has no monotonic trend, annual precipitation is approximately 2 % (16 mm) less in 1861–2005 under the historical scenario. Relative to the piControl scenario, changes of annual precipitation will be −1.2 %–1.3 % in the 21st century under RCPs and will be 0.6 %–2.2 % in 2100–2299 under RCP2.6 and RCP4.5. Under RCP8.5, relative change of annual precipitation is −5.7 %, and a wide range of fluctuations are projected with a variance as high as 94.3 in 2100–2299, which is 63.2 % higher than the piControl scenario (Fig. 4a, b, Table 5).
Table 6Performance of four hydrological models in the upper Yangtze River at the calibration period and the wet and dry validation periods.
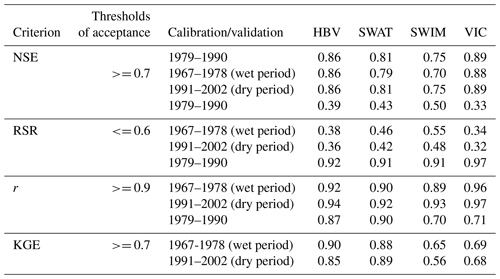
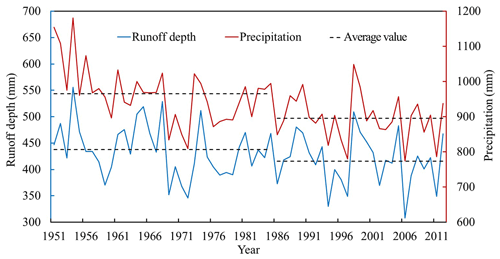
Figure 5Annual precipitation and runoff depth observed in the upper Yangtze River basin in the period 1951–2012.
The long-term average monthly precipitation shows a single-peak curve, with precipitation highest in July and lowest in December and January. The differences in the long-term average monthly precipitation under RCPs and the piControl scenario are projected to grow from −1.9 to 1.3 % before 2100 to −5.4 %–2.2 % in the period 2100–2299 (Fig. 4c, e).
4.2 Calibration and validation of the hydrological models
A previous study found that 1986/1987 was a change point in the observational period for south China, with a more obvious increase in temperature and decrease in precipitation since then (Thomas et al., 2012). Figure 5 shows that observed annual precipitation and runoff depth in the upper Yangtze River basin in the period 1951–1986 are approximately 965 and 437 mm, respectively, and decreased by 7 % and 5 % to 895 and 415 mm, respectively, in the period 1987–2012. Therefore, the period 1979–1990, which included both comparatively wet and dry spells, is chosen as the calibration period. Subsequently, hydrological models are validated in two periods without changing the parameters set during the calibration: the wet spell in 1967–1978 and the dry spell 1991–2002.
Based on the NSE, RSR and r values, all four hydrological models perform quite well in both the calibration and validation periods for the simulations of daily discharge at the Cuntan station. In particular, the NSE values of all models exceed 0.75 in the calibration period and 0.7 in the validation periods (Table 6). The KGE values are above the threshold in the calibration period for all models but slightly lower in the validation period for the SWIM and VIC models. The four hydrological models can also properly simulate high flow and low flow represented by Q10 and Q90 in calibration and validation periods. For example, the Q10 result illustrates that the several severe floods mentioned previously are reproduced quite well by the model simulations: the peak flows of simulated discharge were 64 300, 53 900 and 60 700 m3 s−1 in the 1930s, 1950s and 1990s, respectively, deviating by less than 10 % from the recorded peaks (Fig. 6).
To further validate the hydrological models, discharge simulated in another 30-year historical period (1939–1968) is compared with the observed data (Fig. 7). It is found that there are systematic underestimations of streamflow by SWAT, SWIM and VIC. However, all four hydrological models can reproduce the monthly dynamics of river flow quite satisfactorily, with NSE values of 0.79–0.84 and r values of 0.91–0.92.

Figure 6Comparison of the simulated and observed Q10 and Q90 percentiles at the Cuntan station in the calibration period 1979–1990 (a) and validation periods 1967–1978 and 1991–2002 (b, c).
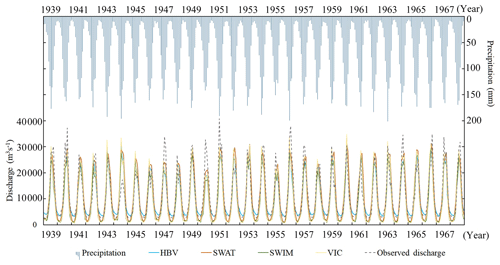
Figure 7Observed and simulated monthly discharge and precipitation at the Cuntan station in the upper Yangtze basin for 1939–1968.
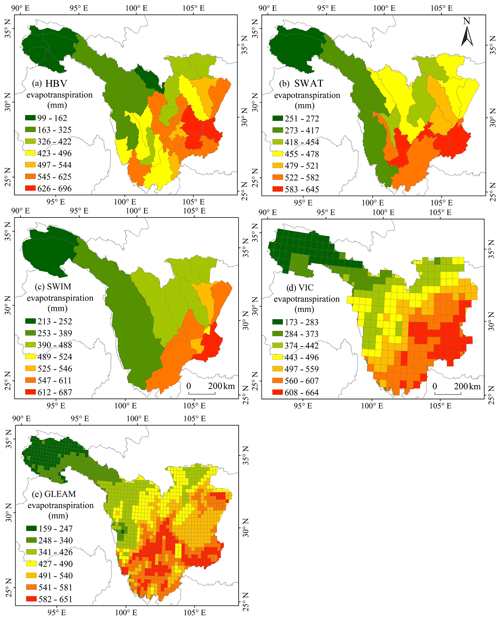
In addition, evapotranspiration outputs of HBV, SWAT, SWIM and VIC are compared with the GLEAM evapotranspiration data (see Sect. 3.3) in the period 1986–2005. The long-term averaged annual evapotranspiration simulated by the four models for the upper Yangtze River basin is 442, 487, 484 and 466 mm, respectively, quite close to the result from GLEAM (452 mm). The spatial patterns of the gridded evapotranspiration outputs of HBV, SWAT, SWIM, VIC and GLEAM all show low values in the northwest but high values in the southeast of the upper Yangtze River basin (Fig. 8). Furthermore, a matrix consisting of 500 randomly selected pixels from simulated evapotranspiration by VIC and corresponding GLEAM grids is set up to get the kappa value. The deduced kappa value of 0.62 indicates a substantial agreement of two date sources.
4.3 Simulation of daily discharge for 1861–2299
The simulated discharge time series for 1861–2299 under the piControl scenario without anthropogenic climate change and scenarios with anthropogenic climate change effects are shown in Fig. 9a, b. Similar to precipitation trend, annual mean discharge at the Cuntan station shows no significant trend from 1861 to 2299 under the piControl scenario. In the historical period, annual mean discharge has shown a slight decreasing trend in 1861–2005. Under RCPs, annual mean discharge will be in a significant upward trend by the end of the 21st century with increasing variation in the upper Yangtze River. Annual mean discharge shows no significant change since 2100 under RCP2.6 and RCP4.5, but a rapid decline is projected under the high-emission RCP8.5 scenario in the future (Fig. 9a, b, Table 5).
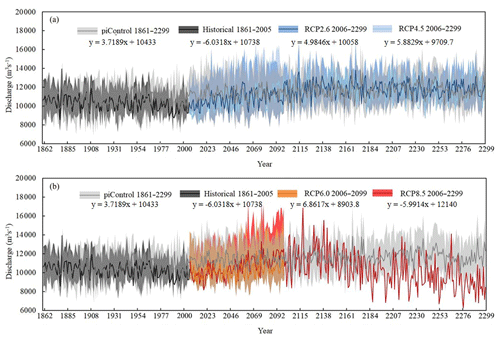
Figure 9The annual mean discharge at the Cuntan station simulated by four hydrological models (HBV, SWAT, SWIM and VIC) under the piControl scenario and scenarios with anthropogenic climate change effects (a, b).
Table 7Relative changes in mean annual discharge, Q10 and Q90 in the periods 2070–2099 and 2270–2299 under the scenarios of anthropogenic climate change relative to the piControl scenario.
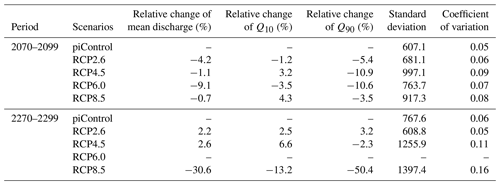
Comparison of relative changes in mean annual discharge for 2070–2099 and 2270–2299 under RCPs with that of the piControl scenario presented in Table 7. Relative to the piControl scenario, change of annual mean discharge will be −4.2 %, −1.1 %, −9.1 % and −0.7 %, respectively, under RCP2.6, RCP4.5, RCP6.0 and RCP8.5, in 2070–2099. And the relative change of annual mean discharge will be 2.2 %, 2.6 % and −30.6 % under RCP2.6, RCP4.5 and RCP8.5, respectively, in 2270–2299 (Table 7).
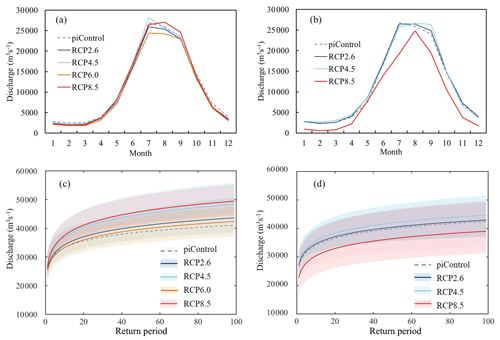
Figure 10Comparison of monthly mean simulated discharge and return periods of daily maximum discharge at the Cuntan station for 2070–2099 (a, c) and 2270–2299 (b, d) under RCPs and the piControl scenario.
Under RCP2.6 and RCP6.0, Q10 and Q90 discharge will be lower than that under the piControl scenario in 2070–2099. The relative changes of Q10 will be 4.3 % higher but that of Q90 will be −3.5 % lower under RCP8.5 than that under the piControl scenario in 2070–2099.
In 2270–2299, a higher Q10 discharge is projected under RCP2.6 and RCP4.5 than the piControl scenario. Meanwhile, a higher Q90 discharge under RCP2.6 but a lower Q90 discharge under RCP4.5 are projected. But the relative changes of Q10 and Q90 discharge will reach −13.2 % and −50.4 % due to the rapid decline of discharge under RCP8.5 in 2270–2299. The results indicate there will be more extreme hydrological events in the long run, especially under RCP8.5.
Similar to precipitation and temperature, average monthly discharge in 2070–2099 and 2270–2299 under both the piControl and RCP scenarios shows a single peak. Under RCP4.5, a higher flood volume in August is projected in the periods 2070–2099 and 2270–2299 than the piControl scenario. Meanwhile, a higher volume in 2070–2099 but a lower volume in 2270–2299 under RCP8.5 are projected. Under RCP2.6, the flood volume of August is similar to piControl in both periods (Fig. 10, b). The generalized logistic distribution (GLD), which is the optimistic distribution by the Kolmogorov–Smirnov goodness-of-fit test, is applied to describe the statistical distribution of the daily maximum discharge (represented by annual Q10) for 2070–2099 and 2270–2299. It is found that the return level of daily maximum discharge under RCP2.6, RCP4.5, RCP6.0 and RCP8.5 is higher than under the piControl scenario in 2070–2099 (Fig. 10c). Under RCP4.5, a higher average of return level of daily maximum discharge is projected in the periods 2070–2099 and 2270–2299 than in the piControl scenario. For RCP8.5, the average of the return level of daily maximum discharge is higher in 2070–2099 but lower in 2270–2299 than in the piControl scenario. Under RCP2.6, the average of the return level of daily maximum discharge is similar to that of piControl scenario in both periods (Fig. 10c, d).
4.4 Data availability
The current study generates daily discharge series for the upper Yangtze River at the Cuntan gauging station in the period 1861–2299 under scenarios with and without anthropogenic climate change. The river discharge is simulated by four hydrological models, HBV, SWAT, SWIM and VIC driven by four downscaled and bias-corrected GCMs (GFDL-ESM2M, HadGEM2-ES, IPSL-CM5A-LR and MIROC5), and the datasets are available at: https://doi.org/10.4121/uuid:8658b22a-8f98-4043-9f8f-d77684d58cbc (Gao et al., 2019).
-
Scenario without anthropogenic climate change (piControl). A total of 16 sequences of daily discharge at the Cuntan hydrological station in the upper Yangtze River are outputs of the four hydrological models that are driven by the four GCMs in the period 1861–2299.
-
Scenarios with anthropogenic climate change.
-
For the historical period, a total of 16 sequences of daily discharge at the Cuntan station in the upper Yangtze River are outputs of the four hydrological models that are driven by the four GCMs in the period 1861–2005.
-
For the RCP2.6 scenario, a total of 16 sequences of daily runoff at the Cuntan station in the upper Yangtze River are outputs of the four hydrological models that are driven by the four GCMs in the period 2006–2299 (for GFDL-ESM2M, the sequences are for the period 2006–2099).
-
For the RCP4.5 scenario, a total of 16 sequences of daily discharge at the Cuntan station in the upper Yangtze River are outputs of the four hydrological models that are driven by the four GCMs in the period 2006–2099 (for IPSL-CM5A-LR, the sequences are for the period 2006–2299).
-
For the RCP6.0 scenario, a total of 16 sequences of daily discharge at the Cuntan station in the upper Yangtze River are outputs of the four hydrological models that are driven by the four GCMs in the period 2006–2099.
-
For the RCP8.5 scenario, a total of 16 sequences of daily discharge at the Cuntan station in the upper Yangtze River are outputs of the four hydrological models that are driven by the four GCMs in the period 2006–2099 (for IPSL-CM5A-LR, the sequences are for the period 2006–2299).
-
Using four GCMs (GFDL-ESM2M, HadGEM2-ES, IPSL-CM5A-LR and MIROC5), changes in temperature and precipitation in the upper Yangtze River basin are analysed from 1861 to the end of the 23th century under conditions with anthropogenic climate change and for a scenario without anthropogenic climate change (abbreviated as the piControl scenario). The discharge at the Cuntan station in the period 1861–2299 is simulated by four hydrological models (HBV, SWAT, SWIM and VIC) driven by the four GCMs, and changes in discharge in a warming world are compared with those under the piControl scenario.
To ensure the reliability of simulated runoff, a multi-objective automatic calibration programme using a univariate search technique is applied to obtain the optimal parameter set for each hydrological model. For the objective functions, the daily discharge and the indicators of high and low flow are considered. Four criteria, including NSE, KGE, RSR and r, are used to evaluate the parameterization results. To assess the models' ability to satisfactorily simulate discharge under different climate conditions, hydrological models are validated in both dry and wet periods. In addition, evapotranspiration outputs by simulation are compared with remote-sensing-based evapotranspiration from the GLEAM dataset to further validate performance of the models.
Previous studies have shown that the HBV, SWAT and VIC hydrological models could be applied to the Cuntan station in the upper Yangtze River after calibration (Huang et al., 2016; Su et al., 2017; Chen et al., 2017). Our study proves that HBV, SWAT, SWIM and VIC models can satisfactorily simulate precipitation–runoff relation in a changing climate. Moreover, simulated extreme peak values in the 1930s, 1950s and 1990s are also in good agreement with the historical documented records of the catastrophic floods in the Yangtze River.
Although the simulation results are tested by several criteria, there are still uncertainties that could influence the outputs. These uncertainties are associated with the GIS data (e.g. land use data), selection of the GCMs, the model calibration procedure, exclusion of water management practices, etc. (Gerhard et al., 2018). First, as no dynamic land use data are available for the historical period before the 1980s and for the future, a static land use for 1990 is used for simulating river discharge before and after the industrial revolution (historical and RCP scenarios). Second, although the most up-to-date climate scenarios are used in this study, downscaling of GCMs and setting of climate scenarios still contribute a lot to the uncertainties in the hydrological simulations. Third, hydrological models are parameterized using the automatic calibration programme. The parameterization effect and model applicability are assessed according to the NSE, KGE and RSR criteria. However, due to equifinality, there could be other parameter sets that may result in a similarly good performance. Combination of parameters and not the choice of individual parameter ultimately influences the result (Cheng et al., 2014). There is a lack of analyses on the effects of different parameter combinations in this study, and the uncertainty related to specific parameters in the models needs to be analysed further. Fourth, since the 1990s, human interferences have escalated in the upper Yangtze River. The construction of dikes and reservoirs alters the timing and volume of peak discharge and base flow. Without consideration of the effects of human interference, focus on merely the natural streamflow is one of the limitations in this study.
The datasets generated in our study are the only available long-term and relatively high-precision discharge sequences for the upper Yangtze River, which include 16 combinations of four hydrological models driven by four GCMs. Simulations by multiple hydrological models and GCMs can provide a range of streamflow variations in the future, which is a clue for water resource management strategies. According to our simulation results, the daily simulated discharge will be reduced with the decreasing precipitation in the future. Comparison of long-term simulated daily discharge under RCPs with anthropogenic climate change and under the piControl scenario without human-induced climate change can provide support to understand to which extent human-induced climate change may impact hydrological regime in the upper Yangtze River basin.
CG, BS, QZ, CC and GL ran the hydrological models. CG, BS and TJ analysed results and drafted the manuscript. XZ, JH, MX and LZ assisted with data processing. VK provided guidance for the calibration and validation of the models and the description of results. All authors reviewed the resulting inventory and assisted with paper writing.
The authors declare that they have no conflict of interest.
The authors would like to thank the ISIMIP project for providing the climate data that were used in this study.
This research has been supported by the National Key Research and Development Program of China MOST (grant no. 2018FY10050001), National Natural Science Foundation of China (grant no. 41871024), High-level Talent Recruitment Program of Ningbo University, and the cooperation project between the Natural Science Foundation of China and the Pakistan Science Foundation (grant no. 41661144027).
This paper was edited by Giuseppe M. R. Manzella and reviewed by two anonymous referees.
Arnold, J. G., Srinivasan, R., Muttiah, R. S., and Williams, J. R.: Large area hydrologic modeling and assessment part I: model development, J. Am. Water Resour. As., 34, 73–89, https://https://doi.org/10.1111/j.1752-1688.1998.tb05961.x, 1998.
Bergström, S. and Forsman, A.: Development of a conceptual deterministic rainfall-runoff model, Hydrol. Res., 4, 147–170, https://doi.org/10.2166/nh.1973.0012, 1973.
Braud, I., Roux, H., Anquetin, S., Maubourguet, M. M., Manus, C., Viallet, P., and Dartus, D.: The use of distributed hydrological models for the Gard 2002 flash flood event: analysis of associated hydrological processes, J. Hydrol., 394, 162–181, https://doi.org/10.1016/j.jhydrol.2010.03.033, 2010.
Changjiang Water Resources Commission of the Ministry of Water Resources: The flood and drought disasters in the Yangtze River Basin, China Water & Power Press, Beijing, China, 2002.
Chen, J., Gao, C., Zeng, X. F., Xiong, M., Wang, Y. J., Jing, C., Krysanova, V., Huang, J. L., Zhao, N., and Su, B. D.: Assessing changes of river discharge under global warming of 1.5 ∘C and 2 ∘C in the upper reaches of the Yangtze River Basin: Approach by using multiple- GCMs and hydrological models, Quat. Int., 453, 63–73, https://doi.org/10.1016/j.quaint.2017.01.017, 2017.
Cheng, X. G., Zhang, J., and Gong, H. L.: HSPF hydrologic simulation and parameter uncertainty in a semi-arid and semi-humid area, Acta Sci. Circumstantiae, 34, 3179–3187, 2014.
Dahl, T. A., Kendall A. D., and Hyndman, D. W.: Impacts of Projected Climate Change on Sediment Yield and Dredging Costs, Hydrol. Process., 32, 1223–1234, https://doi.org/10.1002/hyp.11486, 2018.
Dufresne, J. L., Foujols, M. A., Denvil, S., Caubel, A., Marti, O., Aumont, O., Balkanski, Y., Bekki, S., Bellenger, H., Benshila, R., Bony, S., Bopp, L., Braconnot, P., Brockmann, P., Cadule, P., Cheruy, F., Codron, F., Cozic, A., Cugnet, D., de Noblet, N., Duvel, J. P., Ethe, C., Fairhead, L., Fichefet, T., Flavoni, S., Friedlingstein, P., Grandpeix, J. Y., Guez, L., Guilyardi, E., Hauglustaine, D., Hourdin, F., Idelkadi, A., Ghattas, J., Joussaume, S., Kageyama, M., Krinner, G., Labetoulle, S., Lahellec, A., Lefebvre, M. P., Lefevre, F., Levy, C., Li, Z. X., Lloyd, J., Lott, F., Madec, G., Mancip, M., Marchand, M., Masson, S., Meurdesoif, Y., Mignot, J., Musat, I., Parouty, S., Polcher, J., Rio, C., Schulz, M., Swingedouw, D., Szopa, S., Talandier, C., Terray, P., Viovy, N., and Vuichard, N.: Climate change projections using the IPSL-CM5 Earth System Model: from CMIP3 to CMIP5, Clim. Dynam., 40, 2123–2165, https://doi.org/10.1007/s00382-012-1636-1, 2013.
Frieler, K., Lange, S., Piontek, F., Reyer, C. P. O., Schewe, J., Warszawski, L., Zhao, F., Chini, L., Denvil, S., Emanuel, K., Geiger, T., Halladay, K., Hurtt, G., Mengel, M., Murakami, D., Ostberg, S., Popp, A., Riva, R., Stevanovic, M., Suzuki, T., Volkholz, J., Burke, E., Ciais, P., Ebi, K., Eddy, T. D., Elliott, J., Galbraith, E., Gosling, S. N., Hattermann, F., Hickler, T., Hinkel, J., Hof, C., Huber, V., Jägermeyr, J., Krysanova, V., Marcé, R., Müller Schmied, H., Mouratiadou, I., Pierson, D., Tittensor, D. P., Vautard, R., van Vliet, M., Biber, M. F., Betts, R. A., Bodirsky, B. L., Deryng, D., Frolking, S., Jones, C. D., Lotze, H. K., Lotze-Campen, H., Sahajpal, R., Thonicke, K., Tian, H., and Yamagata, Y.: Assessing the impacts of 1.5 ∘C global warming – simulation protocol of the Inter-Sectoral Impact Model Intercomparison Project (ISIMIP2b), Geosci. Model Dev., 10, 4321–4345, https://doi.org/10.5194/gmd-10-4321-2017, 2017.
Gao, C., Su, B. D., Krysanova V., Zha, Q. Y., Chen, C., Luo, G., Zeng, X. F., Huang, J. L., Xiong, M., Zhang, L. P, and Jiang T.: A 439-year daily discharge dataset (1861–2299) for the upper Yangtze River, China, 4TU, Research Data, https://doi.org/10.4121/uuid:8658b22a-8f98-4043-9f8f-d77684d58cbc, 2019.
Gerhard, K. and Flanner, M. G.: Striking stationarity of large-scale climate model bias patterns under strong climate change, Proc. Natl. Acad. Sci. USA, 115, 9462–9466, https://doi.org/10.1073/pnas.1807912115, 2018.
Gupta, H. V., Kling, H., Yilmaz, K. K., and Martinez, G. F.: Decomposition of the mean squared error and NSE performance criteria: implications for improving hydrological modelling, J. Hydrol., 377, 80–91, https://doi.org/10.1016/j.jhydrol.2009.08.003, 2009.
Hattermann, F. F., Krysanova, V., Gosling, S. N., Dankers, R., Daggupati, P., Donnelly, C., Floerke, M., Huang, S., Motovilov, Y., Buda, S., Yang, T., Mueller, C., Leng, G., Tang, Q., Portmann, F. T., Hagemann, S., Gerten, D., Wada, Y., Masaki, Y., Alemayehu, T., Satoh, Y., and Samaniego, L.: Cross-scale intercomparison of climate change impacts simulated by regional and global hydrological models in eleven large river basins, Clim. Change, 141, 561–576, https://doi.org/10.1007/s10584-016-1829-4, 2017.
Hu, M. S. and Luo, C. Z: The historical flood of China, China Bookstore press, Beijing, China, 1992.
Huang, J. L., Wang, Y. J., Su, B., and Zhai, J. Q.: Future Climate Change and Its Impact on Runoff in the Upper Reaches of the Yangze River Under RCP4.5 Scenario, Meteorol. Monthly, 42, 614–620, https://doi.org/10.7519/j.issn.1000-0526.2016.05.011, 2016.
Jones, C. D., Hughes, J. K., Bellouin, N., Hardiman, S. C., Jones, G. S., Knight, J., Liddicoat, S., O'Connor, F. M., Andres, R. J., Bell, C., Boo, K.-O., Bozzo, A., Butchart, N., Cadule, P., Corbin, K. D., Doutriaux-Boucher, M., Friedlingstein, P., Gornall, J., Gray, L., Halloran, P. R., Hurtt, G., Ingram, W. J., Lamarque, J.-F., Law, R. M., Meinshausen, M., Osprey, S., Palin, E. J., Parsons Chini, L., Raddatz, T., Sanderson, M. G., Sellar, A. A., Schurer, A., Valdes, P., Wood, N., Woodward, S., Yoshioka, M., and Zerroukat, M.: The HadGEM2-ES implementation of CMIP5 centennial simulations, Geosci. Model Dev., 4, 543–570, https://doi.org/10.5194/gmd-4-543-2011, 2011.
Jung, I.-W., Chang, H., and Moradkhani, H.: Quantifying uncertainty in urban flooding analysis considering hydro-climatic projection and urban development effects, Hydrol. Earth Syst. Sci., 15, 617–633, https://doi.org/10.5194/hess-15-617-2011, 2011.
Krysanova, V., Donnelly, Ch., Gelfan, A., Gerten, D., Arheimer, B., Hattermann, F., and Kundzewicz, Z.: How the performance of hydrological models relates to credibility of projections under climate change, Hydrol. Sci. J., 63, 696–720, https://doi.org/10.1080/02626667.2018.1446214, 2018.
Krysanova, V., Hattermann, F., and Wechsung, F.: Development of the ecohydrological model SWIM for regional impact studies and vulnerability assessment, Hydrol. Process., 19, 763–783, https://doi.org/10.1002/hyp.5619, 2005.
Lai, C., Reinders, M. J. T., and Wessels, L.: Random subspace method for multivariate feature selection, Pattern. Recogn. Lett., 27, 1067–1076, https://doi.org/10.1016/j.patrec.2005.12.018, 2006.
Lange, S.: Bias correction of surface downwelling longwave and shortwave radiation for the EWEMBI dataset, Earth Syst. Dynam., 9, 627–645, https://doi.org/10.5194/esd-9-627-2018, 2018.
Liang, X., Lettenmaier, D. P., Wood, E. F., and Burges, S. J.: A simple hydrologically based model of land surface water and energy fluxes for general circulation models, J. Geophys. Res.-Atmos., 99, 14415–14428, https://doi.org/10.1029/94JD00483, 1994.
Longfield, S. A., Faulkner, D., Kjeldsen, T. R., Macklin, M. G., Jones, A. F., Foulds, S. A., Brewer, P. A., and Griffiths, H. M.: Incorporating sedimentological data in UK flood frequency estimation, J. Flood Risk Manag., e12449, https://doi.org/10.1111/jfr3.12449, 2018.
Luo, C. Z. and Le, J. X.: The flood of China, China Bookstore press, Beijing, China, 1996.
Maisa, R., Fabrice, L., Julian, R. V., and Andrew, J. C.: Emergence of robust precipitation changes across crop production areas in the 21st century, Proc. Natl. Acad. Sci. USA, 116, 6673–6678, https://doi.org/10.1073/pnas.1811463116, 2019.
Meaurio, M., Zabaleta, A., Boithias, L., Epelde, A. M., Sauvage, S., Sanchez-Perez, J. M., Srinivasan, R., and Autiguedad, I: Assessing the hydrological response from an ensemble of CMIP5 climate projections in the transition zone of the Atlantic region (Bay of Biscay), J. Hydrol., 548, 46–62, https://doi.org/10.1016/j.jhydrol.2017.02.029, 2017.
Miralles, D. G., Holmes, T. R. H., De Jeu, R. A. M., Gash, J. H., Meesters, A. G. C. A., and Dolman, A. J.: Global land-surface evaporation esti–469, https://doi.org/10.5194/hess-15-453-2011, 2011.
Moriasi, D. N., Arnold, J. G., Van Liew, M. W., Bingner, R. L., Harmel, R. D., and Veith, T. L.: Model evaluation guidelines for systematic quantification of accuracy in watershed simulations, T. Asabe, 50, 885–900, https://doi.org/10.13031/2013.23153, 2007.
Nash, J. E., and Sutcliffe, J. V.: River flow forecasting through conceptual models part I – A discussion of principles, J. Hydrol., 10, 282–290, https://doi.org/10.1016/0022-1694(70)90255-6, 1970.
Råman Vinnå, L., Wüest, A., Zappa, M., Fink, G., and Bouffard, D.: Tributaries affect the thermal response of lakes to climate change, Hydrol. Earth Syst. Sci., 22, 31–51, https://doi.org/10.5194/hess-22-31-2018, 2018.
Ren, Z. H., Zhao, P., Zhang, Q., Zhang, Z. F., Cao, L. J., Yang, Y. R., Zou, F. L., Zhao, Y. F., Zhao, H. M., and Chen, Z.: Quality control procedures for hourly precipitation data from automatic weather stations in China, Meteorol. Monthly, 36, 123–132, https://doi.org/10.3788/HPLPB20102207.1462, 2010 (in Chinese).
Seneviratne, S. I., Rogelj, J., Seferian, R., Wartenburger, R., Allen, M. R., Cain, M., Millar, R. J., Ebi, K. L., Ellis, N., Hoegh-Guldberg, O., Payne, A. J., Schleussner, C. F., Tschakert, P., and Warren, R. F.: The many possible climates from the Paris Agreement's aim of 1.5 ∘C warming, Nature, 558, 41–49, https://doi.org/10.1038/s41586-018-0181-4, 2018.
Stagl, J. C. and Hattermann, F. F.: Impacts of climate change on riverine ecosystems: Alterations of ecologically relevant flow dynamics in the danube river and its major tributaries, Water, 8, 566, https://doi.org/10.3390/w8120566, 2016.
Su, B., Gemmer, M., and Jiang, T.: Spatial and temporal variation of extreme precipitation over the Yangtze River Basin, Quat. Int., 186, 22–31, https://doi.org/10.1016/J.QUAINT.2007.09.001, 2008.
Su, B., Huang, J. L., Zeng, X. L., Gao, C., and Jiang, T.: Impacts of climate change on streamflow in the upper Yangtze River basin, Clim. Change, 141, 533–546, https://doi.org/10.1007/s10584-016-1852-5, 2017.
Taylor, K. E., Stouffer, R. J., and Meehl, G. A.: An Overview of CMIP5 and the Experiment Design, B. Am. Meteorol. Soc., 93, 485–498, https://doi.org/10.1175/BAMS-D-11-00094.1, 2012.
Thomas, F., Marco, G., Liu, L., and Su, B.: Change-points in climate extremes in the Zhujiang River Basin, South China, 1961–2007, J. Clim., 110, 783–799, https://doi.org/10.1007/s10584-011-0123-8, 2012.
Wang, G. J., Jiang, T., Blender, R., and Fraedrich, K.: Yangtze 1/f discharge variability and the interacting river–lake system, J. Hydrol., 351, 230–237, https://doi.org/10.1016/j.jhydrol.2007.12.016, 2008.
Watanabe, M., Suzuki, T., O'ishi, R., Komuro, Y., Watanabe, S., Emori, S., Takemura, T., Chikira, M., Ogura, T., Sekiguchi, M., Takata, K., Yamazaki, D., Yokohata, T., Nozawa, T., Hasumi, H., Tatebe, H., and Kimoto, M.: Improved climate simulation by MIROC5: mean states, variability, and climate sensitivity, J. Clim., 23, 6312–6335, https://doi.org/10.1175/2010JCLI3679.1, 2010.


