the Creative Commons Attribution 4.0 License.
the Creative Commons Attribution 4.0 License.
Compilation of relative pollen productivity (RPP) estimates and taxonomically harmonised RPP datasets for single continents and Northern Hemisphere extratropics
Mareike Wieczorek
Ulrike Herzschuh
Relative pollen productivity (RPP) estimates are fractionate values, often in relation to Poaceae, that allow vegetation cover to be estimated from pollen counts with the help of models. RPP estimates are especially used in the scientific community in Europe and China, with a few studies in North America. Here we present a comprehensive compilation of available northern hemispheric RPP studies and their results arising from 51 publications with 60 sites and 131 taxa. This compilation allows scientists to identify data gaps in need of further RPP analyses but can also aid them in finding an RPP set for their study region. We also present a taxonomically harmonised, unified RPP dataset for the Northern Hemisphere and subsets for North America (including Greenland), Europe (including arctic Russia), and China, which we generated from the available studies. The unified dataset gives the mean RPP for 55 harmonised taxa as well as fall speeds, which are necessary to reconstruct vegetation cover from pollen counts and RPP values. Data are openly available at https://doi.org/10.1594/PANGAEA.922661 (Wieczorek and Herzschuh, 2020).
- Article
(2768 KB) - Full-text XML
- BibTeX
- EndNote
Pollen records are widely used for the reconstruction of vegetation composition (e.g. Bartlein et al., 1984; Li et al., 2019). However, such records need to be interpreted carefully, as different taxa have different pollen productivities and dispersal abilities. While some taxa produce much and/or light pollen which is transported over large distances and thus overrepresented in the pollen records compared with vegetation, others produce little and/or heavy pollen which is hardly found in pollen records despite a high abundance of the taxon in the vegetation (e.g. Prentice, 1985; Prentice and Webb, 1986). To overcome these problems, relative pollen productivity (RPP) has been estimated and fall speed of pollen (FSP) measured or calculated for major plant taxa in several regions of the world (e.g. Baker et al., 2016; Broström et al., 2004; Commerford et al., 2013; Wang and Herzschuh, 2011). Most of these studies are limited to north-central Europe and China. Some major review studies provide RPP estimates for a number of sites and taxa (e.g. Broström et al., 2008; Li et al., 2018; Mazier et al., 2012), but a study compiling all available RPP estimates from the Northern Hemisphere – which would be useful to identify the most suitable dataset for a site-specific reconstruction – is not available. For an informed selection of the best-fitting RPP values, a consistent overview of metadata and information on the RPP data assessment is required.
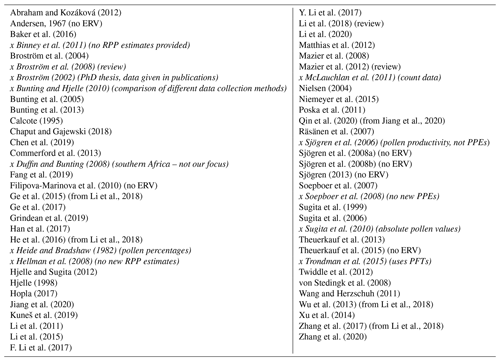
Table 1Publications returned by our literature research for relative pollen productivity (RPP) estimates. Literature not included in all further evaluations is given in italics and marked with an x. If a study has been further examined but did not use the ERV model it is noted in brackets.
Combined large-scale RPP datasets are available for Europe (Mazier et al., 2012) and temperate China (Li et al., 2018). Such a compilation has, until now, not been available for North America. By including recent studies, we created new datasets for North America (including Greenland), Europe (including Arctic Russia), and China (including subtropical regions). Combining these into one northern hemispheric RPP dataset might allow for vegetation reconstructions using broad-scale pollen datasets by adopting a consistent approach.
Here we present a compilation of available RPP publications, four large-scale datasets of RPP estimates, and fall speeds (FSPs) for major northern hemispheric plant taxa.
2.1 Literature search
To find literature on relative pollen productivity estimates (RPP or PPE), we conducted internet searches in Google Scholar (https://scholar.google.de/, last access: 24 June 2020) and Web of Science (https://apps.webofknowledge.com/, last access: 24 June 2020) for the terms “PPE”, “RPP”, “Pollen productivity”, “Pollen productivity estimates”, and various combinations of our search terms. Furthermore, we used literature cited in publications on RPP estimates to gain the most complete overview possible of existing literature about northern hemispheric RPP estimates. Of the resulting 63 publications from our literature search, 12 were excluded a priori (e.g. if they did not provide RPP estimates or consisted only of compilations of previously available RPP data) and are marked with an x in Table 1.
2.2 RPP
2.2.1 RPP compilation
All RPP values and, if given, their standard deviation (SD) or standard error (SE) were collected from the literature. If the data were only presented as figures, values were extracted with the help of CorelDRAW X6. The RPP values from an unpublished study by Li et al. and from the studies of Ge et al. (2015), He et al. (2016), Wu et al. (2013), and Zhang et al. (2017), which are only available in Chinese, where extracted from Li et al. (2018), while the study of Chen et al. (2019) was extracted from Jiang et al. (2020).
While different approaches exist to estimate RPP, the extended R value (ERV) is the most common approach. Details on the ERV model and related assessment criteria can be found in, for example, Abraham and Kozáková (2012), Bunting et al. (2013), and Li et al. (2018). The maximum likelihood method (decreasing likelihood function score or increasing log-likelihood with distance) can be used to identify the relevant source area of pollen (RSAP) and should reach an asymptote with increasing sampling distance (Sugita 1994). For reliable results, the vegetation sampling area should be ≥ RSAP (Sugita 1994). Unexpected behaviour of the maximum likelihood method can occur if assumptions of the ERV model are not met (Li et al., 2018). Furthermore, a sufficient number of randomly selected sites (number of sites greater than or equal to the number of taxa for RPP estimation) is necessary (Li et al., 2018). Last but not least, for the correct application of the REVEALS model, RPP estimates need to have a standard deviation provided, to allow for correct estimation of the vegetation cover.
To allow for further assessment of the presented RPP data, we collected information on, for example, the maximum likelihood, the vegetation sampling radius, and the site distribution used in the different studies (Table A2, Wieczorek and Herzschuh, 2020, https://doi.org/10.1594/PANGAEA.922661). This will help researchers when creating customised RPP datasets. If RPP estimates for several models (e.g. ERV submodel 1, 2 or 3) were presented in the original study, we used all of them for the RPP compilation and added the information on which one was chosen as the best fit by the original author and/or in the RPP compilations of Mazier et al. (2012) and Li et al. (2018) (Tables A1, A3, Wieczorek and Herzschuh, 2020, https://doi.org/10.1594/PANGAEA.922661).
2.2.2 Continental RPP datasets
To develop large-scale datasets for North America (including Greenland), Europe (including Arctic Russia), China, and the Northern Hemisphere, we confined ourselves to those studies in which the prerequisites for the ERV model are met, i.e. a correct maximum likelihood curve, vegetation sampling radius greater than or equal to RSAP, and number of sites greater than or equal to the number of taxa. Furthermore, we only used studies providing standard errors or standard deviations. However, some exceptions were made: studies without information on RSAP or likelihood, for example, were included if they were previously found to be reliable by Mazier et al. (2012) or Li et al. (2018). In North America particularly, only a few studies are available. We thus incorporated further studies and indicate which assumptions are not met. We followed the authors of the original publications in the choice of the most reliable ERV model, but we included previous assessments of Li et al. (2018) and Mazier et al. (2012).
To be able to compare RPP estimates of different studies, it is necessary that all use the same reference, in our case Poaceae in accordance with most other studies. It is possible to recalculate RPP values based on other reference taxa by setting the original reference taxon to the RPP value resulting from other studies and recalculating all other RPP estimates based on that ratio (Mazier et al., 2012; Li et al., 2018). Of those studies selected for the continental RPP datasets, three did not have Poaceae as the original reference and did not include an RPP for Poaceae. The study of Bunting et al. (2005, reference taxon Quercus) did not provide standard deviations, so we used the values provided by Mazier et al. (2012) for this study, including the standard error. The RPP estimates of Li et al. (2015, reference taxon Quercus) were recalculated based on the mean Quercus RPP provided by F. Li et al. (2017), Zhang et al. (2017, Changbai), and Zhang et al. (2020). The RPP estimates of Matthias et al. (2012, reference taxon Pinus) were recalculated based on the mean Pinus RPP provided by Räsänen et al. (2007) and Abraham and Kozáková (2012). The study of Jiang et al. (2020) used Quercus as the reference taxon but included a value for Poaceae, which was used as the basis for recalculation.
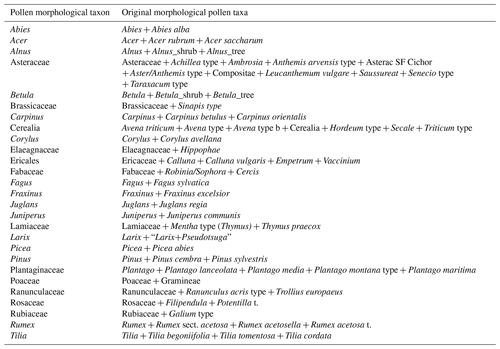
With the remaining RPP estimates, two datasets of RPP were created. To obtain a reasonable taxonomic harmonisation, we assigned broader taxonomic levels to some taxa of the original publications. We kept all original values for the analyses, and calculated means per harmonised taxon for the final datasets if more than one value of finer taxonomic levels was available (Table 2).
In the choice of reliable values, we mainly followed the strategy of Mazier et al. (2012) and Li et al. (2018).
Dataset v1 includes all values of the chosen studies, except those RPP estimates which have an SD (or SE) greater than the RPP.
Dataset v2 is further reduced with the following steps.
-
If N ≥ 5, the highest and smallest RPP estimates are excluded
-
If N=4, the most deviating value from the taxa-specific mean is excluded. An exception is as follows: if two values are from the same study (they are generally similar), their mean is calculated and used for the overall mean (Salix in North America; Betula, Fabaceae, and Larix in China; Rumex in Europe). The most deviating value is chosen based on the resulting mean. An exception in North America is as follows: Betula with four values from only two studies are all kept.
-
If N=3, a value is only excluded if it is strongly deviating (> 100 % of the mean of all values), like Caryophyllaceae in China (RPP of an unpublished study by Li et al. in Li et al. (2018)). Exceptions are as follows: in North America Asteraceae and in Europe Apiaceae with three values from only two studies are all kept, as the two similar ones came from the same study.
-
If N=2, all values are kept, except if one seems less reliable (Larix, Matthias et al., 2012).
Dataset v2 was created separately for each continent and is comparable to the Alt-1 dataset of Li et al. (2018) and PPE.st2 of Mazier et al. (2012).
To calculate the SE of averaged RPP estimates, the delta method (Stuart and Ord, 1994, details in the supplement of Li et al., 2020) was applied. For the calculation of an RPP from pollen counts, a variance–covariance matrix is created. If only RPP ± SD (or SE) are available, the covariance is set to 0 and the final equation results in
Some problems arise from the labelling of standard errors and standard deviations. While some studies provide standard deviations, others provide standard errors or give no information. Some studies provide standard deviations, which are labelled as standard errors in other studies. Given this ambiguity, we used every value as it is and noted whether standard deviation or standard error are said to be given.
2.2.3 Northern hemispheric dataset
The majority of RPP studies concentrate on China and Europe, with one study from Arctic Russia and few studies from North America. We thus decided to create a northern hemispheric dataset to be applied only for broad-scale studies for which RPP data for various taxa would otherwise be lacking. The dataset for the whole Northern Hemisphere was calculated with all data of the continental datasets.
We conducted Kruskal–Wallis tests on the dataset v2 between the continents for each taxon. Additionally, we conducted the tests on the variability between taxa, once for the Northern Hemisphere and separately for each continent, including only taxa with n>2. Statistical analyses have been conducted with R software, version 3.5.3 (R Core Team, 2019).
2.3 Fall speeds
To use RPP values with, for example, the REVEALS model, fall speeds are necessary for the distance weighting of pollen input. Fall speeds were extracted from the compiled literature of the RPP datasets. If several values were available for one taxon (see Table A4), we calculated the mean with unique values, so if several studies had the same fall speed for one taxon, we used only one of them. Taxonomic levels were combined according to Table 2. Fall speeds for continental datasets were calculated based on studies used for RPP data.
3.1 RPP compilation
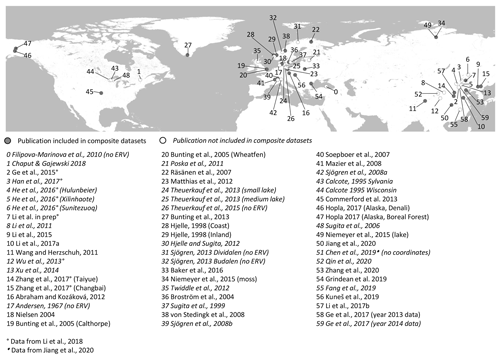
The compilation of RPP studies includes data from 49 studies, 43 of them using a form of the ERV model (Tables A1–A3, Wieczorek and Herzschuh, 2020; https://doi.org/10.1594/PANGAEA.922661). Twenty-nine studies used Poaceae as the reference taxon, while 20 studies used different taxa. The summary provides original RPP values with the given reference taxon. Only those used for the RPP datasets contain further RPP values recalibrated to Poaceae as the reference. An overview of all locations of the compiled RPP studies is given in Fig. 1, which clearly shows the absence of studies in Central Asia and large parts of Russia. Only a few studies have been conducted in North America. Not all studies provide information on the likelihood or RSAP, hampering the assessment of the reliability of the presented RPP values. Other studies do not provide standard deviations, leading to inaccurate results in subsequent applications.
Table 3Overview of continental and northern hemispheric relative pollen productivity (RPP) estimates for woody vegetation with their standard error (SE) (dataset v1) and fall speeds. All values are relative to Poaceae. See Table A1 for information on original RPP data, Table A4 for information on original fall speed values, and methods on the creation of dataset v1 (Wieczorek and Herzschuh, 2020, https://doi.org/10.1594/PANGAEA.922661).
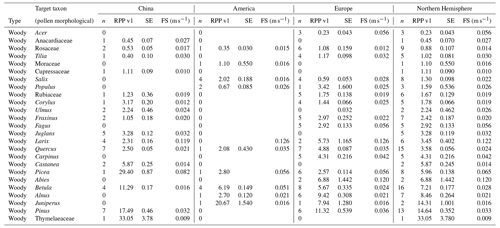
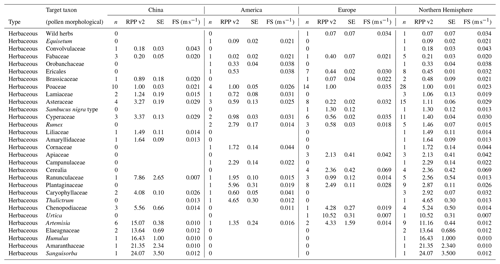
Table 4Overview of continental and northern hemispheric relative pollen productivity (RPP) values for herbaceous vegetation with their standard error (SE) (dataset v1) and fall speeds. All values are relative to Poaceae. See Table A1 for information on original RPP data, Table A4 for information on original fall speed values, and methods on the creation of dataset v1 (Wieczorek and Herzschuh, 2020, https://doi.org/10.1594/PANGAEA.922661). The group of wild herbs is taken from the publication of Matthias et al. (2012) and consists of uncultivated terrestrial herb pollen, including Poaceae, Plantago lanceolata, Rumex acetosa, R. acemsella, and Chenopodiacea.
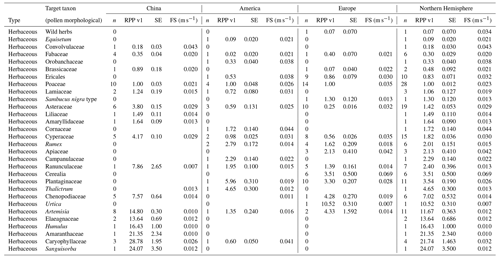
Table 5Overview of continental and northern hemispheric relative pollen productivity (RPP) values for woody vegetation with their standard error (SE) (dataset v2) and fall speeds. All values are relative to Poaceae. See Table A1 for information on original RPP data, Table A4 for information on original fall speed values, and methods on the creation of dataset v2 (Wieczorek and Herzschuh, 2020, https://doi.org/10.1594/PANGAEA.922661).
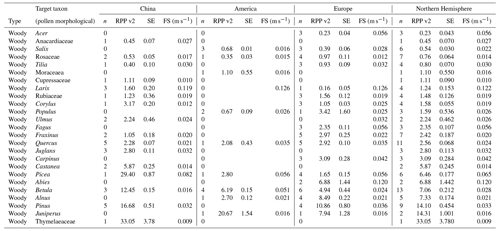
Table 6Overview of continental and northern hemispheric relative pollen productivity (RPP) values for herbaceous vegetation with their standard error (SE) (dataset v2) and fall speeds. All values are relative to Poaceae. See Table A1 for information on original RPP data, Table A4 for information on original fall speed values, and methods on the creation of dataset v2 (Wieczorek and Herzschuh, 2020, https://doi.org/10.1594/PANGAEA.922661). The group of wild herbs is taken from the publication of Matthias et al. (2012).
3.2 RPP datasets
Of 60 RPP datasets, 28 (coming from 23 studies) were excluded prior to the calculation of the combined RPP datasets.
Filipova-Marinova et al. (2010), Andersen (1967), Theuerkauf et al. (2015), Sjögren (2013), and Sjögren et al. (2008a, b) do not present RPP values based on ERV models.
The likelihood function score should decrease and approach an asymptote when reaching the RSAP (see Sect. 2). Within the sampled vegetation area, the curve does not approach an asymptote in the studies of Calcote (1995) and Chaput and Gajewski (2018), meaning that vegetation composition is not studied up to the RSAP. As Poaceae was not used as the referenced taxon, we decided to not use these data despite the scarcity of studies in North America. In the studies of Han et al. (2017) and Xu et al. (2014), the likelihood function score increases. We followed the assessment of Li et al. (2018) and did not incorporate these RPP estimates. The likelihood function score further increases in the study of Ge et al. (2017, year 2014 data). Data from He et al. (2016) are not used in accordance with Li et al. (2018), as pollen are sampled from a pollen trap, which might behave differently compared to moss pollsters or lakes. In the study of Hjelle and Sugita (2012), the likelihood function score does not approach an asymptote. Sugita et al. (1999, 2006) do not provide information on the likelihood, and RPP values are given without information on standard deviation or standard error. The studies of Twiddle et al. (2012) and Li et al. (2011) do not provide standard deviations or errors for the presented RPP values. The study of Wu et al. (2013, original publication in Chinese) was rejected by Li et al. (2018) because of a too large sampling area and we followed this assessment. Theuerkauf et al. (2013) does not provide information on the maximum likelihood or the RSAP. Data from Chen et al. (2019) were extracted from Jiang et al. (2020) but included insufficient information on the study design and the ERV approach. Data from the study of Qin et al. (2020) have been rejected as they had very high values for most taxa compared to other studies, which we assume was a systematic problem of the study. The study of Fang et al. (2019) was excluded because it was designed to test different methods for RPP estimation and was carried out in patchy vegetation without enough sites.
On the other hand, some studies were incorporated despite missing information or likelihood curves that did not meet our criteria.
Hjelle (1998) and Nielsen (2004) do not provide information on the likelihood but have been included in the dataset of Mazier et al. (2012, i.e. was assessed by an expert). Bunting et al. (2013) do not provide information on the likelihood nor do they sample vegetation up to the value of RSAP. The scarcity of data from North America together with Poaceae as a reference taxon led us to the decision to keep these RPP estimates. While the likelihood function score should decrease and reach an asymptote at the radius of the RSAP, the log-likelihood should increase before reaching the asymptote. This is not the case for the study of Commerford et al. (2013), but data have been included due to scarcity of North American studies. At the boreal forest site of Hopla (2017), the likelihood function score does not reach an asymptote. Again, these data have been included due to the scarcity of North American studies.
3.3 Continental and northern hemispheric RPP datasets
All RPP data in the final dataset are given relative to Poaceae. Of 49 publications covering 60 sites, 27 publications and 31 sites are included in the final PPE datasets (10 studies and 11 datasets for China, 14 studies and 16 datasets for Europe, 3 studies and 4 datasets for North America). We have RPP data for 33 taxa in China, 34 taxa in Europe, and 25 taxa in North America. The northern hemispheric dataset consists of RPP values and fall speeds for 55 taxa (Tables 3–6, Wieczorek and Herzschuh, 2020, https://doi.org/10.1594/PANGAEA.922661). Twenty-eight taxa are available in only one of the continental datasets (13 in China, 6 in North America, 9 in Europe).
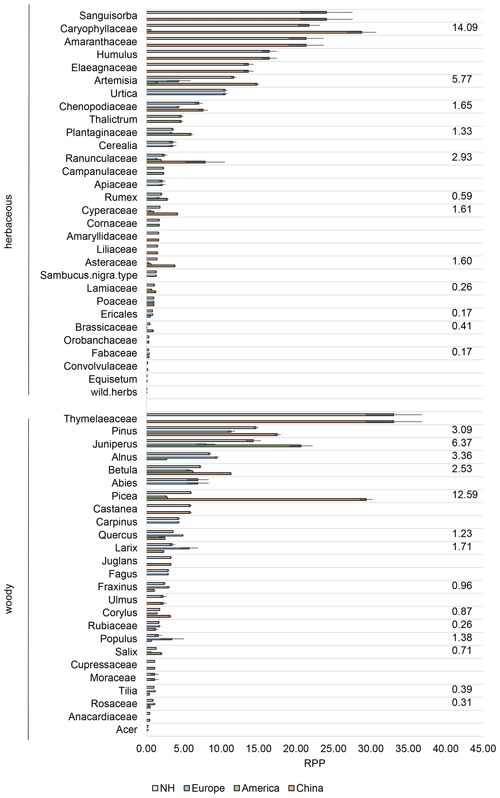
Figure 2Relative pollen productivity (RPP) dataset v1 including all continental mean RPP values with their standard error (SE), calculated with the delta method (see Sect. 2). Numbers to the right are the standard deviation (SD) between continental datasets, NH is Northern Hemisphere.
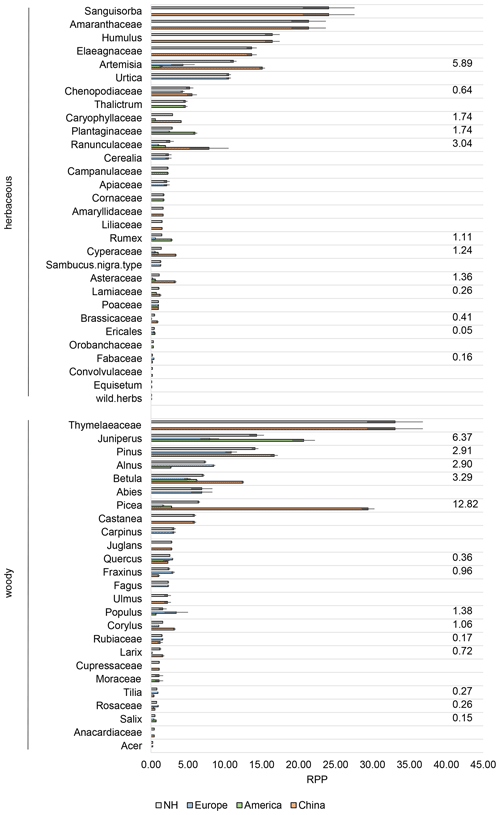
Figure 3Relative pollen productivity (RPP) dataset v2 including subsetted continental mean RPP values with their standard error (SE), calculated with the delta method (see Sect. 2). Numbers to the right are the standard deviation (SD) between continental datasets, NH is Northern Hemisphere.
In dataset v1, 11 RPP values have an SD < 1 between the different datasets, while 15 have an SD > 1 (Fig. 2). The size of RPP as well as the variability of RPP values between continents partly differs between datasets v1 and v2 (Figs. 2, 3).
Testing the RPP values used to create the combined dataset on the variability between taxa shows that the taxa themselves are significantly different from each other (Northern Hemisphere: Kruskal–Wallis chi-squared = 99.337, df = 29, p<0.001 with Acer, Alnus, Apiaceae, Artemisia, Asteraceae, Betula, Carpinus, Caryophyllaceae, Cerealia, Chenopodiaceae, Corylus, Cyperaceae, Ericales, Fabaceae, Fagus, Fraxinus, Juglans, Lamiaceae, Larix, Picea, Pinus, Plantaginaceae, Populus, Quercus, Ranunculaceae, Rosaceae, Rubiaceae, Rumex, Salix, Tilia; China: Kruskal–Wallis chi-squared = 27.599, df = 9, p<0.01, with Artemisia, Asteraceae, Betula, Chenopodiaceae, Cyperaceae, Fabaceae, Juglans, Larix, Pinus, Quercus; Europe: Kruskal–Wallis chi-squared = 56.5, df = 21, p<0.001, with Acer, Alnus, Apiaceae, Asteraceae, Betula, Carpinus, Cerealia, Corylus, Cyperaceae, Ericales, Fagus, Fraxinus, Picea, Pinus, Plantaginaceae, Quercus, Ranunculaceae, Rosaceae, Rubiaceae, Rumex, Salix, Tilia; North America: Kruskal–Wallis chi-squared = 6.7091, df = 2, p<0.05, with Asteraceae, Betula, Salix). Furthermore, while some taxa strongly differ between continents when looking at the absolute deviation (e.g. Artemisia, Fabaceae, or Larix) others show no large deviation from the overall northern hemispheric mean (e.g. Salix, Betula; Fig. 4). And while we found overall significant differences between taxa (described above), we did not find significant differences between datasets for single taxa (n=6) from two continents when applying the Kruskal–Wallis test, except for Asteraceae (Fig. 4). This means the differences between continents are rather small compared to differences between taxa.
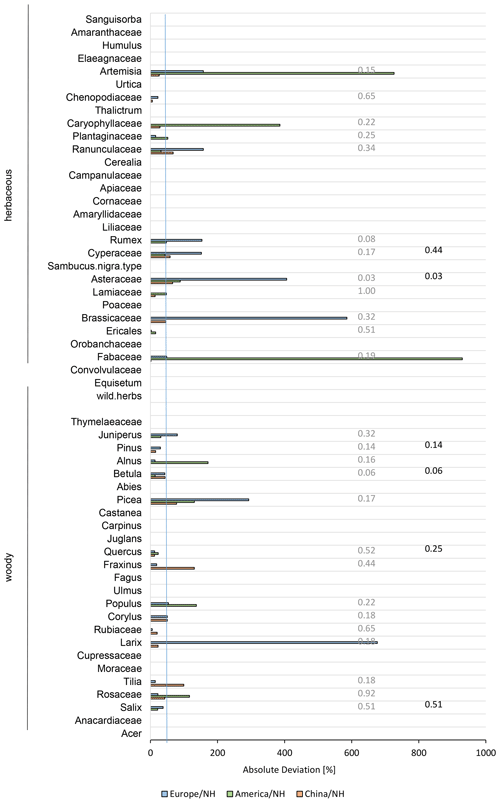
Figure 4Absolute percent deviation of the northern hemispheric relative pollen productivity (RPP) dataset v2 to each continental RPP dataset. Deviation is calculated by ABS((RPPcontinent − RPPNH) ∕ RPPcontinent)×100. The blue line indicates an absolute deviation of 50 %. Numbers on the right are p values of a Kruskal–Wallis test of each taxon between the three continents. Results shown in grey included each RPP set with data and black coloured values only those with N>2 RPP values in at least two continents.
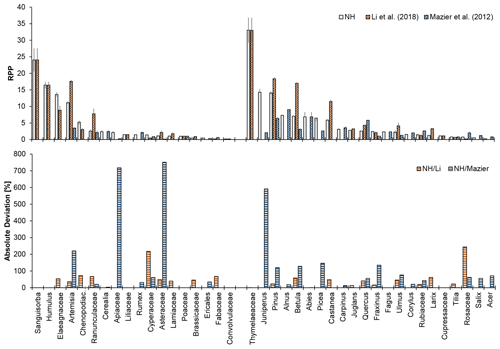
Figure 5Relative pollen productivity (RPP) values for selected taxa from different studies (upper panel) and absolute percentage deviation of the RPP northern hemispheric (NH) v2 dataset to previously published datasets (lower panel, calculated by ABS((RPPstudy − RPPNH) ∕ RPPstudy) × 100). Previously published datasets are the Alt-1 dataset of Li et al. (2018) and PPE.st2 of Mazier et al. (2012).
Comparison with taxa available in the compilations of Mazier et al. (2012, Europe) and Li et al. (2018, temperate China) clearly shows differences in absolute RPP values or a high absolute deviation for some taxa (Fig. 5, e.g. Juniperus, Artemisia, Rosaceae), while many others (e.g. Alnus, Quercus, or Ranunculaceae) have a similar range of values, especially when considering the absolute deviation.
4.1 RPP compilation
The compilation is, to our knowledge, the first overview of available RPP studies covering the whole Northern Hemisphere. It highlights data gaps with respect to certain regions and taxa and as such guides the design of future RPP studies. Good geographic coverage is, to date, limited to central/northern Europe and China (Fig. 1). RPP studies in Russian and North American boreal forests as well as in tropical regions are largely lacking. The compilation covers most common taxa, mostly at the genus level, but the taxonomic resolution of available RPP estimates varies between studies and depends on the level to which pollen has been identified. Furthermore, while some taxa have a large number of available RPP estimates, for 24 taxa (i.e. ∼ 40 %) only one or two datasets are available. By including additional metadata, our compilation is useful for the identification of available RPP sets at specific sites and regions and indicates how suitable they may be for further research. For many studies, however, missing details needed for the evaluation (e.g. information on the maximum likelihood method) or use (e.g. standard deviation) of the RPP values lower their usefulness. It should therefore be stated clearly whether data are presented with standard deviation or standard error.
4.2 Continental and hemispheric PPE datasets
Using RPP estimates for pollen-based quantitative vegetation reconstruction (Sugita, 2007; Theuerkauf et al., 2016) has improved our understanding of environmental change (e.g. Marquer et al., 2014). In this paper, we present RPP datasets for three continents and one dataset of northern hemispheric extratropical RPP estimates and corresponding fall speeds, based on a compilation of studies.
We found that RPP values partly vary between the three continental datasets. Some uncertainty arises due to the use of inconsistent reference taxa. Most studies used Poaceae, a widespread family, whose pollen is easy to identify and often preserved in a good state. However, as discussed by Broström et al. (2008), the pollen cannot be identified to the species level, and different studies may thus have used different species of Poaceae for the reference. Other taxa at higher taxonomic resolution such as Quercus or Acer are therefore sometimes used as the reference taxon (see Table A1, Wieczorek and Herzschuh (2020); https://doi.org/10.1594/PANGAEA.922661).
Reasons for variable RPP values have been discussed in depth by Broström et al. (2008) and Li et al. (2018) and are mainly methodological factors such as different sampling designs and environmental factors such as vegetation characteristics. Furthermore, pollen taxa from different sites can contain different species. Li et al. (2018) discussed in detail for Pinus and Artemisia that vegetation structure and climate of different Chinese study regions, but also methodological differences like the pollen sample type (moss vs. lake sediment) and vegetation sampling method, can explain the variability of RPP estimates within one taxon even better than the occurrence of different taxa. This will be even more apparent when combining data for the whole Northern Hemisphere. However, our compilation clearly indicates that taxa have mostly characteristic RPP values (i.e. within-species variability is low compared to variability between species), while we found no significant differences between continents (i.e. variability within continents is not lower than variability between continents). This implies, when aiming to compare vegetation change between continents, that transformation of pollen data using RPP from another continent is better than keeping the data untransformed. While one has to keep in mind the limited amount of data influencing the statistical power, we conclude that there is no particular reason to not set up a northern hemispheric RPP dataset. Still, before applying one of the datasets presented, researchers should consult the original publication to be sure it fits their needs and standards and be aware of the rather problematic use of SD and SE, which might have influenced our presented SEs.
The RPP compilation as well as the taxonomically harmonised continental RPP datasets are available at https://doi.org/10.1594/PANGAEA.922661 (Wieczorek and Herzschuh, 2020).
The RPP compilation can be used to get a good overview of existing RPP studies, to identify research gaps, and to find RPP estimates to apply at one's study area. It is important (i) to use only those RPP data which have been evaluated by experts or the author as best fit and (ii) to look at the original publication for further information on how the RPP estimates have been generated.
The continental datasets can be applied to assess vegetation changes using broad-scale pollen datasets. It is important to keep in mind that different taxa with different pollen productivities and dispersal abilities are combined in one RPP value and the application to such broad-scale datasets can only be an approximation. This is especially important for the northern hemispheric dataset, which should not be applied to calculate site-specific vegetation compositions. This dataset fills data gaps of RPP values in various regions, but at the cost of accuracy. We consider the presented averaged RPP values as a tool for data transformation to be applied to broad-scale pollen datasets. Using the dataset in this way can account for differences in pollen productivities and transportation rather than obtaining fully reliable quantitative information about the vegetation cover around a specific site.
MW and UH designed the study and wrote the manuscript. MW carried out the analyses and produced the tables and figures.
The authors declare that they have no conflict of interest.
The study was supported by and conducted as part of the ERC consolidator grant “GlacialLegacy” (call: ERC-2017-COG, project reference: 772852) and PalMod Initiative (grant 01LP1510C). We thank all scientists conducting research on pollen productivity, whose previous work and published data made our compilation possible. We would like to thank Marie-José Gaillard and the anonymous referee for taking the time to give us very helpful and constructive reviews and suggestions to improve our dataset and manuscript. We thank C. Jenks for language editing on a previous version of the paper.
This research has been supported by the European Research Council (GlacialLegacy, grant no. 772852) and the PalMod Initiative (grant no. 01LP1510C).
This paper was edited by Thomas Blunier and reviewed by Marie-Jose Gaillard and one anonymous referee.
Abraham, V. and Kozáková, R.: Relative pollen productivity estimates in the modern agricultural landscape of Central Bohemia (Czech Republic), Rev. Palaeobot. Palyno., 179, 1–12, https://doi.org/10.1016/j.revpalbo.2012.04.004, 2012.
Andersen, S. Th.: Tree-pollen rain in a mixed deciduous forest in South Jutland (Denmark), Rev. Palaeobot. Palyno., 3, 267–275, https://doi.org/10.1016/0034-6667(67)90059-0, 1967.
Baker, A. G., Zimny, M., Keczyński, A., Bhagwat, S. A., Willis, K. J. and Latałowa, M.: Pollen productivity estimates from old-growth forest strongly differ from those obtained in cultural landscapes: Evidence from the Białowieża National Park, Poland, The Holocene, 26, 80–92, https://doi.org/10.1177/0959683615596822, 2016.
Bartlein, P. J., Webb, T., and Fleri, E.: Holocene climatic change in the northern Midwest: Pollen-derived estimates, Quaternary Res., 22, 361–374, https://doi.org/10.1016/0033-5894(84)90029-2, 1984.
Binney, H. A., Gething, P. W., Nield, J. M., Sugita, S., and Edwards, M. E.: Tree line identification from pollen data: beyond the limit?, J. Biogeogr., 38, 1792–1806, https://doi.org/10.1111/j.1365-2699.2011.02507.x, 2011.
Broström, A.: Estimating source area of pollen and pollen productivity in the cultural landscapes of southern Sweden – developing a palynological tool for quantifying past plant cover, Quaternary Sci., Department of Geology, Lund University, available at: http://lup.lub.lu.se/record/464945 (last access: 26 November 2018), 2002.
Broström, A., Sugita, S., and Gaillard, M.-J.: Pollen productivity estimates for the reconstruction of past vegetation cover in the cultural landscape of southern Sweden, The Holocene, 14, 368–381, https://doi.org/10.1191/0959683604hl713rp, 2004.
Broström, A., Nielsen, A. B., Gaillard, M.-J., Hjelle, K., Mazier, F., Binney, H., Bunting, J., Fyfe, R., Meltsov, V., Poska, A., Räsänen, S., Soepboer, W., von Stedingk, H., Suutari, H., and Sugita, S.: Pollen productivity estimates of key European plant taxa for quantitative reconstruction of past vegetation: a review, Veget. Hist. Archaeobot, 17, 461–478, https://doi.org/10.1007/s00334-008-0148-8, 2008.
Bunting, M. J. and Hjelle, K. L.: Effect of vegetation data collection strategies on estimates of relevant source area of pollen (RSAP) and relative pollen productivity estimates (relative PPE) for non-arboreal taxa, Veget. Hist. Archaeobot., 19, 365–374, https://doi.org/10.1007/s00334-010-0246-2, 2010.
Bunting, M. J., Armitage, R., Binney, H. A., and Waller, M.: Estimates of “relative pollen productivity” and “relevant source area of pollen” for major tree taxa in two Norfolk (UK) woodlands, The Holocene, 15, 459–465, https://doi.org/10.1191/0959683605hl821rr, 2005.
Bunting, M. J., Schofield, J. E., and Edwards, K. J.: Estimates of relative pollen productivity (RPP) for selected taxa from southern Greenland: A pragmatic solution, Rev. Palaeobot. Palyno., 190, 66–74, https://doi.org/10.1016/j.revpalbo.2012.11.003, 2013.
Calcote, R.: Pollen source area and pollen productivity: evidence from forest hollows, J. Ecol., 83, 591–602, https://doi.org/10.2307/2261627, 1995.
Chaput, M. A. and Gajewski, K.: Relative pollen productivity estimates and changes in Holocene vegetation cover in the deciduous forest of southeastern Québec, Canada, Botany, 96, 299–317, https://doi.org/10.1139/cjb-2017-0193, 2018.
Chen, H., Xu, Q. H., Zhang, S. R., Sun, Y., Wang, M., and Zhou, Z.: Relative pollen productivity estimates of subtropical evergreen and deciduous broadleaved mixed forest in Ta-pieh Mountains, Quat. Sci., 39,469–482, 2019 (in Chinese).
Commerford, J. L., McLauchlan, K. K., and Sugita, S.: Calibrating vegetation cover and grassland pollen assemblages in the Flint Hills of Kansas, USA, Am. J. Plant Sci., 4, 1–10, https://doi.org/10.4236/ajps.2013.47A1001, 2013.
Duffin, K. I. and Bunting, M. J.: Relative pollen productivity and fall speed estimates for southern African savanna taxa, Veget. Hist. Archaeobot., 17, 507–525, https://doi.org/10.1007/s00334-007-0101-2, 2008.
Fang, Y., Ma, C., and Bunting, M. J.: Novel methods of estimating relative pollen productivity: A key parameter for reconstruction of past land cover from pollen records, Progress Phys. Geogr., 43, 731–753, https://doi.org/10.1177/0309133319861808, 2019.
Filipova-Marinova, M. V., Kvavadze, E. V., Connor, S. E., and Sjögren, P.: Estimating absolute pollen productivity for some European Tertiary-relict taxa, Veget. Hist. Archaeobot., 19, 351–364, https://doi.org/10.1007/s00334-010-0257-z, 2010.
Ge, Y., Li, Y., Yang, X., Zhang, R., and Xu, Q.: Relevant source area of pollen and relative pollen productivity estimates in Bashang steppe, Quat. Sci., 35, 934–945, 2015 (in Chinese with English abstract).
Ge, Y., Li, Y., Bunting, M. J., Li, B., Li, Z., and Wang, J.: Relation between modern pollen rain, vegetation and climate in northern China: Implications for quantitative vegetation reconstruction in a steppe environment, Sci. Total Environ., 586, 25–41, https://doi.org/10.1016/j.scitotenv.2017.02.027, 2017.
Grindean, R., Nielsen, A. B., Tanţău, I., and Feurdean, A.: Relative pollen productivity estimates in the forest steppe landscape of southeastern Romania, Rev. Palaeobot. Palyno., 264, 54–63, https://doi.org/10.1016/j.revpalbo.2019.02.007, 2019.
Han, Y., Liu, H., Hao, Q., Liu, X., Guo, W., and Shangguan, H.: More reliable pollen productivity estimates and relative source area of pollen in a forest-steppe ecotone with improved vegetation survey, The Holocene, 27, 1567–1577, https://doi.org/10.1177/0959683617702234, 2017.
He, F., Li, Y., Wu, J., and Xu, Y.: A comparison of relative pollen productivity from forest steppe, typical steppe and desert steppe in Inner Mongolia, Chin. Sci. Bull., 61, 3388–3400, https://doi.org/10.1360/N972016-00482, 2016 (in Chinese with English abstract).
Heide, K. M. and Bradshaw, R.: The pollen – Tree relationship within forests of Wisconsin and Upper Michigan, U.S.A., Rev. Palaeobot. Palynolo., 36, 1–23, https://doi.org/10.1016/0034-6667(82)90011-2, 1982.
Hellman, S. E. V., Gaillard, M., Broström, A., and Sugita, S.: Effects of the sampling design and selection of parameter values on pollen-based quantitative reconstructions of regional vegetation: a case study in southern Sweden using the REVEALS model, Veget. Hist. Archaeobot., 17, 445–459, https://doi.org/10.1007/s00334-008-0149-7, 2008.
Hjelle, K. L.: Herb pollen representation in surface moss samples from mown meadows and pastures in western Norway, Veget Hist Archaebot, 7, 79–96, https://doi.org/10.1007/BF01373926, 1998.
Hjelle, K. L. and Sugita, S.: Estimating pollen productivity and relevant source area of pollen using lake sediments in Norway: How does lake size variation affect the estimates?, The Holocene, 22, 313–324, https://doi.org/10.1177/0959683611423690, 2012.
Hopla, E.-J.: A new perspective on Quaternary land cover in central Alaska, PhD thesis, University of Southampton, available at: https://eprints.soton.ac.uk/422162/ (last access: 21 January 2019), 2017.
Jiang, F., Xu, Q., Zhang, S., Li, F., Zhang, K., Wang, M., Shen, W., Sun, Y., and Zhou, Z.: Relative pollen productivities of the major plant taxa of subtropical evergreen–deciduous mixed woodland in China, J. Quat. Sci., 35, 526–538, https://doi.org/10.1002/jqs.3197, 2020.
Kuneš, P., Abraham, V., Werchan, B., Plesková, Z., Fajmon, K., Jamrichová, E., and Roleček, J.: Relative pollen productivity estimates for vegetation reconstruction in central-eastern Europe inferred at local and regional scales, The Holocene, 29, 1708–1719, https://doi.org/10.1177/0959683619862026, 2019.
Li, F., Gaillard, M.-J., Sugita, S., Mazier, F., Xu, Q., Zhou, Z., Zhang, Y., Li, Y., and Laffly, D.: Relative pollen productivity estimates for major plant taxa of cultural landscapes in central eastern China, Veget. Hist. Archaeobot., 26, 587–605, https://doi.org/10.1007/s00334-017-0636-9, 2017.
Li, F., Gaillard, M.-J., Xu, Q., Bunting, M. J., Li, Y., Li, J., Mu, H., Lu, J., Zhang, P., Zhang, S., Cui, Q., Zhang, Y., and Shen, W.: A Review of Relative Pollen Productivity Estimates From Temperate China for Pollen-Based Quantitative Reconstruction of Past Plant Cover, Front. Plant Sci., 9, 1214, https://doi.org/10.3389/fpls.2018.01214, 2018.
Li, F., Gaillard, M.-J., Cao, X., Herzschuh, U., Sugita, S., Tarasov, P. E., Wagner, M., Xu, Q., Ni, J., Wang, W., Zhao, Y., An, C., Beusen, A. H. W., Chen, F., Feng, Z., Goldewijk, C. G. M. K., Huang, X., Li, Y., Li, Y., Liu, H., Sun, A., Yao, Y., Zheng, Z., and Jia, X.: Towards quantification of Holocene anthropogenic land-cover change in temperate China: A review in the light of pollen-based REVEALS reconstructions of regional plant cover, Earth-Sci. Rev., 203, 103119, https://doi.org/10.1016/j.earscirev.2020.103119, 2020.
Li, H., Liu, X., Herzschuh, U., Cao, X., Yu, Z., and Wang, Y.: Vegetation and climate changes since the middle MIS 3 inferred from a Wulagai Lake pollen record, Inner Mongolia, Northeastern China, Rev. Palaeobot. Palyno., 262, 44–51, https://doi.org/10.1016/j.revpalbo.2018.12.006, 2019.
Li, Y., Bunting, M. J., Xu, Q., Jiang, S., Ding, W., and Hun, L.: Pollen–vegetation–climate relationships in some desert and desert-steppe communities in northern China, The Holocene, 21, 997–1010, https://doi.org/10.1177/0959683611400202, 2011.
Li, Y., Nielsen, A. B., Zhao, X., Shan, L., Wang, S., Wu, J., and Zhou, L.: Pollen production estimates (PPEs) and fall speeds for major tree taxa and relevant source areas of pollen (RSAP) in Changbai Mountain, northeastern China, Rev. Palaeobot. Palyno., 216, 92–100, https://doi.org/10.1016/j.revpalbo.2015.02.003, 2015.
Li, Y., Ge, Y., Bunting, J., Zhang, Z., Li, L., Wang, C., Li, B., and Li, C.: Relative pollen productivities and relevant source area of pollen in the forest–steppe ecotone of northern China, Rev. Palaeobot. Palyno., 244, 1–12, https://doi.org/10.1016/j.revpalbo.2017.04.003, 2017.
Marquer, L., Gaillard, M.-J., Sugita, S., Trondman, A.-K., Mazier, F., Nielsen, A. B., Fyfe, R. M., Odgaard, B. V., Alenius, T., Birks, H. J. B., Bjune, A. E., Christiansen, J., Dodson, J., Edwards, K. J., Giesecke, T., Herzschuh, U., Kangur, M., Lorenz, S., Poska, A., Schult, M., and Seppä, H.: Holocene changes in vegetation composition in northern Europe: why quantitative pollen-based vegetation reconstructions matter, Quat. Sci. Rev., 90, 199–216, https://doi.org/10.1016/j.quascirev.2014.02.013, 2014.
Matthias, I., Nielsen, A. B., and Giesecke, T.: Evaluating the effect of flowering age and forest structure on pollen productivity estimates, Veget. Hist. Archaeobot., 21, 471–484, https://doi.org/10.1007/s00334-012-0373-z, 2012.
Mazier, F., Broström, A., Gaillard, M.-J., Sugita, S., Vittoz, P., and Buttler, A.: Pollen productivity estimates and relevant source area of pollen for selected plant taxa in a pasture woodland landscape of the Jura Mountains (Switzerland), Veget. Hist. Archaeobot, 17, 479–495, https://doi.org/10.1007/s00334-008-0143-0, 2008.
Mazier, F., Gaillard, M.-J., Kuneš, P., Sugita, S., Trondman, A.-K., and Broström, A.: Testing the effect of site selection and parameter setting on REVEALS-model estimates of plant abundance using the Czech Quaternary Palynological Database, Rev. Palaeobot. Palyno., 187, 38–49, https://doi.org/10.1016/j.revpalbo.2012.07.017, 2012.
McLauchlan, K. K., Barnes, C. S., and Craine, J. M.: Interannual variability of pollen productivity and transport in mid-North America from 1997 to 2009, Aerobiologia, 27, 181–189, https://doi.org/10.1007/s10453-010-9186-7, 2011.
Nielsen, A. B.: Modelling pollen sedimentation in Danish lakes at c.AD 1800: an attempt to validate the POLLSCAPE model, J. Biogeogr., 31, 1693–1709, https://doi.org/10.1111/j.1365-2699.2004.01080.x, 2004.
Niemeyer, B., Klemm, J., Pestryakova, L. A., and Herzschuh, U.: Relative pollen productivity estimates for common taxa of the northern Siberian Arctic, Rev. Palaeobot. Palyno., 221, 71–82, https://doi.org/10.1016/j.revpalbo.2015.06.008, 2015.
Poska, A., Meltsov, V., Sugita, S., and Vassiljev, J.: Relative pollen productivity estimates of major anemophilous taxa and relevant source area of pollen in a cultural landscape of the hemi-boreal forest zone (Estonia), Rev. Palaeobot. Palyno., 167, 30–39, https://doi.org/10.1016/j.revpalbo.2011.07.001, 2011.
Prentice, I. C.: Pollen representation, source area, and basin size: Toward a unified theory of pollen analysis, Quat. Res., 23, 76–86, https://doi.org/10.1016/0033-5894(85)90073-0, 1985.
Prentice, I. C. and Webb, T.: Pollen percentages, tree abundances and the Fagerlind effect, J. Quat. Sci., 1, 35–43, https://doi.org/10.1002/jqs.3390010105, 1986.
Qin, F., Bunting, M. J., Zhao, Y., Li, Q., Cui, Q., and Ren, W.: Relative pollen productivity estimates for alpine meadow vegetation, northeastern Tibetan Plateau, Veget. Hist. Archaeobot., 29, 447–462, https://doi.org/10.1007/s00334-019-00751-4, 2020.
Räsänen, S., Suutari, H., and Nielsen, A. B.: A step further towards quantitative reconstruction of past vegetation in Fennoscandian boreal forests: Pollen productivity estimates for six dominant taxa, Rev. Palaeobot. Palyno., 146, 208–220, https://doi.org/10.1016/j.revpalbo.2007.04.004, 2007.
R Core Team: R: A language and environment for statistical computing, R Foundation for Statistical Computing, Vienna, Austria, available at: https://www.R-project.org/, last access: 11 March 2019.
Sjögren, P.: A pilot study on absolute pollen productivity estimates from mires in Norway, The Holocene, 23, 1487–1492, https://doi.org/10.1177/0959683613489582, 2013.
Sjögren, P., van Leeuwen, J. F. N., van der Knaap, W. O., and van der Borg, K.: The effect of climate variability on pollen productivity, AD 1975–2000, recorded in a Sphagnum peat hummock, The Holocene, 16, 277–286, https://doi.org/10.1191/0959683606hl924rp, 2006.
Sjögren, P., van der Knaap, W. O., O. Kaplan, J., van Leeuwen, J. F. N., and Ammann, B.: A pilot study on pollen representation of mountain valley vegetation in the central Alps, Rev. Palaeobot. Palyno., 149, 208–218, https://doi.org/10.1016/j.revpalbo.2007.12.006, 2008a.
Sjögren, P., van der Knaap, W. O., Huusko, A., and van Leeuwen, J. F. N.: Pollen productivity, dispersal, and correction factors for major tree taxa in the Swiss Alps based on pollen-trap results, Rev. Palaeobot. Palyno., 152, 200–210, https://doi.org/10.1016/j.revpalbo.2008.05.003, 2008b.
Soepboer, W., Sugita, S., Lotter, A. F., van Leeuwen, J. F. N., and van der Knaap, W. O.: Pollen productivity estimates for quantitative reconstruction of vegetation cover on the Swiss Plateau, The Holocene, 17, 65–77, https://doi.org/10.1177/0959683607073279, 2007.
Soepboer, W., Vervoort, J. M., Sugita, S., and Lotter, A. F.: Evaluating Swiss pollen productivity estimates using a simulation approach, Veget. Hist. Archaeobot., 17, 497–506, https://doi.org/10.1007/s00334-007-0128-4, 2008.
Stuart, A. and Ord, J. K.: Kendall's Advanced Theory of Statistic, Vol. 1, Distribution Theory, Edward Arnold, London, 1994.
Sugita, S.: Pollen Representation of Vegetation in Quaternary Sediments: Theory and Method in Patchy Vegetation, J. Ecol., 82, 881–897, https://doi.org/10.2307/2261452, 1994.
Sugita, S.: Theory of quantitative reconstruction of vegetation I: pollen from large sites REVEALS regional vegetation composition, The Holocene, 17, 229–241, https://doi.org/10.1177/0959683607075837, 2007.
Sugita, S., Gaillard, M.-J., and Broström, A.: Landscape openness and pollen records: a simulation approach, The Holocene, 9, 409–421, https://doi.org/10.1191/095968399666429937, 1999.
Sugita, S., Parshall, T., and Calcote, R.: Detecting differences in vegetation among paired sites using pollen records, The Holocene, 16, 1123–1135, https://doi.org/10.1177/0959683606069406, 2006.
Sugita, S., Hicks, S., and Sormunen, H.: Absolute pollen productivity and pollen–vegetation relationships in northern Finland, J. Quat. Sci., 25, 724–736, https://doi.org/10.1002/jqs.1349, 2010.
Theuerkauf, M., Kuparinen, A., and Joosten, H.: Pollen productivity estimates strongly depend on assumed pollen dispersal, The Holocene, 23, 14–24, https://doi.org/10.1177/0959683612450194, 2013.
Theuerkauf, M., Dräger, N., Kienel, U., Kuparinen, A., and Brauer, A.: Effects of changes in land management practices on pollen productivity of open vegetation during the last century derived from varved lake sediments, The Holocene, 25, 733–744, https://doi.org/10.1177/0959683614567881, 2015.
Theuerkauf, M., Couwenberg, J., Kuparinen, A., and Liebscher, V.: A matter of dispersal: REVEALSinR introduces state-of-the-art dispersal models to quantitative vegetation reconstruction, Veget Hist Archaeobot, 25, 541–553, https://doi.org/10.1007/s00334-016-0572-0, 2016.
Trondman, A.-K., Gaillard, M.-J., Mazier, F., Sugita, S., Fyfe, R., Nielsen, A. B., Twiddle, C., Barratt, P., Birks, H. J. B., Bjune, A. E., Björkman, L., Broström, A., Caseldine, C., David, R., Dodson, J., Dörfler, W., Fischer, E., Geel, B. van, Giesecke, T., Hultberg, T., Kalnina, L., Kangur, M., Knaap, P. van der, Koff, T., Kuneš, P., Lagerås, P., Latałowa, M., Lechterbeck, J., Leroyer, C., Leydet, M., Lindbladh, M., Marquer, L., Mitchell, F. J. G., Odgaard, B. V., Peglar, S. M., Persson, T., Poska, A., Rösch, M., Seppä, H., Veski, S., and Wick, L.: Pollen-based quantitative reconstructions of Holocene regional vegetation cover (plant-functional types and land-cover types) in Europe suitable for climate modelling, Glob. Change Biol., 21, 676–697, https://doi.org/10.1111/gcb.12737, 2015.
Twiddle, C. L., Jones, R. T., Caseldine, C. J., and Sugita, S.: Pollen productivity estimates for a pine woodland in eastern Scotland: The influence of sampling design and vegetation patterning, Rev. Palaeobot. Palyno., 174, 67–78, https://doi.org/10.1016/j.revpalbo.2011.12.006, 2012.
von Stedingk, H., Fyfe, R. M., and Allard, A.: Pollen productivity estimates from the forest–tundra ecotone in west-central Sweden: implications for vegetation reconstruction at the limits of the boreal forest, The Holocene, 18, 323–332, https://doi.org/10.1177/0959683607086769, 2008.
Wang, Y. and Herzschuh, U.: Reassessment of Holocene vegetation change on the upper Tibetan Plateau using the pollen-based REVEALS model, Rev. Palaeobot. Palyno., 168, 31–40, https://doi.org/10.1016/j.revpalbo.2011.09.004, 2011.
Wieczorek, M. and Herzschuh, U.: Compilation of pollen productivity estimates and taxonomically harmonised relative pollen productivity (RPP) datasets for Europe, northern America, China and the Northern Hemisphere extratropics, PANGAEA, https://doi.org/10.1594/PANGAEA.922661, 2020.
Wu, J., Ma, Y., Sang, Y., Meng, H., and Hu, C.: Quantitative reconstruction of palaeovegetation and development R-values model: an application of R-value and ERV model in Xinglong Mountain natural protection region, Quat. Sci., 33, 554–564, https://doi.org/10.3969/j.issn.1001-7410.2013.03.16, 2013 (in Chinese with English abstract).
Xu, Q., Cao, X., Tian, F., Zhang, S., Li, Y., Li, M., Li, J., Liu, Y., and Liang, J.: Relative pollen productivities of typical steppe species in northern China and their potential in past vegetation reconstruction, Sci. China Earth Sci., 57, 1254–1266, https://doi.org/10.1007/s11430-013-4738-7, 2014.
Zhang, P.-P., Xu, Q.-H., Gaillard, M.-J., Mu, H.-S., Zhang, Y.-H., and Lu, J.-Y.: Research of main plant species' relative pollen productivities and relevant source area of temperate coniferous and broad-leaved mixed forest in Northern China, Quat. Sci., 37, 1429–1443, https://doi.org/10.11928/j.issn.1001-7410.2017.06.24, 2017 (in Chinese with English abstract).
Zhang, Y., Wei, Q., Zhang, Z., Xu, Q., Gao, W., and Li, Y.: Relative pollen productivity estimates of major plant taxa and relevant source area of pollen in the warm-temperate forest landscape of northern China, Veget. Hist. Archaeobot., https://doi.org/10.1007/s00334-020-00779-x, 2020.


