the Creative Commons Attribution 4.0 License.
the Creative Commons Attribution 4.0 License.
 | 15 Dec 2020
A status report on a section-based stratigraphic and palaeontological database – the Geobiodiversity Database
Yan-Sen Chen
Big data are significant for quantitative analysis and contribute to data-driven scientific research and discoveries. Here a brief introduction is given to the Geobiodiversity Database (GBDB), a comprehensive stratigraphic and palaeontological database, and its data. The GBDB includes abundant geological records from China and has supported a series of scientific studies on the Paleozoic palaeogeography and tectonic and biodiversity evolution of China. The data that the GBDB has including those that are newly collected are described in detail; the statistical results and structure of the data are given. A comparison between the GBDB; the largest palaeobiological database, the Paleobiology Database (PBDB); and the geological rock database Macrostrat is drawn. The GBDB and other databases are complementary in palaeontological and stratigraphic research. The GBDB will continually provide users access to detailed palaeontological and stratigraphic data based on publications. Non-structured data of palaeontology and stratigraphy will also be included in the GBDB, and they will be organically correlated with the existing data of the GBDB, making the GBDB more widely used for both researchers and anyone who is interested in fossils and strata. The GBDB fossil and stratum dataset (Xu, 2020) is freely downloadable from https://doi.org/10.5281/zenodo.4245604.
- Article
(5182 KB) - Full-text XML
- BibTeX
- EndNote


Palaeontology and stratigraphy have become a quantitative discipline of geoscience, and there has been a subsequent rapid increase in the implementation of numerical methods in palaeontology and stratigraphy that started in the 1960s (Shaw, 1964; Schwarzacher, 1975; Kemple et al., 1989, 1995; Sepkoski, 1992, 2002; Alroy et al., 2001; Hammer and Harper, 2006; Rong et al., 2007). Quantitative analysis based on big data of fossil and stratum records has been more common recently, especially on the study of biodiversity evolution (Alroy, 1998, 2001; Alroy et al., 2008; Hautmann, 2016; Fan et al., 2020), graphic correlation of strata (Kemple et al., 1989; Fan et al., 2013b), palaeoecology (Muscente et al., 2018), mass extinction (Muscente et al., 2019), and palaeogeography (Ke et al., 2016; Hou et al., 2020). There are professional databases, such as the Paleobiology Database (PBDB), Macrostrat (https://macrostrat.org/, last access: 1 November 2020), and the Geobiodiversity Database (GBDB), storing and providing a big volume of fossil record data and making a number of quantitative studies possible. Well-structured stratigraphic and palaeontological databases and user-friendly, accessible data are significant for the quantitative development of the discipline and, furthermore, push forward digital Earth science in the era of big data (Guo, 2017). In this paper, we show the update and the improvement of a comprehensive database of stratigraphy and palaeontology biodiversity, the Geobiodiversity Database (GBDB), and its data, brief history, and development. Comparisons between related databases are also given.
The Geobiodiversity Database (GBDB) was started in 2006 and has provided an online service since 2007 when there was a strong and urgent demand for the quantitative understanding of fossil and stratum records from China, which was initially supported by the national project of “Organism origination, radiation, extinction and recovery during the key geological ages” (973 Program) (Rong et al., 2006, 2007). At that time the PBDB (Paleobiology Database) was a large palaeontological database that included plenty of fossil occurrence data from the publications of European languages; however, fossil and stratum data from China were temporarily ignored because of the obstacle of language or the relatively smaller contribution from China. The initial purpose of the GBDB was to accommodate fossil and stratum data and data of the geological section as well as fossil collections from China and furthermore to recognize biodiversity change occurring in the geological ages of China (Rong et al., 2006).
At the start of the GBDB, there were at most 10 data entry clerks, including master's or PhD students, assistant professors, and non-professional employees, digitalizing palaeotological and stratigraphic descriptions “from the page into cyberspace” (Normile, 2019) and aligning these data with standards that are acceptable to international researchers so that a researcher could quickly link to them to carry on quantitative analysis that would likely have omitted Chinese data previously. The GBDB was designed to facilitate regional and global scientific collaborations focusing on palaeobiodiversity, systematics, palaeogeography, palaeoecology, regional correlation, and quantitative stratigraphy.
Basic functions of data input and output were gradually added and enhanced. In 2013, a huge number of palaeontological and stratigraphic data were included in the GBDB, such as taxonomy, identification features, occurrence, opinion, lithostratigraphy, biostratigraphy, chemostratigraphy, radio isotopic dating, reference, and palaeogeographic maps (Fan et al., 2013a, 2014). Additionally, there were embedded a few online statistical and visualization tools, such as TimeScale Creator (integrated into the GBDB in 2010), a stratigraphic visualization tool designed by Jim Ogg and Adam Lugowski (https://timescalecreator.org/index/index.php, last access: December 2020), and GeoVisual (integrated into the GBDB in 2010 and updated in 2012), a tool used for geographic visualization and preliminary biogeographic analysis.
One of the exclusive features of the GBDB is its abundant geological-section data, which are readily exported to several correlation tools, such as constrained optimization (CONOP) (Kemple et al., 1995) and SinoCor. SinoCor was designed and updated by Fan et al. (2002) and Fan and Zhang (2000, 2004). Its correlation resembles CONOP but requires a unique file format. SinoCor and CONOP are individual outgrowths of graphic correlation. The geological-section data of the GBDB can also be used in other professional tools, such as Graphcore, PAST, and CONMAN (see Hammer and Harper, 2006; Fan et al., 2013b).
The GBDB became the formal database of the International Commission on Stratigraphy in August 2012 at the 34th International Geological Congress in Brisbane, Australia, and, as a result, the GBDB achieved the goal of integrating stratigraphic standards (e.g. the Global Boundary Stratotype Sections and Points, GSSPs) with comprehensive and authoritative web-based stratigraphic information services for global geoscientists, educators, and the public.
Since 2011, stratigraphic and palaeontological data related to the early Paleozoic, especially the Ordovician and Silurian periods, have been quantitatively analysed and a series of scientific findings have been published. The research themes included the Ordovician and Silurian palaeogeography and tectonic evolution of South China (X. Chen et al., 2012, 2014, 2017), the spatio-temporal pattern of the Ordovician and Silurian marine organisms from China (Q. Chen et al., 2014; Z. Chen et al., 2017; Zhang et al., 2014a, 2016), Permian–Triassic transition and extinction (Shen et al., 2011, 2013; Wang et al., 2014; Ke et al., 2016), and the Paleozoic palaeogeography evolution of South China (Chen et al., 2018; Zhang et al., 2014b; Hou et al., 2020). Recently, nearly all data of Paleozoic marine organisms of the GBDB were used to analyse biodiversity evolution (Fan et al., 2020). Though all data were from China, the Paleozoic geological sections of China cover several palaeocontinents and can be acknowledged to reflect global biodiversity change.
In 2017, the GBDB became a data partner of the British Geological Survey (BGS) and started to digitalize the fossil and stratum data and establish the datasets for the BGS. This is a time-consuming task and still ongoing by the GBDB data entry team. The BGS has amassed and housed about 3 million fossils gathered over more than 150 years at thousands of sites across the British Islands.
At the end of 2018, the manager of the GBDB, Juan-Xuan Fan, left the Nanjing Institute of Geology and Palaeontology (NIGP), Chinese Academy of Sciences (CAS), and Hong-He Xu took over the GBDB. Since 2019, the new working group has continued the same GBDB work of data collecting, processing, and visualization as that which the GBDB group did during 2007–2018, inputting more data of fossil terrestrial organisms (e.g. insects and plants) and re-designing the database and the website according to feedback collected from GBDB users. The GBDB is ushering in a new approach.
The Geobiodiversity Database (GBDB) was designed as a stratigraphic and palaeontological database, and its input format was designed as geological-section-based, which means that data entry clerks or any scientific users must input the metadata for the GBDB according to the geological sections or assumed sections. Every metadata record contains all geological information of a section, including its basic unit (or bed or layer), sediment colour, lithology, thickness, horizon, locality, palaeo-block, geological age, biostratigraphy, geochemistry, palaeoecology, radio isotopic age, fossil collection, and any available original information on rock or fossil specimens during the fieldwork. An individual geological section can normally be subdivided into dozens of basic units when being inputted into the GBDB. Such geological-section records with much information can be found from stratigraphic and palaeontological publications. Sometimes the geological sections are not easily or directly obtained, and consulting with professional experts is necessary. Actually, many palaeontological descriptions or reports are lacking detailed stratigraphic descriptions; the GBDB includes these records as assumed sections, and they are treated as geological sections with only a very small portion, for example, of a single bed (unit) or collection. Borehole core records, many of which are from oil companies and are not open to the public, are also inputted into the GBDB as assumed sections (Fig. 1).
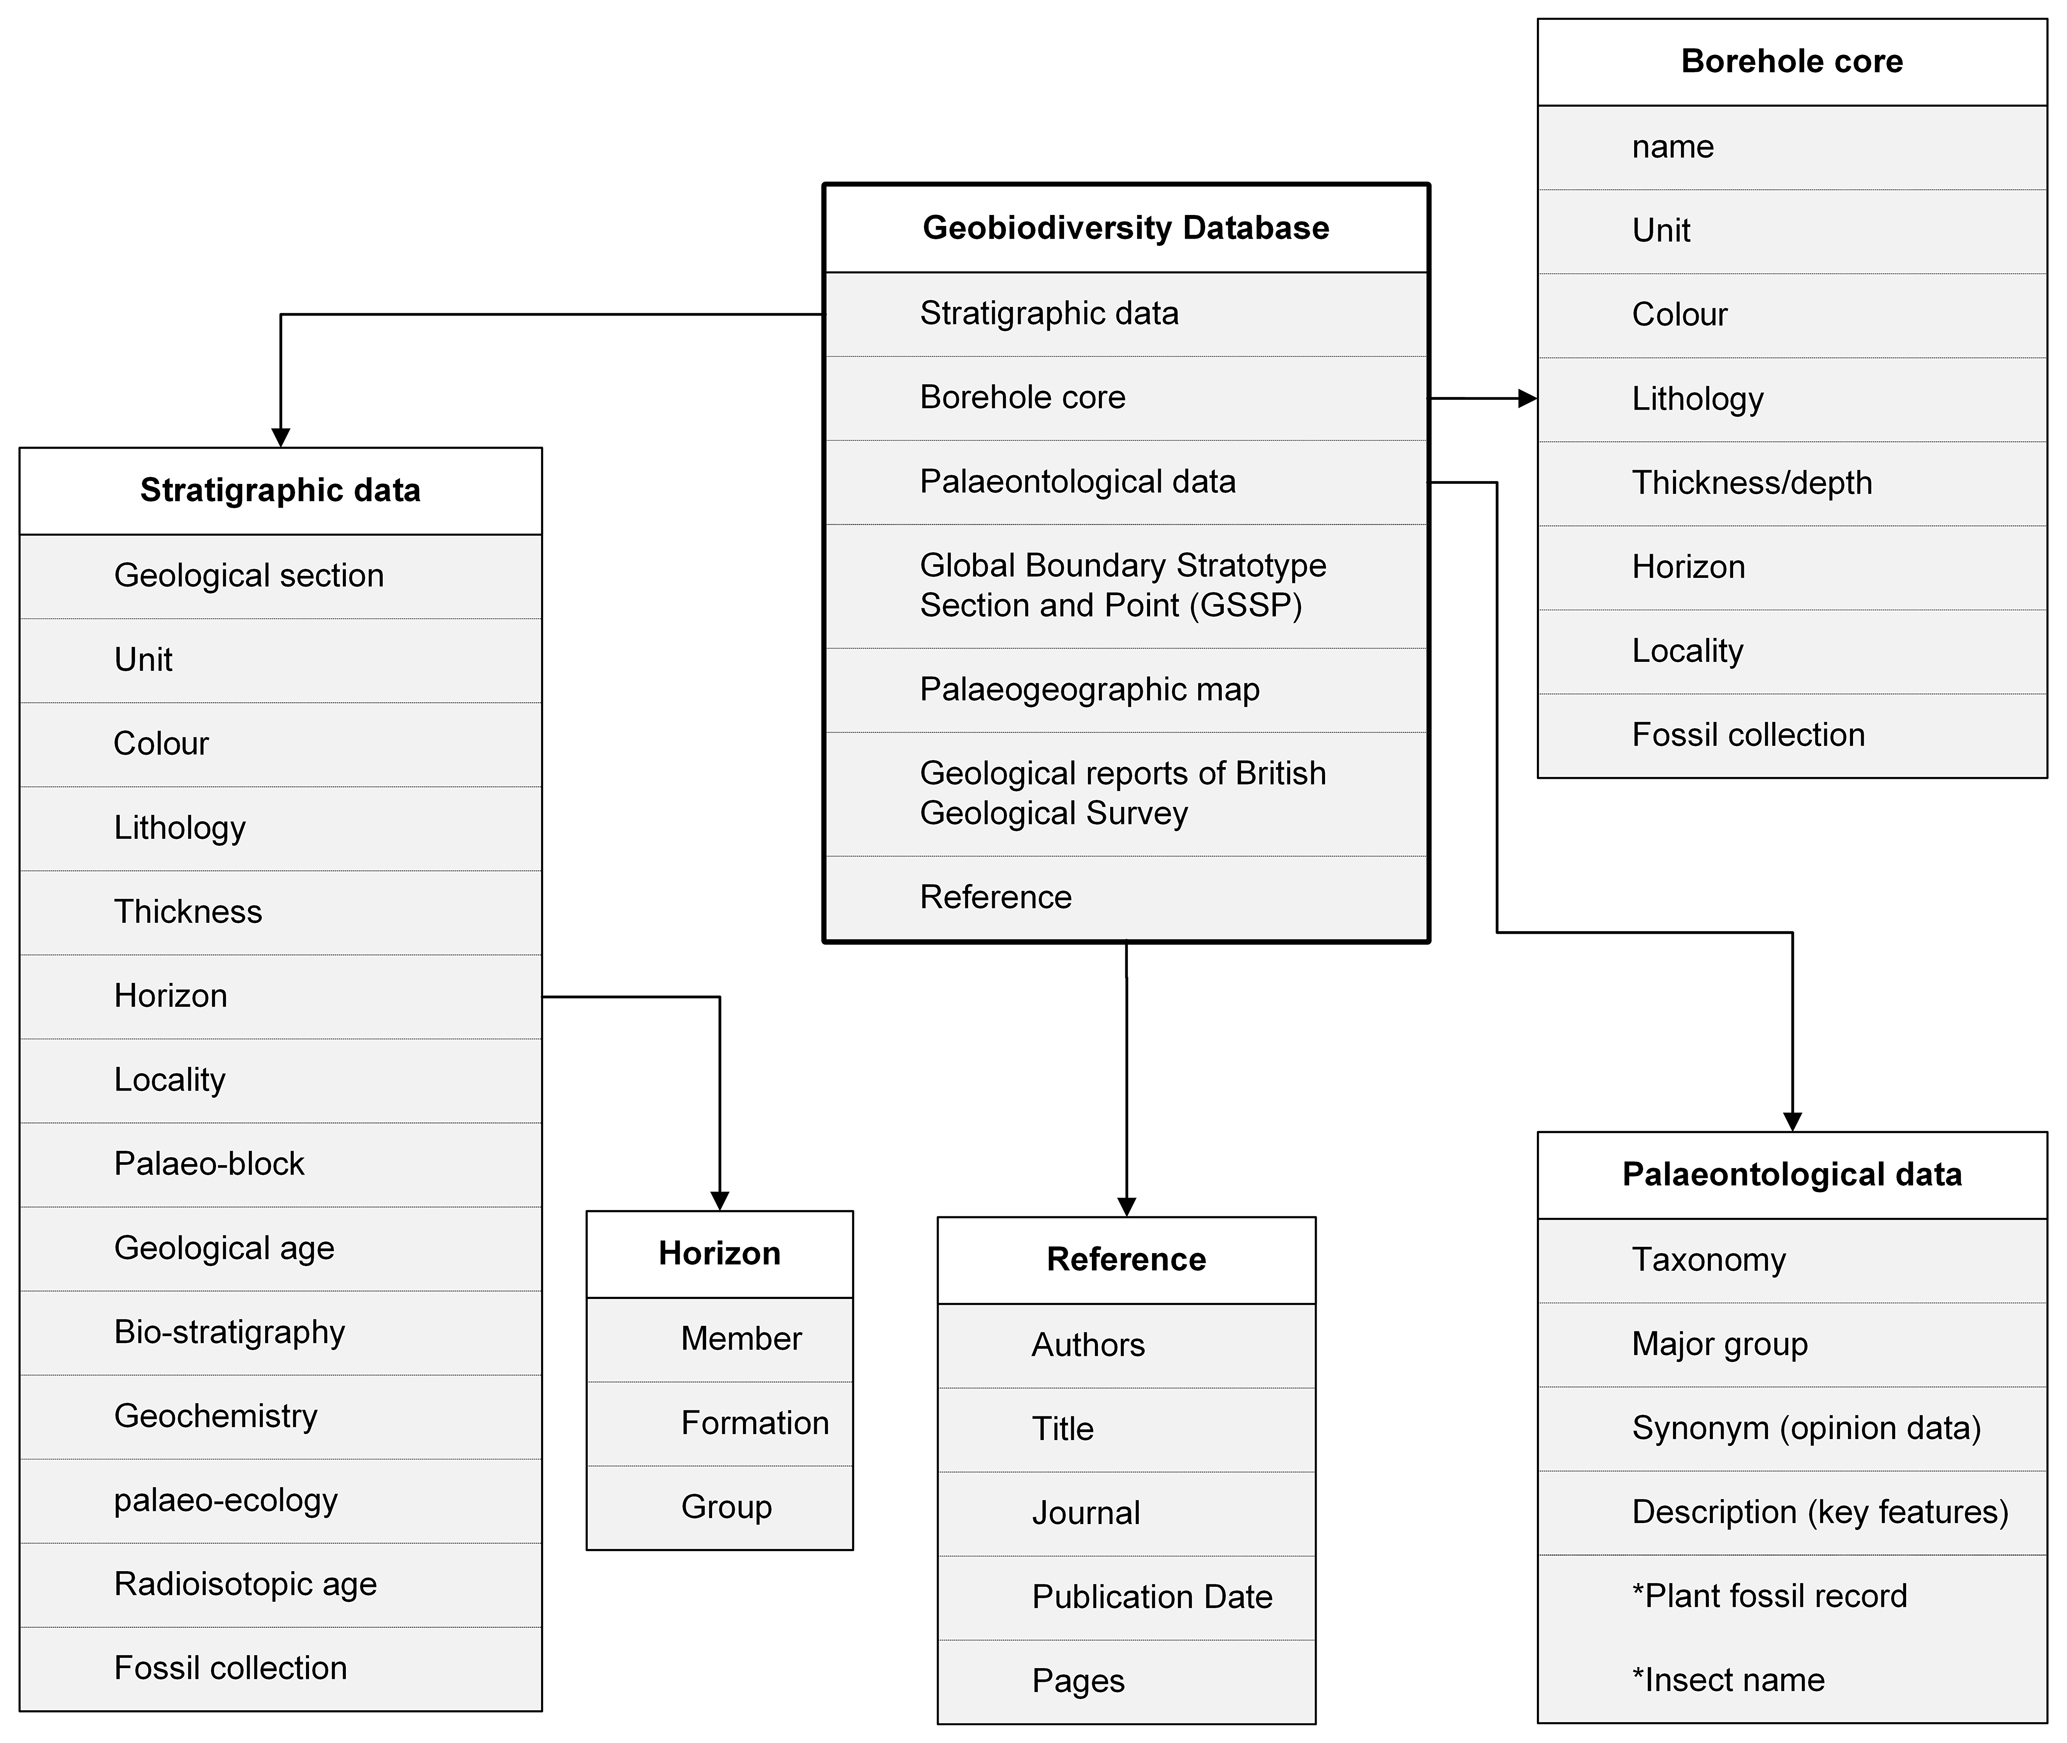
Figure 1The data structure of the Geobiodiversity Database (GBDB). * The newly added datasets.
The stratigraphic data in the GBDB are based on those published in the Chinese literature since the 1920s. By November 2020, all stratigraphic horizons and nearly all published geological sections could be searched for and browsed in the GBDB (Figs. 2, 3). It is noteworthy that the GBDB fossil occurrence data are included in the stratigraphic records and could not previously be searched for directly, such was the improvement in our update. The palaeontological data are linked to the fossil collections from individual geological sections and borehole cores. The data include taxonomy (species, genus, family, order, class, and division), major group, synonym (opinion data with different authors), and description (key features) (Fig. 1). Though the GBDB is geological-section-based, based on which fossil occurrences can be outputted, it is compatible with fossil-occurrence-based databases. Most fossil collections and occurrences of all sections from China are included in the GBDB (Fig. 3). Subsequent authors in further studies have amended a portion of fossil taxa from these sections. In this way, there are also plenty of opinion data in the GBDB.
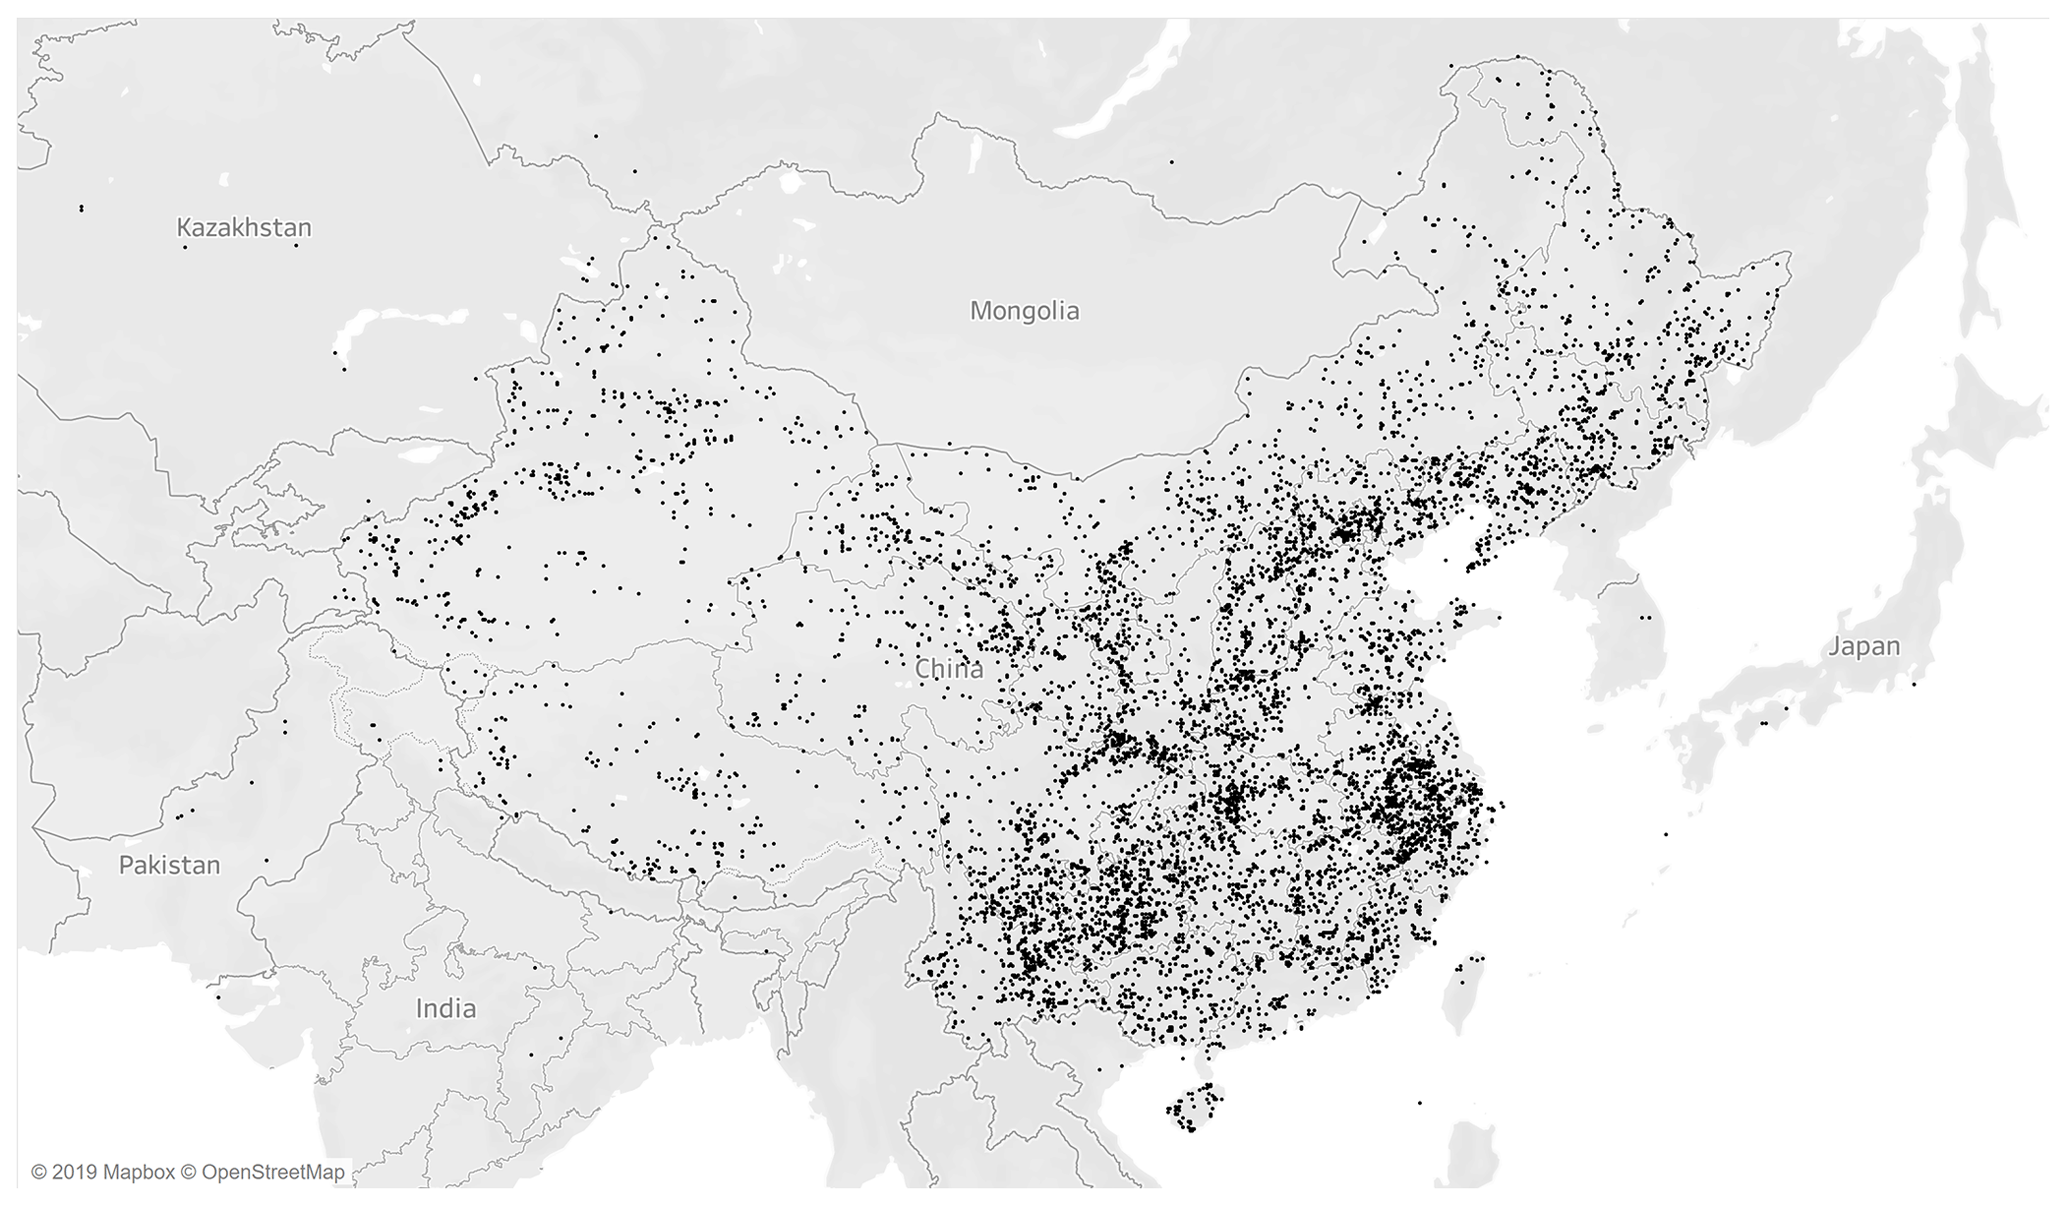
Figure 2Regional (China–East Asia) distribution of stratigraphic and palaeontological data (2007–2018) of the Geobiodiversity Database (GBDB) (Xu, 2020). Every black dot corresponds to a stratigraphic or palaeontological record of the GBDB. The map is from © OpenStreetMap contributors, 2020. Distributed under a Creative Commons BY-SA License.
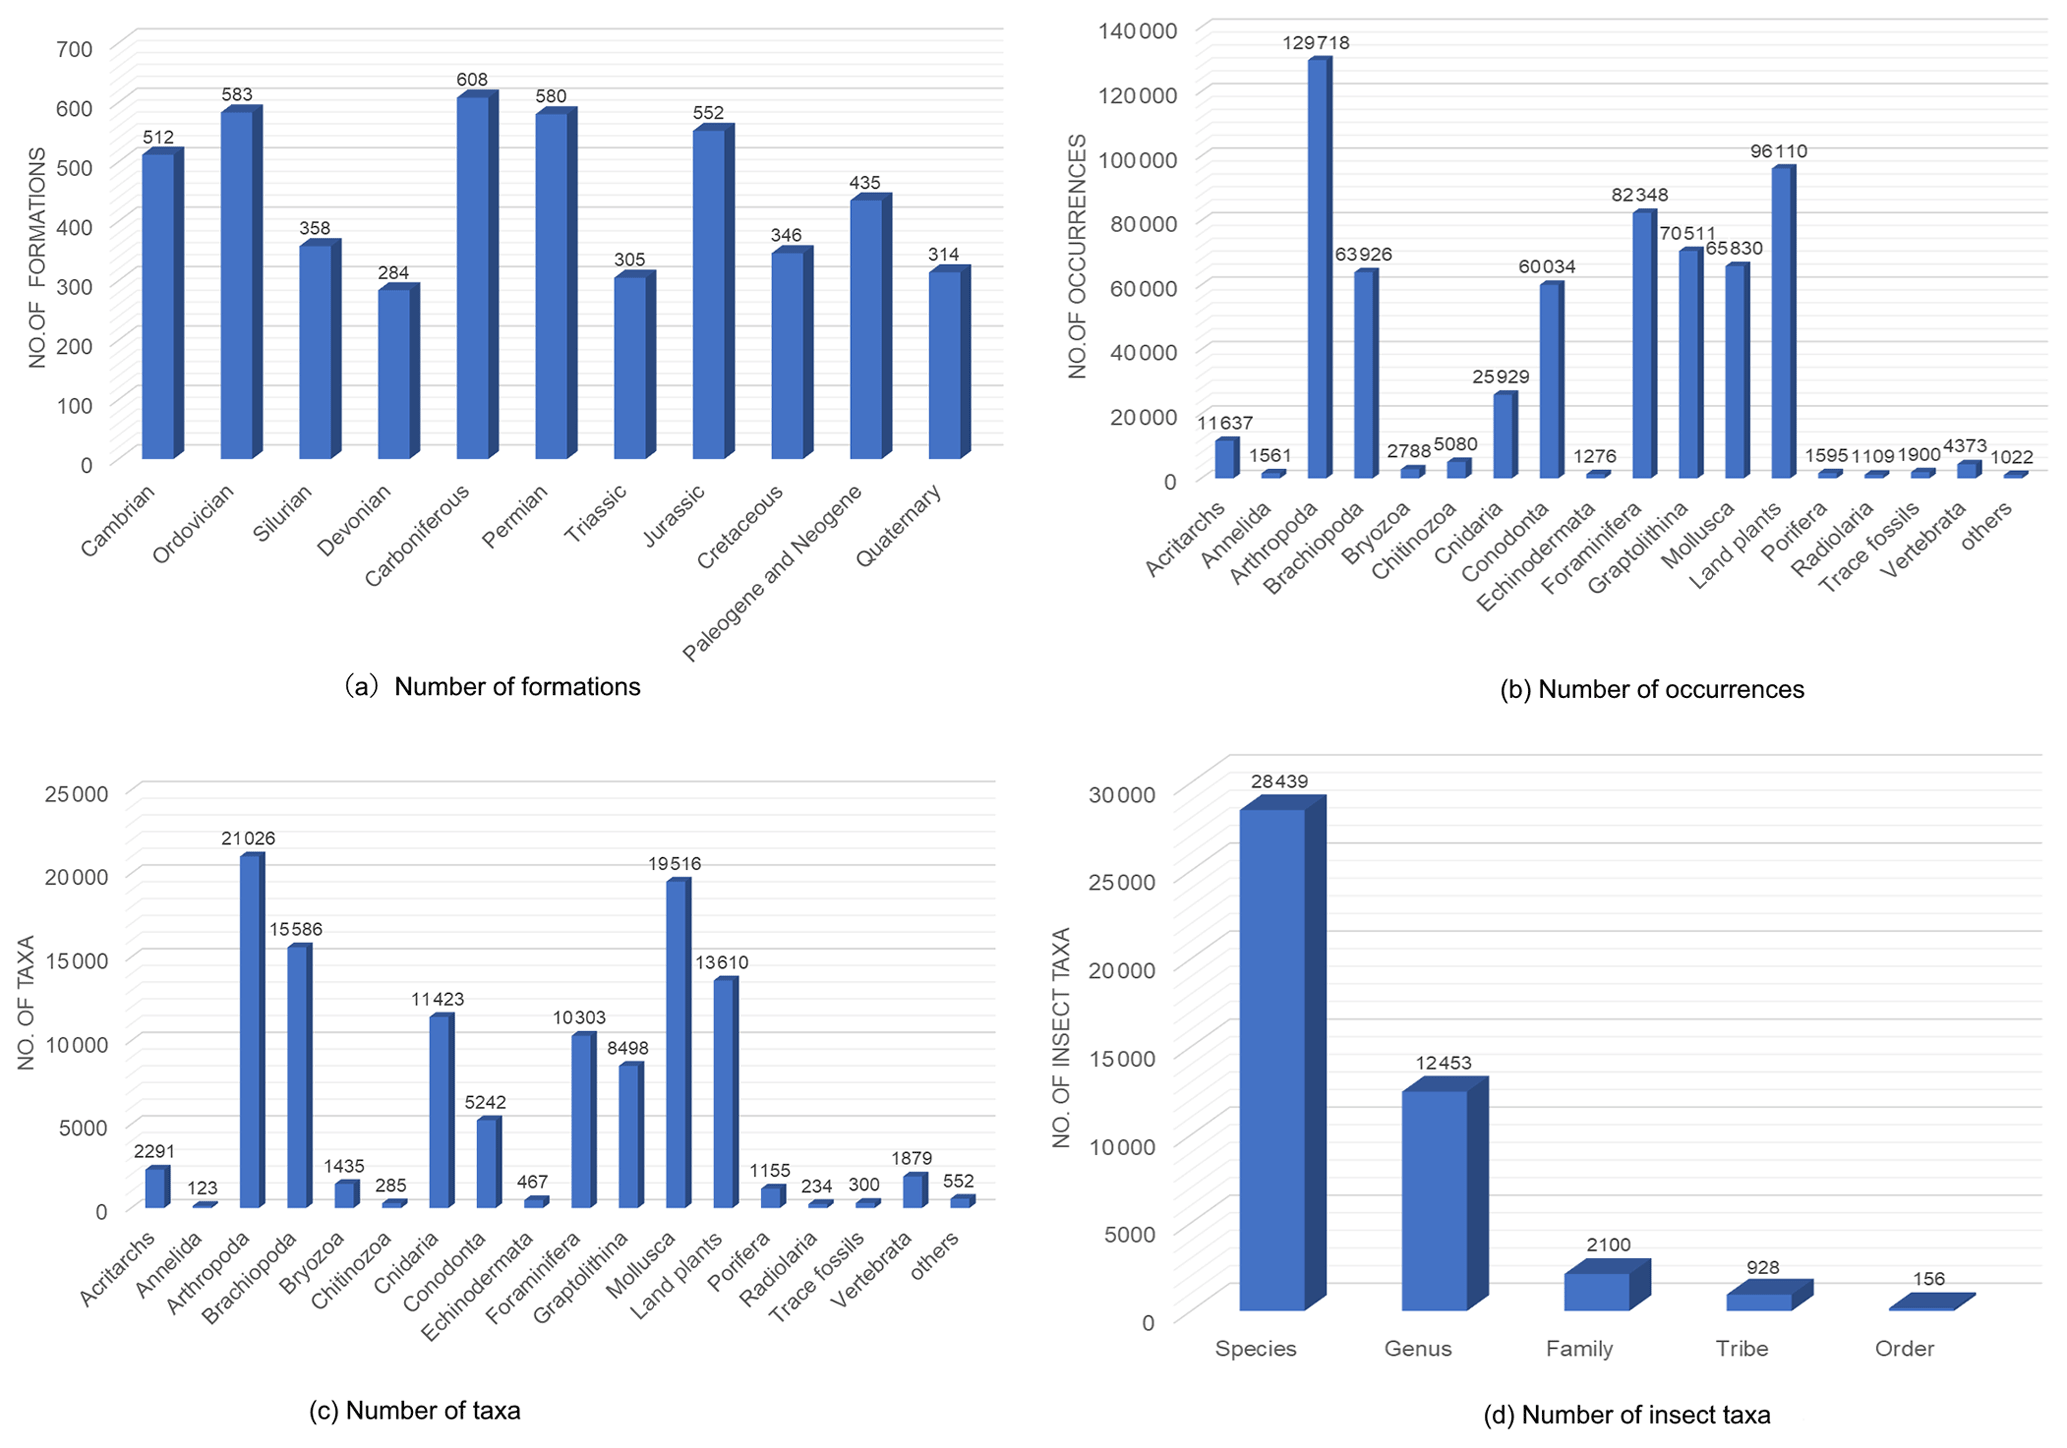
Figure 3Histograms showing the statistical outcome of the data in the Geobiodiversity Database (GBDB); specific numbers are shown by every item. (a) Stratigraphic formations of different ages from China. (b, c) Fossil taxa and occurrences of different groups. (d) Newly added taxa of the class Insecta; these taxa are not included in the statistic outcome of Table 1.
Since 2017, the GBDB started to record the data of Global Boundary Stratotype Sections and Points (GSSPs) of the International Commission on Stratigraphy, including the detailed information of GSSPs and some panorama and three-dimensional scanning of individual GSSPs, an example of which is the Changhsingian GSSP in Changxing, Zhejiang Province, southeastern China (http://www.geobiodiversity.com:8080/Panorama/47/output/, last access: 1 December 2020).
Since August 2017, the British Geological Survey (BGS) and the GBDB have collaborated in stratigraphic and palaeontological data processing. The GBDB data working team helps to digitalize the geological reports from the BGS archive and to build separated datasets for it.
Since 2019, the GBDB has begun to include the borehole core data of petroleum companies, such as the China National Offshore Oil Corporation (Tianjin and Qingdao, China) and China National Petroleum Corporation (Karamay, Xinjiang, China).
In brief, as many as possible stratigraphic and palaeontological records are collected from the original geological publications. Since its establishment, the GBDB data team has conscientiously collected and included stratigraphic and palaeontological data from the Chinese literature. The detailed statistical outcomes are given here (Table 1) (see Xu, 2020).
Table 1The comparison of the two widely used palaeontological databases. Note that the newly added data of terrestrial organisms, plant and insect fossil records, are not included in the GBDB statistical outcome (in November 2020).

* The stratigraphic-formation data of the PBDB were obtained from Wolfgang Kiessling although one can see these records from the portal of the PBDB. n/a: not applicable.
For a long time, biodiversity evolution study was based on fossil records, for example, the earliest quantitative analysis of geological-time biodiversity that drew the conclusion of five mass extinctions (Raup and Sepkoski, 1982) and a series of related geological biodiversity studies based on marine-organism fossil family or genus records (a lot of work was carried out based on PBDB data; see Jablonski, 1994; Sepkoski, 1992, 2002; Alroy et al., 2001, 2008; Rong et al., 2006, 2007), as well as a quantitative study based on terrestrial-organism fossil records (e.g. Alroy, 1998, 2001). There have been quantitative studies on the plant diversity of the Silurian and Devonian periods that were significant for early plant evolution and diversification (Xiong et al., 2013) and a study on plant diversity change during the Permian–Triassic boundary (Xiong and Wang, 2007). The mass extinction occurring at the end of the Permian is the greatest extinction of geological history and wiped out over 95 % of marine organisms (Jablonski, 1994). These two plant diversity studies used fossil record data from South China and listed the data as the supplementary materials of the published papers. It took the authors of the two studies a few years to complete the data collection, even using only the data from the South China palaeo-block.
An inconvenient fact is that the terrestrial-organism fossil database is not as good as that of marine organisms and that the non-marine fossil record is necessarily less complete and less widespread. For a long time, the GBDB focused on the fossil records of marine organisms. Since 2019, the GBDB has collected terrestrial fossil and stratum data systematically and now has a unique feature for the fossil terrestrial organisms. The fossil plant record dataset includes 738 Devonian plant species occurrences from global localities and thousands of Mesozoic plant species occurrences from China.
Besides the plant fossil data, the terrestrial-organism fossil record data of the GBDB are insect fossil records, which greatly increase after taking over the international fossil insect database of the International Palaeoentomological Society, EDNA (https://fossilinsectdatabase.co.uk/, last access: 10 May 2020), which holds details of the holotypes of all fossil insects in the world.
The EDNA database was named after Edna Clifford, who started recording of new species on a card index system, and was designed as an update of Handlirsch's fossil insects handbook (Handlirsch, 1908), which listed all known fossil insect species. Handlirsch recorded 5160 species in 1906. The database is detailed in its contents: it records taxonomic information, synonym details, references for every species (including the page number where it is introduced) and for holotype site details, stratigraphic information, and geological details. All data have been obtained from exhaustive literature searches.
The EDNA database aims to be a complete, fully interactive list of all species of insects named from the fossil record, with the site, geological age, and reference for each holotype. Updating and checking will be ongoing, and the data available will be greatly improved if details of omissions and errors are sent to the administrator for incorporation. The database comes from an exhaustive literature search and in the 2019 edition contains 28 439 species names (including synonyms) extracted from 5218 references (Fig. 3d). The database is held in 38 fields, all of which are searchable, independently or in combination, and the output contains any one or more as required.
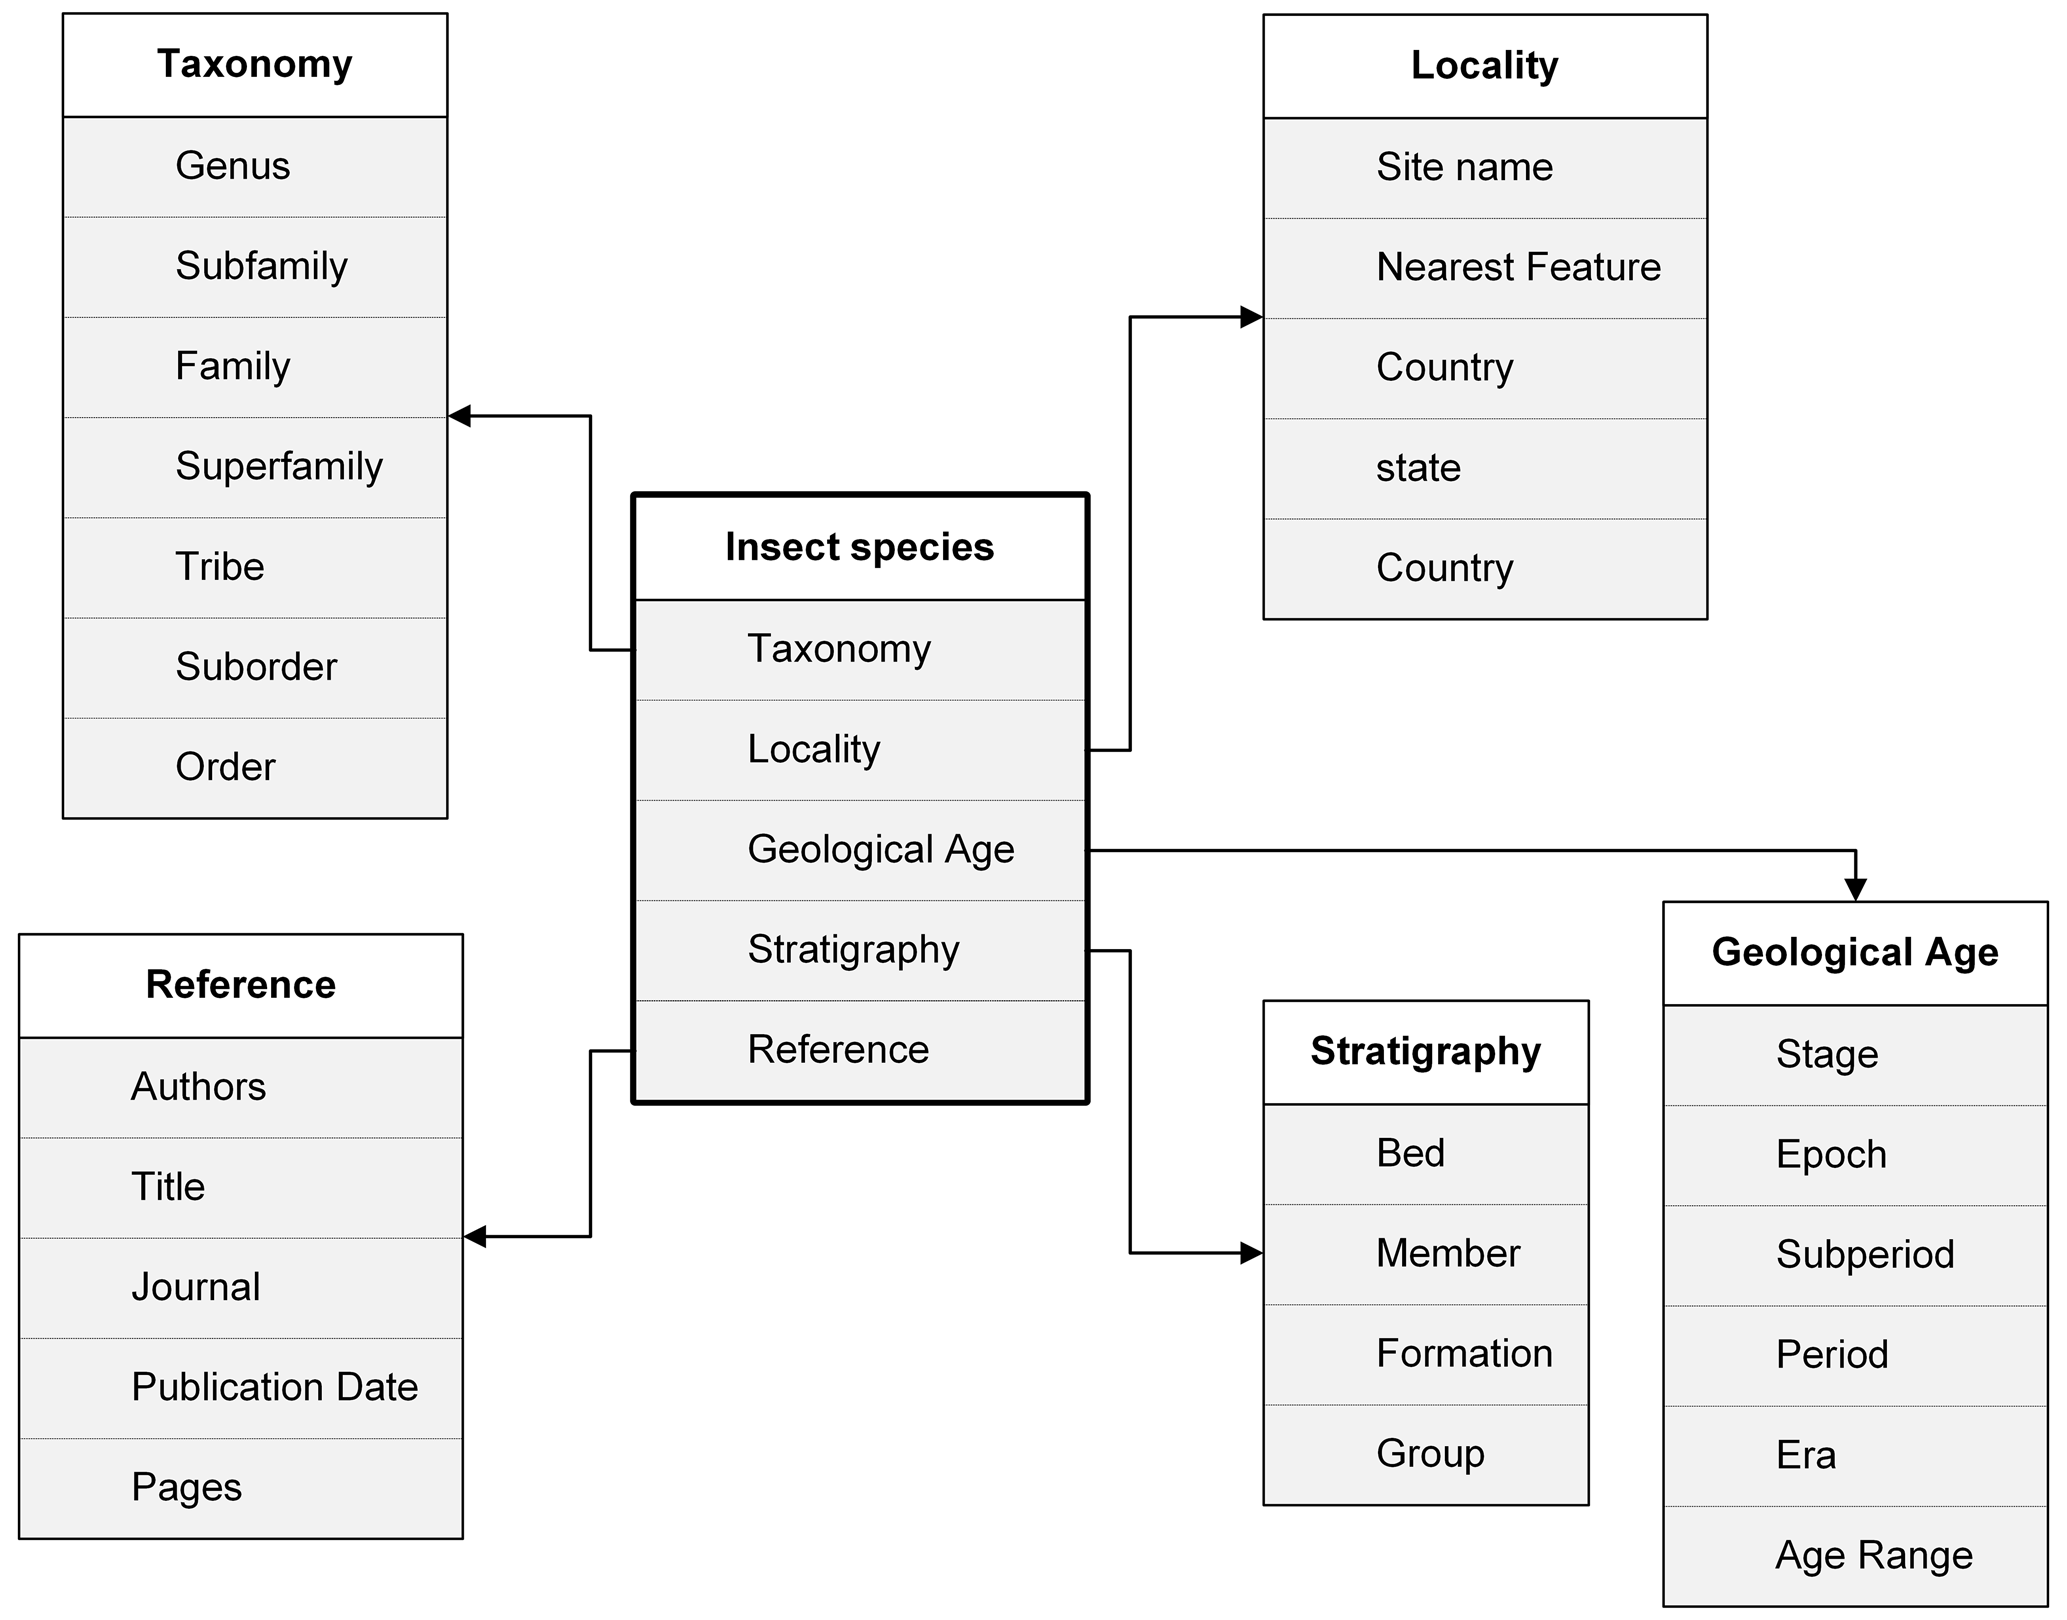
Figure 4The data structure of the insect species name dataset of the Geobiodiversity Database (GBDB) (Xu, 2020).
Fields include the following: generic and specific names, citation, subfamily, family, superfamily, division, suborder, order, author, title, journal, date of publication, and page on which the species is first described. Age data include stage, epoch, subperiod, period, and era and age (range) in millions of years; bed, member, formation, and group; and site name, nearest feature (town, river, etc.), county, state, country, and continent (Fig. 4). For all taxonomic ranks, citations can be included and both junior and senior synonyms displayed. Library call numbers of the Natural History Museum, London, are also included.
A comparison is made between the GBDB and the fossil-occurrence-based Paleobiology Database (PBDB), which was founded in 1998 and has become the largest palaeobiological database. Data of the PBDB include fossil taxa, collection, opinions (paleobiological views from different authors), and related publications. The data volume of the PBDB is larger than the GBDB (Table 1). The noticeable difference lies in the fact that the PBDB has little information about geological sections. The GBDB is known for its large number of geological sections.
By November 2020, 26 450 geological sections were recorded in the GBDB, the geological age of which ranges from the Ediacaran to the Cenozoic (Table 1). They include nearly all sections and some borehole cores from China and worldwide sections and borehole cores from open publications and reports of the British Geology Survey. Every record is based on published literature or internal reports.
As we mentioned, the GBDB is geological-section-based; every record was subdivided into detailed parts when being inputted into the database. The fossil occurrence and collection data can be exported from the GBDB, just like those in the PBDB. Nevertheless, the fossil taxon number in the GBDB is about 30 % of that in the PBDB, whilst the fossil occurrence record number in the GBDB is about 40 % of that in the PBDB (Table 1). This is because the two databases have different histories: the PBDB was founded in 1998, and the GBDB was founded in 2007 (Fig. 1). The PBDB has a history of comprehensive backups, mirror sites and multiple portals (e.g. Fossilworks, http://Fossilworks.org, last access: 1 December 2020), and user-training guides. The GBDB had held several workshops during international academic meetings in recent years, but there is much to be done to improve the data quality and quantity of the GBDB.
The stratigraphic records in the GBDB are reminiscent of Macrostrat (https://macrostrat.org/, last access: 1 December 2020), which is a platform for the aggregation and distribution of geological data relevant to the spatial and temporal distribution of sedimentary, igneous, and metamorphic rocks as well as data extracted from them. Macrostrat aims to become a community resource for the addition, editing, and distribution of new stratigraphic, lithologic, environmental, and economic data. By November 2020, Macrostrat had records of 1534 regional rock columns, 35 163 rock units, and 2 540 323 geologic map polygons. Macrostrat has a lot of exclusive data on composite geological sections, i.e. the sections that are compiled from several places in one basin and may have completeness and thickness that never accumulated in one place. It is also worth noting that Macrostrat mostly records geological data from North America, whilst the GBDB includes nearly all stratigraphic data of sediments from China; igneous and metamorphic rocks were also recorded if they were reported in sediment units.
The current dataset archived via Zenodo represents a static version of the database in November 2020: https://doi.org/10.5281/zenodo.4245604 (Xu, 2020). The latest version of the database is always freely available via https://www.geobiodiversity.com/ (last access: 1 November 2020).
Since the GBDB website went online in 2007, there have been few updates. During the GBDB management change at the end of 2018, a survey was carried out among GBDB users and dozens of pieces of feedback were received. According to this feedback we solved existing problems of the GBDB and its website and comprehensively updated the server and the website, making the database a safe data bank and the website a new and friendly portal (GBDB 2.0; relatively to the previous version). The new website has optimized the input and output of data, the search engine, and the data examination system.
During the process of data inputting, the raw data will be checked by registered authorizers; such an action aims to make sure that the data are valid but not according to the authorizer's own point of view. Today knowledge is updated quickly; it is normal to have a mixture of valid and obsolete information to a certain point, such as taxonomical synonymies and the implementation of a better decay constant to recalculate old radioisotopic dates. The GBDB shows only the data bank but does not support any academic interpretations. The authorizers make the data valid, but the users need to choose which data to use. In the GBDB a huge number of opinion data remain.
Data visualization has been developed. All data are plotted on the world map of the home page that also displays the data volume in the upper right corner. The view centre is the map of China, and the map can be zoomed in or out using a mouse. Geological sections are showed as individual spots, and their rough or detailed information can be checked easily. The different colours of spots on the map correspond to various geological stages of the International Chronostratigraphic Chart that is shown as disc-shaped in the lower right corner and can be hidden manually.

Figure 5A screenshot of a three-dimensional bar graph visualizing the Mesozoic stratigraphic formations from China. Data are from the Geobiodiversity Database (GBDB). The colours of the bars are based on those in the International Chronostratigraphic Chart: Triassic (purple), Jurassic (blue), and Cretaceous (light green). The map is from © OpenStreetMap contributors, 2020. Distributed under a Creative Commons BY-SA License. The website of this graph is http://geobiodiversity.com:8080/download/xuhonghe/diagram/3dbar/index.html (last access: 1 November 2020). The code of this module is at https://doi.org/10.12091/GBDB.202001106.
The user system is optimized; a personal profile and user-favourite feature can be customized. Users can search and choose data to download and analyse; a user account is needed to store search results, to run private data through CONOP or SinoCore, and to give comments. The old version of the GBDB remains available and has an entrance on the home page for users who prefer the old format and hope to use the GBDB in the way they have learned. The GBDB group has also developed applications for mobile devices; users can examine the data of the GBDB and give comments through mobile devices.
In the next step, more data visualization and analytic tools (Fig. 5) will be embedded into the GBDB website publicly, for stratigraphic and palaeontological research.
The GBDB and PBDB are complementary in their great volumes of geological-section and fossil occurrence data. Through the geological sections, the GBDB data record the thickness of individual fossil samples and contain important evidence of fossil organism co-existence. Fossil taxa of the two databases contain not only widely distributed and endemic organisms but also those published in both English and Chinese languages (and others). The GBDB and Macrostrat are complementary for stratigraphic study to some extent. The data of the two databases contain records from both North America and China. Data from these databases, therefore, provide the possibility of conducting various stratigraphic and palaeontological analyses.
The GBDB, just like the PBDB and the Macrostrat, will continually provide users access to detailed palaeontological and stratigraphic data based on publications. Multiple and compatible formats for common software, such as CONOP and SinoCor, will be downloadable in the GBDB. Statistical and analytical tools will be easily used in the GBDB. Additionally, the GBDB is collecting non-structured data of palaeontology and stratigraphy, including fossil specimens' images and three-dimensional models, geological-section panorama images, tomographic image stacks, and references. We will build the organic correlations between these non-structured data and palaeontological and stratigraphic data that the GBDB have collected for years. Connected information will be shown after searching for an individual item that is related to any fossil or stratum, making the GBDB more widely useable for both researchers and anyone who is interested in palaeontology and stratigraphy.
HHX and ZBN designed the project, developed the model, and performed the simulations. HHX prepared and revised the manuscript with contributions from ZBN. YSC gave technical support.
The authors declare that they have no conflict of interest.
We thank Wolfgang Kiessling, Friedrich-Alexander-Universität Erlangen-Nürnberg, Germany; Na Lin, Li Qijian, and Wang Bo, Nanjing Institute of Geology and Palaeontology, Chinese Academy of Sciences (CAS); Pan Zhaohui, Institute of Vertebrate Paleontology and Paleoanthropology, CAS; and Wu Junqi, College of Intelligence and Computing, Tianjin University, for constructive suggestions and help.
This research has been supported by the Chinese Academy of Sciences (grant nos. XDA19050101, XDB26000000) and the National Natural Science Foundation of China (grant nos. 41772012, 61802278).
This paper was edited by Kirsten Elger and reviewed by Richard Butler and Peter Sadler.
Alroy, J.: Cope's rule and the dynamics of body mass evolution in North American fossil mammals, Science, 280, 731–734, 1998.
Alroy, J.: A multispecies overkill simulation of the end-Pleistocene megafaunal mass extinction, Science, 292, 1893–1896, 2001.
Alroy, J., Marshall, C. R., Bambach, R. K., Bezusko, K., Foote, M., Fusich, F. T., Hansen, T. A., Holland, S. M., Ivancy, L. C., Jablonski, D., Jacobs, D. K., Jones, D. C., Kosnik, M. A., Lidgard, S., Low, S., Miller, A. I., Gottshall, P. M., Olszewski, T. D., Patzkowsky, M. E., Raup, D. M., Roy, K., Sepkoski, J. J. Jr., Sommers, M. G., Wagner, P. J., and Webber, A.: Effects of sampling standardization on estimates of Phanerozoic marine diversification, P. Natl. Acad. Sci. USA, 98, 6261–6266, 2001.
Alroy, J., Aberhan, M., Bottjer, D. J., Foote, M., Fürsich, F. T., Harries, P. J., Hendy, A. J., Holland, S. M., Ivany, L. C., and Kiessling, W.: Phanerozoic trends in the global diversity of marine invertebrates, Science, 321, 97–100, 2008.
Chen, Q., Fan, J., Melchin, M. J., and Zhang, L.: Temporal and spatial distribution of the Wufeng Formation black shales (Upper Ordovician) in South China, GFF, 136, 55–59, 2014.
Chen, Q., Fan, J., Zhang, L., and Chen, X.: Paleogeographic evolution of the Lower Yangtze region and the break of the “platform-slope-basin” pattern during the Late Ordovician, Sci. China Earth Sci., 61, 625–636, 2018.
Chen, X., Zhang, Y., Fan, J., Tang, L., and Sun, H.: Onset of the Kwangsian Orogeny as evidenced by biofacies and lithofacies, Sci. China Earth Sci., 55, 1592–1600, 2012.
Chen, X., Fan, J., Chen, Q., Tang, L., and Hou, X.: Toward a stepwise Kwangsian Orogeny, Sci. China Earth Sci., 57, 379–387, 2014.
Chen, X., Fan, J., Wang, W., Wang, H., Nie, H., Shi, X., Wen, Z., Chen, D., and Li, W.: Stage-progressive distribution pattern of the Lungmachi black graptolitic shales from Guizhou to Chongqing, Central China, Sci. China Earth Sci., 60, 1133–1146, 2017.
Chen, Z., Männik, P., and Fan, J.: Llandovery (Silurian) conodont provincialism: An update based on quantitative analysis. Palaeogeogr. Palaeocl., 485, 661–672, 2017.
Fan, J. and Zhang, Y.: SinoCor 1.0, a biostratigraphic program for Graphic Correlation, Acta Palaeontol. Sinica, 39, 573–583, 2000 (in Chinese with English abstract).
Fan, J. and Zhang, Y.: SinoCor 3.0, a biostratigraphic program for graphic correlation, Erlanger geologische Abhandlungen Sonderband, 5, 35–36, 2004.
Fan, J., Chen, X., and Zhang, Y.: Quantitative biostratigraphy of Upper Ordovician to lowermost Silurian on the Yangtze platform – with the designing of SinoCor 2.0, a software for graphic correlation, Memoirs of the Association of Australasian Palaeontologists, 27, 53–58, 2002.
Fan, J., Chen, Q., Hou, X., Miller, A. I., Melchin, M. J., Shen, S., Wu, S., Goldman, D., Mitchell, C. E., Yang, Q., Zhang, Y., Zhan, R., Wang, J., Leng, Q., Zhang, H., and Zhang, L.: Geobiodiversity Database: a comprehensive section-based integration of stratigraphic and paleontological data, Newsletters on Stratigraphy, 46, 111–136, 2013a.
Fan, J., Chen, Q., Melchin, M. J., Sheets, H. D., Chen, Z., Zhang, L., and Hou, X.: Quantitative stratigraphy of the Wufeng and Lungmachi black shales and graptolite evolution during and after the Late Ordovician mass extinction, Palaeogeogr. Palaeocl., 389, 96–114, 2013b.
Fan, J., Hou, X., Chen, Q., Melchin, M. J., Goldman, D., Zhang, L., and Chen, Z.: Geobiodiversity Database (GBDB) in stratigraphic, palaeontological and palaeogeographic research: graptolites as an example, GFF, 136, 70–74, 2014.
Fan, J., Shen, S., Erwin, D. H., Sadler, P. M., McLeod, N., Cheng, Q., Hou, X., Yang, J., Wang, X., Wang, Y., Zhang, H. Chen, X., Li, G., Zhang, Y., Shi, Y., Yuan, D., Chen, Q., Zhang, L., Li, C., and Zhao, Y.: A high-resolution summary of Cambrian to Early Triassic marine invertebrate biodiversity, Science, 367, 272–277, 2020.
Guo, H.: Big Earth data: A new frontier in Earth and information sciences, Big Earth Data, 1, 4–20, 2017.
Hammer, O. and Harper, D. A. T.: Paleontological Data Analysis, Blackwell Publishing, Oxford, 2006.
Handlirsch, A.: Die fossilen Insekten und die Phylogenie der rezenten Formen: ein Handbuch für Paläontologen und Zoologen, W. Engelmann, Leipzig, 1908.
Hautmann, M.: Diversification and diversity partitioning, Paleobiology, 40, 162–176, 2016.
Hou, Z. S., Fan, J. X., Henderson, C. M., Yuan, D. X., Shen, B. H., Wu, J., Wang, Y., Zheng, Q. F., Zhang, Y. C., Wu, Q., and Shen, S. Z.: Dynamic Palaeogeographic Reconstructions of the Wuchiapingian Stage (Lopingian, Late Permian) for the South China Block, Palaeogeogr. Palaeocl., 546, 109667, https://doi.org/10.1016/j.palaeo.2020.109667, 2020.
Jablonski, D.: Extinctions in the fossil record, Philos. T. Roy. Soc. London, Ser. B, 344, 11–17, 1994.
Ke, Y., Shen, S.-Z., Shi, G.R., Fan, J.-X., Zhang, H., Qiao, L., and Zeng, Y.: 2016. Global brachiopod palaeobiogeographical evolution from Changhsingian (late Permian) to Rhaetian (late Triassic), Palaeogeogr. Palaeocl., 448, 4–25, 2016.
Kemple, W. G., Sadler, P. M., and Strauss, D. J.: A prototype constrained optimization solution to the time correlation problem, in: Statistical Applications in the Earth Sciences, edited by: Agterberg, F. P. and Bonham-Carter, G. F., pp. 417–425, Geological Survey of Canada, Paper 89–9, 1989.
Kemple, W. G., Sadler, P. M., and Strauss, D. J.: Extending graphic correlation to many dimensions: stratigraphic correlation as constrained optimization, SEPM Special Publication, 53, 65–82, 1995.
Muscente, A. D., Prabhu, A., Zhong, H., Eleish, A., Meyer, M. B., Fox, P., Hazen, R. M., and Knoll, A. H.: Quantifying ecological impacts of mass extinctions with network analysis of fossil communities, P. Natl. Acad. Sci. USA, 115, 5217–5222, 2018.
Muscente, A. D., Bykova, N., Boag, T. H., Buatois, L. A., Mangano, M. G., Eleish, A., Prabhu, A., Pan, F., Meyer, M. B., Schiffbauer, J. D., Fox, P., Hazen, R. M., and Knoll, A. H.: Ediacaran biozones identified with network analysis provide evidence for pulsed extinctions of early complex life, Nat. Commun., 10, 1–15, 2019.
Normile, D.: Earth scientists plan a “geological Google”, Science, 363, 917–917, 2019.
Raup, D. M. and Sepkoski, J. J.: Mass extinctions in the marine fossil record, Science, 215, 1501–1503, 1982.
Rong, J., Fan, J., and Li, G.: Patterns of latest Proterozoic to early Mesozoic marine biodiversity changes in South China, Science Press, Beijing, 2006.
Rong, J. Y., Fan, J., Miller, A. I., and Li, G. X.: Dynamic patterns of latest Proterozoic-Palaeozoic-early Mesozoic marine biodiversity in South China, Geol. J., 42, 431–454, 2007.
Schwarzacher, W.: Sedimentation models and quantitative stratigraphy, Elsevier, Amsterdam, Oxford, New York, 1975.
Sepkoski Jr., J. J.: A compendium of fossil marine animal families, 2nd edn., Milwaukee Public Museum Contributions to Biology and Geology, 83, 1–156, 1992.
Sepkoski Jr., J. J.: A compendium of fossil marine animal genera, Bulletins of American Paleontology, 363, 1–563, 2002.
Shaw, A. B.: Time in Stratigraphy, McGraw-Hill, New York, 1964.
Shen, S. Z., Crowley, J. L., Wang, Y., Bowring, S. A., Erwin, D. H., and Jin, Y.-G.: Calibrating the End-Permian Mass Extinction, Science, 334, 1367–1372, 2011.
Shen, S. Z., Zhang, H., Shi, G. R., Li, W., Xie, J., and Fan, J.: Early Permian (Cisuralian) global brachiopod palaeobiogeography, Gondwana Res., 24, 104–124, 2013.
Wang, Y., Sadler, P. M., Shen, S.-Z., Erwin, D. H., Zhang, Y., and Henderson, C. M.: Quantifying the process and abruptness of the end-Permian mass extinction, Paleobiology, 40, 113–129, 2014.
Xiong, C. and Wang, Q.: Was There a Mass Extinction of Land Plants at the Permian – Triassic Boundary (PTB)?, Geol. Rev., 53, 577–585, 2007.
Xiong, C., Wang, D., Wang, Q., Benton, M. J., Xue, J., Meng, M., Zhao, Q., and Zhang, J.: Diversity dynamics of silurian-early carboniferous land plants in South china, PLoS One, 8, e75706, https://doi.org/10.1371/journal.pone.0075706, 2013.
Xu, H.-H.: Data of fossils and sections of the Geobiodiversity Database (GBDB) (Version 5-Nov-2020), Zenodo, https://doi.org/10.5281/zenodo.4245604, 2020.
Zhang, L., Fan, J., Chen, Q., and Melchin, M. J.: Geographic dynamics of some major graptolite taxa of the Diplograptina during the Late Ordovician mass extinction in South China, GFF, 136, 327–332, 2014a.
Zhang, L., Fan, J., Chen, Q., and Wu, S. Y.: Reconstruction of the mid-Hirnantian palaeotopography in the Upper Yangtze region, South China, Estonian J. Earth Sci., 63, 4, https://doi.org/10.3176/earth.2014.39, 2014b.
Zhang, L. N., Fan, J., and Chen, Q.: Geographic distribution and palaeogeographic reconstruction of the Upper Ordovician Kuanyinchiao Bed in South China, Chinese Sci. Bull., 61, 11, https://doi.org/10.1360/N972015-00981, 2016.