the Creative Commons Attribution 4.0 License.
the Creative Commons Attribution 4.0 License.
 | 08 Dec 2020
A coastally improved global dataset of wet tropospheric corrections for satellite altimetry
Maria Joana Fernandes
Telmo Vieira
Eliana Vieira
The accuracy of satellite radar altimetry (RA) is known to deteriorate towards the coastal regions due to several reasons, amongst which the improper account for the wet path delay (WPD) can be pointed out. The most accurate WPDs for RA are derived from the on-board microwave radiometer (MWR) radiance measurements, acquired simultaneously as the altimeter ranges. In the coastal zone, however, the signal coming from the surrounding land contaminates these measurements and the water vapour retrieval from the MWR fails. As meteorological models do not handle coastal atmospheric variability correctly yet, the altimeter measurements are rejected whenever MWR observations are absent or invalid. The need to solve this RA issue in the coastal zone, simultaneously responding to the growing demand for data in these regions, motivated the development of the GNSS (Global Navigation Satellite System) derived Path Delay (GPD) algorithm.
GPD combines WPD from several sources through objective analysis (OA) to estimate the WPD or the corresponding RA correction accounting for this effect, the wet tropospheric correction (WTC), for all along-track altimeter points for which this correction has been set as invalid or is not defined. The current GPD version (GPD Plus, GPD+) uses as data sources WPD from coastal and island GNSS stations, from satellites carrying microwave radiometers, and from valid on-board MWR measurements. GPD+ has been tuned to be applied to all, past and operational, RA missions, with or without an on-board MWR. The long-term stability of the WTC dataset is ensured by its inter-calibration with respect to the Special Sensor Microwave Imager (SSM/I) and SSM/I Sounder (SSMIS). The dataset is available for the TOPEX/Poseidon (T/P); Jason-1 and Jason-2 (NASA and CNES); Jason-3 (NASA and EUMETSAT); ERS-1, ERS-2, Envisat and CryoSat-2 (ESA); SARAL/AltiKa (ISRO and CNES); and GFO (US Navy) RA missions. The GPD+ WTC for Sentinel-3 (ESA and EUMETSAT) shall be released soon. The present paper describes the GPD+ database and its assessment through statistical analyses of sea level anomaly (SLA) datasets, calculated with GPD+, the ECMWF Reanalysis Interim (ERA-Interim) model or MWR-derived WTCs. Global results, as well as results for three regions (the North American and European coasts and the Indonesia region), are presented for ESA's recent Envisat Full Mission Reprocessing (FMR) V3.0. Global results show that the GPD+ WTC leads to a reduction in the SLA variance of 1–2 cm2 in the coastal zones, when used instead of the ERA WTC, which is one of the WTCs available in these products and can be adopted when the MWR-derived WTC is absent or invalid. The improvement of the GPD+ WTC over the ERA WTC is maximal over the tropical oceans, particularly in the Pacific Ocean, showing that the model-derived WTC is not able to capture the full variability in the WPD field yet. The statistical assessment of GPD+ for the North American coast shows a reduction in SLA variance, when compared to the use of the ERA-derived WTC, of 1.2 cm2, on average, for the whole range of distances from the coast considered (0–200 km). Similar results are obtained for the European coasts. For the Indonesia region, the use of the GPD+ WTC instead of that from ERA leads to an improvement, on average, on the order of 2.2 cm2 for distances from the coast of up to 100 km. Similar results have been obtained for the remaining missions, particularly for those from ESA. Additionally, GPD+ recovers the WTC for a significant number of along-track altimeter points with missing or invalid MWR-derived WTCs, due to land, rain and ice contamination and instrument malfunctioning, which otherwise would be rejected. Consequently, the GPD+ database has been chosen as the reference WTC in the Sea Level Climate Change Initiative (CCI) products; GPD+ has also been adopted as the reference in CryoSat-2 Level-2 Geophysical Ocean Products (GOP). Strategies to further improve the methodology, therefore enhancing the quality of the database, are also discussed. The GPD+ dataset is archived on the home page of the Satellite Altimetry Group, University of Porto, publicly available at the repository https://doi.org/10.23831/FCUP_UPORTO_GPDPlus_v1.0 (Fernandes et al., 2019).
- Article
(11140 KB) - Full-text XML
- BibTeX
- EndNote


Since the early 1990s, satellite radar altimetry (RA) missions have been observing the oceans, measuring global and regional mean sea level, as well as its change. Altimeters on board RA missions measure the sea surface height (SSH) by subtracting the measured altimeter range, the nadir-measured distance between the satellite and the sea surface, from the satellite altitude (H) above a reference ellipsoid of a terrestrial (geocentric) reference frame, currently known with a centimetre-level radial error (Rudenko et al., 2017). In the computation of accurate SSH, a multitude of well-understood effects must be properly considered: those that introduce errors in the measured range, e.g. atmosphere propagation delay, and those that induce SSH variability other than that under analysis over time, e.g. ocean tides and atmospheric pressure. Sea surface height anomalies, or sea level anomalies (SLAs), are computed subtracting a mean sea surface (MSS) from the corrected SSH measurements.
Range corrections are required to account for the delay the microwave pulses suffer, as they propagate through the atmosphere (ionospheric and tropospheric corrections, the latter including the effect of the neutral atmosphere), and for the interaction with the sea surface (sea state bias); geophysical corrections account for the sea level variability due to tides (ocean, solid Earth and polar tides, as well as loading effects) and for the ocean's response to atmospheric pressure (dynamic atmospheric correction, a combination of a high-frequency signal with the low-frequency inverted barometric response of the ocean); if needed to homogenise and inter-calibrate multi-mission data, the reference frame offset correction is applied, accounting for instrument-dependent effects and biases between missions (Fernandes et al., 2014). A detailed description of the corrections is given in Chelton et al. (2001) and Escudier et al. (2017). The SLA is expressed as
where Rcorr is the altimeter range (R) corrected for all instrument (ΔRinst), range (ΔRrange) and geophysical (ΔRgeoph) effects:
The quality of the SLA measurements has considerably improved over time, essentially because new models and corrections have become available, and satellite orbit determination and radar processing have improved in absolute accuracy. This is particularly true over open ocean, where altimeter waveforms do not depart from the expected shape given by the Brown model and geophysical and range corrections can be accurately estimated (Chelton et al., 2001; Escudier et al., 2017; Fernandes et al., 2006).
The total tropospheric path delay for microwaves can be divided into two components, one depending only on the surface pressure, the hydrostatic term, and a remainder that mainly depends on water vapour abundance, commonly termed wet path delay (WPD) (Askne and Nordius, 1987). The dry tropospheric correction (DTC) accounts for the hydrostatic term that, despite having an absolute value as large as 2.3 ± 0.2 m in the zenith direction at sea level, can be calculated over the ocean with millimetre accuracy, provided the sea level atmospheric pressure is known at each location (Fernandes et al., 2014). From here onwards, the terms DTC and WTC are used to refer to the dry and wet tropospheric corrections (negative values), respectively, applied to RA measurements, and, accordingly, dry path delay (DPD) and WPD refer to the corresponding absolute values. The DTC computation can be carried out using sea level pressure fields given by numerical weather models (NWMs), as described in e.g. Fernandes et al. (2013a). Ranges are corrected for the wet path delay through the wet tropospheric correction (WTC), possessing an absolute value of less than 0.50 m (Chelton et al., 2001). Contrary to the estimation of the DTC, the WTC retrieval requires the knowledge of the full water vapour and temperature profiles, which are known to be highly variable, both temporally and spatially (Dousa and Elias, 2014; E. Vieira et al., 2019). Therefore, to properly account for the microwave propagation delay through the troposphere, RA missions carry aboard passive microwave radiometers (MWRs), nadir-looking instruments capable of measuring both the water vapour and the cloud liquid water components of the wet path delay, from brightness temperatures in appropriate bands of the microwave spectrum.
Radiometers embarked on RA missions can be divided into two main groups (Steunou et al., 2015): two-channel MWRs, operating at frequencies of 21–23.8 GHz, the primary water vapour sensing channel, and 34–37 GHz, carried by the European Space Agency (ESA) ERS-1, ERS-2 and Envisat; by the ESA and EUMETSAT Sentinel-3; by the US Navy's GEOSAT Follow-On (GFO); and by the joint Indian Space Research Organization (ISRO) and Centre National d'Études Spatiales (CNES) SARAL (Satellite with ARgos and ALtiKa) missions and three-channel MWRs carried by NASA's missions TOPEX/Poseidon (T/P), Jason-1, Jason-2 and Jason-3, with an additional channel operating at 18–18.7 GHz. MWR footprints vary in the range of 20 to 45 km, depending on the instrument and frequency, except for the one embedded within SARAL's altimeter, for which the dual-frequency radiometer has a footprint diameter of less than 12 km (Steunou et al., 2015).
Accurate measurements of the integrated amount of water vapour and cloud liquid in the atmosphere are achievable over open ocean but difficult to perform in coastal regions where the precise estimation of the WTC is still challenging. Nearly a decade ago, the RA community started developing new algorithms and methodologies aimed at recovering altimetric data in the coastal region, leading to a more mature status of the, at that time, emerging field of coastal altimetry. Altimetric data in the closest 50 km from the coast are usually flagged as invalid and are therefore discarded or as non-existent due to several reasons. On the one hand, the shape of the waveforms can no longer be described by the Brown model, and this is overcome using specific retracking techniques; on the other hand, the accurate modelling of some corrections is difficult. This is particularly true for the estimation of the wet path delay, and consequently of the WTC, since in coastal areas the measurements of the MWR are in general contaminated by land, in part due to the large diameter of its footprint. Also important is the fact that the WTC retrieval algorithms are designed for open-ocean conditions, thus assuming surface emissivity values corresponding to open-ocean conditions; however, surface emissivity can be highly variable when the surrounding land surfaces contribute partially to the returning signal, causing a failure of the retrieval algorithms. Different strategies have been proposed in the last few years to accomplish the estimation of the wet tropospheric correction in coastal areas, which are summarised in Cipollini et al. (2017). One of these is the GNSS (Global Navigation Satellite System) derived Path Delay (GPD) algorithm. GPD was developed by the University of Porto (UPorto) in the scope of ESA's funded project COASTALT (Vignudelli et al., 2009) to estimate the WTC for correcting the altimetric data in the coastal European region. It has evolved over the last few years reaching a mature status recently (GPD Plus, GPD+), with the global computation of a WTC dataset for all operational and past RA missions that has been adopted as the reference to derive the ESA Climate Change Initiative Sea Level dataset (Quartly et al., 2017; Legeais et al., 2018).
This article aims to inform current and potential new users of GPD+ about the content and the services that the GPD+ database provides. The methodology, the input data sources and the supplied GPD+ products are presented and described. The WTCs provided in the GPD+ products have been assessed through various SLA variance statistical analyses, inspecting simultaneously the impact of the correction on sea level variability. Results are provided for the recently reprocessed and released Envisat Geophysical Data Record (GDR) V3.0 dataset, both globally and for three selected regions (the North American and European coasts and the Indonesia region), aiming to show the improvement in the description of the SLA field when the GPD+ WTC is adopted instead of the MWR- or ERA-derived WTCs provided in the Envisat GDR V3.0. A summary of the results for the remaining satellite altimetry missions is also provided. For more details concerning these results, readers may refer to Fernandes et al. (2015) and Fernandes and Lázaro (2016, 2018). To ensure the long-term stability of the GPD+ WTC, an important issue when trends in sea level change are calculated, the large set of radiometers used in this study have been previously inter-calibrated through the inter-comparison of the various datasets. The calibration parameters of this analysis are presented for all satellite altimetry missions. Additionally, strategies to further improve the methodology, aiming to enhance the quality of the GPD+ products publicly available in the database, are shared.
This paper is organised into five sections. The input data are described in Sect. 2.1; the technical description of the algorithm is presented in Sect. 2.2, and the generated WTC database is presented in Sect. 2.3. Section 3 describes the results obtained globally and for three regions that have been zoomed in on, selected to show the performance of the database in coastal regions, and includes a discussion. Section 4 describes the availability of the GPD+ products. The conclusions are provided in Sect. 5.
The GPD+ algorithm has been developed to estimate the WTC over coastal regions, where MWR-derived WPDs, if available, are usually anomalous values due to land contamination both in the altimeter and MWR observations. If uncorrected, this leads to a rejection of a large number of points in these regions. To accomplish this task, WPD datasets from different sources are combined through an optimal interpolation scheme.
2.1 Input WPD observations
In the most recent version of the algorithm (GPD+), WPDs from the following sources are used as input: (1) tropospheric zenith total delays (ZTDs) computed at a dense GNSS network of stations distributed globally along the coastline; (2) total column water vapour (TCWV) products generated from measurements from passive imaging MWRs on board environmental and meteorological Earth observation satellites; and (3) along-track WPD (the absolute value of WTC) measurements from the on-board MWR, before they become invalid when approaching the coast. The algorithm also provides valid WTC estimates for offshore and open-ocean measurements for which invalid WTCs are detected, provided WPD observations are available at those geographical locations. In this way, the algorithm attempts to eliminate measurements contaminated by heavy rain and ice, as well as faulty measurements due to, e.g., instrument malfunctioning.
2.1.1 WPD from GNSS-derived ZTD
As happens in satellite altimetry, tropospheric propagation delays are also a source of error in GNSS positioning and are therefore estimated at each GNSS station, for each observation. The quantity computed at each station is the slant total delay (STD) between the satellite and the ground-based station. Provided an a priori value for the zenith hydrostatic delay (ZHD, or DTC in satellite altimetry terminology), computed from knowledge of surface atmospheric pressure either measured locally or from NWM-derived meteorological data, and mapping functions for hydrostatic and wet components are known, the ZTD at station height can be computed with millimetre accuracy (Pany et al., 2001; Fernandes et al., 2013a, 2015). Mapping functions relate the delay in the station zenith direction, ZTD, to that in the actual satellite-station direction, STD. While the wet delay varies in time in an unpredictable way, the ZHD can be derived with millimetre accuracy from e.g. NWMs (Pany et al., 2001). Therefore, an a posteriori more accurate ZHD can be computed and subtracted from the estimated ZTD, yielding the wet delay in the zenith direction (zenith wet delay, ZWD, or WPD in satellite altimetry terminology). ZHDs, computed with millimetre accuracy at station height from ZHDs at sea level derived from sea level pressure (SLP) fields from an NWM (e.g. European Centre for Medium-Range Weather Forecasts Reanalysis (ERA) Interim or ECMWF operational models) and further reduced to station height using an adequate height reduction procedure, are used to derive WPD from the GNSS (Fernandes et al., 2013a, 2015). The WPDs obtained this way are given at station height and therefore at a level different from that of interest in satellite altimetry, which is the mean sea level. Therefore, the height reduction in the WPD is required. This has been performed using an exponential decay function, empirically obtained by Kouba (2008), valid for WPD height reductions for heights below ∼ 1000 m (Vieira et al., 2019a).
This summarises the methodology adopted by UPorto in the computation of WPD from GNSS measurements. A complete description of the methodology and its assessment can be found in Fernandes et al. (2013a, 2015) or Vieira et al. (2019a). Zenith total delays (ZTDs) estimated at UPorto, along with those available online from international GNSS services (IGS (International GNSS Service), EPN (EUREF Permanent Network) and SuomiNet) and from several stations located at the German Bight, provided to UPorto by the Technische Universität Darmstadt (TUD) in the scope of ESA's Climate Change Initiative (CCI) project, have been used. More than 800 coastal (at distances from the coast of less than 100 km) and offshore GNSS stations, with an altitude below 1000 m, are being used at the time of writing. Figure 1 shows the increase in the number of both GNSS stations and GNSS observations used as input into the GPD+ algorithm. The number of stations almost doubled, in May 2008, relatively to the number of stations at the beginning of the period and have been continuously increasing until the present. Figure 2 shows the location of the coastal and island GNSS stations used as input in GPD+ and the standard deviation (SD) of the WTC field from ERA-Interim for the along-track point of Envisat cycles 96–108 (November 2010–November 2011). WTC SD ranges from 1 to 15 cm and has a strong dependency with latitude. Maximum values of WTC SD can be seen in tropical southern and eastern Asia, in the north of Australia, and around Mexico and southwest USA, due to variable precipitation determined by the monsoon regime (E. Vieira et al., 2019). Over the polar regions, minimum WPD SD values are found (values < 3 cm).

Figure 1Number of GNSS stations used in GPD+ over time (light grey) and number of available GNSS observations per day (dark grey), for the whole RA era. Envisat period (May 2002–March 2020) is shown by the shaded rectangle. All GNSS stations are at a distance from the coast of less than 100 km.
2.1.2 WPD from scanning imaging MWR
The methodology developed by UPorto to calculate the WTC from TCWV products from passive imaging MWR on board Earth observation satellites is discussed in detail in Fernandes et al. (2013b, 2015). Due to their large spatial and temporal resolutions and spatial coverage, Scanning imaging MWR (SI-MWR) data increase the number of observations to use as input in GPD+ over the ocean, thus allowing the recovery of e.g. entire tracks for which the MWR-derived WTCs are missing due to instrument malfunctioning (i.e. where MWR- and GNSS-derived observations are not available). For this reason, their use improves the description of the WPD field. Additionally, these data are of extreme importance since they provide the unique possibility of computing the WTC over open ocean for those RA missions that do not possess an MWR, like e.g. CryoSat-2 (CS-2). In fact, GPD+ is an upgrade from the GPD methodology, which was developed to compute the WTC only for coastal points, relying only on the GNSS and valid on-board MWR measurements. Motivated by the need to compute an improved correction for CS-2, the SI-MWR dataset was included and the focus of the correction extended to open ocean.
Table 1Total column water vapour (TCWV) availability. For gridded products, two grids per day are made available, each grid comprising the ascending and descending passes. For the swath products, 14–15 orbital swaths per day are available for each instrument. For these latter products, the value provided for the spatial resolution is that of the central pixel (maximum value for pixel size is 130 km).
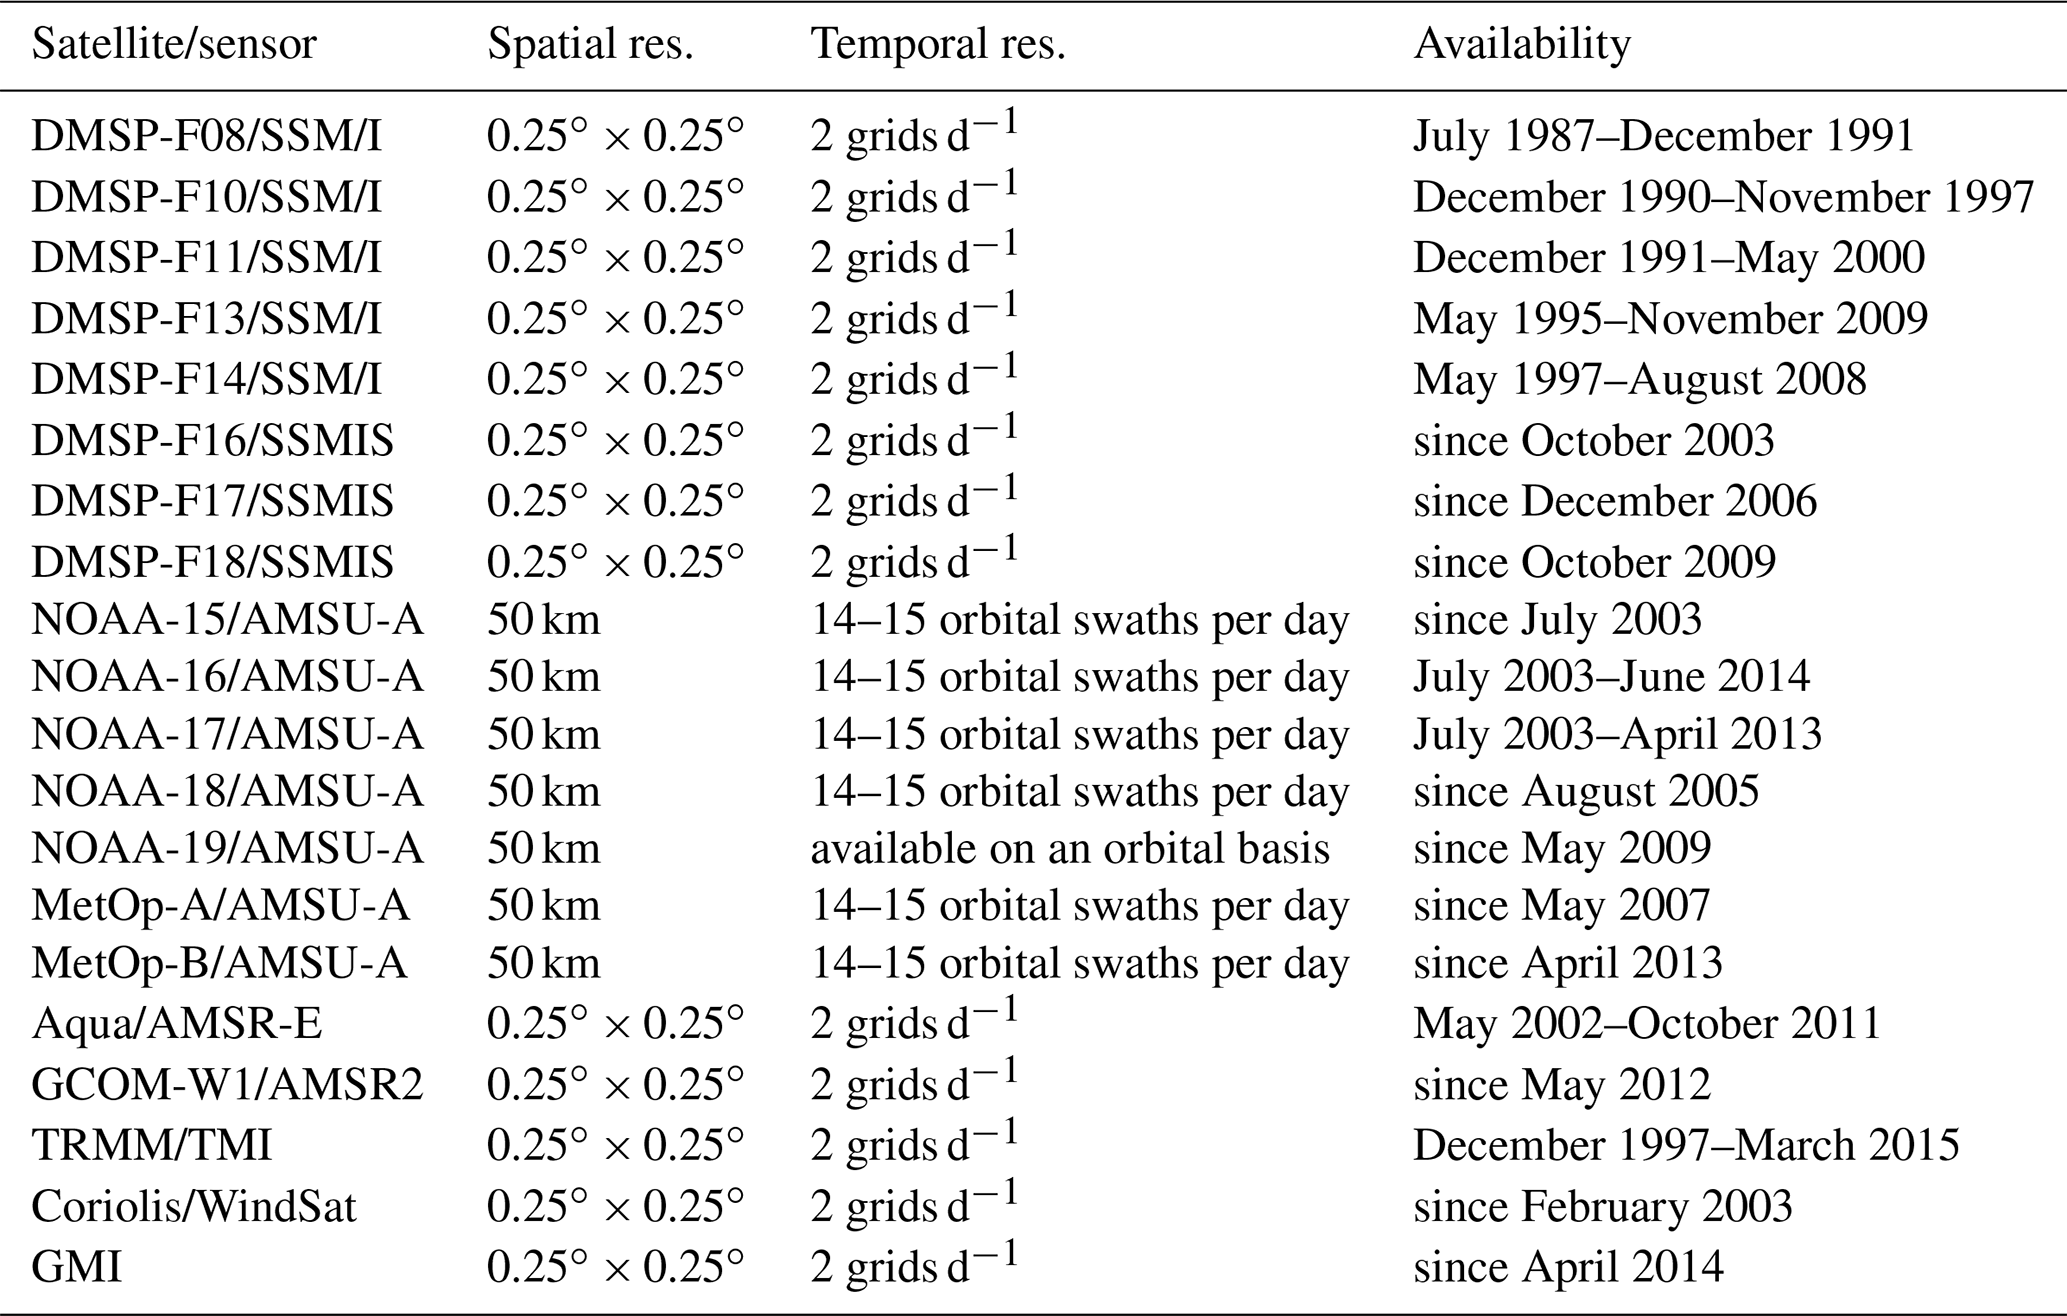
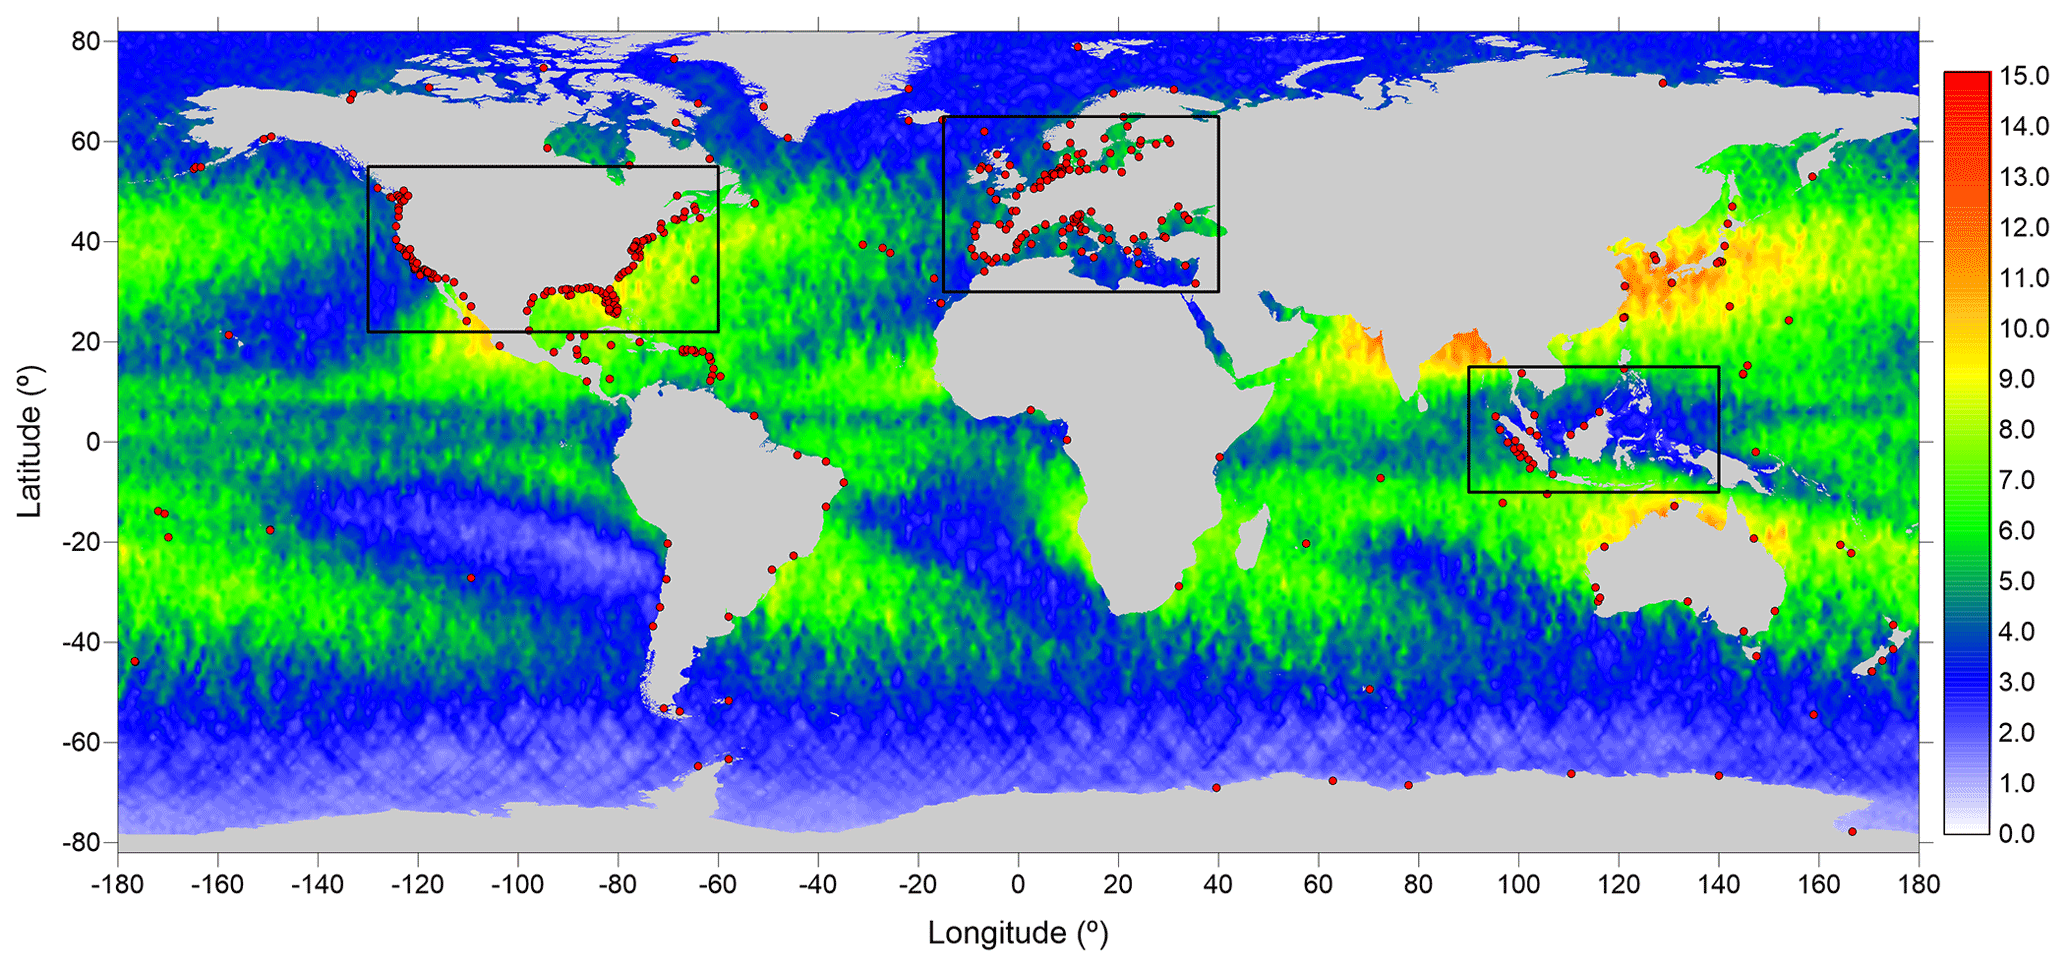
Figure 2Location of the coastal and island GNSS stations used in GPD+ (red dots). Background image shows the standard deviation of the WTC field, in centimetres, computed using ERA-Interim extracted for Envisat along-track points for the period November 2010–November 2011 (cycles 96 to 108). The black rectangles show the regions selected to perform the coastal assessment of the GPD+ WTCs (the North American and European coasts and the Indonesia region).
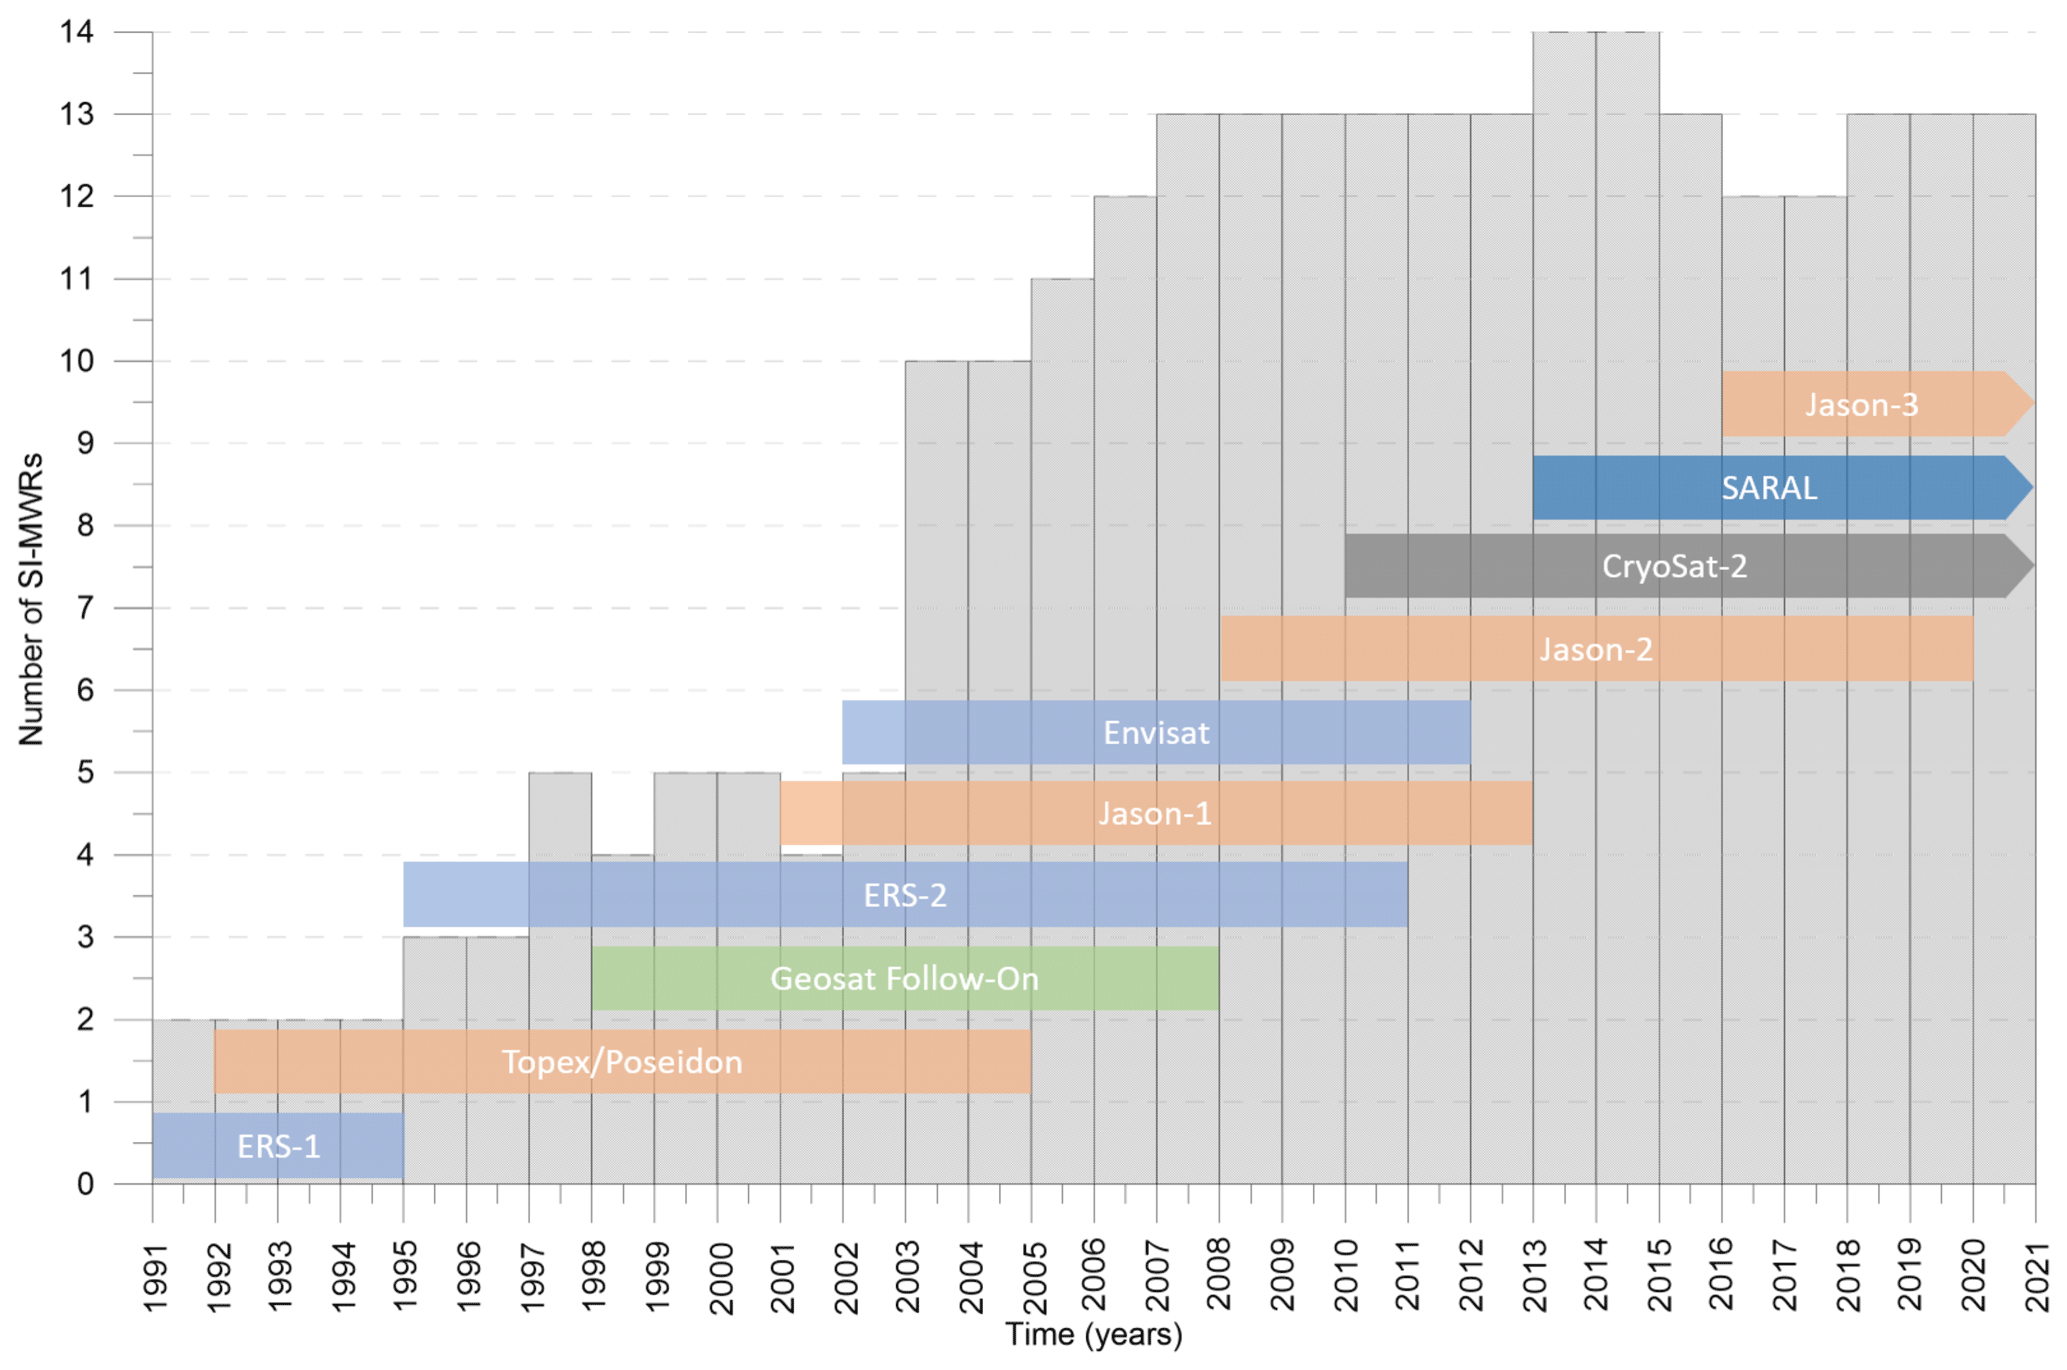
Figure 3Number of SI-MWRs used in GPD+ over time and period covered by each RA mission. SARAL, CryoSat-2 and Jason-3 missions are currently operational RA missions.
TCWV datasets from 20 scanning imaging (SI) passive MWR (SI-MWR), available at the NOAA Comprehensive Large Array-data Stewardship System (CLASS) and at Remote Sensing Systems (RSS) have been selected. CLASS includes data from the AMSU-A (Advanced Microwave Sounding Unit-A) on board the NOAA-16, NOAA-17, NOAA-18, NOAA-19, MetOp-A and MetOp-B satellites. RSS delivers datasets for several sensors, namely SSM/I (Special Sensor Microwave Imager) and SSMIS (SSM/I Sounder) on board DMSP (Defense Meteorological Satellite Program) satellites (F08, F10, F11, F13, F14, F16, F17 and F18), WindSat aboard Coriolis, the Tropical Rainfall Measuring Mission (TRMM) radiometer TMI (TRMM Microwave Imager), the Global Precipitation Measurement (GPM) Microwave Imager (GMI), and AMSR-E (Advanced Microwave Scanning Radiometer for EOS) on board Aqua and AMSR2 on the Japanese Global Change Observation Mission – Water satellite 1 (GCOM-W1). Two types of TCWV products have been used: Level-2 swath products in HDF-EOS2 format (near-real-time products, 14–15 orbital swaths per day available for each instrument) from all data sources except RSS, and Level-2 gridded products (two grids per day, each containing the ascending and descending passes) in binary format from RSS. Table 1 shows the availability of the TCWV products used as input in GPD+ and their main characteristics (spatial and temporal resolution and availability). Figure 3 shows the number of SI-MWRs over time for each RA mission. For the Envisat mission, for example, the number of SI-MWRs increased from 4 to 11, from the beginning (May 2002) to the end (March 2012) of the mission.
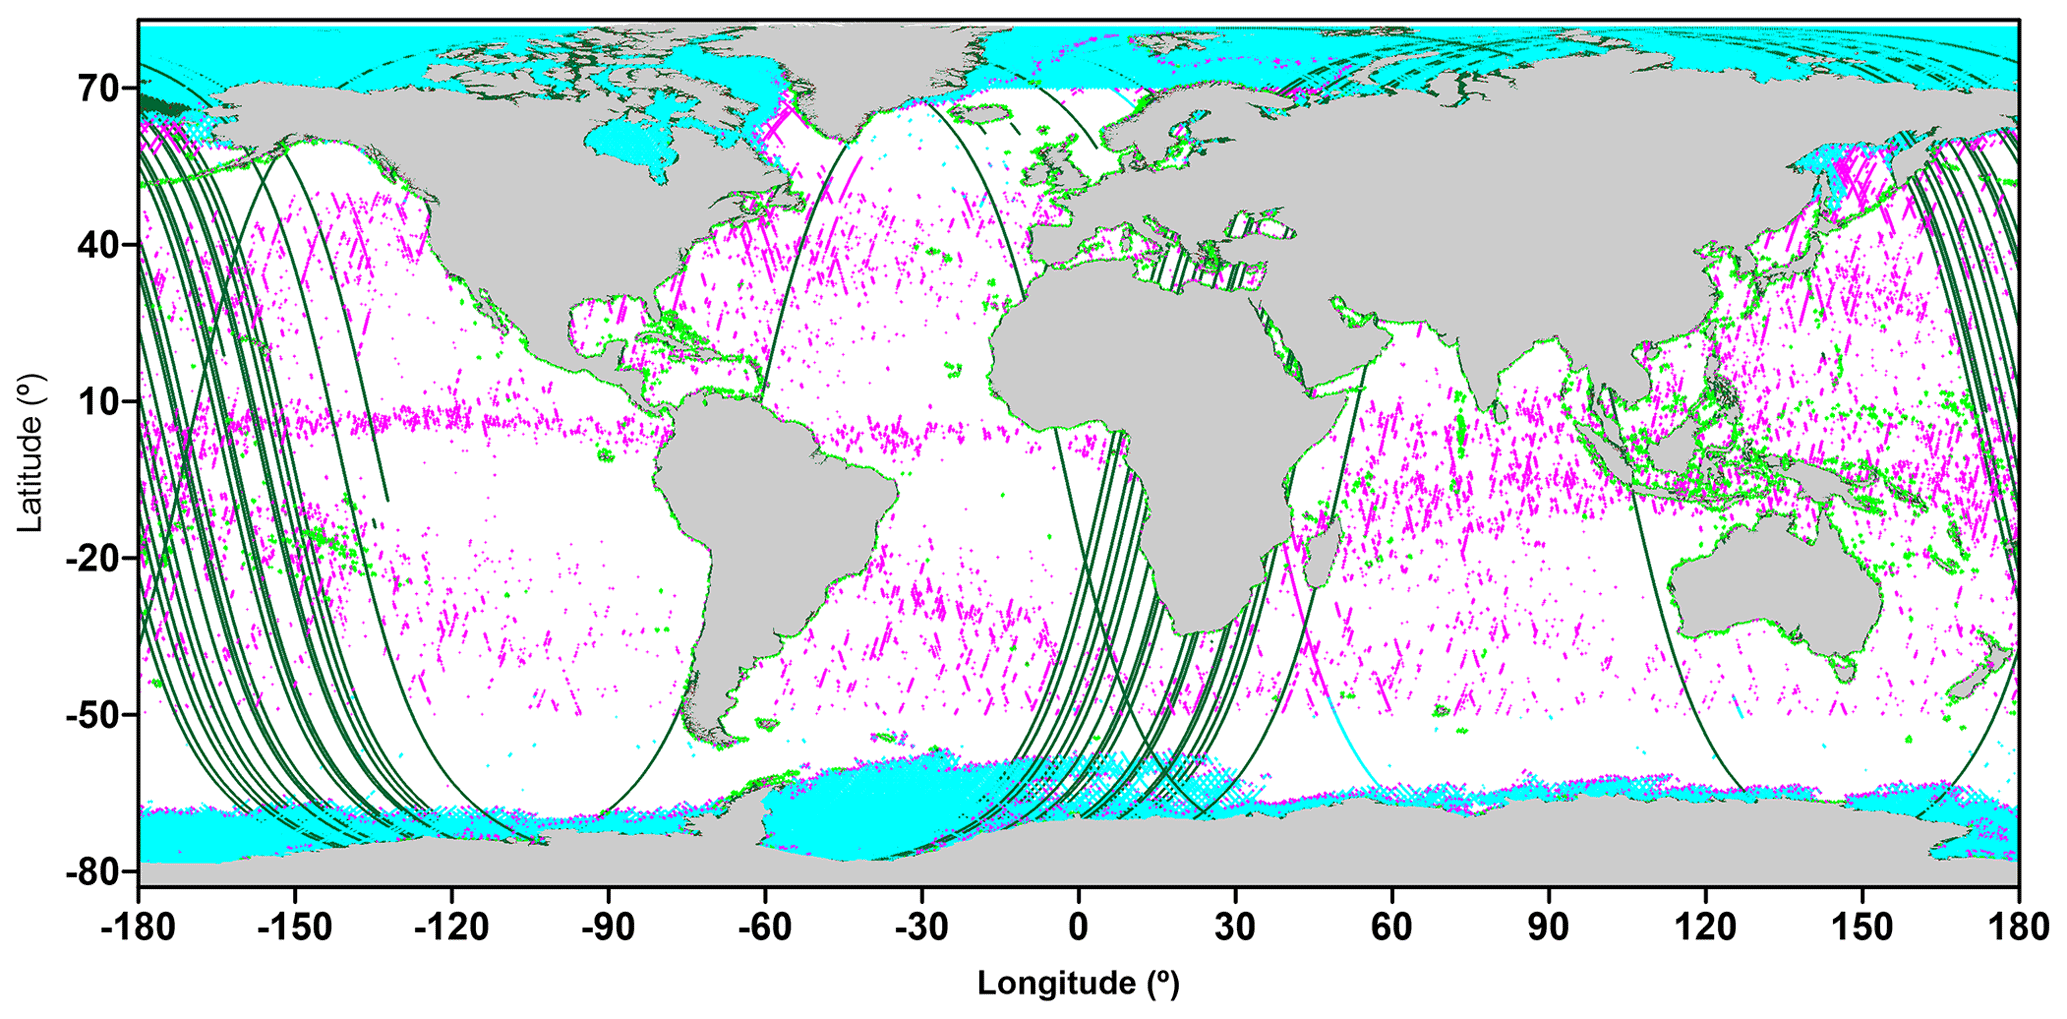
Figure 4Invalid MWR-derived WTC for Envisat cycle 12: (i) correction contaminated due to ice, (ii) correction contaminated due to rain and outliers; (iii) points flagged as coastal, may possess a correction contaminated by land; (iv) no available MWR-derived WTC value (the “fill value” is given). A note must be made that there are several points with an available MWR-derived field but with an invalid value and without any error flag that are detected and flagged by the GPD+ algorithm.
The calculation of the path delay from TCWV can be performed knowing that the quotient between WPD and TCWV is modelled by a decreasing function of WPD of the type
with constants a0=6.8544, , a2=0.0714 and , for TCWV on the right-hand side of the equation in centimetres (Stum et al., 2011).
It is known that, in addition to TCWV, WPD also depends on temperature. Expressions such as Eq. (3) account for an implicit modelling of this dependence. Fernandes et al. (2013b) have shown that this expression leads to similar results to those obtained by adopting formulae that make use of explicit values of atmospheric temperature given e.g. by an NWM, such as the one adopted by Bevis et al. (1994). The authors show that after sensor inter-calibration, a crucial step to guarantee datasets' consistency, the WTCs derived from both methods are equivalent, with differences within ±2 mm.
2.1.3 WPD from along-track MWR
The provenience of the MWR-derived WTC used as input in GPD+ is the Radar Altimeter Database System (RADS) (Scharroo et al., 2012), except for Envisat, as this mission has been recently reprocessed, and SARAL before cycle 30 (for cycles 1 to 30, the MWR-derived WTC provided in the products from the Prototype for Expertise on AltiKa for Coastal, Hydrology and Ice (PEACHI) project (Valladeau et al., 2015), available through AVISO+, have been used). It is recalled that the WPD is the absolute value of the WTC, the quantity of interest in satellite altimetry. RA data necessary to compute the SLA datasets used to validate the GPD+ WTC are also extracted from RADS. For each RA mission, only valid MWR-derived WTCs are input into the algorithm; therefore the correct identification of valid or invalid measurements is of crucial importance. An exception is made for CryoSat-2 (for which, in the absence of an on-board MWR, a WTC is generated for all along-track altimeter points): GPD+ estimates a WTC for those points with an invalid MWR-derived WTC only. In this way, the valid observations from the on-board MWR are preserved.
Table 2Calibration parameters (offset, scale factor and linear trend) obtained for all RA missions with an on-board MWR included in the GPD+ database (Fernandes et al., 2019). For the Jason-3 (J3) and SARAL (SA) missions, no parameter for the linear trend has been computed due to the short length of their datasets. For an explanation of the mission codes, please refer to Table 4.
Invalid measurements are usually detected using a set of flags, some of them provided in the products, as the radiometer flag for the surface type or the ice flag. If different from 0, these flags indicate invalidity due to (1) land contamination or instrument malfunctioning or (2) ice, respectively. MWR-derived WTCs outside the range −0.5 m ≤ WTC < 0.0 m, generally due to heavy rain or ice, are also discarded. A validity criterion based on the distance from the coast is also applied: if the location of a certain MWR measurement is such that its distance from the coast is less than a threshold value, then this measurement is most certainly contaminated by land. Threshold values used in this criterion depend on the RA mission. Adopted values are based on the known characteristics of each instrument and on an independent assessment of the on-board MWR observations using GNSS-derived WPDs in the coastal zones (Vieira et al., 2019a). Results for ESA missions are alike, showing that land contamination occurs at distances from the coast of less than 30 km; the same threshold has been used for GFO and T/P. In relation to the remaining NASA missions, values of 15 km have been used for Jason-1, Jason-2 and Jason-3. For SARAL, a threshold value of 15 km was adopted. Also, noisy MWR measurements are discriminated using median filters based on statistical analysis of the differences to the NWM-derived WTC on the same along-track point and neighbouring points. Invalid measurements are detected if (1) the radiometer surface type flag is different from 0, (2) the ice flag is different from 0, (3) the measurements do not satisfy the defined statistical criteria or are outside WTC limits, or (4) the measurements are at a distance from the coast of less than the threshold established for that mission. Figure 4 shows all the along-track points flagged as invalid for Envisat cycle 12, which reach 29.5 %. As it will be shown in Sect. 3 for Envisat, per cycle and on average, approximately 30 % of the oceanic points have an invalid WTC value; for these points, an SLA value cannot be computed due to the invalidity of the WTC or of other corrections or because a certain criterion is not met (e.g. number of 18 Hz measurements to compute the 1 Hz values used less than the imposed minimum). For approximately 10 % of all oceanic points (including the coastal zone), the WTC is the only correction that prevents the computation of the SLA. This is, on average, the percentage of points with a valid SLA value recovered by the GPD+ algorithm for a mission such as Envisat. For other missions, this percentage depends on instrument type, band of latitudes covered by the mission (which determines the amount of ice contamination) and instrument performance and is summarised in the conclusions.
2.1.4 Radiometer calibration
Global mean sea level is a valuable proxy to understand climate change and how it operates, since it includes the response from various components of the climate system. Also important in the analysis of trends in sea level change, which requires a 0.3 mm yr−1 error level set by the Global Ocean Observing System (GOOS), is the stability of the altimetry dataset. Therefore, the examination, and consequent accounting for, of drifts in the corrections, particularly in the WTC, is necessary to ensure that the corrections are stable in time and do not introduce spurious trends in the SLA.
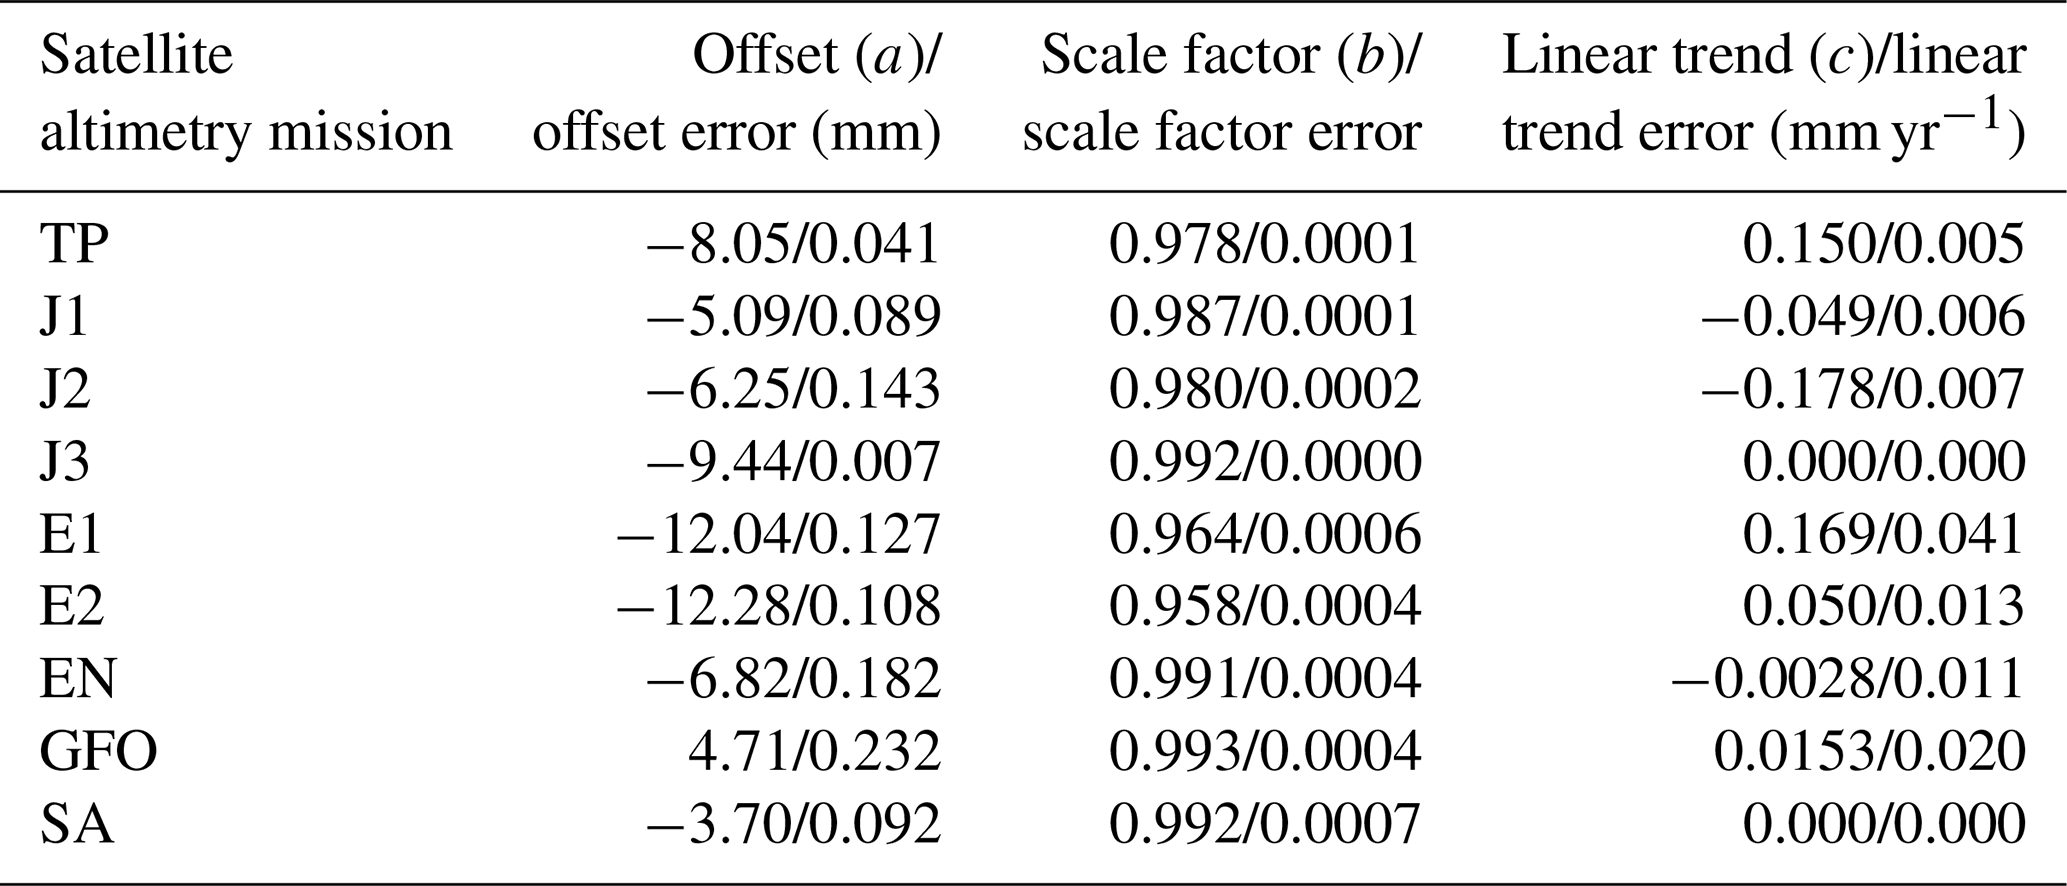
To ensure long-term stability of the GPD+ WTC, the large set of radiometers used in this study has previously been inter-calibrated through the inter-comparison of the various datasets. Data from the reference missions for sea level investigations, such as the T/P and Jason series (and soon Sentinel-6), have been calibrated against those of the Special Sensor Microwave Imager (SSM/I) and the SSM/I Sounder (SSMIS) by selecting matching points from each pair of missions operating simultaneously with a difference in time and location of less than 45 min and 50 km, respectively (Fernandes et al., 2013b). The time series of these matching points was used with a three-parameter model to adjust offset (a), scale factor (b) and linear trend (c) for each mission (Fernandes and Lázaro, 2016):
The remaining altimetry missions were then inter-calibrated to these calibrated datasets from the reference missions since orbits of almost all remaining missions are sun-synchronous with different times for the Equator crossing than those of the SSM/I or SSMIS, with a small number of matchups mostly found at high latitudes, not representative of the WTC variability. For these missions, data were analysed at crossover points and the same adjustment parameters were obtained from the time series. For the crossover analysis, only data with a difference in time of less than 180 min were used. As an example, the calibration parameters that have been obtained for Envisat are mm, b=0.991 and mm yr−1, showing that the trend is negligible and indicating that the dataset is well aligned with the altimeter reference missions and with SSM/I and SSMIS. The small offset and scale factor have the impact of making the correction more negative by 6–7 mm. The calibration parameters (offset, scale factor and linear trend) and their formal errors, obtained for all satellite altimetry missions with an on-board MWR available in the GPD+ database, are presented in Table 2. For more details concerning the calibration of the radiometers, readers are advised to see Fernandes and Lázaro (2016).
2.1.5 WPD from NWMs
Space–time collocated WTCs from NWM grids are adopted in the OA as the first guess. Usually two models from ECMWF are used: the ERA model, provided every 6 hours with spatial resolution, used for missions prior to 2004, and the ECMWF operational model (ECMWF op., 6 h time interval, spatial resolution) for missions after this period. Since ECMWF op. has undergone several updates and does not have the same accuracy over time, for all missions with data before 2004 (T/P, Jason-1, ERS-1, ERS-2, Envisat and GFO) ERA-Interim is used in GPD+, while for the most recent missions ECMWF op. is adopted. Therefore, in the absence of observations to improve the first guess, a WTC estimate from ERA-Interim or ECMWF op. is output from GPD+. This is normally the case for the northernmost latitudes. In addition, to reduce data discontinuities, output values solely based on model data are adjusted to the valid MWR measurements of each cycle by solving for the mean difference, on the order of a few millimetres, between the two datasets for all points with a valid MWR-derived WTC.
2.2 Algorithm description
The GPD+ algorithm is based on objective analysis and estimates the wet path delay, given measurements from different sources of the variable under study at a restricted number of data points. The statistics of the field are estimated in the form of a correlation function and the measurement errors associated with each type of observation. The expected error associated with this estimate is also derived. The technique for the objective analysis is fully described in Bretherton et al. (1976).
The algorithm was originally implemented to calculate the WTC in the coastal zone, where the retrieval of the wet path delay from on-board MWR measurements becomes invalid. Later, it evolved to also provide the correction over open ocean, providing the correction during, for example, instrument malfunctioning, and over inland waters.
For the altimetry missions carrying an on-board MWR (all but CryoSat-2), a GPD+ WTC estimate is calculated for all along-track points with an MWR-derived WTC deemed as invalid, using valid WTC observations from different sources at the nearby location and within a time interval, defined by the spatial and temporal radiuses of influence used in the computation. In the current GPD+ version, these radiuses have been set equal to the correlation spatial and temporal scales. Whilst the spatial correlation scale varies spatially, both with longitude and latitude (Fernandes and Lázaro, 2016), the temporal correlation scale has been set to 100 min (Bosser et al., 2007). For the CryoSat-2 mission, since it does not carry a passive microwave radiometer, a GPD+ WTC estimate is computed for every along-track point using third-party data (WTC observations, other than those from the on-board MWRs) only. The location and time of each along-track measurement are those provided in the GDR products present in RADS. Due to the temporal difference between adjacent satellite tracks, in practice only along-track valid on-board MWR measurements from the track to which the point of estimation belongs are used.
Regarding the accuracy of the observations, a constant value of 0.5 cm has been set for the white noise of the GNSS- and MWR-derived wet path delays, while for the SI-MWR observations a value of between 0.7 and 1.1 cm, depending on the mission, has been used (Fernandes et al., 2013b).
The procedure for finding a good estimate of the WTC starts with the definition of the first guess or a priori value for the field. In the current version of the algorithm, the first guess is the space–time collocated NWM-derived wet path delay from ERA-Interim or ECMWF op., the most suitable depending on purpose and time period. Therefore, in the absence of observations, the GPD+ WTC equals the NWM-derived WTC. In the presence of observations, its input number is limited to 15 in order to decrease the computational burden; the chosen observations are those for which the statistical weights are larger, meaning that for these measurements the differences in acquisition time and distance to the point where the estimate is being calculated are the smallest.
The estimates for those missions that embark an MWR rely on the valid MWR-derived WPD values. Therefore, one of the core competencies of the GPD+ methodology is its ability to detect corrupted WTC values, which is achieved through the definition of improved criteria for their detection. Measurements flagged as invalid are those that (i) have the radiometer surface type flag set as 1; (ii) are contaminated by ice; (iii) are contaminated by rain; (iv) are outside the range [−0.5 m, 0.0 m]; (v) have mission-dependent flags (e.g. radiometer along-track averaging flag for Envisat) set as 1; (vi) do not satisfy several statistical criteria based on the differences between adjacent measurements and between MWR and NWM values; and (vii) are at distances from the coast of less than 15 or 30 km, depending on whether they are from a reference and SARAL or ESA mission.
A general Gaussian space–time correlation function of the form
where r and Δt represent the distance and the time interval between acquisitions of each pair of points and C and T are the spatial and temporal correlation scales, respectively, has been adopted to account for the spatial and temporal variability.
A diagram showing the workflow of the GPD+ algorithm is shown in Fig. 5.
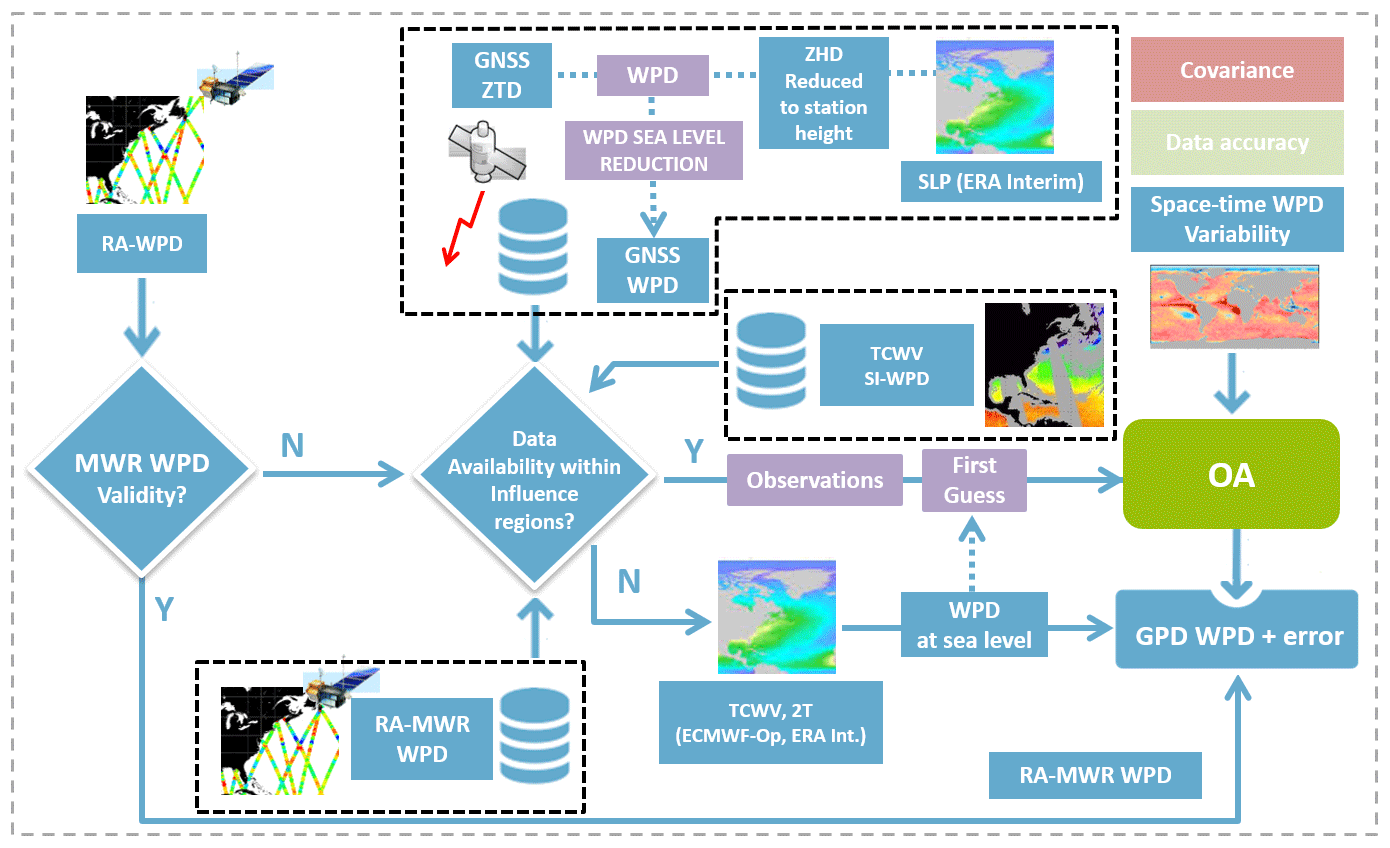
Figure 5Fluxogram of the GPD+ algorithm.
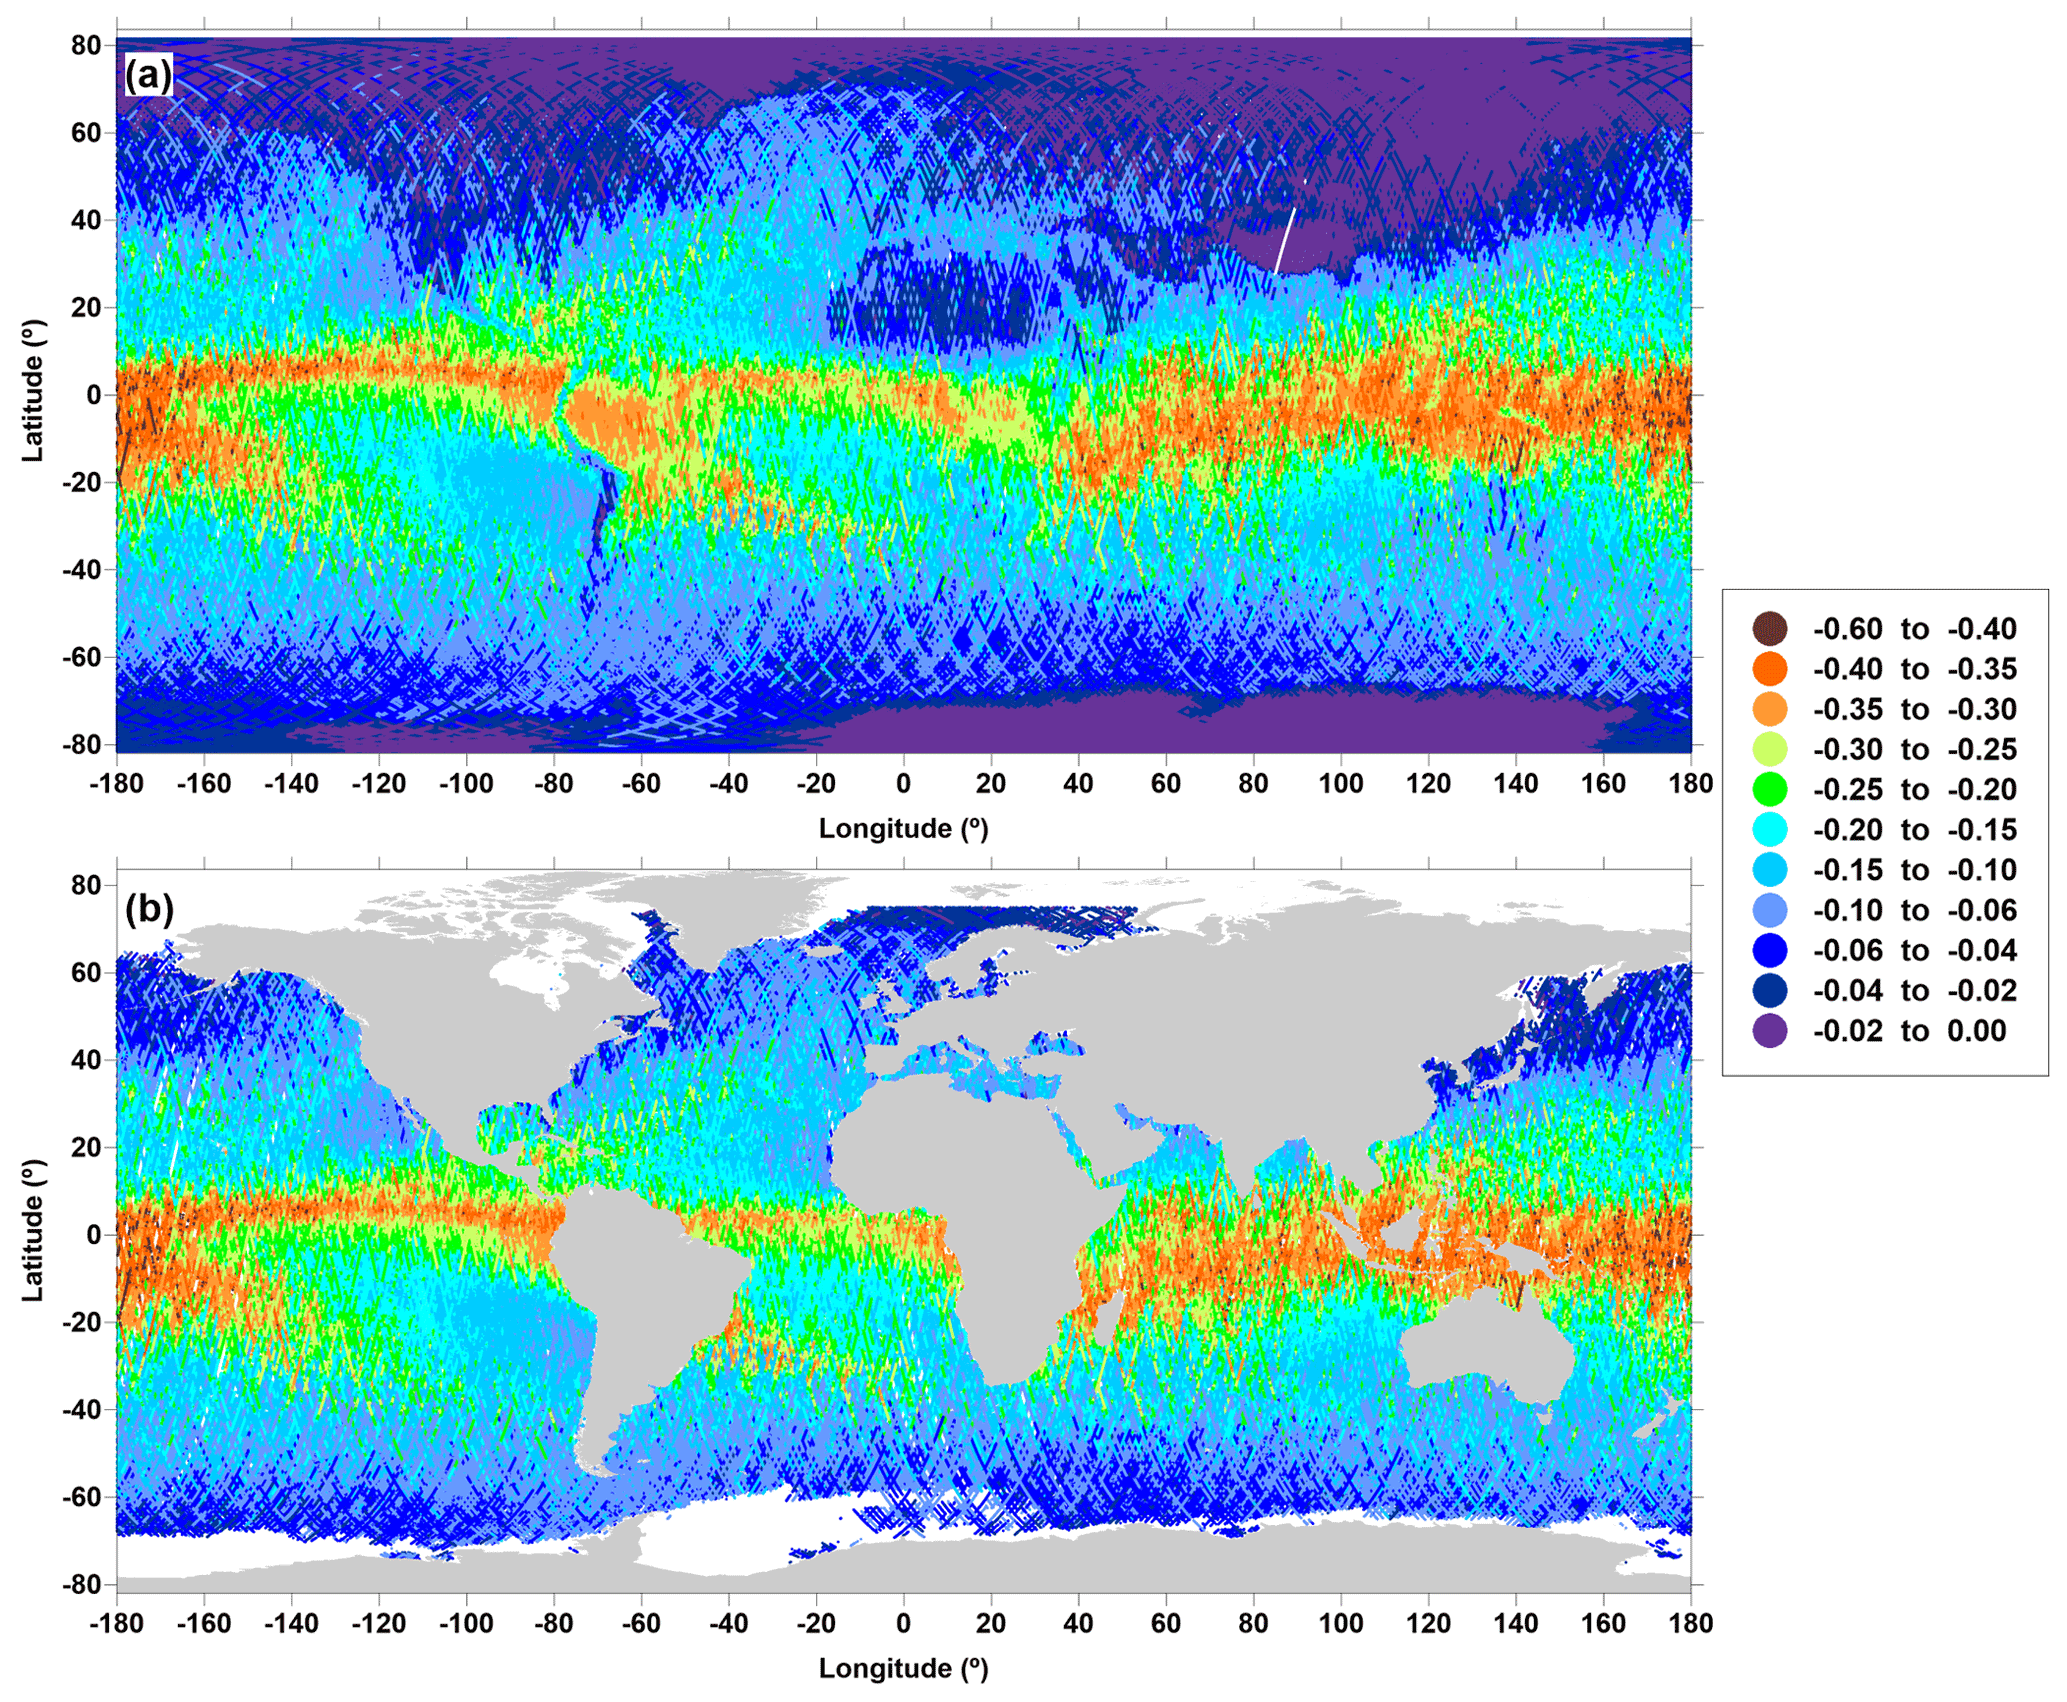
Figure 6GPD+ WTC, in metres, for Envisat cycle 12: (a) global coverage and (b) correction over oceanic regions with valid SLAs.
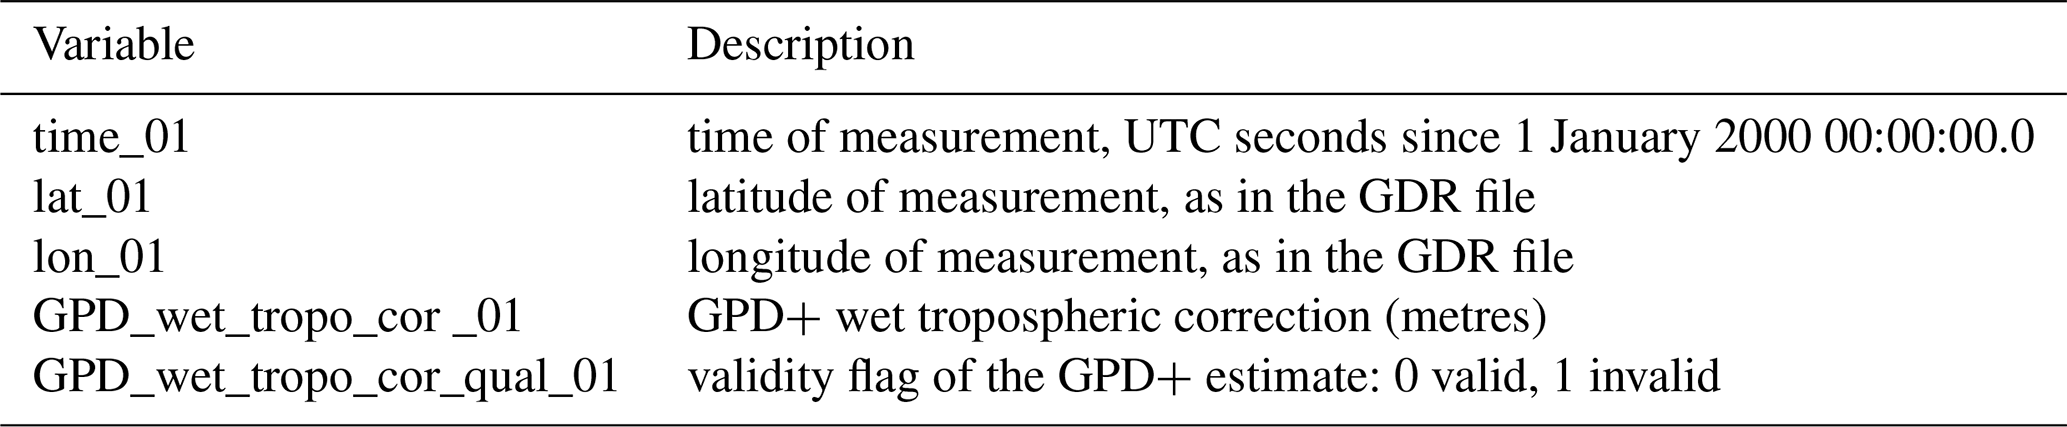
Table 3Data content in each GPD+ WTC NetCDF file, for the time and location of each RA mission measurement (Fernandes et al., 2019).
2.3 GPD+ WTC files description and nomenclature
As the impact of the correction is mainly in ocean studies, in the current version, the final GPD+ WTCs are continuous products over the ocean and coastal regions. To prevent the loss of points when interpolating to 20 Hz points, in addition to ocean points, the closest point over land is included, provided it is within a distance of less than 50 km from the ocean. This guarantees that observations over ocean necessary to compute the WTC for this location are still available within the radiuses of influence centred on the point. The WTC estimated for the closest points over land are also estimated at sea level. For Envisat, as this mission has been recently reprocessed (Version 3.0), the GPD+ WTC covers the whole range of latitudes and surfaces, including land. Corrections are currently publicly available for 10 RA missions: T/P, Jason-1, Jason-2, Jason-3, GFO, ERS-1, ERS-2, Envisat, SARAL and CryoSat-2. Figure 6 gives an example of the GPD+ WTC for Envisat's cycle 12, showing global coverage (top panel) and over-ocean regions with valid sea level anomaly values (bottom panel). As stated above, the correction has its main impact over the ocean since it is meant to be used to improve satellite altimetry. Over non-oceanic surfaces, the correction has been set equal to the ECMWF ERA-Interim or operational models, depending on the mission, as previously explained (Sect. 2.1.5). This has already been done for Envisat, therefore ensuring that Envisat GPD+ products are continuous over ocean and non-ocean surfaces. Future versions of the GPD+ correction for the remaining missions will cover all surface types as well. In addition, improving the GPD+ methodology is envisaged so that GPD+ WTCs will be estimated over non-oceanic regions, provided WPD observations exist (e.g. from MWRs over large lakes or from the GNSS). The GPD+ WTC products, whose content is described in Table 3, are provided for each cycle of the mentioned altimetric missions. For the time and location of each altimeter measurement, specified by the variables “time_01” in UTC seconds since 1 January 2000, 00:00:00.0, and “geodetic lat_01” and “lon_01” in degrees as given in each GDR file, the GPD+ wet tropospheric correction, in metres, and its associated validity flag, fields “GPD_wet_ tropo_ cor_01” and “GPD_wet_tropo_cor_qual_01”, respectively, are provided at 1 Hz. The sign convention adopted is that the WTC should be added to the range measured by the altimeter to correct it for the range delay. The data-quality flag can take the following values:
-
0. The MWR-derived WTC is valid, and, in this case, the GPD+ correction is equal to the MWR-derived WTC, after applying calibration factors, therefore preserving the high accuracy of these data.
-
1. The invalid MWR-derived WTC has been replaced by a valid GPD+ estimate based on observations.
-
2. No observations were available for the computation and the GPD+ estimate is the first guess (i.e. ERA-Interim for TOPEX/Poseidon and ERS-1, ERS-2, Envisat, Jason-1 or ECMWF op. for Ocean Surface Topography Mission (OSTM)/Jason-2, Jason-3, CryoSat-2 and SARAL/AltiKa) with a possible small bias applied.
-
3. The GPD+ estimate is outside the valid range ([−0.5, 0.0]), and either the value −0.5 or the value 0.0 was attributed to the output value (in the most recent implementation this never occurs, as these are replaced by the NWM values).
By using this flag, a knowledgeable user can select the data most suitable for a given application: a continuous correction e.g. for coastal studies, solely the valid measurements for the on-board MWR (e.g. for calibration purposes or global climate studies) or excluding the points solely based on NWM values.
Table 4Mission code used in the name of the GPD+ datasets (Fernandes et al., 2019) and their availability.
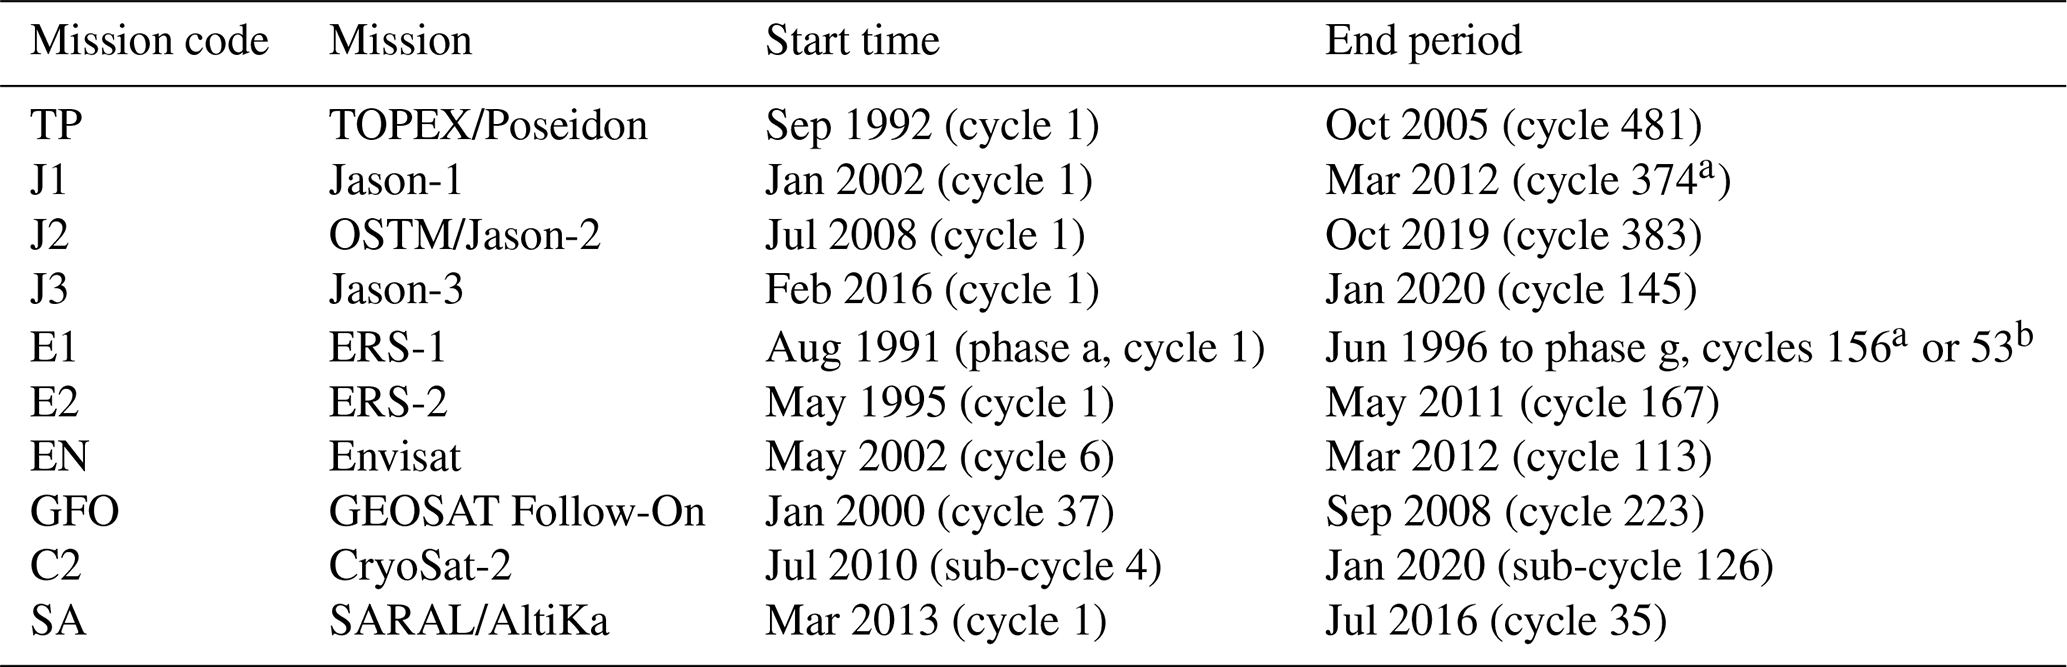
a RADS convention. b AVISO convention.
NetCDF files include self-documenting variables and common attributes.
The nomenclature selected for the GPD+ dataset is
where <MISSION> is a two-letter code that depends on the mission (see Table 4) and <CYCLE_NUMBER> is a three-digit number indicating the cycle number of <MISSION>. In all cases, the RADS cycle number convention has been adopted. In cases such as the Jason-1 geodetic phase (phase c), cycle numbers are different from those adopted by AVISO. For CryoSat-2, sub-cycle numbers of 27 or 29 d are used according to the RADS convention. The availability of GPD+ WTC for each mission is presented in Table 4 (Fernandes et al., 2019).
The results provided here have been obtained in the scope of several ESA-funded research projects and present new scientific findings that have not been published before. For Envisat, the GPD+ WTC was computed for inclusion in the newly reprocessed Envisat Geophysical Data Record (GDR) V3.0 dataset in the ambit of the second ESA Envisat Altimetry Full Mission Reprocessing (FMR). Results concerning the remaining RA missions are summarised in the conclusions. For more details, the reader is advised to consult Fernandes and Lázaro (2018) for Sentinel-3; Fernandes and Lázaro (2016) for CryoSat-2 and GFO; and Fernandes et al. (2015) for T/P, Jason-1, Jason-2 and ESA missions, although the latter results were obtained with a previous version of GPD+, the so-called GPD algorithm.
3.1 GPD+ WTC for Envisat mission
Results for Envisat cover the period May 2002 to April 2012, cycles 6 to 113, which corresponds to the whole Envisat FMR V3.0 dataset released in July 2018 (ESA, 2019). The GPD+ WTC is here compared with the ECMWF Reanalysis WTC (ERA-Interim, field mod_wet_tropo_ cor_ reanalysis_01) and with the WTC derived from the on-board MWR (field “rad_wet_ tropo_cor_sst_gam_01”), both present in the FMR GDRs. The Envisat V3.0 reprocessed data have been improved, comparatively to the previous version, in many aspects, among which is an increased availability of the data acquired by the MWR, particularly at the beginning of the mission.
In the estimation process, the ERA-Interim WTC was selected as the first guess, being therefore the adopted values in the absence of measurements, such as those occurring over land. Anomalies in this field have been found, with the field out of limits in a set of points, most of which are concentrated on certain passes. This is due to the fact that this correction has been computed from 3D model fields at the altimeter measurement altitude. Therefore, whenever the altimeter-derived surface height is not set (Not-a-Number value, NaN), the corresponding model-derived WTC will also be NaN. As our goal is to be able to provide continuous WTCs, without data gaps, this field is unsuitable for use in the GPD+ estimations. For this reason, abnormal values present in the products were replaced by those computed from ERA-Interim single-layer fields of TCWV and 2 m temperature, with the formulation used by Fernandes and Lázaro (2016).
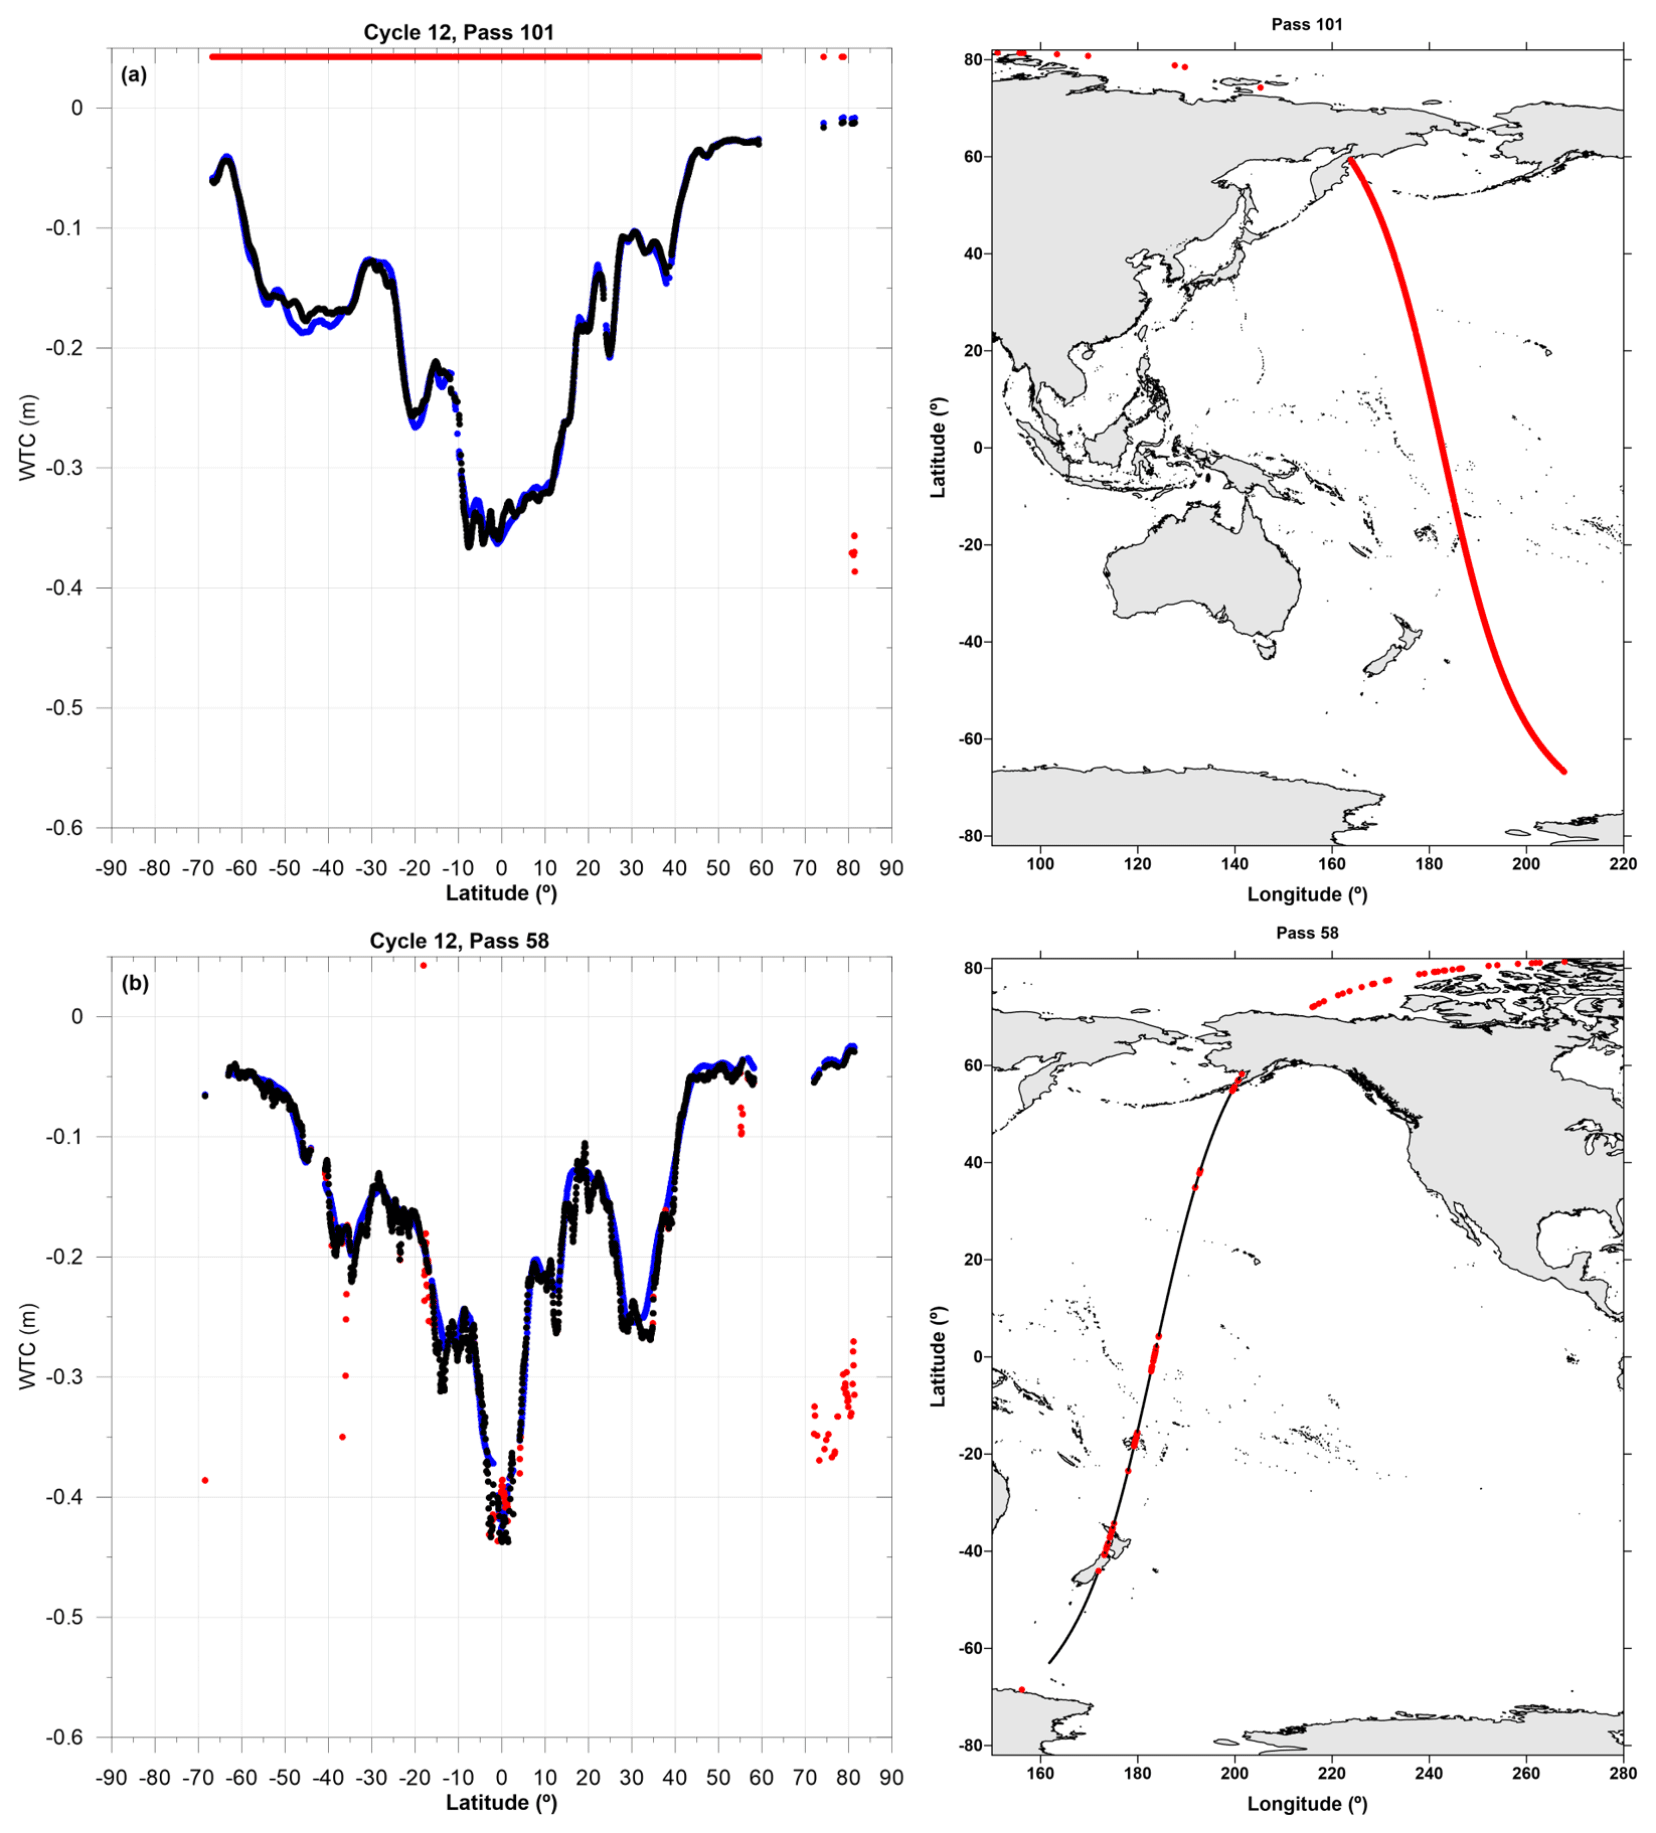
Figure 7Along-track WTCs (m) present in the Envisat FMR V3.0 products for Envisat cycle 12, passes 101 and 58 (panels a and b, respectively): GPD+ (black), MWR-derived WTC (red) and ERA-Interim WTC (blue). Panel (a) shows an example of the unavailability of the on-board MWR-derived WTC; panel (b) shows contamination by ice and rain (red points around the Equator) in the MWR-derived WTC. Right: geographical coverage of the Envisat tracks shown in the left panels (longitude is given in the 0–360∘ range to show the entire track). Along-track points with a GPD+ estimate are shown in red, while points where the GPD+ kept the MWR-derived WTC are shown in black.
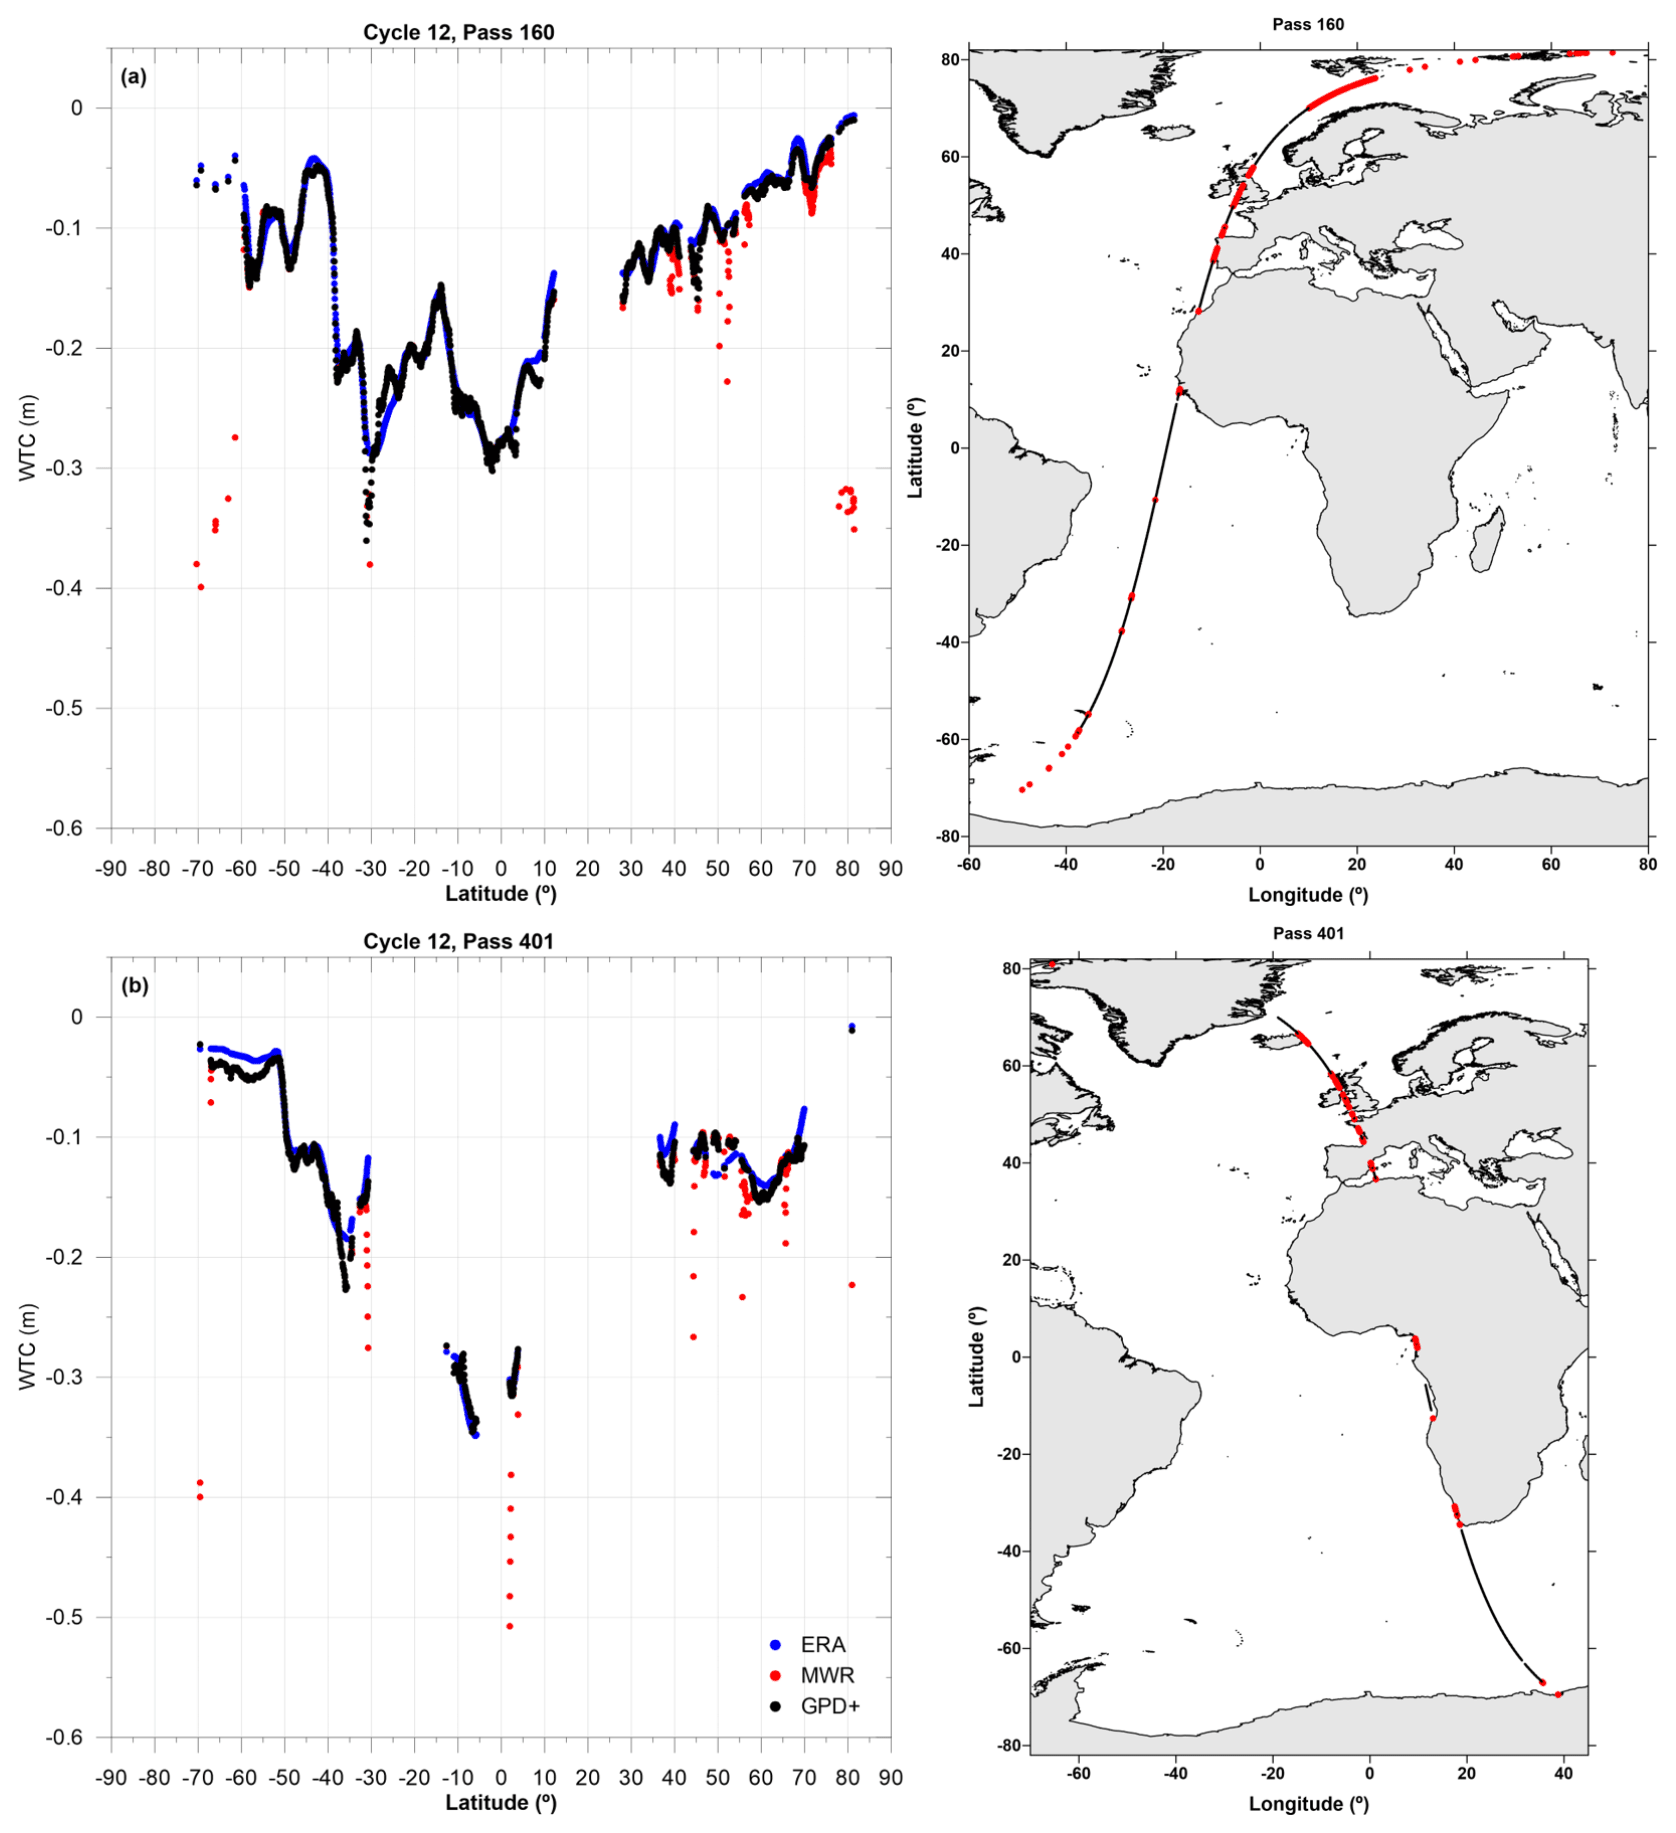
Figure 8Same as Fig. 7 for Envisat tracks 160 and 401 (cycle 12) showing (a) the existence of outliers (red points located over ocean between latitudes 30 and 40∘ S) and (b) contamination by land proximity.
The MWR-based correction used in the generation of the GPD+ WTC products (“rad_wet_tropo_cor_sst_gam_01” GDR field) is hereafter called “on-board MWR-derived WTC”. Figures 7 and 8 show the GPD+ WTC for some Envisat tracks, with different WTC variability conditions, exemplifying several issues commonly encountered in the on-board MWR-derived WTC that no longer exist in the GPD+ WTC: unavailability of the correction (Fig. 7a), correction contaminated by ice (Figs. 7b and 8a, at latitudes above ±60∘), existence of outliers (red points over open ocean at latitudes 30–40∘ S in Fig. 8a), and correction contaminated due to land proximity (red points around coastal regions in all panels except Fig. 7a). The improvement in the description of the WTC signal in terms of small spatial scales when compared to the ERA-Interim WTC (in blue) is clear in Fig. 7a (e.g. around latitudes 10∘ S–10∘ N). It is important to note that the corrections are shown only for points for which a valid SLA value can be computed after recovering the WTC, as explained in what follows.
Figure 9 summarises the results for the whole Envisat period (cycles 6 to 113). The percentages of points, for each Envisat cycle, with a rejected MWR-derived WTC, for which a GPD+ estimate has been computed are represented in pink and are seen to be around 30 %. Figure 4 shows an example of the geographical location of these invalid MWR-derived WTCs for Envisat cycle 12. For this cycle, the percentage of ocean points with an invalid WTC is 29.5 %, and the corresponding percentage when only points with valid SLAs are selected is 10.9 %. By way of example, for the same cycle, the percentage of points recovered due to land, ice and rain contamination, this latter also including outliers, is 8.9 %, 17.4 % and 3.2 %, respectively. The corresponding percentage of points for which a valid SLA value could be computed after the estimation of the WTC by GPD+ is shown in green. The number of points with valid SLA values (in grey) per cycle is also represented. This figure allows us to show that the GPD+ algorithm leads to the recovery of approximately 10 % of the points with a valid SLA value. In some cycles this value can reach 20 % or more; most of these points are located at high latitudes and in coastal regions. Keeping in mind that ESA missions are near-polar missions with an inclination of ∼ 98.5∘, they have the great advantage, when compared to the reference missions, of acquiring measurements at high latitudes. The recovery of data in these regions, as well as along the coastal regions, can be considered one of the greatest advantages of the GPD+ methodology. The given figures show that for around 20 % of the altimeter measurements, an SLA value could not be computed due to a reason other than the invalidity of the WTC. This means that if in future FMR the issues that prevent the SLA computation are totally or partially solved, the percentage of data recovery will increase up to a maximum of 30 % when the GPD+ WTC is used. Despite being provided continuously, the GPD+ WTC has its largest impact over ocean.
GNSS data cannot be considered independent from the GPD+ WTCs since they have been used in their computation. Therefore, these data are not adequate to use in the GPD+ validation. However, the analysis of the root mean square (RMS) value of the WTC differences, a function of distance from the coast, can be valuable to inspect the correction in coastal regions, where the methodology is committed to ameliorating the WTC. For this assessment, GNSS-derived WTCs have been computed at a network of 60 GNSS stations using the methodology explained in Vieira et al. (2019a). This network has a good geographical distribution and covers regions around the world with different atmospheric variability conditions. This dataset consists of WTC measurements at each station location for the whole period of observations available for that station, allowing a non-collocated comparison with WTC estimations at MWR points. Differences between these GNSS-derived WTCs and the on-board MWR and the GPD+ WTC retrievals, respectively, have been computed and analysed for the whole Envisat mission.
For the acquisition instant of each MWR-derived WTC, a GNSS-derived WTC is interpolated, at the station location, for the same instant and is further reduced to sea level; at the same acquisition epoch and location of each MWR-derived WTC, the GPD+ WTC is also available, being the two collocated both in time and space and over ocean. For each pair of WTCs (MWR and GNSS-derived WTCs and GPD+ and GNSS-derived WTCs, relative to the same instant), the distance from the coast of each altimeter point is computed. This process is repeated for each GNSS station with surrounding altimetry measurements and then the whole set of stations is considered, to obtain representative results for the whole globe. Differences are binned into 5 km intervals, and the RMS values are computed as a function of distance from the coast. The results are shown in Fig. 10, for distances up to 65 km from the coast, where red and grey bars represent the number of measurements used to compute the RMS of the differences GNSS − MWR and GNSS − GPD+, respectively. The number of differences is not the same for each case, since the number of invalid MWR-derived WTCs increases as the tracks approach coast, which are discarded from the analysis, while the same along-track points have valid WTC estimates from GPD+. For the comparison GNSS − GPD+, only WTCs retrieved from the observations have been selected (i.e. those estimated from the model were discarded); for the comparison GNSS − MWR, valid MWR values and those that would be rejected solely based on the criterion of distance from the coast were selected (otherwise the invalid measurements due to e.g. ice or rain contamination would overestimate the results). Consequently, the number of GNSS − MWR differences is generally smaller than the number of GNSS − GPD+ differences.
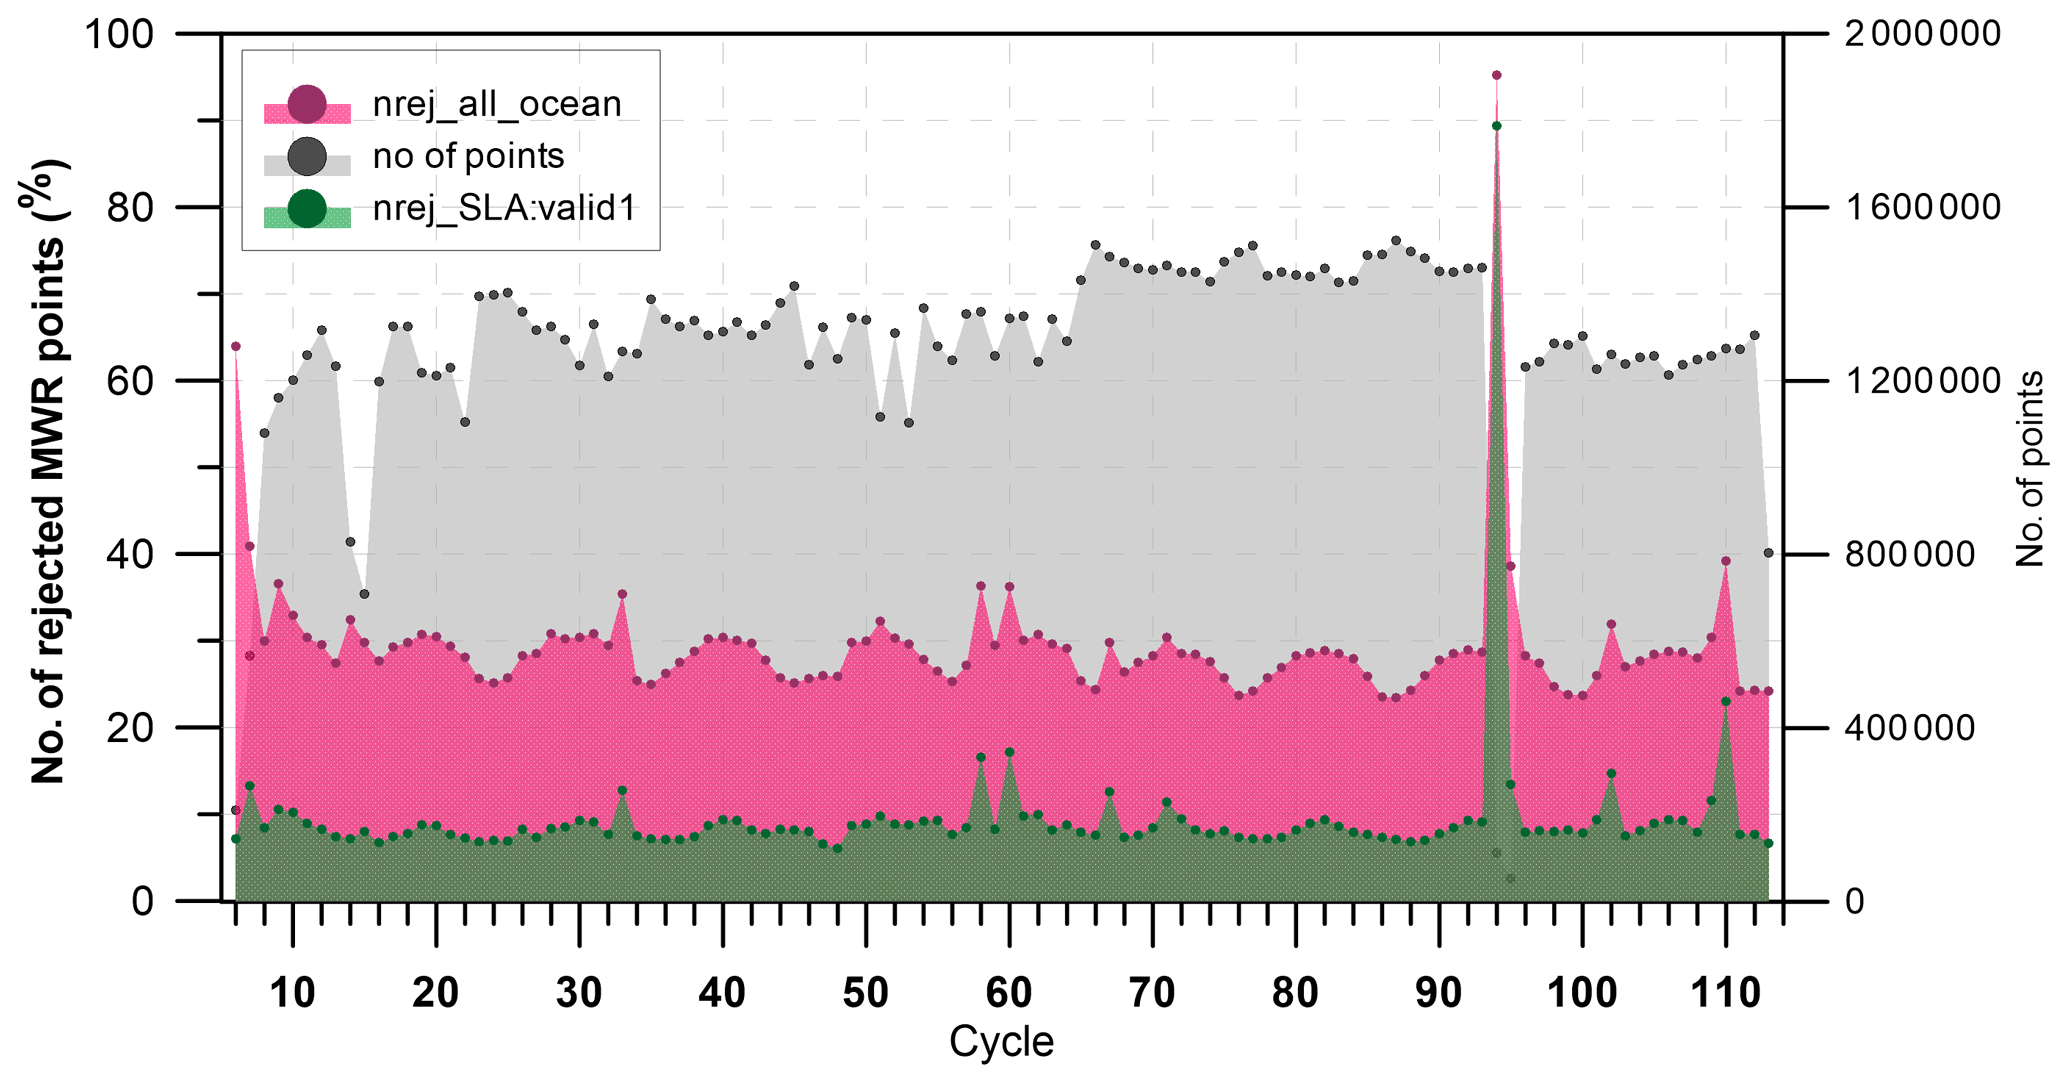
Figure 9Summary, for the whole Envisat period, of the percentage of points with a rejected MWR-derived WTC, for which a GPD+ estimate has been computed (pink), and for which a valid SLA value could be computed after the estimation of the WTC by GPD+ (green). Also shown in grey is the number of points with valid SLA values per cycle.
The increase in the RMS value of the GNSS − MWR differences in the closest 25 km from the coast, seen in Fig. 10, is a clear indication of the loss of accuracy of MWR-derived WTCs in this coastal strip. This also shows that when all rejection criteria except the one related to the distance from the coast are applied, land contamination exists, and it is therefore necessary to set up a criterion based on distance from the coast. Therefore, all MWR-derived WTCs within distances from the coast less than this threshold value are flagged as invalid in the GPD+ methodology (even if they are set as valid in the GDR) and not used as observations. Consequently, this threshold value will be useful in forthcoming GPD+ versions to estimate the WTCs for all points within this distance from the coast. Figure 10 shows that the RMS of the differences GNSS − GPD+ decreases when approaching the coast, where the stations and the number of differences generally increase, indicating that the GPD+ WTC estimates are valid up to the coastline and that these WTC values are recovered at all along-track points without valid MWR-derived WTCs. Moreover, Fig. 10 shows that the GPD+ methodology recovers the WTC not only along the coastal areas but also offshore.
For other missions, results have been presented in Vieira et al. (2019a) and in Fernandes and Lázaro (2018) and are summarised here. For the two-band radiometers, land contamination on the MWR observations occurs for points at distances from the coast smaller than 25–30 km (ERS-1 and ERS-2), 20–25 km (Sentinel-3) and 15–20 km (GFO and SARAL), the latter in agreement with the smaller radiometer footprint of the SARAL MWR. Similar analysis shows that land contamination is observed up to 25–30 km from the coast for T/P and Jason-1 and up to 20–25 km for Jason-2 and Jason-3. These numbers are a function both of the instrument footprint size and of the efficiency of the criteria used to detect valid or invalid MWR observations, since in these plots only MWR values that passed all validation criteria, except for the distance from the coast, have been used. In summary, for each mission, these analyses show the distances from the coast up to which the MWR observations are contaminated by land and must be discarded. Moreover, they also show that GPD+ is efficient in removing this effect.
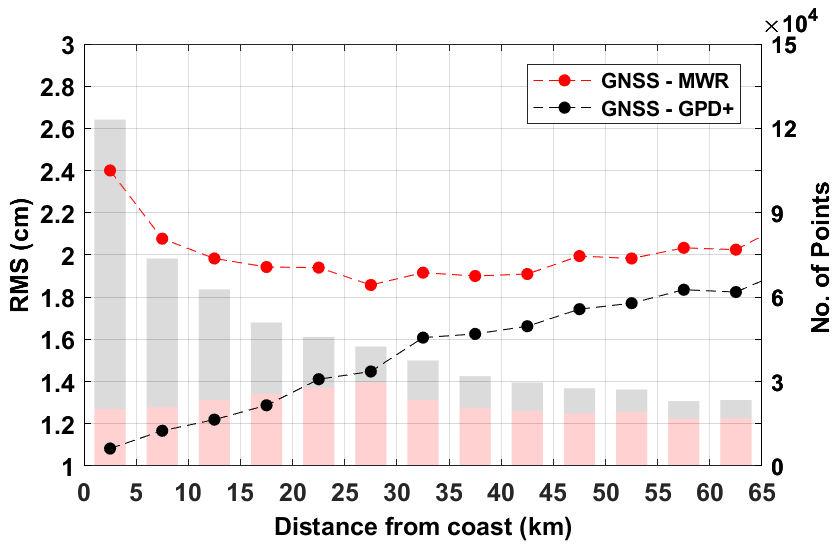
Figure 10RMS (in cm) of WTC differences (left axis) and number of altimetry measurements used (right axis) for the Envisat mission, as a function of distance from the coast. Red bars represent the number of measurements used to compute the RMS of the differences GNSS − MWR, while grey bars represent the number of points used to compute the RMS of the differences GNSS − GPD+. In the comparison GNSS − MWR only valid MWR-derived observations have been used.
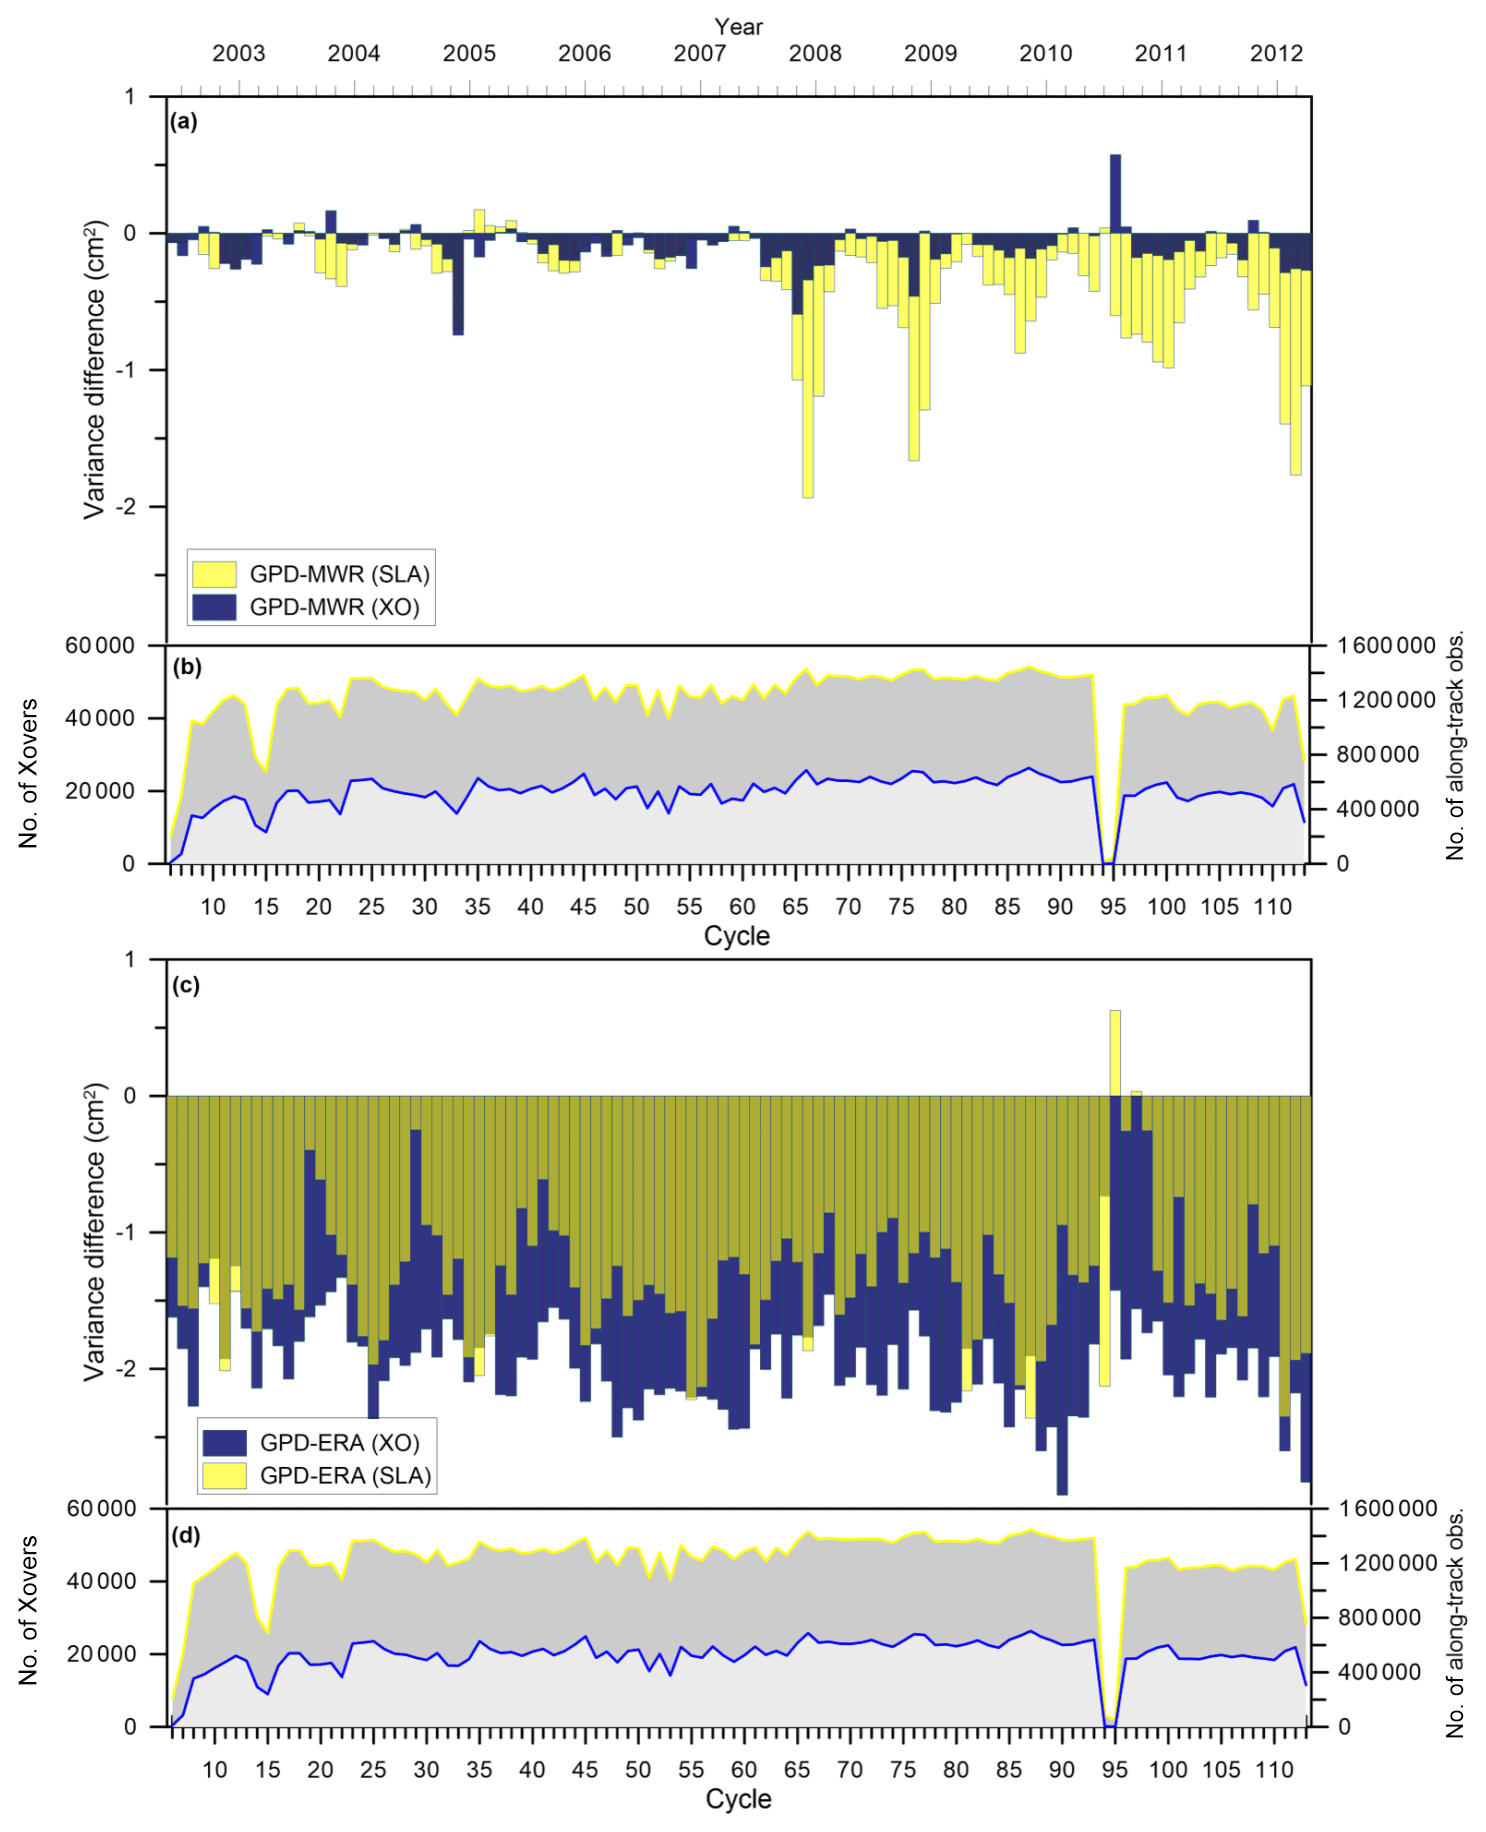
Figure 11Temporal evolution of weighted SLA variance differences (cm2) along satellite tracks (yellow) and at crossovers (blue) between (a) GPD+ and the MWR-derived WTCs and (c) GPD+ and ERA-Interim WTCs. Plots (b) and (d) show the number of crossovers (“No. of Xovers”, blue) and the number of along-track (yellow) pairs used, per cycle, in the GPD-MWR and GPD-ERA analyses, respectively. To facilitate the analysis, both cycle number (bottom x axis) and time (year, top x axis) are used.
3.2 Performance assessment of the Envisat GPD+ WTC
Water vapour content can be accurately obtained by radio-sounding data that could ideally be employed to validate the GPD+ estimates. Despite having a high vertical resolution, radiosonde measurements are distributed only over limited areas, i.e. regions where stations are located; do not cover oceanic regions; and are very scarce over the Southern Hemisphere (Ye et al., 2016). Therefore, their low temporal and spatial resolutions have reduced their use as a validation tool in the context of satellite altimetry.
For this reason, the GPD+ products have been assessed through various SLA variance statistical analyses, analysing simultaneously the impact of the correction on sea level variability. The reasoning for adopting this analysis is that the larger the variance reduction in the SLA signal when using a certain WTC, the better the correction is, i.e. the larger the reduction in the SLA error is and the closer to a pure oceanic signal the SLA dataset that uses that correction is. Therefore, three SLA datasets of collocated along-track points were derived using the same standard corrections (Sect. 1) except the WTCs, which can be the GPD+, the MWR-derived or the ERA-Interim WTCs. The criteria to select valid SLAs are those recommended in the literature and adopted in the standard RADS processing (Scharroo et al., 2012) and include the application of thresholds for all involved fields (satellite orbit above reference ellipsoid, altimeter range, all range and geophysical corrections), the altimeter ice and rain flags (whenever set), and SLAs within ±2 m.
In the comparisons with ERA-Interim, all points with valid SLAs have been selected, including points over ocean, coastal and polar regions. However, in the comparisons with the on-board MWR, only points for which the MWR-derived WTC is available and within the −50 to 0 cm range are used. Therefore, in the latter case, points with WTCs from the on-board MWR whose values are outside this range or are absent have been discarded from the analyses. For Envisat cycle 12 (Fig. 4), these points are represented in dark green and correspond mainly to entire tracks for which no MWR-derived WTCs are available. Consequently, the number of points used in the WTC comparisons between GPD+ and ERA and GPD+ and MWR is different, although quite similar, for both comparisons as can be seen in Fig. 11.
Differences between each pair of SLA datasets are computed along track and at crossovers, and the weighted variance is estimated for the time span of the whole Envisat period, with latitude-dependent weights (i.e. weights are a function of the cosine of latitude). Variance differences have been calculated in such a way that negative values represent an improvement in the description of the SLA field when the GPD+ WTC is used for the field's generation. For the computation of the crossovers, only measurements with a temporal difference of less than 10 d were used. Besides the temporal analysis, the variance differences, calculated both along track and at crossovers, are also mapped for the analysis of their spatial distribution. In this latter case, the variances of the SLA differences are gridded onto 4∘ spatial-resolution cells. Along-track SLA variance differences are also computed as a function of latitude and distance from the coast, where the variance for the whole Envisat period is computed over bins of latitude and distance from the coast. Section 3.2.1 shows the results obtained from the global analysis. Section 3.2.2 shows the results zoomed in on three different geographical domains: the North American and European coasts, selected due to the existence of the great quantity of GNSS stations, and the Indonesia region, a challenging region in terms of coastal satellite altimetry.
3.2.1 Global analysis
Figure 11 illustrates the results obtained for the period of the whole Envisat mission. From this figure, it is observed that the GPD+ WTC for Envisat represents, in general, a significant improvement when compared to the other WTCs selected for this assessment.
Usually the SLA variance reduction is analysed at crossover locations; however since oceanic variability with periods of less than 10 d is neglected when performing this analysis, whilst preserved in the along-track differences, both diagnostics are considered complementary. Figure 11 shows the results for both diagnoses: variance differences calculated along track are shown in yellow, while variance differences at crossovers are represented in blue.
Using the GPD+ WTC instead of the MWR-derived WTC (Fig. 11a) leads, in the along-track analysis, to an improvement in the variance of the oceanic signal of 0.3 cm2 on average, increasing in the second half of the period where values of 2 cm2 can be reached in some cycles, most probably due to the globally poorer performance of both the MWR and the altimeter towards the end of the mission. For the GPD–MWR comparison, the SLA reduction is more noticeable in the along-track analysis than in the crossover analysis. Smaller variance differences are expected in this later analysis, since the GPD+ WTC generally equals the MWR-derived WTC over open ocean, where most crossovers are located. Adopting the GPD+ WTC instead of the ERA-Interim one (Fig. 11c) leads to a reduction in SLA variance which, on average, is in the range of 1 and 2 cm2 for the analysis along the tracks, reaching a maximum value of 3 cm2 in the analysis at crossovers. Therefore, it is expected that the GPD+ WTC leads to a reduction in the SLA variance over open ocean too. Figure 11b and d show the number of crossovers (in blue) and along-track pairs (yellow) used, per cycle, in the comparison of the GPD+ WTCs with the MWR-derived WTCs and ERA WTCs, respectively. A large number of Envisat data were lost in the period corresponding to cycles 94 and 95, since a new orbit configuration (30 d repeat cycle) for the mission was implemented in October 2010, corresponding to a change from Envisat phase b to phase c.

Figure 12Spatial distribution of the weighted SLA variance differences (in cm2) at crossovers (XO) between (a) GPD+ and the MWR-derived WTCs and (b) GPD+ and the ERA-Interim WTCs for the whole Envisat period (cycles 6 to 113). The green colour represents SLA variance differences around zero. Pixels with no data are shown in white.
Figure 12 shows the reduction in SLA variance globally, after being spatially averaged and gridded onto 4∘ spatial-resolution cells, estimated at crossovers for the differences in GPD+ and MWR-derived WTCs and in GPD+ and ERA WTCs, in the top and bottom plots, respectively. In these plots, blueish colours represent an improvement in the SLA dataset by reducing the SLA variance. The improvement of the GPD+ WTC over the model WTC (Fig. 12b) is clear, with maximum values of variance reduction in the tropical oceans, particularly over the Pacific Ocean. The improvement over the Southern Ocean and around the coast of Antarctica shows that the model WTC is not able to capture the full variability in the WPD field yet. Figure 12a shows that the GPD+ and the MWR-derived WTCs are equal over the eastern oceanic basins (SLA variance close to zero, represented by the green colour) as expected, since GPD+ preserves the valid MWR-derived WTC over open ocean. However, despite the SLA improvement when using GPD+ WTCs being smaller than that when the ERA WTCs are used, it can be emphasised that the improvement is not limited to the coastal regions, being clear over e.g. the regions where the western boundary currents flow. Therefore, the use of third-party, mainly SI-MWR, data can help improve the description of the WPD field. Over the Southern Ocean, for latitudes 80–60∘ S, some degradation is visible when GPD+ is used. This is probably be due to the existence of ice contamination in the radiometer-derived (both along-track and image) WTCs. However, it is recalled that, over this region, the MWR-derived WTC is usually missing (default value or NaN) or out of range and that these points, for which a GPD+ estimate would be computed otherwise, have been removed from the analysis. Therefore, it must be emphasised that these results for the comparison GPD+ and MWR-derived WTCs provide underestimated results for GPD+.
SLA variance differences have also been analysed as a function of latitude and distance from the coast, and the results are shown in Fig. 13. Both the differences between GPD+ and ERA WTCs and GPD+ and MWR-derived WTCs are represented. The variance of the SLA dataset is reduced when GPD+ is used instead of the ERA WTC for all latitudes (Fig. 13a). The improvement of the GPD+ WTC with respect to the model one, with an average value of 1.3 cm2, is maximal over latitudes where maximum atmospheric water content can be found, namely over the subtropical ocean and over latitudes where the western boundary currents flow, particularly in the Northern Hemisphere where the variance reduction exceeds 2 cm2. As expected, the improvement is smaller for the comparison with the MWR-derived WTC, since this analysis includes open-ocean points where both corrections are equal. Leading to an improvement in the SLA variance of 0.32 cm2 on average, the GPD+ WTC has its best performance against the WTC from the radiometer in the extratropical oceans, especially in the northern one. The increase in the reduction in the SLA variance at these latitudes is associated with a better description of the WPD field in the coastal regions northwards of the regions where the western boundary currents flow (off Newfoundland and in the Sea of Okhotsk), as can be concluded from the maps showing the reduction in SLA variance for the difference between GPD+ and MWR-derived WTCs, computed along track and spatially averaged at each 4∘ cell (not shown). The SLA dataset is also improved over the coastal regions when the GPD+ WTC is applied (Fig. 13b). The improvement over the ERA WTC is, on average, 0.77 cm2 in the 30 km closest to land, increasing to ∼ 1.4 cm2 for larger distances. This means that a better description of both the WTC and the SLA fields is obtained over open ocean when the GPD+ WTC is adopted (cf. Fig. 12). The improvement over the WTC from the on-board MWR is larger in the nearest 20 km to the coast, where the reduction in variance can reach 3.3 cm2 (average value is 2.0 cm2). As the distance to shore increases, the reduction in variance decreases, although it is still negative and around −0.60 cm2 on average. This result is expected, since the number of invalid MWR-derived WTCs decreases offshore, and therefore the GPD+ WTCs equal those retrieved from the MWR measurements.
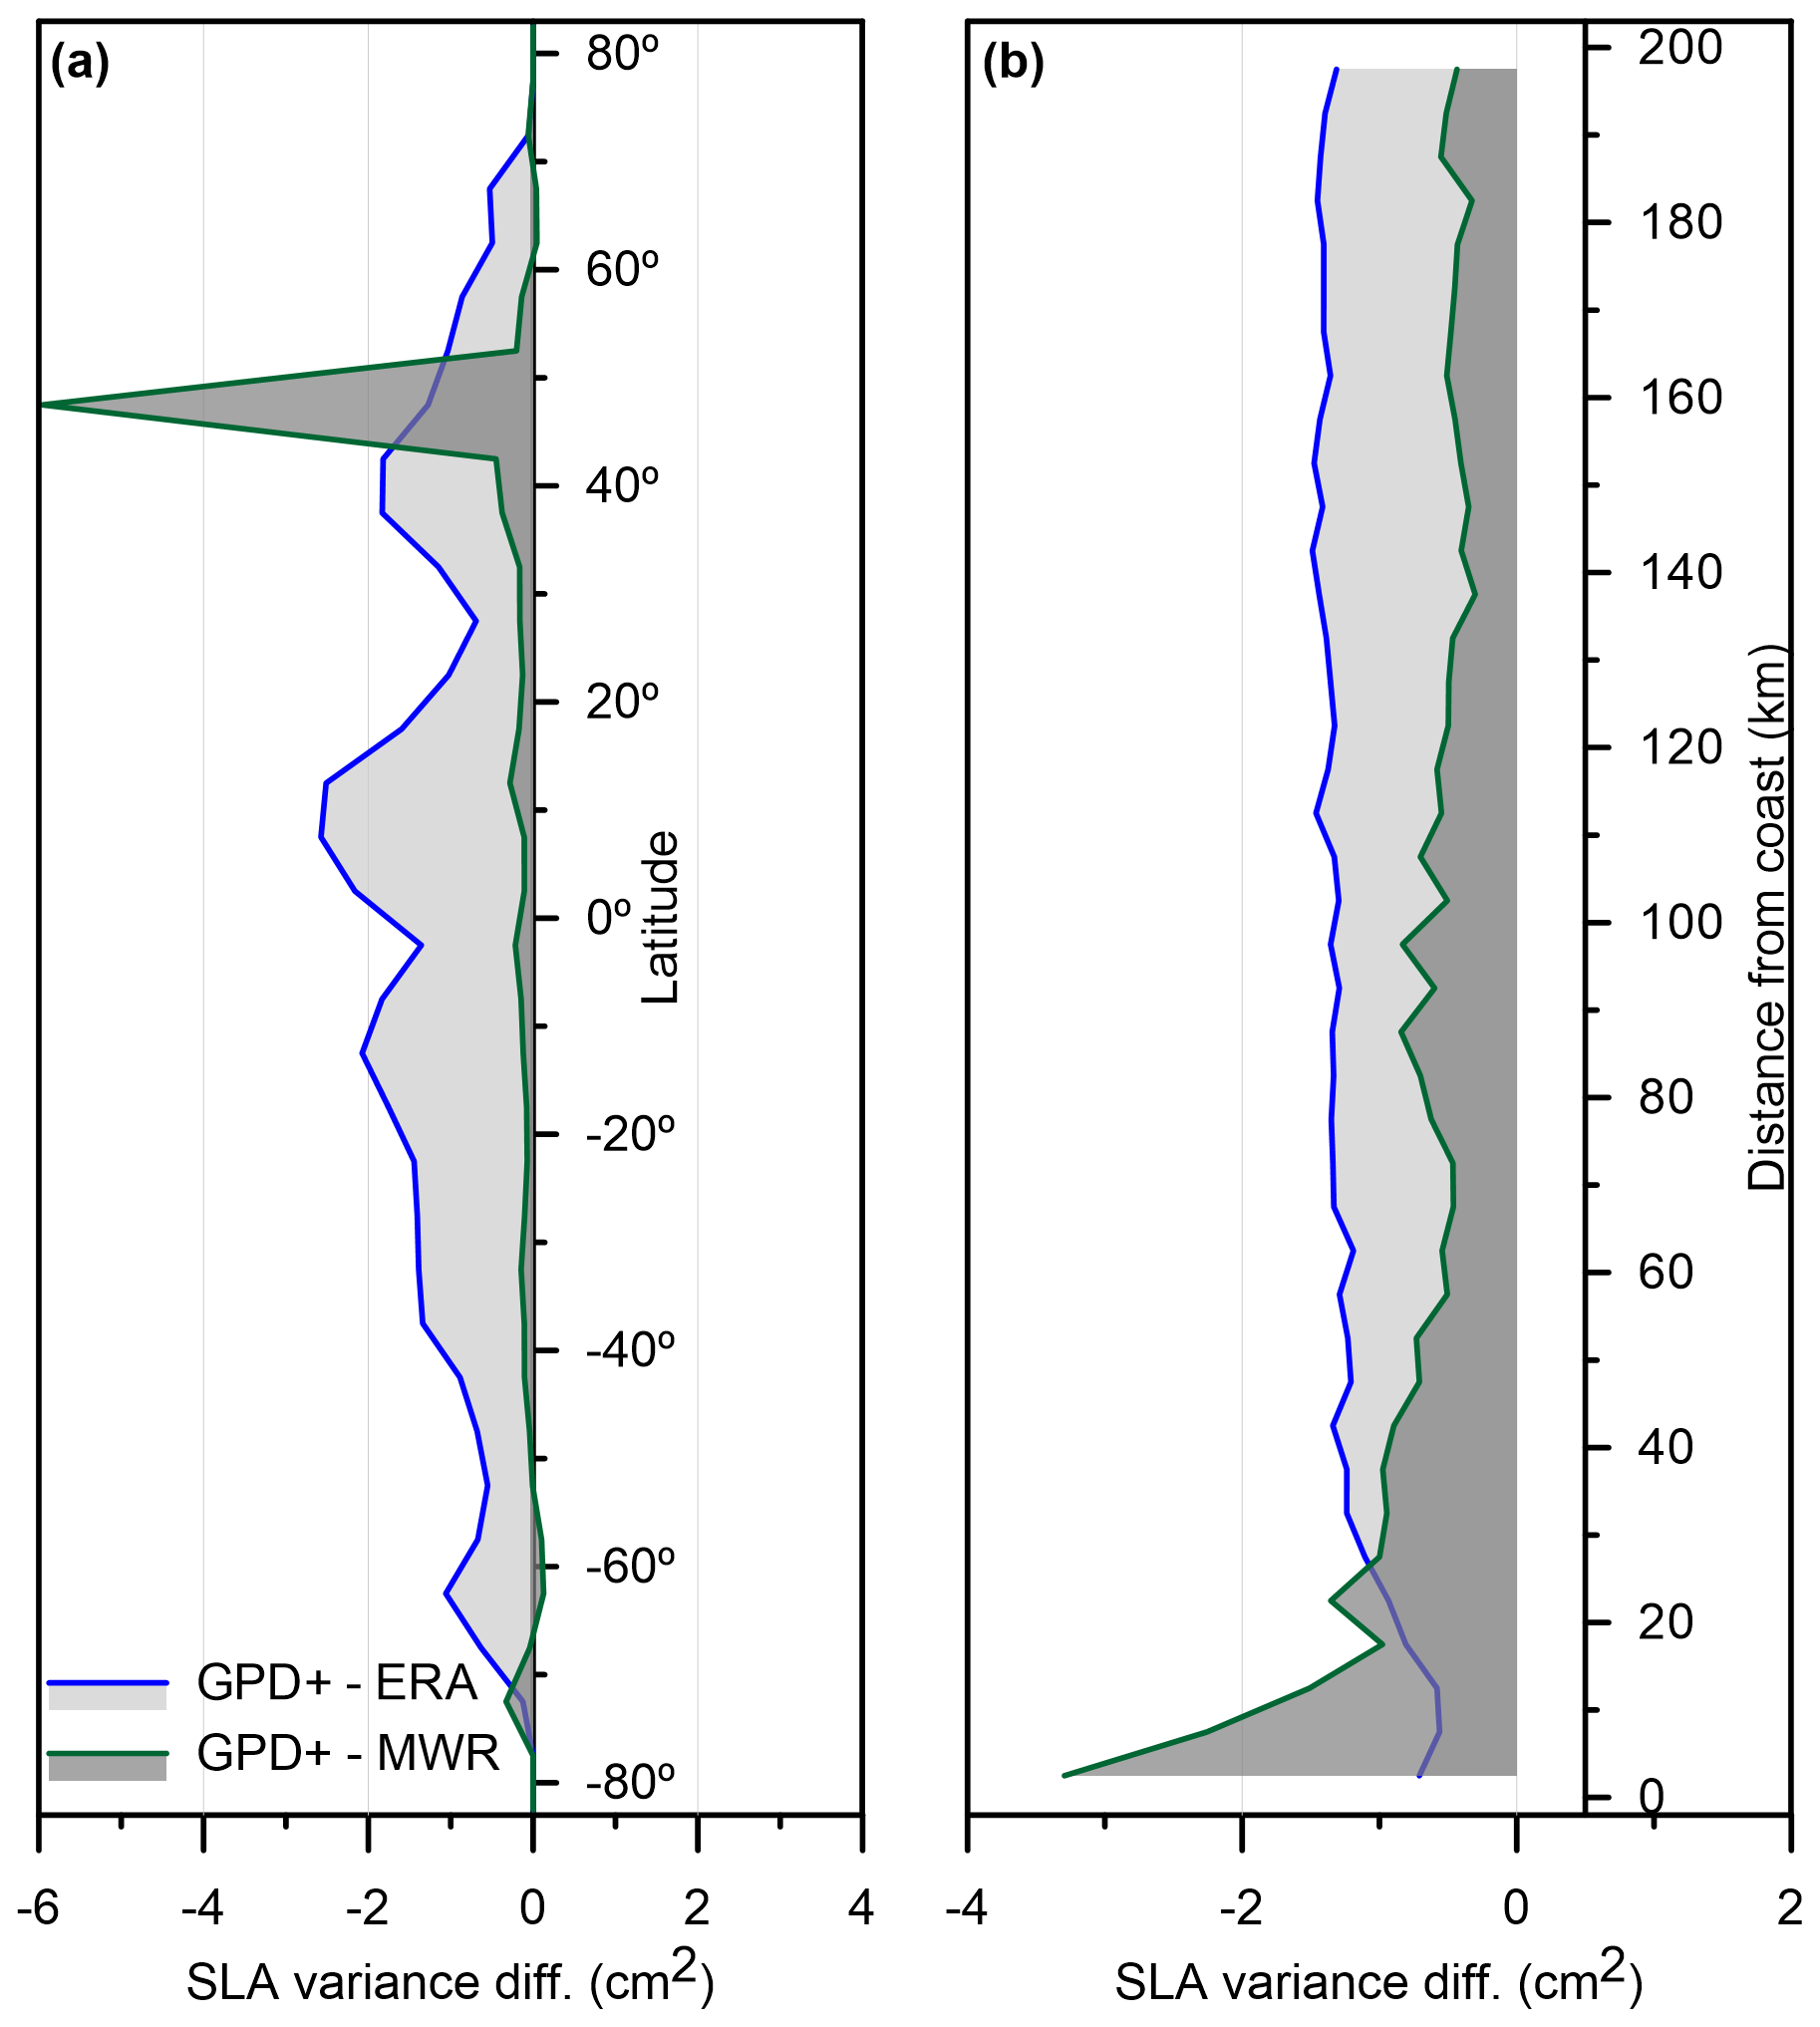
Figure 13Variance differences (cm2) of SLA versus latitude (a) and distance from the coast (b) between GPD+ and ERA-Interim WTCs (blue) and GPD+ and the MWR-derived WTCs (green) for Envisat cycles 6 to 113.
The improvement obtained when the GPD+ methodology is applied to coastal areas is unfortunately not completely evident in the presented results, since the MWR-derived WTCs for those points for which this correction is missing or outside limits are not in the analyses. For these points, if available, the MWR-derived WTCs are expected to be significantly worse than the GPD+ ones.
3.2.2 Coastal analysis
This section shows zoomed-in results for three different regions: the North American and European coasts and the Indonesia region. The first two regions have been selected due to the great quantity of GNSS stations available along the coast (shown by the red dots in Fig. 2), while the third has been selected since it is recognised as being quite challenging for satellite altimetry. The results have been obtained for the whole period of the Envisat mission, and all along-track points within the geographic limits have been considered. As already described in the previous section, points with MWR-derived WTCs out of the range of −50 to 0 cm and those for which the WTC is not defined in the altimeter products are rejected from the comparisons with the on-board MWR, while in the comparisons with ERA all points with valid SLAs are selected.
Results are illustrated in Fig. 14. Left panels show the SLA variance difference (in cm2) function of the distance from the coast calculated along the satellite tracks, where negative variance differences represent an improvement in the description of the SLA field when the GPD+ WTC is used. Right panels show the spatial distribution of the weighted SLA variance differences (in cm2) computed along the satellite tracks, after being spatially averaged and gridded onto 4∘ spatial-resolution cells. In these latter plots, blueish colours represent an improvement in the SLA dataset (reduction in the SLA variance) when the GPD+ WTC is used.
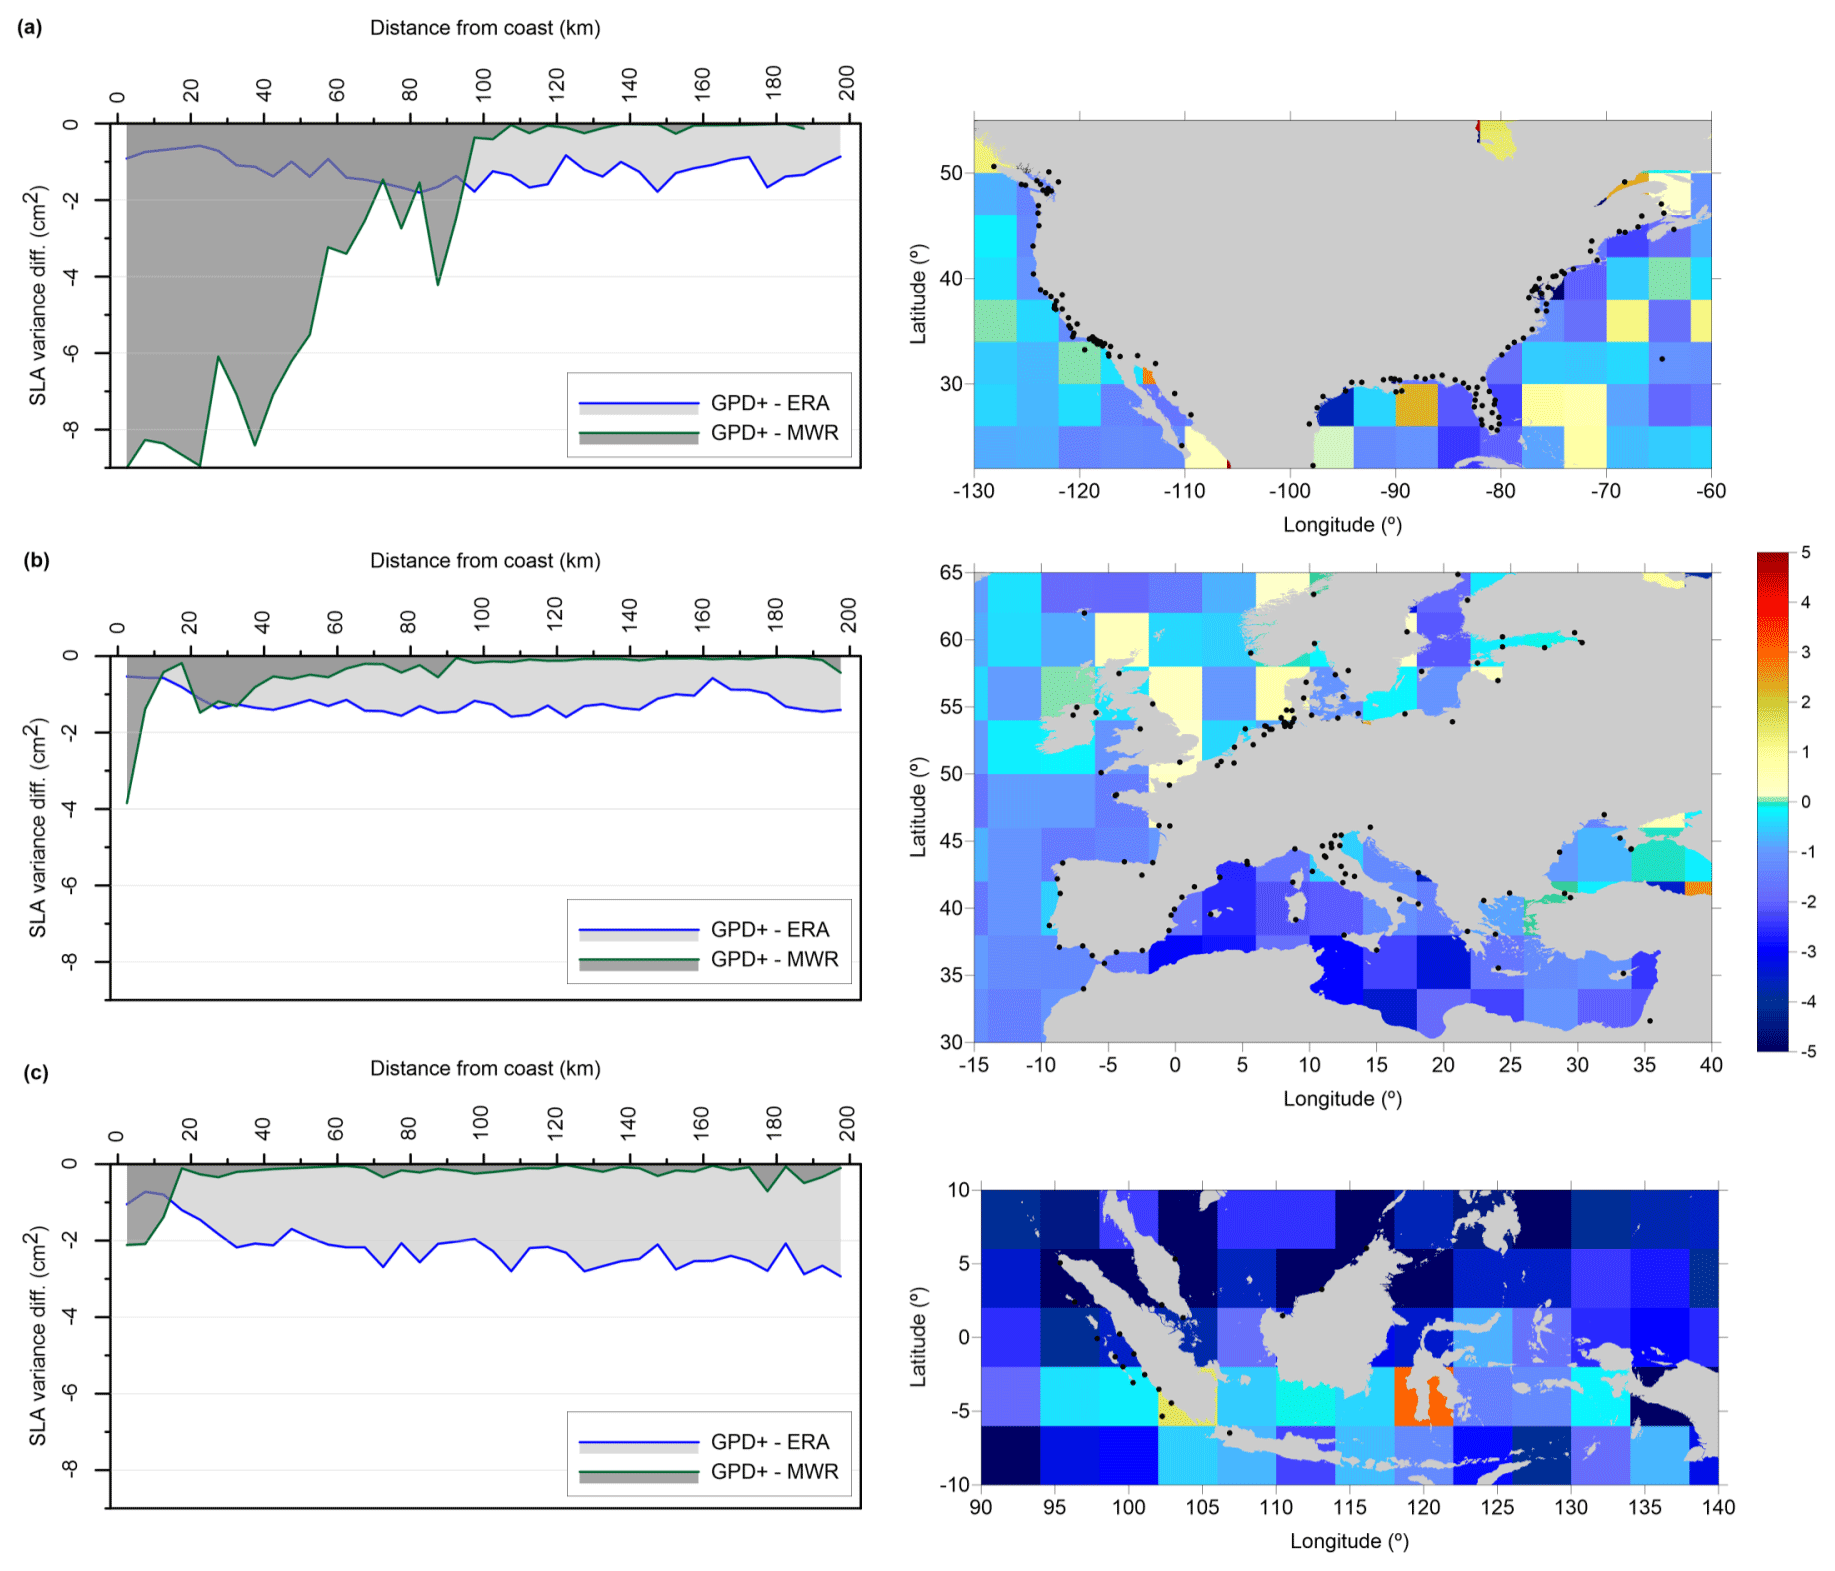
Figure 14Variance differences (cm2) of SLA as a function of distance from the coast (left) between GPD+ and ERA-Interim WTCs (blue) and GPD+ and MWR-derived WTCs (green) for the whole Envisat period (cycles 6 to 113) for the North American coast (a), European coast (b) and Indonesia region (c). In the plot for the North American coast, the y axis has been clipped to −9 cm2 (minimum value is around −13 cm2). Right panels show the spatial distribution of the weighted SLA variance differences (in cm2), computed along the satellite tracks, between GPD+ and ERA-Interim WTCs. The green colour represents SLA variance differences around zero. The GNSS stations used in the computation of the GPD+ WTC are represented as black dots.
All the regions show that the SLA variance is reduced along the coasts when the GPD+ WTC is used rather than the MWR-derived (in green) or the ERA-derived (in blue) WTCs. For the North American coast (Fig. 14a, left panel), the improvement is clear up to 100 km off the coast. For distances up to 40 km off the coast, the reduction in SLA variance is, on average, 8.7 cm2, being ∼ 3.4 cm2 when averaged for distances between 40 and 100 km off the coast. For larger distances, the differences tend to zero, since GPD+ preserves the valid MWR-derived WTC, and therefore both corrections are equal. The comparison with the ERA-derived WTC shows an averaged SLA variance difference of −1.2 cm2 (GPD+ reducing the variance) for the whole range of distances. The right panel of Fig. 14a shows that the reduction in SLA variance, when the GPD+ correction is used instead of the ERA-derived one, is larger along the eastern coast, where the WTC variability is larger (cf. Fig. 2), and that the improvement is not limited to the coastal zone but is also clear over open ocean. This result can be extended to the three selected regions.
For the European region (Fig. 14b, left panel), an improvement of 1.5 cm2 is, on average, obtained for the comparison GPD+ and MWR-derived WTCs for the 20 km closest to the coast. For larger distances, and up to 100 km off the coast, the averaged reduction in SLA variance is 0.67 cm2. The comparison with the ERA-derived WTC shows an SLA variance difference of −1.2 cm2 (GPD+ reducing the variance), on average, for the whole range of distances. SLA variance reduction is notorious over the Mediterranean region (Fig. 14b, right panel).
For the Indonesia region, the improvement of the GPD+ WTC with respect to the MWR-derived one is mainly achieved in the 20 km closest to the coast, where the SLA variance reduction is, on average, 1.4 cm2. The use of the GPD+ WTC instead of the ERA-derived WTC leads to an improvement that, on average, is on the order of 2.2 cm2 for the whole range of distances from the coast. This reduction is observable over almost the whole region, being larger in its northern part.
The results obtained for the comparison with the ERA WTC are a clear indication that current NWMs do not correctly represent the WTC field variability yet. This result can also be extracted from Figs. 7 and 8, where it is seen that the NWM-derived WTC does not exhibit the small spatial scales as well as the MWR-derived and, consequently, GPD+ WTCs.
Once again, it is worth noticing that, in these results, the improvement obtained when the GPD+ methodology is applied to coastal areas is underestimated, since the MWR-derived WTCs for those points for which this correction is missing or outside limits have not been used in the performed analyses. For these points, the MWR-derived WTC, if available, would probably be contaminated by land and would degrade the MWR-derived dataset.
The GPD+ WTCs are freely available in NetCDF format at the UPorto's Satellite Altimetry repository https://doi.org/10.23831/FCUP_UPORTO_GPDPlus_v1.0 (Fernandes et al., 2019) and at the AVISO (Archiving, Validation and Interpretation of Satellite Oceanographic data) web page (https://www.aviso.altimetry.fr/en/index.php?id=3415, last access: December 2020, AVISO, 2020).
The wet tropospheric correction (WTC) is still considered an important source of error in satellite altimetry, particularly in coastal and polar regions, where the retrieval of the wet path delays from the microwave radiometer (MWR) measurements on board the altimetry missions leads to invalid values. During the data processing aimed at deriving the sea level anomaly, altimeter measurements are discarded if the WTC is absent, which is frequent in coastal and polar regions. In the last few years, a huge effort has been made to develop methodologies capable of computing WTC estimates where the correction is absent, while keeping the high accuracy of MWR-derived WTC values. A few methodologies have emerged, among which GPD and its most up-to-date version GPD+ have proven to be the most effective in reducing the SLA variability due to non-ocean phenomena, simultaneously leading to the recovery of a significant number of measurements.
This paper describes the GPD+ WTC database and exemplifies the results using as input the Envisat FMR V3.0. The GPD+ WTC equals the MWR-derived WTC whenever the latter is valid, thus preserving its accuracy. For those MWR-derived WTCs detected by the algorithm as anomalous, a new estimate and its associated mapping error are computed. The GPD+ algorithm has been trained to detect land, ice and outlier-contaminated measurements, besides those identified in the GDR data already. On top of preserving the accuracy of the WTC derived from the on-board MWR measurements, the GPD+ algorithm guarantees the continuity and consistency in the output WTC globally and, in particular, in the coastal zone.
Prior studies using a previous GPD+ version (e.g. GPD algorithm; see Fernandes et al., 2015) show that the GPD WTC led to a significant improvement of the SLA dataset for T/P and ESA-funded missions, since these, particularly the latter, had on-board MWRs whose retrieval algorithms output very noisy values in coastal and ice-contaminated regions. For these missions, the GPD WTC was proven to be the preferred WTC to be used in the definition of the SLA field, when compared to the baseline MWR one, the model-derived one and the AVISO reference composite correction provided in their products (Legeais et al., 2018). The main advantage of the methodology when applied to the T/P mission is the correction of several TOPEX/Poseidon Microwave Radiometer (TMR) anomalies present in the second part of the mission, particularly noticeable in the Indian Ocean, which would otherwise seriously affect the calculation of the mean sea level at regional scales (Fernandes et al., 2015).
The GPD+ WTCs for the GFO and CryoSat-2 missions have been described in Fernandes and Lázaro (2016). Despite the MWR on board the GFO mission being considered a stable and accurate instrument, it had periods of malfunctioning, particularly in the last years of the mission. In addition to improving the derived SLA dataset, by reducing the error associated with non-pure oceanic signals, GPD+ recovers the WTC for the periods during which the GFO MWR was defective. For the CryoSat-2 mission, without an on-board MWR and therefore without a WTC relying on observations, the GPD+ WTC is computed for all along-track points. The GPD+ WTC thus replaces the NWM-derived WTC that otherwise would have to be used. For this mission, the exploitation of third-party data has been proven to be very effective. As the results in this paper show, the NWM-derived WTCs are still inaccurate since they are limited to a poor spatial and temporal resolution.
Products available for Jason missions already possess a coastally improved WTC (Brown, 2010). Still, although small, some improvement, particularly at high latitudes and mainly for Jason-1, can be achieved when the GPD+ correction is used in the generation of the SLA dataset (Fernandes et al., 2015). The current version of the correction (GPD+) for the reference missions leads to more accurate retrievals than before, due to several improvements (e.g. the inclusion of WPD third-party observations from imaging radiometers and a better screening for anomalous MWR-derived WTCs). Due to the fact that, contrary to Jason missions, T/P products do not possess a coastal enhanced WTC, the improvements reached by GPD+ are more significant for T/P than for Jason. For all other RA missions with two-band MWRs (ERS-1, ERS-2, Sentinel-3, SARAL and GFO), GPD+ proves to be a significant improvement over the NWMs, MWRs and AVISO composite WTC, reducing the SLA variance (both along track and at crossovers, as a function of distance from the coast and of latitude) by 1–2 cm2 (Fernandes and Lázaro, 2016, 2018).
Many authors have also proven the positive impact of the GPD+ corrections, particularly in coastal studies, e.g. Handoko et al. (2017) in the Indonesia region and Dinardo et al. (2018, 2020) in the German Bight.
Taken as a whole, the GPD+ algorithm possesses the advantage of being able to compute the WTC at a considerable number of along-track points with an invalid or inexistent MWR-derived WTC, therefore leading to the recovery of the SLA signal at these points. The percentage of recovered points when GPD+ is applied in place of the baseline MWR-derived WTC depends on the instrument type, band of latitudes covered by the mission (which determines the extent of ice contamination) and instrument performance. For all ESA missions (ERS-1, ERS-2, Envisat, Sentinel-3) and SARAL, possessing two-band radiometers and measuring up to latitudes ±81.2∘, the percentage of recovered data is similar to that of Envisat, in the range of 7 %–15 % of the SLA valid points of each cycle. For the reference missions, measuring only up to ±66.7∘ and already possessing an improved WTC near the coast (in all cases except T/P), this percentage is smaller, from 2 % to 4 %. For T/P, these values are from 4 % to 7 % and larger in the second half of the mission. For GFO, measuring up to ±72.0∘, the percentage is similar to that of T/P. Exceptions occur for various missions over periods of instrument malfunction, when the percentage of recovered points can be considerably larger, up to 100 %, as happens for Envisat and GFO.
Moreover, the GPD+ WTC is a continuous correction in the ocean–land interface region, as well as in the polar regions. The scientific novelty and practical significance for the common satellite altimetry user is that the GPD-corrected SLA dataset can be used for coastal applications, constituting a major step forward for satellite altimetry to become a tool for coastal management.
Despite significant efforts made in the past to improve the WPD calculation at GNSS station height and the sea level reduction in the correction to use in satellite altimetry over ocean, the unpredictable way the WPD varies with altitude is still a factor constraining the precise GNSS data reduction procedure, since all other data are provided at sea level. Therefore, the modelling of the 4D variability in the WPD field is under investigation at UPorto (Vieira et al., 2019b). It is expected that a better knowledge of the WTC variability will improve the GPD+ WTCs aimed at a larger reduction in the sea level variance due to non-oceanic signals, since all the GNSS data processing upstream of the GPD+ computation is also performed at UPorto.
Upcoming developments include (i) the inclusion of ameliorative modelling of the WTC vertical variability (Vieira et al., 2019b), leading to better consistency in the various datasets combined in the OA procedure; (ii) the extension of the corrections to all surface types with new estimates over all regions where observations exist, e.g. large lakes and rivers where valid MWR and GNSS data can be exploited; and (iii) for the older missions, the replacement of the ERA-Interim model by ERA5, the most recent reanalysis by ECMWF (Vieira et al., 2019c).
MJF and CL developed the methodology and the code. All authors performed the analyses. CL prepared the manuscript with contributions from all co-authors. All authors have read and approved the final paper.
The authors declare that they have no conflict of interest.
The authors thank the Radar Altimeter Database System (RADS) for providing the GPD+ input altimeter data for all missions except Envisat and SARAL up to cycle 30, Aviso+ (https://www.aviso.altimetry.fr/, last access: January 2019) for the production and distribution of SARAL PEACHI products up to cycle 30, the European Centre for Medium-Range Weather Forecasts (ECMWF) for making both the ECMWF operational and the ERA Interim models available, and all institutions providing the water vapour products used in this study: National Oceanic and Atmospheric Administration (NOAA) – Comprehensive Large Array-Data Stewardship System (CLASS) and Remote Sensing Systems. SSM/I and SSMIS data are produced by Remote Sensing Systems and sponsored by the NASA Earth Science MEaSUREs Program and are available at http://www.remss.com/ (last access: January 2019).
This research was supported by the European Space Agency through the project CLS-SCO-17-0034, ENVISAT 70 RA-2 Level-1B ESL and Prototype Maintenance Support, subcontract to ESA contract no. 4000110859/14/IAM and by Centro Interdisciplinar de Investigação Marinha e Ambiental (CIIMAR) through the project with reference UID/Multi/04423/2019. Telmo Vieira is supported by the Fundação para a Ciência e a Tecnologia (FCT) through the PhD Grant SFRH/BD/135671/2018, funded by the European Social Fund and by the Ministério da Ciência, Tecnologia e Ensino Superior (MCTES).
This paper was edited by Christian Voigt and reviewed by three anonymous referees.
Archiving, Validation and Interpretation of Satellite Oceanographic data (AVISO): GPD+ Wet Tropospheric Correction, available at: https://www.aviso.altimetry.fr/en/index.php?id=3415, last access: December 2020.
Askne, J. and Nordius, H.: Estimation of Tropospheric Delay for Microwaves From Surface Weather Data, Radio Sci., 22, 379–386, https://doi.org/10.1029/RS022i003p00379, 1987.
Bevis, M., Businger, S., Chiswell, S., Herring, T. A., Anthes, R. A., Rocken, C., and Ware, R. H.: GPS Meteorology – Mapping Zenith Wet delays onto precipitable water, J. Appl. Meteorol., 33, 379–386, https://doi.org/10.1175/1520-0450(1994)033<0379:GMMZWD>2.0.CO;2, 1994.
Bosser, P., Bock, O., Pelon, J., and Thom, C.: An improved mean-gravity model for GPS hydrostatic delay calibration, IEEE Geosci. Rem. Sens. Letters, 4, 3–7, https://doi.org/10.1109/LGRS.2006.881725, 2007.
Bretherton, F. P., Davis, R. E., and Fandry, C. B.: A technique for objective analysis and design of oceanographic experiment applied to MODE-73, Deep-Sea Res., 23, 559–582, https://doi.org/10.1016/0011-7471(76)90001-2, 1976.
Brown, S.: A novel near-land radiometer wet path-delay retrieval algorithm: Application to the Jason-2/OSTM advanced microwave radiometer, IEEE Trans. Geosci. Remote Sens., 48, 1986–1992, https://doi.org/10.1109/TGRS.2009.2037220, 2010.
Chelton, D. B., Ries, J. C., Haines, B. J., Fu, L. L., and Callahan, P. S.: Satellite Altimetry, in: Satellite Altimetry and Earth Sciences: A Handbook of Techniques and Applications, edited by: Fu, L. L. and Cazenave, A., Academic, San Diego, CA, USA, Volume 69, 1–131, 2001.
Cipollini, P., Benveniste, J., Birol, F., Fernandes, M. J., Obligis, E., Passaro, M., Strub, P. T., Valladeau, G., Vignudelli, S., and Wilkin J.: Satellite altimetry in coastal regions, in: Satellite Altimetry Over Oceans and Land Surfaces, edited by: Stammer, D. and Cazenave, A., CRC Press, 343–380, ISBN:9781498743457, 2017.
Dinardo, S., Fenoglio-Marc, L., Buchhaupt, C., Becker, M., Scharroo, R., Fernandes, M. J., and Benveniste, J.: Coastal SAR and PLRM altimetry in German Bight and West Baltic Sea, Adv. Space Res., 62, 1371–1404, https://doi.org/10.1016/j.asr.2017.12.018, 2018.
Dinardo, S., Fenoglio-Marc, L., Becker, M., Scharroo, R., Fernandes, M. J., Staneva, J., Grayek, S., and Benveniste, J.: A RIP-based SAR Retracker and its application in North East Atlantic with Sentinel-3, Adv. Space Res., in press, https://doi.org/10.1016/j.asr.2020.06.004, 2020.
Dousa, J. and Elias, M.: An improved model for calculating tropospheric wet delay, Geophys. Res. Lett., 41, 4389–4397, https://doi.org/10.1002/2014GL060271, 2014.
Escudier, P., Ablain, M., Amarouche, L., Carrère, L., Couhert, A., Dibarboure, G., Dorandeu, J., Dubois, P., Mallet, A., Mercier, F., Picard, B., Richard, J., Steunou, N., Thibaut, P., Rio, M.-H., and Tran, N.: Satellite radar altimetry: principle, accuracy & precision, in: Satellite Altimetry Over Oceans and Land Surfaces, edited by: Stammer, D. and Cazenave, A., CRC Press Taylor & Francis, London, UK, 670 pp., https://doi.org/10.1201/9781315151779, 2017.
European Space Agency (ESA): Envisat Altimetry Full Mission Reprocessing V3.0, available at: https://earth.esa.int/web/guest/content/-/article/envisat-altimetry-v3-0-full-mission-reprocessing, last access: July 2019.
Fernandes, M. J. and Lázaro, C.: GPD+ Wet Tropospheric Corrections for CryoSat-2 and GFO Altimetry Missions, Remote Sens., 8, 851, https://doi.org/10.3390/rs8100851, 2016.
Fernandes, M. J. and Lázaro, C.: Independent assessment of Sentinel-3A wet tropospheric correction over the open and coastal ocean, Remote Sens., 10, 484. https://doi.org/10.3390/rs10030484, 2018.
Fernandes, M. J., Barbosa, S., and Lázaro, C.: Impact of Altimeter Data Processing on Sea Level Studies, Sensors, 6, 131–163, https://doi.org/10.3390/s6030131, 2006.
Fernandes, M. J., Pires, N., Lázaro, C., and Nunes, A. L.: Tropospheric delays from GNSS for application in coastal altimetry, Adv. Space Res., 51, 1352–1368, https://doi.org/10.1016/j.asr.2012.04.025, 2013a.
Fernandes, M. J., Nunes, A. N., and Lázaro, C.: Analysis and Inter-Calibration of Wet Path Delay Datasets to Compute the Wet Tropospheric Correction for CryoSat-2 over Ocean, Remote Sens., 5, 4977–5005, https://doi.org/10.3390/rs5104977, 2013b.
Fernandes, M. J., Lázaro, C., Nunes, A. N., and Scharroo, R.: Atmospheric Corrections for Altimetry Studies over Inland Water, Remote Sens., 6, 4952–4997, https://doi.org/10.3390/rs6064952, 2014.
Fernandes, M. J., Lázaro, C., Ablain, M., and Pires, N.: Improved wet path delays for all ESA and reference altimetric missions, Remote Sens. Environ., 169, 50–74, https://doi.org/10.1016/j.rse.2015.07.023, 2015.
Fernandes, M. J., Lázaro, C., Vieira, E., and Vieira, T.: UPorto GPD+ Wet Tropospheric Correction, Dataset, https://doi.org/10.23831/FCUP_UPORTO_GPDPlus_v1.0, 2019.
Handoko, E., Fernandes, M. J., and Lázaro, C.: Assessment of Altimetric Range and Geophysical Corrections and Mean Sea Surface Models–Impacts on Sea Level Variability around the Indonesian Seas, Remote Sens., 9, 102, https://doi.org/10.3390/rs9020102, 2017.
Kouba, J.: Implementation and testing of the gridded vienna mapping function 1 (VMF1), J. Geod., 82, 193–205, https://doi.org/10.1007/s00190-007-0170-0, 2008.
Legeais, J.-F., Ablain, M., Zawadzki, L., Zuo, H., Johannessen, J. A., Scharffenberg, M. G., Fenoglio-Marc, L., Fernandes, M. J., Andersen, O. B., Rudenko, S., Cipollini, P., Quartly, G. D., Passaro, M., Cazenave, A., and Benveniste, J.: An improved and homogeneous altimeter sea level record from the ESA Climate Change Initiative, Earth Syst. Sci. Data, 10, 281–301, https://doi.org/10.5194/essd-10-281-2018, 2018.
Pany, T., Pesec, P., and Stangl, G.: Atmospheric GPS slant path delays and ray tracing through numerical weather models, a comparison, Phys. Chem. Earth Pt. A, 26, 183–188, https://doi.org/10.1016/S1464-1895(01)00044-8, 2001.
Quartly, G. D., Legeais, J.-F., Ablain, M., Zawadzki, L., Fernandes, M. J., Rudenko, S., Carrère, L., García, P. N., Cipollini, P., Andersen, O. B., Poisson, J.-C., Mbajon Njiche, S., Cazenave, A., and Benveniste, J.: A new phase in the production of quality-controlled sea level data, Earth Syst. Sci. Data, 9, 557–572, https://doi.org/10.5194/essd-9-557-2017, 2017.
Rudenko, S., Neumayer, K., Dettmering, D., Esselborn, S., Schöne, T., and Raimondo, J.: Improvements in Precise Orbits of Altimetry Satellites and Their Impact on Mean Sea Level Monitoring, IEEE T. Geosci. Remote, 55, 3382–3395, https://doi.org/10.1109/TGRS.2017.2670061, 2017.
Scharroo, R., Leuliette, E. W., Lillibridge, J. L., Byrne, D., Naeije, M. C., and Mitchum, G. T.: RADS: Consistent multi-mission products, Proceedings of the 20 Years of Progress in Radar Altimetry Symposium, Venice, Italy, 20–28 September 2012.
Steunou, N., Picot, N., Sengenes, P., Noubel, J., and Frery, M. L.: AltiKa Radiometer: Instrument Description and In–Flight Performance, Mar. Geod., 38, 43–61, https://doi.org/10.1080/01490419.2015.1006381, 2015.
Stum, J., Sicard, P., Carrere, L., and Lambin, J.: Using Objective Analysis of Scanning Radiometer Measurements to Compute the Water Vapor Path Delay for Altimetry, IEEE T. Geosci. Remote, 49, 3211–3224, https://doi.org/10.1109/TGRS.2011.2104967, 2011.
Valladeau, G., Thibaut, P., Picard, B., Poisson, J. C., Tran, N., Picot, N., and Guillot, A.: Using SARAL/AltiKa to Improve Ka-band Altimeter Measurements for CoastalZones, Hydrology and Ice: The PEACHI Prototype, Mar. Geodesy, 38, 124–142, https://doi.org/10.1080/01490419.2015.1020176, 2015.
Vieira, E., Lázaro, C., and Fernandes, M. J.: Spatio-temporal variability of the wet component of the troposphere – Application to Satellite Altimetry, Adv. Space Res., 63, 1737–1753, https://doi.org/10.1016/j.asr.2018.11.015, 2019.
Vieira, T., Fernandes, M. J., and Lázaro, C.: Independent Assessment of On-Board Microwave Radiometer Measurements in Coastal Zones Using Tropospheric Delays from GNSS, IEEE Trans. Geosci. Remote Sens., 57, 1804–1816, https://doi.org/10.1109/TGRS.2018.2869258, 2019a.
Vieira, T., Fernandes, M. J., and Lázaro, C.: Modelling the Altitude Dependence of the Wet Path Delay for Coastal Altimetry Using 3-D Fields from ERA5, Remote Sens., 11, 2973, https://doi.org/10.3390/rs11242973, 2019b.
Vieira, T., Fernandes, M. J., and Lázaro, C.: Impact of the new ERA5 Reanalysis in the Computation of Radar Altimeter Wet Path Delays, IEEE T. Geosci. Remote, 57, 9849–9857, https://doi.org/10.1109/TGRS.2019.2929737, 2019c.
Vignudelli, S., Cipollini, P., Gommenginger, C., Snaith, H. M., Coelho, E., Fernandes, J., Gomez-Henri, J., Martin-Puig, C., Woodworth, P. L., Dinardo, S., and Benveniste, J. J.: The COASTALT Project: Towards an Operational Use of Satellite Altimetry in the Coastal Zone, American Geophysical Union, Fall Meeting 2009, OS22A-02, 2009.
Ye, S., Xia, P., and Cai, C.: Optimization of GPS water vapor tomography technique with radiosonde and COSMIC historical data, Ann. Geophys., 34, 789–799, https://doi.org/10.5194/angeo-34-789-2016, 2016