the Creative Commons Attribution 4.0 License.
the Creative Commons Attribution 4.0 License.
 | 03 Dec 2020
A multi-sensor satellite-based archive of the largest SO2 volcanic eruptions since 2006
Pierre-Yves Tournigand
Valeria Cigala
Elzbieta Lasota
Mohammed Hammouti
Lieven Clarisse
Hugues Brenot
Fred Prata
Gottfried Kirchengast
Andrea K. Steiner
Riccardo Biondi
We present a multi-sensor archive collecting spatial and temporal information about volcanic SO2 clouds generated by the 11 largest eruptions of this century. The detection and monitoring of volcanic clouds are an important topic for aviation management, climate issues and weather forecasts. Several studies focusing on single eruptive events exist, but no archive available at the moment combines quantitative data from as many instruments. We archived and collocated the SO2 vertical column density estimations from three different satellite instruments (AIRS, IASI and GOME-2), atmospheric parameters as vertical profiles from the Global Navigation Satellite Systems (GNSS) Radio Occultations (RO), and the cloud-top height and aerosol type from the Cloud-Aerosol Lidar with Orthogonal Polarization (CALIOP). Additionally, we provide information about the cloud-top height from three different algorithms and the atmospheric anomaly due to the presence of the cloud. The dataset is gathering 206 d of SO2 data, collocated with 44 180 backscatter profiles and 64 764 radio occultation profiles. The modular structure of the archive allows an easy collocation of the datasets according to the users' needs, and the cross-comparison of the datasets shows different consistency of the parameters estimated with different sensors and algorithms, according to the sensitivity and resolution of the instruments. The data described here are published with a DOI at https://doi.org/10.5880/fidgeo.2020.016 (Tournigand et al., 2020a).
- Article
(2341 KB) - Full-text XML
-
Supplement
(1122 KB) - BibTeX
- EndNote


Volcanoes around the world are a constant source of gaseous emissions, both passively, during quiescent times, and actively, during eruptions (Robock, 2015; Carn et al., 2017). The most abundant gas species emitted are water (H2O), carbon dioxide (CO2) and sulfur dioxide (SO2), while less abundant ones include hydrogen (H2), hydrogen sulfur (H2S), hydrochloric acid (HCl) and carbon monoxide (CO) (Williams-Jones and Rymer, 2015). Once emitted into the atmosphere, some of these gases can react and transform; for example, SO2 transforms into H2SO4. As with all volcanic eruption products, the gases emitted and the related aerosols can pose hazards to people as well as the environment (Williams-Jones and Rymer, 2015). Moreover, they can be responsible for regional and global climatic effects, depending on the latitude of the volcano, the altitude reached by the eruptive column and subsequent volcanic cloud (Robock, 2000; Robock, 2015; Williams-Jones and Rymer, 2015; Carn et al., 2016). In terms of global climatic impact, SO2 injections into the stratosphere are of the greatest significance. The reason is that in the stratosphere the gas and subsequent aerosol can remain suspended for months to years and hence be transported around the globe, affecting the absorption of both short- and longwave radiation (Robock, 2015). The duration and spatial spreading of emitted gases and aerosols in the atmosphere also depend on the erupted mass of volcanic material and the duration of the emission.
According to the Global Volcanism Program (GVP, 2020) of the Smithsonian Institute, an average of 55 to 88 eruptions (excluding permanent and semi-permanent degassing) have occurred worldwide each year since 1994. The eruptions display variability in their eruptive style (e.g. effusive or explosive); magma composition; the energy of the eruption; and the amount, type and size of the ejected material. To compare and characterize different eruptive events in an objective manner, the Volcanic Explosivity Index (VEI) was created. The VEI was introduced in 1982 by Newhall and Self (1982), drawing inspiration from the Richter scale for earthquake magnitude, to provide a relative, semi-quantitative measure of the explosiveness of volcanic eruptions. The VEI classification, divided into categories from 0 to 8, is based mainly on measures of magnitude, in terms of total ejecta volume, and/or intensity, in terms of mass flux or eruption plume height, depending on data availability (Newhall and Self, 1982; Houghton et al., 2013). The VEI has its limitations; nevertheless, it is being used extensively to provide an eruption descriptor that is understandable by researchers and policymakers alike (Houghton et al., 2013).
The size of an eruption can, however, be significantly different when considering gas emissions only (Carn et al., 2016). Thus, a different eruption size classification can be outlined by the sulfur input into the atmosphere (Schnetzler et al., 1997; Robock, 2015; Carn et al., 2016). In 1997, Schnetzler et al. proposed the volcanic sulfur dioxide index (VSI) based on SO2 retrievals performed with the Total Ozone Mapping Spectrometer (TOMS) on board the Nimbus 7 satellite. Medium VEI eruptions (e.g. VEI 4 events) can be characterized by the emission of a large quantity of tephra with respect to the quantity of SO2 (e.g. the 2008 Chaiten eruption) or by the emission of a larger amount of SO2 than tephra (e.g. the 2011 Nabro eruption) as shown in Carn et al. (2016). Using an improved SO2 emissions retrieval approach and including less energetic events, Carn et al. (2016) found a broader range of SO2 emission per VEI and a weaker first-order correlation. These findings suggest that the intensity and volcanic plume altitude are more relevant parameters for consideration in modelling SO2 emissions and their climate impact (Robock, 2000; Carn et al., 2016).
The above-mentioned GVP provides the most extensive catalogue of historical eruptions with information related to both volcanoes and their eruptions. This catalogue is a first-hand source of information when starting an investigation of a given volcano and a given style of eruption. Similarly, the Large Magnitude Explosive Volcanic Eruptions (LaMEVE) dataset includes data such as the magnitude of the event, the bulk volume, the tephra fallout volume and the column height of Quaternary (from 2.58 Myr ago to present) eruptions with VEI ≥4 (Brown et al., 2014). Other datasets are available including data on geochemical composition (e.g. Turner et al., 2009), or acoustic acquisitions (e.g. Fee et al., 2014), although these types of database are generally limited to ancillary information, a specific volcano, a specific time window or a specific instrument (e.g. de Moor et al., 2017).
Previous studies focusing on a single or a few eruptions are based on personal data collections or project collaborations, and this makes it difficult for data comparison and studies with new techniques or algorithms. The eruptions of Okmok and Kasatochi in 2008 were the focus of a special issue (Journal of Geophysical Research Atmospheres special issue, 2018) collecting 27 articles studying the clouds with a large number of the available remote sensing platforms and algorithms. The Sarychev Peak eruption in 2009 was also well studied (e.g. Carn and Lopez, 2011; Kravitz et al., 2011; Rybin et al., 2011; Doeringer et al., 2012). The Eyjafjallajökull 2010 eruption affected the economy and social life of Europe and beyond, changing the rules of air traffic management, and the volcanic cloud was the subject of a number of studies (e.g. Flentje et al., 2010; Marenco et al., 2011; Prata and Prata, 2012; Stohl et al., 2011). The Grímsvötn eruption in 2011 was quite interesting from a scientific point of view because the SO2 cloud was separated from the ash cloud (Moxnes et al., 2014) and different researchers studied it (e.g. Flemming and Inness, 2013; Marzano et al., 2013; Cook et al., 2014; Prata et al., 2017). The Nabro 2011 eruption was the subject of an interesting discussion regarding the direct intrusion to the stratosphere of the volcanic cloud (e.g. Bourassa et al., 2012; Clarisse et al., 2014; Fromm et al., 2014; Biondi et al., 2017). Puyehue–Cordón Caulle, erupting in the same period, was of interest because the cloud moved around the globe (e.g. Bignami et al., 2014; Griessbach et al., 2014; Theys et al., 2014; Biondi et al., 2017). The Calbuco 2015 eruption (Marzano et al., 2018; Lopes et al., 2019) was widely studied, especially in connection to its impact on the Antarctic ozone hole (Ivy et al., 2017; Stone et al., 2017; Zhu et al., 2018; Zuev et al., 2018). The rest of the volcanic clouds, such as the ones produced by Merapi 2010 (Picquout et al., 2013), Tolbachik 2012 (Telling et al., 2015), and Kelut 2014 (Kristiansen et al., 2015; Vernier et al., 2016) also received some attention from the scientific community.
Considering SO2 emissions, several datasets and inventories are available and updated over time, but generally they include daily or yearly total emissions per volcano or per eruption. Ge et al. (2016) compiled an inventory for daily SO2 emissions in the time frame of 2005–2012 including global volcanic eruptions but also eight persistently degassing volcanoes retrieved by the Ozone Monitoring Instrument (OMI) on board the Aura satellite. Carn et al. (2017) implemented an inventory including OMI retrievals from 2005 to 2015 of emissions related to passive degassing. The most updated and complete dataset up to now is the Multi-Satellite Volcanic Sulfur Dioxide Database Long-Term L4 Global (MSVOLSO2L4) compiled by Carn (2019). The dataset provides “SO2 mass loadings for all significant global volcanic eruptions detected from space since October 1978” to present (Carn, 2019). The MSVOLSO2L4 includes ancillary information about the volcanoes, such as the name and location of the volcano, as well as information about the eruptions, for example, start and end dates and VEI. This information is retrieved from the GVP database. The dataset also reports the observed plume altitude (in kilometres) where known. Otherwise, an estimated plume altitude above the vent depending on eruption type and the measured SO2 mass in kilotons (1000 metric tonnes) are provided (Carn et al., 2016; Carn, 2019). The above-mentioned datasets provide important information for users mainly needing to assess the climatic impact of SO2 from volcanic sources; however, none of them allow for mapping the SO2 emissions and related altitude estimations in space and time and thus the direct testing and comparison of new models and techniques, like GNSS RO, for example. We think it is important to provide a complementary multi-satellite archive covering the largest eruptive events and their cloud development all around the world in order to facilitate the access to such data for future studies.
In this study, we present the first database predicated on satellite data, reporting
-
SO2 retrievals from Atmospheric Infrared Sounder (AIRS), Infrared Atmospheric Sounding Interferometer (IASI) and the Global Ozone Monitoring Experiment 2 (GOME-2), the data from which provide horizontal and temporal information on SO2 concentrations;
-
SO2 cloud altitude estimations from IASI, the Cloud-Aerosol Lidar with Orthogonal Polarization (CALIOP) backscatter and the Global Navigation Satellite System (GNSS) Radio Occultation (RO);
-
the cloud aerosol subtype information from CALIOP;
-
atmospheric properties such as temperature, pressure and humidity from GNSS RO profiles.
The information is provided for eruptions, after July 2008, classified by GVP as VEI 4 or larger and with an SO2 total mass loading greater than 0.05 Tg. At the time of the archive preparation no eruption after 2016 had yet been classified as VEI 4 or greater. The selected volcanoes and relative eruptions are Okmok 2008, Kasatochi 2008, Sarychev 2009, Eyjafjallajökull 2010, Merapi 2010, Grímsvötn 2011, Nabro 2011, Puyehue–Cordón Caulle 2011, Tolbachik 2012, Kelut 2014 and Calbuco 2015. These are the most significant eruptions over the period 2006–2018. Further information on these eruptions can be found in Table 1.
Table 1Summary of data used to build the archive.
NA: not available.
To the best of our knowledge, there is no database to date collecting SO2 maps and volcanic cloud altitude estimations from several instruments, cloud aerosol subtypes and atmospheric properties for explosive eruptions. Accurate knowledge on volcanic SO2 cloud concentration and altitude as well as their spatial and temporal evolution is of crucial importance in the investigation of an eruption's climatic impact. Thus, we believe that the database presented here will help current and future investigations as well as support the development of more accurate retrieval methodologies.
A summary of the instruments' characteristics together with parameters provided in this work and references to the algorithms are reported in Table 1. In this archive, each sensor measuring SO2 amounts measures the partial column density, due to their own limitations (see Sect. 4.3) (Brenot et al., 2014). We here use the term vertical column density (VCD) to refer to this partial column density.
2.1 AIRS
The Atmospheric Infrared Sounder (AIRS) is a cross-track hyperspectral instrument on board the polar-orbiting satellite Aqua launched in June 2002 with an ascending-orbit local Equator crossing time at 13:30. AIRS completely covers the full globe two times per day with a swath of 1650 km and spatial resolution of 13.5 km×13.5 km at nadir and 41 km×21 km at high latitudes (Susskind et al., 2003). Each orbit is divided in granules, where a granule is a portion of AIRS orbit containing 6 min (2250 km×1650 km) of data, which is officially defined by the National Aeronautics and Space Administration (NASA). The SO2 pixels are identified using infrared channels centred at the 7.3 µm absorption peak relying on the correlation between the measured spectrum and a reference spectral shape. The amount of SO2 in each pixel is computed by a least-squares procedure based on an off-line radiative transfer model. This technique performs well for SO2 reaching high tropospheric altitudes or the stratosphere where the water vapour content is negligible. Comparisons with other techniques (Carn et al., 2016; Carn et al., 2017) show an agreement within 10 %–30 % and a typical retrieval error for a single AIRS pixel of about 6 Dobson units (DU) (Prata and Bernardo, 2007).
2.2 IASI
The Infrared Atmospheric Sounding Interferometer (IASI) is a Fourier transform instrument on board the near-polar sun-synchronous orbiting satellites MetOp-A and MetOp-B, respectively launched in October 2006 and September 2012 with an ascending-orbit local Equator crossing time at 09:30. IASI completely covers the full globe two times per day with a swath of 2200 km and a spatial resolution of 12 km at nadir (Clerbaux et al., 2009). The SO2 retrieval is based on a brightness temperature difference in the SO2 ν3 band centred at 7.3 µm (Clarisse et al., 2012), which is converted to SO2 concentration integrated along the vertical axis; the VCD using look-up tables; and operational profiles of pressure, temperature and humidity. The retrieval of VCD assumes that all SO2 is located at particular atmospheric layers (5, 7, 10, 13, 16, 19, 25 or 30 km above sea level) providing different estimations at different altitudes. It has a detection limit of around 0.5 DU at the tropopause, which increases for decreasing altitude (depending on the amount of water vapour in the atmosphere). For plumes above 500 hPa (about 5.5 km) the algorithm has a theoretical uncertainty between 3 %–6 %. A second algorithm (Clarisse et al., 2014) is applied to compute the SO2 cloud altitude with an accuracy of about 2 km for plumes below 20 km. The algorithm exploits the fact that the SO2 ν3 band interferes with strong water vapour absorptions and that these interferences, by virtue of the vertical water vapour profile, have a strong dependency with height. Combining the two datasets, a single best-estimate VCD is obtained by interpolating the VCD columns of the first algorithm at the retrieved height.
2.3 GOME
The Global Ozone Monitoring Experiment 2 (GOME-2) is an ultraviolet–visible spectrometer, on board the MetOp-A and MetOp-B satellites, measuring solar light backscattered by the atmosphere or reflected by the Earth in nadir-viewing geometry with a swath of 1920 km and spatial resolution of 40 km×80 km at nadir (Munro et al., 2006). The SO2 VCD retrieval (Rix et al., 2012) is based on the strong SO2 absorption between 240 and 400 nm and uses a differential optical absorption spectroscopy technique (Platt and Stutz, 2008). All measurements in the wavelength ranging from 315 to 326 nm are fitted to laboratory absorption data of SO2 and converted to VCD with an air mass factor from radiative transfer models assuming hypothetical atmospheric layers representative of different scenarios of emissions. The SO2 VCD is provided for three atmospheric layers representative of different scenarios of emissions: low troposphere (∼2.5 km above the surface), upper troposphere (∼6 km) and lower stratosphere (∼15 km). The volcanic emission measurement is facilitated by large SO2 columns generally at high altitudes (free troposphere to lower stratosphere). However, for large SO2 columns (typically >50 DU) the absorption tends to saturate, leading to a general underestimation and directly affecting the product accuracy. For most volcanoes, there is no ground-based equipment to measure SO2 during the eruption, and the validation approach is usually a cross-comparisons with other satellite products. The O3M SAF validation report (Theys et al., 2015) shows that the GOME-2 SO2 product reaches the target and optimal accuracy of 50 % and 30 % respectively. It is important to notice that the SO2 retrievals from GOME-2 are also affected by clouds and instrumental noise, especially at high solar zenith angles. These limitations have been filtered in the data used in this work, according to the criteria shown by Brenot et al. (2014).
2.4 CALIOP
The Cloud-Aerosol Lidar with Orthogonal Polarization (CALIOP) is an instrument on board the polar-orbiting Cloud-Aerosol Lidar and Infrared Pathfinder Satellite Observation (CALIPSO). To estimate the volcanic cloud (VC) top altitude and validate the cloud-top estimation from GNSS RO, we have used the Level 1 total attenuated backscatter at 532 nm (CAL_LID_L1 Version 4) with a vertical resolution of 60 m and horizontal resolution of 1 km between 10 and 20 km of altitude and a vertical resolution of 180 m and horizontal resolution of 1.67 km above 20 km (Winker et al., 2009). To extract the corresponding aerosol type, we have used the Level 2 Vertical Feature Mask (Winker et al., 2009) product version 4.20. CALIOP does not allow SO2 measurements or estimation (it provides estimations of dust, elevated smoke, volcanic ash and sulfate), and the CALIOP classification algorithm does not include the volcanic ash type below the tropopause level (Kim et al., 2018), making it difficult to distinguish the volcanic ash from other aerosol types in the lower troposphere. For these reasons, the selected CALIOP backscatter is collocated with the SO2 estimation from AIRS, IASI and GOME-2, and this combination provides a complete information on the content and vertical structure of the cloud.
2.5 GNSS RO
The Global Navigation Satellite Systems (GNSS) Radio Occultation (RO) is an active limb sounding technique which uses radio signals transmitted by a GNSS satellite and received by a low-Earth-orbit satellite, where the atmosphere is vertically scanned due to the relative motion of the two satellites. The signal, travelling through the atmosphere, is refracted and bent due to the vertical gradient of atmospheric density. The effect of the atmosphere is represented by a bending angle, from which refractivity and density are retrieved. Refractivity in the neutral atmosphere depends mainly on temperature, pressure and water vapour pressure. Information about the vertical structure of the troposphere and stratosphere is provided (Kursinski et al., 1997). The vertical resolution of the RO ranges between 100 m in the upper troposphere and about 500 m in the lower stratosphere at low latitudes to mid-latitudes (Zeng et al., 2019), while the horizontal resolution can range from about 50 km in the troposphere to 200–300 km in the stratosphere (Kursinski et al., 1997). In this archive we use the RO bending angle, refractivity, temperature, pressure and specific humidity profiles processed by the Wegener Center for Climate and Global Change (WEGC) with the Occultation Processing System (OPS) version 5.6 (EOPAC Team, 2019). We also provide the bending angle anomaly which is proven to be an efficient parameter to reveal the impact of the VC on the atmospheric structure (Biondi et al., 2017; Cigala et al., 2019; Stocker et al., 2019) because perturbations in the vertical structure are seen in the bending angle profile as anomalous peaks, specifically at the volcanic cloud top. The way this anomaly is computed is detailed in Sect. 4.1. The RO profiles are obtained using a combination of geometric optics and wave optics retrieval (Angerer et al., 2017), with transition below the tropopause. The retrieval is based on orbit information and amplitude and phase data from the University Corporation of Atmospheric Research/COSMIC Data Analysis and Archive Center (UCAR/CDAAC) collected from the following RO missions: the CHAllenging Minisatellite Payload (CHAMP) (Wickert et al., 2001), the Satélite de Aplicaciones Cientificas (SAC-C) (Hajj et al., 2004), the Gravity Recovery And Climate Experiment (GRACE-A) (Beyerle et al., 2005), the FormoSat-3/COSMIC (Anthes et al., 2008) and the EUMETSAT/MetOp missions (Luntama et al., 2008). The accuracy of the GNSS RO is 0.2 K in terms of temperature and 0.1 % in terms of refractivity, and the data from the different missions are very consistent (Scherllin-Pirscher et al., 2011), so there is no need of inter-calibration or homogenization (Foelsche et al., 2011).
Table 2Summary of the volcanoes and related eruption selected for the database. The following information is provided: the name of each volcano; the eruption start date as provided by the GVP; the spatial location of the volcano in latitude and longitude; the plume/cloud height as a range estimated from IASI, CALIOP and GNSS RO (see details below); and the SO2 mass loading in teragrams as reported in the literature.
NA: not available.
The archive (Tournigand et al., 2020a) consists of two sets of files, the daily files and the eruption files, i.e. one file per eruption including all collected information. Thus, for each eruption listed in Table 2 the user can choose to access one single day or the whole eruptive period depending on the user's demand. The number of days covered by the archive for each eruption depends on the SO2 detection availability from AIRS, IASI and GOME-2. Also, the variables available from one day to another may differ according to SO2 detection results and instrument availability. Each file is in NetCDF-4 format and file names are self-explanatory with daily files following the format volcanoname_year_month_day and the eruption files following the format volcanoname. As an example, a user who wishes to access all available data corresponding to the Sarychev volcano on 12 June 2009 will have to look for the file Sarychev_2009_06_12.nc. The organization of both file types is described hereafter for each instrument, the main information is provided in Table 3 and all the details are provided in the Supplement including the geographical coverage of each VC (Figs. S1–S11).
3.1 AIRS
AIRS data are organized in the same way in both file types. It consists of four variables, namely AIRS_lat, AIRS_lon, AIRS_date and AIRS_SO2 respectively containing the latitude (∘ N), longitude (∘ E), date and time (POSIX time, number of seconds elapsed since 00:00:00 UTC, 1 January 1970) of each granule, and their SO2 VCD (DU). The variables AIRS_lat, AIRS_lon and AIRS_SO2 are matrices with columns corresponding to the different granules. By selecting one column, the user can find each data point of the corresponding granule. The AIRS_date variable, on the other hand, is a line vector with elements reporting the date and time of each granule. Only data points with SO2 values higher than 0 DU have been included in the archive, thus explaining the different number of points from one granule to another.
3.2 IASI
IASI data are organized in the same way for both file types and are composed of five variables, IASI_lat, IASI_lon, IASI_date, IASI_SO2 and IASI_height respectively containing the latitude (∘ N), longitude (∘ E), date and time (POSIX time), SO2 (DU), and cloud altitude (m). The date variable consists of a line vector with elements corresponding to each scanning line. Similarly, the other variables are matrices with columns corresponding to the different scanning lines and rows to the data points of the given scanning line having an SO2 content higher than 0 DU.
3.3 GOME-2
The GOME-2 data's organization is identical in both file types. GOME-2 is composed of six variables, GOME_lat, GOME_lon, GOME_date, GOME_SO2_1, GOME_SO2_2 and GOME_SO2_3 respectively corresponding to the latitude (∘ N), longitude (∘ E), date and time (POSIX time), low-troposphere SO2 vertical column density (DU), mid-troposphere SO2 vertical column density (DU), and low-stratosphere SO2 vertical column density (DU). As for AIRS and IASI, the date variable corresponds to a line vector providing each scanning line's date. The rest of the variables correspond to matrices with scanning lines also separated in columns and the data points of those scanning lines distributed in rows. In the case of GOME-2, only data points with their three SO2 vertical column contents higher than 0 DU were included. Pixels with a high solar zenith angle (SZA) have also been filtered.
3.4 CALIOP
CALIOP's section of the archive contains six variables, CALIOP_lat, CALIOP_lon, CALIOP_date, CALIOP_filename, CALIOP_height and CALIOP_type respectively corresponding to the latitude (∘ N), longitude (∘ E), date and time (POSIX time), name of CALIOP file, estimated VC top altitude (m), and aerosol type. The latitude, longitude, date and file name variables are column vectors with each row corresponding to latitude, longitude and date data of the designated file in the CALIOP_filename variable. The CALIOP_height variable contains all the cloud-top altitude estimations based on the CALIOP L1 532 nm version 4.10 backscatter product. This variable is a matrix with each row corresponding to a CALIOP file and the three columns indicating to which instrument the CALIOP file is collocated (at ±0.2∘ and ±1 h) with, AIRS (column 1), IASI (column 2) or GOME (column 3).
The CALIOP_type variable is read as a string containing the type of aerosol retrieved from the L2 Vertical Feature Mask (VFM) version 4.20. The L2 VFM CALIOP product subdivides the aerosols into 10 types. Four of those types are of interest for this archive: types 2, 6, 9 and 10 respectively corresponding to dust, elevated smoke, volcanic ash and sulfate/other. This variable is subdivided into as many rows as there are CALIOP files, 16 columns containing the aerosol values and three sections corresponding to three levels of altitude −0.5 to 8.2, 8.2 to 20.2 and 20.2 to 30.1 km. In each altitude level, the presence of one or several cloud types is indicated by the presence of their reference number.
3.5 GNSS RO
GNSS RO data are organized in different ways in the two file types. In the daily files, the RO data are separated into different variables according to the instrument they are collocated with (AIRS, IASI or GOME-2) at ±0.2∘ spatially and ±12 h temporally. For each set of RO data collocated with a given instrument 10 variables are provided: latitude (∘ N), longitude (∘ E), date (POSIX time), bending angle (rad), bending angle anomaly (%), temperature (K), pressure (Pa), refractivity (N-unit), specific humidity (kg kg−1) and volcanic cloud-top altitude (m). Each variable is a matrix with each column corresponding to a RO profile and rows to the latitude dimension. Only the variable containing volcanic cloud altitude is a line vector with each element corresponding to a different RO profile.
In the files containing the whole eruptive period, the RO data are not separated according to the instrument they are collocated with but compiled all together. Thus, the same 10 variables are provided as in daily files, each containing the totality of the RO profiles.
4.1 RO data
The RO profiles included in this archive are collocated spatially at ±0.2∘ and temporally at ±12 h with data points from the volcanic aerosol maps provided by AIRS, IASI and GOME-2 acquisitions.
4.1.1 Climatology
The RO reference climatology for each area of interest is calculated based on 5∘ latitude bands using our dataset of RO profiles covering a period from 2001 to 2017. The averaging of all available RO profiles present within each latitude band provides the RO reference climatology.
4.1.2 Anomaly calculation
The bending angle (BA) anomaly integrated into this archive is calculated by subtracting the RO reference climatology profile from the individual RO BA profile and normalizing with respect to the reference climatology profile (Eq. 1), following the methodology described in Biondi et al. (2017). The resulting anomaly displays variations when the bending angle differs from the climatology. Such variations indicate a change of atmospheric properties and are used to identify related atmospheric features. The presence of volcanic clouds in the atmosphere generates a prominent peak in the BA anomaly profile.
where α is the bending angle anomaly, BA the individual bending angle profile and BAclim the BA climatology profile.
4.1.3 Peak detection
The peak detection of bending angle anomaly profiles was automatically done using a customized MATLAB algorithm. This algorithm, further developed after Cigala et al. (2019), identifies all the peaks displaying a variation larger than 4.5 % in the bending angle anomaly profile with respect to local minimums. Only the peaks having their maximum value between 10 and 22 km of altitude are kept. Peaks vertically spreading over more than 8 km have been removed. Finally, amongst the remaining peaks, the lowest altitude one is selected as a cloud-top altitude.
4.2 CALIOP
4.2.1 Cloud-top automatic detection
For each L1 532 nm version 4.10 CALIOP backscatter product collocated with RO profiles, an automatic cloud-top detection was performed using a customized MATLAB algorithm. The collocation thresholds were kept at ±0.2∘ and ±12 h between RO profiles and CALIOP backscatter products to provide cloud-top altitudes consistent between the instruments. The first step of the cloud-top detection procedure consists of cropping the CALIOP backscatter image according to the collocated RO profile position at +/−14∘ in latitude and +/−80∘ in longitude. The objective of this first step is to focus the processing on a restricted zone around the position of the collocated RO profile in order to save computational time. These latitude and longitude ranges are based on a series of tests performed on backscatter images and correspond to the best compromise between image size reduction and loss of volcanic cloud information. Threshold backscatter values are then implemented to remove the noise outside of the range – km−1 sr−1 to which volcanic clouds correspond. One median filter (4×3 pixels) and two Wiener filters (4×3 and 2×2 pixels) are then successively applied to the resulting backscatter image to reduce the noise within the threshold range. Below 10 km altitude, the RO bending angle anomaly is noisy due to the presence of moisture. Thus we only included in this archive volcanic clouds with a top altitude above 10 km. The following step in the volcanic cloud-top determination is then to remove image information below 10 km, which also removes a significant part of meteorological clouds increasing the volcanic cloud-top altitude detection accuracy. The next step of CALIOP data processing is to identify the remaining groups of pixels (or clusters) within the image. The MATLAB connected components finder is set in this customized algorithm to keep only the clusters combining more than 300 pixels. Amongst these selected clusters the nine biggest ones are kept for the final processing stage. Based on all the collocations between CALIOP and the GNSS RO, a statistical analysis of volcanic clouds defined by the CALIOP cloud mask and collocated with the RO within 2 h has shown that the volcanic clouds are usually thinner than meteorological clouds with an aspect ratio lower than 0.09. According to this result, the final stage of the algorithm consists of distinguishing clusters corresponding to volcanic features from the ones corresponding to meteorological clouds, setting the higher limit of the aspect ratio to 0.09. Finally, the remaining clusters' top altitudes are measured, and an average value is calculated and saved in the archive as an estimate of the volcanic cloud-top altitude.
4.2.2 Cloud type detection
The cloud type detection was performed using the L2 Vertical Feature Mask (VFM) CALIOP product. These VFM products were collocated at ±0.2∘ and ±1 h with AIRS, IASI and GOME-2 for the purpose of confirming the presence of certain aerosol types simultaneously with SO2. Among the different cloud types available in VFM products, the types 2, 6, 9 and 10 were of particular interest for this archive since they respectively correspond to dust, elevated smoke, volcanic ash and sulfate/other. For each CALIOP file of the archive, the aerosol subtype was extracted using a customized MATLAB routine. This MATLAB algorithm reads the VFM data; detects the matching latitude–longitude points of all the CALIOP tracks collocated with AIRS, IASI and GOME-2; and subsets the latitude and longitude array data based on the chosen spatial window of 2∘. The algorithm then extracts the feature sub-type of interest as a function of the altitude. The final output is subdivided into three levels of altitude: −0.5 to 8.2, 8.2 to 20.2 and 20.2 to 30.1 km.
4.3 Uncertainties
This archive combines five different approaches of volcanic cloud detection and each type of measurement and instrument has its own uncertainties. The comparison between different instruments always faces uncertainties due to the spatial and temporal collocation (Sect. 3) and to their spatial resolution (Sect. 2). The difference in cloud-top estimations can be partly explained by the different sensitivities and vertical resolution of the instruments. In addition, the number of collocations between RO and CALIOP is much smaller than for RO-IASI and IASI-CALIOP. The cloud-top height estimation for eruptions with a large number of collocations (Calbuco, Kasatochi, Nabro and Sarychev Peak) is in general consistent within the techniques. For AIRS, IASI and GOME-2 the uncertainty depends on many parameters, such as thickness of the volcanic cloud, amount of aerosols and, one of the most important parameters, the unknown volcanic cloud altitude. Thus, the error is case dependent and a general value of measurement uncertainty cannot be provided. Furthermore, the measurement noise of instruments increases over time due to instrument degradation (Lang et al., 2009; Dikty et al., 2010). However, error budgets of AIRS and IASI can be respectively found in the studies by Prata and Bernardo (2007) and Clarisse et al. (2012), while an uncertainty analysis of GOME-2 is provided by Rix et al. 2012 in the case of the 2010 Eyjafjallajökull volcanic eruption.
Data cross-comparison
Over the past decades, satellite data have proven efficient in volcanic cloud detection through a variety of techniques. Those data are essential in the study of the spreading of such clouds on a global scale but are scattered between the different agencies in charge of processing them. This archive gathers satellite data covering 10 VEI 4 eruptions and one VEI 5 eruption from 2008 to 2016 with a total of 223 d of data coverage (Table 4).
Table 4Number of days, granules, scanning lines and profiles covered by the archive for each volcano in alphabetical order. PCC: Puyehue–Cordón Caulle.
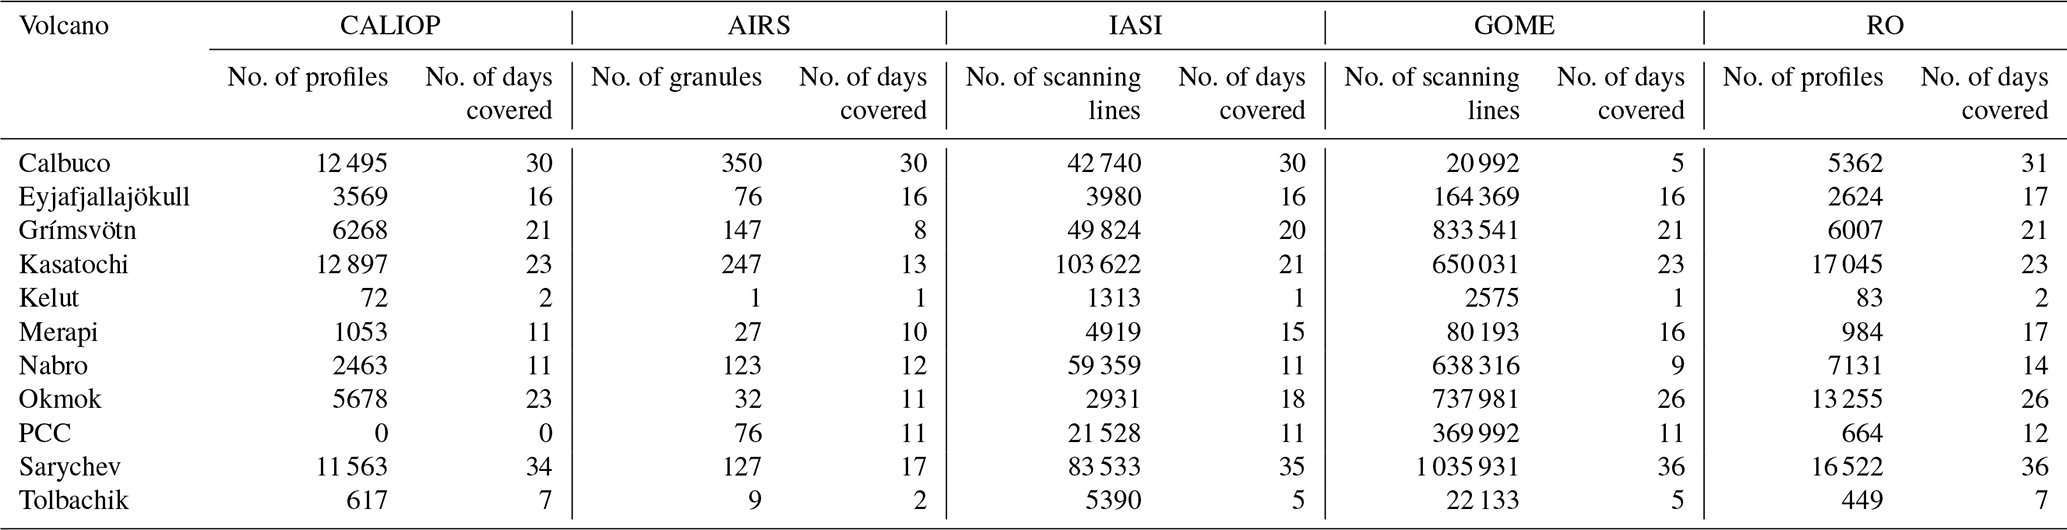
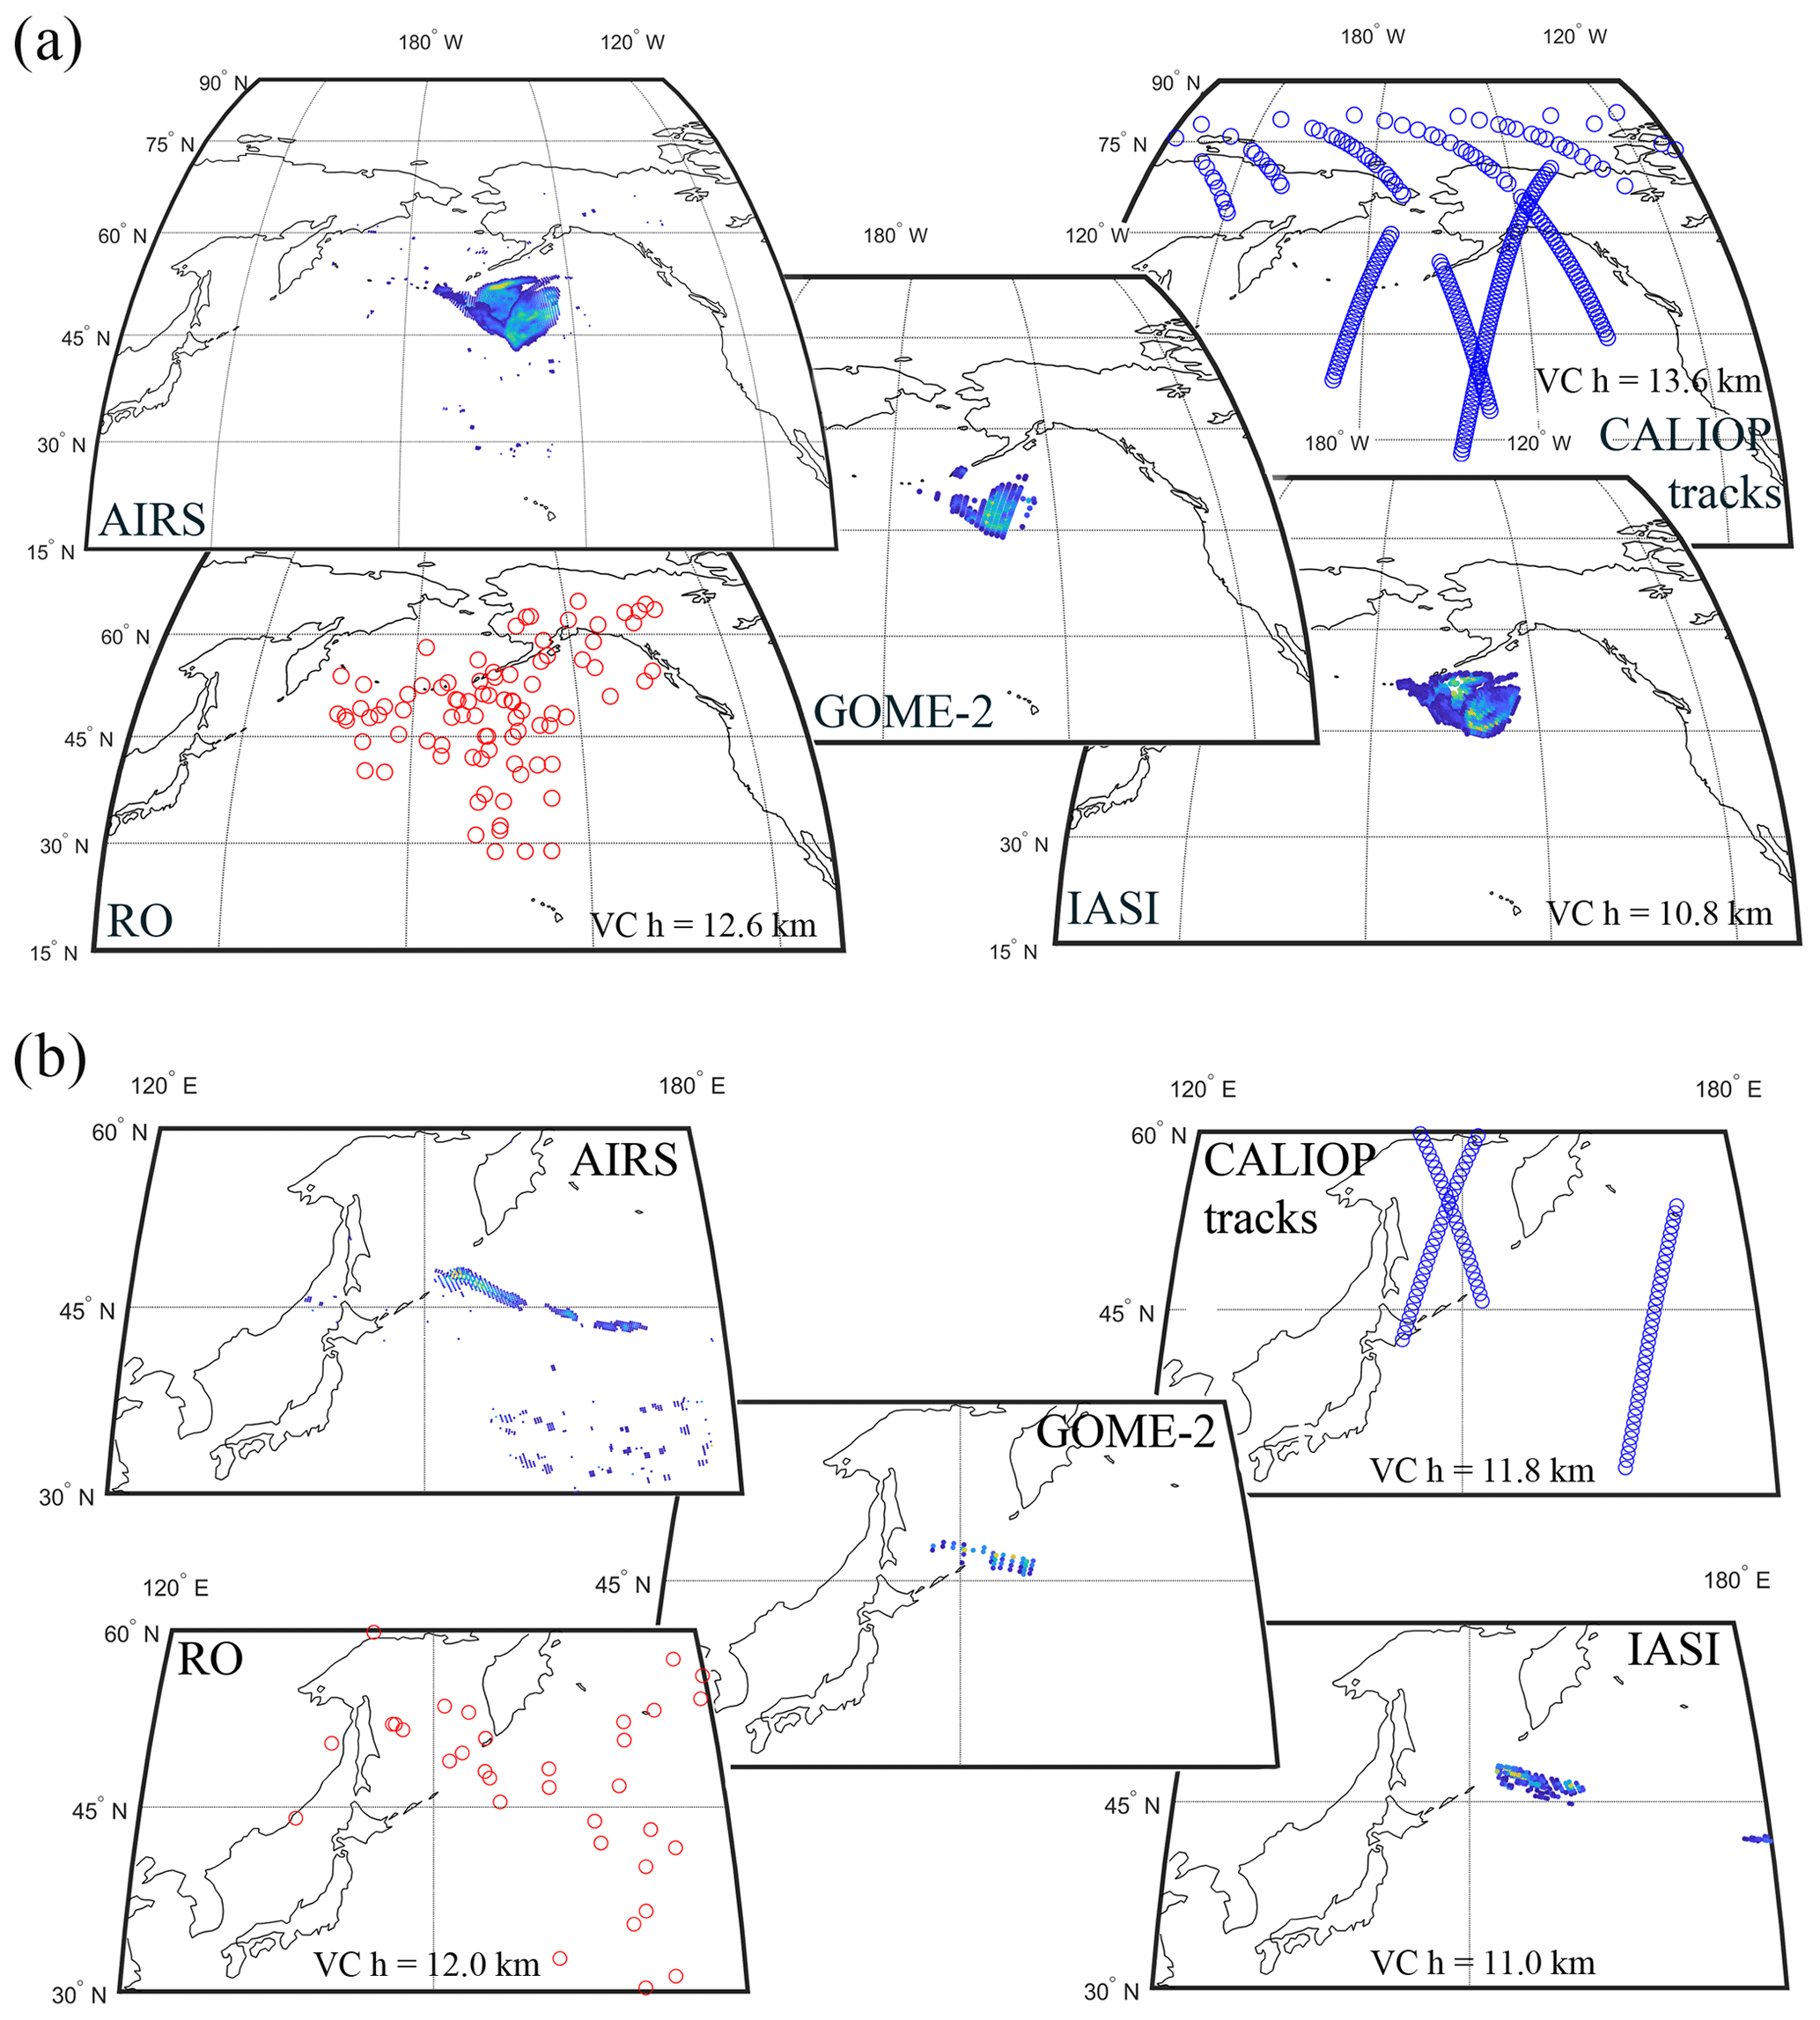
Figure 2Example of data use and data collocation. (a) Kasatochi cloud on 9 August 2008; (b) Sarychev Peak cloud on 12 June 2009. The central panels show the SO2 VCD two-dimensional spreading estimated by AIRS, GOME-2 and IASI; the top right panel shows the CALIOP tracks for which the total attenuated backscatter profile is available; and the bottom left panel shows the RO profiles collocated with the SO2. For IASI, CALIOP and RO the average volcanic cloud-top altitude for the considered day is indicated (VC h).
This archive is organized in different sections (Fig. 1) with each instrument estimation separated from the others. Several parameters are included within the dataset, such as SO2 VCD and cloud-top altitude, to allow cross-correlation between the different retrieval algorithms. The database allows the quick visualization of AIRS, IASI, GOME-2, CALIOP and RO data at a given date and time as well as the collocation of any instrument data point with another one. In order to illustrate the use of this archive, we extracted two test cases (Fig. 2). The first case (Fig. 2a) is the 2008 eruption of Kasatochi volcano for which we selected 9 August as reference. The second case (Fig. 2b) is the 2009 Sarychev Peak eruption for which we selected 12 June as reference. In both cases we considered SO2 values larger than 3 DU from AIRS, IASI and GOME-2 for 24 h, RO profiles collocated within ±0.2∘ and ±12 h, and CALIOP tracks collocated within ±12 h.
In the case of Kasatochi, we selected 4178 AIRS, 1241 IASI and 56 GOME-2 data points with SO2 VCD larger than 3 DU; 379 CALIOP profiles from seven different tracks (Fig. 2a, blue circles) within ±12 h; and 100 RO profiles (Fig. 2a, red circles) collocated within ±0.2∘ and ±12 h. In the case of Sarychev, 1070 AIRS, 209 IASI and 41 GOME-2 data points; 261 CALIOP profiles from three different tracks; and 54 RO profiles have been selected with the same criteria. Due to the modular archive structure reported in Fig. 1, the user can easily select different time frames, different SO2 thresholds and a collocation period range to be adapted to any purpose.
We have manually verified the correct functioning of the algorithm which collocates the different instruments. We randomly selected several days from different eruptions and compared the date, time and coordinates of the acquisitions. We then compared the results with those automatically provided by the algorithm. Additionally, we have used a visual validation method for all the samples plotting the SO2 cloud superimposed to the CALIOP tracks and the RO tangent points. As for the cloud-top height, we have collocated the RO and CALIOP estimations with the closest IASI pixel and compared the corresponding values. In Table 5 we report the number of collocations per pair of instruments with the averaged difference between the estimation. Depending on the eruption, the different techniques can give variable performances; for example, the estimations of RO and CALIOP for Eyjafjallajökull, Kasatochi and Grímsvötn were very close (average difference of 0.3, 0.9 and 1.3 km respectively) while they were large for Calbuco (4.2 km). The difference in cloud-top estimations can be partly explained by the sensitivity of the RO to the density of the atmosphere; denser clouds can be detected better than less dense clouds (Tournigand et al., 2020b). This reason, summed up to the uncertainties reported in Sect. 4.3, can contribute to the different biases of the cross-comparisons. In general, the cloud-top height estimation for eruptions with a large number of collocations (Calbuco, Kasatochi, Nabro and Sarychev Peak) is consistent within the techniques.
Table 5The average difference between cloud-top height estimated with pairs of sensors for each volcano. For each pair we report the average difference (or simply the difference when there is only one collocation) of all the collocations and the number of collocations. When there are no collocations the value reported is “/”.

We have collected 4 535 062 GOME-2 scanning lines covering 182 d, 336 399 IASI scanning lines covering 172 d, 865 AIRS granules covering 122 d, 44 180 CALIOP profiles covering 152 d and 64 764 RO profiles covering 194 d collocated to the VC emitted by 11 different eruptions with VEI ≥4. The Kasatochi eruption has the best data coverage, Sarychev has the longest period of coverage (36 days) and Puyehue–Cordón Caulle is the only one not being covered by CALIOP (due to technical issues on that period).
The archive allows the user to collocate data from five instruments working at different frequencies (Table 1), three of them (IASI, CALIOP and RO) able to provide information to develop an algorithm for the cloud-top height estimation (Table 5). Part of this archive has been used in the past to develop an algorithm estimating the cloud-top height by using the RO bending angle anomaly (Biondi et al., 2017; Cigala et al., 2019) and to understand the possible overshooting of the Nabro eruption in the stratosphere (Biondi et al., 2017).
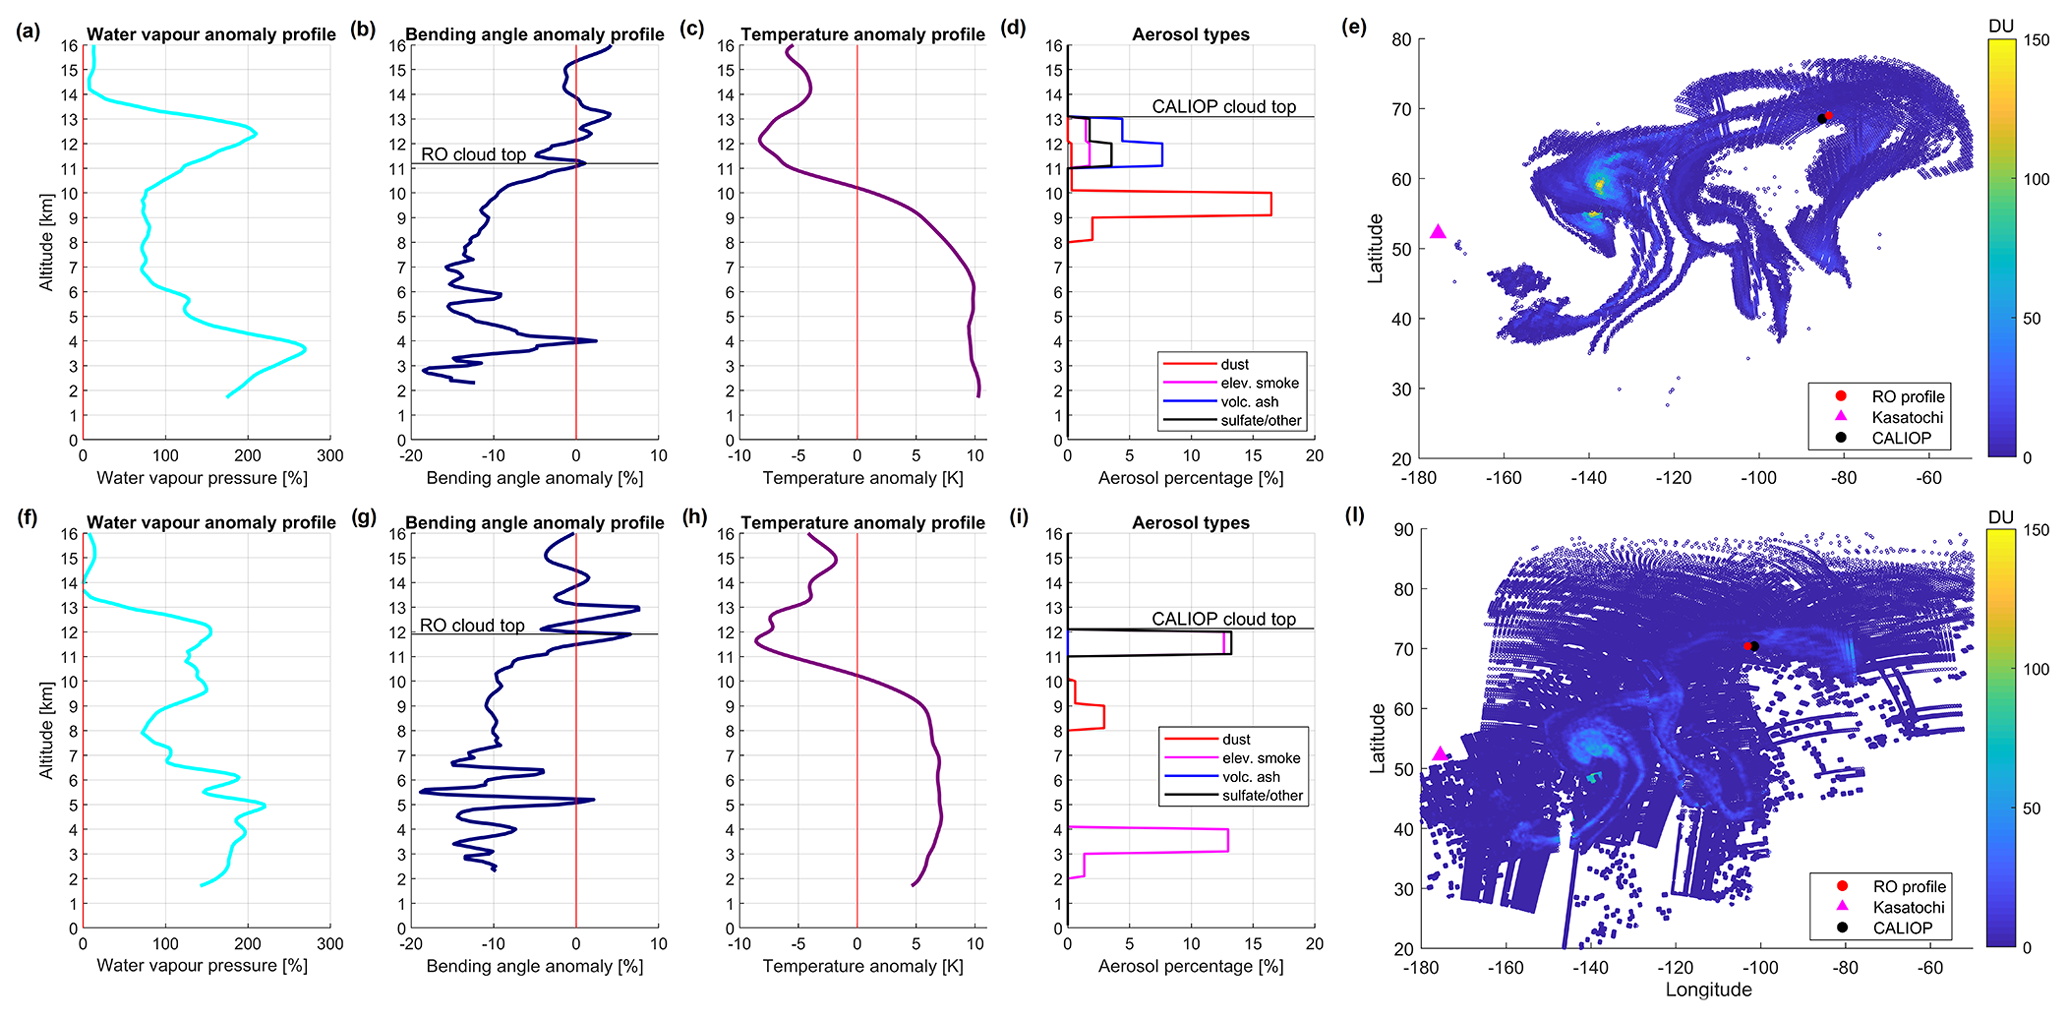
Figure 3Case study Kastochi 2008. RO profiles corresponding to the CALIOP aerosol type profile collocated with the SO2 estimation from IASI (a–e, 12 August 2008) and AIRS (f–j, 11 August 2008).
The user is free to compare the SO2 estimation from three different algorithms, to check the cloud structure by downloading the collocated CALIOP sub-tracks and to analyse the impact of the volcanic cloud on the atmospheric vertical structure with the RO profiles. An example of use of this archive is shown in Fig. 3. We collocated, the IASI SO2 estimation for 12 August 2008 (Fig. 3e) and the AIRS SO2 estimation 11 August 2008 (Fig. 3l) of the Kasatochi VC, with the RO and CALIOP profiles. The map visually provides the SO2 distribution and the position of the RO and CALIOP profiles. Panels (d) and (i) show the vertical distribution of the aerosol according to the CALIOP algorithm: on 12 August there was volcanic ash together with sulfate up to 13 km of altitude, while on 11 August the sulfate was prevailing and the cloud top was slightly lower (about 12 km). We then report the vertical profiles of temperature anomaly (panels c and h) and water vapour anomaly (panels a and f) when compared to the climatological values of the area. The behaviour of the two parameters are similar, but on 12 August the temperature anomaly in the lower troposphere is colder, and the water vapour anomalies are larger in the lower troposphere and at the cloud-top layer. Finally, the bending angle anomaly (panels b and g) according to the algorithm reported in Sect. 4.1.3 shows a cloud-top height of 11.2 km (12 August) against about 13 km from CALIOP and a cloud-top height of 11.9 km (11 August) slightly lower than the detection from CALIOP. This comparison shows that the cloud structure was steady over time with similar characteristics confirmed by four different instruments.
The raw CALIOP data can be found at https://urs.earthdata.nasa.gov/ (last access: 15 March 2020).
The archive consists of daily files and “eruption” files. For each eruption, we provide access to single daily files or to one file for the whole eruptive period. The files of any eruption are compressed (.zip) NetCDF-4 format (including the daily and whole eruptive period) together with two pdf's (Supplement) describing the file structure. The file names are self-explanatory with daily files following the format volcanoname_year_month_day.nc and the eruption files following the format volcanoname.nc. As an example, a user who wishes to access the data corresponding to Kasatochi volcano on 11 August 2008 will have to look for the file Kasatochi_2008_08_11.nc. In case the user wants all the available data for the Kasatochi eruption, they will have to look for the file Kasatochi.nc. The data structure of daily files and volcano files is reported in the Supplement. The data described here are published (Tournigand et al., 2020a) with a DOI at https://doi.org/10.5880/fidgeo.2020.016.
This paper presents the first comprehensive archive with quantitative information on large SO2 volcanic clouds since 2006. We collected three different datasets of volcanic SO2 detection from the AIRS, IASI and GOME-2 instruments and collocated the detected pixels with the CALIOP and the GNSS RO products to get information about the cloud vertical structure. The archive provides information about the SO2 detection and retrieval (with three different algorithms), the cloud-top height (with three different algorithms), the cloud aerosol type (CALIOP vertical mask feature reference), the atmospheric parameters (bending angle, refractivity, temperature, pressure and specific humidity) and the atmospheric change due to the presence of the volcanic cloud (bending angle anomaly). At present, there are no public archives of volcanic clouds which can be used as a reference for further studies, and all the information is scattered in different locations and available under different conditions. The aim of this archive and this paper is to provide the users with a complete set of state-of-the-art data. The interest in volcanic cloud detection and monitoring is high and there are still some challenges like the accurate determination of the cloud-top height and cloud density to be faced. This archive will make available to the scientific community a relevant number of cases to develop and test new algorithms on, thereby contributing to improving the accuracy on the estimation of fundamental volcanic cloud parameters. The modular structure of the archive can be easily extended in the future to smaller eruptions (VEI <4) and to other SO2 estimations, facilitating the inter-/cross-comparison between algorithms, allowing the reconstruction of the cloud structure and dynamical characteristics, and supporting the development of cloud dispersion models.
The supplement related to this article is available online at: https://doi.org/10.5194/essd-12-3139-2020-supplement.
PYT and VC collected the data. LC provided the IASI dataset. HB provided the GOME-2 dataset. FP provided the AIRS dataset. GK and AKS provided the WEGC GNSS RO dataset. PYT, VC and EL conceived the algorithm approach and wrote the code. MH elaborated the CALIOP VFM data. PYT, VC and RB structured and wrote the manuscript. RB conceived the idea, coordinated the team, supervised the project and acquired the funding. EL, MH, LC, HB, FP, GK and AKS reviewed the manuscript.
The authors declare that they have no conflict of interest.
The work is accomplished in the frame of the VESUVIO project funded by the Supporting Talent in ReSearch (STARS) grant at Università degli Studi di Padova, IT. We would like to thank Armin Leuprecht for the support and all the suggestions to make the archive technically correct.
This research has been supported by the UNIPDi (VESUVIO).
This paper was edited by Alexander Kokhanovsky and reviewed by two anonymous referees.
Angerer, B., Ladstädter, F., Scherllin-Pirscher, B., Schwärz, M., Steiner, A. K., Foelsche, U., and Kirchengast, G.: Quality aspects of the Wegener Center multi-satellite GPS radio occultation record OPSv5.6, Atmos. Meas. Tech., 10, 4845–4863, https://doi.org/10.5194/amt-10-4845-2017, 2017.
Anthes, R. A., Bernhardt, P. A., Chen, Y., Cucurull, L., Dymond, K. F., Ector, D., Healy, S. B., Ho, S., Hunt, D. C., Kuo, Y., Liu, H., Manning, K., McCormick, C., Meehan, T. K., Randel, W. J., Rocken, C., Schreiner, W. S., Sokolovskiy, S. V., Syndergaard, S., Thompson, D. C., Trenberth, K. E., Wee, T., Yen, N. L., and Zeng, Z.: The COSMIC/Formosat/3 mission: early results, B. Am. Meteorol. Soc., 89, 313–333, https://doi.org/10.1175/BAMS-89-3-313, 2008.
Beyerle, G., Schmidt, T., Michalak, G., Heise, S., Wickert, J., and Reigber, C.: GPS radio occultation with GRACE: atmospheric profiling utilizing the zero difference technique, Geophys. Res. Lett., 32, L13806, https://doi.org/10.1029/2005GL023109, 2005.
Bignami, C., Corradini, S., Merucci, L., Michele, M. de, Raucoules, D., Astis, G. D., Stramondo, S., and Piedra, J.: Multisensor satellite monitoring of the 2011 Puyehue-Cordón Caulle eruption, IEEE J. Sel. Top. Appl., 7, 2786–2796, https://doi.org/10.1109/JSTARS.2014.2320638, 2014.
Biondi, R., Steiner, A. K., Kirchengast, G., Brenot, H., and Rieckh, T.: Supporting the detection and monitoring of VCs: A promising new application of Global Navigation Satellite System radio occultation, Adv. Space Res., 60, 2707–2722, https://doi.org/10.1016/j.asr.2017.06.039, 2017.
Bourassa, A. E., Robock, A., Randel, W. J., Deshler, T., Rieger, L. A., Lloyd, N. D., Llewellyn, E. J., and Degenstein, D. A.: Large volcanic aerosol load in the stratosphere linked to Asian monsoon transport, Science, 337, 78–81, https://doi.org/10.1126/science.1219371, 2012.
Brenot, H., Theys, N., Clarisse, L., van Geffen, J., van Gent, J., Van Roozendael, M., van der A, R., Hurtmans, D., Coheur, P.-F., Clerbaux, C., Valks, P., Hedelt, P., Prata, F., Rasson, O., Sievers, K., and Zehner, C.: Support to Aviation Control Service (SACS): an online service for near-real-time satellite monitoring of volcanic plumes, Nat. Hazards Earth Syst. Sci., 14, 1099–1123, https://doi.org/10.5194/nhess-14-1099-2014, 2014.
Brown, S. K., Crosweller, H. S., Sparks, R. S. J., Cottrell, E., Deligne, N. I., Guerrero, N. O., Hobbs, L., Kiyosugi, K., Loughlin, S. C., Siebert, L., and Takarada, S.: Characterisation of the Quaternary eruption record: Analysis of the Large Magnitude Explosive Volcanic Eruptions (LaMEVE) database, J. Appl. Volcanol., 3, 1–22, https://doi.org/10.1186/2191-5040-3-5, 2014.
Carboni, E., Grainger, R., Walker, J., Dudhia, A., and Siddans, R.: A new scheme for sulphur dioxide retrieval from IASI measurements: application to the Eyjafjallajökull eruption of April and May 2010, Atmos. Chem. Phys., 12, 11417–11434, https://doi.org/10.5194/acp-12-11417-2012, 2012.
Carn, S. A.: Multi-Satellite Volcanic Sulfur Dioxide L4 Long-Term Global Database V3, Greenbelt, MD, USA, Goddard Earth Science Data and Information Services Center (GES DISC), https://doi.org/10.5067/MEASURES/SO2/DATA404, 2019.
Carn, S. A. and Lopez, T. M.: Opportunistic validation of sulfur dioxide in the Sarychev Peak volcanic eruption cloud, Atmos. Meas. Tech., 4, 1705–1712, https://doi.org/10.5194/amt-4-1705-2011, 2011.
Carn, S. A., Clarisse, L., and Prata, A. J.: Multi-decadal satellite measurements of global volcanic degassing, J. Volcanol. Geoth. Res., 311, 99–134, https://doi.org/10.1016/j.jvolgeores.2016.01.002, 2016.
Carn, S. A., Fioletov, V. E., Mclinden, C. A., Li, C., and Krotkov, N. A.: A decade of global volcanic SO2 emissions measured from space, Sci. Rep.-UK, 7, 1–12, https://doi.org/10.1038/srep44095, 2017.
Cigala, V., Biondi, R., Prata, A. J., Steiner, A. K., Kirchengast, G., and Brenot, H.: GNSS Radio Occultation Advances the Monitoring of Volcanic Clouds: The Case of the 2008 Kasatochi Eruption, Remote Sens.-Basel, 11, 2199, https://doi.org/10.3390/rs11192199, 2019.
Clarisse, L., Hurtmans, D., Clerbaux, C., Hadji-Lazaro, J., Ngadi, Y., and Coheur, P.-F.: Retrieval of sulphur dioxide from the infrared atmospheric sounding interferometer (IASI), Atmos. Meas. Tech., 5, 581–594, https://doi.org/10.5194/amt-5-581-2012, 2012.
Clarisse, L., Coheur, P.-F., Theys, N., Hurtmans, D., and Clerbaux, C.: The 2011 Nabro eruption, a SO2 plume height analysis using IASI measurements, Atmos. Chem. Phys., 14, 3095–3111, https://doi.org/10.5194/acp-14-3095-2014, 2014.
Clerbaux, C., Boynard, A., Clarisse, L., George, M., Hadji-Lazaro, J., Herbin, H., Hurtmans, D., Pommier, M., Razavi, A., Turquety, S., Wespes, C., and Coheur, P.-F.: Monitoring of atmospheric composition using the thermal infrared IASI/MetOp sounder, Atmos. Chem. Phys., 9, 6041–6054, https://doi.org/10.5194/acp-9-6041-2009, 2009.
Cooke, M. C., Francis, P. N., Millington, S., Saunders, R., and Witham, C.: Detection of the Grímsvötn 2011 volcanic eruption plumes using infrared satellite measurements, Atmos. Sci. Lett., 15, 321–327, https://doi.org/10.1002/asl2.506, 2014.
Corradini, S., Merucci, L., Prata, A. J., and Piscini, A.: Volcanic ash and SO2 in the 2008 Kasatochi eruption: Retrievals comparison from different IR satellite sensors, J. Geophys. Res.-Atmos., 115, D00L21, https://doi.org/10.1029/2009JD013634, 2010.
de Moor, J. M., Kern, C., Avard, G., Muller, C., Aiuppa, A., Saballos, A., Ibarra, M., LaFemina, P., Protti, M., and Fischer, T. P.: A New Sulfur and Carbon Degassing Inventory for the Southern Central American Volcanic Arc: The Importance of Accurate Time-Series Data Sets and Possible Tectonic Processes Responsible for Temporal Variations in Arc-Scale Volatile Emissions, Geochem., Geophy. Geosy., 18, 4437–4468, https://doi.org/10.1002/2017GC007141, 2017.
Dikty, S., Richter, A., Bovensmann, H., Wittrock, F., Weber, M., Noël, S., Burrows, J. P., Munro, R., and Lang, R.: GOME-2 level 2 products at IUP Bremen and first results on the quantification of the effects of optical degradation, Meteorological Satellite Conference, Cordoba, Spain, 20–24 September 2010.
Doeringer, D., Eldering, A., Boone, C. D., González Abad, G., and Bernath, P. F.: Observation of sulfate aerosols and SO2 from the Sarychev volcanic eruption using data from the Atmospheric Chemistry Experiment (ACE), J. Geophys. Res.-Atmos., 117, D3, https://doi.org/10.1029/2011JD016556, 2012.
EOPAC Team: GNSS Radio Occultation Record (OPS 5.6 2001–2018), University of Graz, Austria, https://doi.org/10.25364/WEGC/OPS5.6:2019.1, 2019.
Fee, D., Yokoo, A., and Johnson, J. B.: Introduction to an open community infrasound dataset from the actively erupting Sakurajima Volcano, Japan, Seismol. Res. Lett., 85, 1151–1162, https://doi.org/10.1785/0220140051, 2014.
Flemming, J. and Inness, A.: Volcanic sulfur dioxide plume forecasts based on UV satellite retrievals for the 2011 Grímsvötn and the 2010 Eyjafjallajökull eruption, J. Geophys. Res.-Atmos., 118, 10–172, https://doi.org/10.1002/jgrd.50753, 2013.
Flentje, H., Claude, H., Elste, T., Gilge, S., Köhler, U., Plass-Dülmer, C., Steinbrecht, W., Thomas, W., Werner, A., and Fricke, W.: The Eyjafjallajökull eruption in April 2010 – detection of volcanic plume using in-situ measurements, ozone sondes and lidar-ceilometer profiles, Atmos. Chem. Phys., 10, 10085–10092, https://doi.org/10.5194/acp-10-10085-2010, 2010.
Foelsche, U., Scherllin-Pirscher, B., Ladstädter, F., Steiner, A. K., and Kirchengast, G.: Refractivity and temperature climate records from multiple radio occultation satellites consistent within 0.05 %, Atmos. Meas. Tech., 4, 2007–2018, https://doi.org/10.5194/amt-4-2007-2011, 2011.
Fromm, M., Kablick III, G., Nedoluha, G., Carboni, E., Grainger, R., Campbell, J., and Lewis, J.: Correcting the record of volcanic stratospheric aerosol impact: Nabro and Sarychev Peak, J. Geophys. Res.-Atmos., 119, 10–343, https://doi.org/10.1002/2014JD021507, 2014.
Ge, C., Wang, J., Carn, S., Yang, K., Ginoux, P., and Krotkov, N.: Satellite-based global volcanic SO2 emissions and sulfate direct radiative forcing during 2005–2012, J. Geophys. Res.-Atmos., 121, 3446–3464, https://doi.org/10.1002/2015JD023134, 2016.
Global Volcanism Program: available at: https://volcano.si.edu/, last access: 25 April 2020.
Griessbach, S., Hoffmann, L., Spang, R., and Riese, M.: Volcanic ash detection with infrared limb sounding: MIPAS observations and radiative transfer simulations, Atmos. Meas. Tech., 7, 1487–1507, https://doi.org/10.5194/amt-7-1487-2014, 2014.
Hajj, G. A., Ao, C. O., Iijima, B. A., Kuang, D., Kursinski, E. R., Mannucci, A. J., Meehan, T. K., Romans, L. J., de la Torre Juarez, M., and Yunck, T. P.: CHAMP and SAC-C atmospheric occultation results and intercomparisons, J. Geophys. Res.-Atmos., 109, D06109, https://doi.org/10.1029/2003JD003909, 2004.
Haywood, J. M., Jones, A., Clarisse, L., Bourassa, A., Barnes, J., Telford, P., Bellouin, N., Boucher, O., Agnew, P., Clerbaux, C., Coheur, P., Degenstein, D., and Braesicke, P.: Observations of the eruption of the Sarychev volcano and simulations using the HadGEM2 climate model, J. Geophys. Res.-Atmos., 115, D21212, https://doi.org/10.1029/2010JD014447, 2010.
Houghton, B. F., Swanson, D. A., Rausch, J., Carey, R. J., Fagents, S. A., and Orr, T. R.: Pushing the volcanic explosivity index to its limit and beyond: Constraints from exceptionally weak explosive eruptions at Kilauea in 2008, Geology, 41, 627–630, https://doi.org/10.1130/G34146.1, 2013.
Ivy, D. J., Solomon, S., Kinnison, D., Mills, M. J., Schmidt, A., and Neely, R. R.: The influence of the Calbuco eruption on the 2015 Antarctic ozone hole in a fully coupled chemistry-climate model, Geophys. Res. Lett., 44, 2556–2561, https://doi.org/10.1002/2016GL071925, 2017.
Journal of Geophysical Research Atmospheres special issue 2018: The 2008 Eruptions of Okmok and Kasatochi Volcanoes, Alaska, J. Geophys. Res.-Atmos., available at: https://agupubs.onlinelibrary.wiley.com/doi/toc/10.1002/(ISSN)2169-8996.VOLCANOES1 (last access: 25 April 2020), 2018.
Karagulian, F., Clarisse, L., Clerbaux, C., Prata, A. J., Hurtmans, D., and Coheur, P. F.: Detection of volcanic SO2, ash, and H2SO4 using the Infrared Atmospheric Sounding Interferometer (IASI), J. Geophys. Res.-Atmos., 115, D00L02, https://doi.org/10.1029/2009JD012786, 2010.
Kim, M.-H., Omar, A. H., Tackett, J. L., Vaughan, M. A., Winker, D. M., Trepte, C. R., Hu, Y., Liu, Z., Poole, L. R., Pitts, M. C., Kar, J., and Magill, B. E.: The CALIPSO version 4 automated aerosol classification and lidar ratio selection algorithm, Atmos. Meas. Tech., 11, 6107–6135, https://doi.org/10.5194/amt-11-6107-2018, 2018.
Kravitz, B., Robock, A., Bourassa, A., Deshler, T., Wu, D., Mattis, I., Finger, F., Hoffmann, A., Ritter, C., Bitar, L., Duck, T. J., and Barnes, J. E.: Simulation and observations of stratospheric aerosols from the 2009 Sarychev volcanic eruption, J. Geophys. Res.-Atmos., 116, D18, https://doi.org/10.1029/2010JD015501, 2011.
Kristiansen, N. I., Stohl, A., Prata, A. J., Richter, A., Eckhardt, S., Seibert, P., Hoffmann, A., Ritter, C., Bitar, L., Duck, T. J., and Stebel, K.: Remote sensing and inverse transport modeling of the Kasatochi eruption sulfur dioxide cloud, J. Geophys. Res.-Atmos., 115, D00L16, https://doi.org/10.1029/2009JD013286, 2010.
Kristiansen, N. I., Prata, A. J., Stohl, A., and Carn S. A.: Stratospheric volcanic ash emissions from the 13 February 2014 Kelut eruption, Geophys. Res. Lett., 42, 588–596, https://doi.org/10.1002/2014GL062307, 2015.
Krotkov, N. A., Schoeberl, M. R., Morris, G. A., Carn, S., and Yang, K.: Dispersion and lifetime of the SO2 cloud from the August 2008 Kasatochi eruption, J. Geophys. Res.-Atmos., 115, D00L20, https://doi.org/10.1029/2010JD013984, 2010.
Kursinski, E. R., Haij, G. A., Schofield, J. T., and Linfield, R. P.: Observing Earth's atmosphere with radio occultation measurements using the Global Positioning System, J. Geophys. Res.-Atmos., 102, 423–429, https://doi.org/10.1029/97JD01569, 1997.
Lang, R., Munro, R., Livschitz, Y., Dyer, R., and Lacan, A.: GOME-2 FM3 long-term in-orbit degradation – Basic signatures after 2nd throughput test, Tech Rep. EUM.OPS-EPS.DOC.09.0464, Eur. Organ. for the Exploit. of Meteorol. Satell., Darmstadt, Germany, 2009.
Lopes, F. J. S., Silva, J. J., Antuña Marrero, J. C., Taha, G., and Landulfo, E.: Synergetic aerosol layer observation after the 2015 Calbuco volcanic eruption event, Remote Sens.-UK, 11, 195, https://doi.org/10.3390/rs11020195, 2019.
Luntama, J. P., Kirchengast, G., Borsche, M., Foelsche, U., Steiner, A., Healy, S., von Engeln, A., O'Clerigh, E., and Marquardt, C.: Prospects of the EPS GRAS mission for operational atmospheric applications, B. Am. Meteorol. Soc., 89, 18631875, https://doi.org/10.1175/2008BAMS2399.1, 2008.
Marenco, F., Johnson, B., Turnbull, K., Newman, S., Haywood, J., Webster, H., and Ricketts, H.: Airborne lidar observations of the 2010 Eyjafjallajökull volcanic ash plume, J. Geophys. Res.-Atmos., 116, D20, https://doi.org/10.1029/2011JD016396, 2011.
Marzano, F. S., Lamantea, M., Montopoli, M., Herzog, M., Graf, H., and Cimini, D.: Microwave remote sensing of the 2011 Plinian eruption of the Grímsvötn Icelandic volcano, Remote Sens. Environ., 129, 168–184, https://doi.org/10.1016/j.rse.2012.11.005, 2013.
Marzano, F. S., Corradini, S., Mereu, L., Kylling, A., Montopoli, M., Cimini, D., Merucci, L., and Stelitano, D.: Multisatellite Multisensor Observations of a Sub-Plinian Volcanic Eruption: The 2015 Calbuco Explosive Event in Chile, IEEE T. Geosci. Remote, 56, 2597–2612, https://doi.org/10.1109/TGRS.2017.2769003, 2018.
Moxnes, E. D., Kristiansen, N. I., Stohl, A., Clarisse, L., Durant, A., Weber, K., and Vogel, A.: Separation of ash and sulfur dioxide during the 2011 Grímsvötn eruption, J. Geophys. Res.-Atmos., 119, 7477–7501, hhttps://doi.org/10.1002/2013JD021129, 2014.
Munro, R., Eisinger, M., Anderson, C., Callies, J., Corpaccioli, E., Lang, R., Lefebvre, A., Livschitz, Y., and Pérez Albiñana, A.: GOME-2 on MetOp, in: Proceedings of The 2006 EUMETSAT Meteorological Satellite Conference, 12–16 June 2006, Helsinki, Finland, 48, 2006.
Newhall, C. G. and Self, S.: The volcanic explosivity index (VEI) an estimate of explosive magnitude for historical volcanism, J. Geophys. Res.-Ocean, 87, 1231, https://doi.org/10.1029/JC087iC02p01231, 1982.
Nowlan, C. R., Liu, X., Chance, K., Cai, Z., Kurosu, T. P., Lee, C., and Martin, R. V.: Retrievals of sulfur dioxide from the Global Ozone Monitoring Experiment 2 (GOME-2) using an optimal estimation approach: Algorithm and initial validation, J. Geophys. Res.-Atmos., 116, D18301, https://doi.org/10.1029/2011JD015808, 2011.
Pardini, F., Burton, M., Arzilli, F., La Spina, G., and Polacci, M.: SO2 emissions, plume heights and magmatic processes inferred from satellite data: The 2015 Calbuco eruptions, J. Volcanol. Geoth. Res., 361, 12–24, https://doi.org/10.1016/j.jvolgeores.2018.08.001, 2018.
Picquout, A., Lavigne, F., Mei, E. T. W., Grancher, D., Noer, C., Vidal, C. M., and Hadmoko, D. S.: Air traffic disturbance due to the 2010 Merapi volcano eruption, J. Volcanol.Geoth. Res., 261, 366–375, https://doi.org/10.1016/j.jvolgeores.2013.04.005, 2013.
Platt, U. and Stutz, J.: Differential optical absorption spectroscopy: Principles and Applications, Springer, Berlin and Heidelberg, Germany, 2008.
Prata, A. J. and Bernardo, C.: Retrieval of volcanic SO2 column abundance from Atmospheric Infrared Sounder data, J. Geophys. Res.-Atmos., 112, D20204, https://doi.org/10.1029/2006JD007955, 2007.
Prata, A. J. and Prata, A. T.: Eyjafjallajökull volcanic ash concentrations determined using Spin Enhanced Visible and Infrared Imager measurements, J. Geophys. Res.-Atmos., 117, D20, https://doi.org/10.1029/2011JD016800, 2012.
Prata, A. J., Gangale, G., Clarisse, L., and Karagulian, F.: Ash and sulfur dioxide in the 2008 eruptions of Okmok and Kasatochi: Insights from high spectral resolution satellite measurements, J. Geophys. Res.-Atmos., 115, D00L18, https://doi.org/10.1029/2009JD013556, 2010.
Prata, F., Woodhouse, M., Huppert, H. E., Prata, A., Thordarson, T., and Carn, S.: Atmospheric processes affecting the separation of volcanic ash and SO2 in volcanic eruptions: inferences from the May 2011 Grímsvötn eruption, Atmos. Chem. Phys., 17, 10709–10732, https://doi.org/10.5194/acp-17-10709-2017, 2017.
Pugnaghi, S., Guerrieri, L., Corradini, S., and Merucci, L.: Real time retrieval of volcanic cloud particles and SO2 by satellite using an improved simplified approach, Atmos. Meas. Tech., 9, 3053–3062, https://doi.org/10.5194/amt-9-3053-2016, 2016.
Rix, M., Valks, P., Hao, N., Loyola, D. G., Schlager, H., Huntrieser,H. H., Flemming, J., Koehler, U., Schumann, U., and Inness, A.: Volcanic SO2, BrO and plume height estimations using GOME-2 satellite measurements during the eruption of Eyjafjallajökull in May 2010, J. Geophys. Res.-Atmos., 117, D00U19, https://doi.org/10.1029/2011JD016718, 2012.
Robock, A.: Volcanic eruptions and climate, Rev. Geophys., 38, 191–219, https://doi.org/10.1029/1998RG000054, 2000.
Robock, A.: Chapter 53 – Climatic Impacts of Volcanic Eruptions, in: The Encyclopedia of Volcanoes (Second Edition), edited by: Sigurdsson, H., Academic Press, Amsterdam, pp. 935–942, https://doi.org/10.1016/B978-0-12-385938-9.00053-5, 2015.
Rybin, A., Chibisova, M., Webley, P., Steensen, T., Izbekov, P., Neal, C., and Realmuto, V.: Satellite and ground observations of the June 2009 eruption of Sarychev Peak volcano, Matua Island, Central Kuriles, B. Volcanol., 73, 1377–1392, https://doi.org/10.1007/s00445-011-0481-0, 2011.
Scherllin-Pirscher, B., Steiner, A. K., Kirchengast, G., Kuo, Y.-H., and Foelsche, U.: Empirical analysis and modeling of errors of atmospheric profiles from GPS radio occultation, Atmos. Meas. Tech., 4, 1875–1890, https://doi.org/10.5194/amt-4-1875-2011, 2011.
Schnetzler, C. C., Bluth, G. J. S., Krueger, A. J., and Walter, L. S.: A proposed volcanic sulfur dioxide index (VSI), J. Geophys. Res.-Sol. Ea., 102, 20087–20091, https://doi.org/10.1029/97JB01142, 1997.
Sigmarsson, O., Haddadi, B., Carn, S., Moune, S., Gudnason, J., Yang, K., and Clarisse, L.: The sulfur budget of the 2011 Grímsvötn eruption, Iceland, Geophys. Res. Lett., 40, 6095–6100, https://doi.org/10.1002/2013GL057760, 2013.
Spinei, E., Carn, S. A., Krotkov, N. A., Mount, G. H., Yang, K., and Krueger, A.: Validation of ozone monitoring instrument SO2 measurements in the Okmok volcanic cloud over Pullman, WA, July 2008, J. Geophys. Res.-Atmos., 115, D00L08, https://doi.org/10.1029/2009JD013492, 2010.
Stocker, M., Ladstädter, F., Wilhelmsen, H., and Steiner, A. K.: Quantifying Stratospheric Temperature Signals and Climate Imprints From Post-2000 Volcanic Eruptions, Geophys. Res. Lett., 46, 12486–12494, https://doi.org/10.1029/2019GL084396, 2019.
Stohl, A., Prata, A. J., Eckhardt, S., Clarisse, L., Durant, A., Henne, S., Kristiansen, N. I., Minikin, A., Schumann, U., Seibert, P., Stebel, K., Thomas, H. E., Thorsteinsson, T., Tørseth, K., and Weinzierl, B.: Determination of time- and height-resolved volcanic ash emissions and their use for quantitative ash dispersion modeling: the 2010 Eyjafjallajökull eruption, Atmos. Chem. Phys., 11, 4333–4351, https://doi.org/10.5194/acp-11-4333-2011, 2011.
Stone, K. A., Solomon, S., Kinnison, D. E., Pitts, M. C., Poole, L. R., Mills, M. J., Schmidt, A., Neely, R. R., Ivy, D., Schwartz, M. J., Vernier, J.-P., Johnson, B. J., Tully, M. B., Klekociuk, A. R., König‐Langlo, G., and Hagiya, S.: Observing the impact of Calbuco volcanic aerosols on South Polar ozone depletion in 2015, J. Geophys. Res.-Atmos., 122, 11–862, https://doi.org/10.1002/2017JD026987, 2017.
Surono, Jousset, P., Pallister, J., Boichu, M., Buongiorno, M. F., Budisantoso, A., Costa, F., Andreastuti, S., Prata, F., Schneider, D., Clarisse, L., Humaida, H., Sumarti, S., Bignami, C., Griswold, J., Carn, S., Oppenheimer, C., and Lavigne, F.: The 2010 explosive eruption of Java's Merapi volcano – A “100-year” event, J. Volcanol. Geoth. Res., 241/242, 121–135, https://doi.org/10.1016/j.jvolgeores.2012.06.018, 2012.
Susskind, J., Barnet, C. D., and Blaisdell, J. M.: Retrieval of atmospheric and surface parameters from AIRS/AMSU/HSB data in the presence of clouds, IEEE T. Geosci. Remote, 41, 390–409, https://doi.org/10.1109/TGRS.2002.808236, 2003.
Telling, J., Flower, V. J. B., and Carn, S. A.: A multi-sensor satellite assessment of SO2 emissions from the 2012–13 eruption of Plosky Tolbachik volcano, Kamchatka, J. Volcanol. Geoth. Res., 307, 98–106, https://doi.org/10.1016/j.jvolgeores.2015.07.010, 2015.
The 2008 Eruptions of Okmok and Kasatochi Volcanoes, Alaska, J. Geophys. Res.-Atmos., Special issue, Wiley, AGU publications, available at: https://agupubs.onlinelibrary.wiley.com/doi/toc/10.1002/(ISSN)2169-8996.VOLCANOES1 (last access: 25 April 2020), 7 February 2018.
Theys, N., Campion, R., Clarisse, L., Brenot, H., van Gent, J., Dils, B., Corradini, S., Merucci, L., Coheur, P.-F., Van Roozendael, M., Hurtmans, D., Clerbaux, C., Tait, S., and Ferrucci, F.: Volcanic SO2 fluxes derived from satellite data: a survey using OMI, GOME-2, IASI and MODIS, Atmos. Chem. Phys., 13, 5945–5968, https://doi.org/10.5194/acp-13-5945-2013, 2013.
Theys, N., De Smedt, I., Van Roozendael, M., Froidevaux, L., Clarisse, L., and Hendrick, F.: First satellite detection of volcanic OClO after the eruption of Puyehue-Cordón Caulle, Geophys. Res. Lett., 41, 667–672, https://doi.org/10.1002/2013GL058416, 2014.
Theys, N., Koukouli, M., Pinardi, G., Van Roozendael, M., Balis, D., Hedelt, P., and Valks, P.: O3M SAF VALIDATION REPORT, SAF/O3M/IASB/VR/SO2/11, 2015.
Tournigand, P.-Y., Cigala, V., Lasota, E., Hammouti, M., Clarisse, L., Brenot, H., Prata, F., Kirchengast, G., Steiner, A., and Biondi, R.: A comprehensive archive of large SO2 volcanic clouds in 2000s, GFZ Data Services, https://doi.org/10.5880/fidgeo.2020.016, 2020a.
Tournigand, P.-Y., Cigala, V., Prata, F., Steiner, A., Kirchengast, G., Brenot, H., Clarisse, L., and Biondi, R.: the 2015 Calbuco volcanic cloud detection using GNSS radio occultation and satellite lidar, in: IGARSS 2020 Proceedings, International Geoscience and Remote sensing Symposium, 26 September–2 October 2020b.
Turner, M. B., Bebbington, M. S., Cronin, S. J., and Stewart, R. B.: Merging eruption datasets: Building an integrated Holocene eruptive record for Mt Taranaki, New Zealand, B. Volcanol., 71, 903–918, https://doi.org/10.1007/s00445-009-0274-x, 2009.
Vernier, J.-P., Fairlie, T. D., Deshler, T., Natarajan, M., Knepp, T., Foster, K., Wienhold, F. G., Bedka, K. M., Thomason, L., and Trepte, C.: In situ and space-based observations of the Kelud volcanic plume: The persistence of ash in the lower stratosphere, J. Geophys. Res.-Atmos., 121, 11–104, https://doi.org/10.1002/2016JD025344, 2016.
Wickert, J., Reigber, C., Beyerle, G., König, R., Marquardt, C., Schmidt, T., Grunwaldt, L., Galas, R., Meehan, T. K., Melbourne, W. G., and Hocke, K.: Atmosphere sounding by GPS radio occultation: First results from CHAMP, Geophys. Res. Lett., 28, 3263–3266, https://doi.org/10.1029/2001GL013117, 2001.
Williams-Jones, G. and Rymer, H.: Chapter 57 – Hazards of Volcanic Gases, in: The Encyclopedia of Volcanoes (Second Edition), edited by: Sigurdsson, H., Academic Press, Amsterdam, pp. 985–992, https://doi.org/10.1016/B978-0-12-385938-9.00057-2, 2015.
Winker, D. M., Vaughan, M. A., Omar, A., Hu, Y., Powell, K. A., Liu, Z., Hunt, W. H., and Young, S. A.: Overview of the CALIPSO mission and CALIOP data processing algorithms, J. Atmos. Ocean. Tech., 26, 2310–2323, https://doi.org/10.1175/2009JTECHA1281.1, 2009.
Yang, K., Liu, X., Bhartia, P. K., Krotkov, N., Carn, S., Hughes, E., Krueger, A., Spurr, R., and Trahan, S.: Direct retrieval of sulfur dioxide amount and altitude from spaceborne hyperspectral UV measurements: Theory and application, J. Geophys. Res.-Atmos, 115, D00L09, https://doi.org/10.1029/2010JD013982, 2010.
Zeng, Z., Sokolovskiy, S., Schreiner, W. S., and Hunt, D.: Representation of Vertical Atmospheric Structures by Radio Occultation Observations in the Upper Troposphere and Lower Stratosphere: Comparison to High-Resolution Radiosonde Profiles, J. Atmos. Ocean. Tech., 36, 655–670, https://doi.org/10.1175/JTECH-D-18-0105.1, 2019.
Zhu, Y., Toon, O. B., Kinnison, D., Harvey, V. L., Mills, M. J., Bardeen, C. G., Pitts, M., Bègue, N., Renard, J.-B., Berthet, G., and Jégou, F.: Stratospheric aerosols, polar stratospheric clouds, and polar ozone depletion after the Mount Calbuco eruption in 2015, J. Geophys. Res.-Atmos., 123, 12–308, https://doi.org/10.1029/2018JD028974, 2018.
Zuev, V. V., Savelieva, E. S., and Parezheva, T. V.: Study of the Possible Impact of the Calbuco Volcano Eruption on the Abnormal Destruction of Stratospheric Ozone over the Antarctic in Spring 2015, Atmospheric and Oceanic Optics, 31, 665–669, https://doi.org/10.1134/S1024856018060192, 2018.