the Creative Commons Attribution 4.0 License.
the Creative Commons Attribution 4.0 License.
 | 25 Nov 2020
Early-season mapping of winter wheat in China based on Landsat and Sentinel images
Jie Dong
Yangyang Fu
Jingjing Wang
Haifeng Tian
Shan Fu
Zheng Niu
Wei Han
Yi Zheng
Jianxi Huang
Wenping Yuan
Early-season crop identification is of great importance for monitoring crop growth and predicting yield for decision makers and private sectors. As one of the largest producers of winter wheat worldwide, China outputs more than 18 % of the global production of winter wheat. However, there are no distribution maps of winter wheat over a large spatial extent with high spatial resolution. In this study, we applied a phenology-based approach to distinguish winter wheat from other crops by comparing the similarity of the seasonal changes of satellite-based vegetation index over all croplands with a standard seasonal change derived from known winter wheat fields. Especially, this study examined the potential of early-season large-area mapping of winter wheat and developed accurate winter wheat maps with 30 m spatial resolution for 3 years (2016–2018) over 11 provinces, which produce more than 98 % of the winter wheat in China. A comprehensive assessment based on survey samples revealed producer's and user's accuracies higher than 89.30 % and 90.59 %, respectively. The estimated winter wheat area exhibited good correlations with the agricultural statistical area data at the municipal and county levels. In addition, the earliest identifiable time of the geographical location of winter wheat was achieved by the end of March, giving a lead time of approximately 3 months before harvest, and the optimal identifiable time of winter wheat was at the end of April with an overall accuracy of 89.88 %. These results are expected to aid in the timely monitoring of crop growth. The 30 m winter wheat maps in China are available via an open-data repository (DOI: https://doi.org/10.6084/m9.figshare.12003990, Dong et al., 2020a).
- Article
(8735 KB) - Full-text XML
- BibTeX
- EndNote


Wheat is one of the most important cereal crops in the world (FAOSTAT, 2018; Guo et al., 2019). According to the statistics provided by the Food and Agriculture Organization (FAO), the harvested area of wheat reached 215×106 ha in 2018 worldwide, accounting for 30 % of the global grain area and 29 % of the grain production (FAOSTAT, 2018). As a major type of wheat, winter wheat dominates the wheat production in many countries including China, United States, France, Russia, Ukraine, Argentina, and Australia (National Bureau of Statistics of China, 2018; USDA-ERS, 2018). It accounts for more than 70 % of the total wheat production in the United States (USDA-ERS, 2018). Quickly acquiring the detailed location and planting area of winter wheat provides the basis for forecasting winter wheat yield, understanding winter wheat management, and assessing food security (Franch et al., 2015, 2019; Huang et al., 2015; Wang et al., 2019; Zhang et al., 2019; Zhuo et al., 2019).
Satellite-based methods are an effective and quick tool for crop mapping owing to their great spatial coverage and temporal continuity (Belgiu and Csillik, 2017; Griffiths et al., 2019; Jin et al., 2019). Most studies have used supervised classification methods, such as decision tree classification (Brown and Pervez, 2014; Wardlow and Egbert, 2008), and supervised machine learning methods (Yang et al., 2019), such as random forests (Wang et al., 2019; Yin et al., 2020), support vector machines (Zheng et al., 2015), and neural networks (Cai et al., 2018; Zhong et al., 2019), to distinguish crop types. However, these methods strongly depend on the selection of the training samples, which is time-consuming and labor-intensive (Skakun et al., 2017b). For instance, the 30 m resolution Cropland Data Layer (CDL) product generated by the USDA (United States Department of Agriculture) National Agricultural Statistics Service (NASS) classified more than 100 types of crops grown in the United States using the decision tree classification method (Boryan et al., 2011). The CDL product uses a large volume of USDA Common Land Unit (CLU) data as training samples, which are renewed every year. In Nebraska alone, more than 250 000 CLU polygon records were used to train and validate the CDL product (Boryan et al., 2011). Such large volumes of CLU data can only be acquired with government support and are usually confidential (Boryan et al., 2011). Therefore, the accuracy of national and subnational crop classification products based on supervised classification algorithms is limited because of the lack of training datasets (Petitjean et al., 2012).
As an alternative approach, several studies have used phenological characteristics as a metric for identifying geographic locations of winter wheat (Qiu et al., 2017; Skakun et al., 2017b; Wardlow et al., 2007). The common method differentiates winter wheat from other crops based on the differences in key phenological phases (e.g., tillering, heading, and harvesting) in combination with spectral signatures (Pan et al., 2012; Skakun et al., 2017a). Some studies integrate accumulated growing degree day (GDD) to consider the phenology difference to reduce phenology variability due to different climatic conditions (Franch et al., 2015; Skakun et al., 2017b; Zhong et al., 2014). Other methods like dynamic time warping (DTW) have been proven to be an effective solution for mapping crop distribution, e.g., for identifying rice paddy fields (Guan et al., 2016) and classifying vegetables types (Li and Bijker, 2019). DTW was initially designed for speech recognition (Sakoe and Chiba, 1978). Maus et al. (2016) proposed a time-weighted version of the DTW method, namely time-weighted dynamic time warping (TWDTW), which accounts for seasonality in crop types, thus further improving the classification accuracy. Unlike supervised classification methods, these methods require very low volumes of training data, thus substantially reducing the need for field surveys (Belgiu and Csillik, 2017).
China produces approximately one-sixth of the world's wheat in one-tenth of the world's wheatland (FAOSTAT, 2018), with winter wheat constituting 95 % of the total wheat production in China (National Bureau of Statistics of China, 2018). Numerous studies have been conducted to identify the cultivation map of winter wheat at county (Pan et al., 2012), province (He et al., 2019), and regional scales (Wu et al., 2007). Significant efforts have been made to generate a planting area map of winter wheat over the large regions of China. Based on MODIS (Moderate Resolution Imaging Spectroradiometer) surface reflectance products, Qiu et al. (2017) used the differences in the enhanced vegetation index before and after heading dates to develop two indicators to map winter wheat in the major winter wheat producing regions of China. A recent study generated a 30 m resolution distribution map of winter crop, instead of winter wheat over the main producing areas in China using the decision tree classification method (Tian et al., 2019). However, several limitations in existing winter wheat maps remain. First, previous studies showed that the MODIS dataset failed to identify the planting areas of winter wheat because of the relatively low spatial resolution (Tian et al., 2019). In China, because of the large population and implementation of household responsibilities, farmers have the freedom to select the type of crop they wish to plant. The planting area per household is only 1.37 ha on average (Guo, 2008), which accounts for 5 % of a 500 m MODIS pixel. Therefore, identification methods with low spatial resolution data (e.g., MODIS dataset) will result in large misclassifications (Qiu et al., 2017). Second, identifications based on high-spatial-resolution satellite datasets still show large uncertainty in several regions. For example, based on the Landsat 7, Landsat 8, and Sentinel-2 images with a spatial resolution of 30 m, Tian et al. (2019) found a relative error greater than 50 % in identifying the planting areas compared to statistical data for Hubei and Shanxi provinces.
Especially, identifying the geographic location and areas of winter wheat as early as possible is important for monitoring crop growth, simulating crop water use, and meeting the timeliness requirement of yield predictions (Chipanshi et al., 2015; Q. Song et al., 2017). Under the background of climate change, the frequencies of extreme weather events and natural disasters are expected to increase (Trenberth et al., 2014; Zambrano et al., 2018). Therefore, early mapping of crop distribution is urgently necessary for policymakers to reduce economic loss and assess food security (Inglada et al., 2016). Identifying the crop distribution in the early-season period is more challenging than that by the end of the growing season because of the limited input information.
In this research, we used a phenology-based method to identify the geographic locations of winter wheat in China and produced a 30 m resolution winter wheat map for the period of 2016–2018. Moreover, we explored the potential for early-season mapping of the planting areas of winter wheat and determined the earliest identifiable time and optimal identifiable time. The identification accuracy was assessed based on field surveys, visual interpretation results of very high-spatial resolution images, and agricultural statistical data. The proposed method can generate winter wheat maps that can be updated annually, proving a useful tool for crop management and policymaking.
2.1 Study area
This study identified planting areas of winter wheat for the period of 2016–2018 in 11 provinces covering an area of 390×106 ha: Henan (HN), Shandong (SD), Anhui (AH), Jiangsu (JS), Hebei (HB), Hubei (HuB), Shanxi (SX), Shaanxi (SAX), Sichuan (SC), Xinjiang (XJ), and Gansu (GS) (Fig. 1). These provinces are the most important winter-wheat-producing regions of China, constituting 96 % of the total planting areas with 21.6×10⁶ ha and 98 % of the total production of winter wheat in China with 125×106 t reported in 2017 (National Bureau of Statistics of China, 2018).
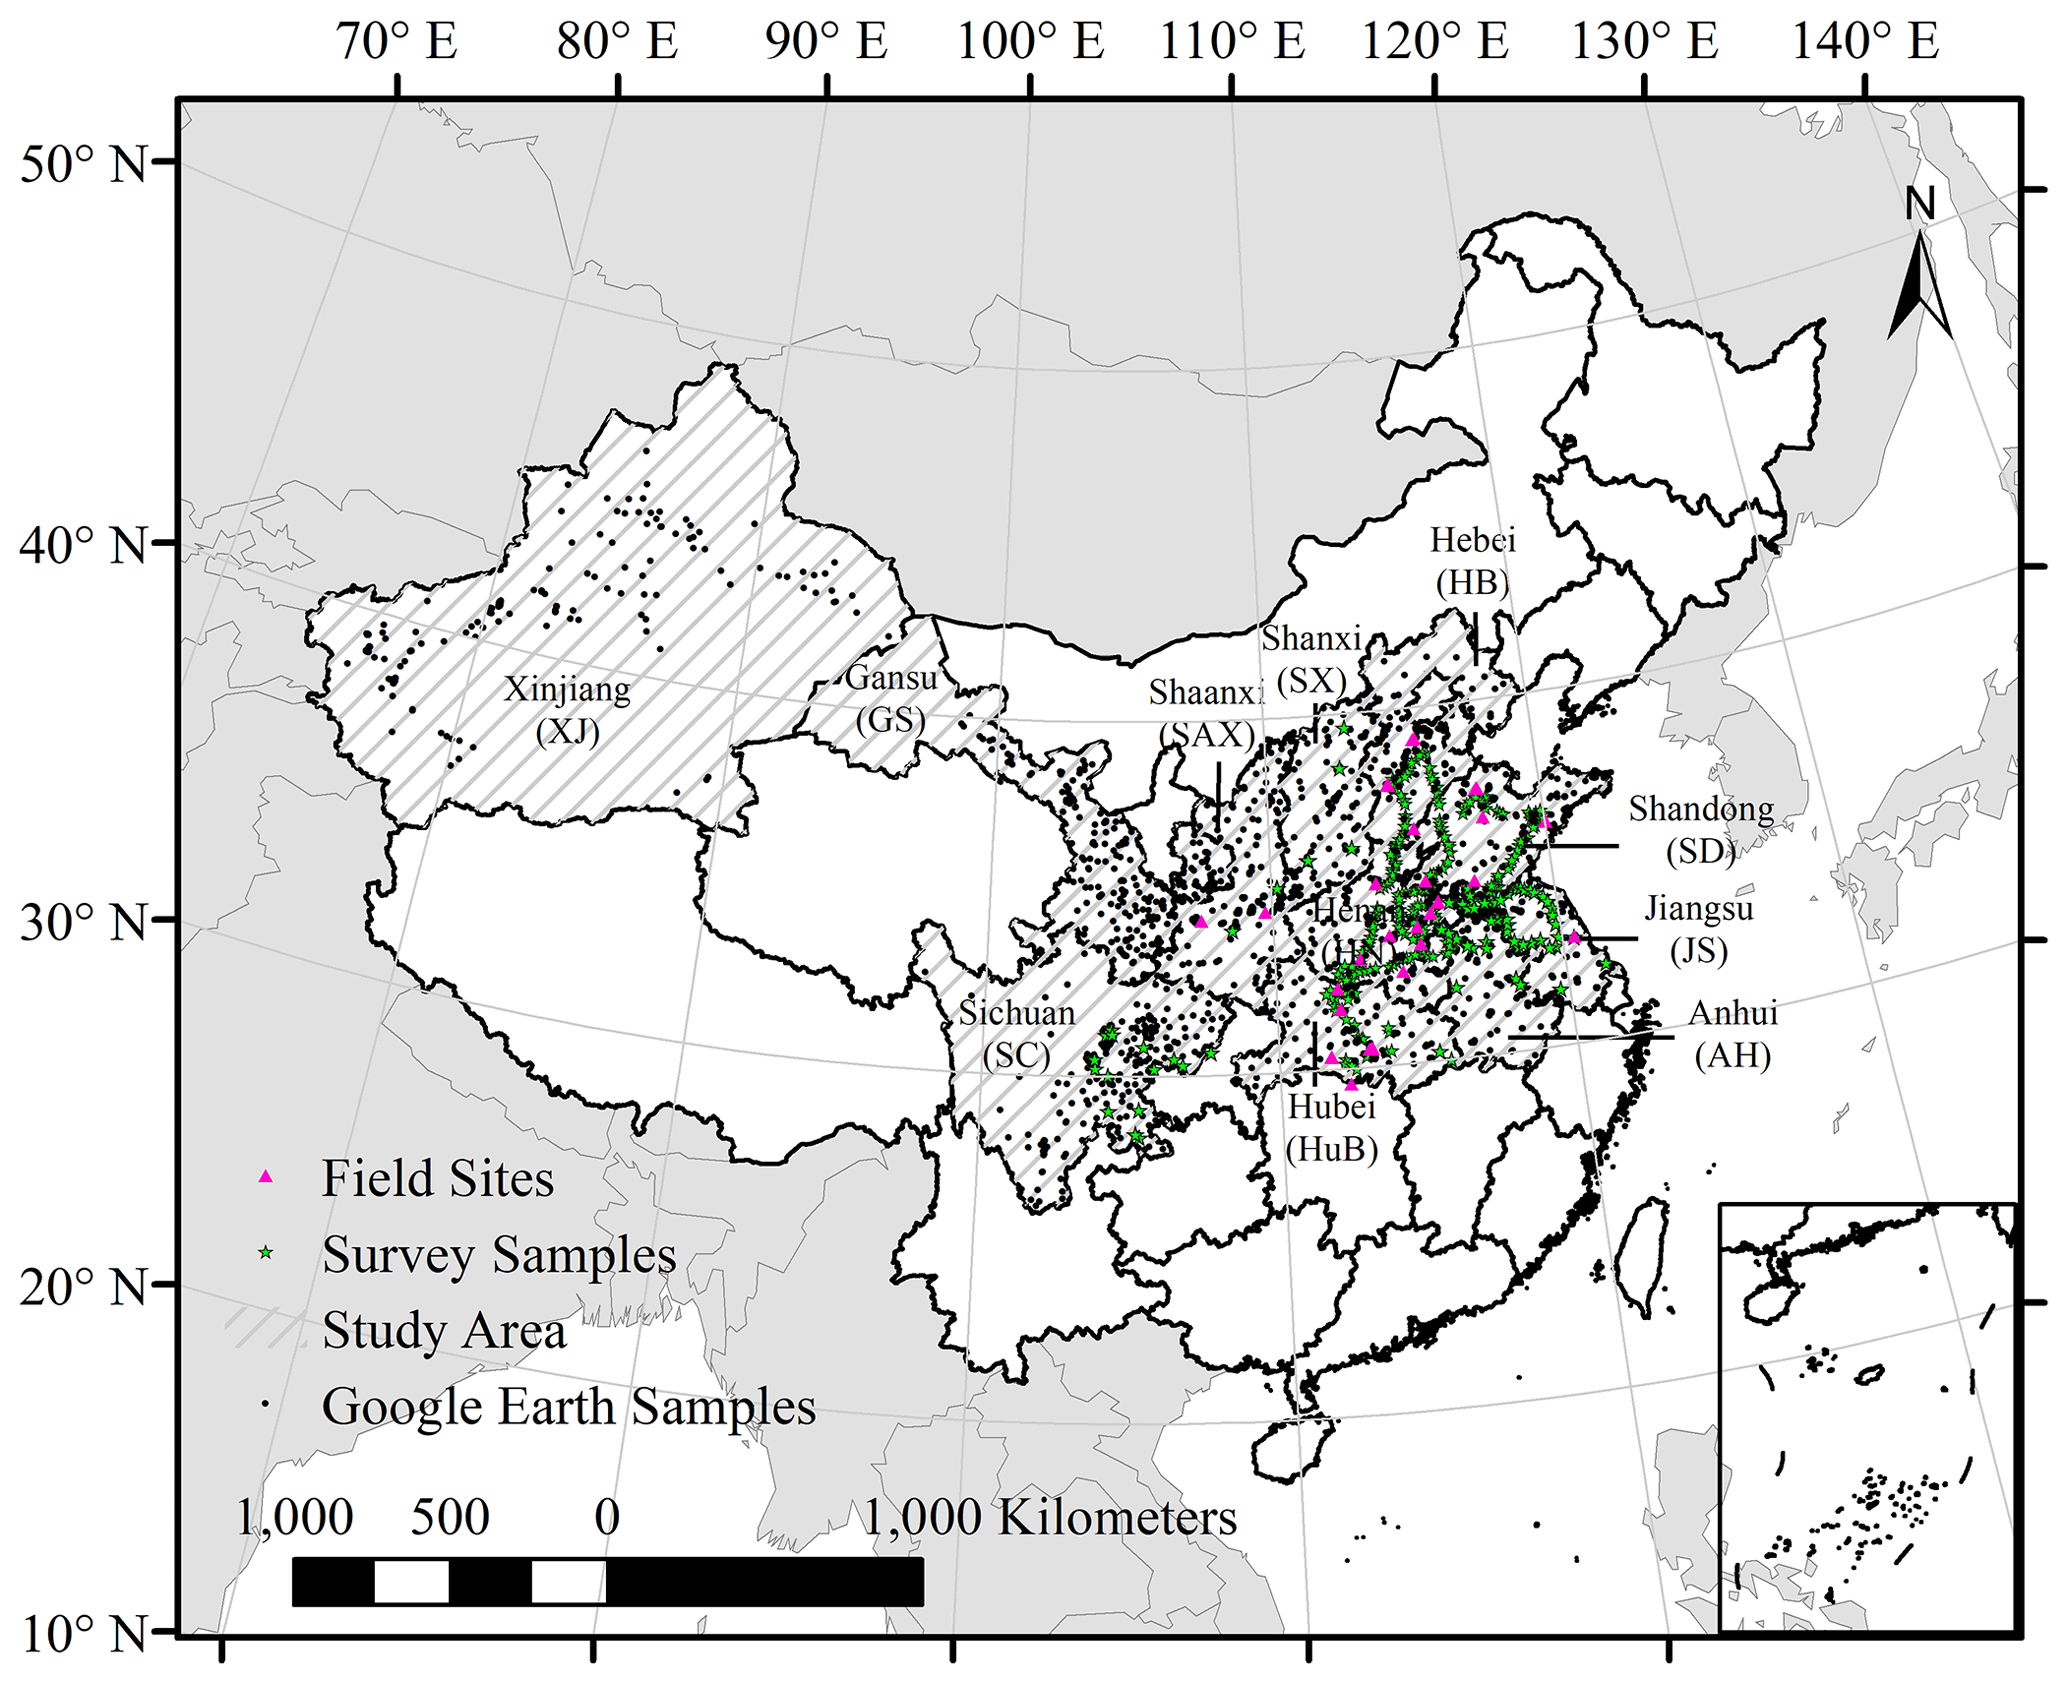
Figure 1Study area spans 11 provinces over China (the region covered by oblique lines). The solid black lines represent the boundary of the provinces. The black dots indicate survey sites obtained from Google Earth; the red triangles indicate field survey sites; and each site covers 1 km2. The green five-pointed stars show field survey samples. Provincial administrative boundary data and global country administrative boundary data are sourced from http://www.resdc.cn/DOI/ (last access: 1 December 2019) © Institute of Geographic Sciences and Natural Resources Research, Chinese Academy Sciences.
2.2 Method
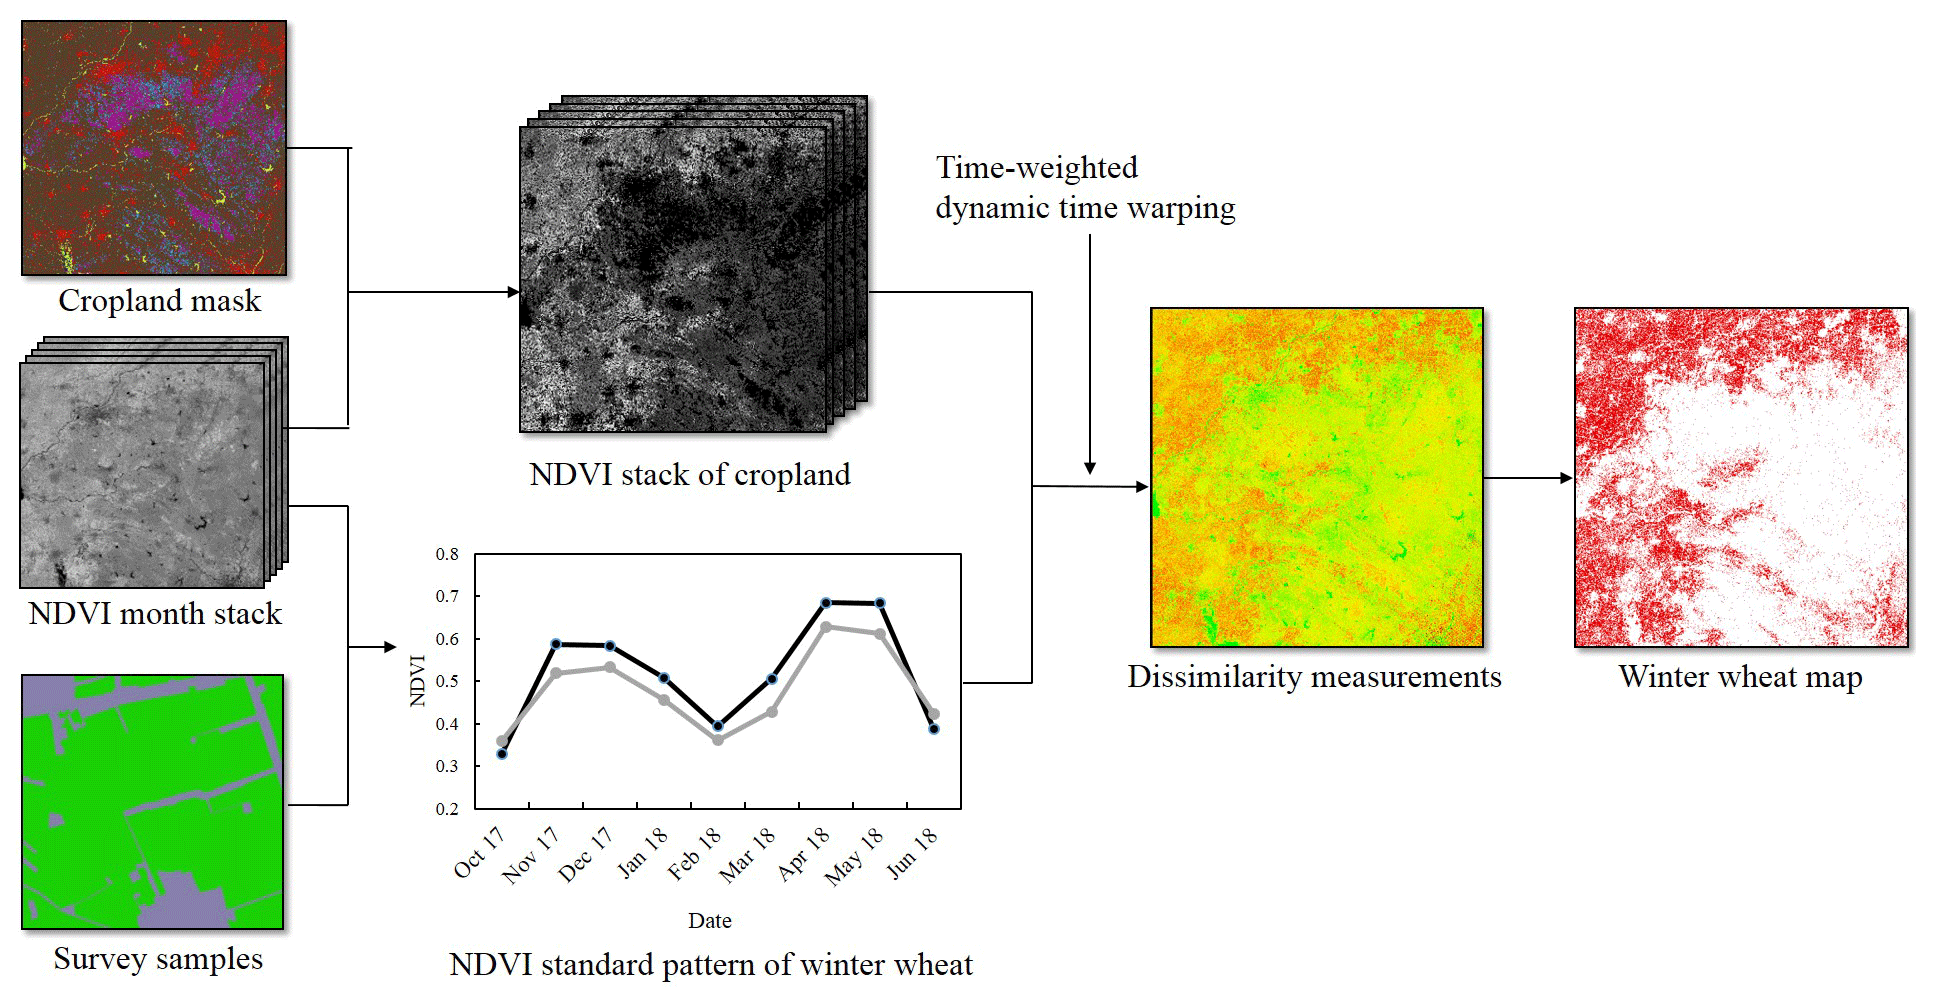
The methodological workflow consists of the following steps: (1) image preprocessing to construct monthly maximum composite NDVI (normalized difference vegetation index) images and extraction of cropland based on the FROM-GLC (Finer Resolution Observation and Monitoring of Global Land Cover) product (see Sect. 2.3 for more details); (2) data processing, which produces standard seasonal change of NDVI for winter wheat for each province based on the winter wheat samples; (3) winter wheat identification, where TWDTW is used to measure the similarity of seasonal changes of NDVI for known winter wheat fields with investigated fields, and area statistical data use at the province level to determine the thresholds of similarity measurements; and (4) evaluation for assessing the classification accuracies (Fig. 2).
2.2.1 Time-weighted dynamic time warping
In this study, we used the time-weighted dynamic time warping (TWDTW) method to identify the planting locations and areas of winter wheat. The TWDTW is an improved version of the DTW algorithm (Petitjean et al., 2012; Sakoe and Chiba, 1978). In the DTW algorithm, the distance (i.e., cost) (Fig. 3a) between two time series, namely series X of known winter wheat fields and series Y of unknown land cover, is calculated by warping the series Y via stretching or shortening the time dimension (Fig. 3b and c), in order to find the optimal warping path, which is the minimum distance between the two series. Compared to other similarity-based methods, such as Euclidean distance, the DTW is more advantageous in that it can flexibly deal with the temporal distortions associated with seasonal change, such as amplitude, time scaling, or shifting (Lhermitte et al., 2011). Taking the seasonal change in land cover types into consideration, Maus et al. (2016) added a time constraint to the DTW (i.e., TWDTW) to balance shape matching and phenological change, thus further increasing identification reliability contrast with the DTW method.
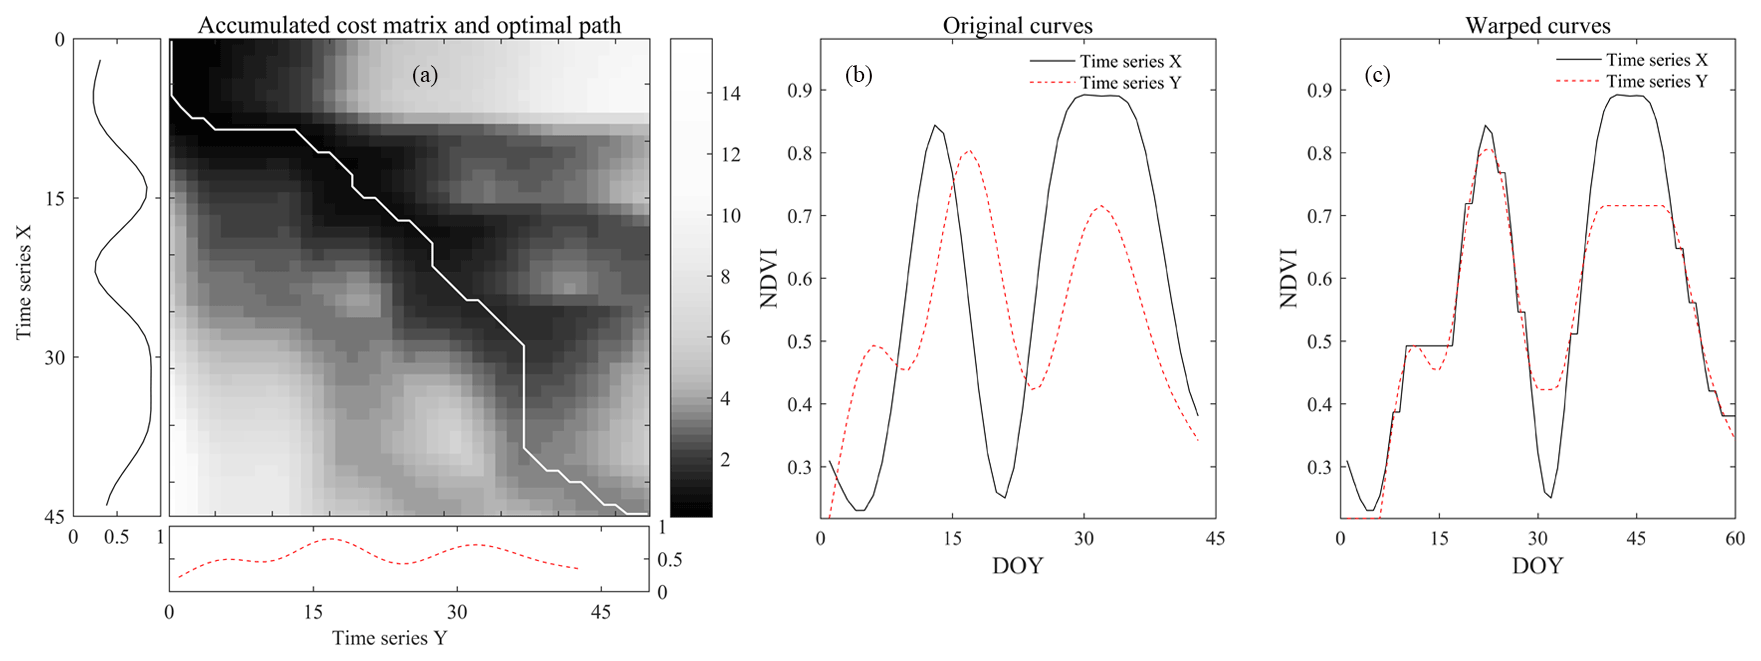
Figure 3(a) Accumulated cost matrix and optimal warping path between two NDVI sequences and (b, c) original and warped time series, respectively. DOY: day of year.
In order to use the TWDTW method, first, the standard seasonal change curve of NDVI of winter wheat retrieved at some known winter wheat fields is required (Fig. 4). Taking each province as a unit, the dissimilarity values can then be calculated by comparing the seasonal change in NDVI of each investigated pixel with the standard seasonal curve of winter wheat in a given province. The pixels with low dissimilarity values have a higher probability of being winter wheat. In this research, we employ the area statistical data of winter wheat at the province level to determine the thresholds of dissimilarity. The pixels (Nth) having the lowest dissimilarity values are considered winter wheat in a given province, and the total area of all N pixels should be equal to the statistical area of winter wheat in the investigated province.
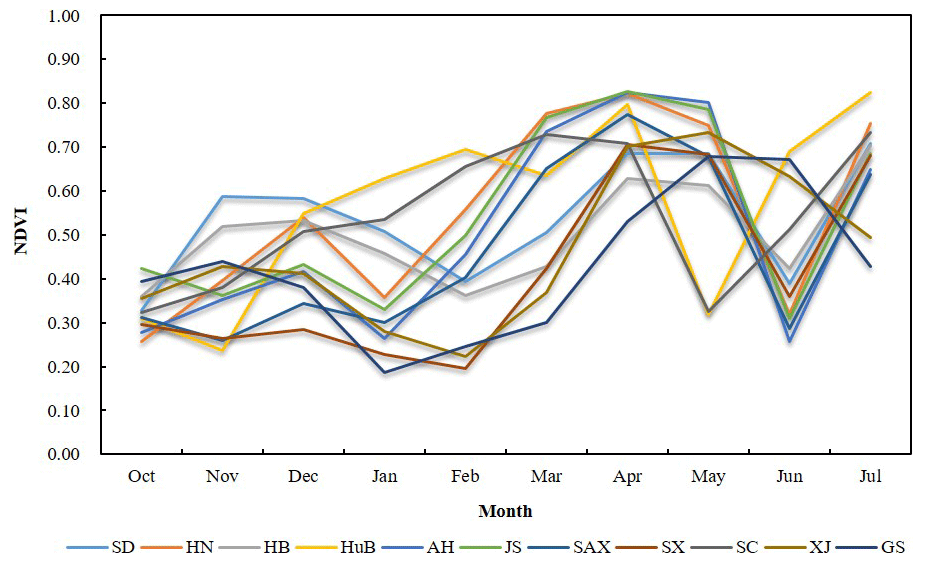
This study used satellite-based NDVI extracted from Sentinel-2 and Landsat composite imageries to indicate the seasonal change in the vegetation. The standard seasonal curve of winter wheat was generated by averaging the NDVI with 20 % of the winter wheat pixels randomly selected from field surveys in each province (see Sect. 2.3). The winter wheat over all the 11 provinces has similar seasonal changes (Fig. 4). Generally, winter wheat reaches the maximum growth period during March to June and is harvested during May to June. We assumed that the seasonal change of winter wheat for each province does not vary from year to year. We used the standard seasonal curves derived from NDVI measurements taken in 2018 to identify the planting area of winter wheat for the period of 2016–2018 to further examine the applicability of the method.
To determine the earliest identifiable time, we employed incremental time windows by setting 1 October of the previous year as the start and extending it with an increment of 1 month until the following June to compare the seasonal changes with different lengths. In other words, we started to identify the planting areas from the previous October, and subsequently, at each month, a new image is acquired to compose longer time series and generate a new identification. The influence of seasonal change length on identification accuracies was assessed based on these classification accuracies.
2.2.2 Removing the disturbances of winter rapeseed
Three winter crops are grown over the whole study area, including winter wheat, winter rapeseed, and winter garlic. The first two crops constitute 91 % and 8 % of the planting area of winter crops, respectively (National Bureau of Statistics of China, 2018); winter rapeseed may affect the identification of winter wheat. Relying solely on optical imagery to discriminate them would be a challenge because of their similar spectral characteristics and phenological stages (Veloso et al., 2017). Widely planted in HuB, winter rapeseeds cover an area of 0.97×10⁶ ha, nearly equal to that of winter wheat with 1.1×10⁶ ha reported in 2017 (Hubei Statistical Bureau, 2018). In addition, winter rapeseed is grown in AH and JS, and its total area is 0.78×10⁶ ha, whereas the total area of winter wheat grown here is 4.57×10⁶ ha (Anhui Statistical Bureau, 2018; Jiangsu Statistical Bureau, 2018). Winter garlic is mainly distributed in SD, HN, JS, and HB. Compared with winter wheat, the planting area of winter garlic is very small. For example, as the largest garlic producer, SD plants 0.15×10⁶ ha of garlic, accounting for only 3.8 % of winter wheat in 2017 (Shandong Statistical Bureau, 2018). Therefore, this study ignored the impact of garlic when identifying the planting areas of winter wheat.
Fortunately, the difference in the plant structure between winter wheat and winter rapeseed makes it possible to differentiate them based on radar data (Veloso et al., 2017). Therefore, we used radar data to exclude the interference from winter rapeseed in this study. By investigating the survey samples in HuB, we found that the VH (vertical transmit and horizontal receive) backscatter values in April are a good indicator to differentiate winter wheat from winter rapeseed. The VH backscatter values in April for winter wheat were lower than −15.5, whereas they were higher for winter rapeseed (Fig. 5), which meant the pixels (with VH values greater than −15.5) had less possibility to plant winter wheat. Accordingly, by assigning a higher dissimilarity to these pixels, this study distinguished winter wheat and rapeseed in HuB, JS, and AH.

Figure 5The seasonal change in monthly maximum composite NDVI (a) and VH (b) of winter wheat and winter rapeseed in HuB. (c) Frequency histograms of winter wheat and winter rapeseed in terms of VH in April.
2.2.3 Classification accuracy assessment
The identification accuracy of winter wheat was evaluated based on two methods: (1) validation using the ground truth samples at the field level, including ground surveys and visual interpretation of very high-resolution images from Google Earth, and (2) comparisons with agricultural statistical data at administrative units. Eighty percent of the winter wheat samples and all non-winter wheat samples were selected to obtain the confusion matrix of the winter wheat map for each province (see Sect. 3 for more details). The overall accuracy (OA) was measured to investigate the overall effectiveness of the method. The producer's accuracy (PA) shows the proportion of ground truth samples properly judged as the target class, and the user's accuracy (UA) shows the proportion of samples judged as the target class on the classification map that are actually present on the ground. In addition, the planting area of winter wheat identified in this study was compared with that obtained from agricultural statistical data at the county and municipal levels through Pearson's correlation coefficient. Other statistical indicators, including the mean absolute error (MAE) and the root mean square error (RMSE), were also used to evaluate the performance.
2.3 Data
2.3.1 Satellite data
The methodology in this study mainly relied on the similarity measurement between the NDVI seasonal change in an investigated pixel and a known seasonal change of winter wheat. Two different data sources were used to calculate the NDVI: the constellation of the Landsat 7, Landsat 8 and Sentinel-2 satellites. The NDVI was derived from the Landsat Surface Reflectance (SR) products produced by the United States Geological Survey (USGS), which have been processed for atmospheric corrections. The quality bands provided by the SR products were used to remove pixels contaminated by clouds. The study also used the NDVI obtained from the MultiSpectral Instrument (MSI) sensor on board Sentinel-2. The SR products generated from Level-2A products by running Sen2Cor provided by ESA (https://github.com/senbox-org, last access: 10 October 2019) were used. We employed the QA60 band to mask clouds from the Sentinel-2 images (ESA, 2019). As a result, the study region with an area of 390×106 ha corresponded to 4.3 billion 30 m pixels covering the entire winter wheat growing season (October to July) during the period of 2016–2018. Monthly cloud-free image frequencies from October to July at each pixel are visualized in Fig. 6.
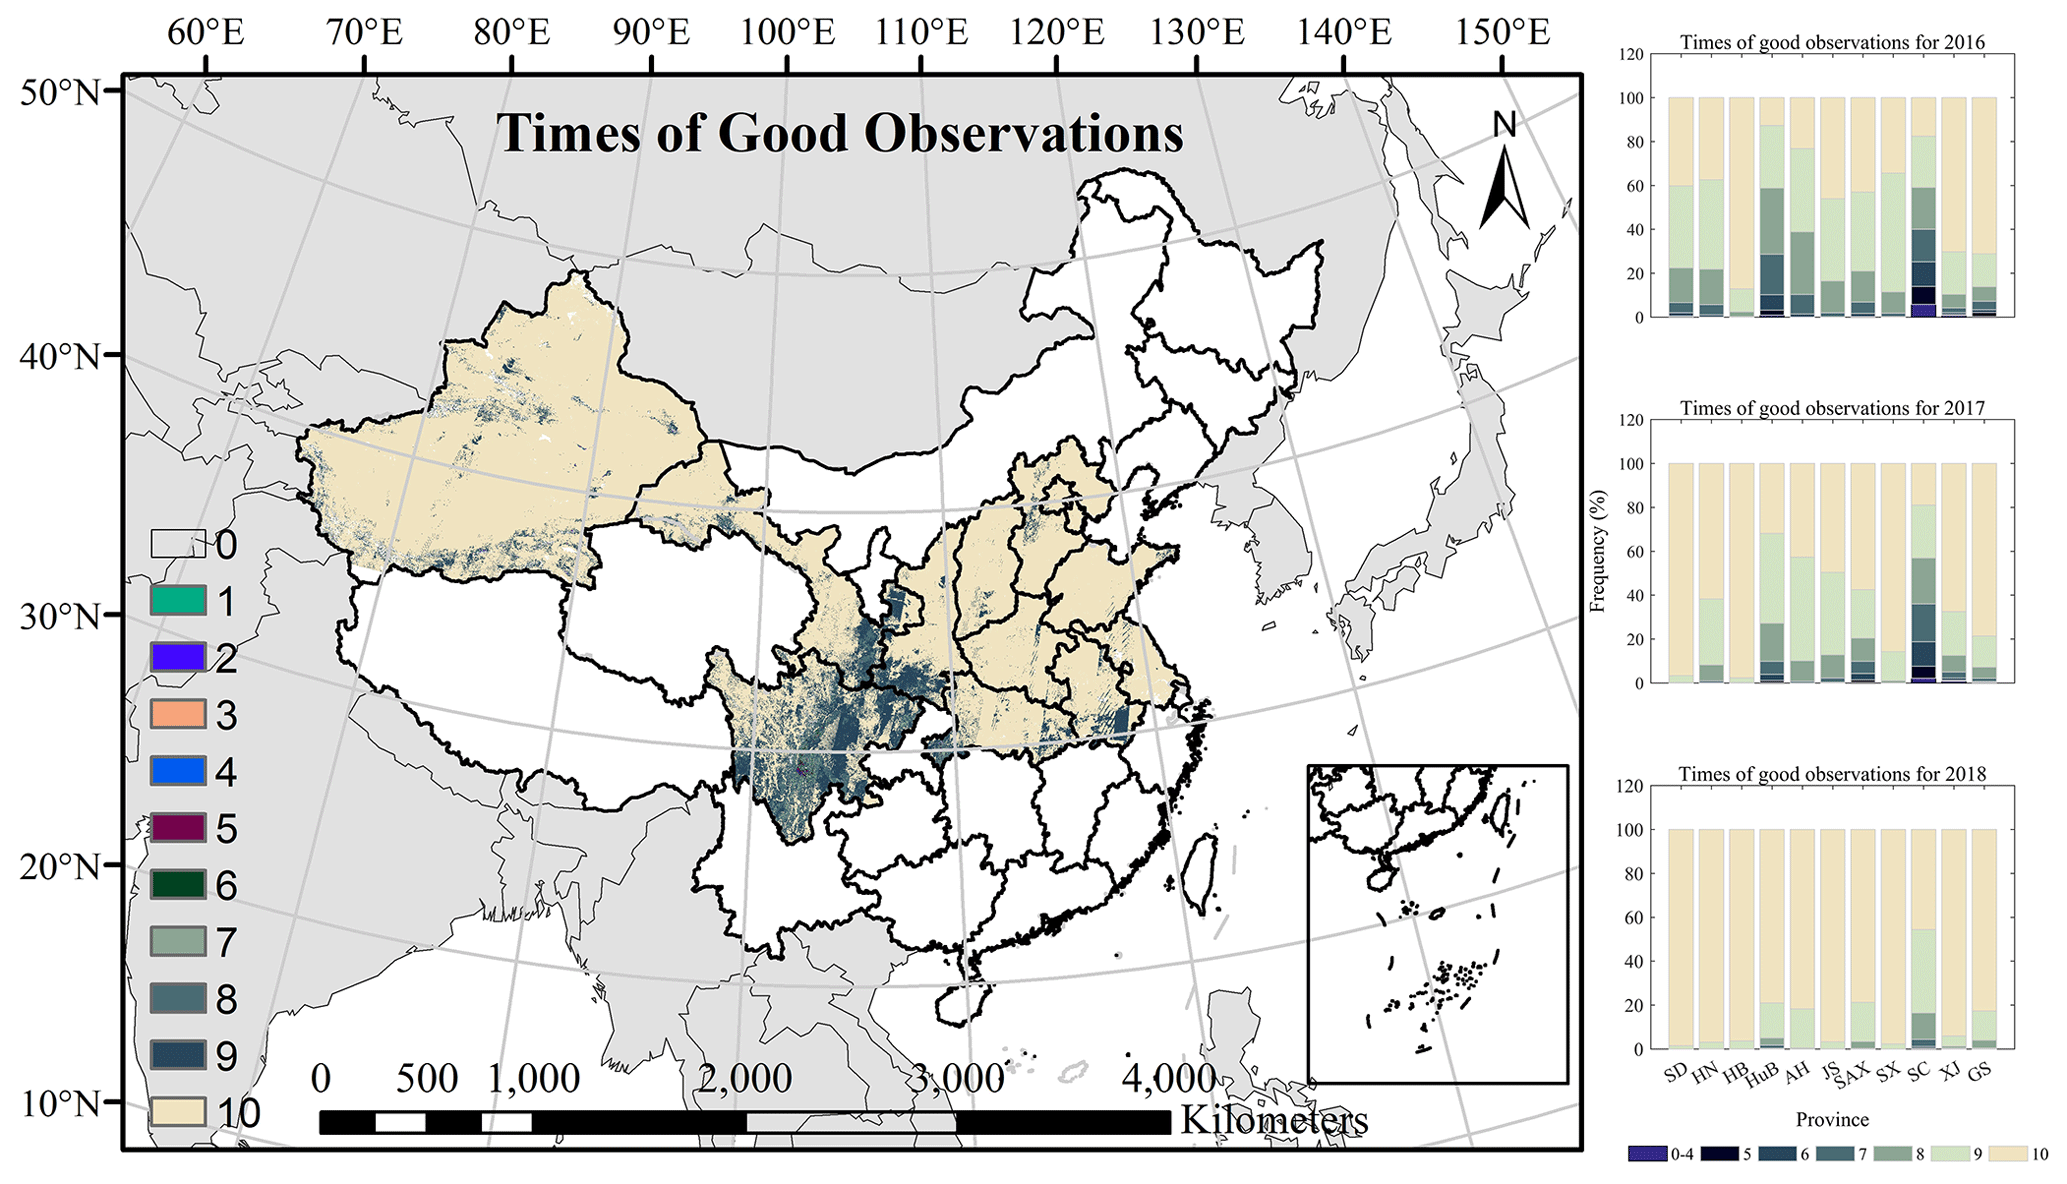
Figure 6Times of good observations in the study area obtained from monthly maximum NDVI composite images between 1 October 2017 and 31 July 2018. The right column shows the frequency of the times of good observations during the period of 2016–2018 from October to the following July. Provincial administrative boundary data and global country administrative boundary data are sourced from http://www.resdc.cn/DOI/ © Institute of Geographic Sciences and Natural Resources Research, Chinese Academy Sciences.
To differentiate winter wheat from other winter crops (i.e., winter rapeseed), this study used the synthetic aperture radar (SAR) (i.e., Ground Range Detected, Level-1; GRD) product from Sentinel-1. It had a dual-polarized vertical transmission with VV (vertical transmit and vertical receive) and VH (vertical transmit and horizontal receive) bands. We processed each image and acquired the backscatter coefficient (σ∘) in decibels (dB) on the platform of Google Earth Engine (GEE) (as operated by the Sentinel-1 Toolbox; ESA, 2015), comprising thermal noise removal, radiometric calibration, and terrain correction (orthorectification). Even with standard noise-reduction techniques applied, SAR images contained a speckle noise due to the interferences between adjacent backscatter returns. In this study, we chose the refined Lee filter, as described in Abramov et al. (2017), to further correct the SAR images for speckle noise.
In this study, the VH and NDVI data are both composited into their corresponding monthly maximum images, respectively, for the period between 1 October 2015 and 31 July 2018 on the platform of GEE. The operations were run on GEE in pixels: within a month, we obtained NDVI values of all available clean pixels and got the maximum for the monthly composite. The pixels of the monthly composite imageries had the highest quality and represented the whole month, whereas a small number of pixels had no values. The reason for this is that imageries from Landsat 7, Landsat 8 and Sentinel had several pixels with bad quality owing to clouds, cloud shadows, and/or no data acquisition (e.g., failure of Landsat 7) (Fig. 6).
2.3.2 Field data
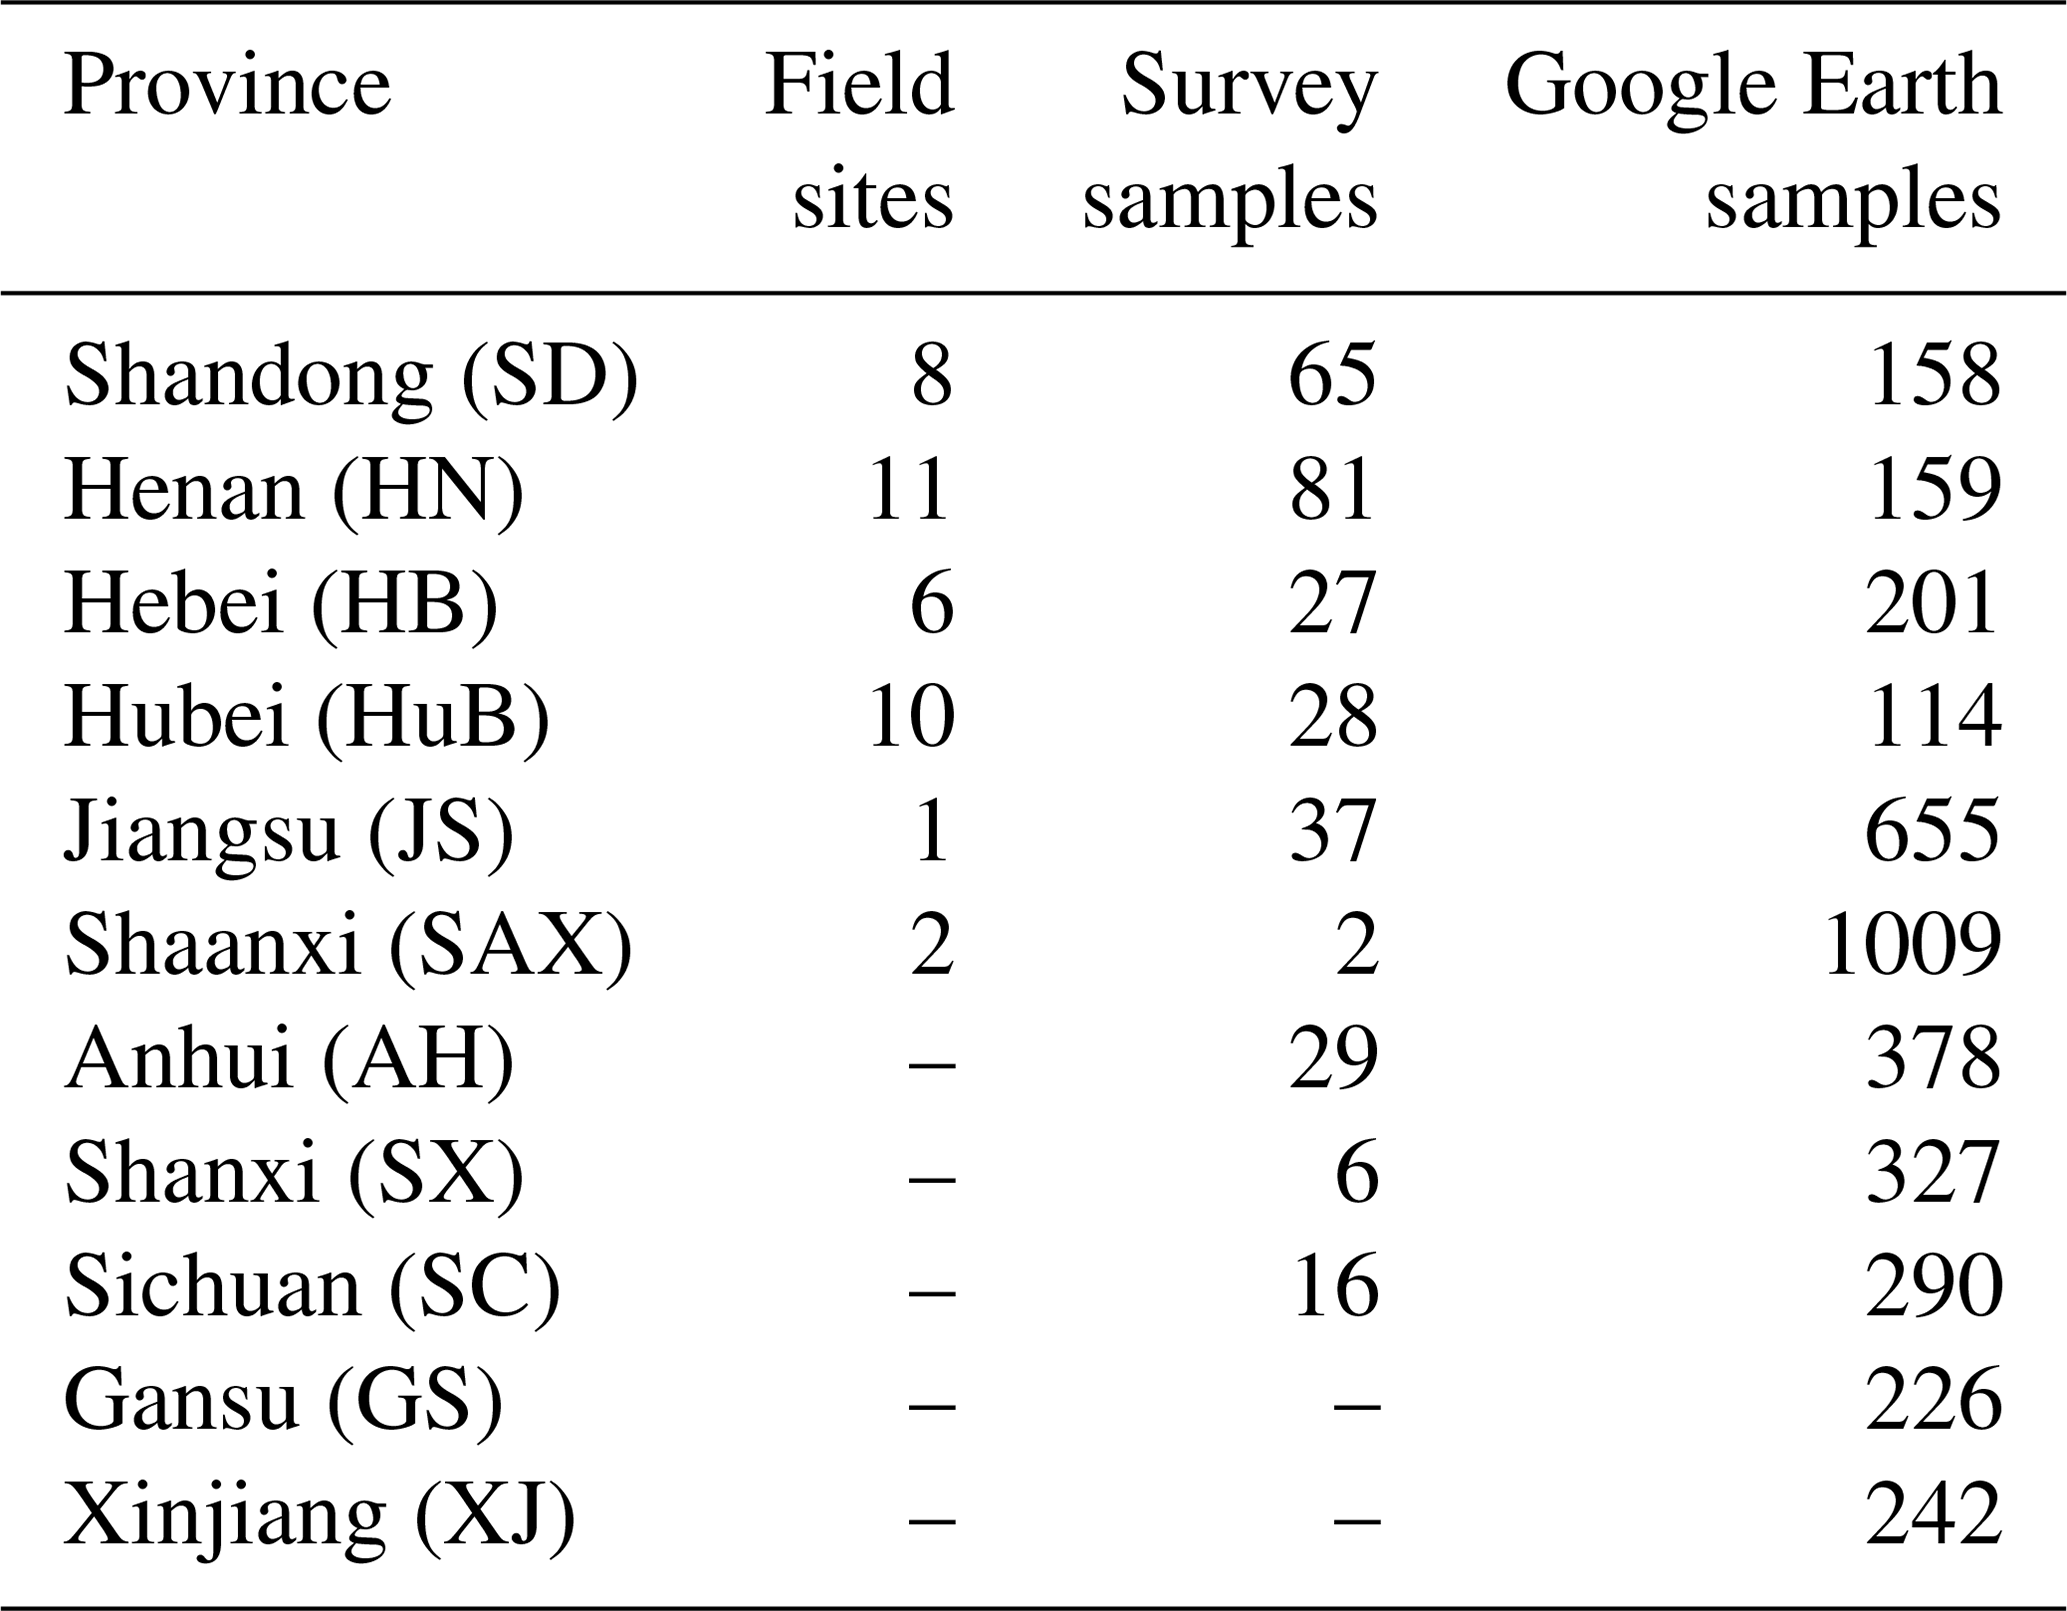
To obtain the standard seasonal change curve of winter wheat and validate how the proposed method performs, we collected survey samples from the following three sources. First, 38 sites (red triangles in Fig. 1) were investigated through field surveys during 2018 in the six provinces (i.e., SD, HN, HB, JS, SAX, and HuB) (Tian et al., 2019) (Fig. 1). Each field site covered 1 km2. In all the field sites, the available field samples cover 29 754 pixels (i.e., 30 m × 30 m), of which 17 971 pixels are winter wheat samples and 11 783 are non-winter wheat samples. Second, we collected 291 field survey samples (five-pointed stars in Fig. 1) through cooperating with other researchers. An MG858 handheld GPS was used for ground survey. Third, we made visual interpretations of the very high-resolution images from Google Earth for 2018 to select large fields for winter wheat and acquired a total of 3759 samples, among which 1750 samples are for winter wheat and another 2009 samples are for non-winter wheat. The three sets of samples were used to validate and evaluate the accuracy of the method. Moreover, the total number of field sites, survey samples, and Google Earth samples for each province are showed in Table 1.
Table 1The total number of samples of different types for each province during 2018.
2.3.3 Land cover dataset and agricultural statistical data
In this study, the Finer Resolution Observation and Monitoring of Global Land Cover (FROM-GLC) product with 30 m resolution was used to extract cropland locations. The product can be downloaded via http://data.ess.tsinghua.edu.cn/ (last access: 10 October 2020) (Gong et al., 2013; Li et al., 2017). Agricultural statistical area data of winter wheat at the county, municipal, and province levels during the period of 2016–2018 were acquired from the National Bureau of Statistics of China (2018). The winter wheat growth conditions were collected by agro-technicians from survey samples via investigating the registered farmlands or gathering the estimates made by farmers; they were then reported to the National Bureau of Statistics of China (2018), where the planting areas were inferred based on weighting of the sampling croplands. The area statistical data are the most reliable data with a high level of accuracy (Franch et al., 2015). The municipality-level statistical data of winter wheat can be found in only eight provinces, and county-level data can be found in only six provinces.
To examine the potential for early-season identification of winter wheat and explore how early we could produce the distribution maps before the harvest, we investigated the method with shorter time windows and assessed its performance based on all the survey samples collected, which correspond to 33 776 pixels in total. We compared the producer's accuracy (PA), user's accuracy (UA), and overall accuracy (OA) for different seasonal change lengths starting from October, with monthly increments thereafter (Fig. 7). The identification accuracy increases with seasonal change length until March with an overall accuracy of 87.3 %. From April onward, the identification results reach saturation in terms of the accuracy, with an overall accuracy close to maximum, 89.88 %. This indicates that the method can identify the planting area of winter wheat 3 months before harvest (i.e., March), with stable performance until April.
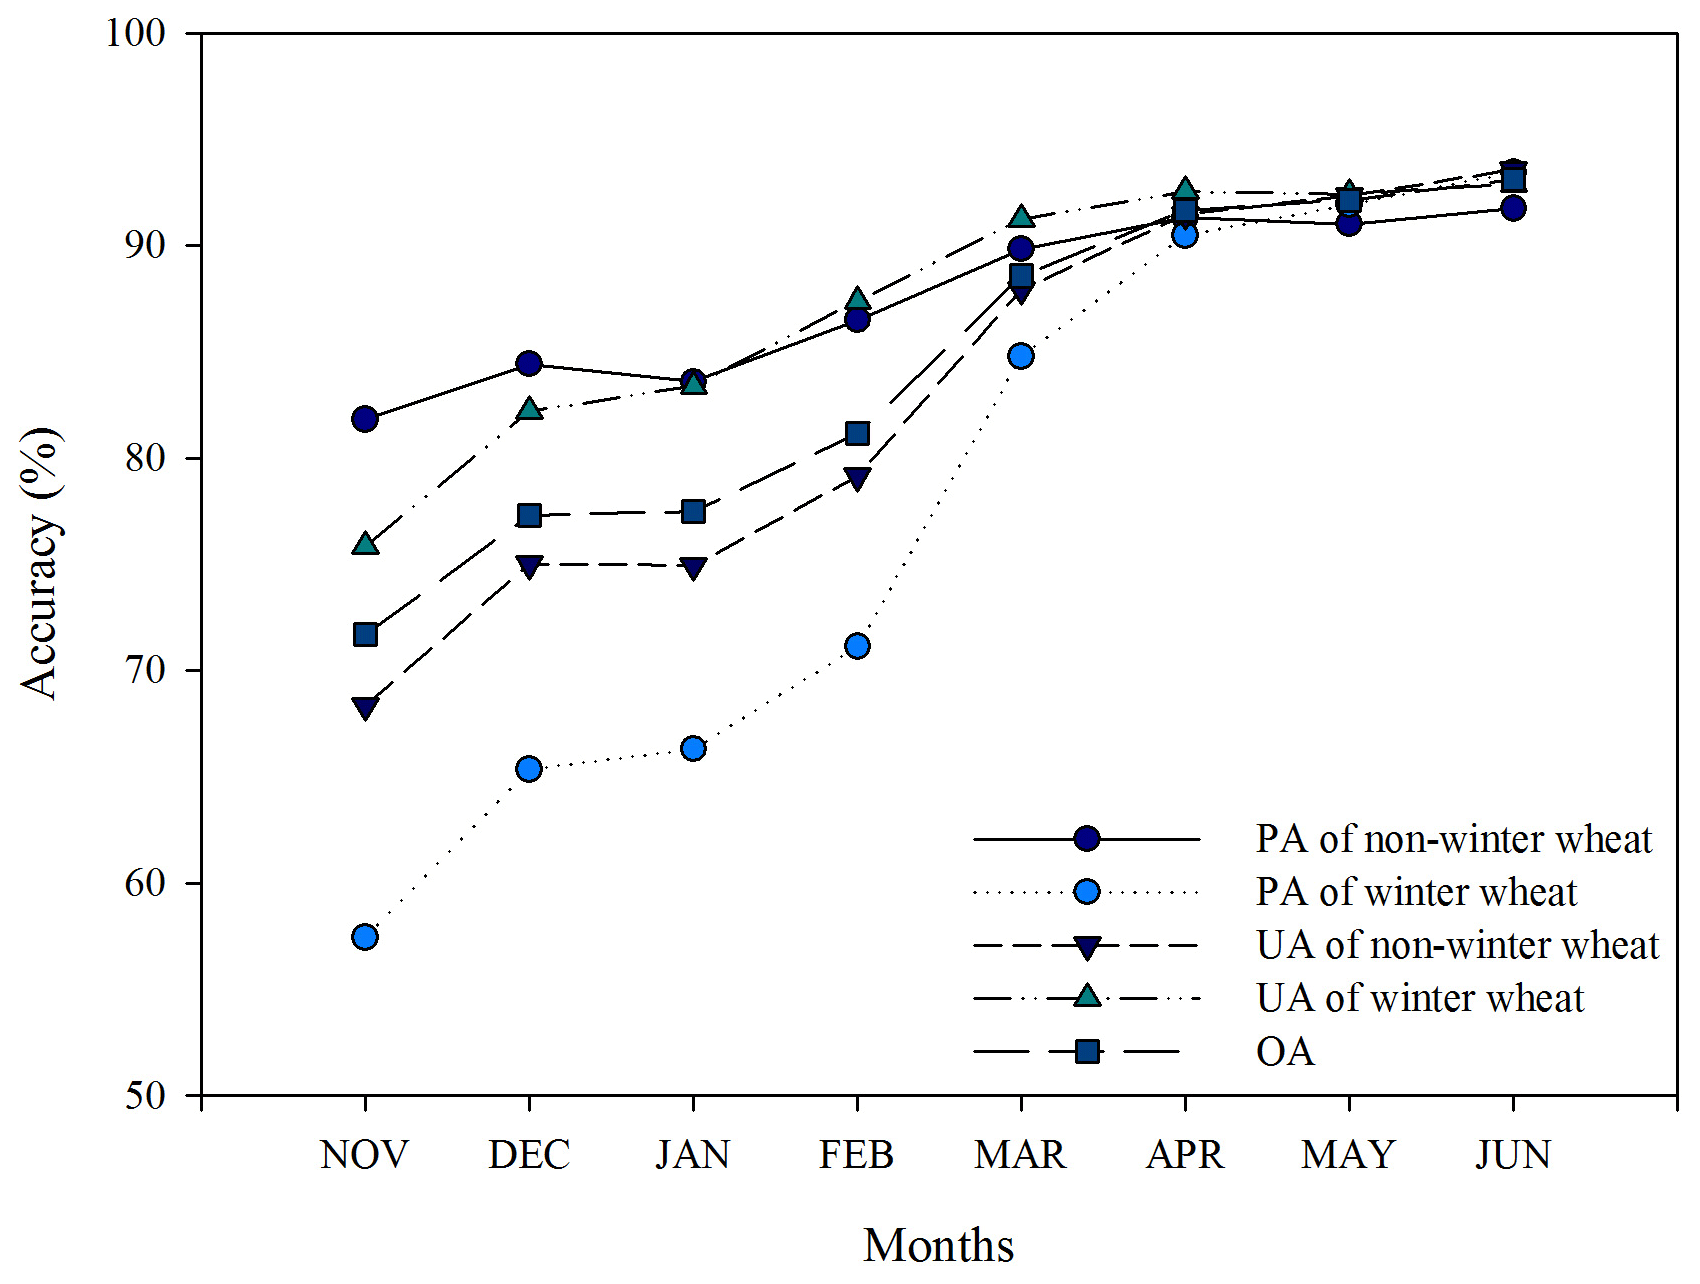
Figure 7Evolution of producer's accuracy (PA), user's accuracy (UA), and overall accuracy (OA) with monthly increments. PA of non-winter wheat and PA of winter wheat represent the probabilities that the ground truth reference data of non-winter wheat and wheat class are correctly classified, respectively. UA of non-winter wheat and UA of winter wheat indicate the ratio of the total quantity of pixels correctly classified into the objective class (i.e., non-winter wheat and winter wheat) to the total quantity of pixels classified into the objective class using the proposed method.
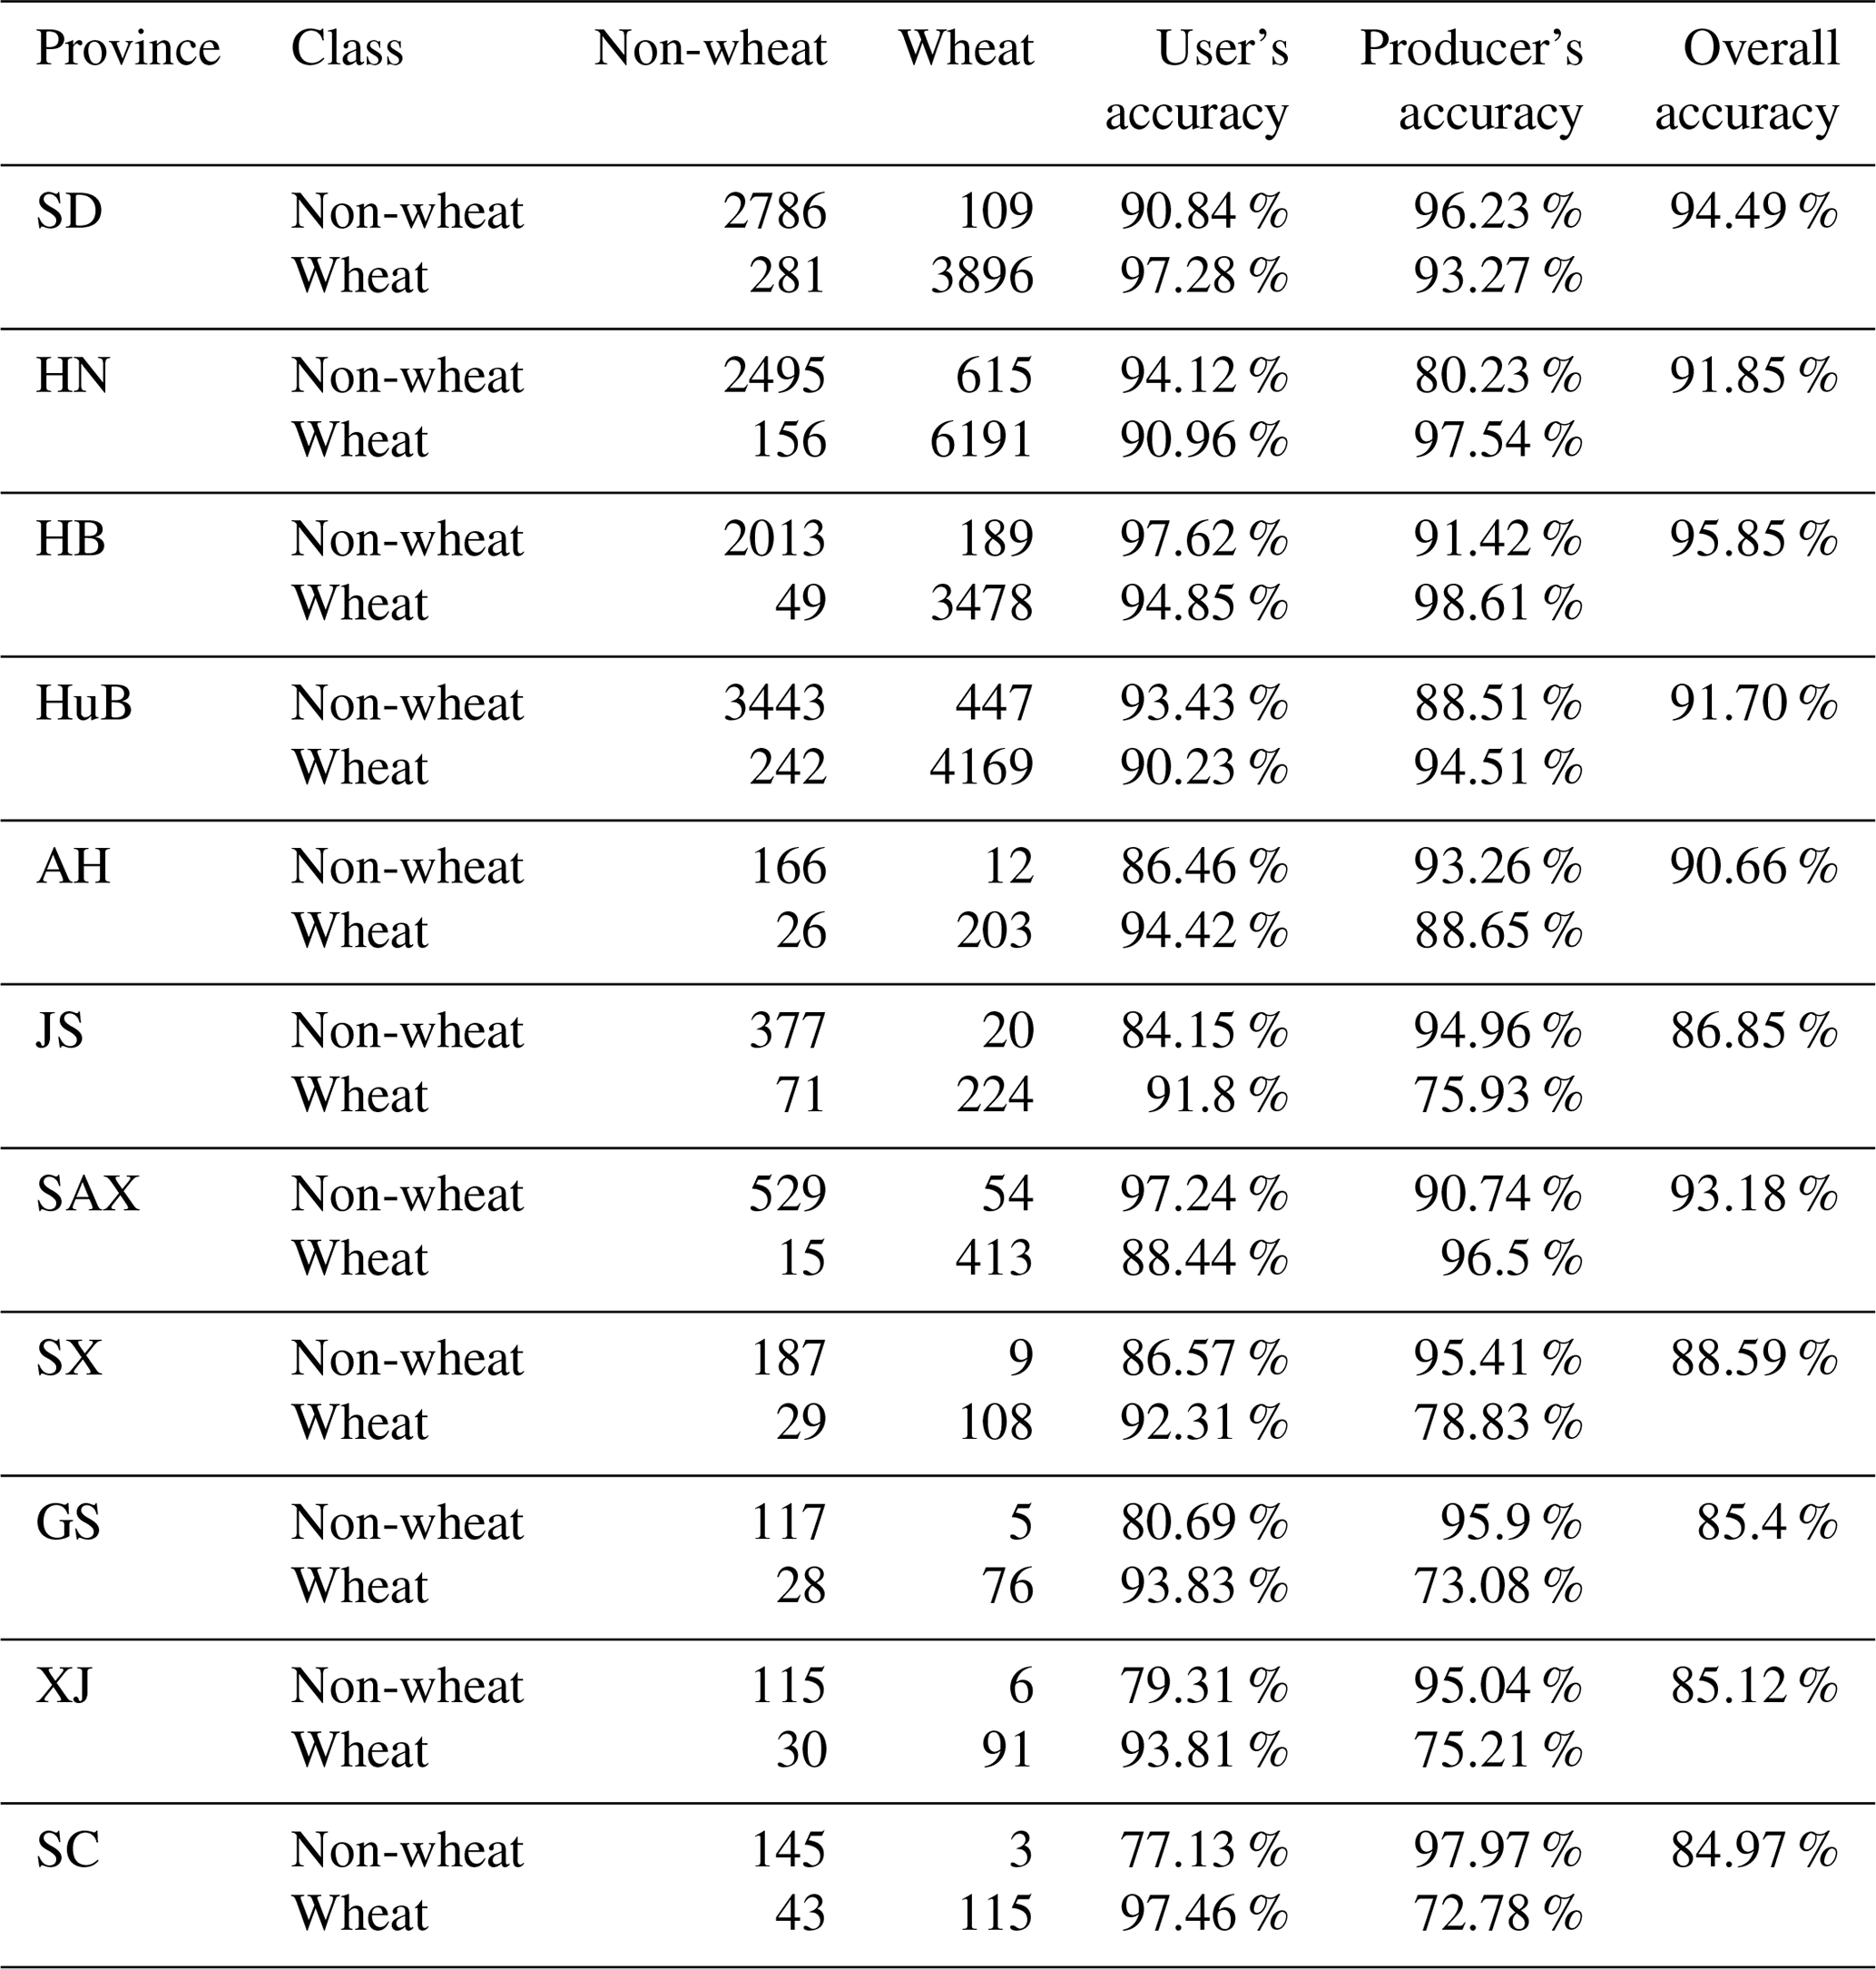
We used the time window from October to April to compare the similarity between the seasonal change of investigated fields and that of known winter wheat field; thus, we produced winter wheat distribution maps (Fig. 8). Our method shows good performance in identifying the planting areas of winter wheat over all the 11 provinces. Based on winter wheat and non-winter wheat survey samples, the overall identification accuracy varies among the 11 provinces, ranging from 84.97 % to 95.85 % (Table 2). The user's accuracy (UA) and producer's accuracy (PA) are high in most provinces. For SC and GS, the same approach produced the lowest PA of winter wheat, 72.78 % and 73.08 %, respectively (Table 2).
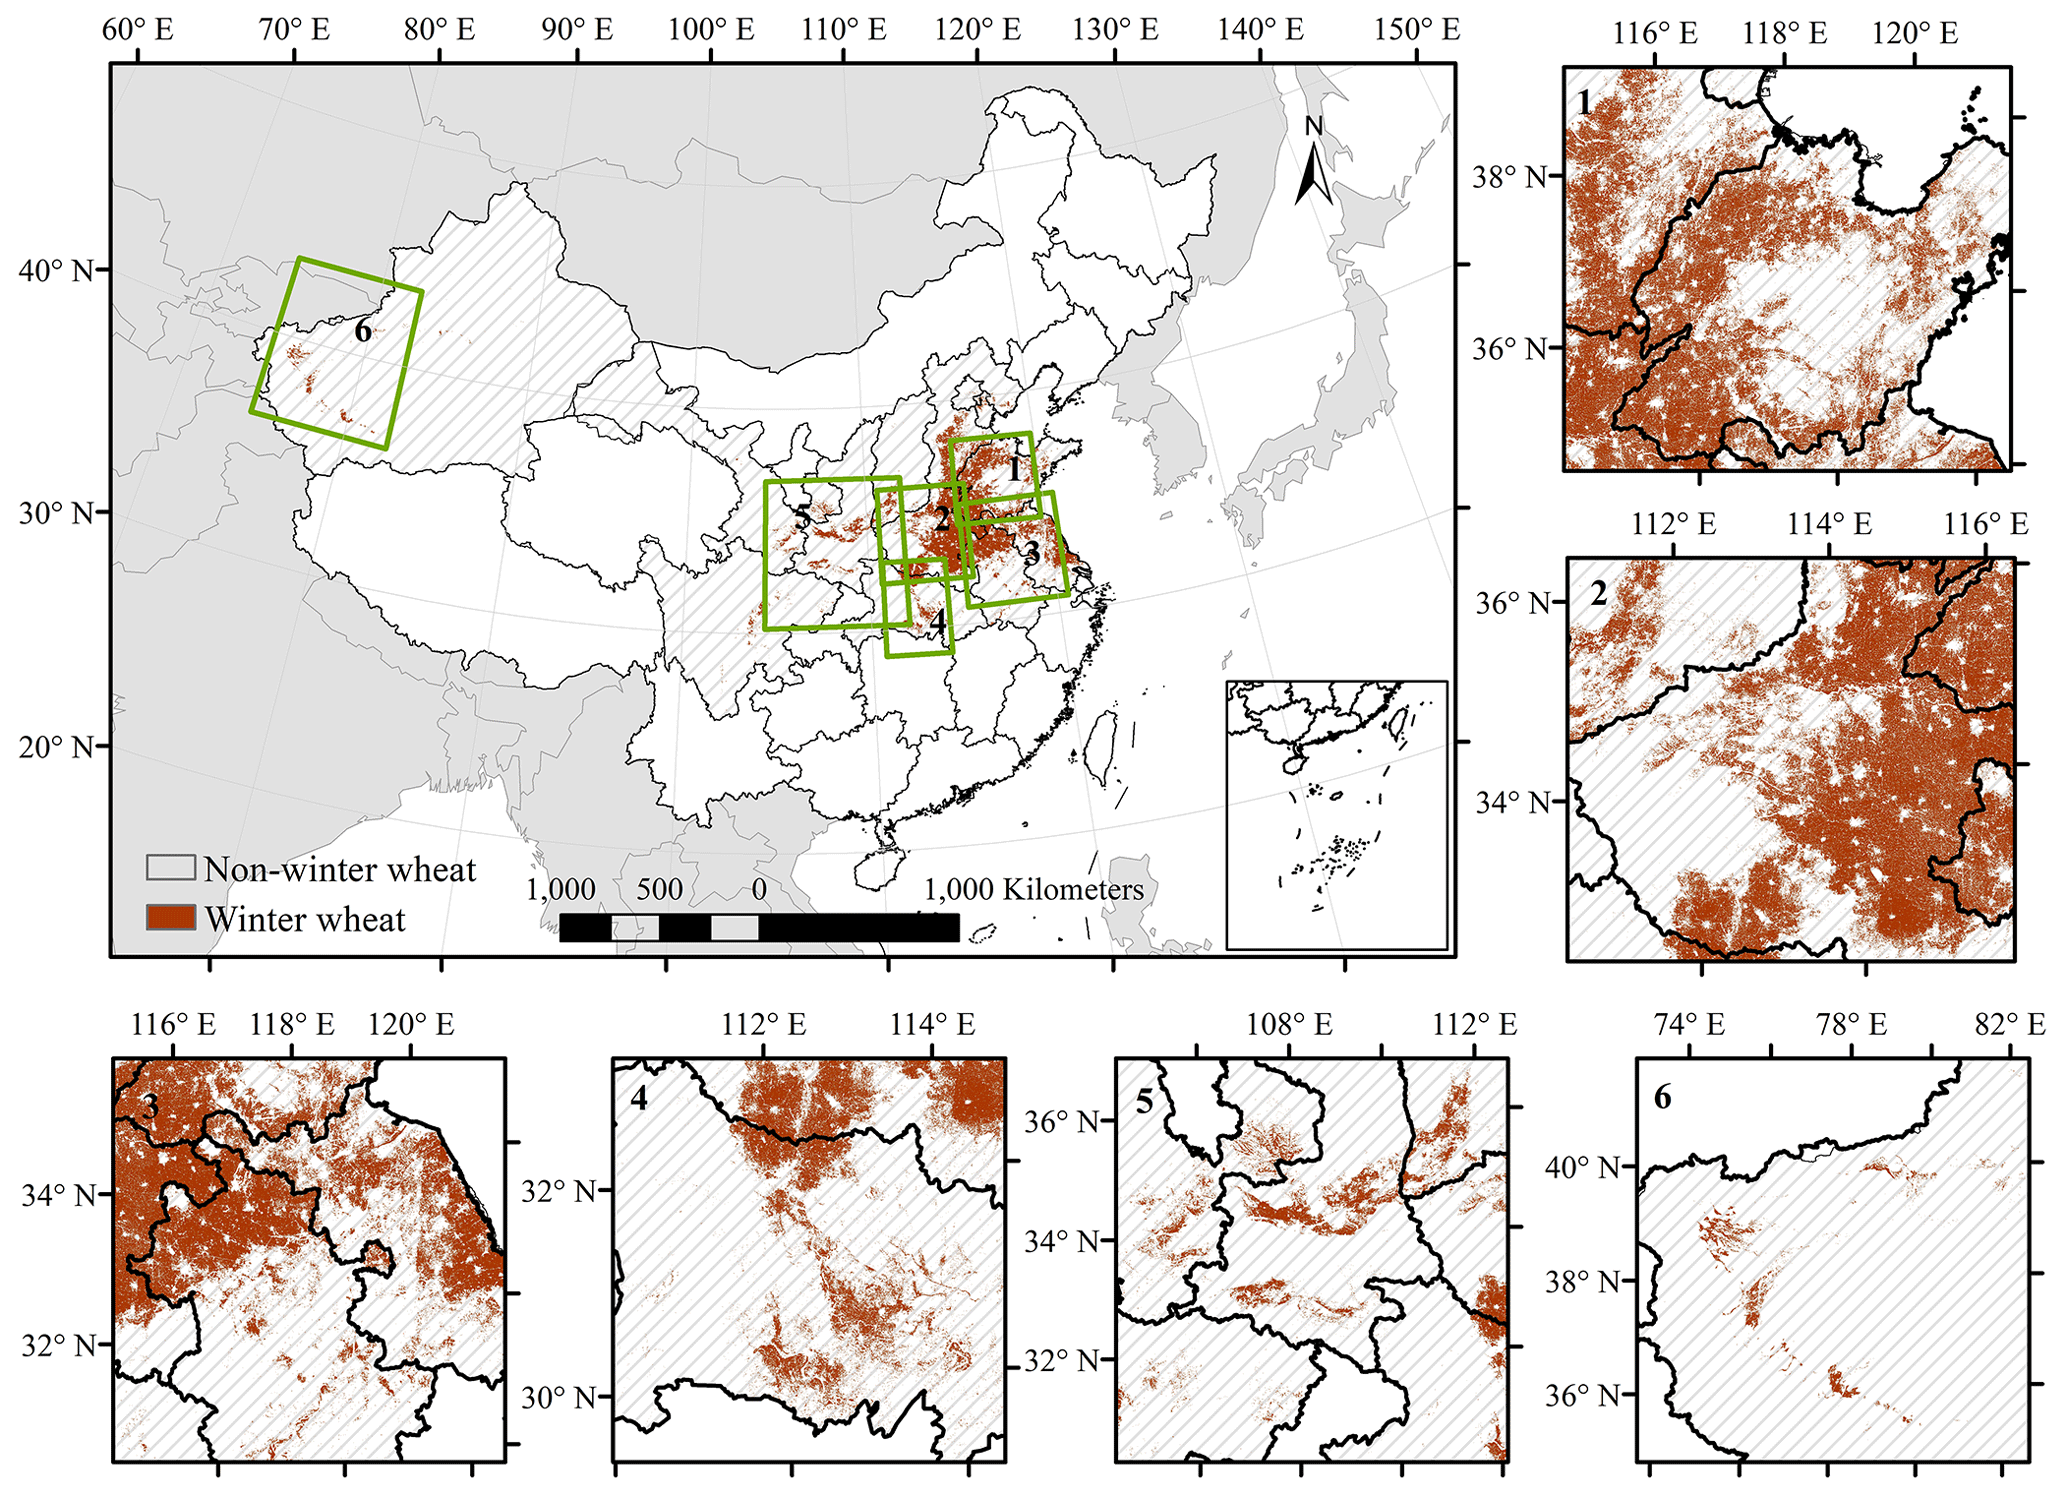
Figure 8Final winter wheat identification map of China in 2018. Panels 1–6 on the right and bottom are the zoomed-in maps, indicating the local details in the different provinces and regions, including SD, HN, AH and JS, HuB, central and western regions of China, and XJ, respectively. Provincial administrative boundary data and global country administrative boundary data come from the Resource and Environment Science and Data Center cloud platform (http://www.resdc.cn/DOI/).
Table 2Confusion matrix for the identification map of planting areas of winter wheat in 11 provinces during 2018.
In addition, this method accurately estimates the areas of winter wheat compared to the available agricultural statistical data at the municipal and county levels (Fig. 9). The correlation coefficient (R2 values) between the identified and agricultural statistical areas range from 0.85 to 0.99 at the municipal level (Fig. 9Ia–h), indicating a strong correlation. At the county level, the method performs a little worse, with correlation coefficient (R2 values) ranging from 0.7 to 0.88 (Fig. 9IIa–h). Considering the MAE and the RMSE, JS, HN, and AH show higher error at the municipal and county level.
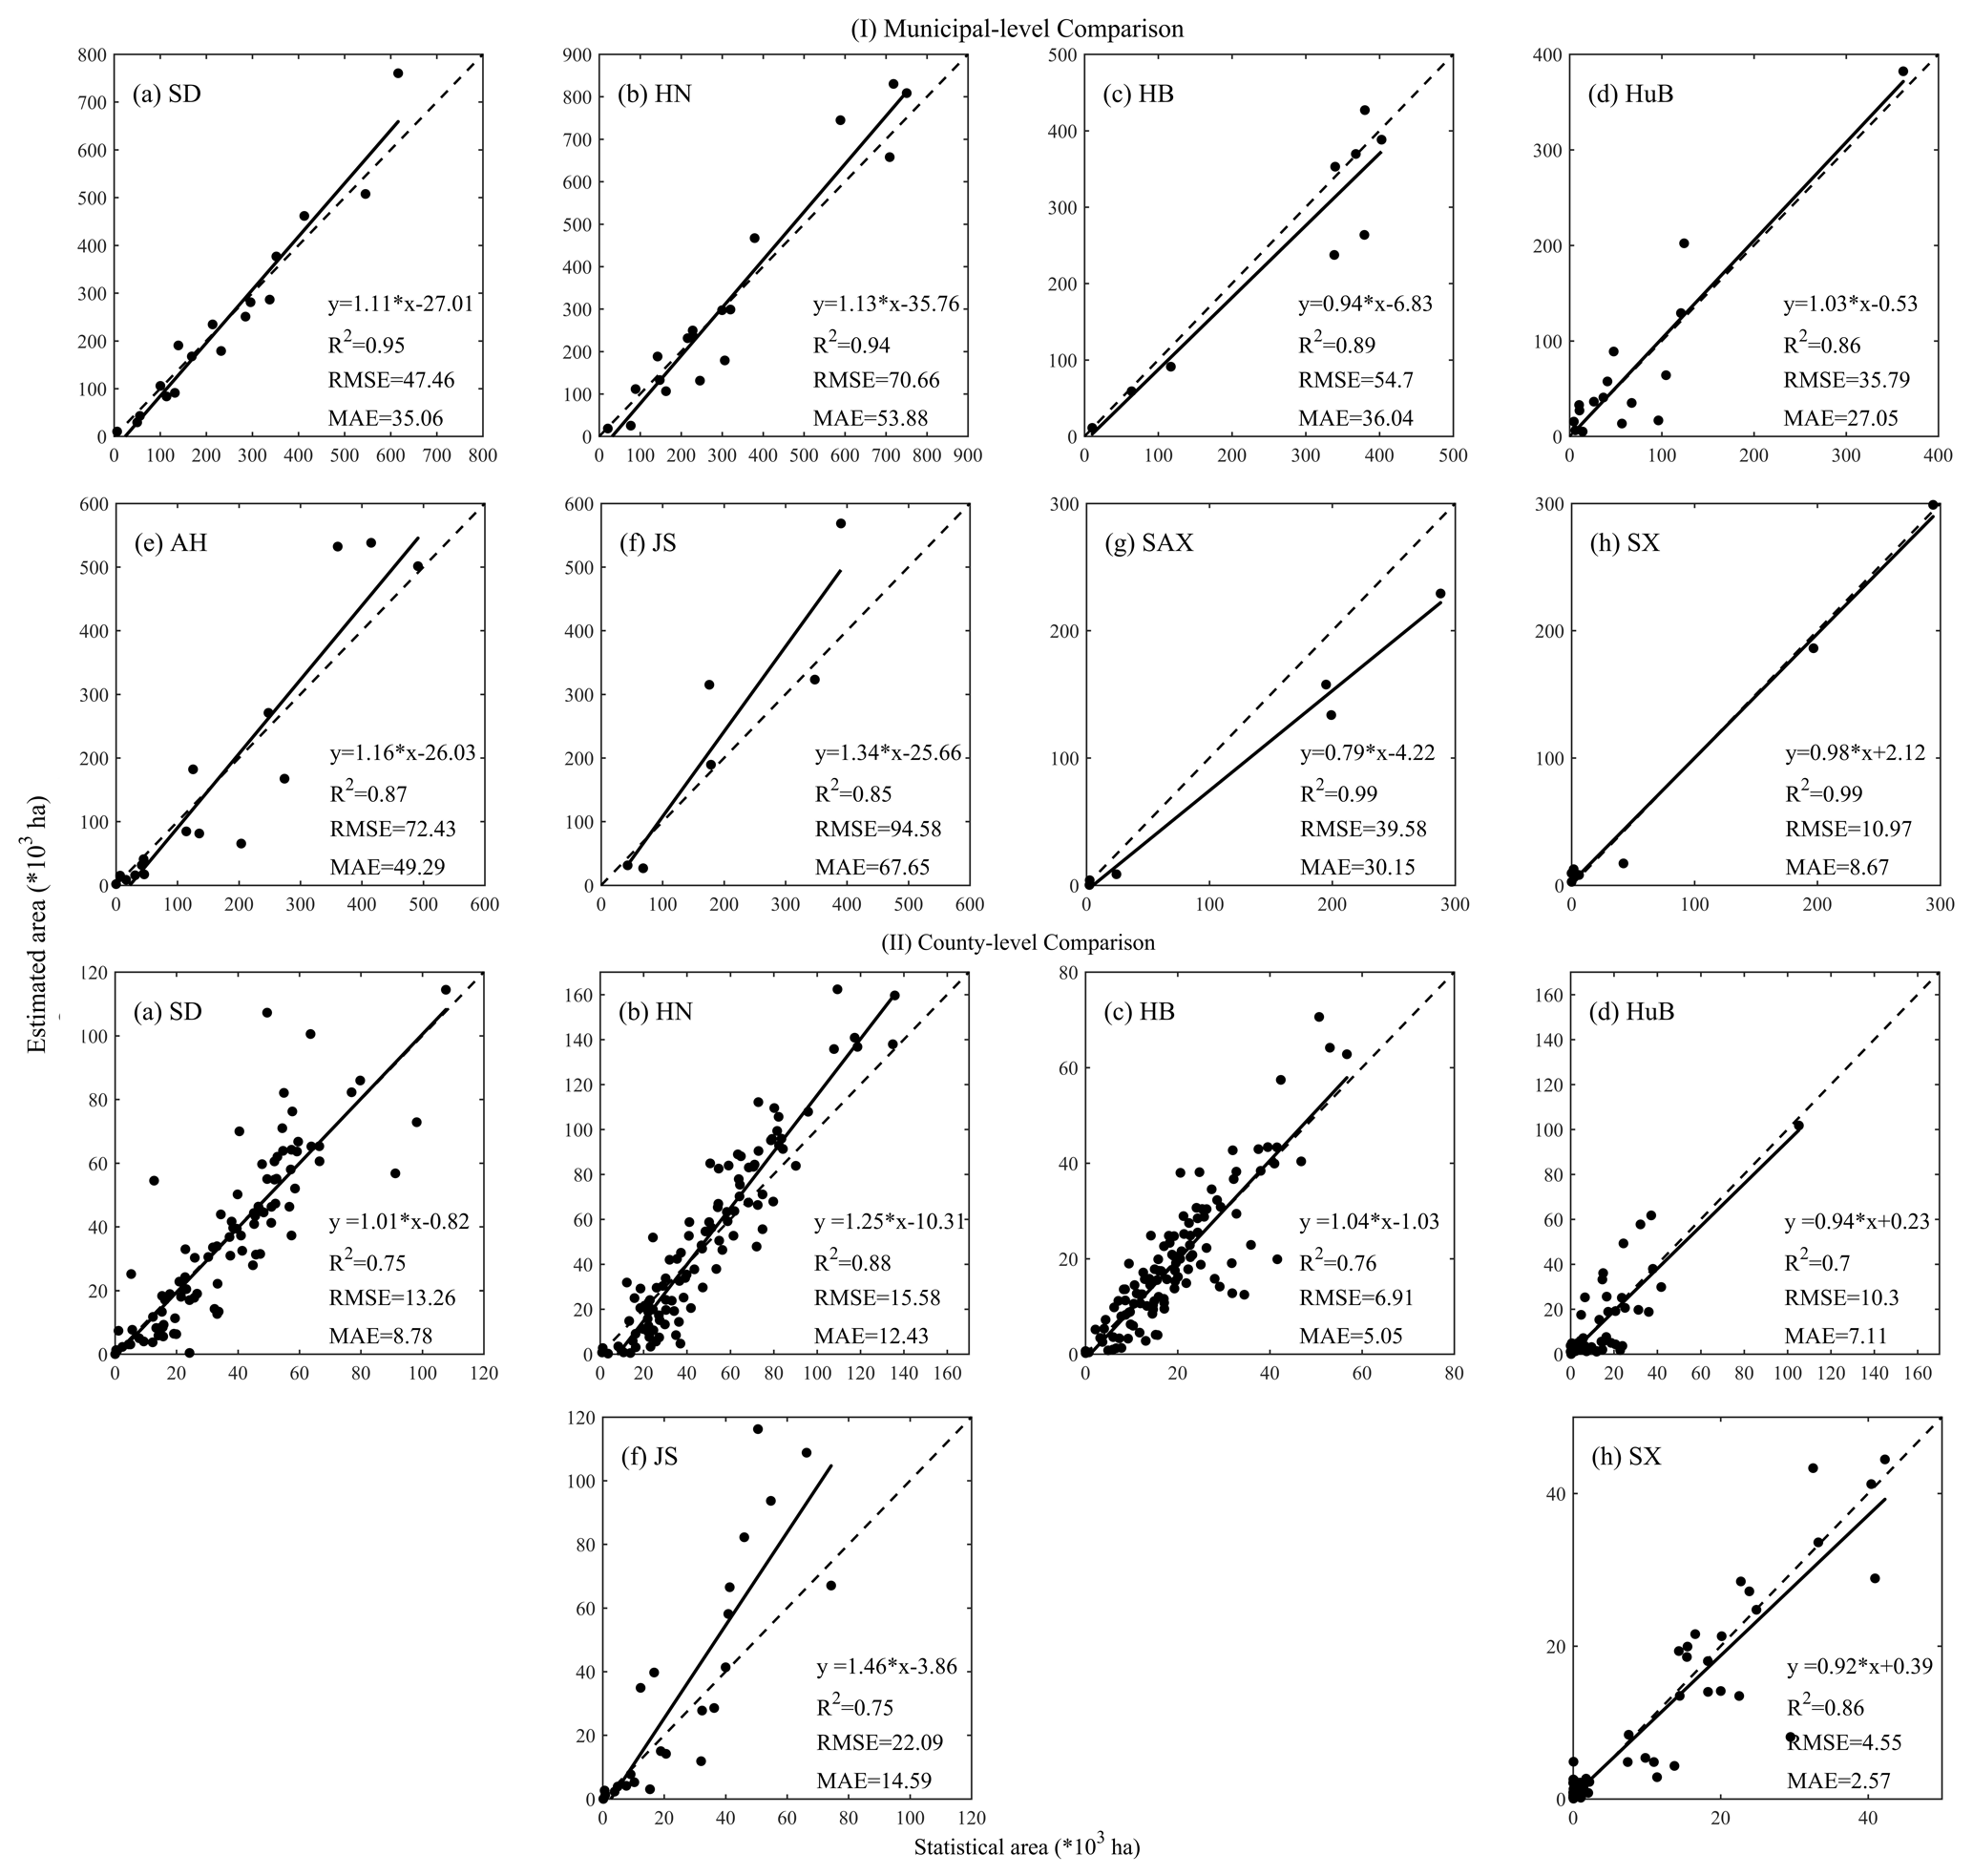
Figure 9Comparison between the estimated planting area of winter wheat and agricultural statistical area at the municipal (I) and county level (II) for 2018. The dotted line denotes the 1:1 line. The agricultural statistical area at the county level for AH and SAX are not available. The units of RMSE and MAE are 1000 ha.
Finally, we examined the capability of the method for extending the standard seasonal change of NDVI acquired from a single year to apply it in other years (i.e., 2016 and 2017). We used the same seasonal change of NDVI of winter wheat for each province derived from field samples obtained from 2018 to compare the dissimilarity with that of unknown fields for 2016–2017. We then compared the estimated winter wheat areas with agricultural statistical area for the 2 years (Fig. 10). R2 and slope for the period of 2016–2018 changed little in most provinces, except for JS and HN at the county level.
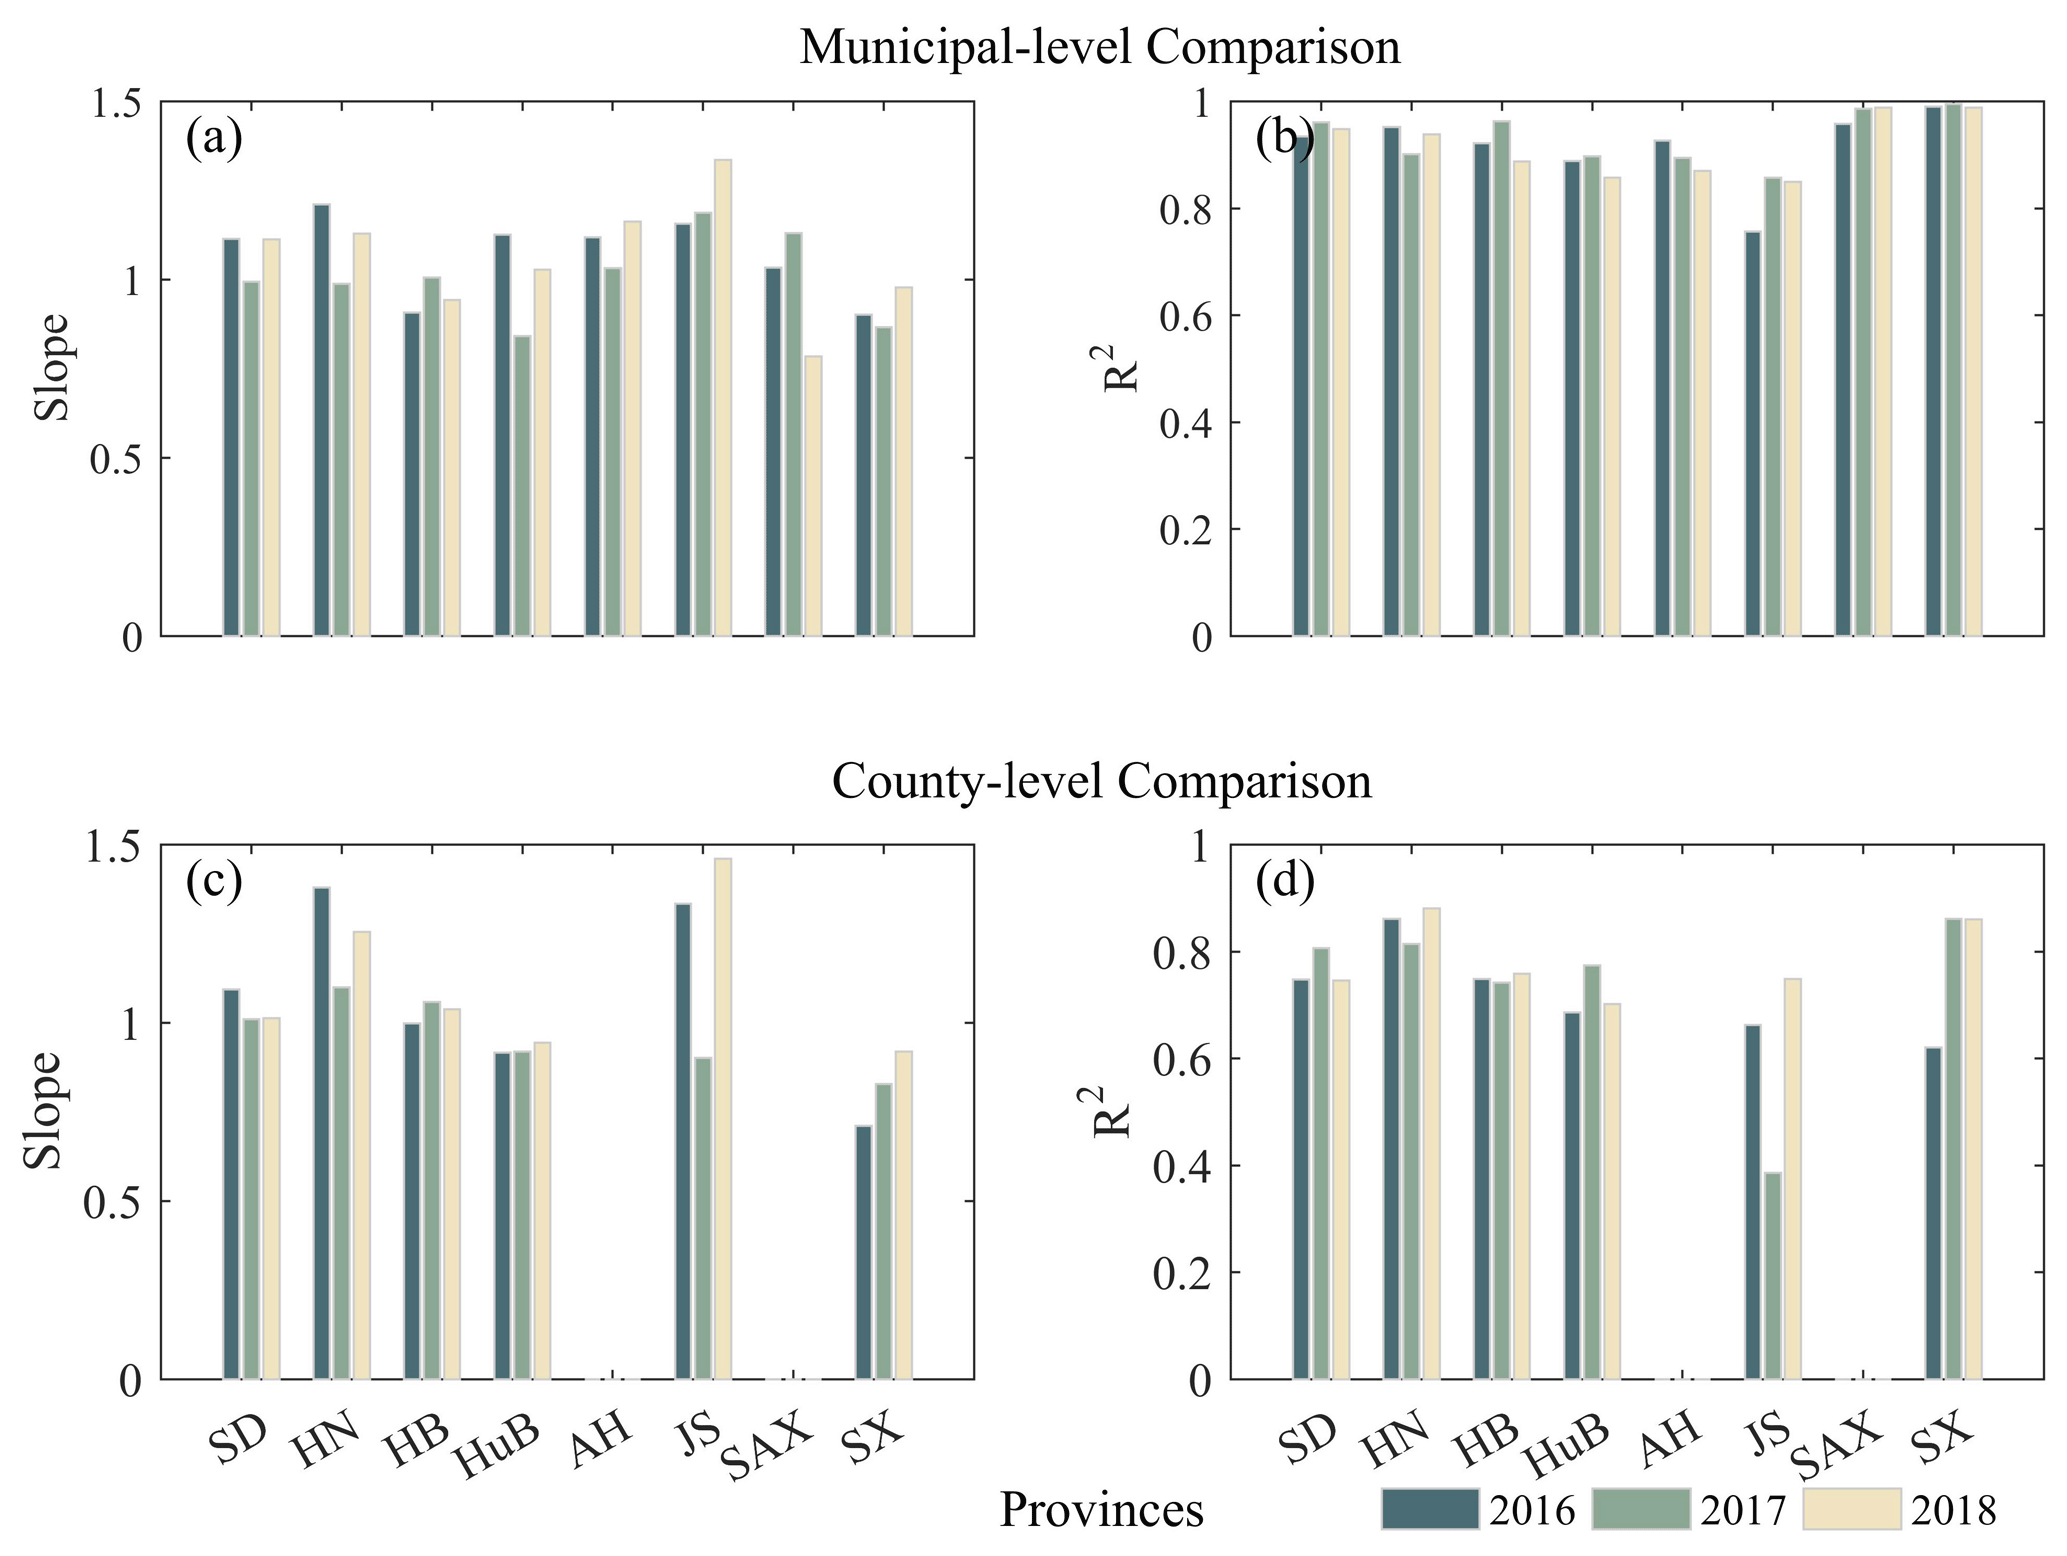
Figure 10Comparison between the estimated and statistical winter wheat area at the municipal (a, b) and county level (c, d) for the period of 2016–2018. The agricultural statistical area at the county level for AH and SAX are not available.
Winter wheat is one of the most important crops in the world, and information on its spatial extent is critical for making economic and grain subsidy policies (FAOSTAT, 2018). To our knowledge, there are currently no distribution maps for winter wheat over China on a large scale with a spatial resolution of 30 m. Previous studies have made efforts to generate the distribution map of winter wheat over the major producing areas in China based on moderate-spatial-resolution satellite data (i.e., MODIS) (Qiu et al., 2017). However, owing to small plot sizes for crops, the distribution map with moderate resolution may lead to large uncertainties because of mixed pixels, further restricting the classification accuracy (Tian et al., 2019). Machine learning methods, such as random forests and support vector machines, have been proven to be effective in identifying the spatial distribution of various crops (Cai et al., 2018; Liu et al., 2018); these methods, however, strongly depend on the number of training samples, thus restricting the large-area crop mapping because of the lack of data (Belgiu and Csillik, 2017; Millard and Richardson, 2015; Valero et al., 2016).
In this study, we generated winter wheat distribution maps with a spatial resolution of 30 m for the period of 2016–2018 based on the TWDTW method using Landsat- and Sentinel-derived monthly maximum composite NDVI. The results obtained based on field surveys and statistical data indicate that the proposed method can accurately identify the winter wheat planting areas over all the 11 provinces. Compared to machine learning methods, our method performs well even if with only a few training samples, which is a significant advantage for large-scale crop identification given the lack of survey samples available (King et al., 2017). In addition, the performance is ideal even when using the same standard seasonal change of the winter wheat for each province for the years when ground surveys are lacking (Fig. 10). Therefore, the proposed method can identify winter wheat quickly with a few training samples and can be extended for years when training samples are scarce (Maus et al., 2016). Recent research suggested that the TWDTW method is more robust in contrast to other identification techniques, such as the random forests, when there are only a small number of training samples (Belgiu and Csillik, 2017).
More importantly, this method can identify planting areas of winter wheat 3 months before harvesting (i.e., March) and can achieve stable performance in April, which are significant for early and continuous winter wheat production predictions (Franch et al., 2015; McNairn et al., 2014). Therefore, understanding where crops are distributed, especially during the early within-season period, is a top priority in predicting total production and monitoring trends in production (Shao et al., 2015; Skakun et al., 2017b). Existing agricultural estimates on crop area or mapping of crop distribution are usually available at the end of the season or after crop harvest (Boryan et al., 2011; Zhong et al., 2019), and the limited input information makes early identification of winter wheat distribution a challenge (Kontgis et al., 2015; X.-P. Song et al., 2017). For example, machine learning methods strongly depend on field survey data and time series features as input; this increases the difficulty in early identification because collecting field data during the season is time-consuming and laborious, especially over large areas (Skakun et al., 2017b; Q. Song et al., 2017). Moreover, the time series input features are generally obtained for the entire growing season, making early mapping more challenging (Johnson, 2016). In this study, our results indicate that early-season identification of winter wheat planting area is feasible up to 3 months before harvest with limited imageries and time information.
Some potential uncertainties could affect the identification accuracy. First, the quantity of cloud-free satellite data substantially determines effectiveness of retrieving the seasonal change of crop growth; this can influence the identification quality (Dong et al., 2020b). In this study, we used all the available satellite data of Landsat and Sentinel and composited multitemporal monthly maximum NDVI images, in order to avoid cloud contamination as much as possible. However, there are large differences in the available images among various provinces; it remains a challenge to acquire cloud-free images in cloudy and rainy southern areas, such as in SC, HuB, and JS (X.-P. Song et al., 2017). The low identification accuracy in these provinces is likely due to the relatively poor data quality of satellite data (Dong et al., 2015). Second, although the seasonal change of winter wheat is relatively consistent in most provinces (i.e., a low peak in NDVI in winter and a high peak in NDVI in spring), there is an interclass difference in winter wheat in each province, such as wheat variety, sowing time, and irrigation conditions. Some winter wheat fields may have an earlier sowing time, showing a pattern deviation from the standard average pattern of this province, and therefore, may lead to some omission errors. Besides, there are some particularities in the NDVI seasonal change curves of SC and HB, where NDVI shows an increasing trend from October to April. This is different from the typical seasonal change curves with two NDVI peaks during the growing season, and this may make it difficult to differentiate winter wheat from other crops. That may be the reason for relatively lower identification accuracy. So, the identification of winter crops in warmer regions should be paid more attention.
The derived winter wheat maps in China for 3 years (2016–2018) are available at https://doi.org/10.6084/m9.figshare.12003990 (Dong et al., 2020a).
To help the readers to reproduce this work, Table 3 summarizes the data source and platform information of datasets and processing steps in this study. The input datasets came from three parts including: the GEE platform, our group, and freely accessible websites. Specifically, the four satellite datasets in Sect. 2.3.1 were available at the GEE platform. The survey samples were collected by our group from the three sources, which have been introduced in detail in Sect. 2.3.2. The land cover product (i.e., FROM-GLC product) in Sect. 2.3.3 was downloaded from the freely accessible website of Tsinghua University, and the agricultural statistical area data in Sect. 2.3.3 were downloaded from the National Bureau of Statistics of China.
In addition, the process of monthly maximum NDVI composition was implemented on the GEE platform. The TWDTW algorithm, the exclusion of disturbances of winter rapeseed, and the classification accuracy assessment were operated on the localhost platform.
Table 3The detailed information of the datasets and processes in this study.

Information on the geographical location and distribution of crops at global, national, and regional scales is valuable for many applications. To our knowledge, there are no published distribution maps for winter wheat over China on a large scale with a spatial resolution of 30 m. Based on the available Landsat and Sentinel imageries and a time-weighted dynamic time warping (TWDTW) method, this study produced an unprecedented 30 m spatial resolution winter wheat distribution map of China for the period of 2016–2018. The method performed well over the 11 provinces that produce more than 98 % of the winter wheat in China. When validated with 33 776 survey samples, the overall accuracy was 89.88 %, and the producer's and user's accuracies reached 89.30 % and 90.59 %, respectively. The resultant planting areas of winter wheat were spatially consistent with the agricultural statistical area, and the method explained 78 % of the spatial variabilities in the planting areas at the county level averaged over six provinces. More importantly, this method is effective in identifying the planting areas of winter wheat 3 months prior to harvest, which is beneficial for early yield estimation. In general, this paper produced a 30 m spatial resolution winter wheat map of China, which is expected to contribute to the timely monitoring of winter wheat growth. In future work, the main goal to be achieved is to improve the method and apply it to other staple crops (e.g., corn and rice) and eventually complete maps of staple crops at national scales.
WY and JD designed the research, performed the analysis, and wrote the paper; YF, JW, SF, YZ, and WH performed the analysis; ZN, JH, and HT edited and revised the paper.
The authors declare that they have no conflict of interest.
We would like to thank the editor and the two reviewers for their valuable comments. We would also like to thank all the scientists and students who participated in the field observations.
This research has been supported by the China National Funds for Distinguished Young Scientists (grant no. 41925001), the National Youth Top-Notch Talent Support Program (grant no. 2015-48), the Changjiang Young Scholars Program of China (grant no. Q2016161), and the Fundamental Research Funds for the Central Universities (grant no. 19lgjc02).
This paper was edited by David Carlson and reviewed by Sergii Skakun and one anonymous referee.
Abramov, S., Rubel, O., Lukin, V., Kozhemiakin, R., Kussul, N., Shelestov, A., and Lavreniuk, M.: Speckle reducing for Sentinel-1 SAR data, in: 2017 IEEE International Geoscience and Remote Sensing Symposium (IGARSS), 27 July 2017, Fort Worth, TX, USA, 2353–2356, 2017.
Anhui Statistical Bureau: Anhui Statistical Yearbook, China Statistics Press, Beijing, 2018.
Belgiu, M. and Csillik, O.: Sentinel-2 cropland mapping using pixel-based and object-based time-weighted dynamic time warping analysis, Remote Sens. Environ., 204, 509–523, https://doi.org/10.1016/j.rse.2017.10.005, 2017.
Boryan, C., Yang, Z., Mueller, R., and Craig, M.: Monitoring US agriculture: the US Department of Agriculture, National Agricultural Statistics Service, Cropland Data Layer Program, Geocarto Int., 26, 341–358, https://doi.org/10.1080/10106049.2011.562309, 2011.
Brown, J. F. and Pervez, M. S.: Merging remote sensing data and national agricultural statistics to model change in irrigated agriculture, Agr. Syst., 127, 28–40, https://doi.org/10.1016/j.agsy.2014.01.004, 2014.
Cai, Y., Guan, K., Peng, J., Wang, S., Seifert, C., Wardlow, B., and Li, Z.: A high-performance and in-season classification system of field-level crop types using time-series Landsat data and a machine learning approach, Remote Sens. Environ., 210, 35–47, https://doi.org/10.1016/j.rse.2018.02.045, 2018.
Chipanshi, A., Zhang, Y., Kouadio, L., Newlands, N., Davidson, A., Hill, H., Warren, R., Qian, B., Daneshfar, B., Bedard, F., and Reichert, G.: Evaluation of the Integrated Canadian Crop Yield Forecaster (ICCYF) model for in-season prediction of crop yield across the Canadian agricultural landscape, Agr. Forest Meteorol., 206, 137–150, https://doi.org/10.1016/j.agrformet.2015.03.007, 2015.
Dong, J., Xiao, X., Kou, W., Qin, Y., Zhang, G., Li, L., Jin, C., Zhou, Y., Wang, J., Biradar, C., Liu, J., and Moore, B.: Tracking the dynamics of paddy rice planting area in 1986–2010 through time series Landsat images and phenology-based algorithms, Remote Sens. Environ., 160, 99–113, https://doi.org/10.1016/j.rse.2015.01.004, 2015.
Dong, J., Fu, Y., Wang, J., Tian, H., Fu, S., Niu, Z., Han, W., Zheng, Y., Huang, J., and Yuan, W.: Early-season mapping of winter wheat in China based on Landsat and Sentinel images, figshare Dataset, https://doi.org/10.6084/m9.figshare.12003990, 2020a.
Dong, J., Lu, H., Wang, Y., Ye, T., and Yuan, W.: Estimating winter wheat yield based on a light use efficiency model and wheat variety data, ISPRS J. Photogramm., 160, 18–32, https://doi.org/10.1016/j.isprsjprs.2019.12.005, 2020b.
ESA: Sentinel-2 User Handbook, European Space Agency, Paris, France, 2015.
FAOSTAT: Food and Agriculture Organization of the United Nations, FAO Statistical Databases, available at: http://www.fao.org/faostat/en/ (last access: 17 February 2020), 2018.
Franch, B., Vermote, E. F., Becker-Reshef, I., Claverie, M., Huang, J., Zhang, J., Justice, C., and Sobrino, J. A.: Improving the timeliness of winter wheat production forecast in the United States of America, Ukraine and China using MODIS data and NCAR Growing Degree Day information, Remote Sens. Environ., 161, 131–148, https://doi.org/10.1016/j.rse.2015.02.014, 2015.
Franch, B., Vermote, E. F., Skakun, S., Roger, J. C., Becker-Reshef, I., Murphy, E., and Justice, C.: Remote sensing based yield monitoring: Application to winter wheat in United States and Ukraine, Int. J. Appl. Earth Obs., 76, 112–127, https://doi.org/10.1016/j.jag.2018.11.012, 2019.
Gong, P., Wang, J., Yu, L., Zhao, Y., and Chen, J.: Finer resolution observation and monitoring of global land cover: First mapping results with Landsat TM and ETM+ data, Int. J. Remote Sens., 34, 2607–2654, https://doi.org/10.1080/01431161.2012.748992, 2013.
Griffiths, P., Nendel, C., and Hostert, P.: Intra-annual reflectance composites from Sentinel-2 and Landsat for national-scale crop and land cover mapping, Remote Sens. Environ., 220, 135–151, https://doi.org/10.1016/j.rse.2018.10.031, 2019.
Guan, X., Huang, C., Liu, G., Meng, X., and Liu, Q.: Mapping Rice Cropping Systems in Vietnam Using an NDVI-Based Time-Series Similarity Measurement Based on DTW Distance, Remote Sens., 8, 19, https://doi.org/10.3390/rs8010019, 2016.
Guo, C., Tang, Y., Lu, J., Zhu, Y., Cao, W., Cheng, T., Zhang, L., and Tian, Y.: Predicting wheat productivity: Integrating time series of vegetation indices into crop modeling via sequential assimilation, Agr. Forest Meteorol., 272/273, 69–80, https://doi.org/10.1016/j.agrformet.2019.01.023, 2019.
Guo, Q.: Agricultural development and adjustment of industrial structure in Northeast China, in: Annual Meeting of 2008 in Chinese Association of Agricultural Economics, 21–22 September 2008, Hefei, Anhui, China, 2008.
He, Y., Wang, C., Chen, F., Jia, H., Liang, D., and Yang, A.: Feature Comparison and Optimization for 30-M Winter Wheat Mapping Based on Landsat-8 and Sentinel-2 Data Using Random Forest Algorithm, Remote Sens., 11, 535, https://doi.org/10.3390/rs11050535, 2019.
Huang, J., Tian, L., Liang, S., Ma, H., Becker-Reshef, I., Huang, Y., Su, W., Zhang, X., Zhu, D., and Wu, W.: Improving winter wheat yield estimation by assimilation of the leaf area index from Landsat TM and MODIS data into the WOFOST model, Agr. Forest Meteorol., 204, 106–121, https://doi.org/10.1016/j.agrformet.2015.02.001, 2015.
Hubei Statistical Bureau: Hubei Statistical Yearbook, China Statistics Press, Beijing, 2018.
Inglada, J., Vincent, A., Arias, M., and Marais-Sicre, C.: Improved Early Crop Type Identification By Joint Use of High Temporal Resolution SAR And Optical Image Time Series, Remote Sens., 8, 362, https://doi.org/10.3390/rs8050362, 2016.
Jiangsu Statistical Bureau: Jiangsu Statistical Yearbook, China Statistics Press, Beijing, 2018.
Jin, Z., Azzari, G., You, C., Di Tommaso, S., Aston, S., Burke, M., and Lobell, D. B.: Smallholder maize area and yield mapping at national scales with Google Earth Engine, Remote Sens. Environ., 228, 115–128, https://doi.org/10.1016/j.rse.2019.04.016, 2019.
Johnson, D. M.: A comprehensive assessment of the correlations between field crop yields and commonly used MODIS products, Int. J. Appl. Earth Obs., 52, 65–81, https://doi.org/10.1016/j.jag.2016.05.010, 2016.
King, L., Adusei, B., Stehman, S. V., Potapov, P. V., Song, X.-P., Krylov, A., Di Bella, C., Loveland, T. R., Johnson, D. M., and Hansen, M. C.: A multi-resolution approach to national-scale cultivated area estimation of soybean, Remote Sens. Environ., 195, 13–29, https://doi.org/10.1016/j.rse.2017.03.047, 2017.
Kontgis, C., Schneider, A., and Ozdogan, M.: Mapping rice paddy extent and intensification in the Vietnamese Mekong River Delta with dense time stacks of Landsat data, Remote Sens. Environ., 169, 255–269, https://doi.org/10.1016/j.rse.2015.08.004, 2015.
Lhermitte, S., Verbesselt, J., Verstraeten, W. W., and Coppin, P.: A comparison of time series similarity measures for classification and change detection of ecosystem dynamics, Remote Sens. Environ., 115, 3129–3152, https://doi.org/10.1016/j.rse.2011.06.020, 2011.
Li, C., Gong, P., Wang, J., Zhu, Z., Biging, G. S., Yuan, C., Hu, T., Zhang, H., Wang, Q., and Li, X.: The first all-season sample set for mapping global land cover with Landsat-8 data, Sci. Bull., 62, 508–515, https://doi.org/10.1016/j.scib.2017.03.011, 2017.
Li, M. and Bijker, W.: Vegetable classification in Indonesia using Dynamic Time Warping of Sentinel-1A dual polarization SAR time series, Int. J. Appl. Earth Obs., 78, 268–280, https://doi.org/10.1016/j.jag.2019.01.009, 2019.
Liu, J., Feng, Q., Gong, J., Zhou, J., Liang, J., and Li, Y.: Winter wheat mapping using a random forest classifier combined with multi-temporal and multi-sensor data, Int. J. Digit. Earth, 11, 783–802, https://doi.org/10.1080/17538947.2017.1356388, 2018.
Maus, V., Camara, G., Cartaxo, R., Sanchez, A., Ramos, F. M., and de Queiroz, G. R.: A Time-Weighted Dynamic Time Warping Method for Land-Use and Land-Cover Mapping, IEEE J. Sel. Top. Appl., 9, 3729–3739, https://doi.org/10.1109/JSTARS.2016.2517118, 2016.
McNairn, H., Kross, A., Lapen, D., Caves, R., and Shang, J.: Early season monitoring of corn and soybeans with TerraSAR-X and RADARSAT-2, Int. J. Appl. Earth Obs., 28, 252–259, https://doi.org/10.1016/j.jag.2013.12.015, 2014.
Millard, K. and Richardson, M.: On the Importance of Training Data Sample Selection in Random Forest Image Classification: A Case Study in Peatland Ecosystem Mapping, Remote Sens., 7, 8489–8515, https://doi.org/10.3390/rs70708489, 2015.
National Bureau of Statistics of China: National statistical yearbook, China Statistics Press, Beijing, 2018.
Pan, Y., Li, L., Zhang, J., Liang, S., Zhu, X., and Sulla-Menashe, D.: Winter wheat area estimation from MODIS-EVI time series data using the Crop Proportion Phenology Index, Remote Sens. Environ., 119, 232–242, https://doi.org/10.1016/j.rse.2011.10.011, 2012.
Petitjean, F., Inglada, J., and Gancarski, P.: Satellite Image Time Series Analysis Under Time Warping, IEEE T. Geosci. Remote, 50, 3081–3095, https://doi.org/10.1109/TGRS.2011.2179050, 2012.
Qiu, B., Luo, Y., Tang, Z., Chen, C., Lu, D., Huang, H., Chen, Y., Chen, N., and Xu, W.: Winter wheat mapping combining variations before and after estimated heading dates, ISPRS J. Photogramm., 123, 35–46, https://doi.org/10.1016/j.isprsjprs.2016.09.016, 2017.
Sakoe, H. and Chiba, S.: Dynamic programming algorithm optimization for spoken word recognition, IEEE T. Acoust. Speech, 26, 43–49, https://doi.org/10.1109/TASSP.1978.1163055, 1978.
Shandong Statistical Bureau: Shandong Statistical Yearbook, China Statistics Press, Beijing, 2018.
Shao, Y., Campbell, J. B., Taff, G. N., and Zheng, B.: An analysis of cropland mask choice and ancillary data for annual corn yield forecasting using MODIS data, Int. J. Appl. Earth Obs., 38, 78–87, https://doi.org/10.1016/j.jag.2014.12.017, 2015.
Skakun, S., Vermote, E., Roger, J.-C., and Franch, B.: Combined Use of Landsat-8 and Sentinel-2A Images for Winter Crop Mapping and Winter Wheat Yield Assessment at Regional Scale, AIMS Geosciences, 3, 163–186, https://doi.org/10.3934/geosci.2017.2.163, 2017a.
Skakun, S., Franch, B., Vermote, E., Roger, J.-C., Becker-Reshef, I., Justice, C., and Kussul, N.: Early season large-area winter crop mapping using MODIS NDVI data, growing degree days information and a Gaussian mixture model, Remote Sens. Environ., 195, 244–258, https://doi.org/10.1016/j.rse.2017.04.026, 2017b.
Song, Q., Hu, Q., Zhou, Q., Hovis, C., Xiang, M., Tang, H., and Wu, W.: In-Season Crop Mapping with GF-1/WFV Data by Combining Object-Based Image Analysis and Random Forest, Remote Sens., 9, 1184, https://doi.org/10.3390/rs9111184, 2017.
Song, X.-P., Potapov, P. V., Krylov, A., King, L., Di Bella, C. M., Hudson, A., Khan, A., Adusei, B., Stehman, S. V., and Hansen, M. C.: National-scale soybean mapping and area estimation in the United States using medium resolution satellite imagery and field survey, Remote Sens. Environ., 190, 383–395, https://doi.org/10.1016/j.rse.2017.01.008, 2017.
Tian, H., Huang, N., Niu, Z., Qin, Y., Pei, J., and Wang, J.: Mapping Winter Crops in China with Multi-Source Satellite Imagery and Phenology-Based Algorithm, Remote Sens., 11, 820, https://doi.org/10.3390/rs11070820, 2019.
Trenberth, K. E., Dai, A., van der Schrier, G., Jones, P. D., Barichivich, J., Briffa, K. R., and Sheffield, J.: Global warming and changes in drought, Nature Clim. Change, 4, 17–22, https://doi.org/10.1038/nclimate2067, 2014.
USDA ERS, Economic Research Service, United States Department of Agriculture: Wheat Data, available at: https://www.ers.usda.gov/data-products/wheat-data/, last access: 12 October 2018.
Valero, S., Morin, D., Inglada, J., Sepulcre, G., Arias, M., Hagolle, O., Dedieu, G., Bontemps, S., Defourny, P., and Koetz, B.: Production of a Dynamic Cropland Mask by Processing Remote Sensing Image Series at High Temporal and Spatial Resolutions, Remote Sens., 8, 1–21, https://doi.org/10.3390/rs8010055, 2016.
Veloso, A., Mermoz, S., Bouvet, A., Le Toan, T., Planells, M., Dejoux, J.-F., and Ceschia, E.: Understanding the temporal behavior of crops using Sentinel-1 and Sentinel-2-like data for agricultural applications, Remote Sens. Environ., 199, 415–426, https://doi.org/10.1016/j.rse.2017.07.015, 2017.
Wang, S., Azzari, G., and Lobell, D. B.: Crop type mapping without field-level labels: Random forest transfer and unsupervised clustering techniques, Remote Sens. Environ., 222, 303–317, https://doi.org/10.1016/j.rse.2018.12.026, 2019.
Wardlow, B., Egbert, S., and Kastens, J.: Analysis of time-series MODIS 250 m vegetation index data for crop classification in the U.S. Central Great Plains, Remote Sens. Environ., 108, 290–310, https://doi.org/10.1016/j.rse.2006.11.021, 2007.
Wardlow, B. D. and Egbert, S. L.: Large-area crop mapping using time-series MODIS 250 m NDVI data: An assessment for the U.S. Central Great Plains, Remote Sens. Environ., 112, 1096–1116, https://doi.org/10.1016/j.rse.2007.07.019, 2008.
Wu, W., Shibasaki, R., Yang, P., Tan, G., Matsumura, K., and Sugimoto, K.: Global-scale modelling of future changes in sown areas of major crops, Ecol. Model., 208, 378–390, https://doi.org/10.1016/j.ecolmodel.2007.06.012, 2007.
Yang, N., Liu, D., Feng, Q., Xiong, Q., Zhang, L., Ren, T., Zhao, Y., Zhu, D., and Huang, J.: Large-Scale Crop Mapping Based on Machine Learning and Parallel Computation with Grids, Remote Sens., 11, 1500, https://doi.org/10.3390/rs11121500, 2019.
Yin, L., You, N., Zhang, G., Huang, J., and Dong, J.: Optimizing Feature Selection of Individual Crop Types for Improved Crop Mapping, Remote Sens., 12, 162, https://doi.org/10.3390/rs12010162, 2020.
Zambrano, F., Vrieling, A., Nelson, A., Meroni, M., and Tadesse, T.: Prediction of drought-induced reduction of agricultural productivity in Chile from MODIS, rainfall estimates, and climate oscillation indices, Remote Sens. Environ., 219, 15–30, https://doi.org/10.1016/j.rse.2018.10.006, 2018.
Zhang, X., Qiu, F., and Qin, F.: Identification and mapping of winter wheat by integrating temporal change information and Kullback–Leibler divergence, Int. J. Appl. Earth Obs., 76, 26–39, https://doi.org/10.1016/j.jag.2018.11.002, 2019.
Zheng, B., Myint, S. W., Thenkabail, P. S., and Aggarwal, R. M.: A support vector machine to identify irrigated crop types using time-series Landsat NDVI data, Int. J. Appl. Earth Obs., 34, 103–112, https://doi.org/10.1016/j.jag.2014.07.002, 2015.
Zhong, L., Gong, P., and Biging, G. S.: Efficient corn and soybean mapping with temporal extendability: A multi-year experiment using Landsat imagery, Remote Sens. Environ., 140, 1–13, doi.org/10.1016/j.rse.2013.08.023, 2014.
Zhong, L., Hu, L., Zhou, H., and Tao, X.: Deep learning based winter wheat mapping using statistical data as ground references in Kansas and northern Texas, US, Remote Sens. Environ., 233, 111411, https://doi.org/10.1016/j.rse.2019.111411, 2019.
Zhuo, W., Huang, J., Li, L., Zhang, X., Ma, H., Gao, X., Huang, H., Xu, B., and Xiao, X.: Assimilating Soil Moisture Retrieved from Sentinel-1 and Sentinel-2 Data into WOFOST Model to Improve Winter Wheat Yield Estimation, Remote Sens., 11, 1618, https://doi.org/10.3390/rs11131618, 2019.