the Creative Commons Attribution 4.0 License.
the Creative Commons Attribution 4.0 License.
 | 16 Nov 2020
Constructing a complete landslide inventory dataset for the 2018 monsoon disaster in Kerala, India, for land use change analysis
Lina Hao
Rajaneesh A.
Sajinkumar K. S.
Tapas Ranjan Martha
Pankaj Jaiswal
Brian G. McAdoo
Event-based landslide inventories are important for analyzing the relationship between the intensity of the trigger (e.g., rainfall, earthquake) and the density of the landslides in a particular area as a basis for the estimation of the landslide probability and the conversion of susceptibility maps into hazard maps required for risk assessment. They are also crucial for the establishment of local rainfall thresholds that are the basis of early warning systems and for evaluating which land use and land cover changes are related to landslide occurrence. The completeness and accuracy of event-based landslide inventories are crucial aspects to derive reliable results or the above types of analyses. In this study, we generated a relatively complete landslide inventory for the 2018 monsoon landslide event in the state of Kerala, India, based on two inventories that were generated using different methods: one based on an object-based image analysis (OBIA) and the other on field surveys of damaging landslides. We used a collaborative mapping approach based on the visual interpretation of pre- and post-event high-resolution satellite images (HRSIs) available from Google Earth, adjusted the two inventories, and digitized landslides that were missed in the two inventories. The reconstructed landslide inventory database contains 4728 landslides consisting of 2477 landslides mapped by the OBIA method, 973 landslides mapped by field survey, 422 landslides mapped both by OBIA and field methods, and an additional 856 landslides mapped using the visual image (Google Earth) interpretation. The dataset is available at https://doi.org/10.17026/dans-x6c-y7x2 (van Westen, 2020). Also, the location of the landslides was adjusted, based on the image interpretation, and the initiation points were used to evaluate the land use and land cover changes as a causal factor for the 2018 monsoon landslides. A total of 45 % of the landslides that damaged buildings occurred due to cut-slope failures, while 34 % of those having an impact on roads were due to road cut-slope failures. The resulting landslide inventory is made available for further studies.
- Article
(32092 KB) - Full-text XML
- BibTeX
- EndNote


Landslides are a significant type of natural hazard occurring worldwide and incurring serious losses to human society. Landslides frequently damage buildings, communication systems, agriculture, natural vegetation, and the environment, and they are a major cause of fatalities (Froude and Petley, 2018; Petley et al., 2005). A landslide inventory forms the basis for studies of landslide hazard, risk, and prevention studies (Fan et al., 2019; Guzzetti et al., 2012; Marcelino et al., 2009; Moosavi et al., 2014). Critical elements of analysis include their spatial distribution pattern (Duman et al., 2005; Galli et al., 2008; Xu, 2015), their occurrences with respect to landform evolution (Guzzetti et al., 2012; Rosi et al., 2018), and a range of other environment factors (Duman et al., 2005), susceptibility mapping (van Den Eeckhaut et al., 2009), triggering factors (Li et al., 2016), community risk assessment and mitigation (Marcelino et al., 2009), and land use planning and risk management (Colombo et al., 2005). A detailed landslide inventory should contain information on location, types of failures, geometries, date of occurrence, triggering factors, possible failure mechanisms, and damage caused (Rosi et al., 2018). Landslide inventory maps can be generated by compiling existing historical landslide data or acquiring new landslide data using a variety of technical approaches (Rosi et al., 2018; Santangelo et al., 2015).
A new landslide inventory that is generated after a major triggering event, e.g., an earthquake, storm, snowmelt, or volcanic eruptions, is referred to as an event-based landslide inventory (Fiorucci et al., 2011; Galli et al., 2008; Rosi et al., 2018). Methods for event-based landslide inventories include field investigation, visual interpretation of remotely sensed images, and often an automatic image classification. Field investigation shortly after the event (Fiorucci et al., 2011; Mondini et al., 2011) allows for the collection of detailed information through field surveys recording information on the location, types, volumes, contributing factors, and damage (Yang and Chen, 2010; Samodra et al., 2018). Visual interpretation based on remote sensing images (Alkevli and Ercanoglu, 2011; Mondini et al., 2011; Samodra et al., 2018) allows us to map and classify landslides in terrain that is less accessible. This method will be more accurate when higher-resolution images are available of the situation before and after the event (Li et al., 2013; Xu et al., 2013; Zhong et al., 2019). The automated classification of remote sensing images is a means to rapidly map many landslides over large areas, using different classification algorithms (Aksoy and Ercanoglu, 2012; Lei et al., 2018; Lu et al., 2019; Plank et al., 2016). Often the field survey methods are combined with remote-sensing-based methods to improve accuracy (Ardizzone et al., 2012; Galli et al., 2008; Mondini et al., 2011; Oh and Pradhan, 2011; Rosi et al., 2018; Trigila et al., 2010).
With the continuous improvement of earth observation technology, such as multi-temporal high-resolution optical satellite remote sensing, it is more feasible to acquire remote sensing images before and after an event, which leads to more landslide inventory maps (Casagli et al., 2016; Santangelo et al., 2015; Solari et al., 2019; Travelletti et al., 2012). The availability of multi-sourced and multi-temporal high-resolution satellite images (HRSIs) on the Google Earth platform with 3D viewing capabilities (Crosby, 2012; Fisher et al., 2012) offered major advantages for landslide inventory mapping (Mohammadi et al., 2018). Many authors have generated landslide inventories using the Google Earth platform (Rabby and Li, 2019; Sato and Harp, 2009; Fiorucci et al., 2011; Borrelli et al., 2015). It has also proven to be possible to map event-based landslides by comparing images before and after the event using the Google Earth history viewer (Xu et al., 2014a, b). However, recognizing and mapping specific types of landslides such as rainfall triggered shallow landslides over large areas can be still challenging when using automated techniques. Field verification is only feasible for a limited number of landslides as it is time and labor intensive, and many landslides may be difficult to access. Therefore, visual image interpretation using HRSI from different time periods may be the best solution. Landslide mapping and classification requires mapping experience and the availability of HRSI in 3D views, using either stereo images or oblique views such as in Google Earth, allowing us to recognize the specific diagnostic features (Soeters and van Westen, 1996; Zieher et al., 2016).
Between 1 June and 26 August 2018, the southern Indian state of Kerala witnessed the most severe extreme rainfall event since 1924 (Agarwal, 2018; Megha et al., 2019; Sankar, 2018; Vishnu et al., 2019). The torrential rains triggered several thousand landslides (Singh et al., 2018) and extensive flooding, affecting 5.4 million people in over 1200 villages and causing enormous property losses (buildings, roads, and agriculture damage) and more than 440 casualties (Mishra et al., 2018; Vishnu et al., 2019). Furthermore, the following year, from 8 to 14 August, 2019, Kerala was hit again by another extreme precipitation event, causing more than 100 deaths due to landslides and floods (Koshy, 2019). Due to these severe events, both the United Nations Environment Programme (UNEP) and the Government of Kerala came together to study the causes of the extreme occurrences of slope failure in this region. Concern was raised whether anthropogenic activities such as deforestation and agriculture exacerbate the occurrence of mass movements in this region. In order to study this, a complete event-based landslide inventory is required that contains detailed land use information to determine a causal relationship.
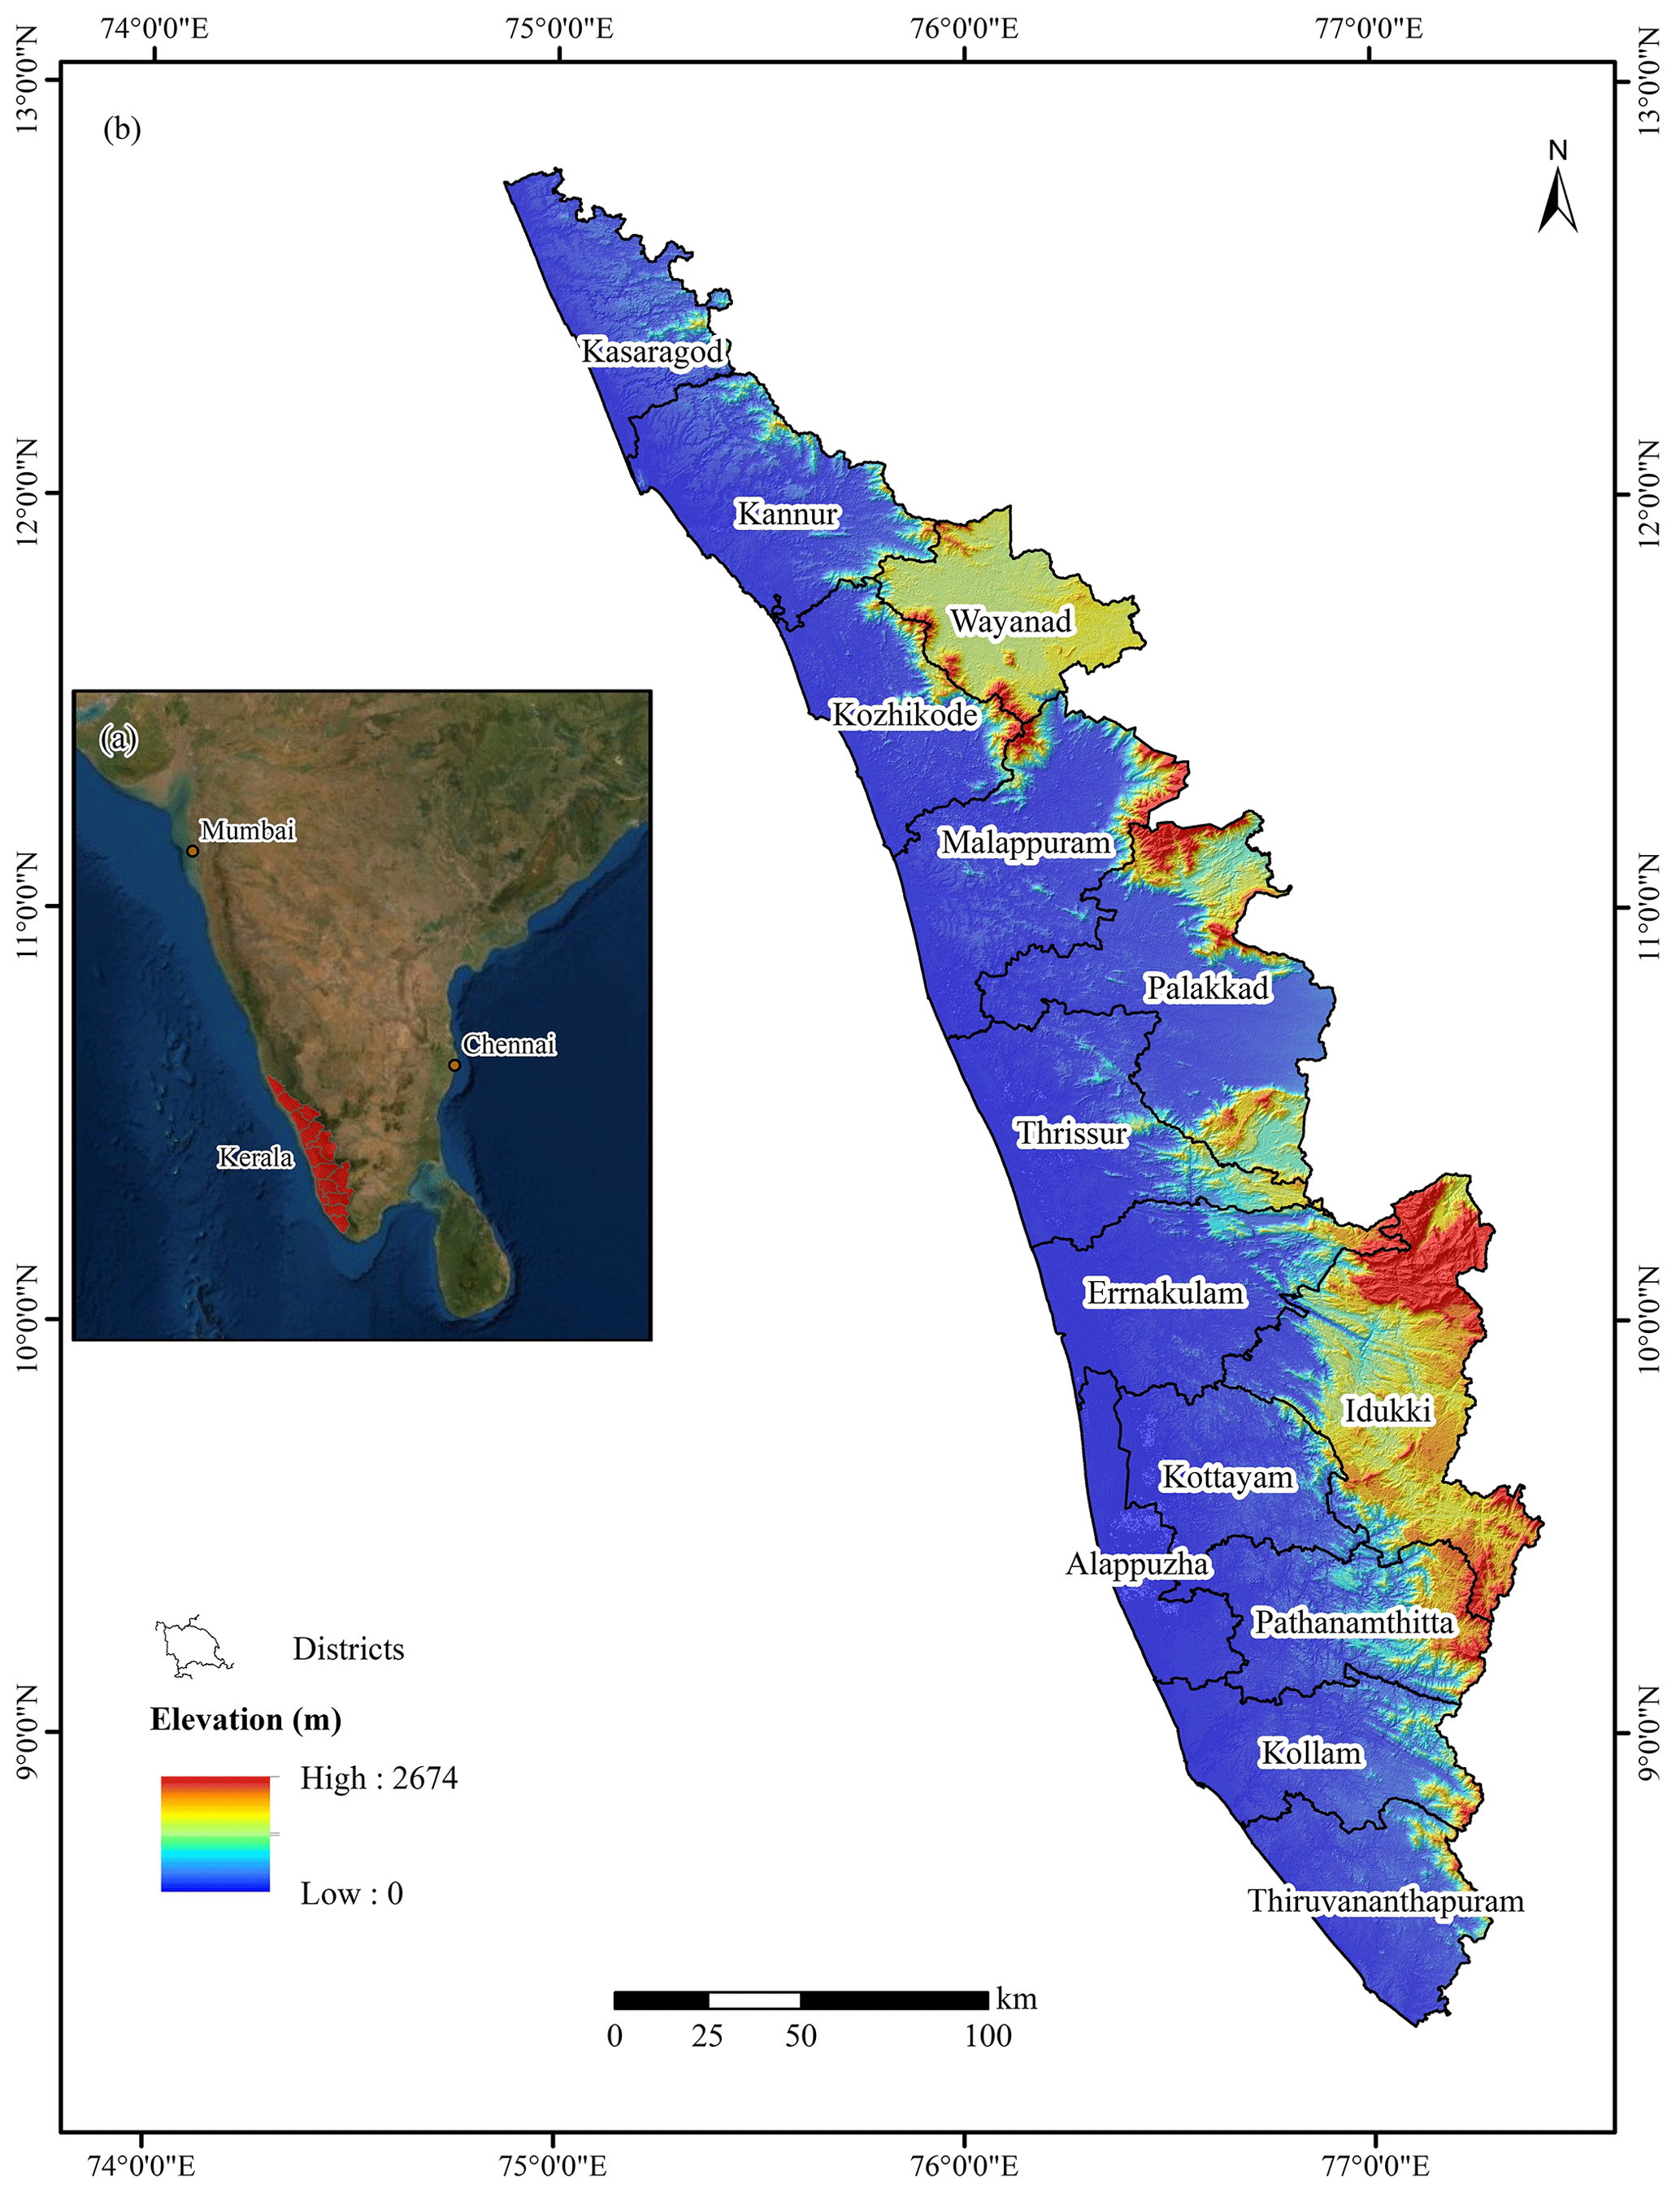
Figure 1Overview map of Kerala with districts and elevation.
In this research, we generated a complete landslide inventory for the 2018 monsoon event in Kerala using a collaborative mapping approach based on the visual interpretation of pre- and post-event HRSIs available in Google Earth and two pre-existing inventories. This paper focuses on the generation of the dataset consisting of a detailed landslide inventory with land use and land cover (LULC) information for two periods: shortly before the event and almost a decade before. The main objective of the study is to develop a comprehensive event-based landslide inventory database for the 2018 monsoon in Kerala that can be used to analyze the extent to which these landslides were affected by land use changes.

Figure 2Overview map of the existing inventories.
2.1 Study area
Kerala is one of the most susceptible areas to mass movements in India (Sreekumar, 2009; Vasudevan and Ramanathan, 2016) with a long history for the natural occurrence of slope instability going back to 1341 CE (Kuriakose et al., 2009). Both the climate and landscape make slopes in Kerala prone to failures. Kerala is located in the southwest of the Indian Peninsula in the windward slope of the Western Ghats (Sajinkumar et al., 2011) and on the east coast of the Arabian Sea (Fig. 1a) with a typical tropical climate (the average minimum and maximum temperatures are 22 and 34 ∘C) characterized by two monsoon seasons. The southwest monsoon, lasting from June to September, delivers 80 % of the annual rainfall (Paul et al., 2016), and the remainder falls in the northeast monsoon lasting from October to November. The annual average rainfall in this area is 200 to 500 cm, which increases from the southwestern coastal plains to the mountain areas in the east due to the orographic effect of the Western Ghats (Kuriakose et al., 2009; Sajinkumar et al., 2011). Under global climate change, extreme rainfall events have hit India frequently (Mishra et al., 2018), and the extreme rainfall events during the monsoon season are expected to increase (Hunt and Menon, 2020; Rai et al., 2019, 2020; Shashikanth et al., 2018), making it more vulnerable to slope failures.

Figure 3Examples of landslides in the NRSC inventory that were not considered as actual landslides after visual inspection. The examples in (a) and (b) show that there are no visible scarps before or after the event near the marked polygons. Basemap data © 2019 Google.
Owing to the tropical climate, weathering of the bedrock is strong in Kerala, leading to most of this area being covered with thick, poorly consolidated soil (Sajinkumar et al., 2011). The main soil is laterite with an average thickness of 5 m depending on the slope (Kuriakose et al., 2009). Physiographically, Kerala can be divided into two units: a plateau with rugged mountains and deep valleys in the east and coastal plains in the west (Fig. 1b) (Kuriakose et al., 2009; Sajinkumar and Anbazhagan, 2015; Vishnu et al., 2019). The Western Ghats are controlled by ancient faulted escarpments located along the plateau, often with very steep slopes, which are susceptible to slope failures (Kuriakose et al., 2009). Metamorphic rocks, such as charnockites, khondalites, and gneisses, are the predominant rock types in Kerala (Kuriakose et al., 2009; Sajinkumar and Anbazhagan, 2015). The combination of highly weathered bedrock and steep slopes in a monsoon climate make each district in Kerala (save the whole coastal plain district of Alappuzha) susceptible to slope instability (Fig. 1) (Kuriakose et al., 2009; Sajinkumar and Anbazhagan, 2015).
2.2 Original data
Two landslide inventories for the 2018 triggering rainfall event were available. The first inventory came from the National Remote Sensing Center (NRSC), of the Indian Space Research Organization (ISRO), which did a rapid mapping project aimed to quickly identify slope failures in the whole Western Ghats region. They used a combination of visual image interpretation and semiautomated landslide detection based on an object-based image analysis (OBIA) algorithm (Martha et al., 2010, 2011, 2012, 2013, 2016). They used multi-temporal images acquired before and after the monsoon rainfall event from Resourcesat-2 and Sentinel-2 Earth observation satellites (Martha et al., 2019), resulting in an inventory with 5191 landslide polygons for Kerala (Martha et al., 2019). This rapid assessment was crucial for the emergency response by the disaster management authorities in Kerala. The fast mapping method allowed the determination of the general distribution, density, and size of landslides in order to plan for the relief operations and overall assessment. The landslide dataset can be consulted on the Bhuvan web platform of NRSC (https://bhuvan-app1.nrsc.gov.in/disaster/disaster.php?id=landslide_monitor, last access: 9 November 2020). In this study, the original NRSC data were obtained as a polygon shapefile (Fig. 2), and then the shapefile was converted into the Keyhole Markup Language (KML) for the subsequent visual interpretation in Google Earth.
Another landslide inventory was generated by the Geological Survey of India (GSI) in collaboration with the Kerala State Disaster Management Authority (KSDMA) with the aim of making a detailed survey of the landslides that specifically caused damage to buildings, roads, and other infrastructure. It is important to recognize this deliberate bias in the dataset as almost all landslides would have been mapped near roads; almost by definition they are going to be related to human occupation and transformation of the land. During a period of several months after the event, teams from GSI visited hundreds of landslide sites. The landslides characteristics were recorded in data sheets and transferred to spreadsheets with many attributes, including the names of administrative units, latitude, longitude, types of landslide, buildings affected, roads affected, recommendations, and remarks. The GSI landslide data spanned 10 districts (Fig. 2), and the landslides studied were mainly along roads. A total of 1437 landslide points were converted into a point shapefile with all the attributes using ArcGIS 10.3 and KML for easier visual interpretation in Google Earth.
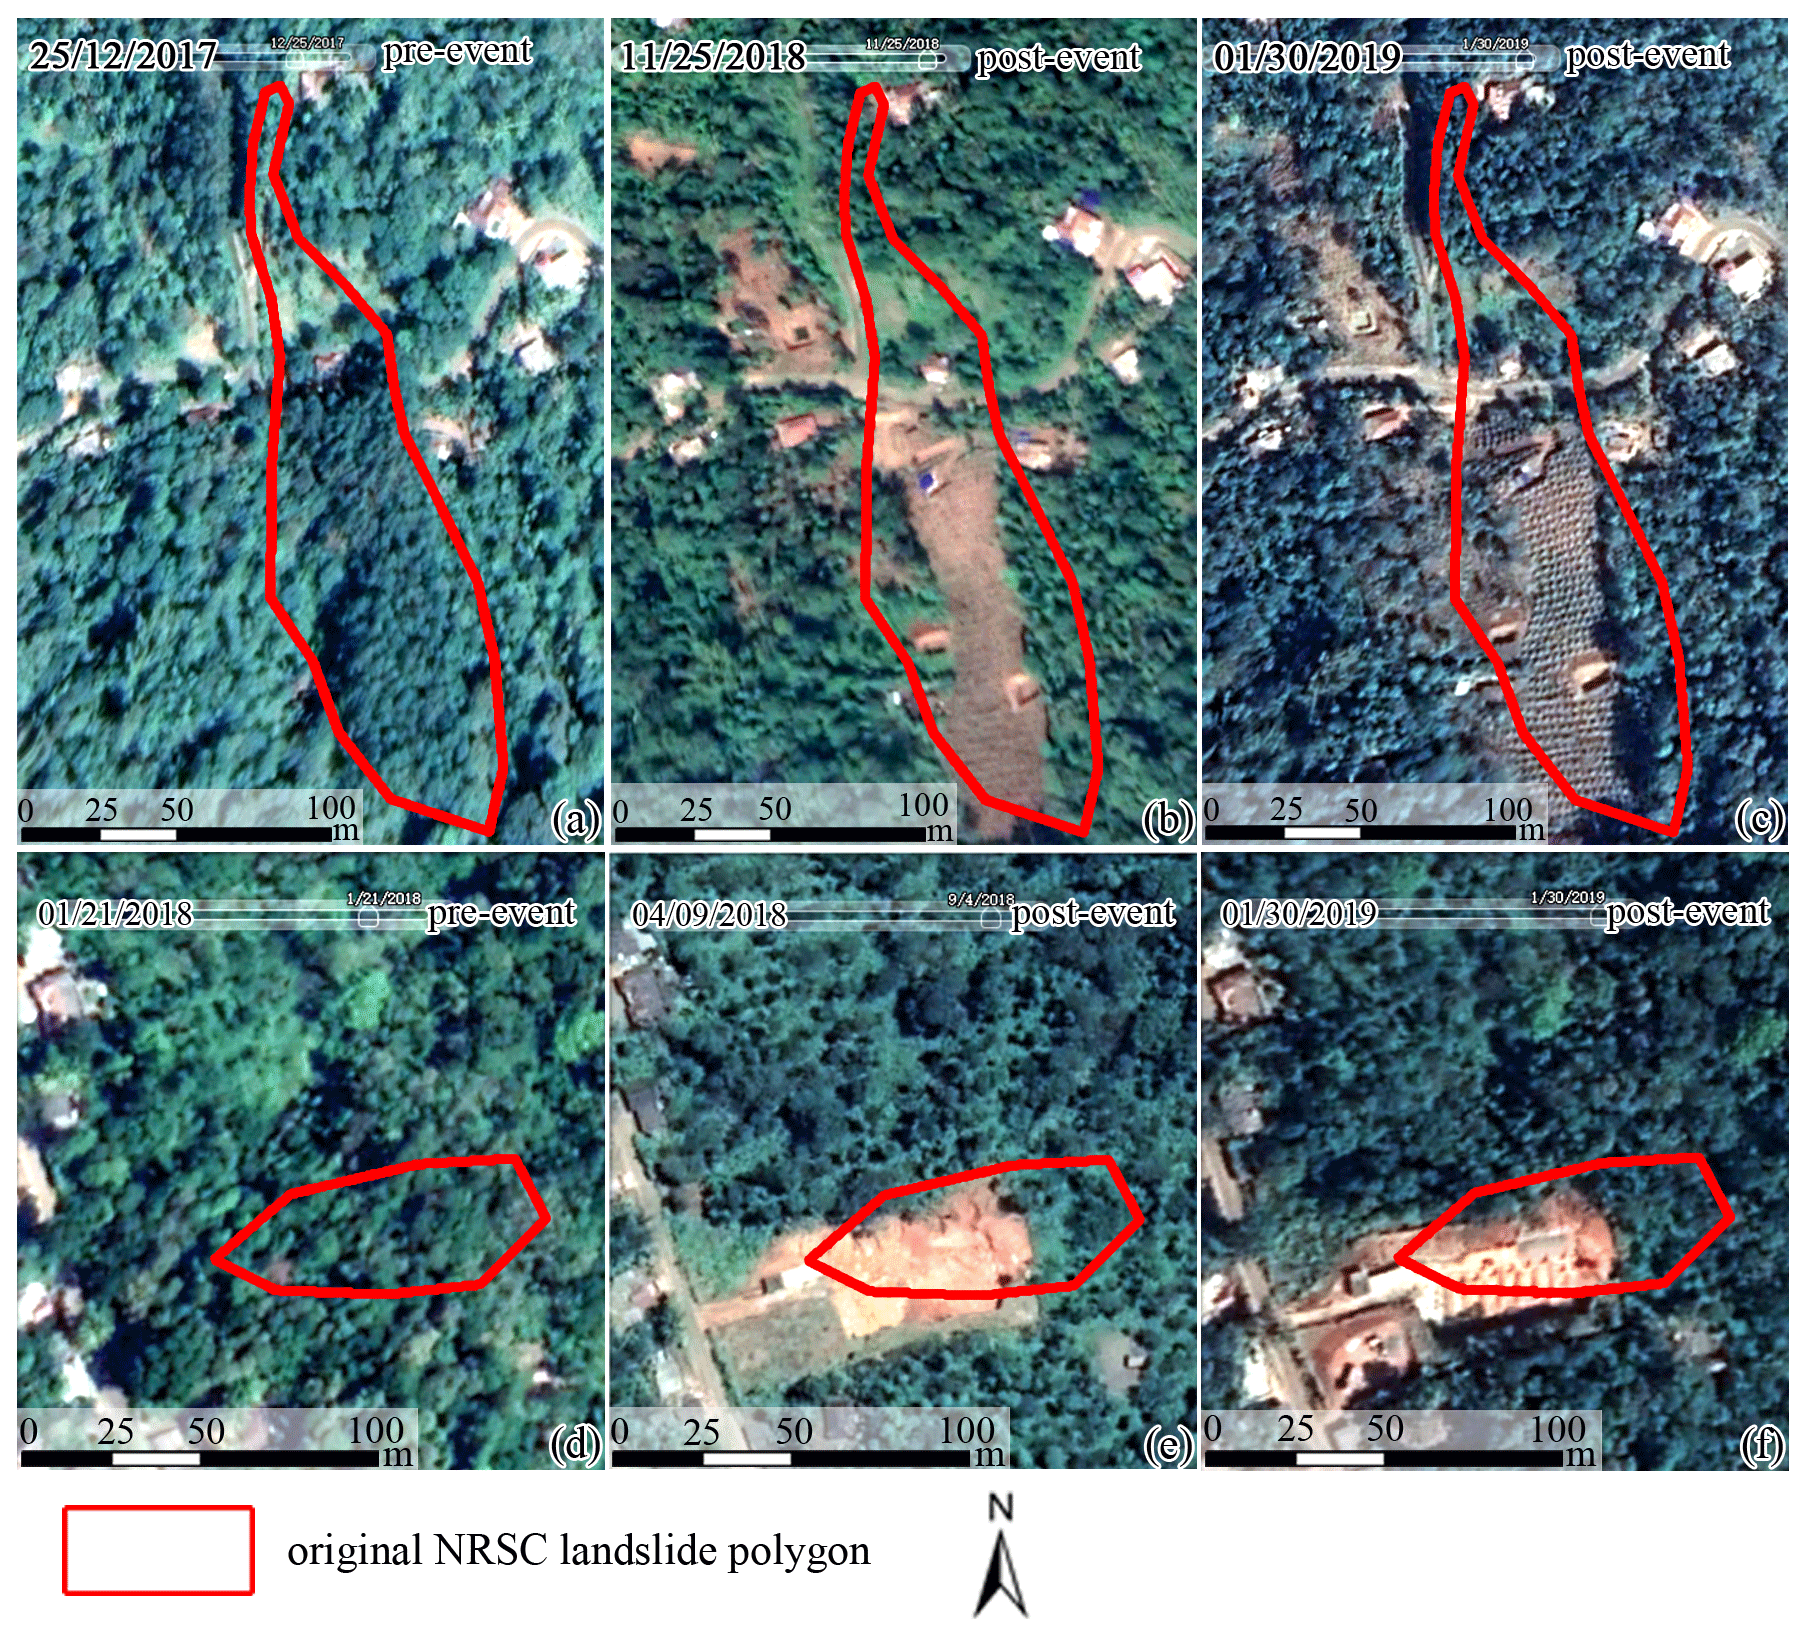
Figure 4Examples of landslides in the NRSC inventory that were not considered as actual landslides after visual inspection. The example in (a)–(c) shows that the changes in the polygon before and after the event were caused by vegetation clearing and agricultural activities. Images (d)–(f) show that the changes near the polygon before and after the event were caused by building construction. Basemap data © Google Earth 2019.
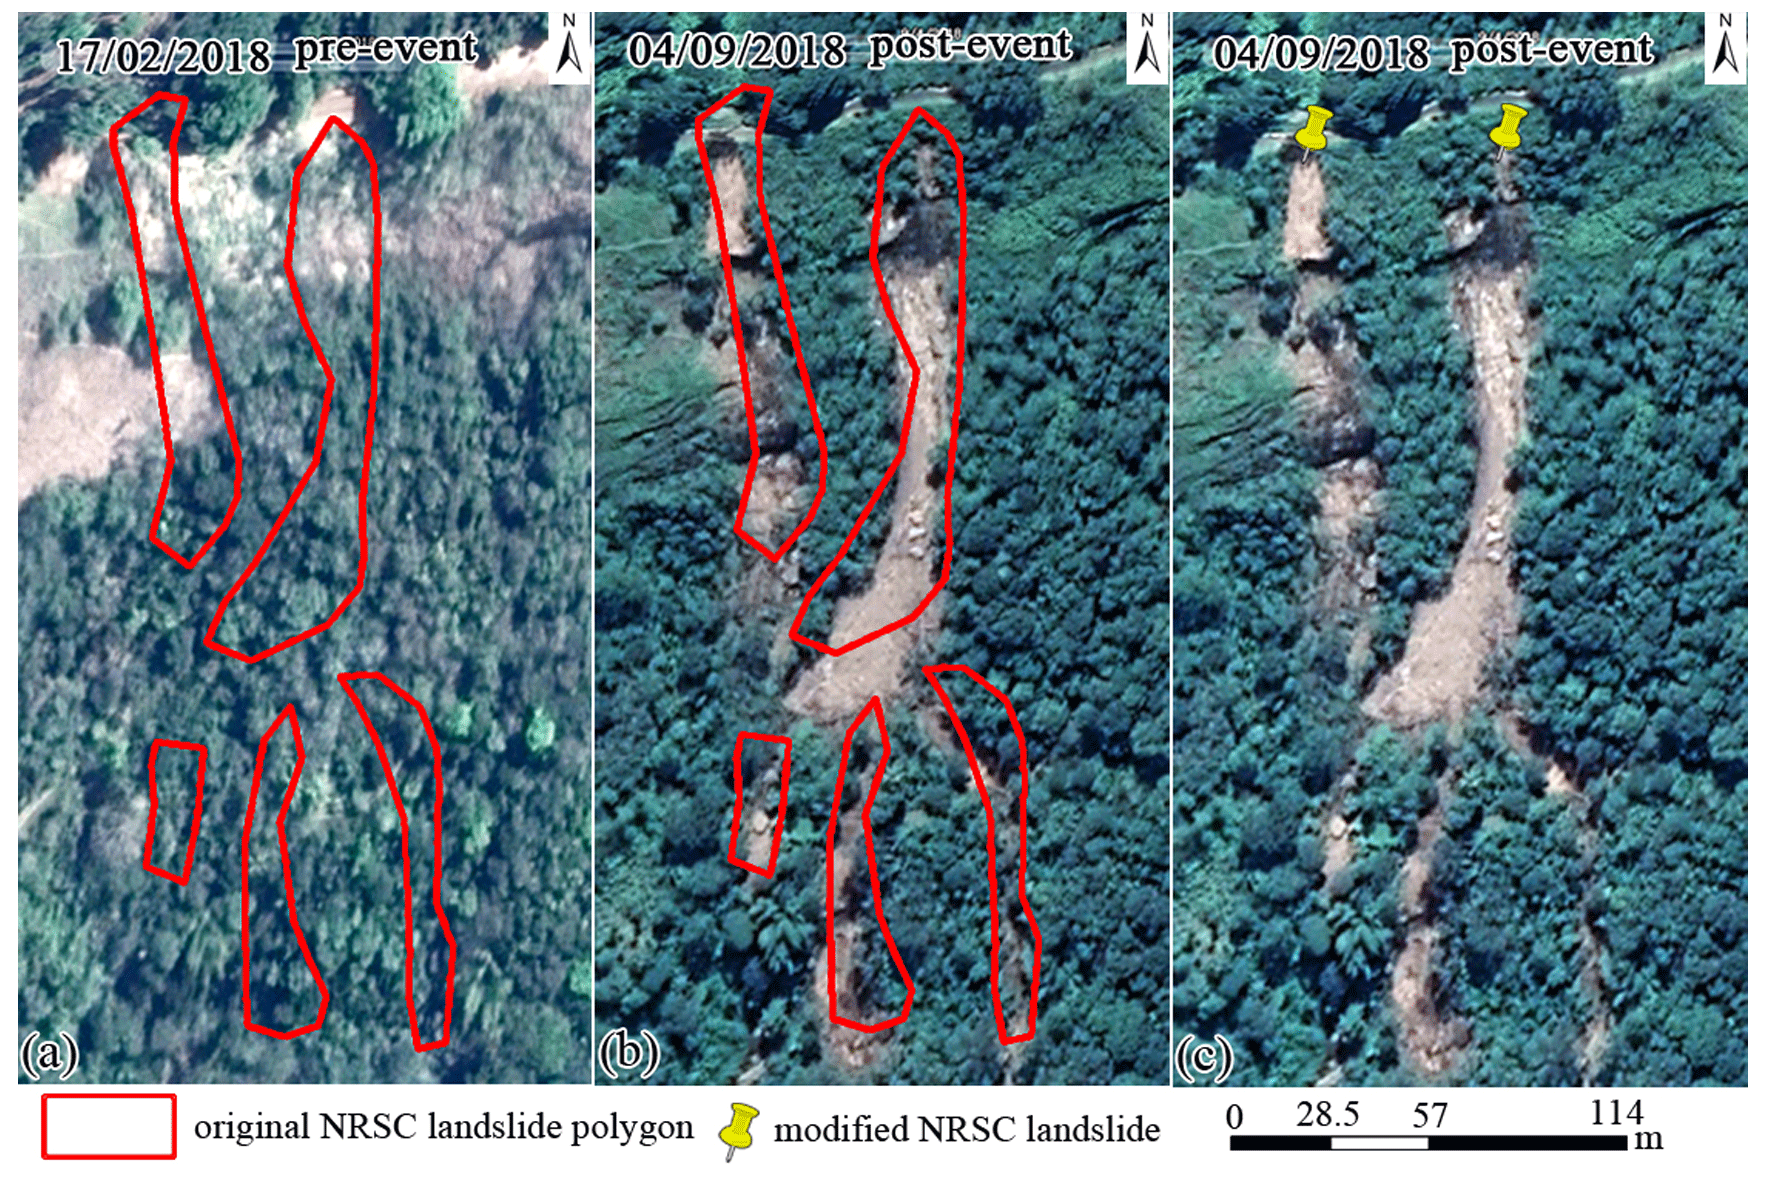
Figure 5Example of a situation where the original NRSC landslide polygons were combined and converted into points and digitized on the top of the scarps: (a) pre-landslide image, (b) post-landslide image, and (c) final inventory using points. Basemap data © Google Earth 2019.
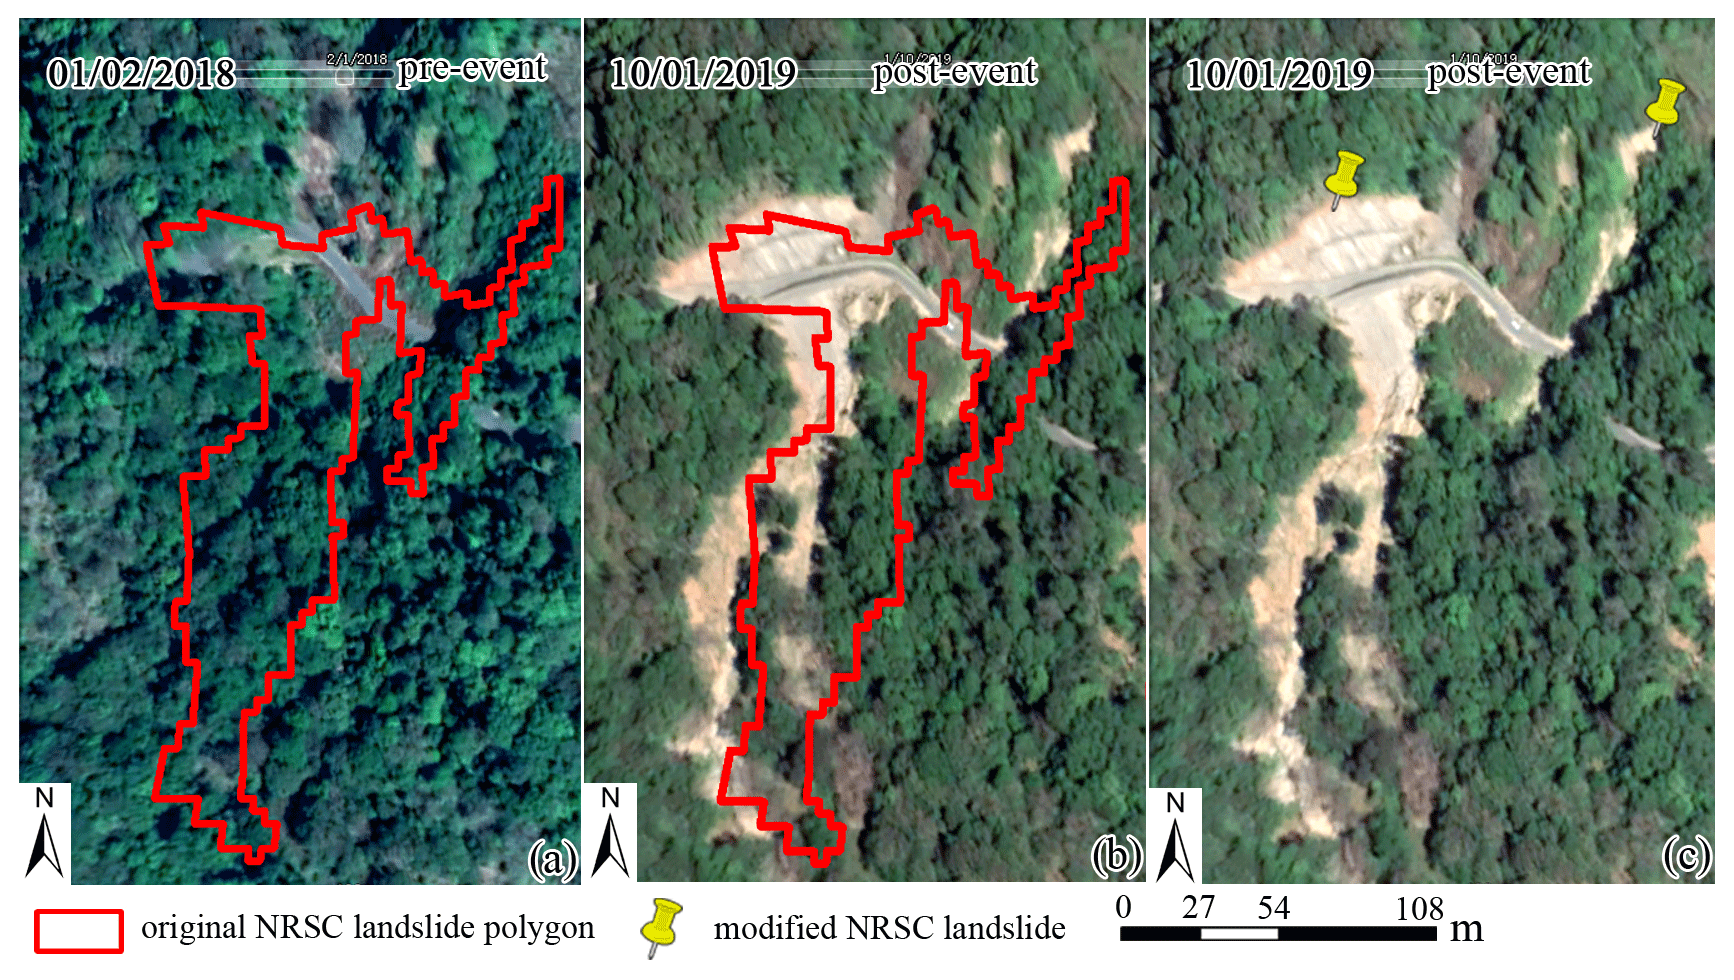
Figure 6Example of a situation where the original NRSC landslide polygon was subdivided into several landslides, marked by points and digitized on the top of the scarps: (a) pre-landslide image with NRSC landslide polygon on top, (b) post-landslide image with the NRSC polygon on top which shows that there are two landslides instead of a single one, and (c) the mapping of landslide points in the scarps of the two landslides. Basemap data © Google Earth 2019.
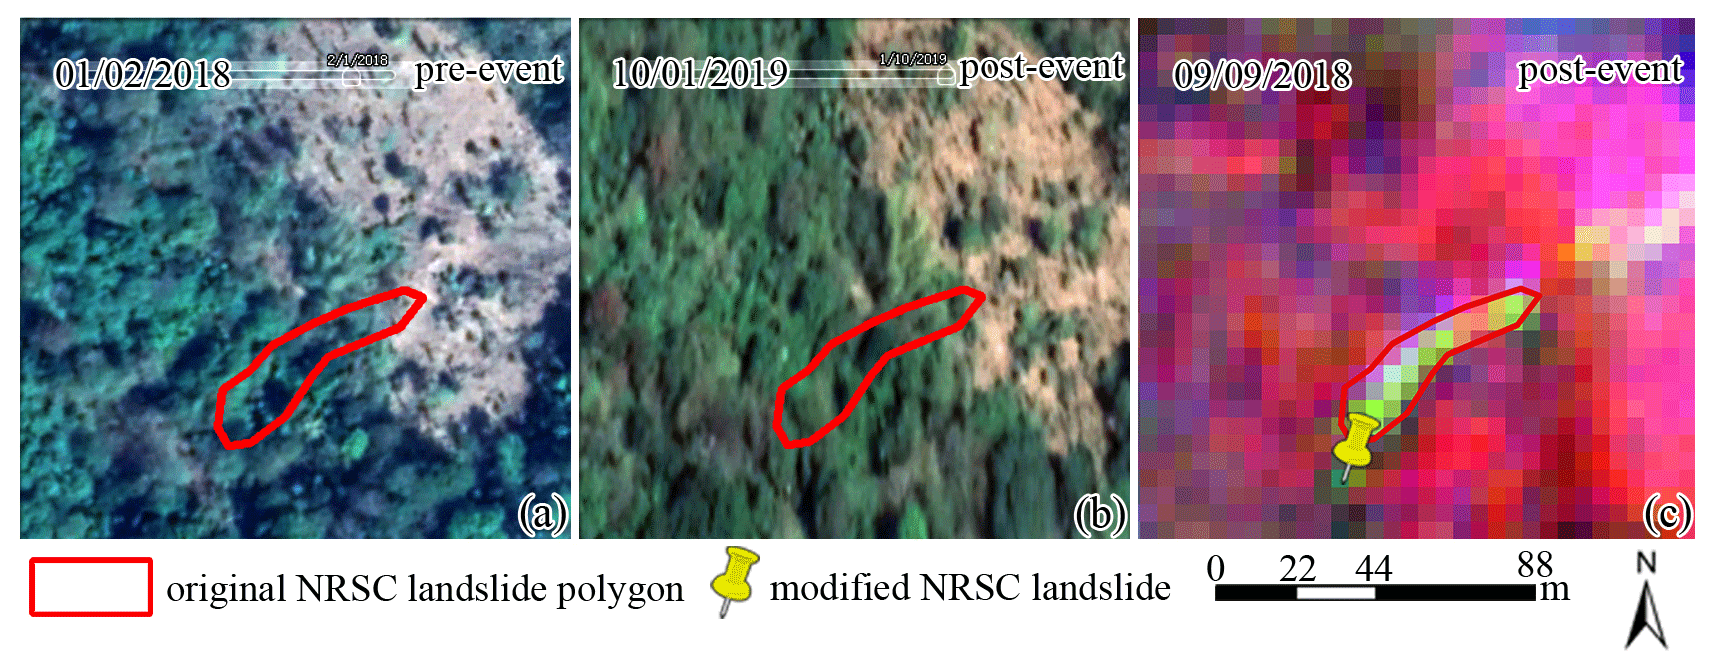
Figure 7Example of a situation where vegetation regrowth made it difficult to identify the scarps in Google Earth images due to the large time span between the event and the first available images from Google Earth. The original NRSC landslide polygons were generated from the classification of Resourcesat-2 LISS-IV images that were taken within 15 days of the event: (a) pre-landslide Google Earth image, (b) earliest available post-landslide Google Earth image in which the landslide cannot be recognized, and (c) mapping of the landslide initiation point based on Resourcesat-2 LISS-IV images (RGB combination: near infrared, red, green). Basemap data for (a) and (b) © Google Earth 2019.
2.3 Problems with the use of existing inventories
After combining the above-mentioned inventories and overlaying them on multi-sourced submeter-resolution satellite images for both the pre- and post-monsoon situation on the Google Earth platform (Jacobson et al., 2015; Rabby and Li, 2019), several problems with the data were discovered through visual interpretation.
Many challenges arose when analyzing the NRSC inventory. For some of the landslide polygons, no noticeable changes were visible in the images from before and after the event, and we decided to exclude these from the final inventory (Fig. 3a, b). In some instances, there were changes visible when comparing images before and after the event which were not caused by a landslide but by other factors, i.e., vegetation clearing (Fig. 4a–c) or engineering activities (Fig. 4d–f). These landslides were also excluded from the inventory. Instances were also found in which the landslide polygons were displaced with respect to the landslide scarps visible in the Google Earth images (Figs. 5b, 6b). The NRSC landslide polygons were derived from the automatic classification of Resourcesat-2 LISS-IV images with 5.8 m spatial resolution which were taken shortly after the event. Due to the coarse resolution and short time available for geocorrection, the images presented georeferencing errors which were responsible for the mismatches. In these cases, the landslides were mapped in the correct locations according to the Google Earth images. In other cases, a polygon in the inventory was merging several smaller ones (Fig. 5b), requiring us to map the individual landslides. Also the opposite was found in which several smaller polygons in the inventory were part of the same large landslide (Fig. 6b). Problems were also found with the use of the Google Earth images, and landslides clearly identified in the NRSC inventory could not be visually confirmed. This could be due in some areas to a long time span of 5 months between the 2018 monsoon and the first available image after the event, which caused problems with identification due to the fast regrowth of vegetation (Fig. 7b). In some cases, the post-event images in Google Earth were of poor quality due to distortion induced by steep slopes (Fig. 8b, c), shadows induced by steep slopes (Fig. 9b), or clouds obstructing the view (Fig. 10b).
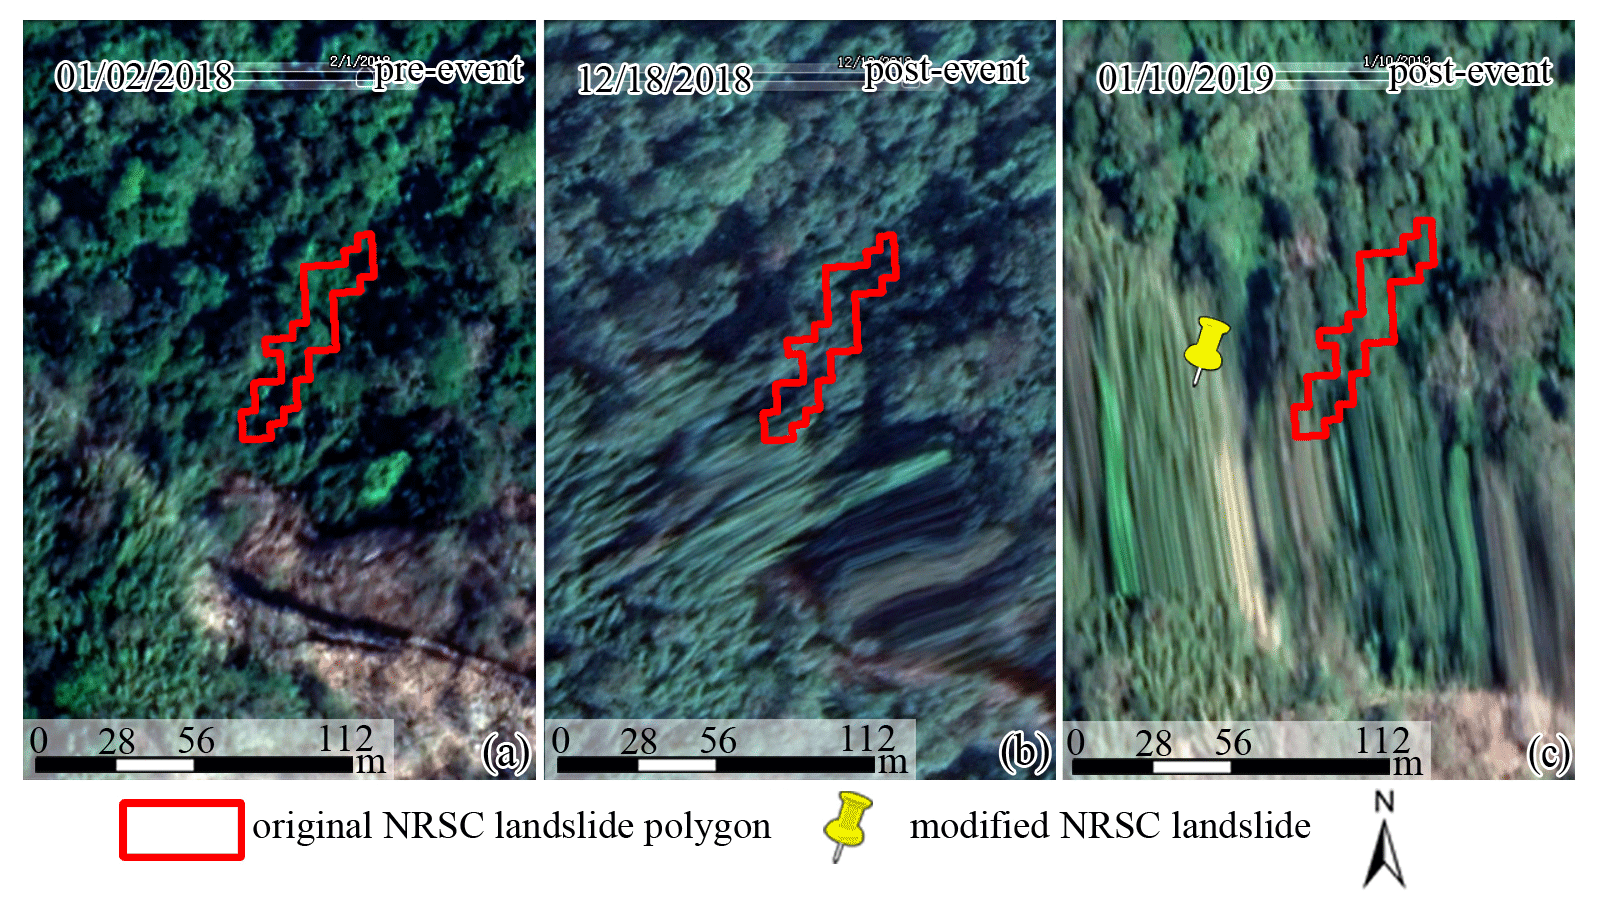
Figure 8Example of distorted images in Google Earth in which it was not possible to check the original NRSC landslide polygons. They were converted into points and digitized on the top of the scarps based on Resourcesat-2 LISS-IV images: (a) pre-landslide image, (b) post-landslide image, and (c) creation of a new inventory using points based on post-landslide image. Basemap data © Google Earth 2019.
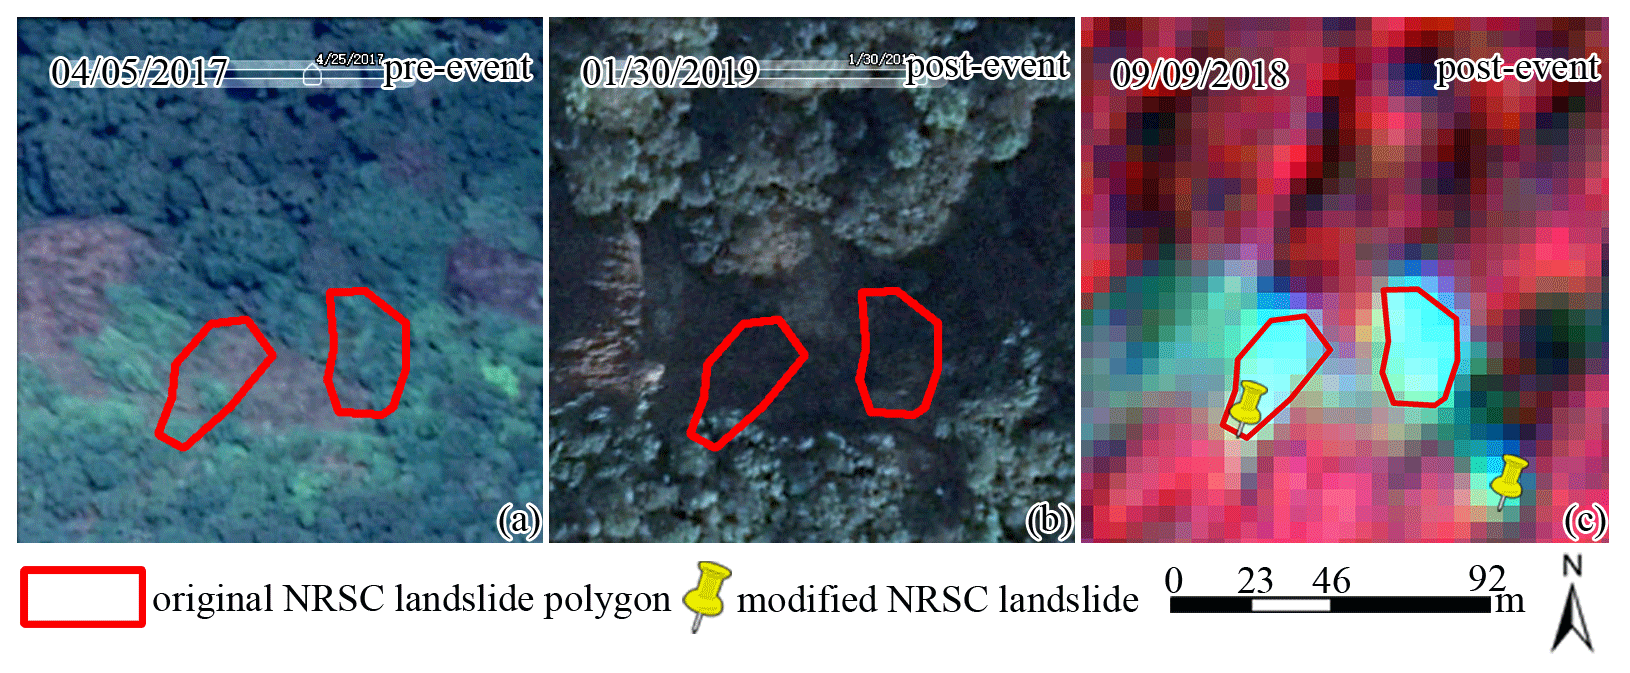
Figure 9Example of the presence of dark shadows in the post-event images in Google Earth images making it impossible to check the original NRSC landslide polygons: (a) pre-landslide Google Earth image, (b) earliest available post-landslide Google Earth image in which the landslide cannot be recognized, and (c) mapping of the landslide initiation point based on Resourcesat-2 LISS-IV image (RGB combination: near infrared, red, green). Basemap data for (a) and (b) © Google Earth 2019.
Also, the landslide points of the GSI inventory had some problems. The surveyors marked some points where cracks or small subsidence had occurred that did not lead to an actual landslide. These were not included in the final database. Moreover, some of the landslide points could not be recognized as slope failures in the images if they were too small to be recognized, sheltered by shadows, trees or buildings (Fig. 11a, b), or the landslide point did not match with a visible landslide scarp in the image (Fig. 12b).
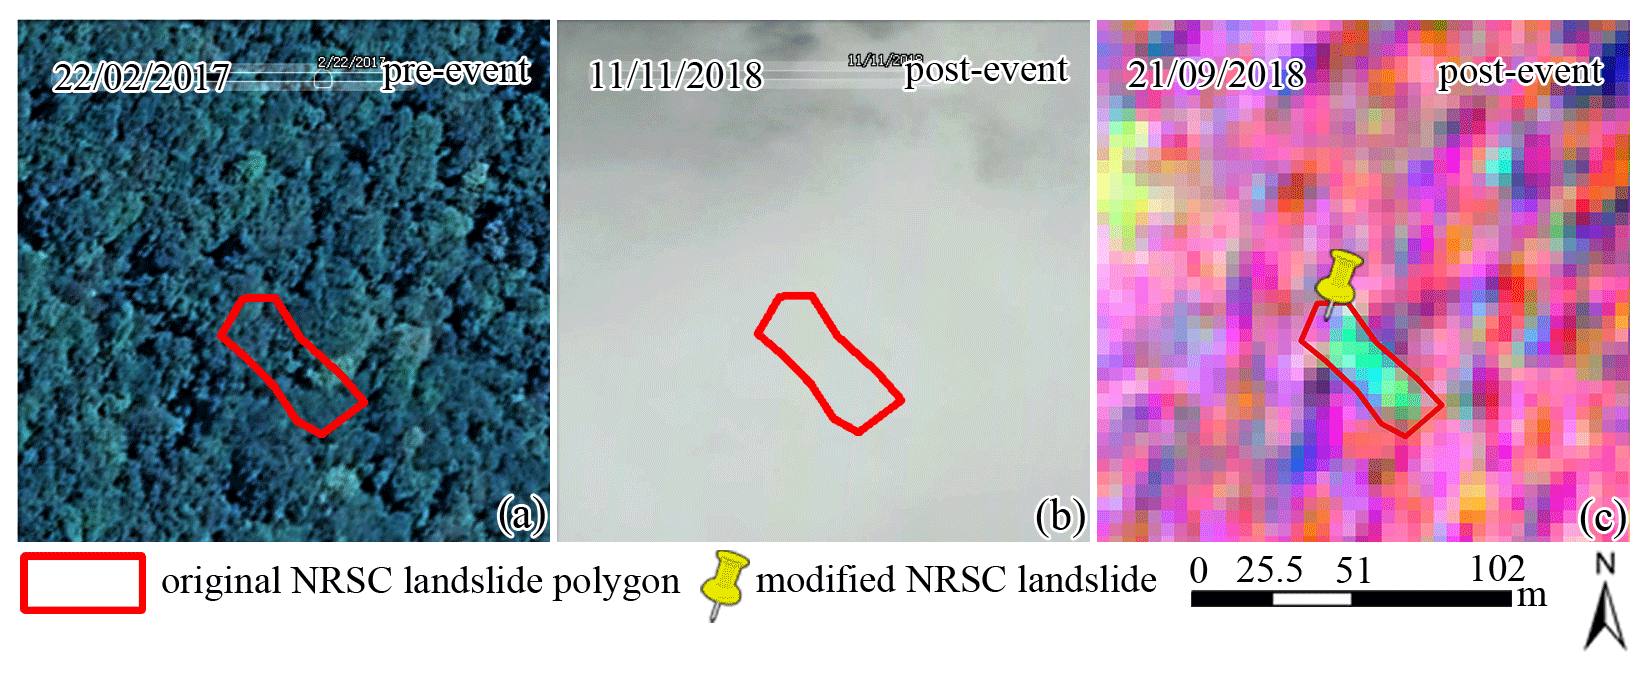
Figure 10Example of the obstruction of view by clouds in which the original NRSC landslide polygons could not be checked: (a) pre-landslide Google Earth image, (b) earliest available post-landslide Google Earth image in which the landslide cannot be recognized, and (c) mapping of the landslide initiation point based on Resourcesat-2 LISS-IV image (RGB combination: near infrared, red, green). Basemap data for (a) and (b) © Google Earth 2019.
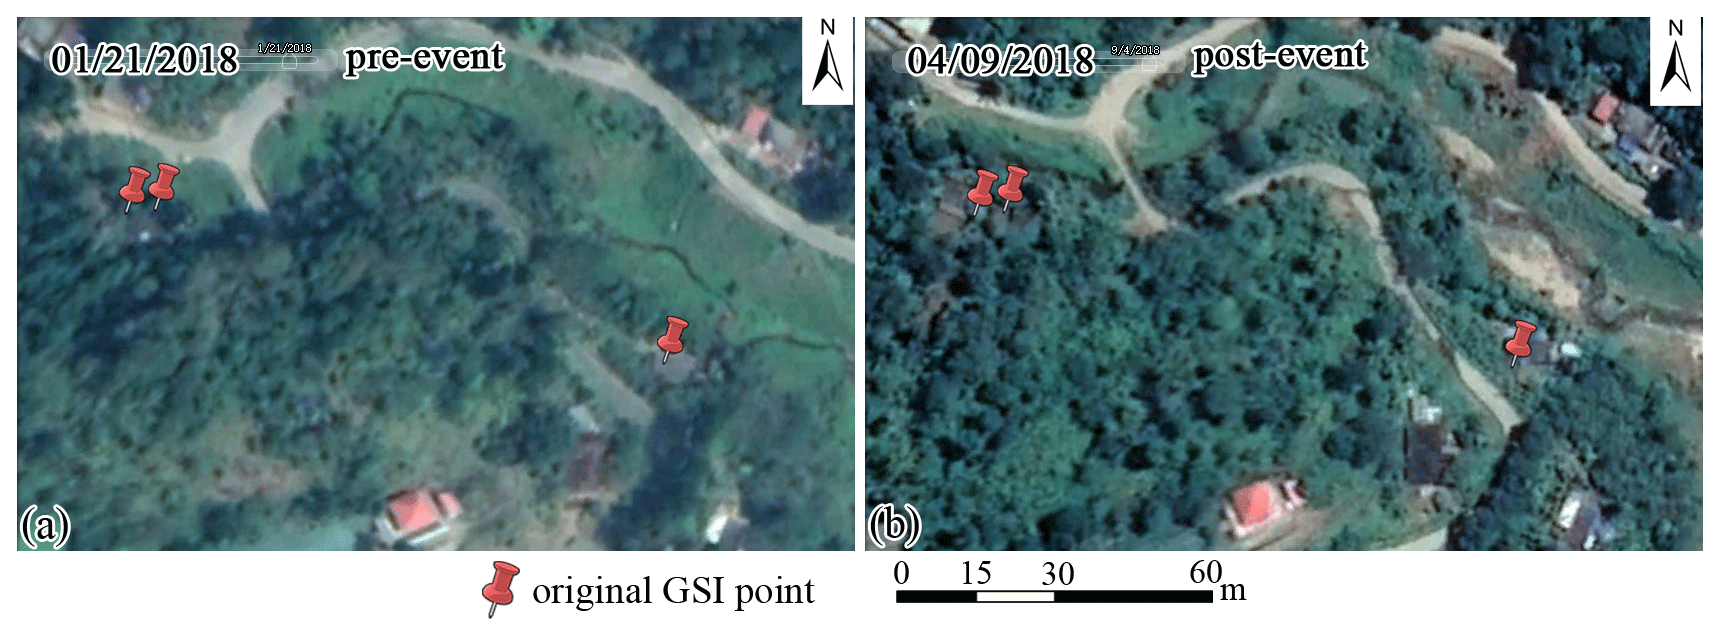
Figure 11Example of a situation in which the original GSI landslide points were accepted although there were no manifestation of landslide scarps visible in pre- and post-event images from Google Earth. We assumed that landslides were properly marked in the field by the surveyors and that they must have been very small and hidden from view by surrounding vegetation or buildings. Basemap data © Google Earth 2019.
3.1 Workflow
Since the above-mentioned problems with the two available landslide inventories would have a large influence on the analysis, we decided to correct and edit all landslides using visual interpretation based on multi-temporal HRSIs available before and after the event on the Google Earth platform. These images with varying dates allow us to recognize details in landforms and land use. For those areas where the post-event images in Google Earth were distorted, obscured, or missing, we used Indian Resourcesat-2 LISS-IV images (with a spatial resolution of 5.8 m and three bands of green, red, and near infrared) for the earliest available post-monsoon period of 2018, which were obtained from the NRSC. By using two screens, the same landslide area was visualized using Google Earth on one screen (with KML files of the landslide points or polygons) and ArcGIS on another screen with shapefiles. With the aid of the historical image viewer tool from Google Earth, the landslides were evaluated, interpreted, assessed, and measured on one screen by experts comparing multi-temporal images of the same area, while they edited the same area on the other screen. For each landslide, we visually interpreted the LULC types using the Google Earth history viewer for two time periods: before the monsoon of 2018 and for the oldest and nearly complete cover of HRSIs for Kerala, which date back to 2010. Our final landslide inventory dataset was made as points which were carefully located on the initiation point of the landslides with attributes related to the landslide type and the LULC in 2010 and 2018. Due to the large number of landslides in the inventory, it was not possible to map the landslides as polygons, separating initiation, runout, and accumulation areas (Soeters and van Westen, 1996). The workflow for the landslide inventory is shown in Fig. 13.
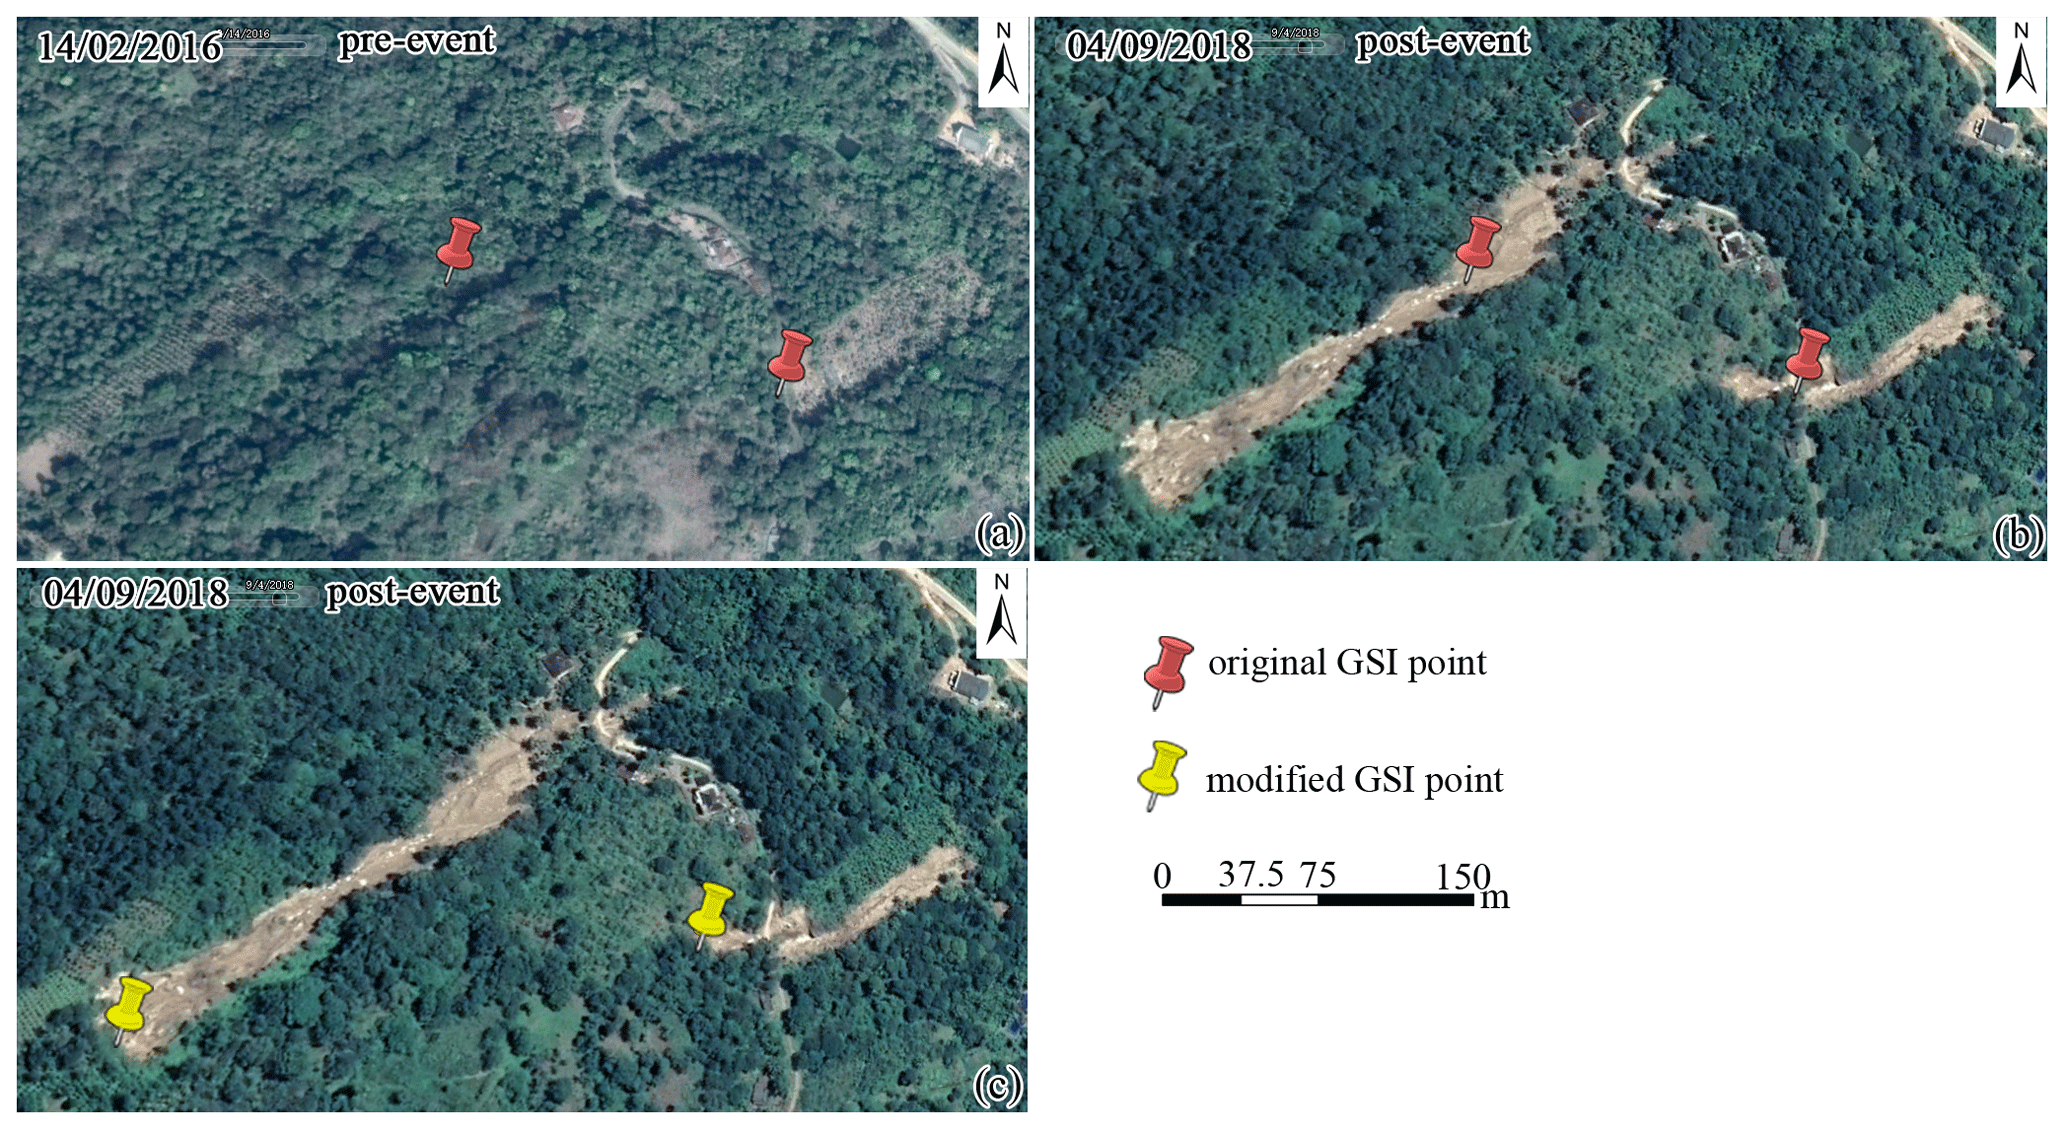
Figure 12Example of a situation in which the original GSI landslide points were shifted to the top of the landslide scarps: (a) pre-event image with landslide points from the GSI inventory, (b) post-event image with original landslide points from the GSI inventory, and (c) post-event image with adjusted landslide points. Basemap data © Google Earth 2019.
3.2 Landslide mapping
The landslide mapping included the conversion of the available polygons from NRSC to points, the checking of the points from GSI, and the addition of new landslides that were overlooked by the available existing inventories according to the diagnostic image and geomorphological features by comparing pre- and post-event images (Borrelli et al., 2015; Fisher et al., 2012; Rabby and Li, 2019; Zieher et al., 2016). For the polygons from NRSC, the correction included the removal of erroneous polygons (Figs. 3 and 4) and the digitizing of a landslide point at the top of the landslide scarp (Figs. 5c, 6c). For areas with NRSC landslide polygons but where post-event images in Google Earth were of poor quality or missing, a landslide point was digitized at the top of the landslide scarp based on available Resourcesat-2 LISS-IV images and a comparison with the Google Earth pre-event image in 3D (Figs. 7c, 9c, 10c). As the entire landslide points from GSI were mapped in the field by geologists, we only removed those points that were not classified as actual landslides but as zones with cracks and subsidence and retained all the other points and their locations even when the landslide scarps could not be recognized in images (Fig. 11a, b). In the locations where the GSI landslide did not match the image, we moved the landslide point to the scarp (Fig. 12c). Using this procedure, the entire area was carefully checked through a visual comparison of images before and after the event, and landslides that were missed in the two available inventories were added by digitizing a point on the top of their scarp.
For each of the mapped landslide points, a number of attributes were also obtained either from those recorded in the GSI inventory or through visual interpretation. The following attributes were considered: landslide type, length, width, area, damage to buildings, roads, and agriculture, specific reasons for failure, and the land use in 2010 and 2018.
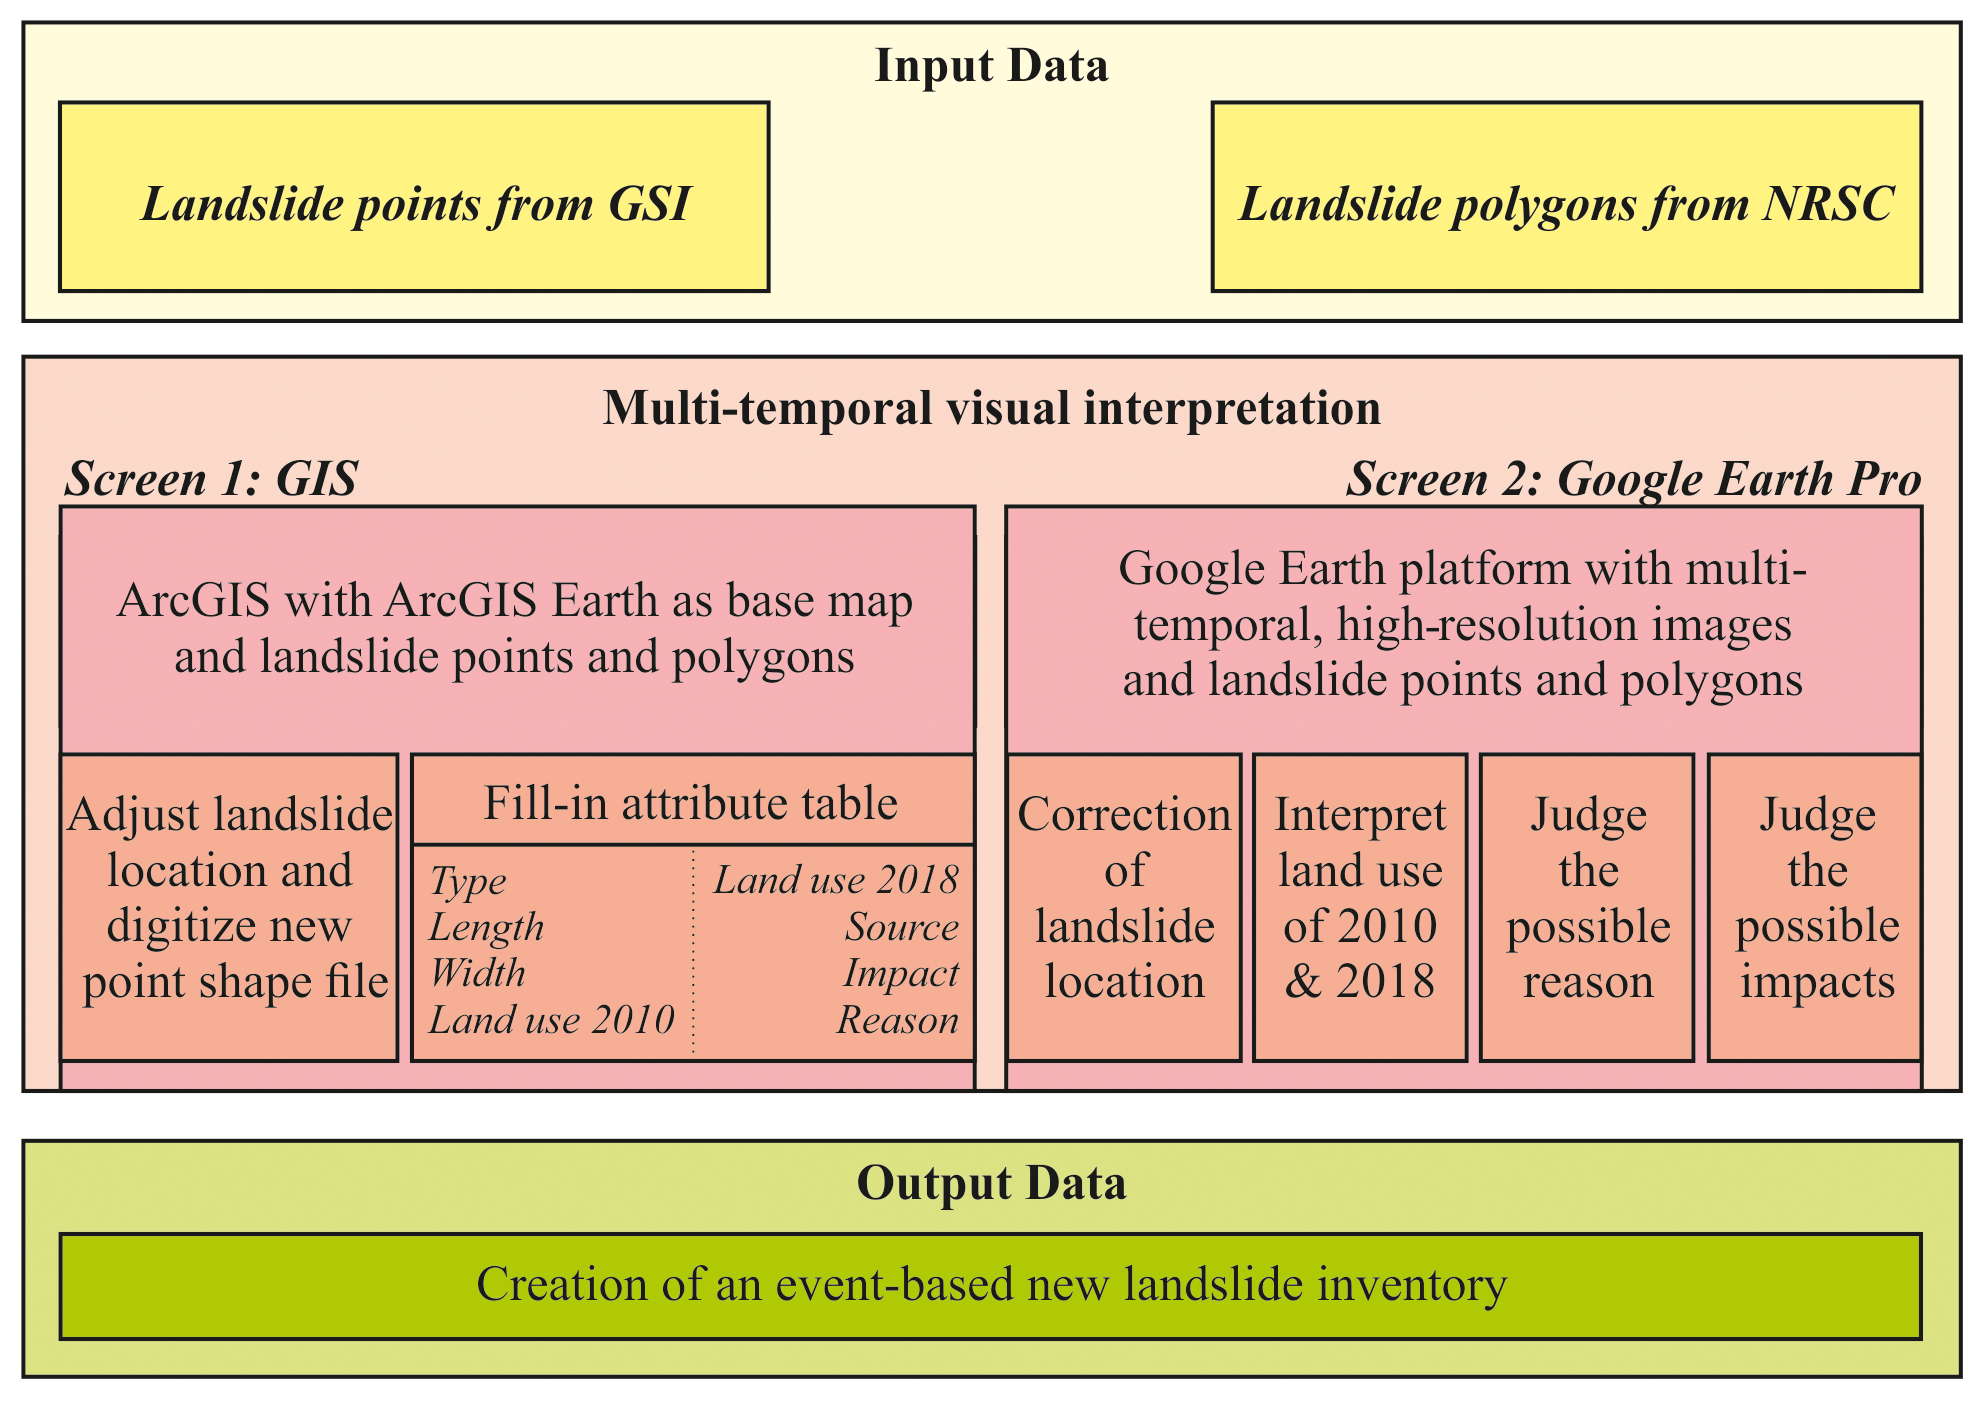
Figure 13Overview of the methodology adopted for the creation of a new landslide inventory in this study.
The landslides were classified into three simple groups: shallow landslide (SS), debris flow (DF), and rock fall (RF). Based on the diagnostic features described in Soeters and van Westen (1996), DF features were differentiated from an SS by the presence of a runout zone, often reaching to the nearest stream, which is not the case for SS. RF features can be differentiated from the other two processes as they occur on very steep and bare rocky slopes.
The maximum length and width were measured in Google Earth. Based on the GSI survey data and our interpretation of the satellite data, we marked those landslides that caused damage to buildings, roads, and agricultural land. Wherever possible, we identified the apparent reasons for failure through image interpretation and the attributes from the GSI data. The following causes were identified: (1) building cut slope failure, (2) road cut slope failure, (3) inadequate drainage along the road, (4) reactivation of old landslides, (5) undercutting of slope by river, (6) reservoir increase causing instability along the slopes, (7) deforestation, (8) clearing of tea plantation, (9) clearing of rubber plantation, and (10) the margin area between different land use types.
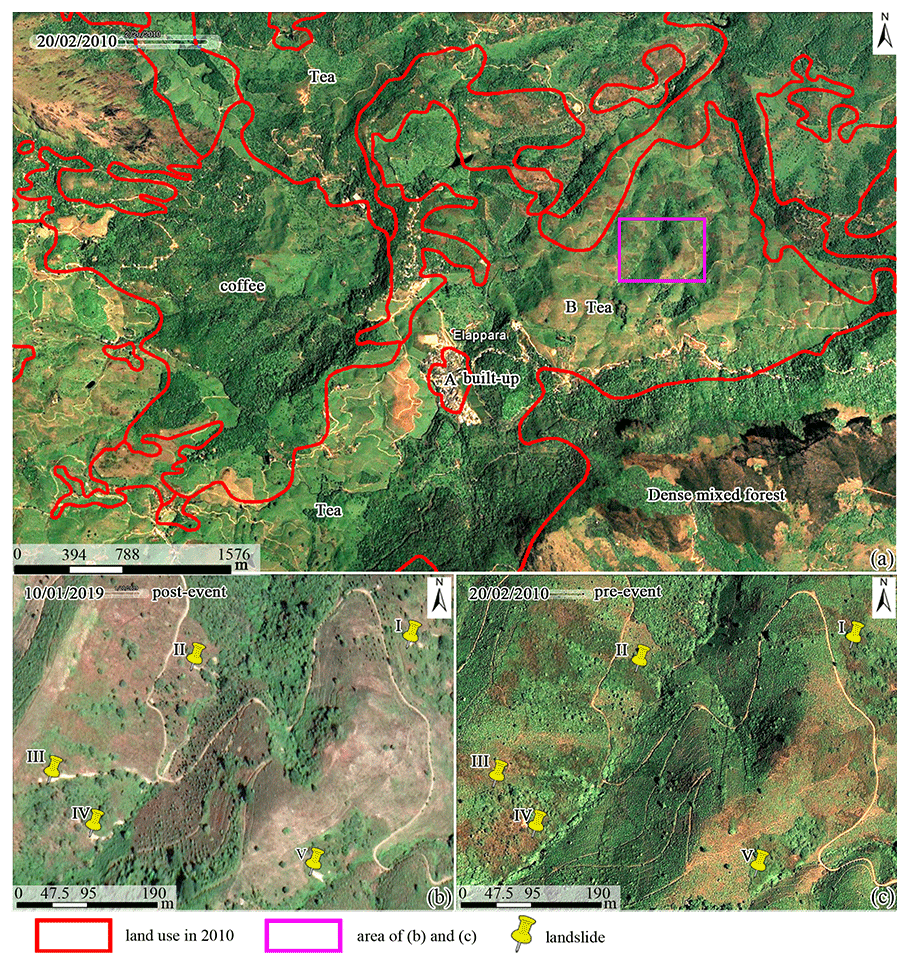
Figure 14Example of the problem in using the available land use map. The boundaries of the available 1 : 50 000 land use map from 2010 are shown on a HRSI of the same year. The detailed images shown in (b) and (c) contains many more land use types than the single one indicated on the map, leading to wrong correlations between landslides and land use. Basemap data © Google Earth 2019.
3.3 Land use attributes
To study the relation between landslides and recent land use changes, detailed and precise land use information immediately before the 2018 event was required, together with land use information for some time earlier. The available online land cover products, such as IGBP DISCover, UMD Land Cover, Global Land Cover 2000, and GlobCover 2009 (Congalton et al., 2014), have resolutions that are too coarse for a proper correlation with the landslides (Seo et al., 2014). Several historical digital land use maps from Kerala were also available from the KSDMA; however, after careful comparison with the corresponding HRSIs using the Google Earth history viewer, we decided not to use them because of the insufficient spatial and thematic accuracy. Figure 14a illustrates this by overlaying the 2010 land use map on the HRSI of the same year. The first problem is that the land use polygons do not match the image information (i.e., the shape of polygon A and B do not match with the image from the same year). The second problem is that the land use polygons in this 1 : 50 000 scale land use map are too generalized for analyzing specific relations with landslides. One land use polygon may contain more than one land use type, i.e., the land use type of polygon B is Tea, while on the detailed images it can been interpreted that it contains roads, buildings, shrubs, bare farm land, and forest as well (Fig. 14a). If this map had been used for correlating landslide occurrences with land use types, the land use type in 2010 of all landslides in Fig. 14b would have been Tea. However, the actual land use types were bare farmland (landslide I, III, and IV) and shrub plantation (landslide II and V) (Fig. 14c).
In order to correlate landslide occurrences with the land use (change) at specific locations (like landslide scarps), detailed and accurate land use data are needed. Automatic image classification would not give the required accuracy and detail (Srivastava et al., 2012) due to the complexity of the terrain and the detailed land use legend needed. It has proven very difficult to differentiate natural land use types (e.g., forest) from cultivated area (e.g., mixed forest plantations) using automatic image classification. Automatic image classification also requires a large number of very high-resolution cloud-free images for at least two periods covering the whole landslide affected area of Kerala, which requires costs that were beyond the scope of this project.
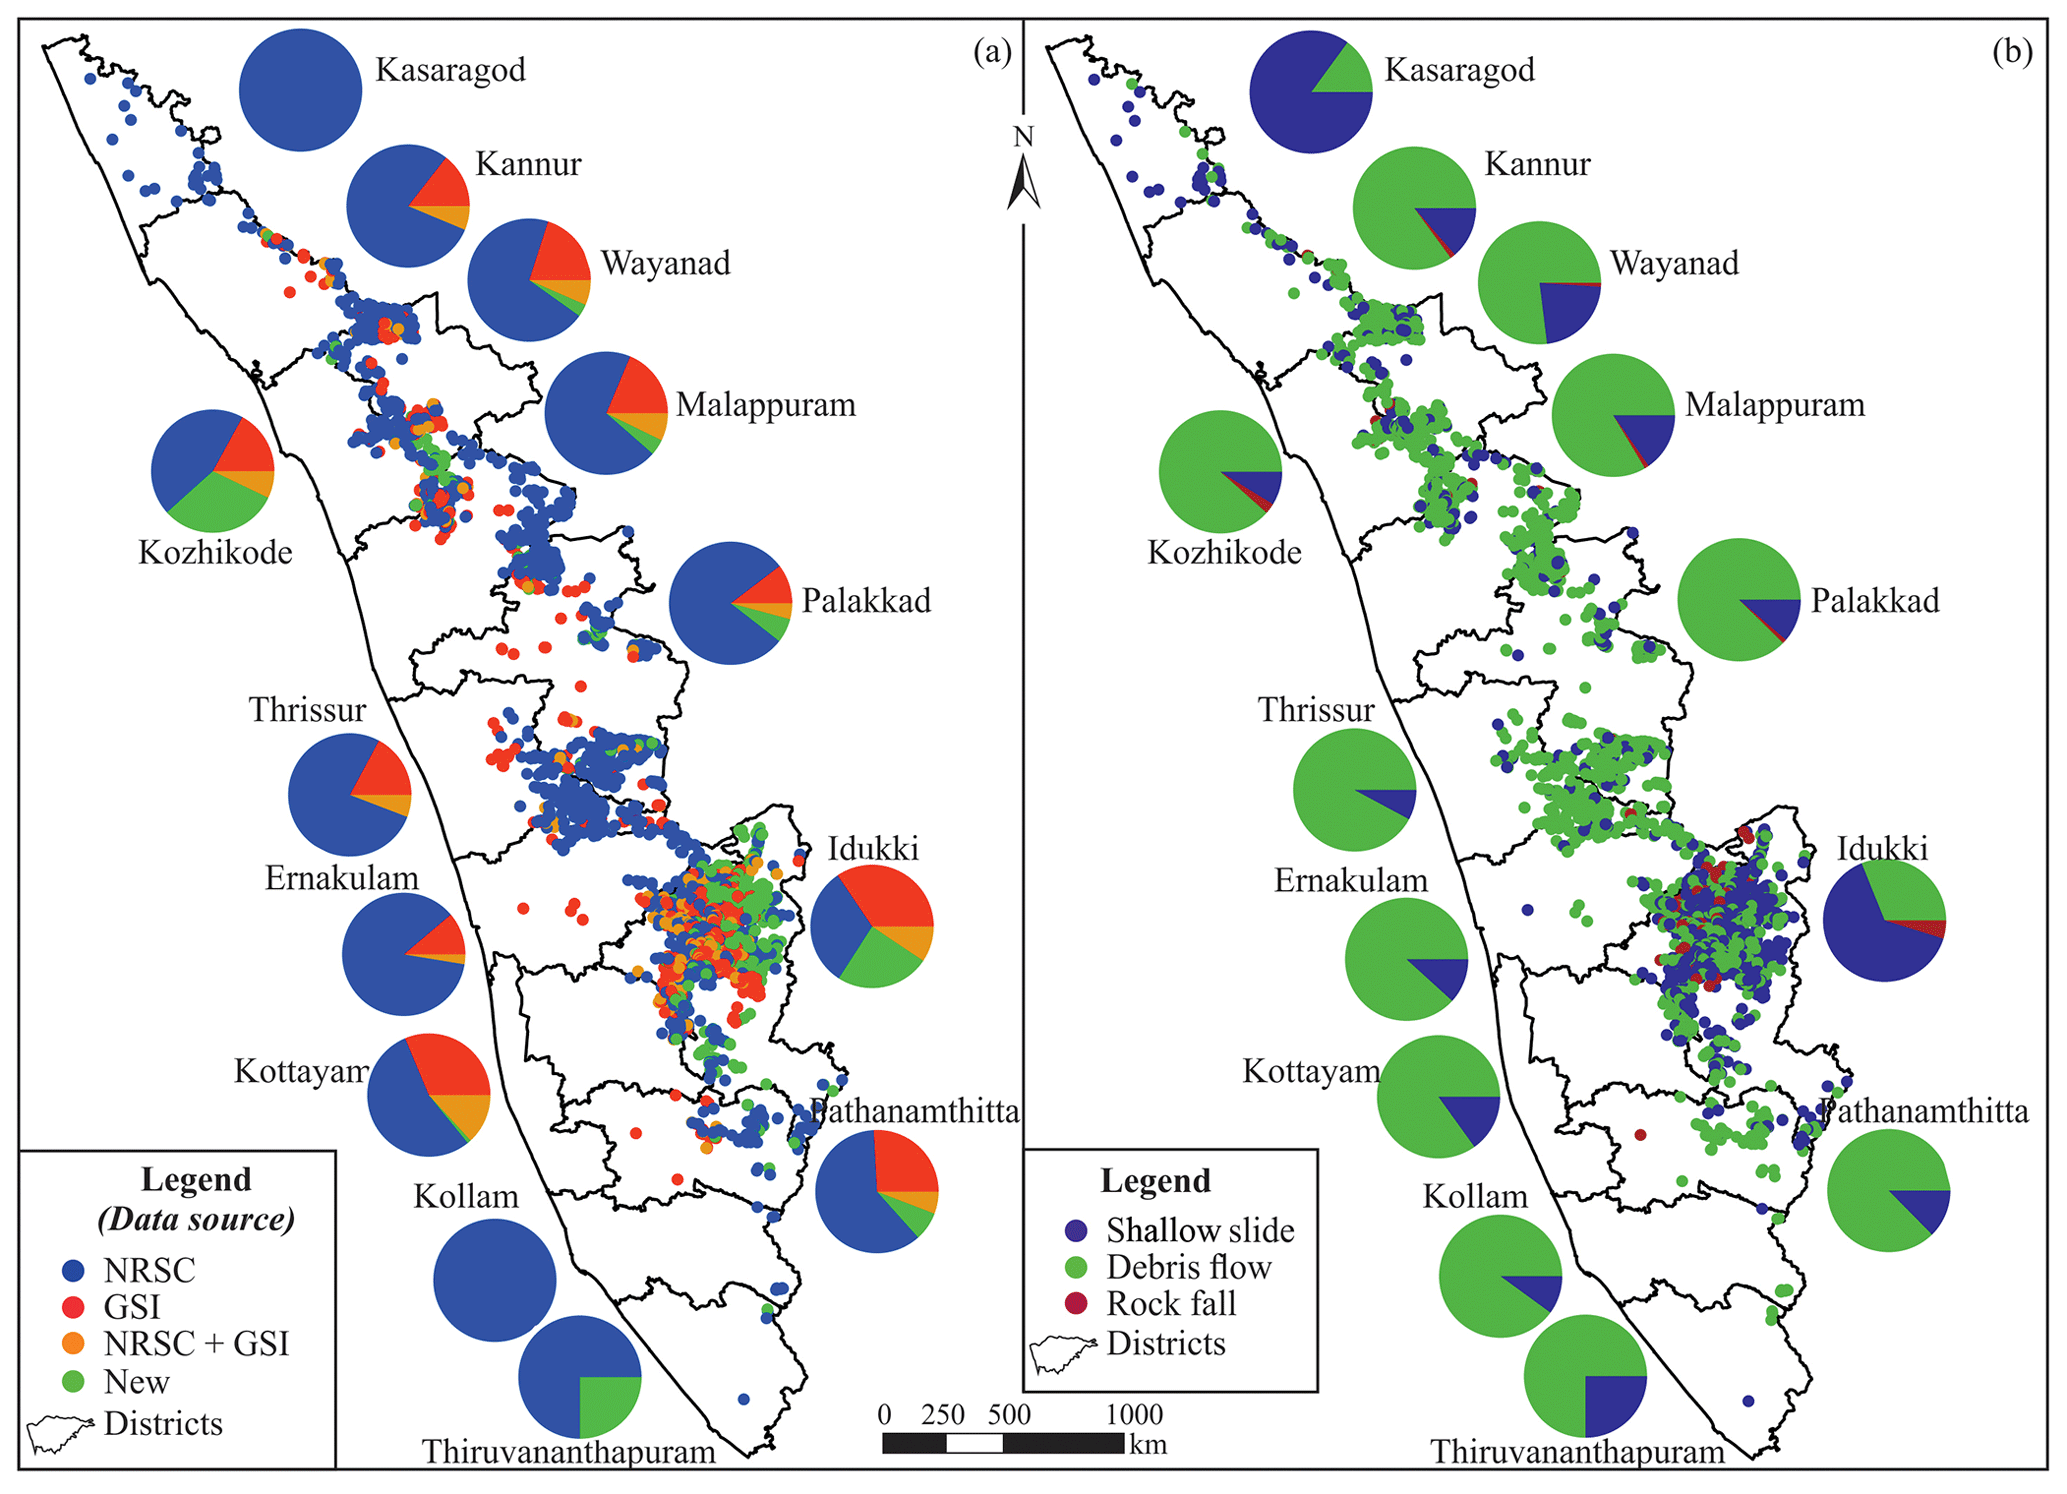
Figure 15Map of the final landslide inventory dataset. (a) distribution according to the source of the data and (b) distribution of different landslide types.
In view of the above problems, we decided to visually interpret the land use types for each landslide initiated area based on the Google Earth history viewer, in which the oldest and nearly complete cover of HRSIs for Kerala dates back to 2010. Visual interpretation is useful in land use mapping (Butt et al., 2015; Mohammady et al., 2015; Kibret et al., 2016) with higher accuracy (Audah et al., 2019; Ghorbani and Pakravan, 2012), especially in complicated areas (Huang et al., 2018). A skilled interpreter who is familiar with land use types and was trained to identify diagnostic features of various land use types in the study area is able to extract detailed land use information from the image interpretation elements of pattern, shape, context, size, shadows, phenology, spatial relation, and changes (Cihlar and Jansen, 2001), as well as using clues from available land use maps from NRSC for differentiating cultivation from natural vegetation. Differentiating agriculture from natural vegetation was considered important in modeling the relationship between landslides and land use. An interpreter will generally be able to discriminate the boundaries of complicated land use types with a higher accuracy than can be obtained through automatic classification, although it will take much more time (Miettinen et al., 2019).
The use of the Google Earth history viewer allows us to frequently compare the temporal image characteristics of the same area using vertical and also oblique views in different directions, which are all helpful in recognizing land use types. Furthermore, the land use in the direct surrounding of the landslide can be interpreted as well, allowing the interpreters to make a better evaluation of the relation between land use and landslides. For each landslide, the land use situation was evaluated for the year 2010 and for the year 2018 prior to the occurrence of the extreme event in August 2018. Mapping was done as a collaborative exercise, involving a group of four mappers. A detailed legend was worked out first and discussed among the mappers in order to achieve a standard interpretation. Also, regular cross-checks were made of each other's results to ensure a standardized approach. The ability to visually differentiate land use types was taken into account in defining the land use legends (Fox et al., 2017). Land use and land cover types were selected in such a way that they differed with respect to their influence on landslides in terms of vegetation cover, anthropogenic activities, hydrological effects, and the characteristic vegetation roots (Karsli et al., 2009; Reichenbach et al., 2014). Ultimately, 25 land use types were defined in our study (see Fig. 16). For each landslide point on the top of a landslide scarp, the historical image viewer of Google Earth was used to visualize the surrounding areas before failure in 2018 using the earliest available images and the land use situation around 2010 (using the image that is closest to this period).
4.1 Complete landslide inventory for the 2018 Kerala monsoon event
After the landslide mapping and attribute editing, a complete landslide point inventory dataset for the 2018 monsoon event in Kerala was generated, containing 4728 confirmed landslides. Out of these, 2477 landslides (52 %) were derived from the NRSC polygons and 973 landslides (21 %) from the GSI points with 422 landslides (9 %) that were included in both inventories. Additionally, 856 new landslide points (18 %) were identified using HRSIs available in Google Earth (Table 1, Figs. 15a, 18).
Table 1The number of landslides per district in Kerala from the final dataset with various sources.
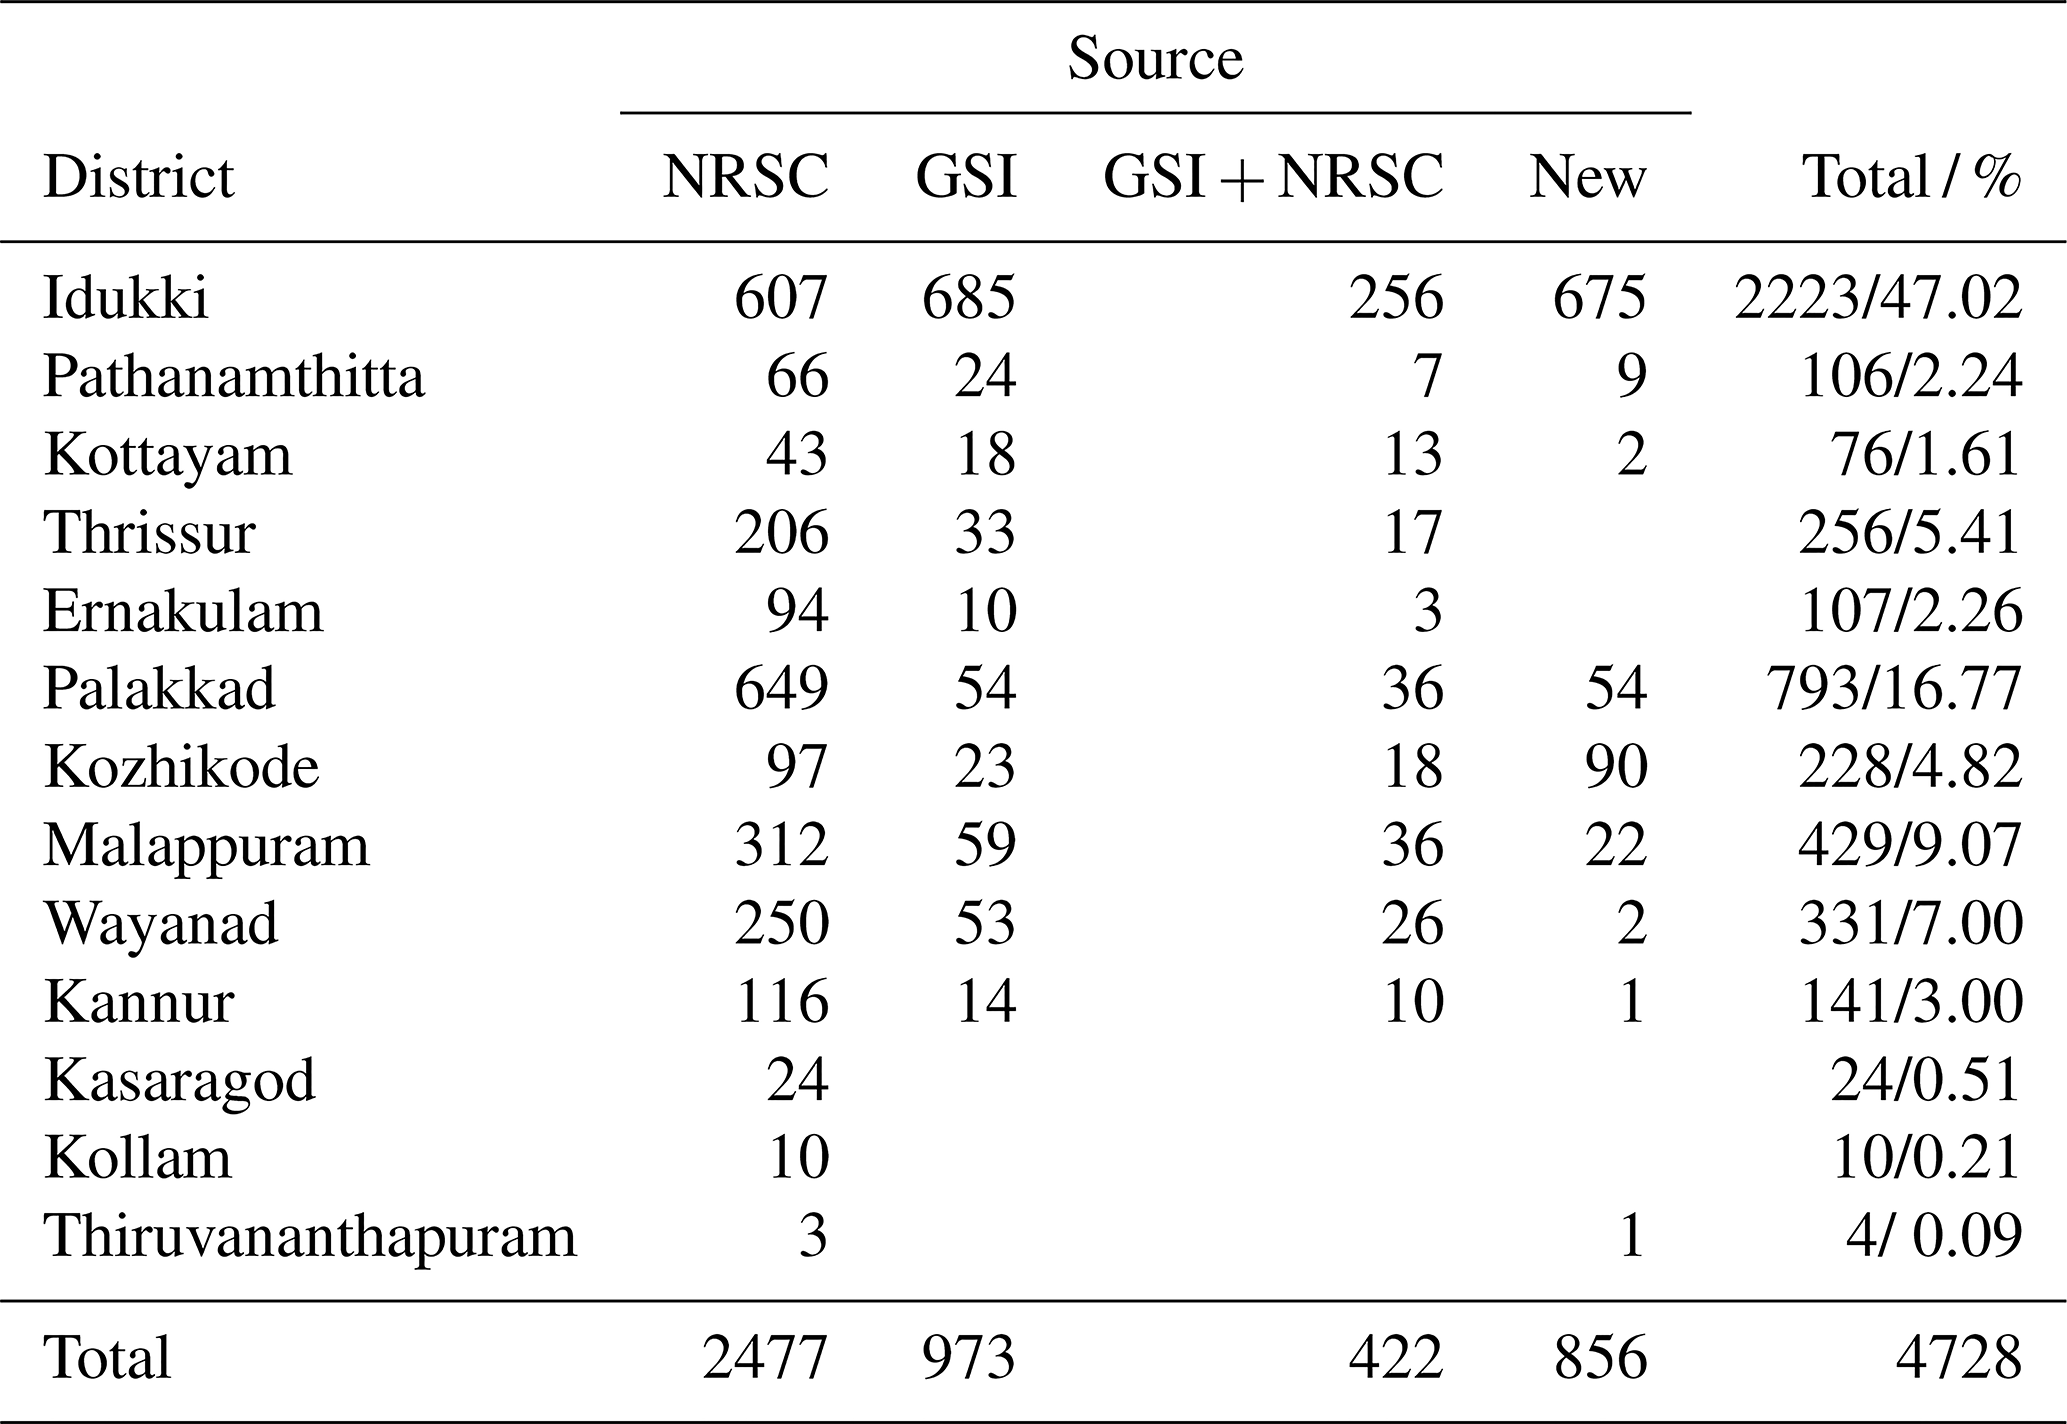
The most common landslide type was debris flow (DF: 2816 landslides), followed by shallow slide (SS: 1760) and rock fall (RF: 152) (Table 2, Fig. 15b). The landslide types for the NRSC inventory were interpreted by us using the visual mapping of the Google Earth images. They differed from the GSI landslide inventory with a higher proportion of debris flows in the NRSC data (71 % of the polygons were DF, 25 % SS, and 4 % RF) compared to the GSI mapped slides (44 % DF, 55 % SS, and only 1 % RF). The Idukki district was affected by landslides the most, accounting for 47.02 % of the total landslides in Kerala (Fig. 15).
Table 2The number of landslides classified by types in each district in Kerala.
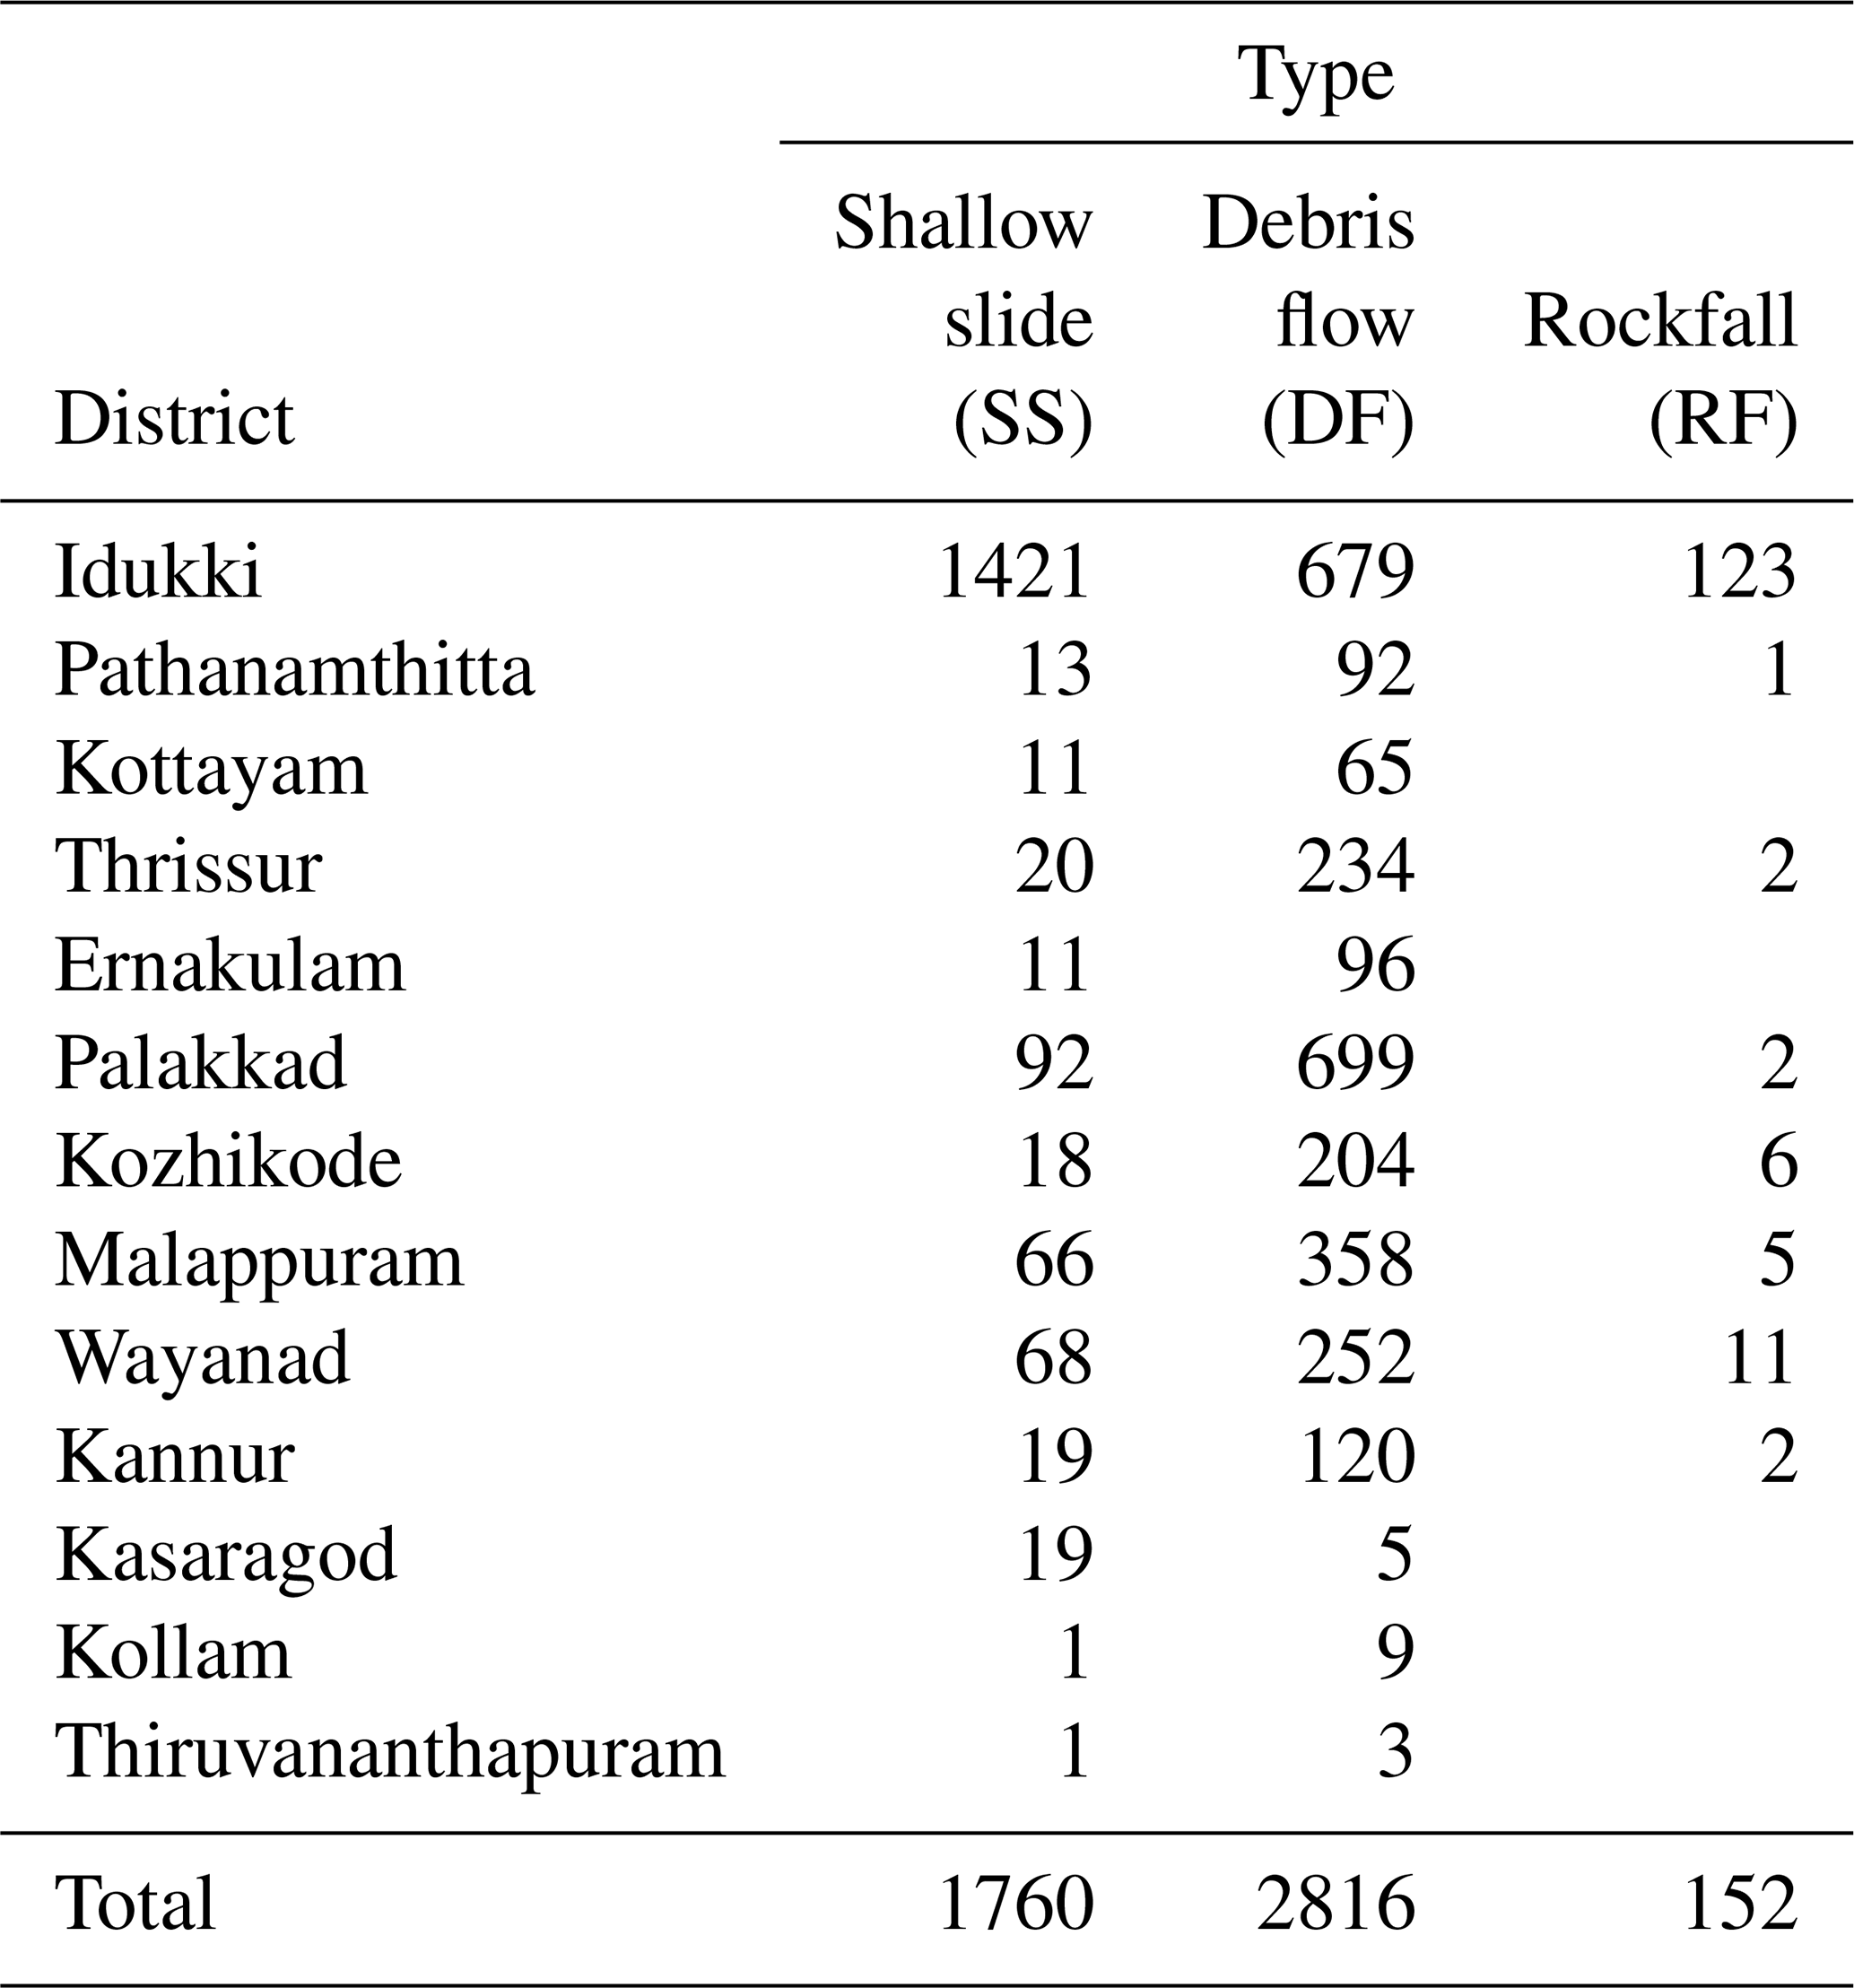
Figure 16 shows the frequency of landslides for the different land use and land cover types in 2010 and 2018. The results show that the highest proportion of the landslides were initiated in mixed forest plantation (FMP: 25.06 %), followed by dense natural forest (FDN: 23.33 %). This is an interesting result in view of the expectation that forests are less vulnerable to landslides due to the hydrological and geomechanical characteristics of trees which tend to reduce the chance of slope instability (Alcántara-Ayala et al., 2006; Reichenbach et al., 2014; Tasser et al., 2003). Moreover, a significant percentage of 14 % of all landslides occurred in steep areas with bare rock and soil and sparse vegetation.

Figure 16General land use types of all landslides in Kerala: QUU – quarry in use, QUA – quarry abandoned, CSV – vegetated cut slopes, CSB – bare cut slopes, ROA – roads, BUI – buildings, RUB – rubber plantation, FMP – mixed forest plantation, FCP – forest plantation, TEA – tea plantation, SPL – shrub plantation, GMC – meadows (refers to cultivated grassland), BSL – bare farmland, FDN – dense natural forest, FNO – open natural forest, BSF – bare soil with isolated forests, BRF – bare rock with isolated forests, SNA – natural shrub land, BSS – bare soil with isolated shrubs, BRS – bare rock with isolated shrubs, GNA – natural grass land, BSG – bare soil with isolated grass, BRG – bare rock with isolated grass, BSO – bare soil, and BRO – bare rock.
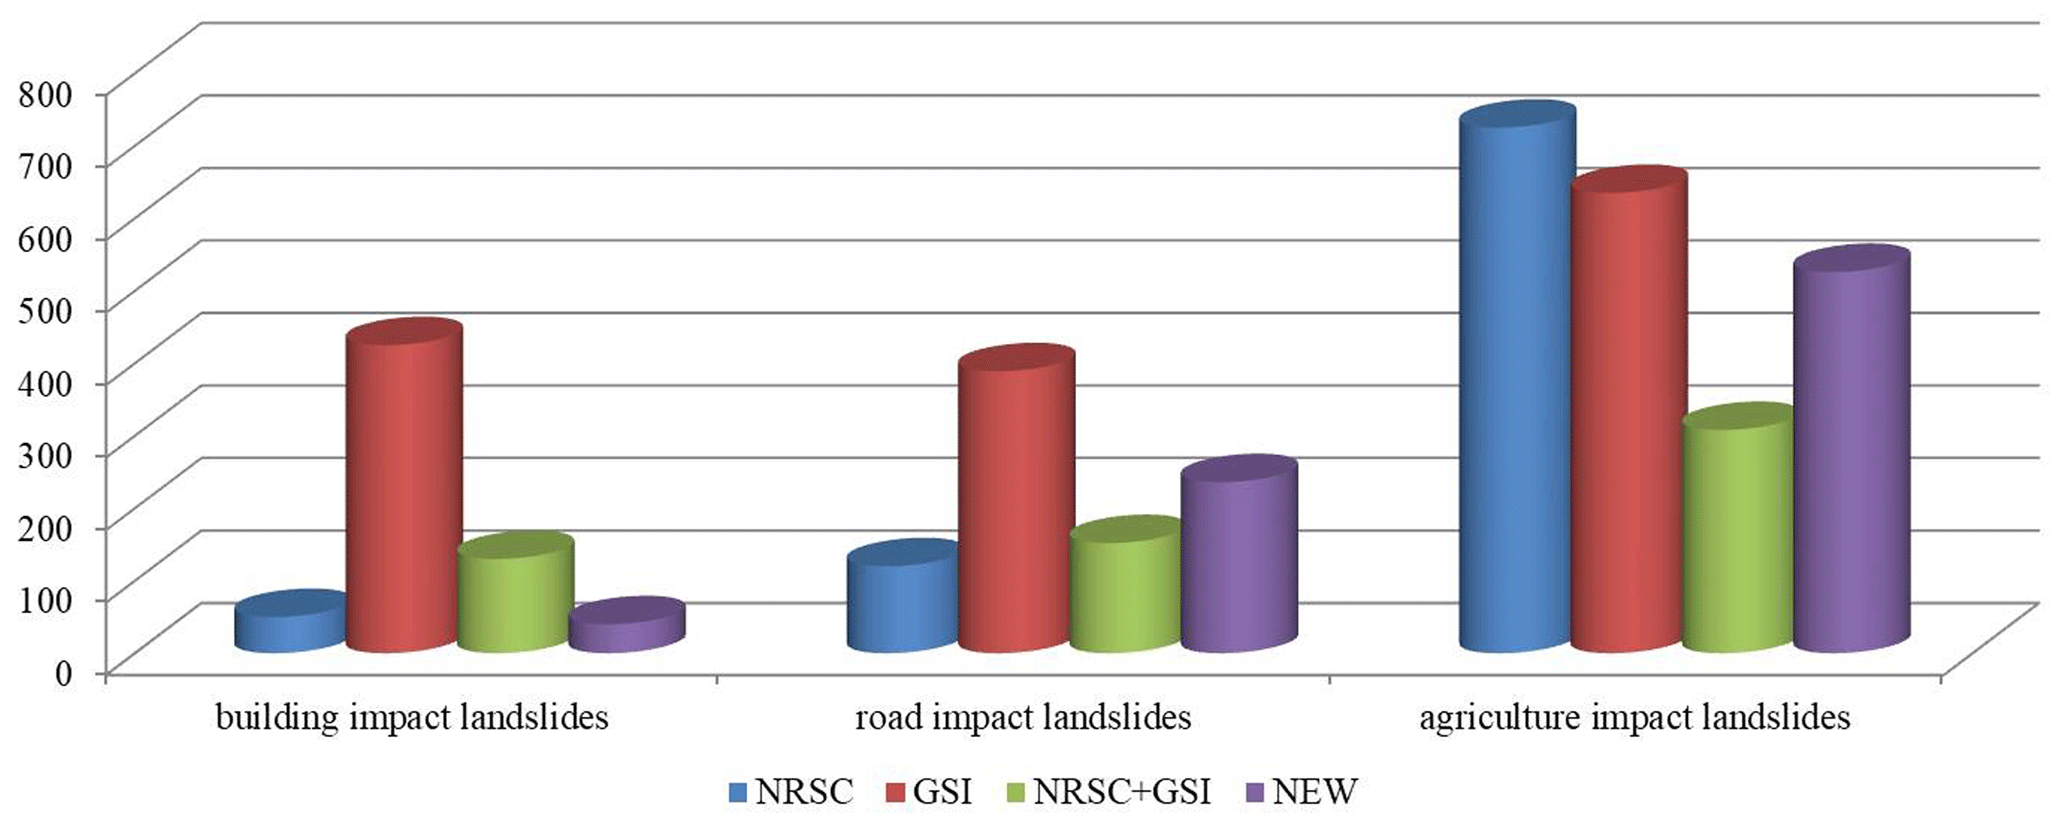
Among all the landslides in this event in Kerala, 2503 out of 4728 landslides caused damage to buildings, roads, and agriculture, accounting for 52.94 %. Apart from the 1205 damaging landslides surveyed in the field by GSI, the image interpretation revealed another 90 landslides with damage to buildings, 356 with damage to roads, and 1251 with damage to agriculture (Fig. 17). As for building impacts, 645 landslides destroyed 942 buildings, of which most were residential buildings (Fig. 17). A shallow slide (SS) in Kannur damaged 23 buildings, while a debris flow (DF) in Wayanad destroyed 12. Landslides associated with building cut-slopes were responsible for 45 % of the damaged buildings. Regarding road impacts, 897 landslides caused traffic disruptions after the event, among which 625 landslides covered roads which needed to be cleared, while 272 landslides damaged roads that had to be repaired. Landslides associated with road cut-slopes were responsible for 34 % of the road impacts. For agriculture impacts, 2194 landslides damaged the agricultural land use classes of tea plantation (TEA), FMP, rubber plantation (RUB), shrub plantation (SPL), and forest plantation (FCP) (Fig. 16). FMP, SPL, and TEA suffered the most damage of all cultivation lands.
The results show that only a relatively small number of landslides (707, 14.95 %) were located at sites where land use changes occurred in the past 8 years before their occurrence (Fig. 16). The vast majority of the landslides were not related to land use changes in the past decade.
4.2 Comparison of inventories
The final landslide dataset was made by integrating two inventories that were acquired using different methods. In the final inventory, 2899 (61.32 %) out of 4728 landslides were obtained directly from the results of the automatic classification, which were accepted after careful visual interpretation of multi-temporal HRSIs. Among the 2899 landslides, 2657 landslides were mapped as points directly from an equal number of polygons, 163 landslide points were made by merging 366 polygons (when several polygons belonged to the same landslide), and 79 landslides were mapped by separating 35 polygons (when a single polygon contained several landslides). Only 422 out of 1437 landslides with confirmed damage, mapped by GSI, were identified by automatic image classification (Fig. 18).
Table 3The number of landslide confirmations by different means in Kerala.

In the final landslide point dataset, 1276 (27 %) out of 4728 landslides were confirmed only by one source, while a total of 3452 (73 %) landslides were confirmed by at least two independent sources (Table 3). Among the single sourced 1276 landslides, 420 (9 %) landslides were without an estimation of the area of the landslides as those were the points from GSI for which no area could be determined in the images because the landslides were too small. These 420 landslides were mapped by GSI as they caused damage to buildings and roads but could not be identified in Google Earth or Resourcesat-2 satellite images due to the small size or sheltering by buildings, trees, and clouds. Still, they are accepted in the final dataset because they were visited by geologists in the field. The rest of the 856 (18 %) single sourced landslides were identified and confirmed by their clear signs in multi-temporal Google Earth images, and about 25 of these were confirmed through field investigations by the authors in May 2019. Therefore, the minimum overall accuracy of the final inventory is 73 %, although we consider it to be much larger given the fact that we visually inspected the entire area. However, it is not possible to quantify the completeness of the final inventory due to the lack of another independent and confirmed complete inventory.
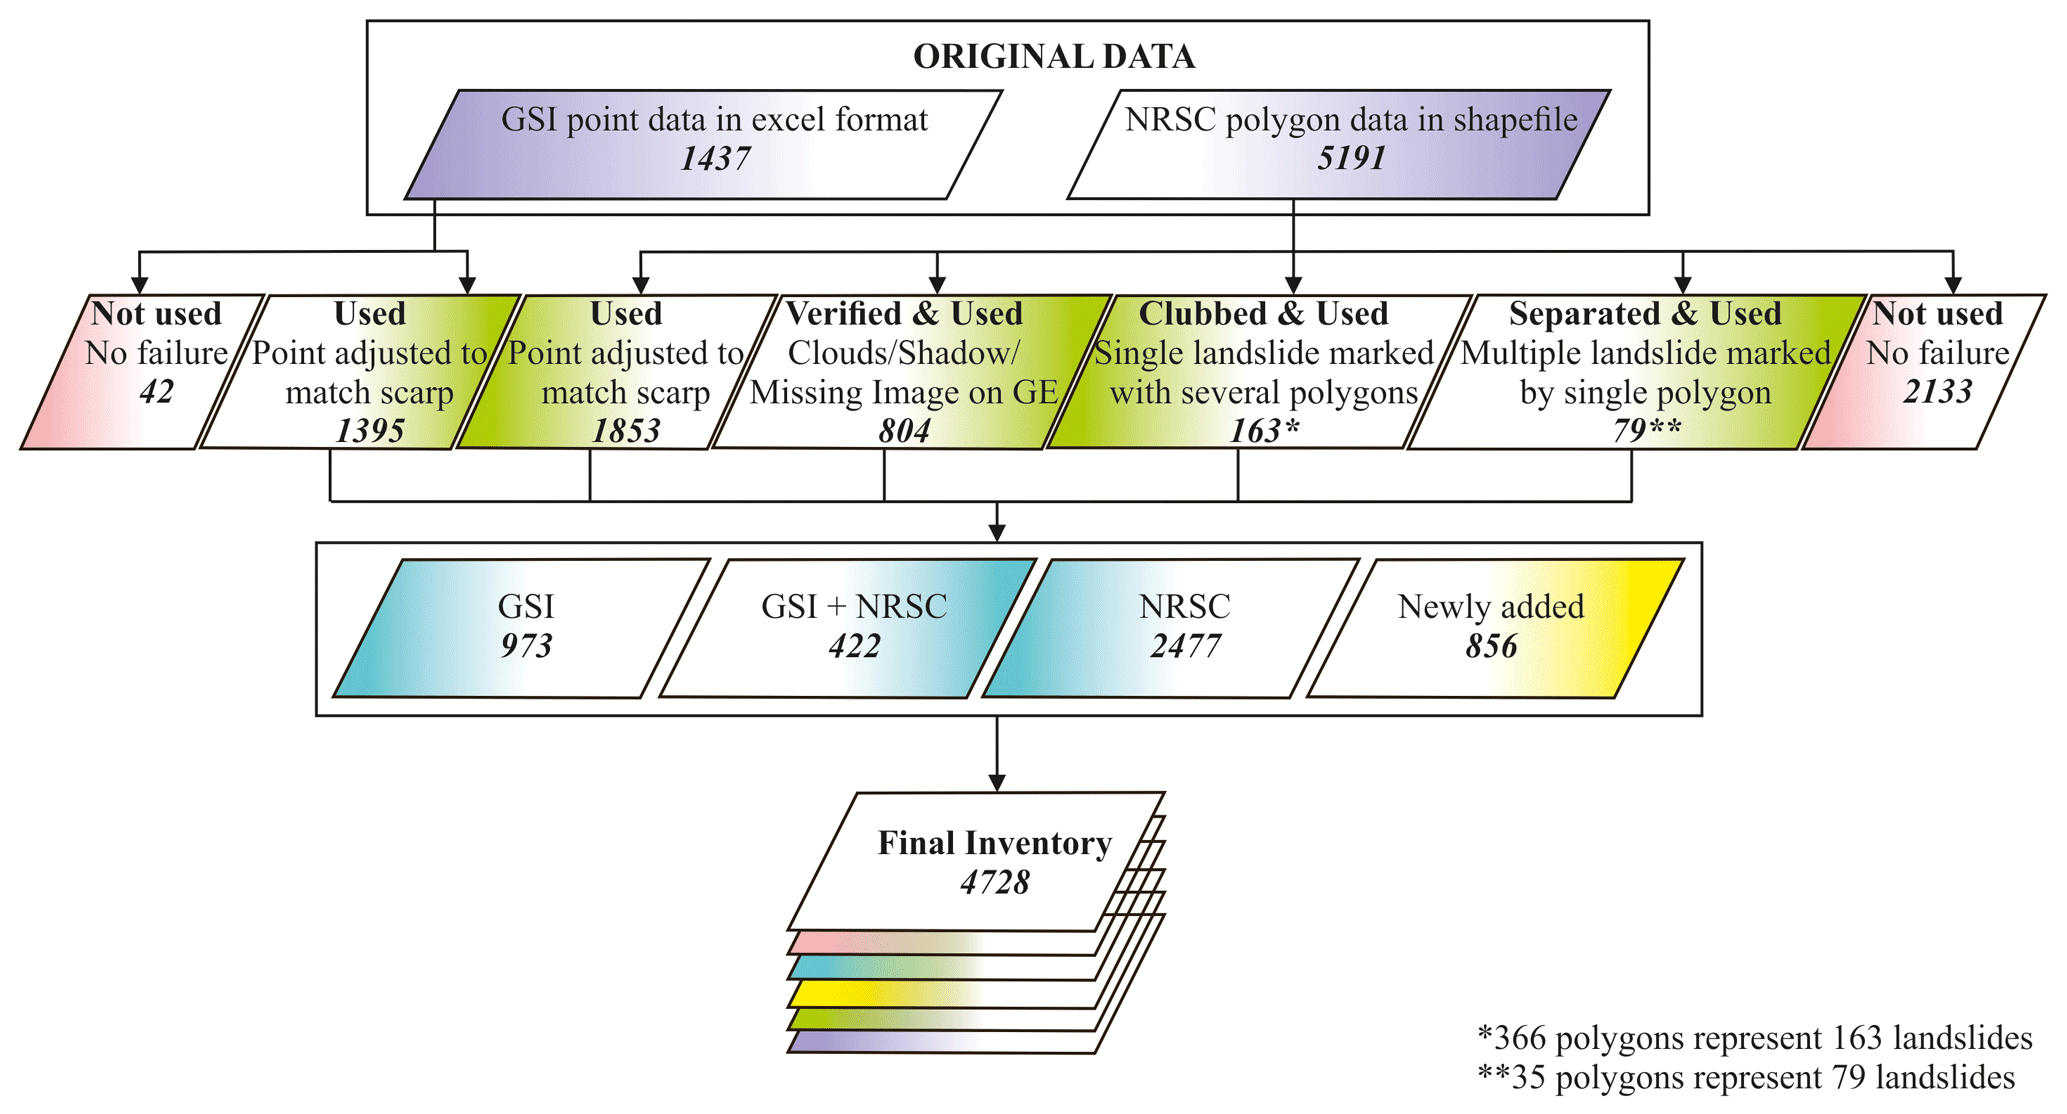
Figure 18Overview of the procedure to generate the complete landslide inventory with the number of landslides indicated.
The landslide dataset, and a document with metadata, is freely downloadable from https://doi.org/10.17026/dans-x6c-y7x2 (van Westen, 2020) and available for further analysis. The landslide dataset is provided in the form of an Environmental Systems Research Institute (ESRI) point shapefile including the following attributes: district, landslide type, area, damage (building impact, road impact, and agriculture impact), land use in 2010, land use in 2018, specific reasons for landslide occurrence, remarks, and data source. The definition of each attribute and the codes are provided in an accompanying metadata Word document. The dataset aims to further the understanding of the relation between rainfall intensities and associated spatial distribution of landslides in order to improve the methods for rainfall-induced landslide hazard assessment and the development of more accurate rainfall thresholds for early warning. The dataset also aims to further research on the relation between land use changes and landslide occurrences, which is also an important aspect especially due to the observed increase in extreme hydrometeorological hazard events.
The results show that more than half of the damaging landslides (613) surveyed by GSI were very small (< 500 m2). Many of these small-sized landslides could not be visually identified and measured even in HRSIs as they may be covered by dense vegetation or sheltered by buildings and other objects. This makes it also very difficult to detect them using automatic image classification as no more than half of these damaging landslides (422 out of 973) were detected. This is an important factor as the automatic image classification provides a rapid survey of the possible landslide area soon after the event. Reconnaissance in the field by geologists is the best method for mapping such landslides (Brardinoni et al., 2003). The survey requires considerably more time and resources, and it took survey teams of 20 persons 1 month to carry out the survey with a follow up survey by 10 persons of another 3 months. The survey was also biased towards damage along the roads. Although time consuming and biased toward to landslides close to roads, field-based surveys remain an essential component for the damage assessment and post-disaster recovery as they will obtain quantitative information on the damage caused by landslides and will not be replaced by image interpretation or automatic image classification (Moosavi et al., 2014).
For landslides with an area larger than 1000 m2, automatic image classification is a very useful tool, as evidenced by this study, in which more than 76.3 % of all large landslides were detected automatically. The automatic classification method is useful for detecting landslides with a certain minimum size (Lahousse et al., 2011; Martha et al., 2011) depending on the resolution of remote sensing images (Fiorucci et al., 2011; Harp et al., 2011). OBIA is very effective for generating a rapid first inventory of larger landslides triggered by an event such as an intense rainfall or earthquake (Behling et al., 2014; Lu et al., 2011; Martha et al., 2016). However, the accuracy of these automatic recognition methods still needs to be improved (Feizizadeh et al., 2017), and care should be taken when deriving statistical relationships with causal factors from such inventories due to the significant overestimation of the number of landslides and because the relations would only be meaningful for the initiation areas of the landslides and not for the full polygon areas that are normally identified using OBIA.
During this monsoon-event-triggered landslide inventory, it took teams of six persons 39 d (one person works 8 h d−1) for the visual interpretation check and digitization. Compared to automatic image classification, the visual interpretation of satellite data is a cost-effective yet quite time-consuming method for mapping event-triggered landslides (Yu and Chen, 2017) which has a high accuracy if combined with field investigations (Fiorucci et al., 2011; Mondini et al., 2011). Also, landslides above a minimum size of 20 m2 can be recognized based on submeter HRSIs if they are not masked by shadows from nearby slopes, objects, or vegetation. The comparison of pre- and post-event satellite images, and the integration with the results of automatic image classification on a platform such as the Google Earth history viewer, was very useful for the generation of a complete and reliable inventory. The collaborative mapping approach, involving a number of mappers in different locations, required good communication and cross-checking of the interpretation results to ensure consistent results among the mappers, but it reduced the mapping time compared to field-based survey methods, and the costs for image acquisition were greatly reduced by using Google Earth images (van Westen et al., 2008).
The monsoon event of 2018 in Kerala killed more than 483 persons (Sahana, 2019) and triggered 4728 landslides which damaged 942 buildings. It was an extreme event, and the damage was attributed in popular literature to climate change and anthropogenic changes, especially the decrease in natural forests and the increase in buildings on sloping terrain (Naik, 2019). Recent studies (Ramachandra and Bharath, 2019) have found that the forest cover in the Western Ghats has decreased by 30 %, from 16.21 % in 1985 to 11.3 % in 2018. The region now has a 17.92 % plantation area, 37.53 % agriculture, and 4.88 % mining and built-up urban areas. It is therefore remarkable that the majority of the landslides triggered during the 2018 monsoon event occurred within forested areas. Also, for the vast majority of the landslides, no significant changes in land use were detected in the past 8 years, suggesting that this was indeed an extraordinary rainfall event in which land use played a relatively minor role. Further research is needed to study the intricate relations between land use change and landslide occurrence.
So far, the final inventory of significant landslides that damaged buildings, roads, and agricultural areas, as well as failures large enough to be seen in various satellite images, can be considered relatively complete for the 2018 event as the entire area was carefully checked using multi-temporal visual image interpretation. However, it is possible that a few landslides were still missed in the final dataset due to their very small size or shelter. It is not possible to quantify the completeness of the final inventory due to the lack of another independent and confirmed complete inventory.
LH and CvW designed the work together with SKS. LH and RA compiled the dataset. LH wrote the paper and was supervised by CvW. TRM and PJ provided some of the data and suggestions on some methods. LH, RA, and SKS compiled the figures. CvW and BGM provided suggestions on structure, methods, and figures. All the authors contributed to the review of the paper and approved the dataset.
The authors declare that they have no conflict of interest.
We thank the United Nations Environmental Program (UNEP) (Muralee Thummarukudy, Karen Sudmeier-Rieux, and Louise Schreyers) for initiating this work and the coordination, Sekhar Lukose Kuriakose and colleagues from the Kerala State Disaster Management Agency (KSDMA) for their support, the National Remote Sensing Centre (NRSC) for providing the landslide polygon inventory, the Geological Survey of India (GSI) for providing the landslide point inventory, and Google Earth for the use of multi-temporal HRSIs.
This research has been supported by the Chinese National Science Fund (grant nos. 41702358, 41790445, 41630640, 41771444) and the China Postdoctoral Science Foundation (grant no. 2017M622982).
This paper was edited by Giulio G. R. Iovine and reviewed by two anonymous referees.
Agarwal, R.: Original Research Article Lesson Learned from Killer Floods in Kerala?: Time for Retrospection, Manag. Econ. Res. J., 4, 268–280, 2018.
Aksoy, B. and Ercanoglu, M.: Landslide identification and classification by object-based image analysis and fuzzy logic: An example from the Azdavay region (Kastamonu, Turkey), Comput. Geosci., 38, 87–98, https://doi.org/10.1016/j.cageo.2011.05.010, 2012.
Alcántara-Ayala, I., Esteban-Chávez, O., and Parrot, J. F.: Landsliding related to land-cover change: A diachronic analysis of hillslope instability distribution in the Sierra Norte, Puebla, Mexico, Catena, 65, 152–165, https://doi.org/10.1016/j.catena.2005.11.006, 2006.
Alkevli, T. and Ercanoglu, M.: Assessment of ASTER satellite images in landslide inventory mapping: Yenice-Gökçebey (Western Black Sea Region, Turkey), Bull. Eng. Geol. Environ., 70, 607–617, https://doi.org/10.1007/s10064-011-0353-z, 2011.
Ardizzone, F., Basile, G., Cardinali, M., Casagli, N., Del Conte, S., Del Ventisette, C., Fiorucci, F., Garfagnoli, F., Gigli, G., Guzzetti, F., Iovine, G., Mondini, A. C., Moretti, S., Panebianco, M., Raspini, F., Reichenbach, P., Rossi, M., Tanteri, L., and Terranova, O.: Landslide inventory map for the Briga and the Giampilieri catchments, NE Sicily, Italy, J. Maps, 8, 176–180, https://doi.org/10.1080/17445647.2012.694271, 2012.
Audah, S., Nazliyati, N., Bakruddin, B., Saputra, E., Wathan, S., and Rizky, M. M.: Visual Analysis of Satellite Landsat Images Multitemporal and GPS as a Geographic Information System for Mapping of Nugmet Plantations in Tapaktuan, IOP Conf. Ser. Mater. Sci. Eng., 506, 012037, https://doi.org/10.1088/1757-899X/506/1/012037, 2019.
Behling, R., Roessner, S., Kaufmann, H., and Kleinschmit, B.: Automated spatiotemporal landslide mapping over large areas using rapideye time series data, Remote Sens., 6, 8026–8055, https://doi.org/10.3390/rs6098026, 2014.
Borrelli, L., Cofone, G., Coscarelli, R., and Gullà, G.: Shallow landslides triggered by consecutive rainfall events at Catanzaro strait (Calabria–Southern Italy), J. Maps, 11, 730–744, https://doi.org/10.1080/17445647.2014.943814, 2015.
Brardinoni, F., Slaymaker, O., and Hassan, M. A.: Landslide inventory in a rugged forested watershed: A comparison between air-photo and field survey data, Geomorphology, 54, 179–196, https://doi.org/10.1016/S0169-555X(02)00355-0, 2003.
Butt, A., Shabbir, R., Ahmad, S. S., and Aziz, N.: Land use change mapping and analysis using Remote Sensing and GIS: A case study of Simly watershed, Islamabad, Pakistan, Egypt, J. Remote Sens. Sp. Sci., 18, 251–259, https://doi.org/10.1016/j.ejrs.2015.07.003, 2015.
Casagli, N., Cigna, F., Bianchini, S., Hölbling, D., Füreder, P., Righini, G., Del Conte, S., Friedl, B., Schneiderbauer, S., Iasio, C., Vlcko, J., Greif, V., Proske, H., Granica, K., Falco, S., Lozzi, S., Mora, O., Arnaud, A., Novali, F., and Bianchi, M.: Landslide mapping and monitoring by using radar and optical remote sensing: Examples from the EC-FP7 project SAFER, Remote Sens. Appl. Soc. Environ., 4, 92–108, https://doi.org/10.1016/j.rsase.2016.07.001, 2016.
Cihlar, J. and Jansen, L. J. M.: From Land Cover to Land Use: A Methodology for Efficient Land Use Mapping over Large Areas, Prof. Geogr., 53, 275–289, https://doi.org/10.1111/0033-0124.00285, 2001.
Colombo, A., Lanteri, L., Ramasco, M., and Troisi, C.: Systematic GIS-based landslide inventory as the first step for effective landslide-hazard management, Landslides, 2, 291–301, https://doi.org/10.1007/s10346-005-0025-9, 2005.
Congalton, R. G., Gu, J., Yadav, K., Thenkabail, P., and Ozdogan, M.: Global land cover mapping: A review and uncertainty analysis, Remote Sens., 6, 12070–12093, https://doi.org/10.3390/rs61212070, 2014.
Crosby, C. J.: Lidar and Google Earth: Simplifying access to high-resolution topography data, Spec. Pap. Geol. Soc. Am., 492, 37–47, https://doi.org/10.1130/2012.2492(03), 2012.
Duman, T. Y., Çan, T., Emre, Ö., Keçer, M., Dogan, A., Ateş, Ş., and Durmaz, S.: Landslide inventory of northwestern Anatolia, Turkey, Eng. Geol., 77, 99–114, https://doi.org/10.1016/j.enggeo.2004.08.005, 2005.
Fan, X., Scaringi, G., Domènech, G., Yang, F., Guo, X., Dai, L., He, C., Xu, Q., and Huang, R.: Two multi-temporal datasets that track the enhanced landsliding after the 2008 Wenchuan earthquake, Earth Syst. Sci. Data, 11, 35–55, https://doi.org/10.5194/essd-11-35-2019, 2019.
Feizizadeh, B., Blaschke, T., Tiede, D., and Moghaddam, M. H. R.: Evaluating fuzzy operators of an object-based image analysis for detecting landslides and their changes, Geomorphology, 293, 240–254, https://doi.org/10.1016/j.geomorph.2017.06.002, 2017.
Fiorucci, F., Cardinali, M., Carlà, R., Rossi, M., Mondini, A. C., Santurri, L., Ardizzone, F., and Guzzetti, F.: Seasonal landslide mapping and estimation of landslide mobilization rates using aerial and satellite images, Geomorphology, 129, 59–70, https://doi.org/10.1016/j.geomorph.2011.01.013, 2011.
Fisher, G. B., Amos, C. B., Bookhagen, B., Burbank, D. W., and Godard, V.: Channel widths, landslides, faults, and beyond: The new world order of high-spatial resolution Google Earth imagery in the study of earth surface processes, Spec. Pap. Geol. Soc. Am., 492, 1–22, https://doi.org/10.1130/2012.2492(01), 2012
Fox, T. A., Rhemtulla, J. M., Ramankutty, N., Lesk, C., Coyle, T., and Kunhamu, T. K.: Agricultural land-use change in Kerala, India: Perspectives from above and below the canopy, Agric. Ecosyst. Environ., 245, 1–10, https://doi.org/10.1016/j.agee.2017.05.002, 2017.
Froude, M. J. and Petley, D. N.: Global fatal landslide occurrence from 2004 to 2016, Nat. Hazards Earth Syst. Sci., 18, 2161–2181, https://doi.org/10.5194/nhess-18-2161-2018, 2018.
Galli, M., Ardizzone, F., Cardinali, M., Guzzetti, F., and Reichenbach, P.: Comparing landslide inventory maps, Geomorphology, 94, 268–289, https://doi.org/10.1016/j.geomorph.2006.09.023, 2008.
Ghorbani, A. and Pakravan, M.: Land use mapping using visual and digital interpretation of tm and google earth images in Shirvandarasi Watershed (north-west of Iran), 33rd Asian Conf. Remote Sens. 2012, ACRS 2012, 2, 1823–1828, 2012.
Guzzetti, F., Mondini, A. C., Cardinali, M., Fiorucci, F., Santangelo, M., and Chang, K. T.: Landslide inventory maps: New tools for an old problem, Earth-Sci. Rev., 112, 42–66, https://doi.org/10.1016/j.earscirev.2012.02.001, 2012.
Harp, E. L., Keefer, D. K., Sato, H. P., and Yagi, H.: Landslide inventories: The essential part of seismic landslide hazard analyses, Eng. Geol., 122, 9–21, https://doi.org/10.1016/j.enggeo.2010.06.013, 2011.
Huang, B., Zhao, B., and Song, Y.: Urban land-use mapping using a deep convolutional neural network with high spatial resolution multispectral remote sensing imagery, Remote Sens. Environ., 214, 73–86, https://doi.org/10.1016/j.rse.2018.04.050, 2018.
Hunt, K. M. R. and Menon, A.: The 2018 Kerala floods: a climate change perspective, Clim. Dyn., 54, 2433–2446, https://doi.org/10.1007/s00382-020-05123-7, 2020.
Jacobson, A., Dhanota, J., Godfrey, J., Jacobson, H., Rossman, Z., Stanish, A., Walker, H., and Riggio, J.: A novel approach to mapping land conversion using Google Earth with an application to East Africa, Environ. Model. Softw., 72, 1–9, https://doi.org/10.1016/j.envsoft.2015.06.011, 2015.
Karsli, F., Atasoy, M., Yalcin, A., Reis, S., Demir, O., and Gokceoglu, C.: Effects of land-use changes on landslides in a landslide-prone area (Ardesen, Rize, NE Turkey), Environ. Monit. Assess., 156, 241–255, https://doi.org/10.1007/s10661-008-0481-5, 2009.
Kibret, K. S., Marohn, C., and Cadisch, G.: Assessment of land use and land cover change in South Central Ethiopia during four decades based on integrated analysis of multi-temporal images and geospatial vector data, Remote Sens. Appl. Soc. Environ., 3, 1–19, https://doi.org/10.1016/j.rsase.2015.11.005, 2016.
Koshy, S. M.: Most Recent Kerala Landslides In “Ecologically Sensitive Zones”, NDTV, available at: https://www.ndtv.com/kerala-news/kerala-rain-most-recent-kerala-landslides-in-ecologically-sensitive-zones-2085594 (last access: 9 November 2020), 2019.
Kuriakose, S. L., Sankar, G., and Muraleedharan, C.: History of landslide susceptibility and a chorology of landslide-prone areas in the Western Ghats of Kerala, India, Environ. Geol., 57, 1553–1568, https://doi.org/10.1007/s00254-008-1431-9, 2009.
Lahousse, T., Chang, K. T., and Lin, Y. H.: Landslide mapping with multi-scale object-based image analysis == a case study in the Baichi watershed, Taiwan, Nat. Hazards Earth Syst. Sci., 11, 2715==2726, https://doi.org/10.5194/nhess-11-2715-2011, 2011.
Lei, T., Xue, D., Lv, Z., Li, S., Zhang, Y., and Nandi, A. K.: Unsupervised change detection using fast fuzzy clustering for landslide mapping from very high-resolution images, Remote Sens., 10, 1–23, https://doi.org/10.3390/rs10091381, 2018.
Li, W.-l., Huang, R.-q., Tang, C., Xu, Q., and van Westen, C.: Co-seismic landslide inventory and susceptibility mapping in the 2008 Wenchuan earthquake disaster area, China, J. Mt. Sci., 10, 339–354, https://doi.org/10.1007/s11629-013-2471-5, 2013.
Li, Z., Shi, W., Myint, S. W., Lu, P., and Wang, Q.: Semi-automated landslide inventory mapping from bitemporal aerial photographs using change detection and level set method, Remote Sens. Environ., 175, 215–230, https://doi.org/10.1016/j.rse.2016.01.003, 2016.
Lu, P., Stumpf, A., Kerle, N., and Casagli, N.: Object-oriented change detection for landslide rapid mapping, IEEE Geosci. Remote Sens. Lett., 8, 701–705, https://doi.org/10.1109/LGRS.2010.2101045, 2011.
Lu, P., Qin, Y., Li, Z., Mondini, A. C., and Casagli, N.: Landslide mapping from multi-sensor data through improved change detection-based Markov random field, Remote Sens. Environ., 231, 111235, https://doi.org/10.1016/j.rse.2019.111235, 2019.
Marcelino, E. V., Formaggio, A. R., and Maeda, E. E.: Landslide inventory using image fusion techniques in Brazil, Int. J. Appl. Earth Obs. Geoinf., 11, 181–191, https://doi.org/10.1016/j.jag.2009.01.003, 2009.
Martha, T. R., Kerle, N., Jetten, V., van Westen, C. J., and Kumar, K. V.: Characterising spectral, spatial and morphometric properties of landslides for semi-automatic detection using object-oriented methods, Geomorphology, 116, 24–36, https://doi.org/10.1016/j.geomorph.2009.10.004, 2010.
Martha, T. R., Kerle, N., van Westen, C. J., Jetten, V., and Kumar, K. V.: Segment optimization and data-driven thresholding for knowledge-based landslide detection by object-based image analysis, IEEE Trans. Geosci. Remote Sens., 49, 4928–4943, https://doi.org/10.1109/TGRS.2011.2151866, 2011.
Martha, T. R., Kerle, N., van Westen, C. J., Jetten, V., and Vinod Kumar, K.: Object-oriented analysis of multi-temporal panchromatic images for creation of historical landslide inventories, ISPRS J. Photogramm. Remote Sens., 67, 105–119, https://doi.org/10.1016/j.isprsjprs.2011.11.004, 2012.
Martha, T. R., van Westen, C. J., Kerle, N., Jetten, V., and Vinod Kumar, K.: Landslide hazard and risk assessment using semi-automatically created landslide inventories, Geomorphology, 184, 139–150, https://doi.org/10.1016/j.geomorph.2012.12.001, 2013.
Martha, T. R., Kamala, P., Jose, J., Vinod Kumar, K., and Jai Sankar, G.: Identification of new Landslides from High Resolution Satellite Data Covering a Large Area Using Object-Based Change Detection Methods, J. Indian Soc. Remote Sens., 44, 515–524, https://doi.org/10.1007/s12524-015-0532-7, 2016.
Martha, T. R., Roy, P., Khanna, K., Mrinalni, K., and Vinod Kumar, K.: Landslides mapped using satellite data in the Western Ghats of India after excess rainfall during August 2018, Curr. Sci., 117, 804–812, https://doi.org/10.18520/cs/v117/i5/804-812, 2019.
Megha, V., Joshi, V., Kakde, N., Jaybhaye, A. and Dhoble, D.: Flood Mapping and Analysis using Sentinel Application Platform (SNAP) – A Case Study of Kerala, Int. J. Res. Eng. Sci. Manage., 2, 486–488, 2019.
Miettinen, J., Gaveau, D. L. A., and Liew, S. C.: Comparison of visual and automated oil palm mapping in Borneo, Int. J. Remote Sens., 40, 8174–8185, https://doi.org/10.1080/01431161.2018.1479799, 2019.
Mishra, V., Aaadhar, S., Shah, H., Kumar, R., Pattanaik, D. R., and Tiwari, A. D.: The Kerala flood of 2018: combined impact of extreme rainfall and reservoir storage, Hydrol. Earth Syst. Sci. Discuss., https://doi.org/10.5194/hess-2018-480, 2018.
Mohammadi, A., Shahabi, H., and Bin Ahmad, B.: Integration of insar technique, google earth images and extensive field survey for landslide inventory in a part of cameron highlands, Pahang, Malaysia, Appl. Ecol. Environ. Res., 16, 8075–8091, https://doi.org/10.15666/aeer/1606_80758091, 2018.
Mohammady, M., Moradi, H. R., Zeinivand, H., and Temme, A. J. A. M.: A comparison of supervised, unsupervised and synthetic land use classification methods in the north of Iran, Int. J. Environ. Sci. Technol., 12, 1515–1526, https://doi.org/10.1007/s13762-014-0728-3, 2015.
Mondini, A. C., Guzzetti, F., Reichenbach, P., Rossi, M., Cardinali, M., and Ardizzone, F.: Semi-automatic recognition and mapping of rainfall induced shallow landslides using optical satellite images, Remote Sens. Environ., 115, 1743–1757, https://doi.org/10.1016/j.rse.2011.03.006, 2011.
Moosavi, V., Talebi, A., and Shirmohammadi, B.: Producing a landslide inventory map using pixel-based and object-oriented approaches optimized by Taguchi method, Geomorphology, 204, 646–656, https://doi.org/10.1016/j.geomorph.2013.09.012, 2014.
Naik, G. D.: India must stop deforesting its mountains if it wants to fight floods, The Conversation, available at: http://theconversation.com/india-must-stop-deforesting-its-mountains-if-it-wants-to-fight-floods-122669 (last access: 9 November 2020), 2019.
Oh, H. J. and Pradhan, B.: Application of a neuro-fuzzy model to landslide-susceptibility mapping for shallow landslides in a tropical hilly area, Comput. Geosci., 37, 1264–1276, https://doi.org/10.1016/j.cageo.2010.10.012, 2011.
Paul, S., Ghosh, S., Oglesby, R., Pathak, A., Chandrasekharan, A., and Ramsankaran, R.: Weakening of Indian Summer Monsoon Rainfall due to Changes in Land Use Land Cover, Sci. Rep., 6, 1–10, https://doi.org/10.1038/srep32177, 2016.
Petley, D., Dunning, S., and Rosser, N. J.: The analysis of global landslide risk through the creation of a database of worldwide landslide fatalities, Landslide Risk Manag., 367–374, 2005.
Plank, S., Twele, A., and Martinis, S.: Landslide mapping in vegetated areas using change detection based on optical and polarimetric SAR data, Remote Sens., 8, 307, https://doi.org/10.3390/rs8040307, 2016.
Rabby, Y. W. and Li, Y.: An integrated approach to map landslides in Chittagong Hilly Areas, Bangladesh, using Google Earth and field mapping, Landslides, 16, 633–645, https://doi.org/10.1007/s10346-018-1107-9, 2019.
Rai, P., Choudhary, A., and Dimri, A. P.: Future precipitation extremes over India from the CORDEX-South Asia experiments, Theor. Appl. Climatol., 137, 2961–2975, https://doi.org/10.1007/s00704-019-02784-1, 2019.
Rai, P. K., Singh, G. P., and Dash, S. K.: Projected changes in extreme precipitation events over various subdivisions of India using RegCM4, Clim. Dyn., 54, 247–272, https://doi.org/10.1007/s00382-019-04997-6, 2020.
Ramachandra, T. V. and Bharath, S.: Carbon Sequestration Potential of the Forest Ecosystems in the Western Ghats, a Global Biodiversity Hotspot, Nat. Resour. Res., 29, 2753–2771, https://doi.org/10.1007/s11053-019-09588-0, 2019.
Reichenbach, P., Busca, C., Mondini, A. C., and Rossi, M.: The Influence of Land Use Change on Landslide Susceptibility Zonation: The Briga Catchment Test Site (Messina, Italy), Environ. Manage., 54, 1372–1384, https://doi.org/10.1007/s00267-014-0357-0, 2014.
Rosi, A., Tofani, V., Tanteri, L., Tacconi Stefanelli, C., Agostini, A., Catani, F., and Casagli, N.: The new landslide inventory of Tuscany (Italy) updated with PS-InSAR: geomorphological features and landslide distribution, Landslides, 15, 5–19, https://doi.org/10.1007/s10346-017-0861-4, 2018.
Sahana G.: Kerala floods: Unpacking the reasons for heavy, sustained rainfall, MONGABAY, available at: https://india.mongabay.com/2019/08/kerala-floods-unpacking-the-reasons-for-heavy-sustained-rainfall/ (last access: 9 November 2020), 2019.
Sajinkumar, K. S. and Anbazhagan, S.: Geomorphic appraisal of landslides on the windward slope of Western Ghats, southern India, Nat. Hazards, 75, 953–973, https://doi.org/10.1007/s11069-014-1358-2, 2015.
Sajinkumar, K. S., Anbazhagan, S., Pradeepkumar, A. P., and Rani, V. R.: Weathering and landslide occurrences in parts of Western Ghats, Kerala, J. Geol. Soc. India, 78, 249–257, https://doi.org/10.1007/s12594-011-0089-1, 2011.
Samodra, G., Chen, G., Sartohadi, J., and Kasama, K.: Generating landslide inventory by participatory mapping: an example in Purwosari Area, Yogyakarta, Java, Geomorphology, 306, 306–313, https://doi.org/10.1016/j.geomorph.2015.07.035, 2018.
Sankar, G.: Monsoon Fury in Kerala – A Geo-environmental Appraisal, J. Geol. Soc. India, 92, 383–388, https://doi.org/10.1007/s12594-018-1031-6, 2018.
Santangelo, M., Marchesini, I., Bucci, F., Cardinali, M., Fiorucci, F., and Guzzetti, F.: An approach to reduce mapping errors in the production of landslide inventory maps, Nat. Hazards Earth Syst. Sci., 15, 2111–2126, https://doi.org/10.5194/nhess-15-2111-2015, 2015.
Sato, H. P. and Harp, E. L.: Interpretation of earthquake-induced landslides triggered by the 12 May 2008, M7.9 Wenchuan earthquake in the Beichuan area, Sichuan Province, China using satellite imagery and Google Earth, Landslides, 6, 153–159, https://doi.org/10.1007/s10346-009-0147-6, 2009.
Seo, B., Bogner, C., Poppenborg, P., Martin, E., Hoffmeister, M., Jun, M., Koellner, T., Reineking, B., Shope, C. L., and Tenhunen, J.: Deriving a per-field land use and land cover map in an agricultural mosaic catchment, Earth Syst. Sci. Data, 6, 339–352, https://doi.org/10.5194/essd-6-339-2014, 2014.
Shashikanth, K., Ghosh, S., Vittal, H., and Karmakar, S.: Future projections of Indian summer monsoon rainfall extremes over India with statistical downscaling and its consistency with observed characteristics, Clim. Dynam., 51, 1–15, https://doi.org/10.1007/s00382-017-3604-2, 2018.
Singh, B., Singh, P., Supriya, K., and Singh, M.: An overview on Kerala floods?: Loss of human lives as well as biodiversity in god ' s own Country An overview on Kerala floods?: Loss of human lives as well as biodiversity in god's own Country, Int. J. Fauna Biol. Studies, 5, 96–98, 2018.
Soeters, R. and van Westen, C. J.: Slope instability recognition, analysis, and zonation, in: Landslides, investigation and mitigation, edited by: Turner, A. K. and Schuster, R. L., Special Report, 247, Transportation Research Board, National Research Council, National Academy Press, Washington DC, USA, 129–177, 1996.
Solari, L., Del Soldato, M., Montalti, R., Bianchini, S., Raspini, F., Thuegaz, P., Bertolo, D., Tofani, V., and Casagli, N.: A Sentinel-1 based hot-spot analysis: landslide mapping in north-western Italy, Int. J. Remote Sens., 40, 7898–7921, https://doi.org/10.1080/01431161.2019.1607612, 2019.
Sreekumar, S.: Techniques for slope stability analysis: Site specific studies from Idukki district, Kerala, J. Geol. Soc. India, 73, 813–820, https://doi.org/10.1007/s12594-009-0065-1, 2009.
Srivastava, P. K., Han, D., Rico-Ramirez, M. A., Bray, M., and Islam, T.: Selection of classification techniques for land use/land cover change investigation, Adv. Sp. Res., 50, 1250–1265, https://doi.org/10.1016/j.asr.2012.06.032, 2012.
Tasser, E., Mader, M., and Tappeiner, U.: Effects of land use in alpine grasslands on the probability of landslides, Basic and Applied Ecology, 4, 271–280 2003.
Travelletti, J., Delacourt, C., Allemand, P., Malet, J. P., Schmittbuhl, J., Toussaint, R., and Bastard, M.: Correlation of multi-temporal ground-based optical images for landslide monitoring: Application, potential and limitations, ISPRS J. Photogramm. Remote Sens., 70, 39–55, https://doi.org/10.1016/j.isprsjprs.2012.03.007, 2012.
Trigila, A., Iadanza, C., and Spizzichino, D.: Quality assessment of the Italian Landslide Inventory using GIS processing, Landslides, 7, 455–470, https://doi.org/10.1007/s10346-010-0213-0, 2010.
Van Den Eeckhaut, M., Reichenbach, P., Guzzetti, F., Rossi, M., and Poesen, J.: Combined landslide inventory and susceptibility assessment based on different mapping units: an example from the Flemish Ardennes, Belgium, Nat. Hazards Earth Syst. Sci., 9, 507–521, https://doi.org/10.5194/nhess-9-507-2009, 2009.
van Westen, C.: Landslide inventory of the 2018 monsoon rainfall in Kerala, India, DANS, https://doi.org/10.17026/dans-x6c-y7x2, 2020.
van Westen, C. J., Castellanos, E., and Kuriakose, S. L.: Spatial data for landslide susceptibility, hazard, and vulnerability assessment: An overview, Eng. Geol., 102, 112–131, https://doi.org/10.1016/j.enggeo.2008.03.010, 2008.
van Westen, C.: Remote sensing for natural disaster management, Int. Arch. Photogramm. Remote Sens. Spat. Inf. Sci. – ISPRS Arch., 33, 1609–1617, 2000.
Vasudevan, N. and Ramanathan, K.: Geological factors contributing to landslides: Case studies of a few landslides in different regions of India, IOP Conf. Ser.: Earth Environ. Sci., 30, 012011, https://doi.org/10.1088/1755-1315/30/1/012011, 2016.
Vishnu, C. L., Sajinkumar, K. S., Oommen, T., Coffman, R. A., Thrivikramji, K. P., Rani, V. R., and Keerthy, S.: Satellite-based assessment of the August 2018 flood in parts of Kerala, India, Geomatics, Nat. Hazards Risk, 10, 758–767, https://doi.org/10.1080/19475705.2018.1543212, 2019.
Xu, C.: Preparation of earthquake-triggered landslide inventory maps using remote sensing and GIS technologies: Principles and case studies, Geosci. Front., 6, 825–836, https://doi.org/10.1016/j.gsf.2014.03.004, 2015.
Xu, C., Shyu, J. B. H., and Xu, X.: Landslides triggered by the 12 January 2010 Port-au-Prince, Haiti, Mw = 7.0 earthquake: visual interpretation, inventory compiling, and spatial distribution statistical analysis, Nat. Hazards Earth Syst. Sci., 14, 1789–1818, https://doi.org/10.5194/nhess-14-1789-2014, 2014a.
Xu, C., Xu, X., Shyu, J. B. H., Zheng, W., and Min, W.: Landslides triggered by the 22 July 2013 Minxian-Zhangxian, China, Mw 5.9 earthquake: Inventory compiling and spatial distribution analysis, J. Asian Earth Sci., 92, 125–142, https://doi.org/10.1016/j.jseaes.2014.06.014, 2014b.
Xu, C., Xu, X., Dai, F., Wu, Z., He, H., Shi, F., Wu, X., and Xu, S.: Application of an incomplete landslide inventory, logistic regression model and its validation for landslide susceptibility mapping related to the May 12, 2008 Wenchuan earthquake of China, Nat. Hazards, 68, 883–900, https://doi.org/10.1007/s11069-013-0661-7, 2013.
Yang, X. and Chen, L.: Using multi-temporal remote sensor imagery to detect earthquake-triggered landslides, Int. J. Appl. Earth Obs. Geoinf., 12, 487–495, https://doi.org/10.1016/j.jag.2010.05.006, 2010.
Yu, B. and Chen, F.: A new technique for landslide mapping from a large-scale remote sensed image: A case study of Central Nepal, Comput. Geosci., 100, 115–124, https://doi.org/10.1016/j.cageo.2016.12.007, 2017.
Zhong, C., Liu, Y., Gao, P., Chen, W., Li, H., Hou, Y., Nuremanguli, T., and Ma, H.: Landslide mapping with remote sensing: challenges and opportunities, Int. J. Remote Sens., 41, 1555–1581, https://doi.org/10.1080/01431161.2019.1672904, 2019.
Zieher, T., Perzl, F., Rössel, M., Rutzinger, M., Meißl, G., Markart, G., and Geitner, C.: A multi-annual landslide inventory for the assessment of shallow landslide susceptibility – Two test cases in Vorarlberg, Austria, Geomorphology, 259, 40–54, https://doi.org/10.1016/j.geomorph.2016.02.008, 2016.