the Creative Commons Attribution 4.0 License.
the Creative Commons Attribution 4.0 License.
 | 14 Nov 2020
Shipborne lidar measurements showing the progression of the tropical reservoir of volcanic aerosol after the June 1991 Pinatubo eruption
Juan-Carlos Antuña-Marrero
Graham W. Mann
Philippe Keckhut
Sergey Avdyushin
Bruno Nardi
Larry W. Thomason
A key limitation of volcanic forcing datasets for the Pinatubo period is the large uncertainty that remains with respect to the extent of the optical depth of the Pinatubo aerosol cloud in the first year after the eruption, the saturation of the SAGE-II instrument restricting it to only be able to measure the upper part of the aerosol cloud in the tropics. Here we report the recovery of stratospheric aerosol measurements from two shipborne lidars, both of which measured the tropical reservoir of volcanic aerosol produced by the June 1991 Mount Pinatubo eruption. The lidars were on board two Soviet vessels, each ship crossing the Atlantic, their measurement datasets providing unique observational transects of the Pinatubo cloud across the tropics from Europe to the Caribbean (∼ 40 to 8∘ N) from July to September 1991 (the Professor Zubov ship) and from Europe to south of the Equator (∼ 40∘ N to 8∘ S) between January and February 1992 (the Professor Vize ship). Our philosophy with the data recovery is to follow the same algorithms and parameters that appear in the two peer-reviewed articles that presented these datasets in the same issue of GRL in 1993, and here we provide all 48 lidar soundings made from the Professor Zubov and 11 of the 20 conducted from the Professor Vize, ensuring we have reproduced the aerosol backscatter and extinction values in the figures of those two papers. These original approaches used thermodynamic properties from the CIRA-86 standard atmosphere to derive the molecular backscattering, vertically and temporally constant values applied for the aerosol backscatter-to-extinction ratio, and the correction factor of the aerosol backscatter wavelength dependence. We demonstrate this initial validation of the recovered stratospheric aerosol extinction profiles, providing full details of each dataset in this paper's Supplement S1, the original profiles of backscatter ratio, and the calculated profiles of aerosol backscatter and extinction. We anticipate these datasets will provide potentially important new observational case studies for modelling analyses, including a 1-week series of consecutive soundings (in September 1991) at the same location showing the progression of the entrainment of part of the Pinatubo plume into the upper troposphere and the formation of an associated cirrus cloud. The Zubov lidar dataset illustrates how the tropically confined Pinatubo aerosol cloud transformed from a highly heterogeneous vertical structure in August 1991, maximum aerosol extinction values around 19 km for the lower layer and 23–24 for the upper layer, to a more homogeneous and deeper reservoir of volcanic aerosol in September 1991. We encourage modelling groups to consider new analyses of the Pinatubo cloud, comparing the recovered datasets, with the potential to increase our understanding of the evolution of the Pinatubo aerosol cloud and its effects. Data described in this work are available at https://doi.org/10.1594/PANGAEA.912770 (Antuña-Marrero et al., 2020).
- Article
(2070 KB) - Full-text XML
-
Supplement
(163 KB) - BibTeX
- EndNote


Observations by satellite and in situ measurements have shown that major volcanic eruptions enhance the stratospheric aerosol layer for several years (Stratospheric Processes and their Role in Climate – SPARC, 2006). Such enhancement causes radiative, thermal, dynamical and chemical perturbations in different regions of the earth's atmosphere, resulting in a perturbation of the earth's climate (e.g. Robock, 2000; Timmreck, 2012). Current research on those perturbations demands detailed information about the 3D spatial and temporal distributions of stratospheric aerosols both under background conditions and after the volcanic eruptions. The June 1991 Mount Pinatubo eruption is the most used for such research activities because it has been the largest and best documented eruption for the 20th century up to the present. Still there are notable gaps in the information collected because of the lack of measurements in the tropics and because several of the measurements conducted and reported in the literature have not yet been made available to the wider community
This work is a contribution to the data rescue activity of the Stratospheric Sulfur and its Role in Climate (SSiRC) recently included in this SPARC initiative. This data rescue activity aims to “foster new collaborations between scientists to recover, re-digitise and re-calibrate other historic stratospheric aerosol datasets, and invite scientists to contribute to this activity and to provide advice and expertise on how best to recover other incomplete long term observations of stratospheric composition” (SSiRC, 2020). In its current initial stage, particular attention is given to gather datasets to characterise the progression of the aerosol cloud during the initial months after the 1991 Pinatubo eruption, the main motivation for the work we present here.
Among the envisaged applications of the two Mount Pinatubo stratospheric aerosol lidar datasets we are presenting is the contribution to future improvements of the Global Space-based Stratospheric Aerosol Climatology (GloSSAC). GloSSAC is the most complete source of information about the global spatial and temporal distribution of the stratospheric aerosol optical properties from 1979 to the present (Thomasson et al., 2018). From 1979 to mid-2005 the climatology relies mainly on the observations from the Stratospheric Aerosol and Gas Experiment (SAGE) series of satellite instruments. Only two lidar datasets in the tropics were used for filling the gap in SAGE II aerosol extinction profiles in this region in GloSSAC (Thomasson et al., 2018), produced by the dense stratospheric aerosol layer (McCormick and Veiga, 1992).
In Sect. 2 the datasets are briefly described, providing the detailed description, format and inventory of the datasets contained in Supplement S1. Section 3 describes the processing conducted to try to reproduce the values of the aerosol's extinction profiles at 532 nm for both shipborne lidars Zubov and Vize, respectively. Section 4 shows and discusses the results, comparing them with the available information reported in Avdyushin et al. (1993) and Nardi et al. (1993). This section includes the discussion of several features of the stratospheric aerosols from the Mount Pinatubo eruption during the period the measurements were taken to illustrate the importance of the rescued datasets. Section 5 shows an application of the reconstructed dataset in the validation of Mount Pinatubo modelling simulations. The article concludes with a summary and outlook.
2.1 Lidar datasets
The single-wavelength backscatter measured by a lidar is usually decomposed into two components: aerosol backscatter and molecular backscatter. The lidar scattering ratio is defined as the ratio of the total backscatter signal (aerosol and molecular) to the molecular backscatter signal (Collis and Russell, 1976). Here we report the two sets of scattering ratio profiles measured by two Soviet shipborne lidars a few months after the Mount Pinatubo June 1991 eruption across the North Atlantic Ocean. The Professor Zubov ship carried a lidar from July to September 1991 and Professor Vize in January and February 1992 (Avdyushin et al., 1993; Nardi et al., 1993). The measurement campaign was part of a joint effort between the Roscomhydromet from the former Soviet Union and the Service d'aéronomie du CNRS of France. It included another shipborne lidar on the French military ship Henri Poincaré, based in Brest, and two ground-based lidars. The lidars were located at Haute-Provence Observatory (OHP: 44∘ N, 6∘ E) and at the Centre d'Essai des Landes at Biscarrosse (CEL: 44∘ N, 1∘ W). A broad description appears in Nardi et al. (1993) and Avdyushin et al. (1993).
Because of the particular spatio-temporal distribution of the lidar measurements from Zubov, they contribute in characterising the variability of the Mount Pinatubo stratospheric aerosol (SA) vertical extinction profiles at certain points and regions of the North Atlantic Ocean between July and September 1991. Spatially the variability covers both latitudinal and longitudinal and temporally the daily variability of two Atlantic locations where lidar measurements were conducted for several consecutive and nonconsecutive days.
Table 1Technical features of the two shipborne lidars. Ya: yttrium aluminium. From Table 1 of Avdyushin et al. (1993).
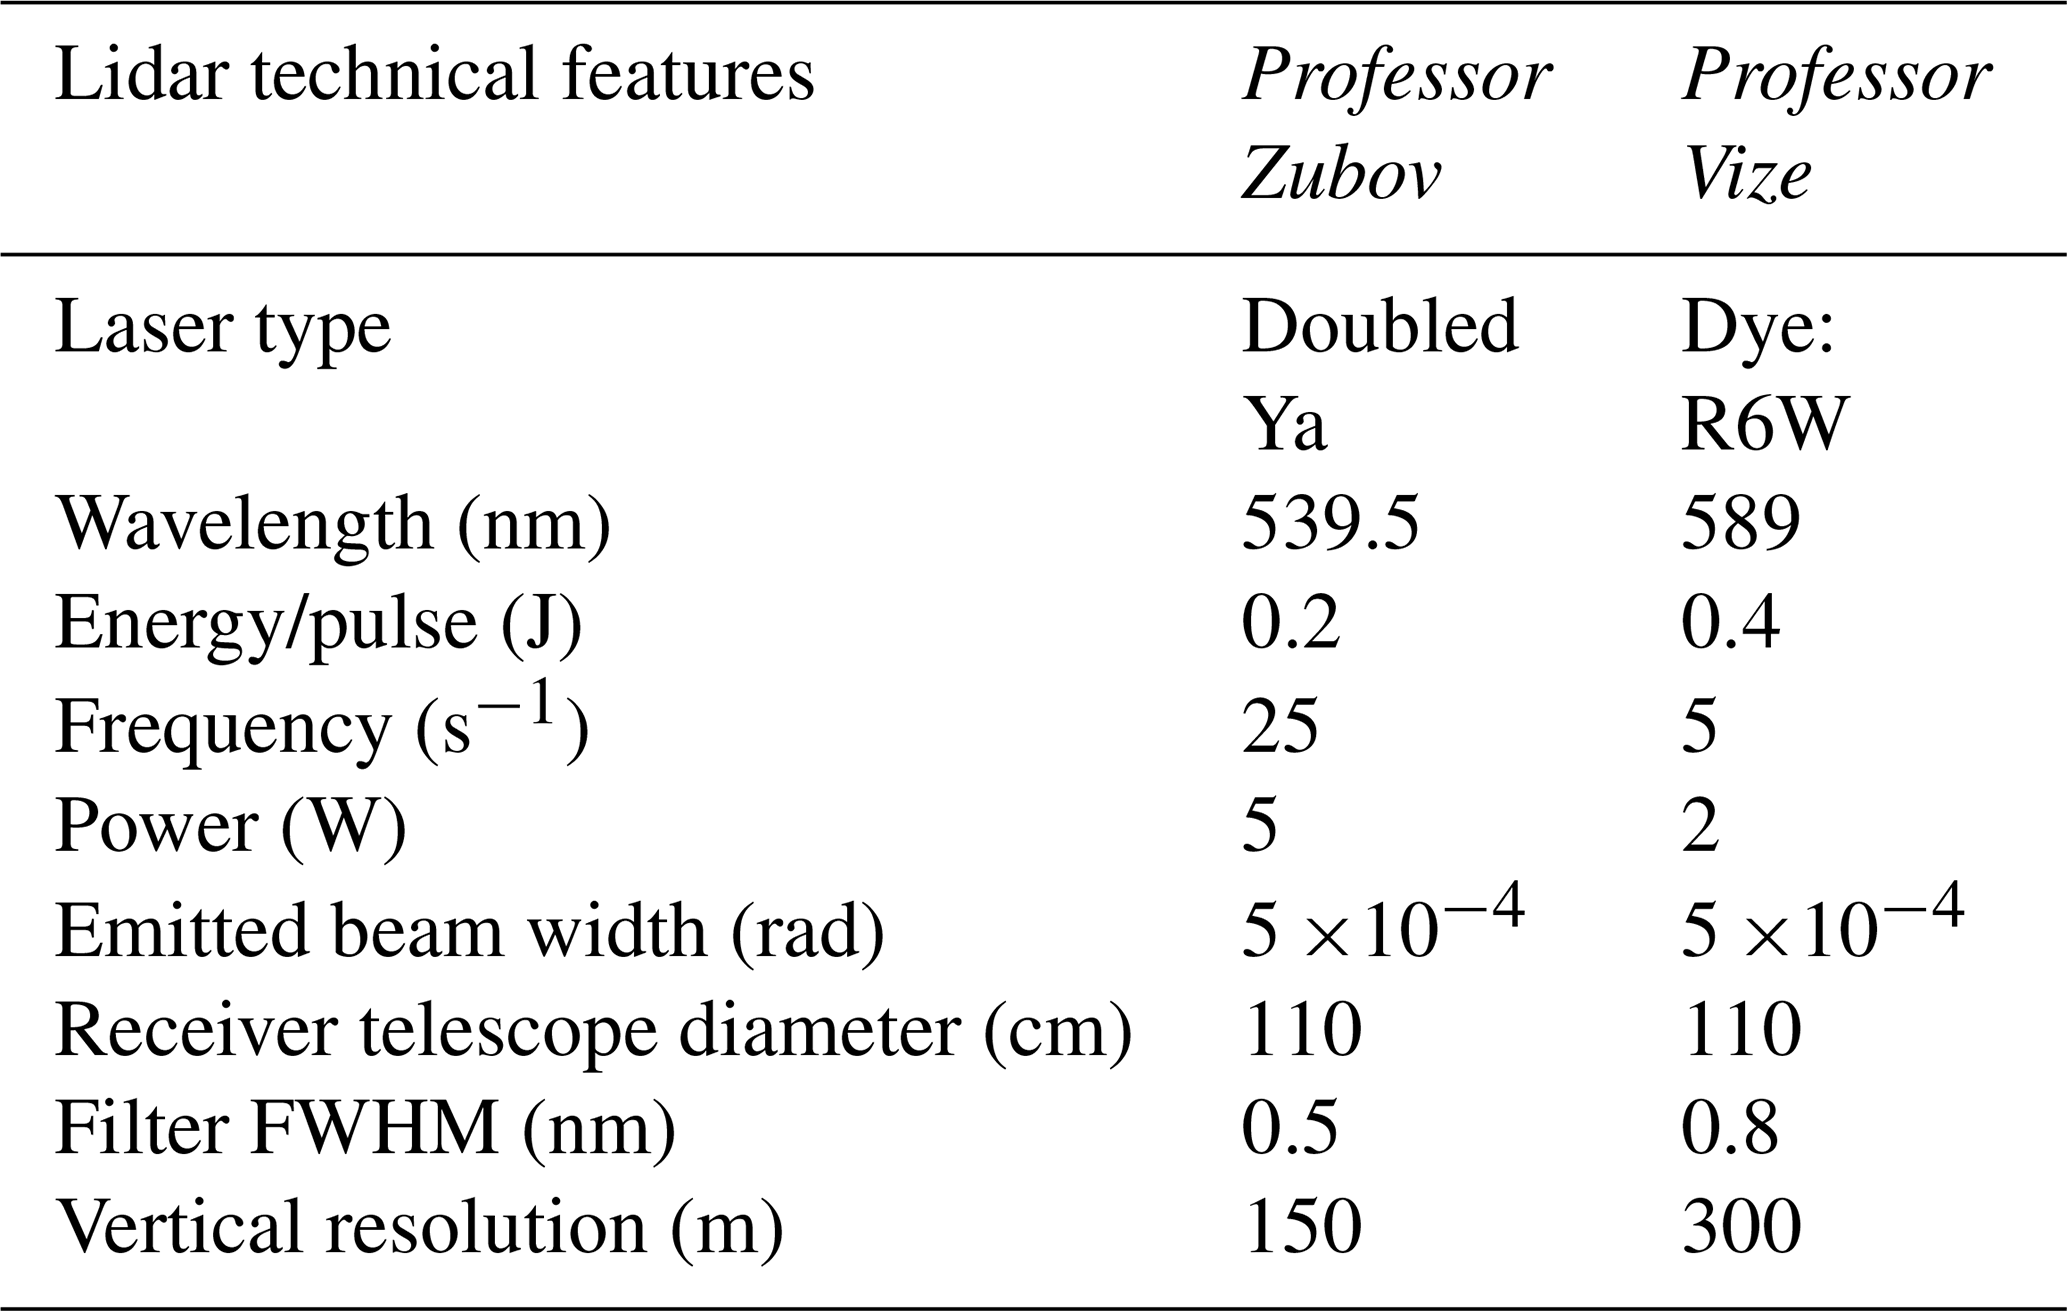
FWHM: full width at half maximum.
2.2 Data source
Philippe Keckhut contributed the lidar scattering ratio (SR) profile dataset derived from the lidar measurements conducted by Zubov and Vize vessels for the PhD dissertation research of the lead author in 1999. The goal of that research was to validate the Mount Pinatubo SA extinction profiles measured by the Stratospheric Aerosol and Gas Experiment II (SAGE II) with ground-based lidar observations (Antuña et al., 2002, 2003). However, we found very little information to comply with the proposed goal due to a combination of two factors. Firstly, the SAGE II profiles were truncated below the upper portion of the SA layer in the tropics for almost half a year after the June 1991 Mount Pinatubo eruption. It was the result of the elevated atmospheric opacity produced by the SA (McCormick and Veiga, 1992). Secondly, very few of the SAGE-II extinction profiles were coincident with either vessel’s lidar soundings, with the coincidence criteria selected (Antuña et al., 2002). The dataset was not used and had remained stored in the lead author's archives since 1999.
2.3 Dataset description
In brief, the datasets consist of 48 data files from the Professor Zubov vessel, containing daily profiles of the lidar SR(z) profiles and 11 lidar SR(z) profiles from Professor Vize vessel. The trajectories of both ships are shown in Fig. 1 with the positions where the lidar measurements were conducted marked with symbols. The Professor Zubov vessel (red stars) began its measurements on 12 July 1991 from 39∘ N, 28∘ W, travelling towards the Caribbean. After arriving in the Caribbean near Punta de Maisí (the easternmost point of Cuba), for the last week of July and first weeks of August its trajectory consisted of a loop around the Lesser Antilles island group (see Fig. S2), the most southward lidar measurement on 9 August (10∘ N) near Trinidad and Tobago. From 19 August the Zubov began an eastward trans-Atlantic leg travelling from 21∘ N, 63∘ W in the direction of northern Africa. Five co-located lidar measurements made whilst the ship remained for 7 d (3–9 September) at its most southward point in the vicinity of 8∘ N and 24∘ W. Nine further measurements were made as the ship travelled northeast towards Europe, with the last measurement taken on 21 September in the vicinity of northern Spain.
Whereas the July to September Zubov lidar measurements of the Pinatubo cloud from the Caribbean and Atlantic provide information on the early stages of the Pinatubo aerosol cloud as it was in transition from its initial sheared plume structure, the Professor Vize measurements (blue diamonds) were after a substantial proportion of the tropical reservoir of volcanic aerosol (e.g. Grant et al., 1996) had already been transported to mid-latitudes. The Vize began in the Southern Hemisphere on 26 January 1992 (−8∘ S, 2∘ W), moving northward, measuring this later phase of the tropical Pinatubo aerosol reservoir, the datasets providing a transect of seven tropical lidar profiles along the western coast of central and northern Africa in the latitude range 10∘ S to 20∘ N, from 26 January to 1 February. The final four measurements were then of the mid-latitude Pinatubo cloud, from 34∘ S from just north of the Canary Islands, then off the coast of northern Spain, with the final two measurements in the Baltic Sea on 19 and 20 February at 56 and 59∘ N (18 and 27∘ E). It should be noted that the Vize lidar dataset contains only 11 of the 20 measurements in the two papers; another 9 lidar profiles are reported to have been conducted (Avdyushin et al., 1993; Nardi et al., 1993).
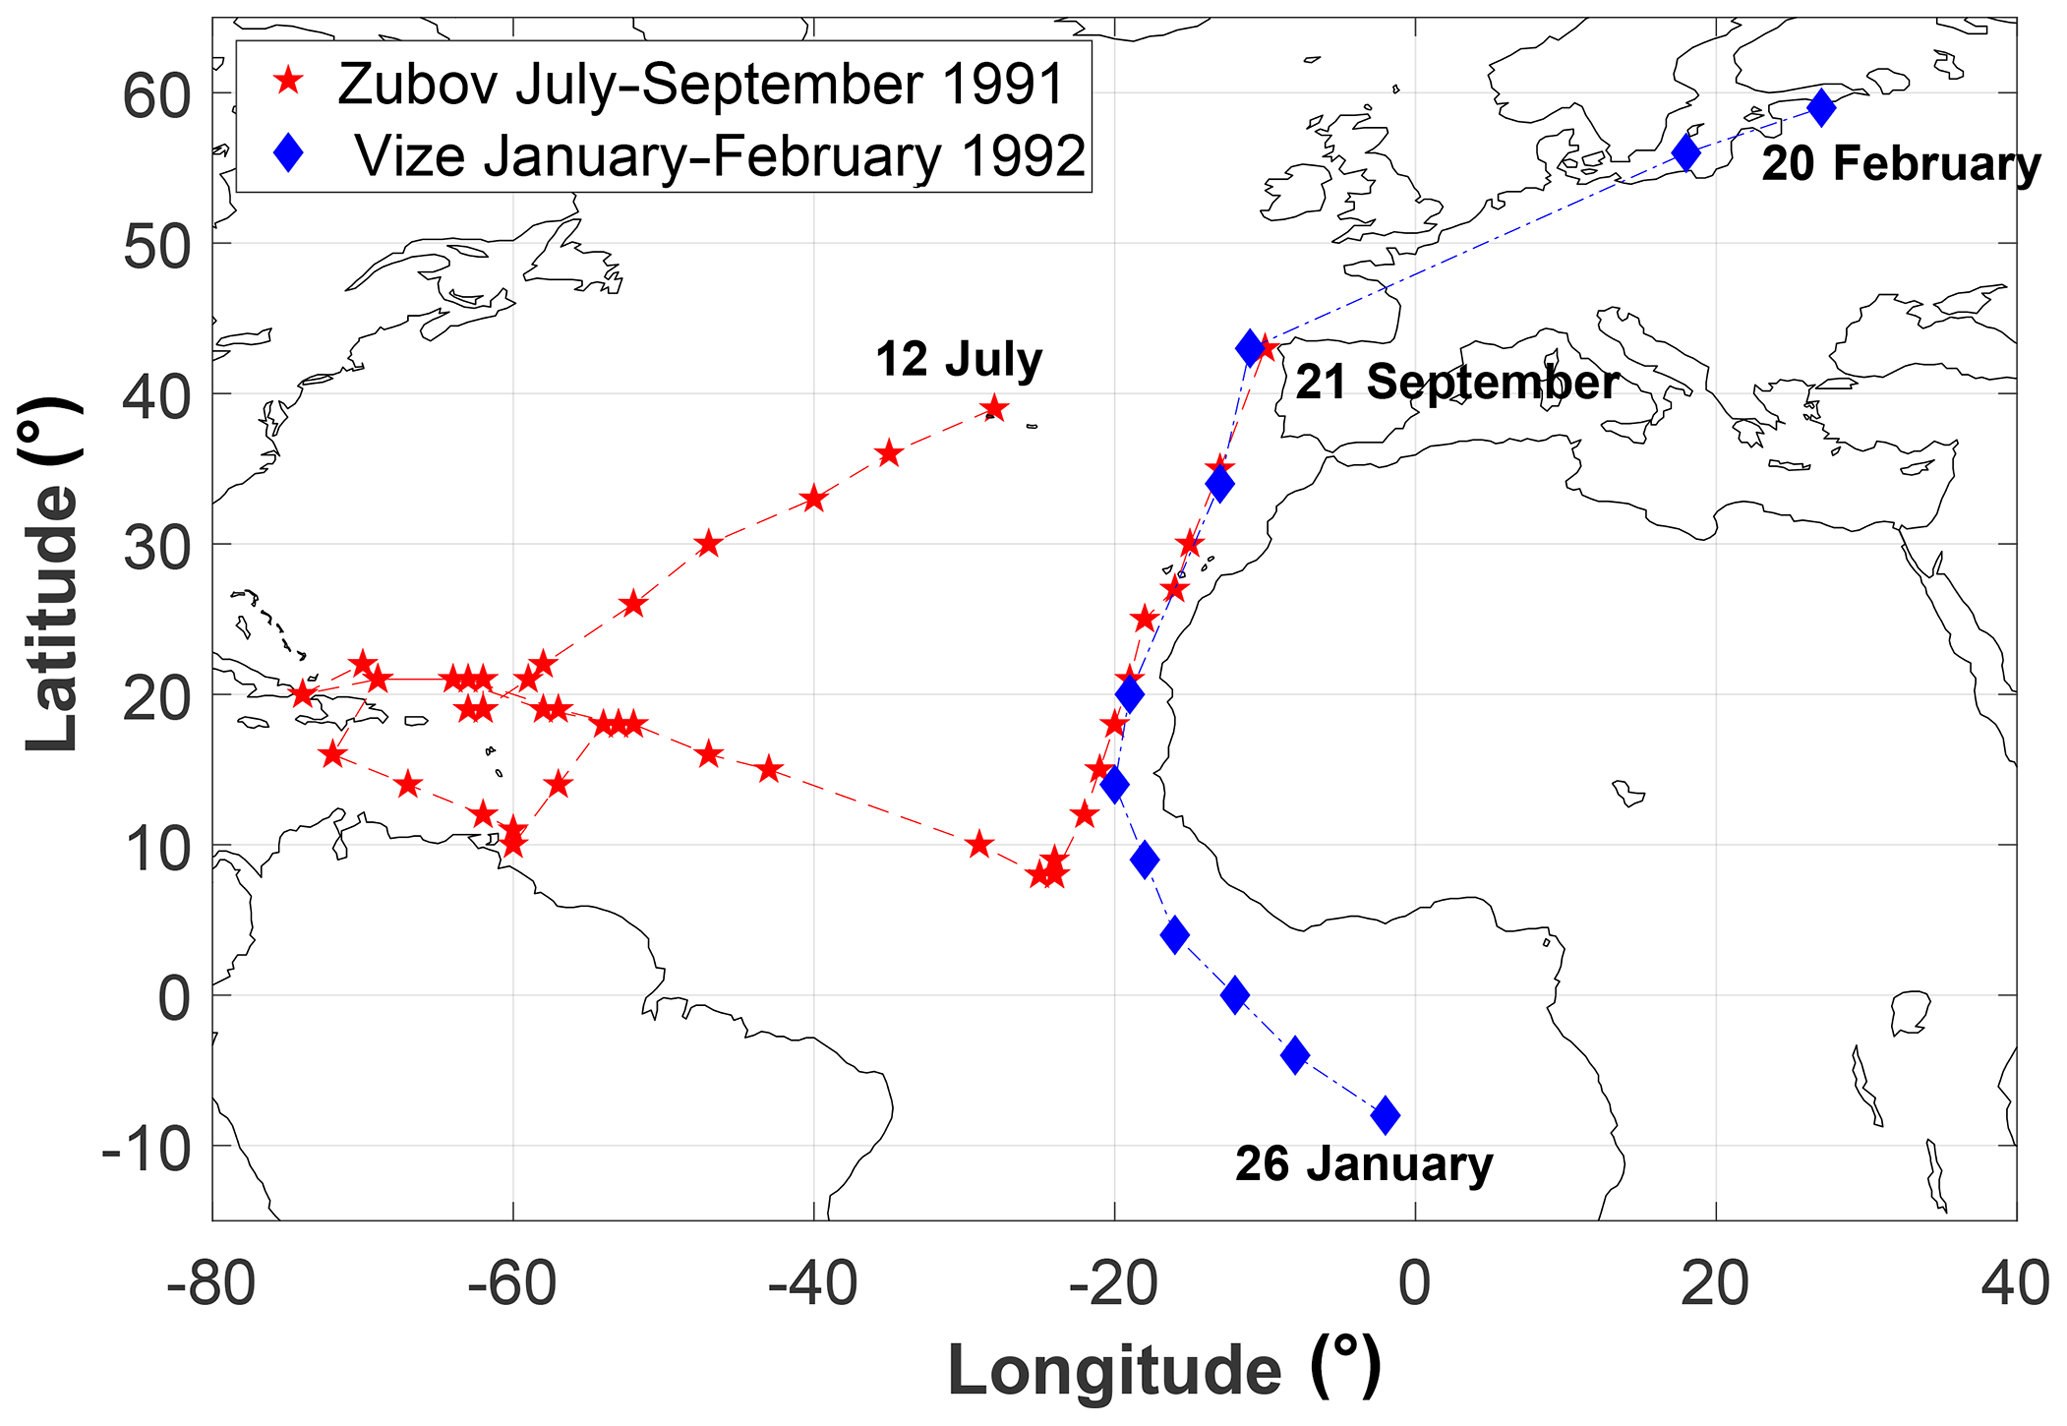
Figure 1Trajectories of the Professor Zubov (red stars) between 12 July and 21 September 1991 and Professor Vize (blue diamonds) between 26 January and 20 February 1992.
To comply with the goal of reproducing the aerosol extinction vertical profiles (αext(z)) reported in Avdyushin et al. (1993) and Nardi et al. (1993) from the available SR(z), we deliberately followed exactly the same algorithms and parameter assumptions used in those papers. This section describes each of the processing steps they conducted, which we have followed exactly for the recovered dataset. To derive the 532 nm aerosol signal, the approach taken in both datasets was to specify a Rayleigh backscattering cross section coefficient of m2 sr−1 at 532 nm. For the 539 nm lidar SR in the Zubov dataset, no wavelength dependence was accounted for. The wavelength difference from the target 532 nm was considered negligible, whereas for the 589 nm lidar SR on the Vize dataset, a correction factor of the Rayleigh backscattering cross section coefficient at 532 nm () was used (Avdyushin et al., 1993).
Then Rayleigh backscatter at the surface was calculated. For each lidar measurement the Rayleigh backscatter profiles (βmol(z)) were derived using the vertical profiles of pressure (P(z)) and temperature (T(z)) from the CIRA-86 atmospheric model (Flemming et al., 1988). The procedure consisted in determining the geopotential height (Zg(z)) and T(z) at the mandatory P(Z) levels from 1000 to 0.1 hPa from the CIRA-86 atmosphere taking into account the month the measurement was conducted and latitude of the ship for each individual measurement. Then the Zg(z) was converted to geometric altitude (z). Afterwards, the P(z) values were logarithmically interpolated in the vertical to the altitude of the lidar SR levels. A similar method was used for T(z) but using lineal interpolation. Then the βmol(z) is derived using the standard procedure (Bucholtz, 1995). Next, the aerosol backscattering profiles (βaer(z)) were derived using Eq. (1) (Russell et al., 1979). To avoid zero or negative values in βaer(z), produced by SR(z) equal to or lower than 1 respectively, we replaced those SR(z) values by 1.01 following the value proposed by Russell et al. (1979) for the SR(z) minimum aerosol level. At the levels where this change took place, the magnitude of βaer(z) is 2 orders lower than the magnitude of βmol(z) at the same level. Equation (1) was used to derive βaer(z):
The next step consisted in calculating the αaer(z) from the βaerl(z) using Eq. (2), using a constant value in time and altitude of 0.04 sr−1 for the aerosol backscattering-to-extinction ratio (Advyushin et al., 1993).
It is worth mentioning that it is more common to use the inverse of the term among squared brackets in the former equation, termed the extinction-to-backscatter lidar ratio or sometimes simply referred to as “the lidar ratio”. However, taking into account the goal of this work, to reproduce exactly these hitherto unavailable data records, the language and terms used in the two cited papers has been preserved here. In addition, regarding the magnitude of 0.04 sr−1 for the backscattering-to-extinction ratio (25 sr if the extinction-to-backscatter lidar ratio definition is used), this value is taken to be representative of an aqueous sulfuric acid aerosol cloud with the particle size distribution suitable for this period, 3–9 months after the Pinatubo eruption, when the effective radius was greatly enhanced compared to background levels (see, e.g. Bauman et al., 2003). Vaughan et al. (1994) showed how the lidar extinction-to-backscatter ratio for aqueous sulfuric acid clouds decreases for larger particles, with more moderate volcanic aerosol clouds having higher extinction-to-backscatter ratios (see, e.g. Prata et al., 2017). For the 1991 Mount Pinatubo eruption, a set of vertical profiles of extinction-to-backscatter lidar ratio values from 355 to 1064 nm were produced for each month, based on size distribution fits (Jäger et al., 1995) to balloon-borne optical particle counter-measurements in mid-latitudes (Deshler et al., 1993). The conversion factors are a function of the time after the eruption and the altitude, comprising a set of wavelength exponents to convert aerosol backscatter across several wavelengths from 355 to 1064 nm, and also for aerosol extinction (Jäger and Deshler, 2002). Since the effective radius enhancement after Pinatubo was much larger in the tropics than in mid-latitudes (see, e.g. Russell et al., 1996; Bauman et al., 2003), it remains a potential future community research effort to produce a recommended Pinatubo lidar extinction-to-backscatter ratio dataset suitable for the tropics and for other major eruption periods.
The tabulated lidar SR profiles and the calculated βaer(z) and αaer(z) profiles at the wavelength of 532 nm from both lidars are available at https://doi.org/10.1594/PANGAEA.912770 (Antuña-Marrero et al., 2020).
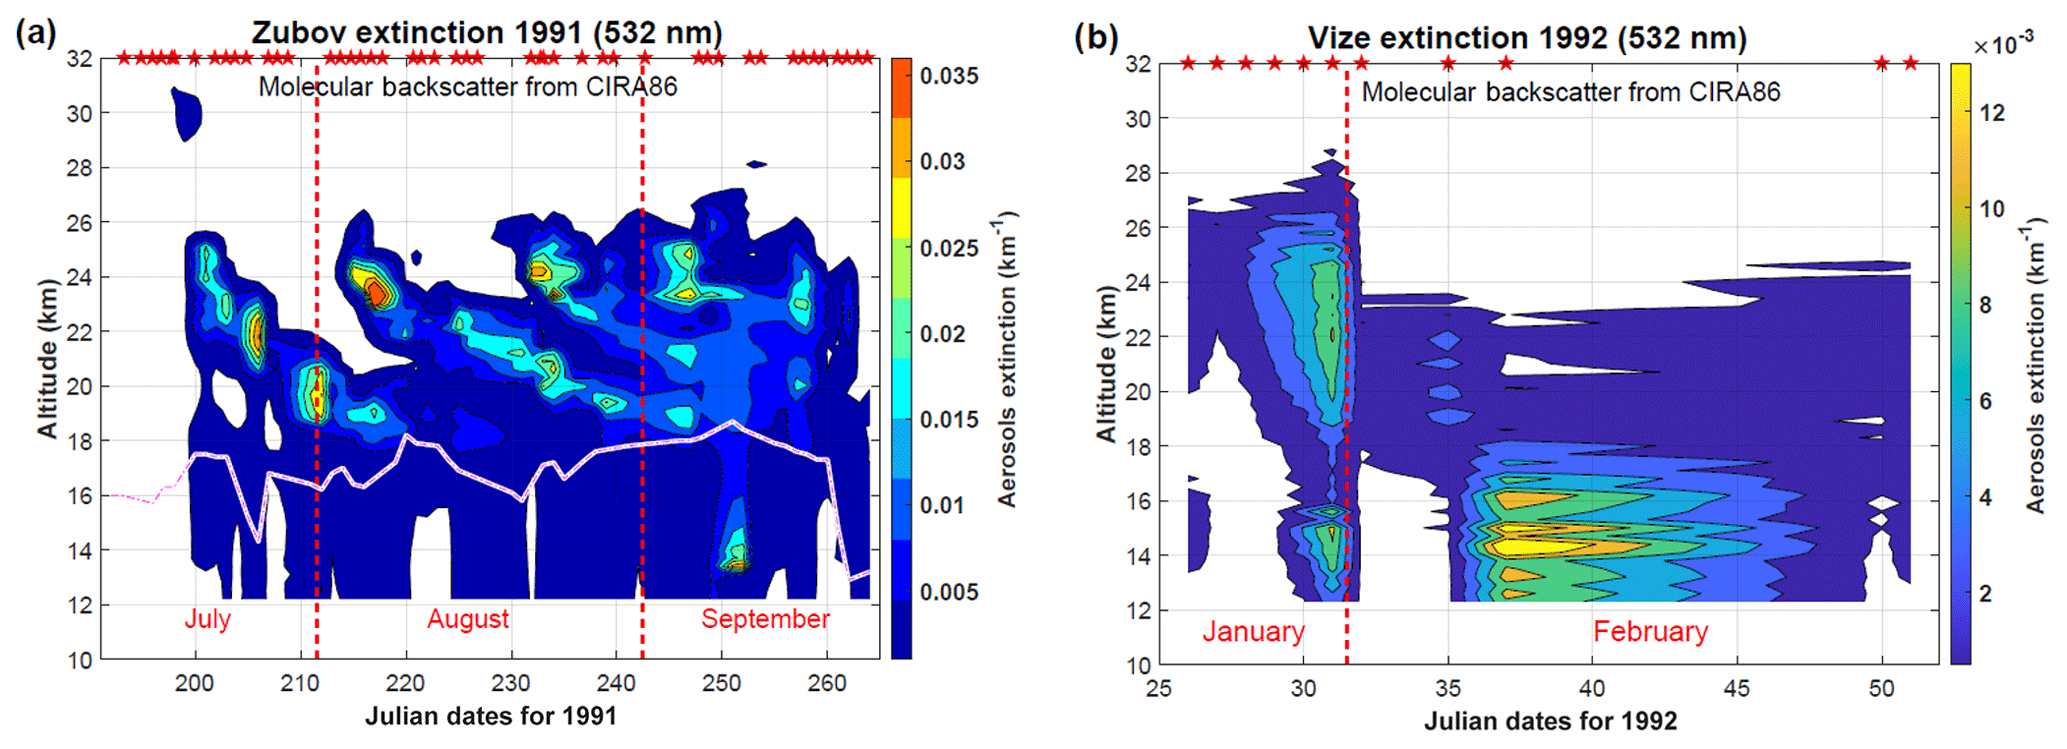
Figure 2Temporal–vertical cross sections of the aerosol extinction at 532 nm measured by the lidar on board the two shipborne lidars during their trajectories: (a) Professor Zubov ship and (b) Professor Vize ship.
4.1 Validation of the reproduced dataset
No tabulated data are available for the αaer(z) values used in the cited Avdyushin or Nardi papers, the only published source of information about the measurements. In addition, the papers do not conduct detailed discussions or mention the extinction-relevant features in the Zubov and Vize datasets. Here we make use all the available information to conduct a semi-quantitative validation for the Zubov dataset. In the case of Vize, it is only possible to conduct a qualitative validation.
Figure 1a and b show the temporal–vertical cross section of the αaer(z) measured by the lidars on board the Professor Zubov and Vize ships. The pink discontinuous line on top of the white background in Fig. 1a is the altitude of the tropopause at the locations the lidar measurements were conducted. The tropopause altitudes were derived from the ERA-Interim reanalysis potential vorticity profiles, interpolating to the height levels of the lidar measurements and selecting the height of the PV surface.
Figure 2a shows the same pattern of the temporal–vertical cross section of the αaer(z) for the entire Zubov trajectory as the one reported in Fig. 2 in Avdyushin et al. (1993). Both figures are the main semi-quantitative comparison of the results we present here with those shown in Avdyushin et al. (1993), also validating our method with the few quantitative values reported in the two papers. The magnitudes of the αaer(z) are on the same order in both figures, as can be seen comparing the scales of the colour bars on the right side of both of them. A careful comparison between the areas in red (corresponding to the highest values of αaer(z)) in both figures shows a larger area in Fig. 2 of Avdyushin et al. (1993), an indication of slightly lower values in the values of αaer(z) we reproduced. Moreover, the maximum αaer(z) value in the reproduced dataset is 0.054 km−1 at 23.3 km of altitude on 4 August, which can be seen in Fig. 2a. Avdyushin et al. (1993) reported the maximum at 18∘ N between 23 and 24 km of altitude with an αaer(z) value of 0.08 km−1 the same day. All those facts demonstrate the agreement of the reproduced dataset with the original one.
In Fig. 2a the presence of an area of high values of the αaer(z) at the tropical middle troposphere in September 1991 around day 250 should also be noted. This signature is not seen on the temporal cross section from the Zubov lidar in Fig. 2 of Avdyushin et al. (1993) because the vertical-axis lower altitude is at 15 km. It appears more clearly in the temporal cross section of the SR(z) from the Zubov lidar, Fig. 4 in Nardi et al. (1993), having the vertical axes beginning at 12 km. This feature may be associated with the combination of what seems to be a downward transport of stratospheric aerosols with the presence of a thick cirrus cloud attached below. The profiles associated with this feature will be discussed later. The features described above demonstrate that the reproduced αaer(z) dataset in the case of Zubov is in reasonable agreement with the reports in the only two papers available describing the measurements.
Figure 2b for Prof. Vize shows in general the same pattern as Fig. 3 in Avdyushin et al. (1993), although the αaer(z) magnitudes in the reproduced dataset are lower. In some way the lack of 9 measurements (∼ 45 %) of the 20 reported to be conducted (Avdyushin et al., 1993) contributes to those low αaer(z) magnitudes in the Vize dataset. Also, in Fig. 2b lidar information is available on the extension of the vertical axes down to the lower level, 12 km. This allows one to see aerosols in the upper troposphere, which is not the case in Fig. 3 of Avdyushin et al. (1993, Fig. 3).
4.2 Downward transport of stratospheric aerosols with a thick cirrus cloud below
The cited area of high values of αaer(z) at the tropical middle troposphere in September 1991 around day 250, shown in the Fig. 1a, is associated with the αaer(z) profile in Fig. 3 for 8 September 1991. The profile of αaer(z) extends from 24 km in the lower stratosphere to 12 km, middle–upper tropical troposphere, across the tropopause located at 18.2 km. The most plausible explanation of the vertical extension of the layer is the occurrence of stratospheric aerosol downward transport into the upper and middle troposphere. Figure 3 also includes the value of the total aerosol optical depth (TAOD) of 0.183, resulting from the contributions of the stratospheric AOD (SAOD) from the tropopause to 33 km, which was 0.085. The upper tropospheric AOD (UTAOD) was 0.098, from 12 km to the tropopause. SAOD and UTAOD have contributions on the same order of magnitudes as the TAOD, showing the notable magnitude of the stratospheric aerosols into the upper and middle troposphere.
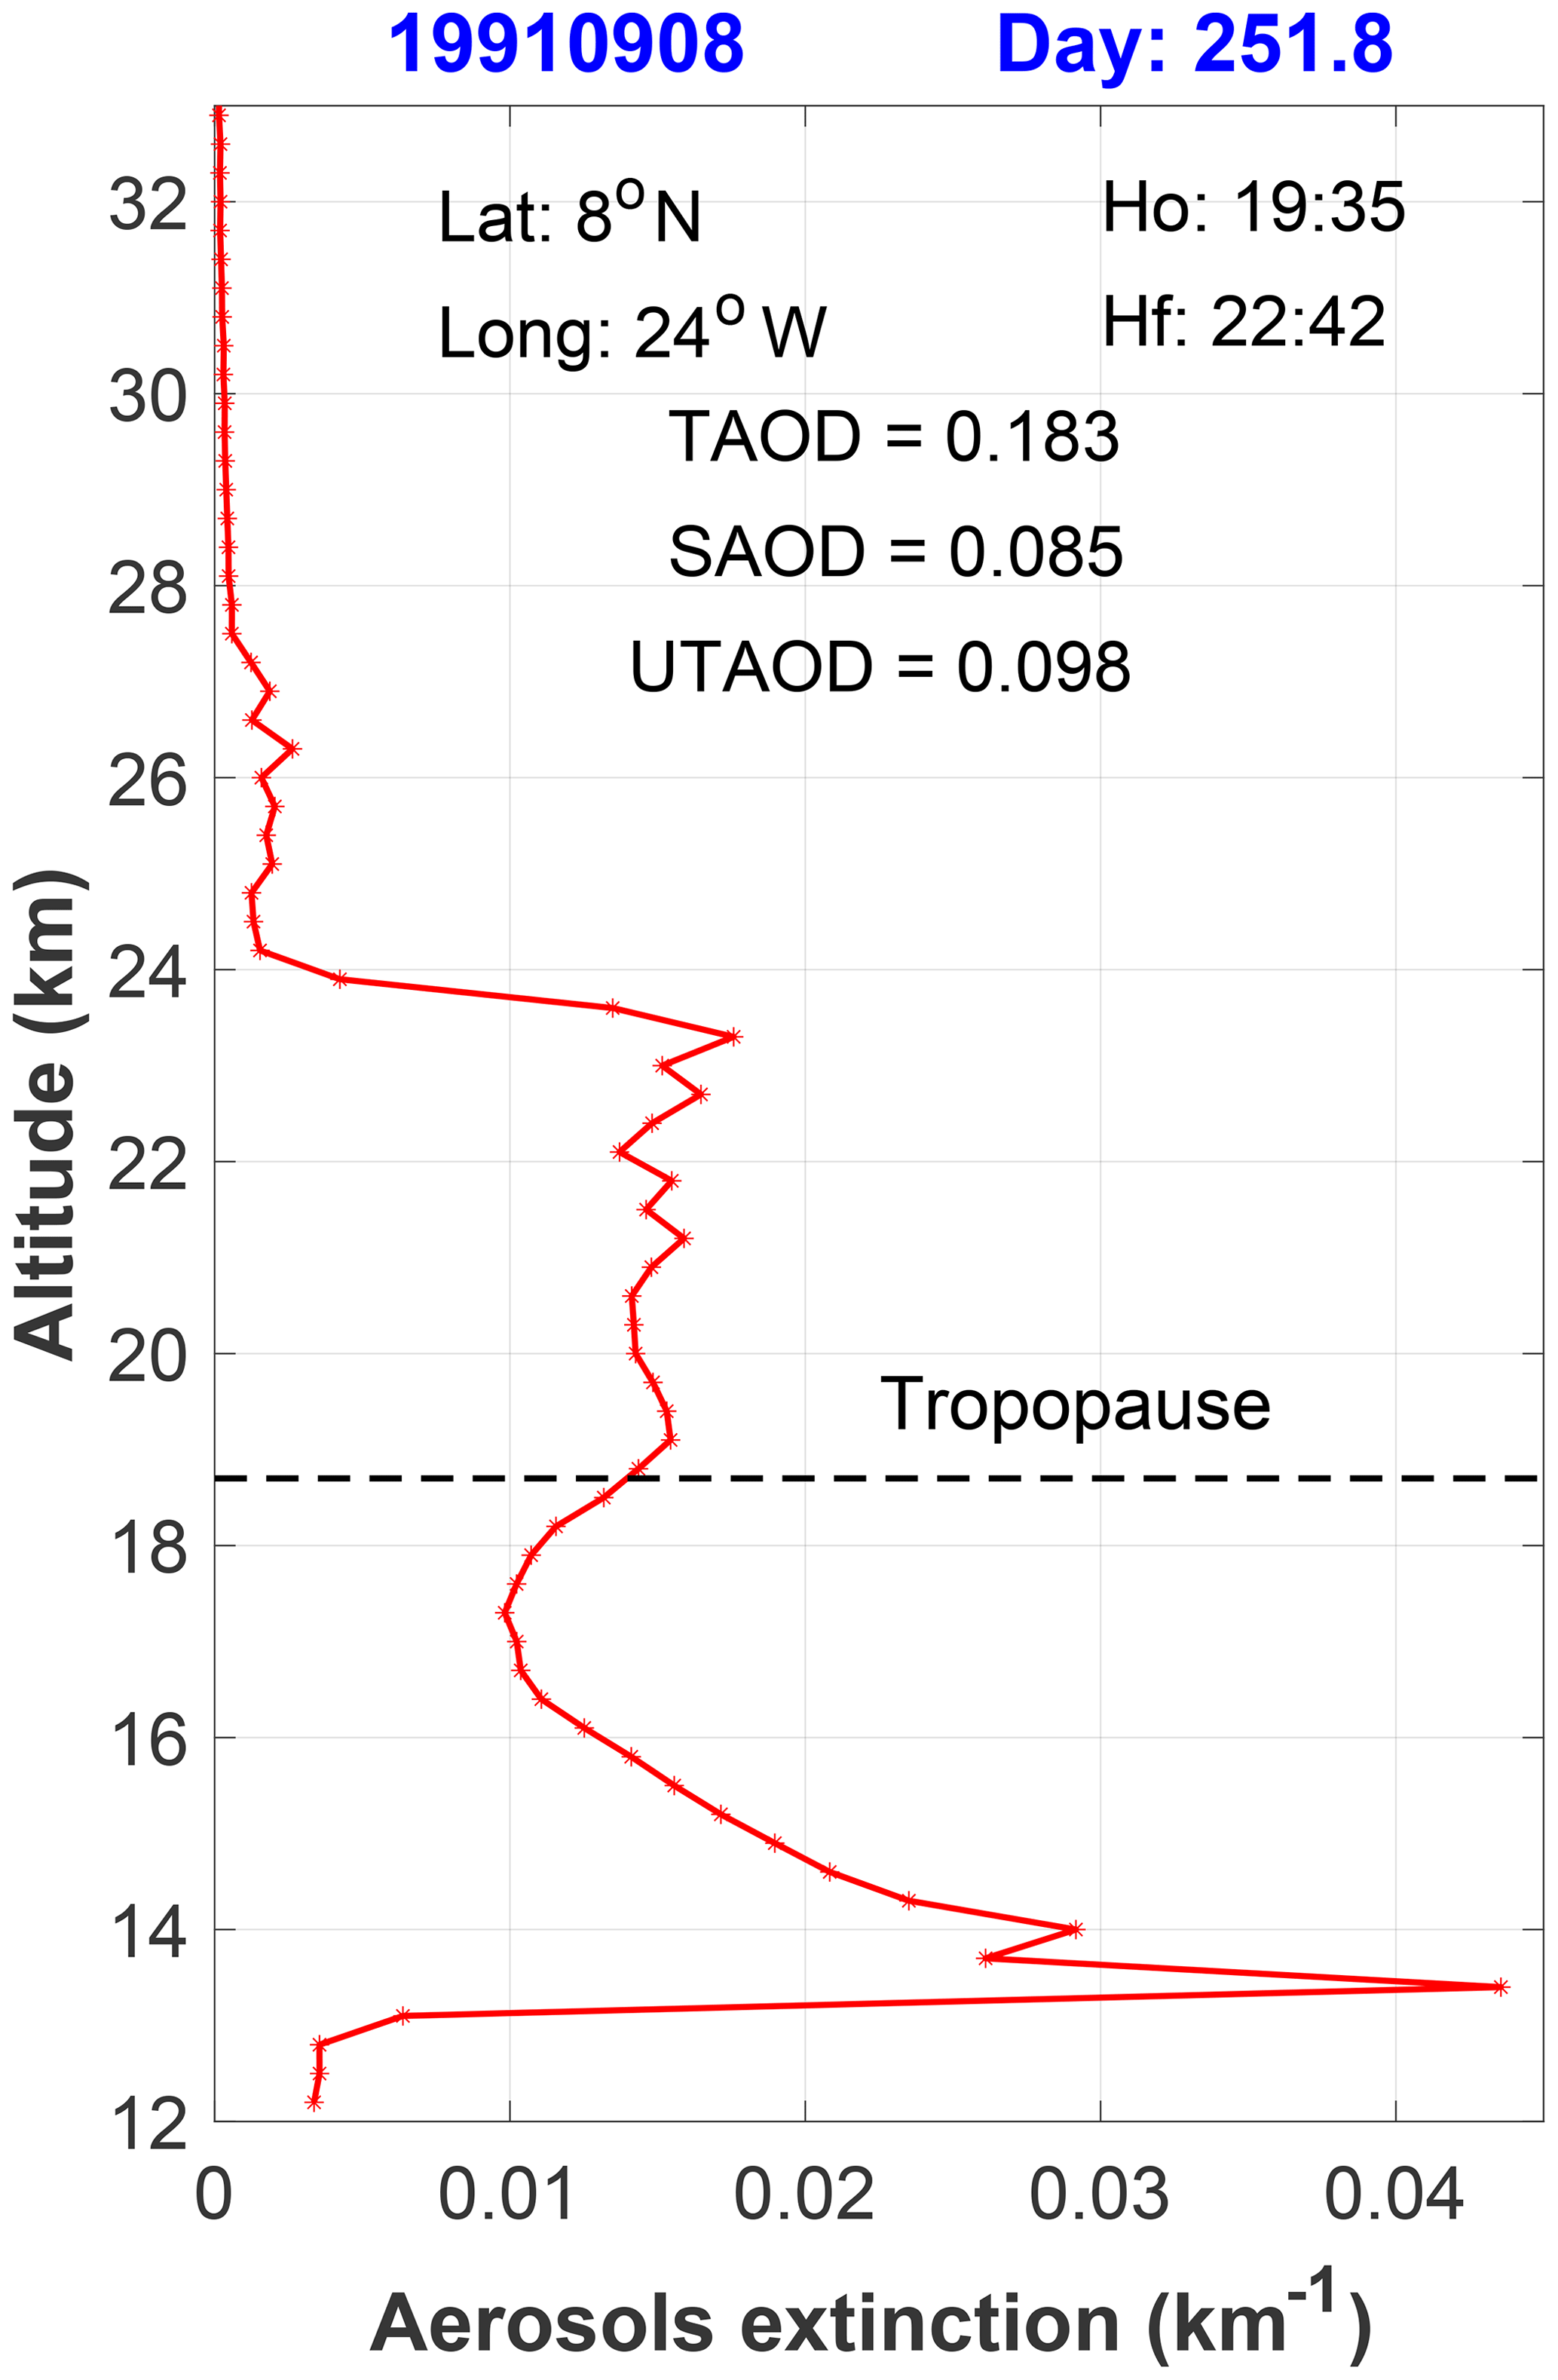
Figure 3Profiles of the αaer(z) for 8 September at 8∘ N, showing the presence of cirrus clouds between 13 and 14 km. In addition, between 20 and 18 km the transport of stratospheric aerosols from the stratosphere into troposphere across the tropopause is evident.
Figure 3 also shows that αaer(z) decreases from 0.012 km−1 at the 18.2 km (tropopause) up to 0.02 km−1 at 17.3 km and then increases to ending in two sharp maximums at 14 and 13.4 km with αaer(z) of 0.029 and 0.044 km−1 respectively. This double peak layer at the bottom of the Pinatubo stratospheric aerosol layer is a cirrus cloud, a phenomenon already reported for Pinatubo. A similar lidar βaerl(z) profile structure is reported at Sodankylä (Finland), 66∘ N, in Fig. 1 of Guasta et al. (1994) for 3 February 1992. This measurement conducted at Sodankylä was part of the European Arctic Stratospheric Ozone Experiment (EASOE) campaign during December 1991 to March 1992, where cirrus clouds were reported in 50 % of the 56 measurements conducted. Cirrus clouds were reported to grow often within the stratospheric aerosol layer from Mount Pinatubo as in the case we are discussing (Guasta et al., 1994). This profile shows, probably, the earlier case of a cirrus observed in lidar measurements of the Mount Pinatubo stratospheric aerosols.
An interesting feature is that, in the 48 αaer(z) profiles from the lidar on the Professor Zubov vessel between July and September 1991, only in one profile was a cirrus cloud detected, only 2 % of the profiles. However, in 4 of the 11 available αaer(z) profiles from the lidar on the Professor Vize vessel between January and February 1992, four profiles showed the presence of cirrus clouds, around 40 % of the observations. This percentage is similar to that reported by a lidar located at Sodankylä, Finland (66∘ N), during the EASOE campaign between December 1991 and March 1992 (Guasta et al., 1994).
4.3 Absolute maximum αaer(z) value
Figure 4a and b show the αaer(z) profiles on 3 and 4 August 1991, Fig. 4b belonging to the day the absolute maximum value of αaer(z) was registered and Fig. 4a to the day before. Both profiles were taken at the same latitude and only 1∘ apart in longitude, allowing characterisation of the longitudinal evolution of the Mount Pinatubo stratospheric aerosol evolution and variability. A double layer is present both days. The UTAOD is almost the same for both days, but SAOD is an order of magnitude larger from 0.080 on 3 August 1991 to 0.119 the next day.
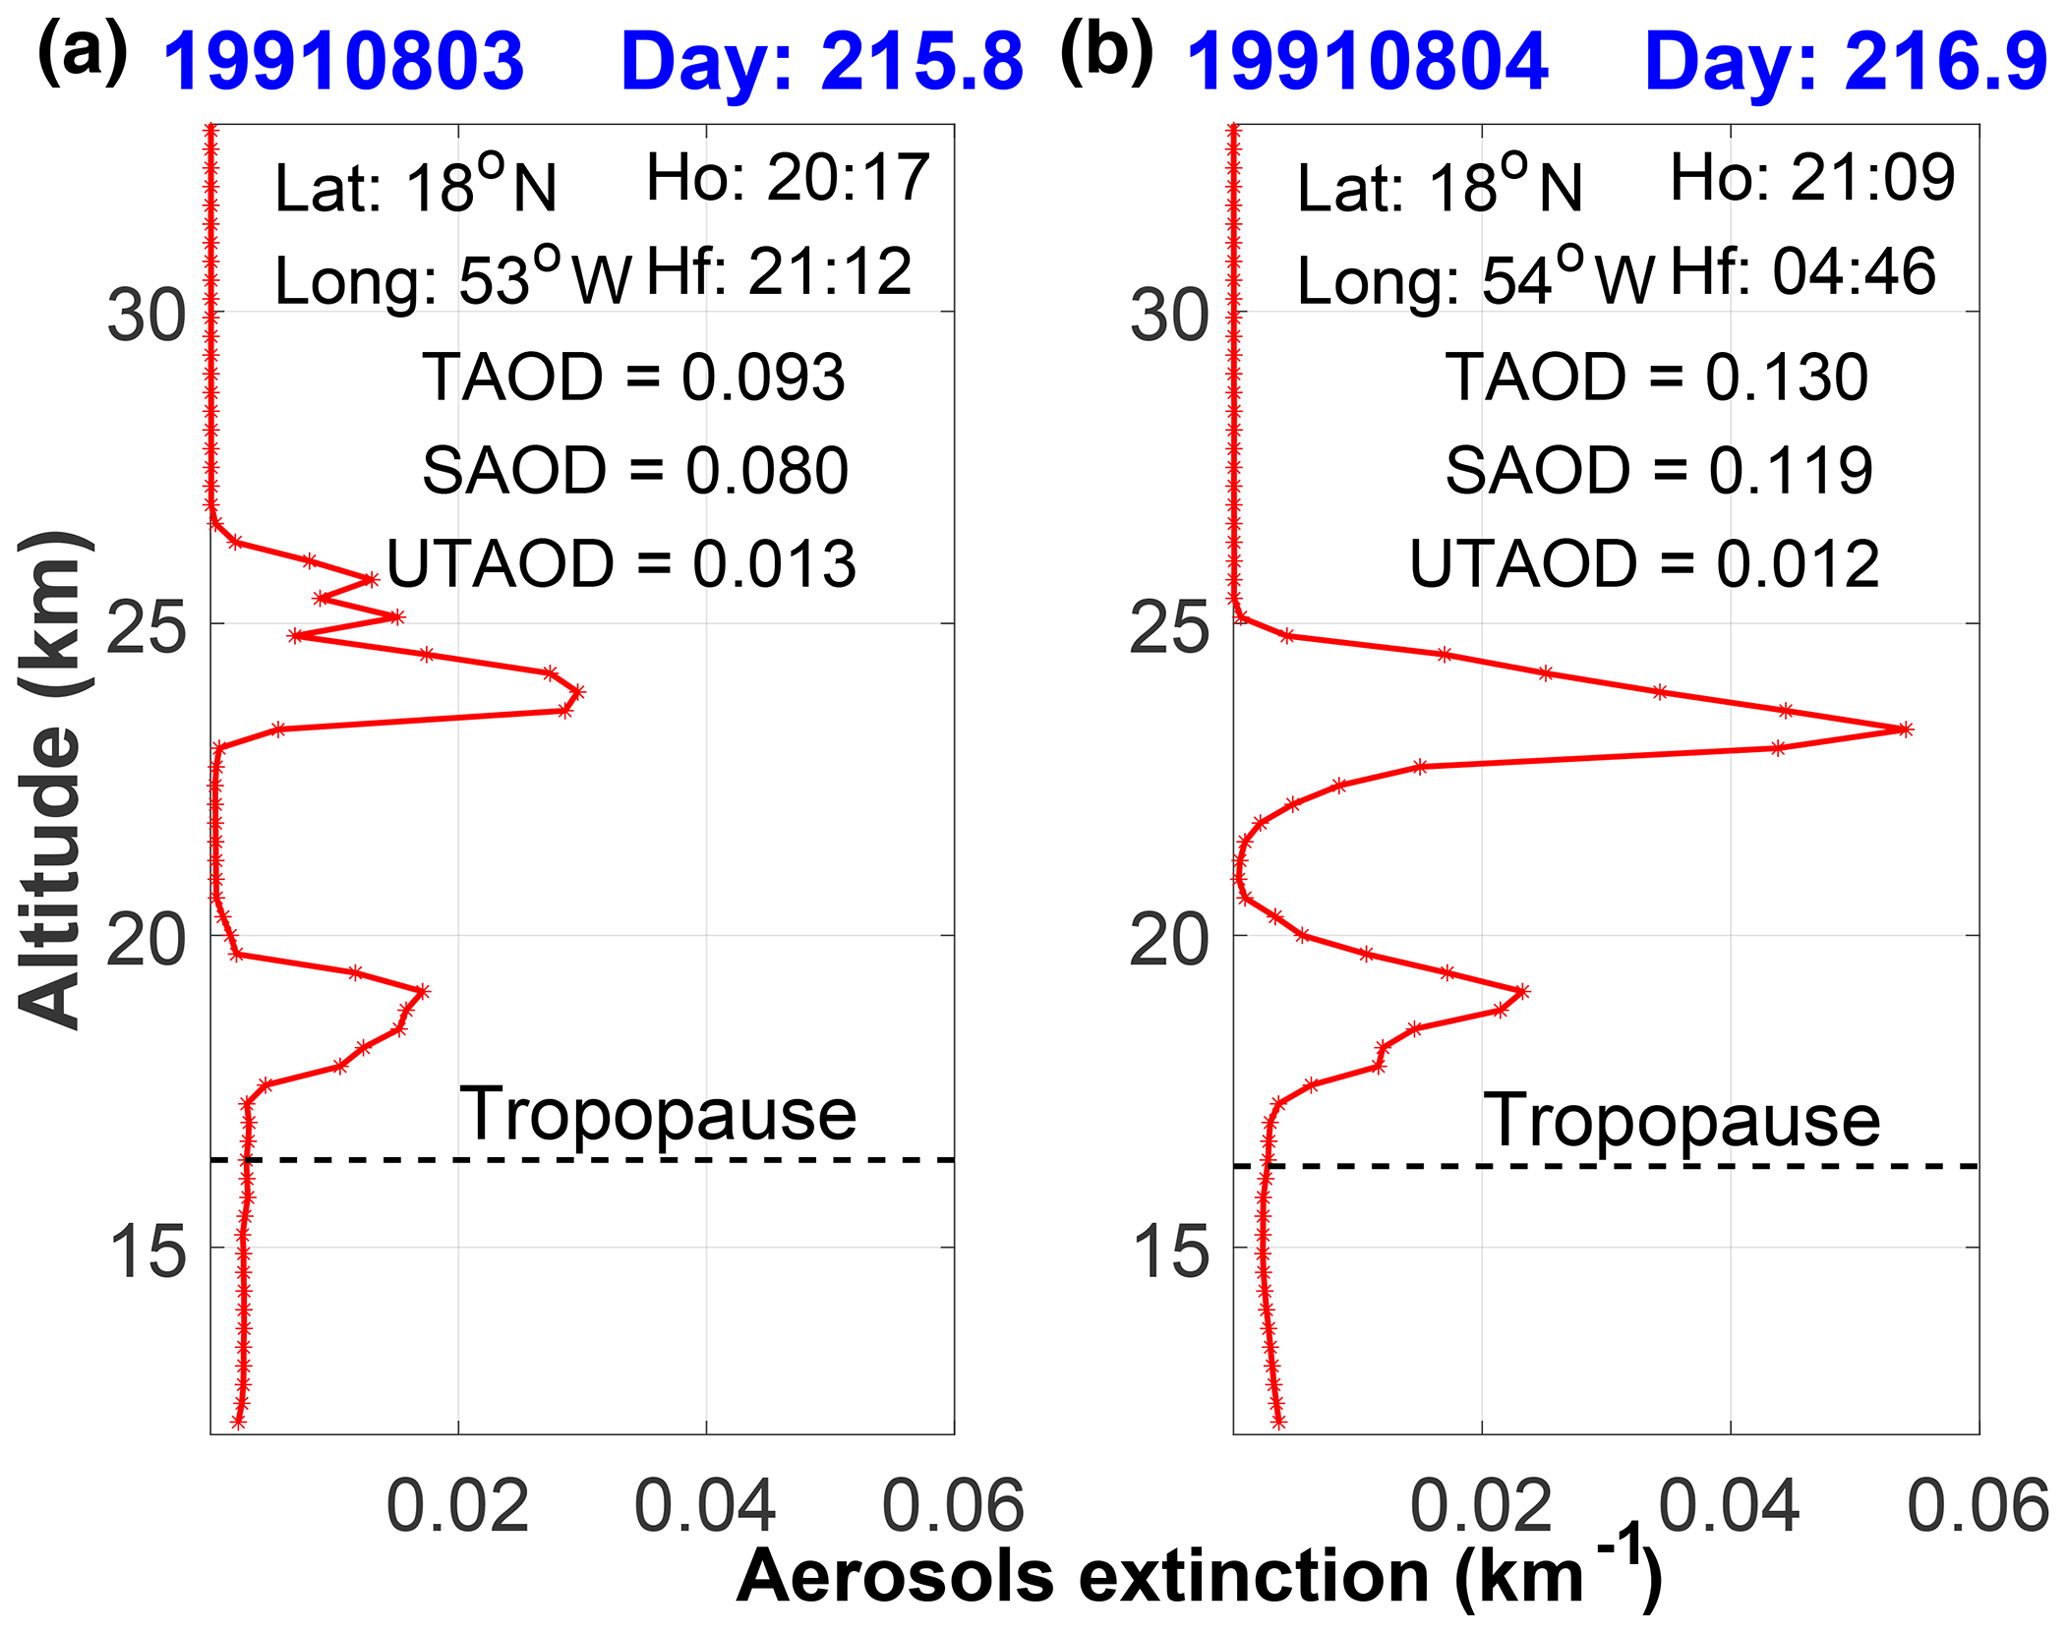
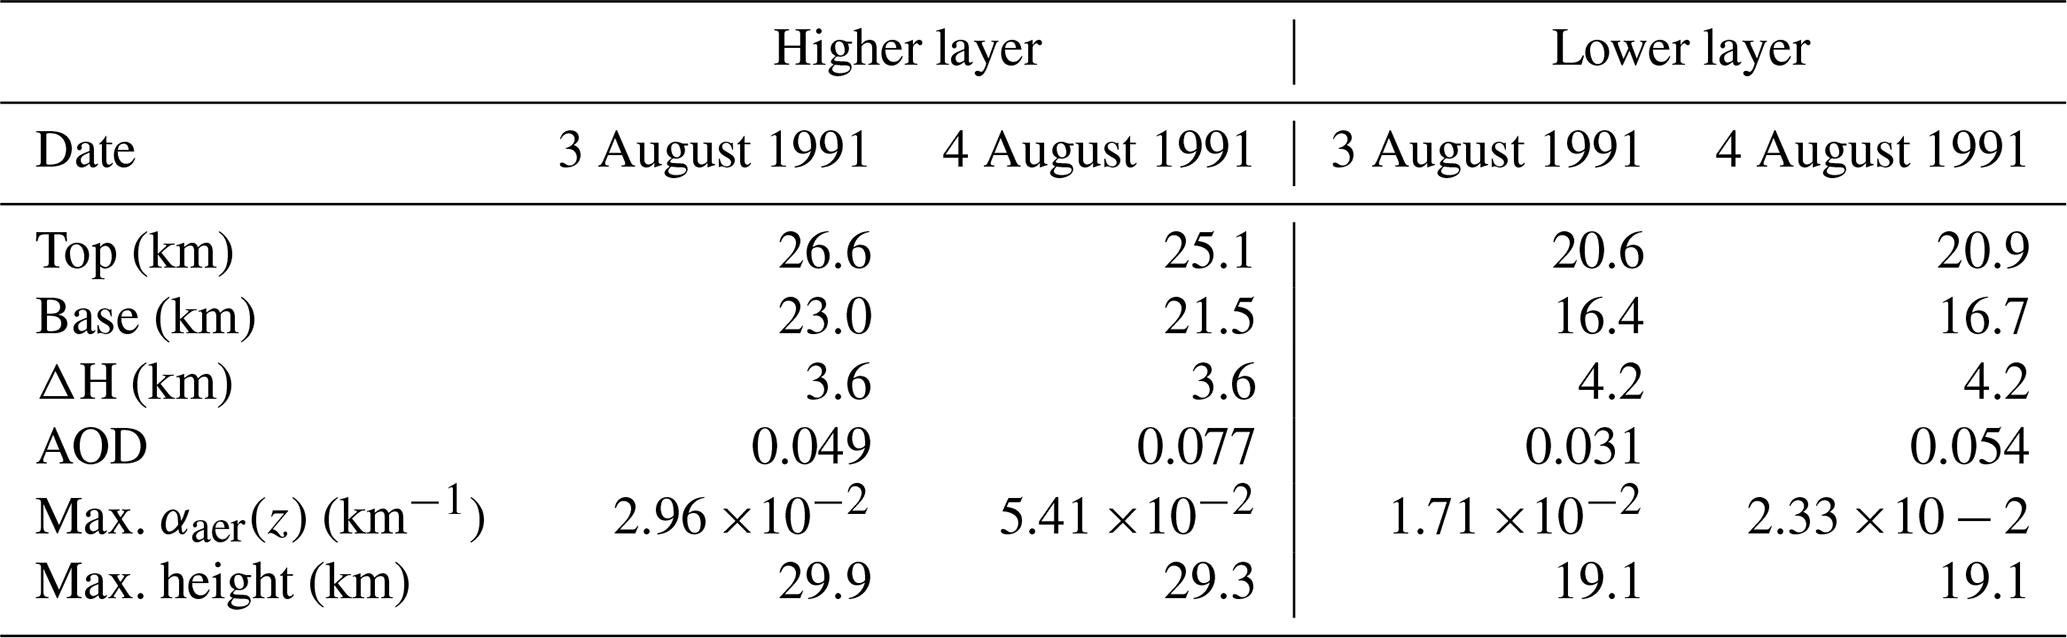
In Table 2, the geometrical and optical parameters of the higher and lower layers are present in both the 3 and 4 August αaer(z) profiles. The altitude descent of both the higher and lower layers from 3 and 4 August can be seen, with both layers keeping their depths. The altitude of the αaer(z) absolute maximum in the top layer decreased a little more than half a kilometre, but the maximum in the lower layer maintains its altitude. The magnitudes of the maximums αaer(z) in each layer increase, in 2.45 km−1 in the upper layer reaching the absolute maximum value of the entire record and in the lower layer in 0.62 km−1. The AOD increases 0.028 in the higher layer and 0.023 in the lower. This is an example of the usefulness of the rescued dataset allowing the quantification of those magnitudes during the early stages of Mount Pinatubo.
Table 2Geometrical and optical parameters of the higher and lower layers present in the 3 and 4 August αaer(z) profiles.
The former analysis was based on the assumption that the 1∘ difference in longitude between the positions of Professor Zubov lidar on 3 and 4 August 1991 could be negligible compared to the magnitudes of the lower stratosphere winds transporting the stratospheric aerosols. To support that assumptions we calculated the mean northward and eastward wind components for both days in the latitude between 15 and 20∘ N and the longitudes between 60 and 40∘ W using the NCEP Reanalysis (Kalnay et al., 1996). Figure S2 in Supplement S3 shows the profile of the lower stratosphere mean wind components for both days in the selected area around the two lidar locations. The figure confirms the northward component was insignificant, with the dominant easterly flow in the stratosphere at that time. At the altitudes of the two aerosol extinction peaks, 19 and 23 km, the easterly wind component shows values of 54 and 72 km h−1, which during the 24 h time difference measurements represent ∼ 1300 and 1700 km displacement respectively. Those displacements compare to only ∼ 110 km (for the 1∘ difference in longitude at 18∘ N), supporting our assumption.
4.4 Evolution of the daily AOD, maximum αaer(z) and its altitude along the Zubov trajectory
Figure 5 shows the temporal evolution, along the entire ship trajectory, of the daily maximum αaer(z), its altitude and the aerosol optical depth (AOD) calculated between 15 and 33 km. The three months are denoted as the latitudinal and longitudinal bands the lidar sampled during the Zubov trajectory. Daily maximum αaer(z) values are mainly in the range between 0.0541 and 5.7 km−1, with mean and standard deviation values of 0.018 and 0.013 km−1. The altitudes of the maximum αaer(z) values range between 30.8 and 12.2 km, with a mean of 21.8 km and a standard deviation of 3.5 km. The AOD mean value is 0.059 with a standard deviation of 0.041, showing its maximum value of 0.149 on 3 September at 8∘ N and 25∘ E.
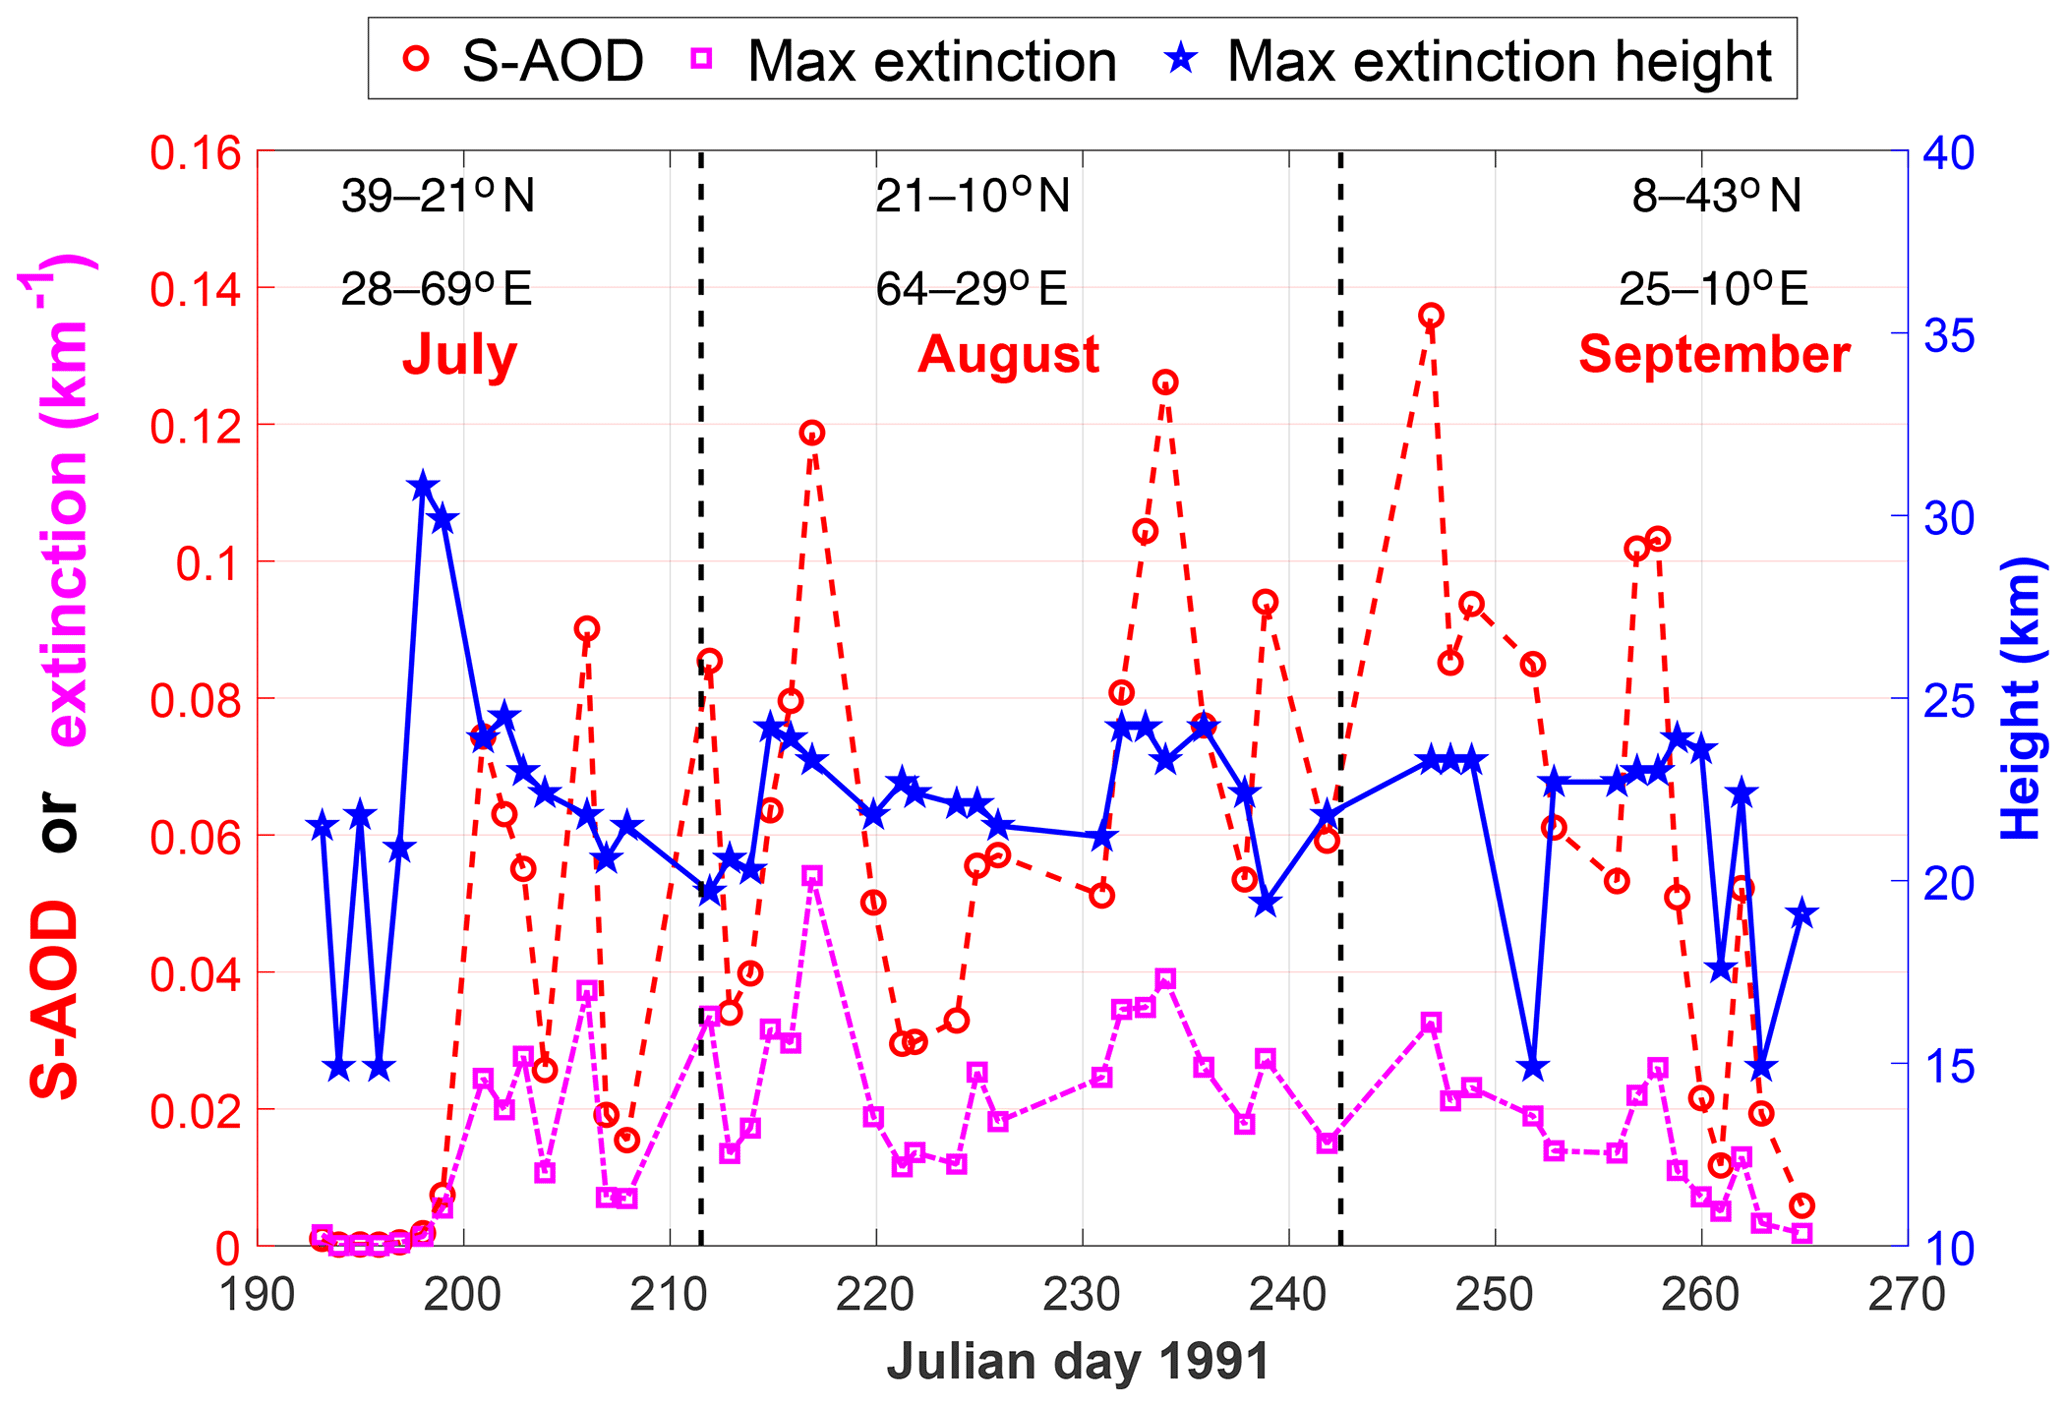
Figure 5Temporal section of the AOD, maximum extinction and its altitude from the individual lidar profiles measured by Zubov along its trajectory.
Data described in this work are available at https://doi.org/10.1594/PANGAEA.912770 (Antuña-Marrero et al., 2020).
Here we present a reproduced version of the stratospheric aerosol extinction profiles derived from lidar measurements conducted by Professor Zubov and Vize vessels already referenced in the literature (Avdyushin et al., 1993; Nardi et al., 1993), but they have been unavailable until the present. The data presented consist of two sets of vertical profiles of the SR(z), βaer(z) and αaer(z) at 300 m vertical resolution, one for each vessel. In the case of Professor Zubov the set include 48 measurement days conducted between July and September 1991 and for Professor Vize 11 measurements days between January and February 1992.
We expect this dataset to contribute to some of the current and future research to simulate the early stages of the Mount Pinatubo eruption. It will also contribute to a future GloSSAC update, helping to fill the SAGE II gaps produced by the dense volcanic aerosol cloud during the first months after the eruption.
The supplement related to this article is available online at: https://doi.org/10.5194/essd-12-2843-2020-supplement.
JCAM led the re-processing of the lidar measurements, data analysis and the preparation of the figures, with JCAM and GWM both contributing to the design of the paper and progression of the figures and text of the article. SA and BN made the original lidar measurements. PK provided the dataset and advice on the re-processing of the lidar datasets. All co-authors contributed to either advising/co-ordinating the data recovery, writing sections of the paper, and/or reviewing drafts of the paper.
The authors declare that they have no conflict of interest.
These measurements are the result of the scientific cooperation between Roscomhydromet of the former Soviet Union and the Service d'Aéronomie du CNRS of France, as well as contributions of the authors of the two cited papers and many anonymous scientists and supporters. Despite the social and economic upheaval that occurred with the collapse of the former Soviet Union, this scientific co-operation between Roscomhydromet and CNRS continued. To both agencies, to the authors of the two cited papers and to the anonymous scientists and supporting staff, we recognise the value of this continued collaboration and express our sincere gratitude to all involved. Juan Carlos Antuña-Marrero acknowledges the support of the Copernicus Atmospheric Monitoring Service (CAMS), one of six services that form Copernicus, the European Union's Earth observation programme, for his 1-month visit in March 2019 to the School of Earth and Environment, University of Leeds, Leeds, UK. We also acknowledge funding from the National Centre for Atmospheric Science for Graham W. Mann via the volcanic work package of the NERC Multi-Centre Long-Term Science Programme on the North Atlantic climate system (ACSIS, NERC grant NE/N018001/1). We also acknowledge discussions, during the CAMS-funded visit to Leeds, with Sarah Shallcross and Sandip Dhomse (University of Leeds) in relation to initial model comparisons to the Zubov lidar dataset. Wind data were provided by the NOAA/OAR/ESRL PSL, Boulder, Colorado, USA, from their website at http://psl.noaa.gov/ (last access: 26 June 2020).
This research has been supported by the Copernicus Atmospheric Monitoring Service (CAMS), one of six services that together form Copernicus, the EU's Earth observation programme. We also acknowledge funding from the UK Natural Environment Research Council (NERC) via the National Centre for Atmospheric Science (NCAS) contribution to the ACSIS long-term science programme (grant reference: NE/N018001/1).
This paper was edited by Jens Klump and reviewed by two anonymous referees.
Antuña-Marrero, J. C., Mann, G., Keckhut, P., Avdyushin, S., Nardi, B., and Thomason, L. W.: Ship borne lidar measurements in the Atlantic of the 1991 Mt Pinatubo eruption, PANGAEA, https://doi.org/10.1594/PANGAEA.912770 , 2020.
Antuña, J. C., Robock, A., Stenchikov, G. L., Thomason, L. W., and Barnes, J. E.: Lidar validation of SAGE II aerosol measurements after the 1991 Mount Pinatubo eruption, J. Geophys. Res., 107, 4194, https://doi.org/10.1029/2001JD001441, 2002.
Antuña, J. C., Robock, A., Stenchikov, G. L., Zhou, J., David, C., Barnes, J. E., and Thomason, L. W.: Spatial and temporal variability of the stratospheric aerosol cloud produced by the 1991 Mount Pinatubo eruption, J. Geophys. Res., 108(D20), 4624, https://doi.org/10.1029/2003JD003722, 2003.
Avdyushin, S. I., Tulinov, G. F., Ivanov, M. S., Kuzmenko, B. N., Mezhuev, I. R., Nardi, B., Hauchecorne, A., and Chanin, M.-L.: Spatial and temporal evolution of the optical thickness of the Pinatubo aerosol cloud in the northern hemisphere from a network of shipborne and stationary lidars, Geophys. Res. Lett., 20, 1963–1966, 1993.
Bauman, J. J., Russell, P. B., Geller, M. A., and Hamill, P.: A stratospheric aerosol climatology from SAGE-II and CLAES measurements: 1. Methodology, J. Geophys. Res., 108, 4382, https://doi.org/10.1029/2002JD002992, 2003.
Bucholtz, A.: Rayleigh-scattering calculations for the terrestrial atmosphere, App. Opt., 34, 2765–2773, 1995.
Collis, R. T. H. and Russell, P. B.: Lidar Measurement of Particles and Gases by Elastic Backscattering and Differential Absorption, in: Laser Monitoring of the Atmosphere, edited by: Hinkley, E. D., Springer-Verlag, NewYork, p. 102, 1976.
Deshler, T., Johnson, B. J., and Rozier, W. R.: Balloonborne measurements of Pinatubo aerosol during 1991 and 1992 at 41∘ N: Vertical profiles, size distribution and volatility, Geophys. Res. Lett., 20, 1435–1438, 1993.
Fleming, E. L., Chandra, S., Shoeberl, M. R., and Barnett, J. J.: Monthly Mean Global Climatology of Temperature, Wind, Geopotential Height and Pressure for 0–120 km, NASA TM100697, February 1988.
Grant, W. B., Browell, E. V., Long, C. S., Stowe, L. L., Grainger, R. G., and Lambert, A.: Use of volcanic aerosols to study the tropical stratospheric reservoir, J. Geophys. Res., 101, 3973–3988, 1996.
Guasta, M. D., Morandi, M., Stefanutti, L., Stein, B., Kolenda, J., Rairoux, P., Wolf, J. P., Matthey, R., and Kyro, E.: Multiwavelength lidar observation of thin cirrus at the base of the Pinatubo stratospheric layer during the EASOE campaign, Geophys. Res. Lett., 21, 1339–1342, 1994.
Jäger, H. and Deshler, T.: Lidar backscatter to extinction, mass and area conversions for stratospheric aerosols based on midlatitude balloon borne size distribution measurements, Geophys. Res. Lett., 29, 1929, https://doi.org/10.1029/2002GL015609, 2002.
Jäger, H., Deshler, T., and Hofmann, D. J.: Midlatitude lidar backscatter conversions based on balloonborne aerosol measurements, Geophys. Res. Lett., 22, 1727–1732, 1995.
Kalnay, E., Kanamitsu, M., Kistler, R., Collins, W., Deaven, D., Gandin, L., Iredell, M., Saha, S., White, G., Woollen, J., Zhu, Y., Chelliah, M., Ebisuzaki, W., Higgins, W., Janowiak, J., Mo, K. C., Ropelewski, C., Wang, J., Leetmaa, A., Reynolds, R., Jenne, R., and Joseph, D.: The NCEP/NCAR 40-Year Reanalysis Project, B. Am. Meteorol. Soc., 77, 437–472, https://doi.org/10.1175/1520-0477(1996)077<0437:TNYRP>2.0.CO;2, 1996.
McCormick, M. P. and Veiga, R. E.: SAGE II measurements of early Pinatubo aerosols, Geophys. Res. Lett., 19, 155–158, 1992.
Nardi, B., Chanin, M.-L., Hauchecorne, A., Avdyushin, S. I., Tulinov, G. F., Ivanov, M. S., Kuzmenko, B. N., and Mezhuev, I. R.: Morphology and dynamics of the Pinatubo aerosol layer in the Northern Hemisphere as detected from a ship-borne lidar. Part II, Geophys. Res. Lett., 20, 1967–1970, 1993.
Prata, A. T., Young, S. A., Siems, S. T., and Manton, M. J.: Lidar ratios of stratospheric volcanic ash and sulfate aerosols retrieved from CALIOP measurements, Atmos. Chem. Phys., 17, 8599–8618, https://doi.org/10.5194/acp-17-8599-2017, 2017.
Robock, A.: Volcanic eruptions and climate, Rev. Geophys., 38, 191–219, https://doi.org/10.1029/1998RG000054, 2000.
Russell, P. B., Swissler, T. J., and McCormick, M. P.: Methodology for error analysis and simulation of lidar aerosol measurements, App. Opt., 18, 3783–3797, 1979.
Russell, P. B., Livingston, J. M., Pueschel, R. F., Bauman, J. J., Pollack, J. B., Brooks, S. L., Hamill, P., Thomason, L. W., Stowe, L. L., Deshler, T., Dutton, E. G., and Bergstrom, R. W.: Global to microscale evolution of the Pinatubo volcanic aerosol derived from diverse measurements and analyses, J. Geophys. Res., 101, 18745–18763. 1996.
SSiRC: Activity – Data Rescue, available at: http://www.sparc-ssirc.org/data/datarescueactivity.html, last access: 2 January 2020.
SPARC: Assessment of Stratospheric Aerosol Properties (ASAP), in: SPARC Report No. 4, Stratospheric Processes and their Role in Climate (SPARC), edited by: Thomason, L. and Peter, T., World Climate Research Programme WCRP-124, WMO/TD No. 1295, WMO, 2006.
Thomason, L. W., Ernest, N., Millán, L., Rieger, L., Bourassa, A., Vernier, J.-P., Manney, G., Luo, B., Arfeuille, F., and Peter, T.: A global space-based stratospheric aerosol climatology: 1979–2016, Earth Syst. Sci. Data, 10, 469–492, https://doi.org/10.5194/essd-10-469-2018, 2018.
Timmreck, C.: Modeling the climatic effects of large explosive volcanic eruptions, WIREs Clim. Change, 3, 545–564, https://doi.org/10.1002/wcc.192, 2012.
Vaughan, G., Wareing, D. P., Jones, S. B., Thomas, L., and Larsen, N.: Lidar measurements of Mt. Pinatubo aerosols at Aberystwyth from August 1991 through March 1992, Geophys. Res. Lett., 21, 1315–1318, 1994.