the Creative Commons Attribution 4.0 License.
the Creative Commons Attribution 4.0 License.
 | 08 Oct 2020
Timely estimates of India's annual and monthly fossil CO2 emissions
Robbie M. Andrew
India is the world's third-largest emitter of carbon dioxide and is developing rapidly. While India has pledged an emissions-intensity reduction as its contribution to the Paris Agreement, the country does not regularly report emissions statistics, making tracking progress difficult. Moreover, all estimates of India's emissions in global datasets represent its financial year, which is not aligned to the calendar year used by almost all other countries. Here I compile monthly energy and industrial activity data allowing for the estimation of India's CO2 emissions by month and calendar year with a short lag. Emissions show clear seasonal patterns, and the series allows for the investigation of short-lived but highly significant events, such as the near-record monsoon in 2019 and the COVID-19 crisis in 2020. Data are available at https://doi.org/10.5281/zenodo.3894394 (Andrew, 2020a).
- Article
(1722 KB) - Full-text XML
-
Supplement
(3486 KB) - BibTeX
- EndNote


As the world rapidly approaches the temperature limits set in the Paris Agreement (CONSTRAIN, 2019), timely estimates of greenhouse gas emissions are critical for steering policy and scientific understanding of the global carbon cycle (Le Quéré et al., 2020). India, although having low per capita emissions, is the world's third-largest emitter of carbon dioxide (Friedlingstein et al., 2019), yet its most recent official report of emissions covers the single year 2014 (GOI, 2018).
According to available estimates, India's CO2 emissions have grown by about 5 % yr−1 over 2010–2018 (Crippa et al., 2019). This growth has mainly been driven by expansion of the economy as, among other things, the country's labour pool grows and much-needed energy supply is increased (Karstensen et al., 2020), and much of this energy is supplied by coal and petroleum products, including the transition from biomass to petroleum fuels, continuing the long-term increase in the share of India's energy supplied from fossil fuels (see Fig. S42 in the Supplement). Countering these upward pressures on CO2 emissions, India's recent development of variable renewables, particularly solar and wind, has exerted a downward pressure on emissions growth, assisted by a sharp decline in prices for these technologies and ambitious goals for renewables growth that have repeatedly been strengthened (Khanna, 2010; MNRE, 2015; Varadhan, 2019). Development of variable renewables has been further assisted by the introduction of reverse auctions and the creation of solar parks, among other measures (Bose and Sarkar, 2019). In addition, the difficulty India has faced in ramping up domestic coal production has probably also restrained emissions growth (Carl, 2015).
India does publish a great deal of energy data, but it is scattered across many documents, often not in machine-readable form, occasionally with errors, and generally without much documentation. The country's official estimates of CO2 emissions are infrequent and never for more than a single year (GOI, 2004, 2012, 2015, 2018). Moreover, these reported emissions are for India's financial year, running from April to March, so they do not align with the calendar-year estimates provided by almost every other country (Andrew, 2020b). This gap in official reporting has been filled by third parties estimating emissions largely based on available financial-year publications, whether directly or via intermediate sources (e.g. IEA, 2019a; Gilfillan et al., 2019; EIA, 2020; Hoesly et al., 2018; GHG Platform India, 2020), and not all of these are freely available.
Given the rapid pace both of India's development and of the change in global context, emissions estimates at a frequency greater than annual are also of interest. Higher-frequency data open up opportunities to analyse the relationships between emissions and policy shifts, economic cycles, weather, and more. The ability to explain why emissions have changed is critical to developing effective emissions policies.
Many of India's energy data are not available in formats that are readily machine-readable. In many cases, tables must be copied from PDF-format reports, either automatically using “scraping” scripts or by hand. On some occasions, reports posted on official websites are low-quality scans of signed documents, further reducing the availability of these data for analysis. Furthermore, explanations for data are often lacking in detail and can conflict across different datasets for reasons that are not immediately apparent (see Sect. S7 in the Supplement).
The International Energy Agency in 2020 stated that the “Government of India should … Improve the collection, consistency, transparency and availability of energy data across the energy system at central and state government levels” (IEA, 2020b, p. 18). While government ministries responsible for publishing these data are making moves to improve the availability of more recent data, there are still obvious examples of copy-and-paste errors in spreadsheets, random misspellings, filename glitches, and even incorrect units given in the Energy Statistics yearbook (MOSPI, 2019). During the COVID-19 lockdown in India, the Central Electricity Authority stopped publishing daily generation reports for 4 weeks. Clearly much data work is still manual, and further automation will significantly improve India's ability to produce robust and timely estimates of fossil CO2 emissions.
Monthly emissions estimates are also a core input to atmospheric-inversion models (Oda et al., 2018). The standard approach taken in the literature to produce monthly emissions estimates is to use a temporal profile based on partial monthly activity data to temporally downsample annual emissions estimates. Three examples of this downsampling approach in the literature are the very first seasonal estimates made by Rotty (1987), CDIAC's gridded estimates (Andres et al., 2011), and EDGAR's temporal profiles (Crippa et al., 2020). Rotty (1987) and Andres et al. (2011), for example, used coal-fired power generation as a proxy for all coal consumption in India, while Crippa et al. (2020) used a proprietary database of activity data. EDGAR's monthly gridded dataset has no intra-annual variation for India (Matthew Jones, personal communication, 10 July 2020).
Here I present a new dataset collating available information on India's monthly energy production and consumption, as well as on cement production, and use this dataset directly to estimate India's monthly and calendar-year CO2 emissions. In contrast to downsampling techniques, the method used here provides accurate estimates of monthly CO2 emissions in India.
Fossil CO2 emissions can be divided into four main source categories: coal, oil, natural gas, and carbonates (Friedlingstein et al., 2019). For the fossil fuels, estimates of monthly consumption are required, while for carbonates, production statistics are needed. In all cases, apparent energy consumption approximates true consumption, omitting some minor changes in stocks. For example, reported consumption of petroleum products is most likely supply to the market, with stocks at petrol stations and in vehicles not accounted for. A summary of the methodology is presented here, while full details are provided in the Supplement, including a table of individual data sources.
While monthly coal consumption by utility power stations is reported (CEA, 2020), India does not report sub-annual total coal consumption, and apparent consumption must therefore be calculated using data on production, imports, exports, and stock changes. While these data are incomplete, they are sufficient to produce a reasonable estimate of monthly coal consumption. Importantly, the goal of this analysis is an estimate of CO2 emissions from all oxidation of solid fossil fuels, rather than the more limited emissions from combustion for energy purposes, and this means it is unnecessary to separate out, for example, coking coal used in steel manufacture, which is oxidised rather than combusted.
The energy data sources used include revised, historical data from the Indian Bureau of Mines (2019), Ministry of Coal (2020a), and UN Statistics Division (2020); provisional and revised data from Coal India Limited (CIL, 2020), Singareni Collieries Company Ltd (SCCL, 2020), the Ministry of Coal (2020b, 2020c), and the Ministry of Mines (Ministry of Mines, 2020); power station stocks from the Central Electricity Authority (CEA, 2020a, b); and international trade from the Directorate General of Commercial Intelligence and Statistics (DGCIS, 2020) and Department of Commerce (DOC, 2020), supplemented by recent provisional estimates reported by the media. While these data sources combined allow for a good estimate of production and stock changes in hard coal with a lag of less than 1 month, lignite production data have a slightly longer lag, and simple extrapolation is used to complete the picture for the most recent month or 2 months (Fig. S15 in the Supplement). It is assumed that the share of consumed coal that is not oxidised is negligible.
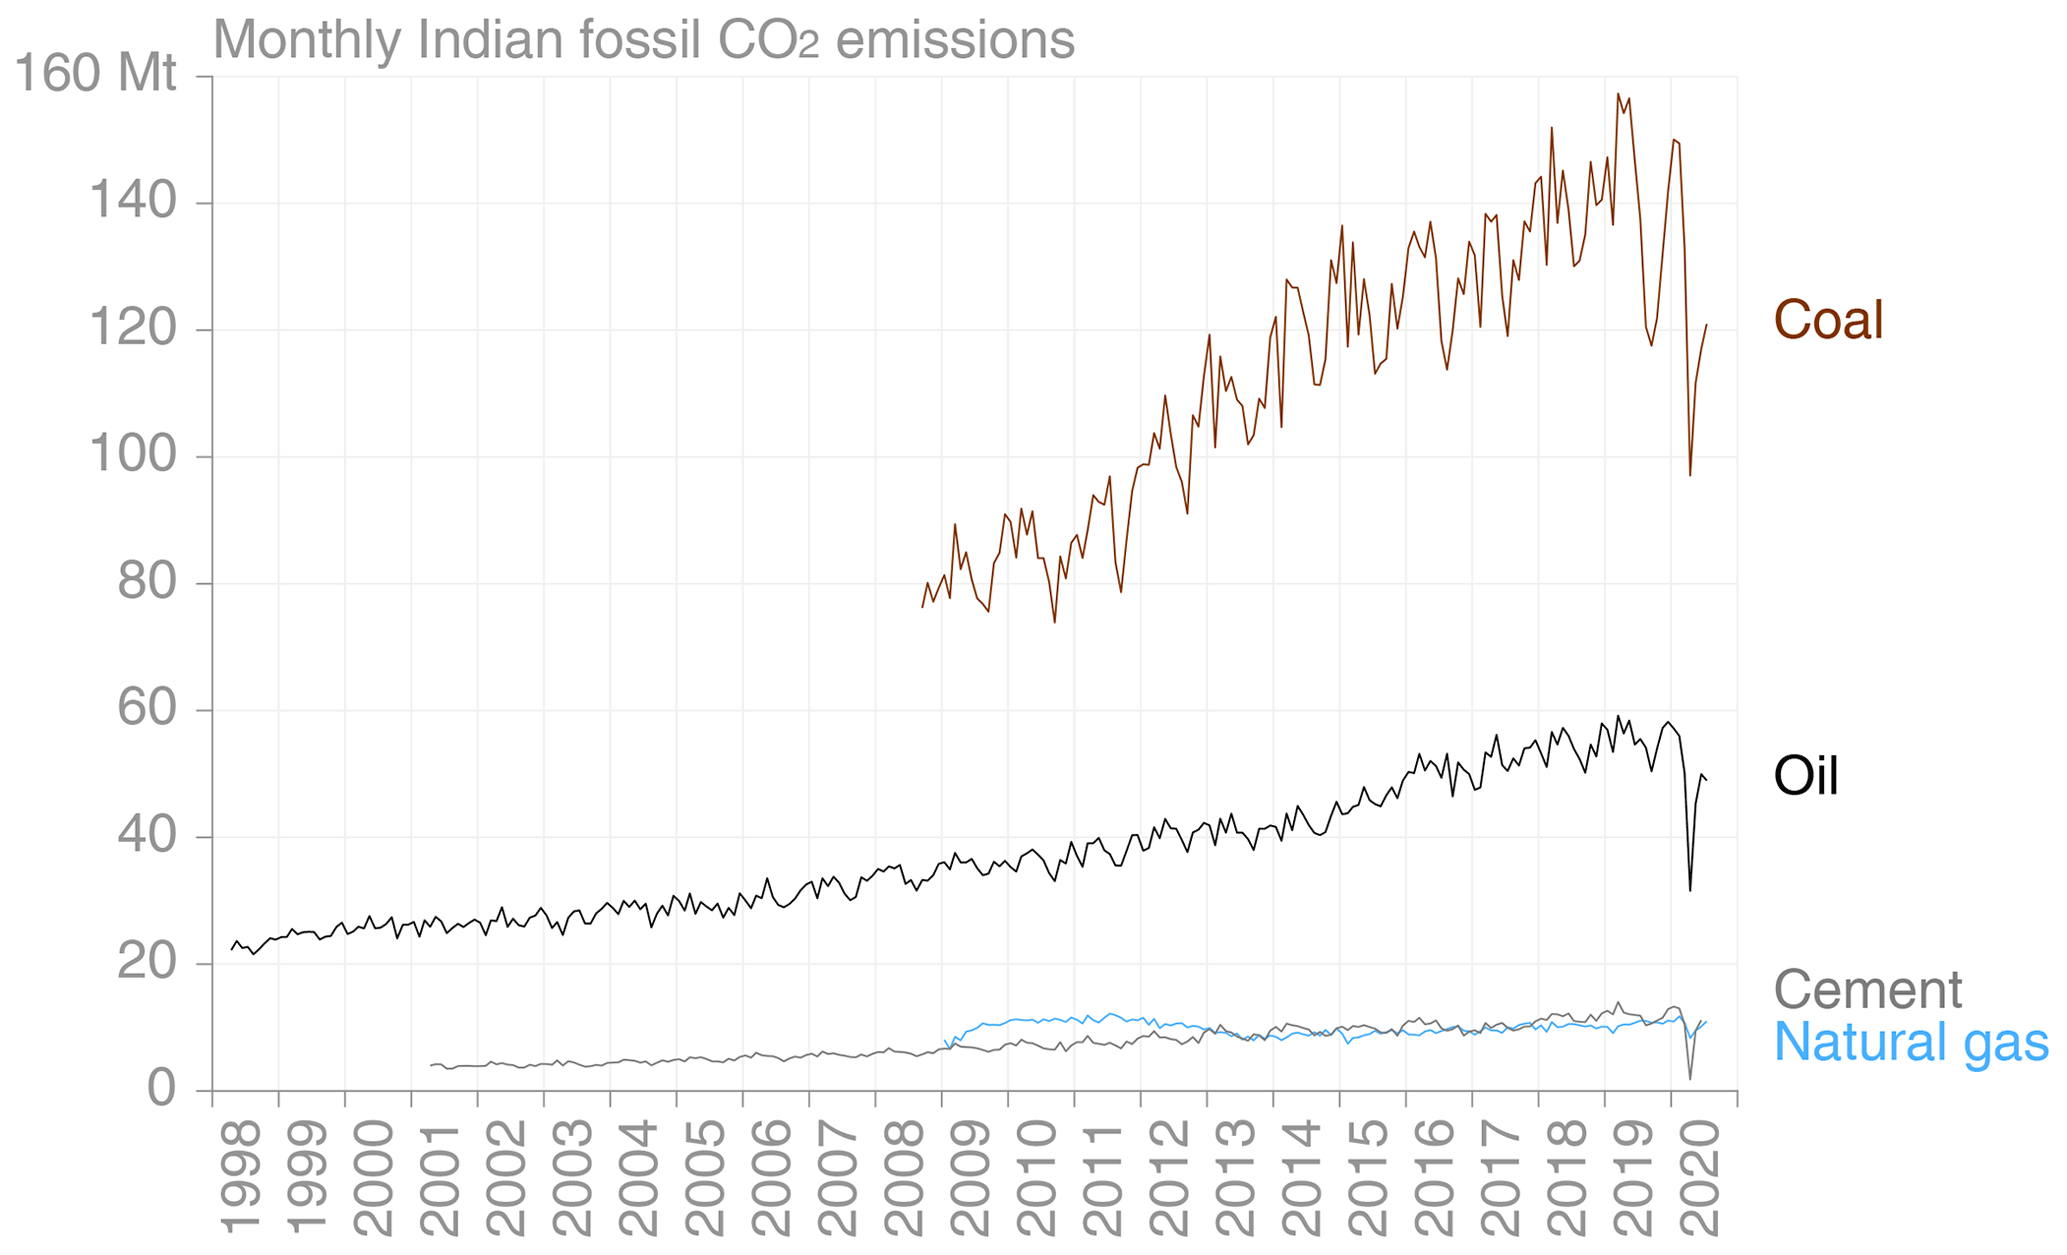
Figure 1Final monthly CO2 emissions by category. Trends in coal, oil, and natural gas are given up until the end of July 2020, and the trend in cement is given up until the end of June 2020. Source: Own calculations.
Monthly data on production and consumption of petroleum products are available from the Petroleum Planning and Analysis Cell (PPAC) of the Ministry of Petroleum and Natural Gas. In all four categories, revised data are always used when available in preference to provisional data. Since consumption data are available, the apparent consumption approach used for coal is not required for petroleum products. All products except for bitumen and lubricants are assumed to be fully oxidised; while it is known that some naphtha is used for production of durable commodities, this share is not known but may be discoverable using data from the Annual Survey of Industries (MOSPI, 2020b).
PPAC also publishes monthly data on production, import, and supply of natural gas (PPAC, 2020a, b). Some data on consumption by sector are also published, and these are used to estimate the proportion of natural gas that is oxidised.
For carbonates, monthly data on clinker production are not available, so monthly cement production statistics are combined with a time-varying estimate of the clinker ratio to produce an estimate of monthly clinker production. Data on production of lime, glass, and ceramics were not available, and emissions from these carbonate sources are therefore omitted; India's second Biennial Update Report indicates these emissions combined contributed 1.9 % of fossil CO2 emissions in 2013/14 (GOI, 2018).
Once monthly energy consumption and clinker production estimates are available, these are converted to estimates of CO2 emissions. For fossil fuels this requires first converting the consumption in physical units to energy units using information from the International Energy Agency (IEA) for coal and petroleum products (IEA, 2019b, c) and PPAC (2020c) for natural gas and then applying emission factors from the Intergovernmental Panel on Climate Change's 2006 guidelines (Gómez et al., 2006). For clinker production, the method of Andrew (2019) is followed to estimate emissions from physical production in tonnes.
For complete details of the methodology, data sources used, comparisons of provisional and revised energy data, comparisons of energy data from different sources, and more, see the Supplement. The monthly energy and cement data collated here are available at https://doi.org/10.5281/zenodo.3894394 (Andrew, 2020a).
Following the described methods, I have assembled monthly CO2 emissions estimates for coal, oil, natural gas, and cement for India (Fig. 1). The available data and methodology allow for the estimation of emissions from coal from September 2008, oil from April 1998, natural gas from January 2009, and cement from April 2001.
Emissions from oxidation of coal form the largest share of the total, rising from about 61 % in 2010 to 66 % in 2014, before levelling off to about 65 % in 2019. Peak monthly emissions to date were in March 2019 with 157 Mt CO2 in the month. While emissions from coal grew at an average rate of 6.2 % yr−1 over 2009–2018, in 2019 they stalled, as electricity demand dropped dramatically (Fig. S41 in the Supplement).
Emissions from oxidation of oil (petroleum products) are the next-largest source with about 25 % of the total, reaching 50–60 Mt CO2 per month in recent years. Emissions from natural gas and cement production are both about 5 % of the total.
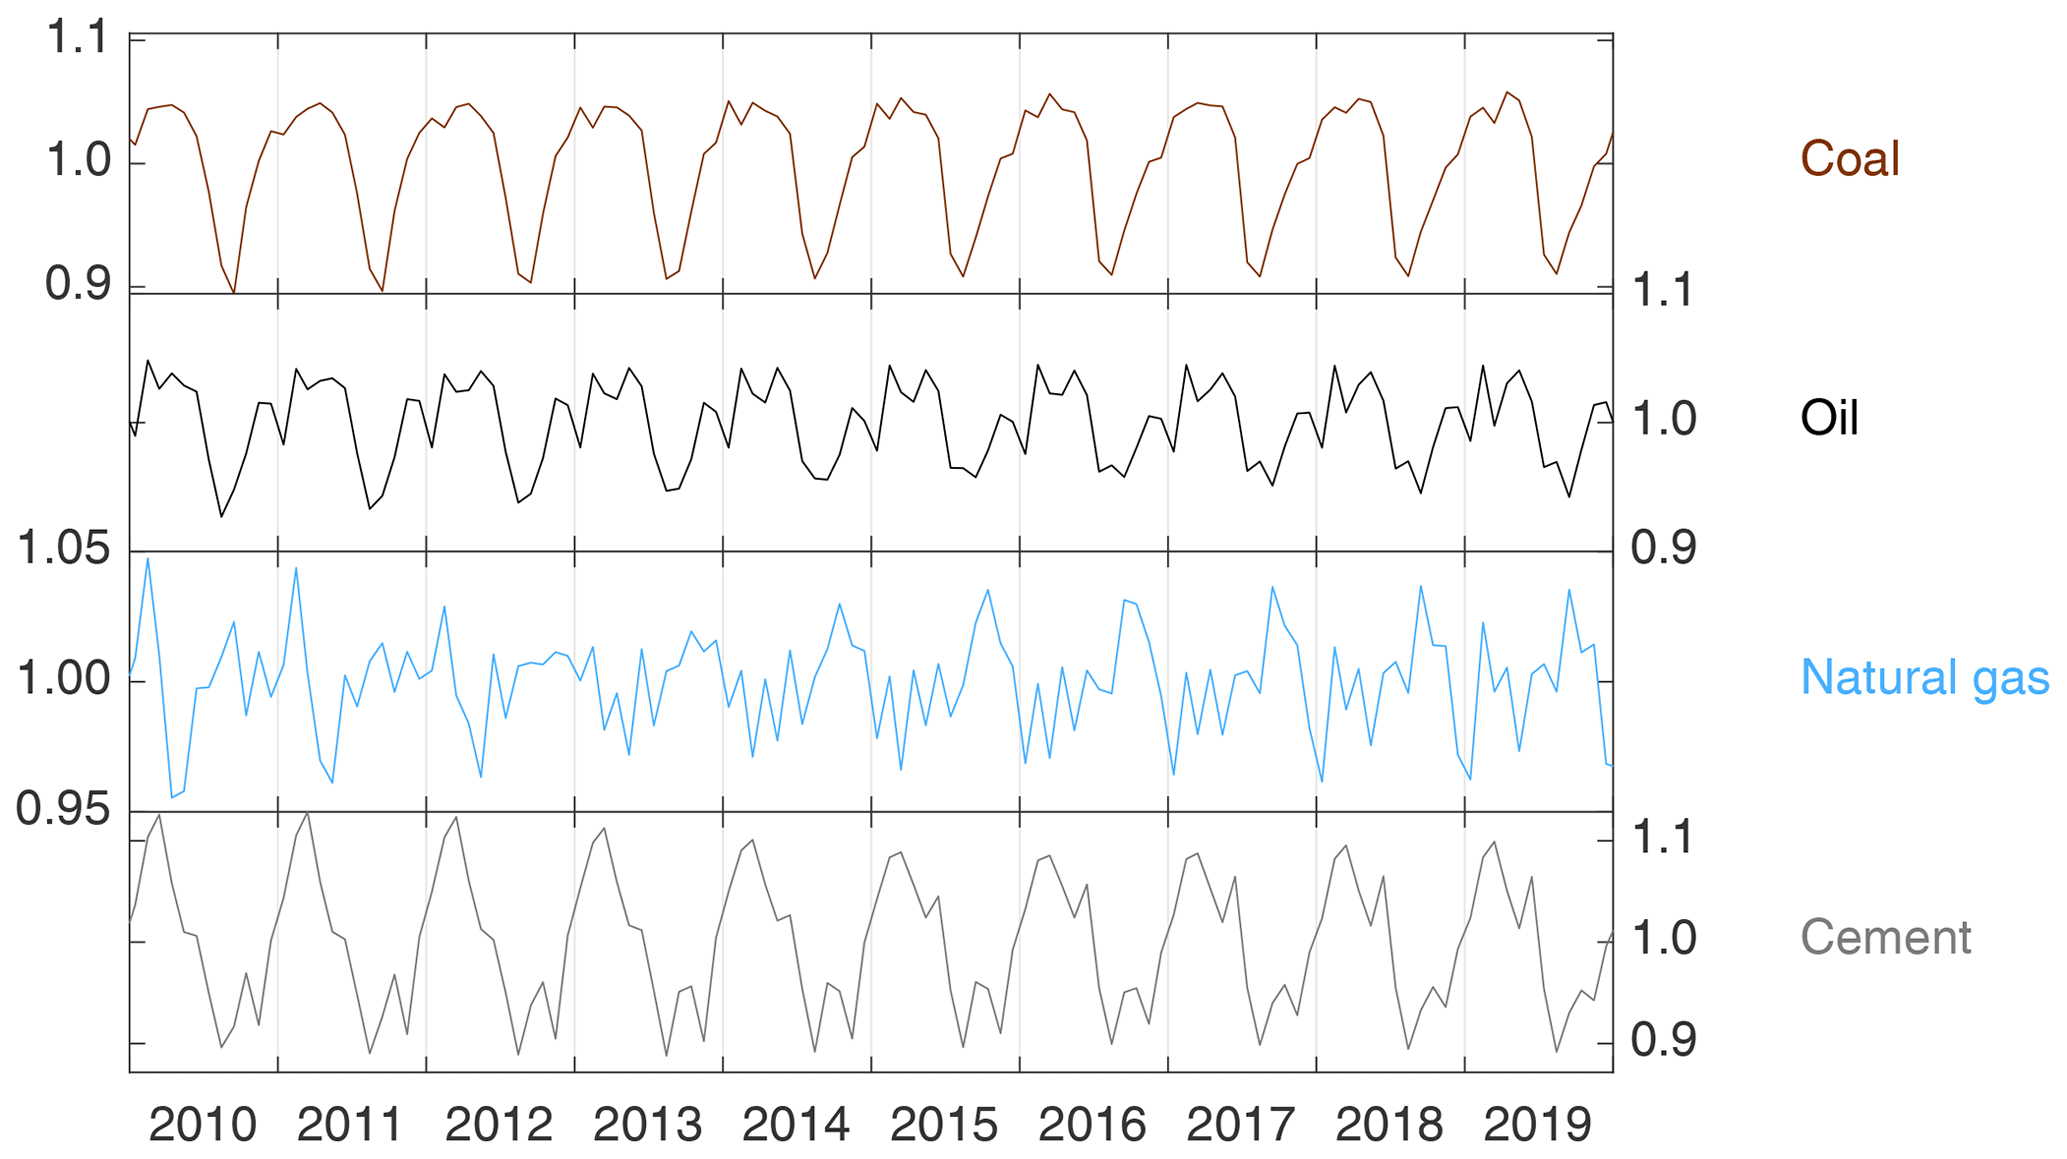
Figure 2Seasonality of the four emissions categories, derived using the X-11 method. Emissions in 2020 have been excluded from the analysis because of their strong deviations from historical patterns.
Table 1Calendar-year CO2 emissions in India by category, in millions of tonnes.
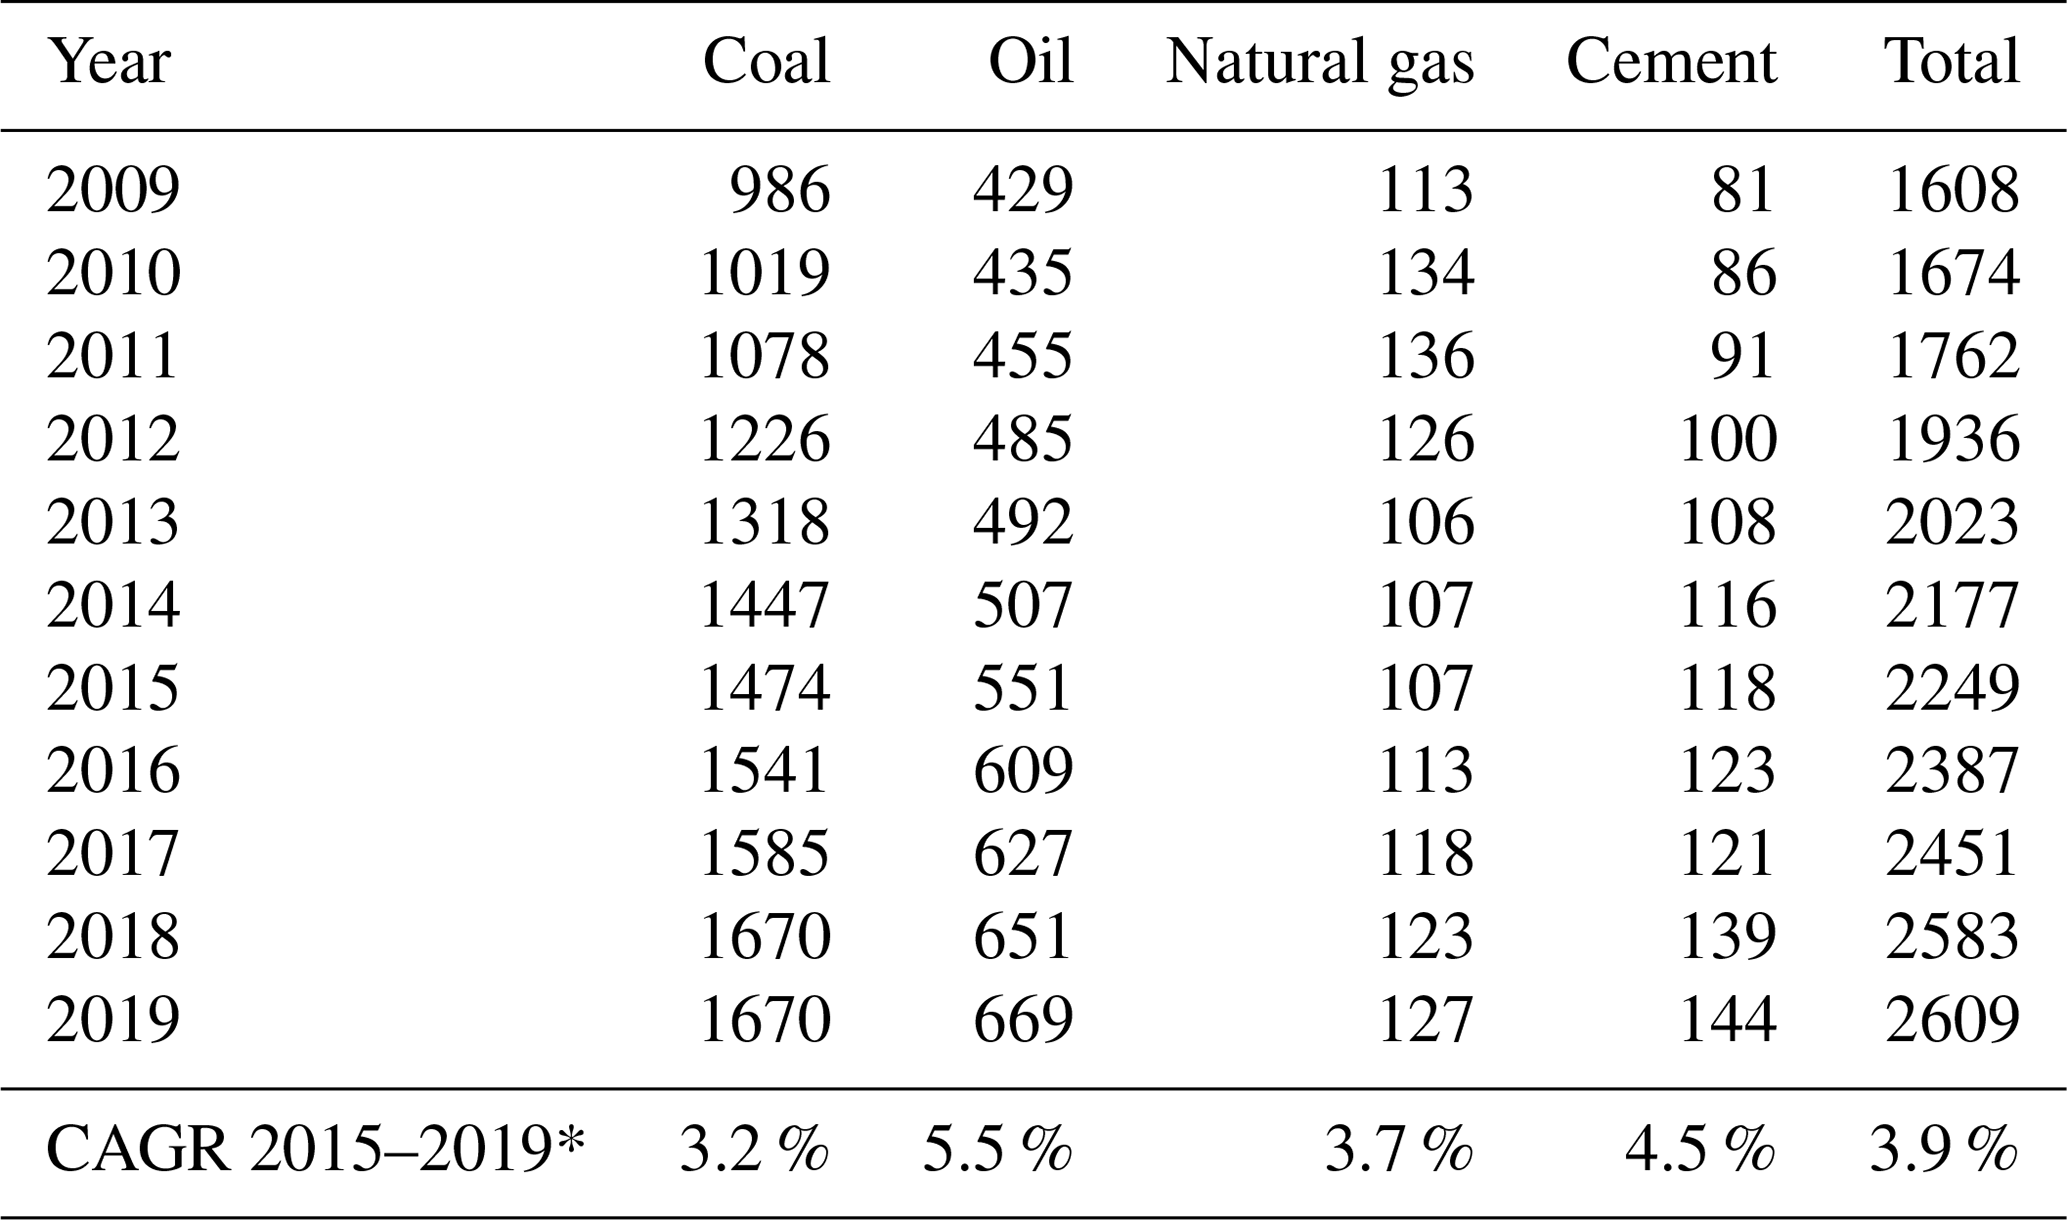
* CAGR denotes continuous annual growth rate, with continuous compounding and adjusted for leap years.
While the monthly emissions series appear quite volatile, X-11 seasonality analysis (Darné et al., 2018; Shiskin et al., 1967; summarised in the Supplement) reveals strong, underlying seasonal patterns (Fig. 2). Coal emissions reach a peak in March–May, before declining by up to 10 % below the trend line for the typical southwest monsoon months of June–August and then picking up again towards the end of the year, and emissions from both oil and cement show similar though somewhat less smooth patterns. These emissions patterns largely result from the effects of the monsoon's heavy rains, driving a decline in industrial, construction, and transportation activities. Coal emissions are also driven down by the displacing effect of higher power generation from both hydropower and wind during the monsoon season. In addition, oil emissions exhibit a consistent dip in January and in March–April. Natural gas emissions show a substantially lower amplitude of seasonality, under ± 5 %, with recent years showing a peak during the monsoon, apparently driven by increased fertiliser production during these months. The seasonality of natural gas emissions is also less stable over time, as supply constraints have changed considerably. Despite relatively clear derived seasonal signals, considerable volatility is superimposed on this seasonality in all emissions series (Fig. 1).
Turning to calendar-year emissions, Table 1 summarises emissions by category and total CO2 emissions for India from 2009 to 2019. Each category has grown by 3 %–5 % per year over the last 5 years, although growth from year to year has not been smooth, with coal emissions stable in 2019. Total CO2 emissions in India have grown from 1.6 Gt in 2009 to 2.6 Gt in 2019, at an annual growth rate of 3.9 %. (An equivalent table for financial‐year emissions is presented in the Supplement.) Over the same period, the CO2 emissions intensity of India's GDP has declined from 23.2 to 18.1 g per Indian rupee, about 2.2 % yr−1 (Fig. S40 in the Supplement).
The monthly Indian fossil CO2 emissions dataset produced here includes all but about 2 % of anthropogenic fossil sources in the country, excluding emissions from decomposition of fossil carbonates in the production of lime, glass, and ceramics. The time lags of the emissions estimates are at most 2 months, and under 1 month for coal, the most important emissions source.
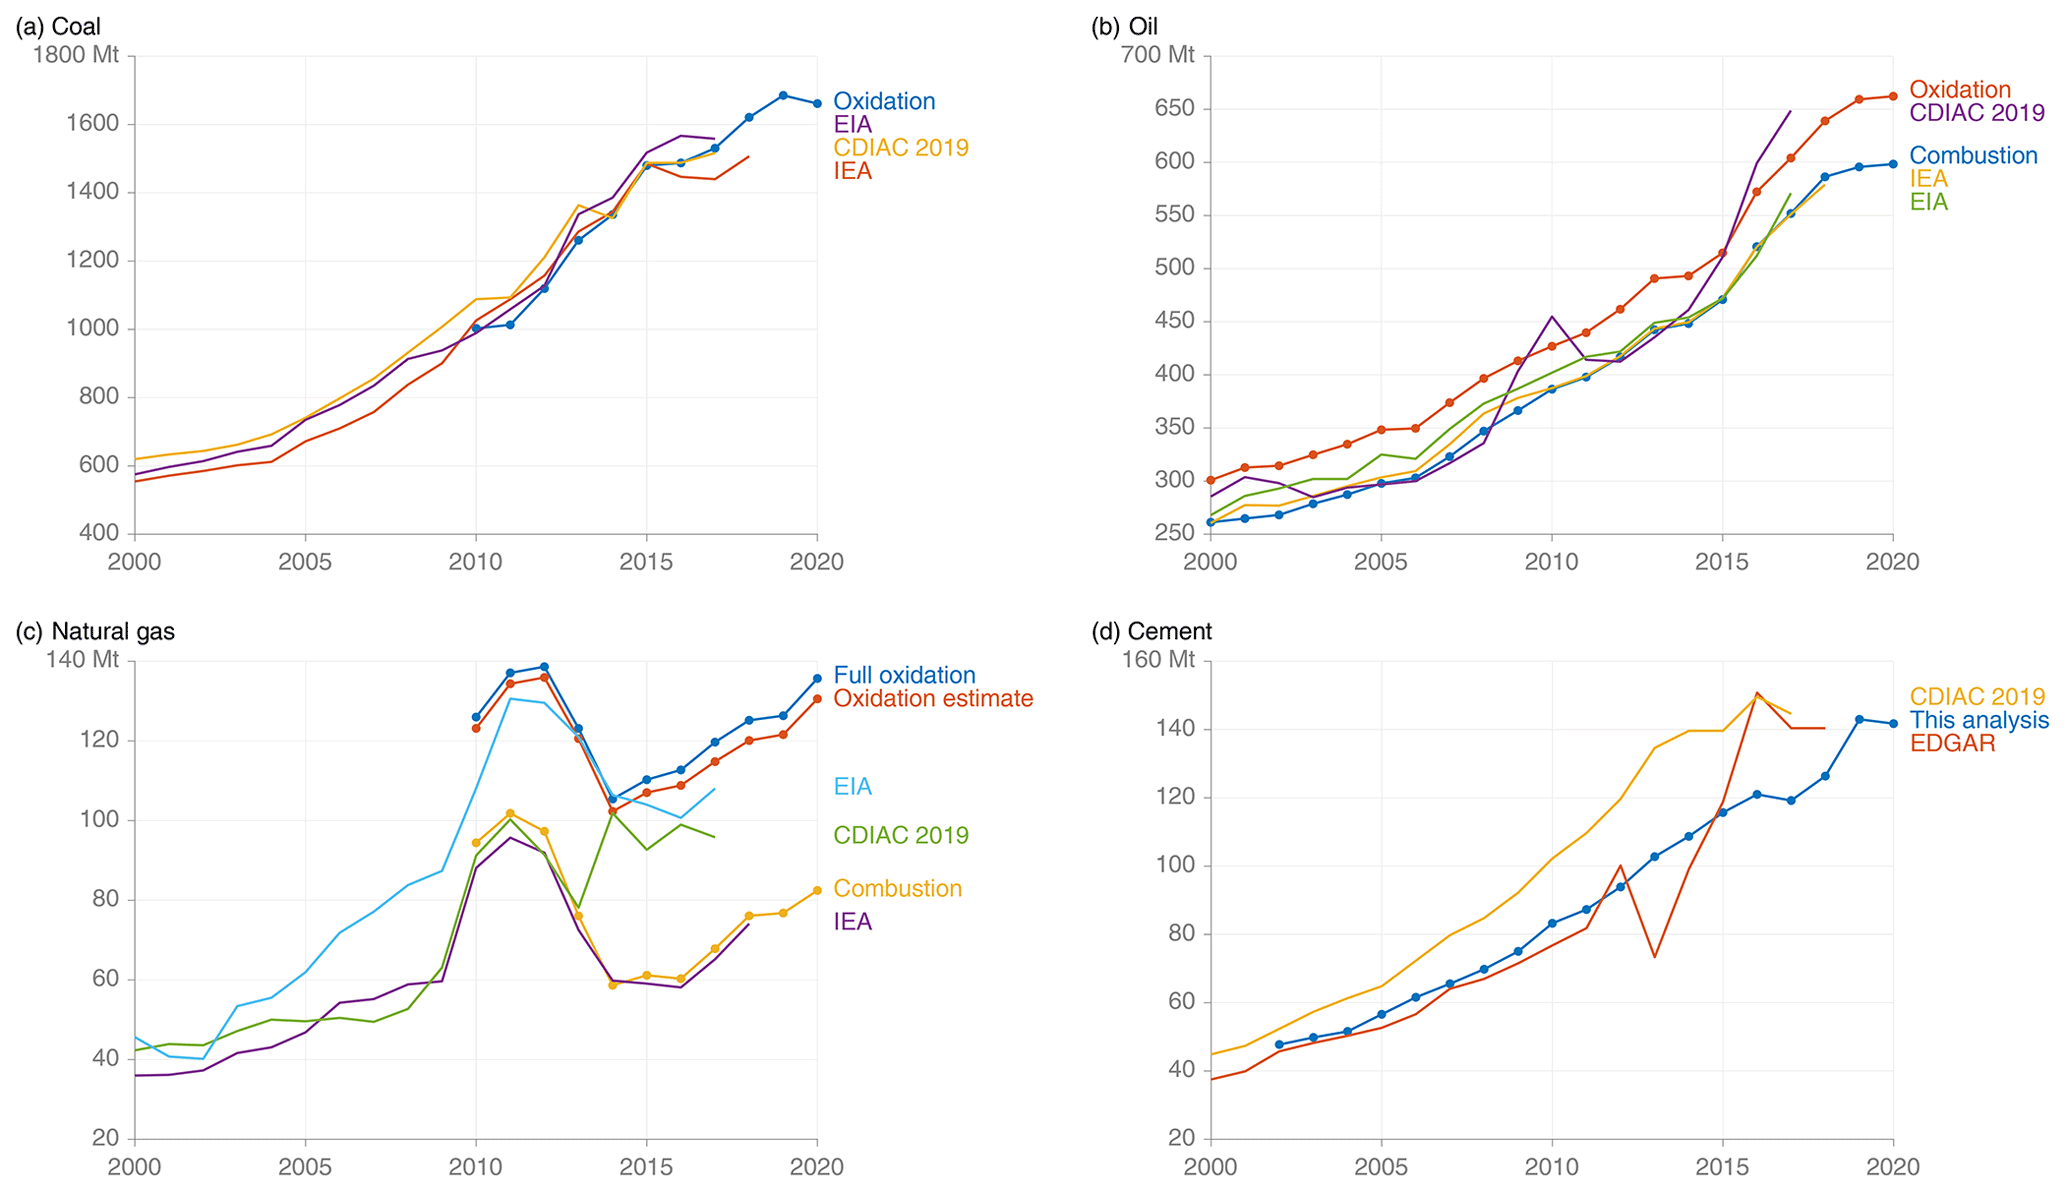
Figure 3Comparison of financial-year emissions estimates with other datasets: (a) coal, (b) oil, (c) natural gas, and (d) cement. Sources: Gilfillan et al. (2019), IEA (2019a), Crippa et al. (2019), EIA (2020), own calculations.
To compare the emissions estimates produced here with other datasets, I aggregate monthly emissions to annual emissions against the Indian financial year, April–March. Figure 3 compares the emissions estimates produced here with those of the IEA (2019a) and CDIAC (Gilfillan et al., 2019), and also with EDGAR (Crippa et al., 2019) for cement, noting that all three of these datasets report emissions in the period April 2017 to March 2018 as 2017 emissions.
For coal the method produces one series of oxidation emissions, and this is largely similar to the estimates from both IEA and CDIAC (Fig. 3a). In the final 2 years of 2017/18 and 2018/19, however, IEA has lower estimates. Close investigation has revealed potential errors in IEA's reported stock changes in both years, amounting to about 30 Mt in 2018/19 (detailed in Sect. S2 in the Supplement); IEA's 2018/19 estimate is indicated as being preliminary. Furthermore, IEA's data exclude changes in stocks at power stations, which exhibit large swings (Fig. S10 in the Supplement). CDIAC's estimate declines between 2012/13 and 2013/14, in strong contrast to the growth in other series, and this is because of CDIAC's use of UN energy data, which has a sharp drop in the energy content of coal (see Sect. S5 in the Supplement).
For oil there are two series: combustion and oxidation (Fig. 3b). The combustion series lies very close to that of the IEA – which specifically includes only energy uses of oil products – over the entire period. Oxidation emissions are on average about 50 Mt CO2 yr−1 higher throughout the period, largely reflecting emissions from oxidised naphtha and petroleum coke. CDIAC's series exhibits quite a different trend.
The natural gas emissions series includes three estimates: combustion, oxidation, and full oxidation (Fig. 3c). The last of these assumes that all natural gas is oxidised, merely to present a bounding case. The combustion series agrees well with IEA's estimates, but again the CDIAC series exhibits a very different trend, diverging sharply from 2013/14. The oxidation series is significantly higher, largely reflecting the emissions from production and use of nitrogen-based fertilisers. Emissions show a very prominent peak in 2010–2012, a result of the rapid development of offshore gas field KG-D6, but while this led to the construction of a number of gas-fired power stations, production from this field dropped substantially leading to greatly reduced domestic supplies and stranded power assets (MoP, 2019; Fig. S32 in the Supplement).
For cement process emissions, the series is much lower than that of CDIAC, for reasons that have been explained elsewhere (Andrew, 2019). EDGAR's series appears to be reasonable up until 2010/11, when national clinker production data are readily available, but thereafter the trend appears unrealistic.

Figure 4India's hard-coal demand. Filled circles and hollow circles show reported and projected demand in two five-year plans, while the light blue line shows actual demand, and annual growth rates are indicated. Demand does not equal consumption because of changes in stocks at power stations and industry. Source: Ministry of Coal (2006, 2011), own calculations.
The most recent Indian official estimate of total CO2 emissions was presented in India's second biennial update report to the United Nations Framework Convention on Climate Change (UNFCCC), with 1.998 Gt in the financial year 2013/14 (GOI, 2018). In the analysis here, total CO2 emissions in India in 2013/14 are estimated to be 2.04 Gt. While this is strikingly close, this is not a true measure of the accuracy of the method since some errors have cancelled each other out: it is known that the emissions estimates generated here exclude some carbonate sources, while emissions from naphtha oxidation here might be overestimated, and there are other assumptions in various factors used here that introduce uncertainty. Nevertheless, this match with the official total is encouraging.
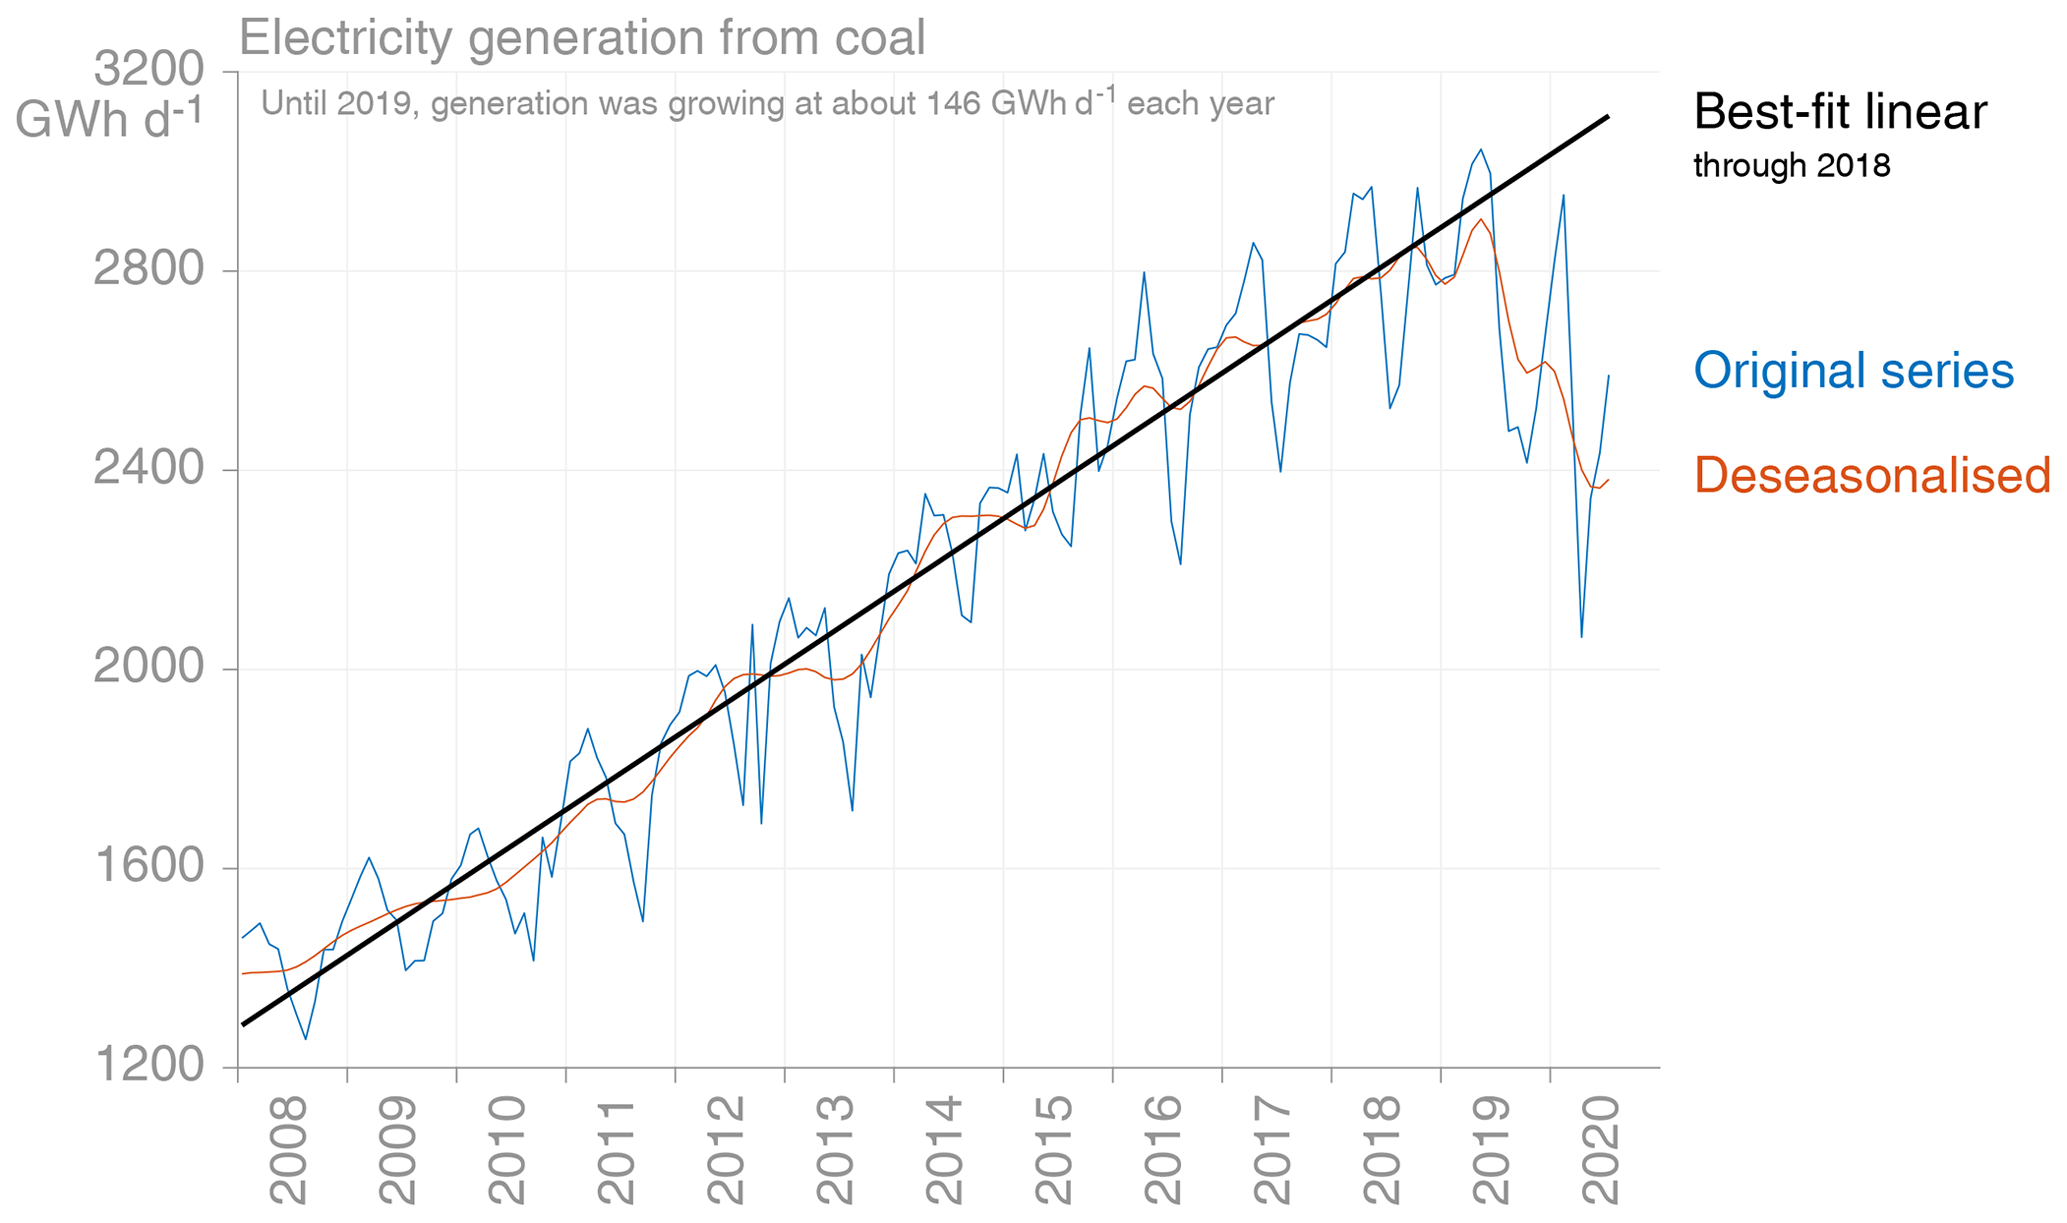
Figure 5Average daily electricity generation from coal by month, divided by month length and deseasonalised, with a best-fit linear regression. Source: Central Electricity Authority, own calculations.
If official forecasts of growth in hard-coal demand had played out, demand would have been more than 20 % higher in 2019/20, with consequently higher emissions (Fig. 4). These forecasts were based on assumptions of underlying growth in the economy of as much as 10 % yr−1 (Ministry of Coal, 2011). In fact, the report on coal and lignite for the 12th five-year plan included a second scenario with much higher demand growth, already reaching 1200 Mt in 2016/17. While growth in demand followed the projection reasonably closely until 2014/15, it has since slowed markedly.
There were certainly significant tailwinds in support of high growth in both demand and supply of coal, such as strong political will, the 25 % yr−1 annual average growth in coal imports 2011–2014, the rapid construction of new coal-fired capacity 2010–2016 (Fig. S38 in the Supplement), high targets for coal mining, the opening up of coal mining to competition, and significant expansion of the labour pool. But these faced an array of headwinds constraining growth, including difficulty in acquiring land and environmental permits; local protests; difficulty obtaining finance (CEA, 2019); rail undercapacity; debt; subdued demand; unpredictable monsoon rains; “Coalgate” (illegal government coal block allocations; Gilbert and Chatterjee, 2020); the dramatic fall in renewables prices; and large economic shocks such as 2016's demonetisation, 2017's goods and service tax (GST) introduction, the shadow bank crisis starting in 2018 (Subramanian and Felman, 2019), and 2020's COVID-19 pandemic. In comparison, China's much larger consumption of coal grew by almost 9 % yr−1 over 2000–2010 (NBS, 2019).
As suggested by Fig. 5, growth in electricity generation from coal – recently about 75 % of all coal consumption – has been more linear than exponential in the last 10 years.
Figure 5 also shows how significant the deviation in coal generation was in the latter half of calendar year 2019, also clear in Fig. 1. From 2008 to 2018, the largest deviation of monthly electricity generation with seasonality removed from the trend line is 110 GWh d−1, while in 2019 it peaked at over 390 GWh d−1. Generation from hydropower was 17 % higher in 2019 than in 2018, partly a result of a very heavy southwest monsoon (IMD, 2019). But total electricity demand was down by almost 3 % in the second half of 2019 compared to the same period in 2018 and more than 13 % down in October 2019 (POSOCO, 2020), probably driven by a stalling economy (Subramanian and Felman, 2019), with value-added growth in the manufacturing sector below zero in the period July to December 2019 (MOSPI, 2020a).
The seasonal patterns of emissions generally follow the monsoon, particularly with less electricity generation from coal. Rather than being due to decreased demand or difficulty producing electricity from coal during the monsoon, the reason for this is higher generation from both hydro and wind, both of which peak during the monsoon season. In fact, electricity demand is highest through summer and lowest in winter (Fig. S41 in the Supplement), with energy required in India for summer cooling substantially higher than energy required for winter heating (Gaur et al., 2016).
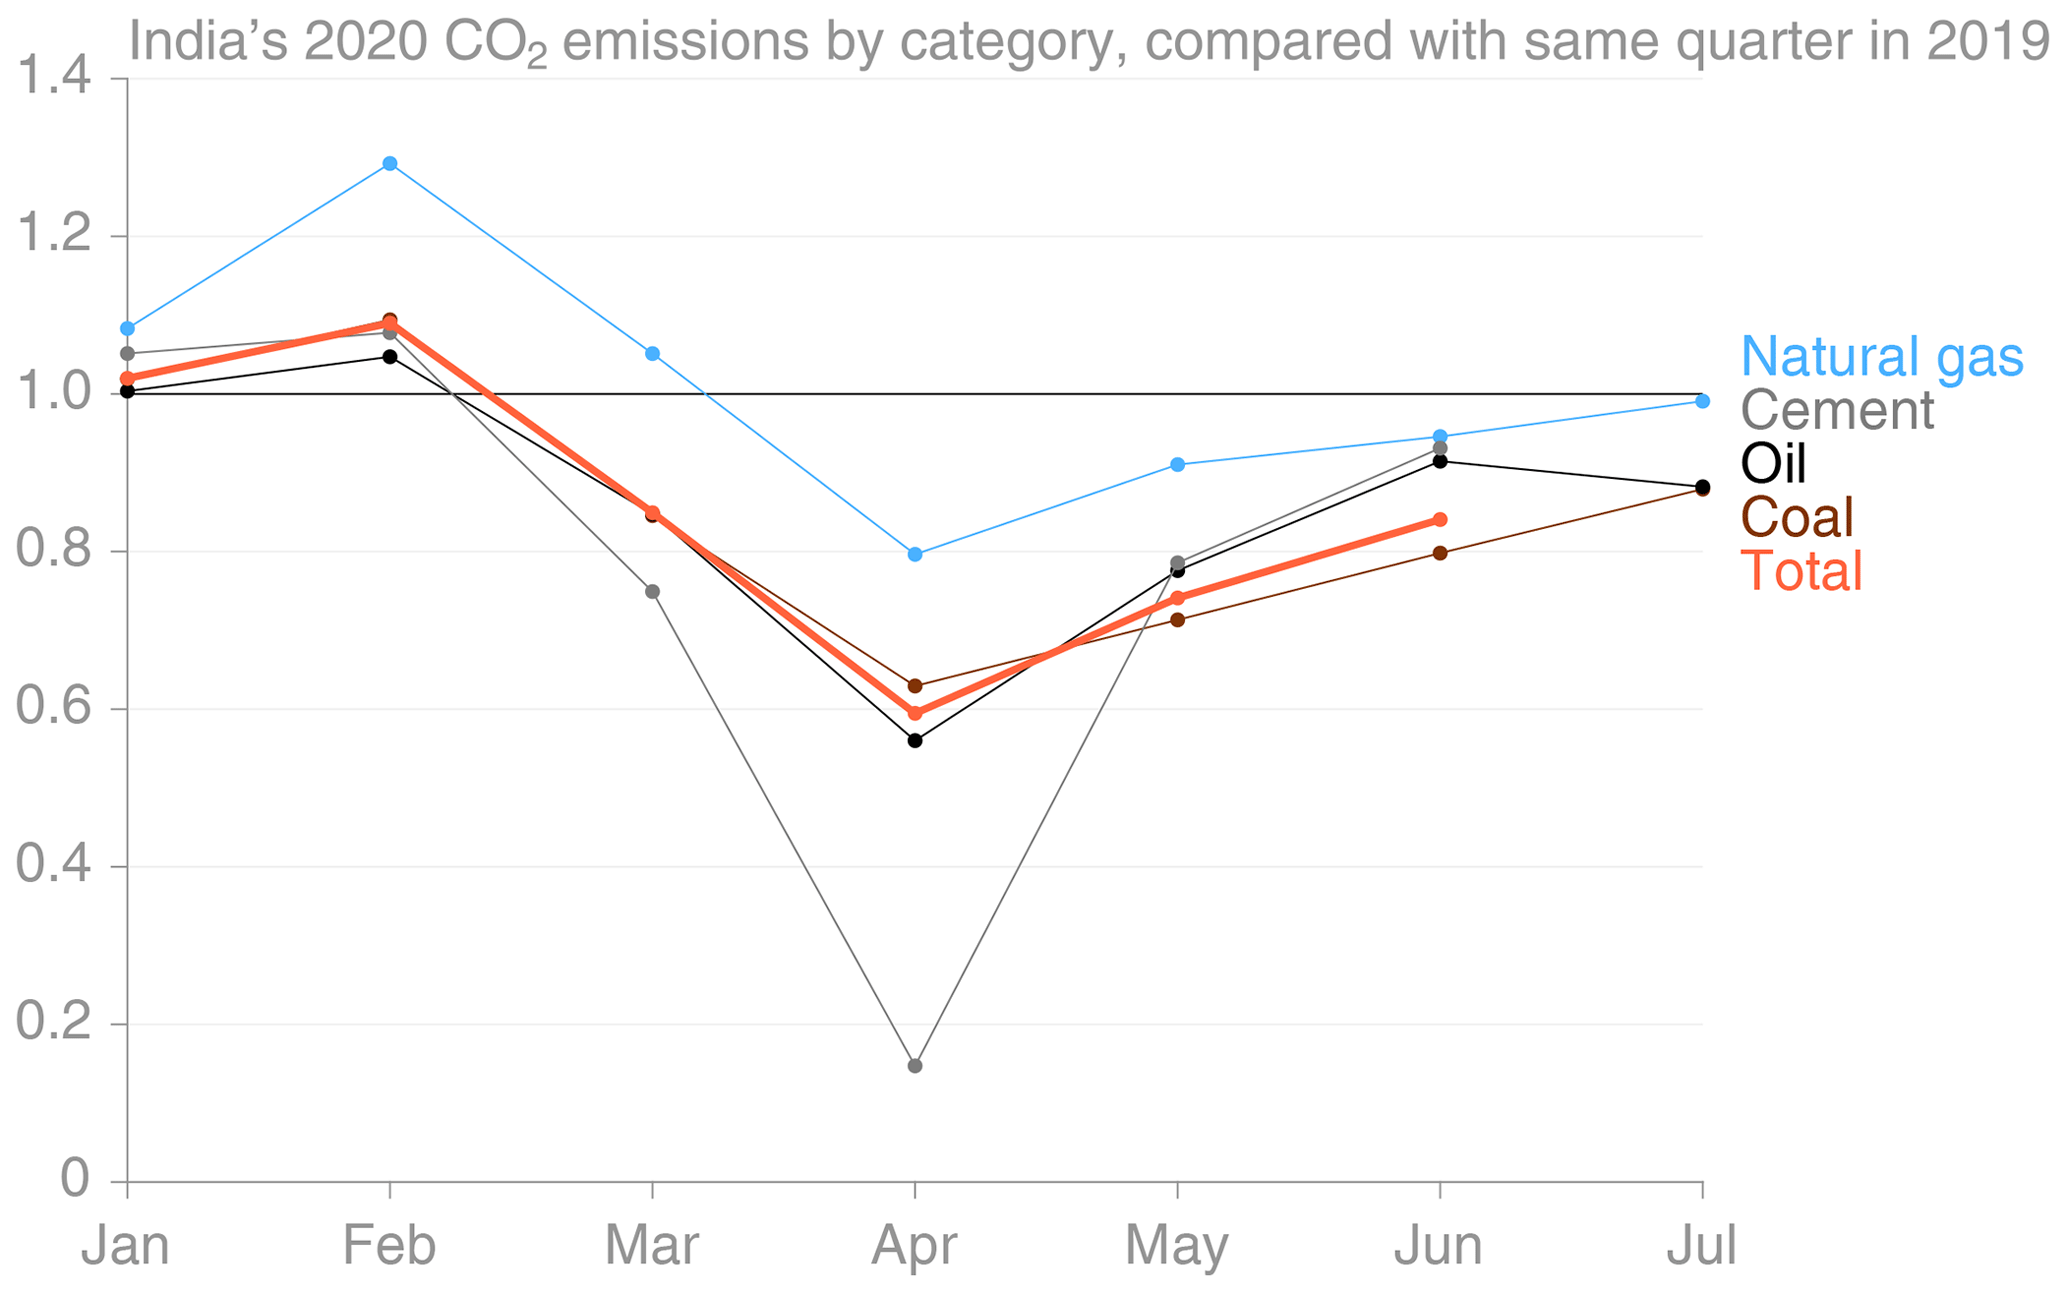
Figure 6Quarter-on-quarter changes in CO2 emissions by category during the first months of 2020.
March would usually be one of the months of the year with the highest coal emissions (Fig. 2), but in 2020 this was affected by COVID-19 measures. India introduced a nationwide lockdown (curfew) on 25 March, although some areas introduced lockdowns in the days before (Roy and Phartiyal, 2020; Varadhan, 2020). Initially the lockdown was to be for 3 weeks, but it was repeatedly extended until the end of May (The Tribune, 2020) and was thereafter followed by a phased “unlocking” (The Hindu, 2020). Largely as a result of substantially reduced activity, and despite the lockdown only affecting about one-third of the month, CO2 emissions from coal in March 2020 were 15 % lower than in March 2019 (Fig. 6). But April saw the largest drops in emissions, with the lockdown having very substantial effects on almost all areas of economic activity: total CO2 emissions were down 40 % compared to April 2019, with cement production dropping by 85 %. In May emissions had already started to rise again as constraints on activity were reduced, but the recovery is far from complete, with July's consumption of oil products declining again compared to June.
New approaches have recently been used to estimate the effect of the world's pandemic responses on global CO2 emissions, based on the collation of partial activity data for use as proxies, such as electricity generation data or travel indices (Le Quéré et al., 2020; IEA, 2020a; Liu et al., 2020). Such methods are suitable and useful for estimation of global effects in near real time when more accurate and detailed data are not available, and the monthly estimates reported in the present work may be used to validate these alternative estimates of India's CO2 emissions. Furthermore, given the close links between emissions of CO2 and other air pollutants, studies on changes in air pollution due to India's lockdowns could be cross-validated with the monthly CO2 estimates reported here (e.g. Sharma et al., 2020; Mahato et al., 2020).
There are several sources of uncertainty in these emissions estimates, which can be divided into four categories. First is the omission of some emissions sources. This analysis has excluded emissions from some carbonates, estimated to be equivalent to less than 2 % of India's total CO2 emissions. Further, some imported non-energy goods containing fossil carbon are excluded. While the case of Iceland shows clearly that imports of carbon anodes used in aluminium manufacture can be important (Andrew, 2020b), these are not imported by India (DGCIS, 2020). India does import urea from China, and the approach used here will not capture emissions from its use in agriculture; however, the amount is likely to be below 2 Mt yr−1 (see Supplement). A further missing source is that of low-temperature oxidation and spontaneous combustion of coal at mines, but available evidence suggests this would be significantly less than 1 % of India's CO2 emissions (Day et al., 2010; IPCC, 2019; Singh, 2019).
Second is use of provisional data and extrapolation before revised data are available. Revisions of coal, the most important emissions source, are in general relatively minor, and use of provisional data along with the methods used here to fill gaps is unlikely to introduce significant error (see Supplement). Lignite production is relatively small and stable, so its extrapolation is not expected to introduce significant uncertainty. Moreover, if monthly press releases of mineral production have indeed recommenced, the lignite uncertainty will be largely removed in future, except for in the most recent month(s).
Third is that of the revised data, effectively measurement error. While energy and emissions data in China serve as a cautionary example (Korsbakken et al., 2016), and India's economic production data face heavy revisions (Fig. S39 in the Supplement), these issues are not expected to affect India's energy and emissions data. One of the reasons for China's high data uncertainty is the very large number of enterprises involved, but in India energy and cement production are highly concentrated and closely monitored. As examples, two coal-mining companies, both state-owned, account for close to 90 % of all coal production and three state-owned fuel retailers account for about 90 % of India's retail fuel sales (Reuters, 2020). While there have recently been claims of official tampering with economic statistics in India (Nadeem, 2019; The Telegraph, 2019) and incorrectly calculated productivity data (Singh, 2012), there is as yet no evidence of manipulation of energy or industrial production data.
The final category of uncertainty is in the emission factors, energy contents, and oxidised fractions used. This is perhaps the largest source of uncertainty, particularly the energy content of domestic hard coal, for which data have been scarce and inconsistent, and broad sampling efforts in recent years point to significant errors, with data from 2016/17 suggesting the declared average coal quality was 10 % higher than the true value (see Sect. S5 in the Supplement). More work is required to generate a more reliable time series of coal quality in India, but in the absence of additional historical sampling coming to light, estimates will have to be made. A further source of uncertainty in this category is the assumption that all naphtha is oxidised, which potentially leads to an overestimate on the order of 1–2 Mt CO2 per month.
The combination of data availability and assumptions made means that coal emissions can be estimated with the shortest lag, within a week of the end of the month. Oil, natural gas, and cement emissions are usually delayed an additional month. There are two main reasons that coal emissions have a short lag. Firstly, coal-fired power stations have faced critical shortages at times and are monitored very closely, and secondly, the two largest mining companies, which report within a day of the month closing, make up the great majority of production. Although short-lag emissions estimates require extrapolation of some components (e.g. lignite production) and use provisional data, as reported and revised data become available, these are incorporated into the estimation procedure used here.
While there are some identified deficiencies in the emissions estimates here, including the exclusion of emissions from use of limestone apart from in cement clinker production, comparisons with annual estimates from other sources, and in particular India's official reporting to the UNFCCC, suggest relatively good accuracy and therefore a high level of usefulness.
All monthly input data used in the analysis, in addition to the monthly emissions estimates, seasonality analysis results, and a copy of the Supplement, are available at https://doi.org/10.5281/zenodo.3894394 (Andrew, 2020a).
India publishes more energy data than many other developing countries, providing a wealth of information for management, policy analysis, and scientific research. Nevertheless, there remains significant room for improvement in the quality of these publications. Possible avenues for such improvement include the following: (i) publishing more data in machine-readable formats, rather than just as tables in PDF documents or in web-page tables; (ii) providing a way for the public and researchers to ask questions about or report errors in data, establishing direct contact with those responsible for the data, to facilitate crowdsourcing of quality assurance; (iii) encouraging collaboration in data preparation and presentation across ministries to prevent errors creeping into reports; (iv) providing more documentation of reported data; (v) reducing use of manual copying, pasting, and typing and automating as much as possible with both automatic and manual quality assurance; (vi) standardising the use of important terms (e.g. “consumption”) across reports from different departments to prevent confusion; and (vii) making older, non-electronic reports (e.g. Monthly Abstract of Statistics) available online through use of digitisation.
The monthly, short-lag estimates of India's CO2 emissions produced here will likely prove useful for tracking the country's progress against its nationally determined contribution under the Paris Agreement but will also be useful for analysis of the drivers of India's emissions both historically and in the future. Calendar-year estimates derived from these are also better aligned to the global datasets into which India's emissions are incorporated.
The future pathway of India's CO2 emissions is highly uncertain. But India is developing rapidly in a world that – largely because of emissions in other countries – is carbon constrained. As India's population grows, as roads, railways, and houses are built, as both vehicles and houses are electrified, as solar panels and wind turbines are installed, and as new coal mines are opened, tracking CO2 emissions monthly will allow for a closer observation of the consequences of these changes.
The supplement related to this article is available online at: https://doi.org/10.5194/essd-12-2411-2020-supplement.
The author declares that there is no conflict of interest.
The provision of data by the International Energy Agency for use in this work is gratefully acknowledged. Comments from the three reviewers helped improve the manuscript.
This research has been supported by the Horizon 2020 programme (grant no. 776810).
This paper was edited by David Carlson and reviewed by Charles Worringham, Thomas Spencer, and one anonymous referee.
Andres, R. J., Gregg, J. S., Losey, L., Marland, G., and Boden, T. A.: Monthly, global emissions of carbon dioxide from fossil fuel consumption, Tellus B, 63, 309-327, https://doi.org/10.1111/j.1600-0889.2011.00530.x, 2011.
Andrew, R. M.: Global CO2 emissions from cement production, 1928–2018, Earth Syst. Sci. Data, 11, 1675–1710, https://doi.org/10.5194/essd-11-1675-2019, 2019.
Andrew, R.: Background data for: Timely estimates of India's annual and monthly fossil CO2 emissions, Zenodo, https://doi.org/10.5281/zenodo.3894394, 2020a.
Andrew, R. M.: A comparison of estimates of global carbon dioxide emissions from fossil carbon sources, Earth Syst. Sci. Data, 12, 1437–1465, https://doi.org/10.5194/essd-12-1437-2020, 2020b.
Bose, A. S. and Sarkar, S.: India's e-reverse auctions (2017–2018) for allocating renewable energy capacity: An evaluation, Renewable and Sustainable Energy Reviews, 112, 762–774, https://doi.org/10.1016/j.rser.2019.06.025, 2019.
Carl, J.: The causes and implications of India's coal production shortfall, in: The Global Coal Market: Supplying the Major Fuel for Emerging Economies, edited by: Thurber, M. C. and Morse, R. K., 123–163, https://doi.org/10.1017/CBO9781316136058.004, 2015.
CEA: Broad Status Report: Under Construction Thermal Power Projects December 2019, Thermal Project Monitoring Division, Central Electricity Authority, New Delhi, available at: http://www.cea.nic.in/reports/monthly/broadstatus/2019/broad_status-12.pdf (last access: 3 October 2020), 2019.
CEA: Daily Coal Report, available at: https://npp.gov.in/publishedReports, last access: 17 April 2020a.
CEA: Coal Statement, available at: http://cea.nic.in/monthlycoal.html, last access: 17 April 2020b.
CIL: Provisional Production and offtake performances of CIL and its subsidiaries companies, Coal India Limited, available at: https://www.coalindia.in/en-us/performance/physical.aspx, last access: 17 April 2020.
CONSTRAIN: ZERO IN ON the remaining carbon budget and decadal warming rates, The CONSTRAIN Project Annual Report 2019, https://doi.org/10.5518/100/20, 2019.
Crippa, M., Oreggioni, G., Guizzardi, D., Muntean, M., Schaaf, E., Lo Vullo, E., Solazzo, E., Monforti-Ferrario, F., Olivier, J. G. J., and Vignati, E.: Fossil CO2 and GHG emissions of all world countries: 2019 report, available at: https://edgar.jrc.ec.europa.eu/overview.php?v=booklet2019 (last access: 14 April 2020), Publications Office of the European Union, Luxembourg, EUR 29849 EN, JRC117610, ISBN 978-92-76-11100-9, 2019.
Crippa, M., Solazzo, E., Huang, G., Guizzardi, D., Koffi, E., Muntean, M., Schieberle, C., Friedrich, R., and Janssens-Maenhout, G.: High resolution temporal profiles in the Emissions Database for Global Atmospheric Research, Scientific Data, 7, 121, https://doi.org/10.1038/s41597-020-0462-2, 2020.
Darné, O., Ferrara, L., and Ladiray, D.: A Brief History of Seasonal Adjustment Methods and Software Tools, in: Handbook on Seasonal Adjustment: 2018 edition, edited by: Eurostat, Eurostat, Luxembourg, available at: https://ec.europa.eu/eurostat/web/products-manuals-and-guidelines/-/KS-GQ-18-001 (last access: 6 April 2020), 2018.
Day, S. J., Carras, J. N., Fry, R., and Williams, D. J.: Greenhouse gas emissions from Australian open-cut coal mines: contribution from spontaneous combustion and low-temperature oxidation, Environ. Monit. Assess., 166, 529–541, https://doi.org/10.1007/s10661-009-1021-7, 2010.
DGCIS: Foreign Trade Data Dissemination Portal, Directorate General of Commercial Intelligence and Statistics, available at: http://14.98.253.4/, last access: 6 April 2020.
DOC: System on India's Monthly Trade, Department of Commerce, available at: http://commerce-app.gov.in/meidb/brcq.asp?ie=i, last access: 7 April 2020.
EIA: International Energy Statistics, Energy Information Administration, available at: https://www.eia.gov/international/data/world, last access: 4 February 2020.
Friedlingstein, P., Jones, M. W., O'Sullivan, M., Andrew, R. M., Hauck, J., Peters, G. P., Peters, W., Pongratz, J., Sitch, S., Le Quéré, C., Bakker, D. C. E., Canadell, J. G., Ciais, P., Jackson, R. B., Anthoni, P., Barbero, L., Bastos, A., Bastrikov, V., Becker, M., Bopp, L., Buitenhuis, E., Chandra, N., Chevallier, F., Chini, L. P., Currie, K. I., Feely, R. A., Gehlen, M., Gilfillan, D., Gkritzalis, T., Goll, D. S., Gruber, N., Gutekunst, S., Harris, I., Haverd, V., Houghton, R. A., Hurtt, G., Ilyina, T., Jain, A. K., Joetzjer, E., Kaplan, J. O., Kato, E., Klein Goldewijk, K., Korsbakken, J. I., Landschützer, P., Lauvset, S. K., Lefèvre, N., Lenton, A., Lienert, S., Lombardozzi, D., Marland, G., McGuire, P. C., Melton, J. R., Metzl, N., Munro, D. R., Nabel, J. E. M. S., Nakaoka, S.-I., Neill, C., Omar, A. M., Ono, T., Peregon, A., Pierrot, D., Poulter, B., Rehder, G., Resplandy, L., Robertson, E., Rödenbeck, C., Séférian, R., Schwinger, J., Smith, N., Tans, P. P., Tian, H., Tilbrook, B., Tubiello, F. N., van der Werf, G. R., Wiltshire, A. J., and Zaehle, S.: Global Carbon Budget 2019, Earth Syst. Sci. Data, 11, 1783–1838, https://doi.org/10.5194/essd-11-1783-2019, 2019.
Gaur, K., Rathour, H. K., Agarwal, P. K., Baba, K. V. S., and Soonee, S. K.: Analysing the Electricity Demand Pattern, 2016 National Power Systems Conference (NPSC 2016), Bhubaneswar, India, 19–21 December 2016, http://www.iitk.ac.in/npsc/proceeding2016.html (last access: 16 April 2020), 2016.
GHG Platform India: GHG Platform India, CEEW, CIMMYT, STEP, ICLEI, Vasudha Foundation, WRI India, available at: http://www.ghgplatform-india.org/.last access: 8 August 2020.
Gilbert, D., and Chatterjee, P.: Buffeted or Energized? India's Dynamic Energy Transition, in: The Palgrave Handbook of Managing Fossil Fuels and Energy Transitions, edited by: Wood, G. and Baker, K., https://doi.org/10.1007/978-3-030-28076-5_9, 2020.
Gilfillan, D., Marland, G., Boden, T., and Andres, R.: Global, Regional, and National Fossil-Fuel CO2 Emissions: 1751–2016, Appalachian Energy Center, Appalachian State University, available at: https://energy.appstate.edu/research/work-areas/cdiac-appstate, last access: 6 December 2019.
GOI: India's Initial National Communication to the United Nations Framework Convention on Climate Change, Ministry of Environment and Forests, Government of India, available at: http://www.unfccc.int/process/transparency-and-reporting/reporting-and-review-under-convention/national-communications-0 (last access: 16 March 2017), 2004.
GOI: India: Second National Communication to the United Nations Framework Convestion on Climate Change, Ministry of Environment and Forests, Government of India, available at: http://www.unfccc.int/process/transparency-and-reporting/reporting-and-review-under-convention/national-communications-0 (last access: 14 April 2020), 2012.
GOI: India: First Biennial Update Report to the United Nations Framework Convention on Climate Change, Ministry of Environment Forest and Climate Change, Government of India, available at: https://unfccc.int/process/transparency-and-reporting/reporting-and-review-under-convention/biennial-update-reports-0 (last access: 13 March 2017), 2015.
GOI: India: Second Biennial Update Report to the United Nations Framework Convention on Climate Change, Ministry of Environment, Forest and Climate Change, Government of India, ISBN: 978-81-938531-2-2, available at: https://unfccc.int/BURs (last access: 6 April 2020), 2018.
Gómez, D. R., Watterson, J. D., Americano, B. B., Ha, C., Marland, G., Matsika, E., Namayanga, L. N., Osman-Elasha, B., Saka, J. D. K., Treanton, K., and Quadrelli, R.: Stationary Combustion, in: 2006 IPCC Guidelines for National Greenhouse Gas Inventories, edited by: Eggleston, S., Buendia, L., Miwa, K., Ngara, T., and Tanabe, K., IGES, Japan, available at: http://www.ipcc-nggip.iges.or.jp/public/2006gl/index.html (last access: 21 May 2017), 2006.
Hoesly, R. M., Smith, S. J., Feng, L., Klimont, Z., Janssens-Maenhout, G., Pitkanen, T., Seibert, J. J., Vu, L., Andres, R. J., Bolt, R. M., Bond, T. C., Dawidowski, L., Kholod, N., Kurokawa, J.-I., Li, M., Liu, L., Lu, Z., Moura, M. C. P., O'Rourke, P. R., and Zhang, Q.: Historical (1750–2014) anthropogenic emissions of reactive gases and aerosols from the Community Emissions Data System (CEDS), Geosci. Model Dev., 11, 369–408, https://doi.org/10.5194/gmd-11-369-2018, 2018.
IEA: CO2 emissions from fuel combustion 2019, International Energy Agency, Paris, France, available at: https://webstore.iea.org/ (last access: 5 February 2020), 2019a.
IEA: World Energy Statistics 2019 Edition, International Energy Agency, Paris, available at: http://www.iea.org (last access: 29 August 2019), 2019b.
IEA: World Energy Balances 2019 Edition, International Energy Agency, Paris, available at: http://www.iea.org (last access: 29 August 2019), 2019c.
IEA: Global Energy Review 2020: The impacts of the Covid-19 crisis on global energy demand and CO2 emissions, International Energy Agency, Paris, available at: https://www.iea.org/reports/global-energy-review-2020, last access: 30 April 2020a.
IEA: India 2020: Energy Policy Review, International Energy Agency, Paris, available at: https://niti.gov.in/documents/reports, last access: 9 April 2020b.
IMD: 2019 Southwest Monsoon Season Rainfall and IMD's Long Range Forecasts, India Meteorological Department, Ministry of Earth Sciences, available at: https://mausam.imd.gov.in/backend/assets/press_release_pdf/IMD_Press_release_2019_monsoon.pdf,last access: 3 October 2020.
Indian Bureau of Mines: Monthly Statistics of Mineral Production, available at: http://ibm.nic.in/index.php?c=pages&m=index&id=497, last access: 26 November 2019.
IPCC: 2019 Refinement to the 2006 IPCC Guidelines for National Greenhouse Gas Inventories, 2019.
Karstensen, J., Roy, J., Pal, B. D., Peters, G., and Andrew, R.: Key Drivers of Indian Greenhouse Gas Emissions, Econ. Polit. Weekly, 55, 46–53, 2020.
Khanna, P. K.: Jawaharlal Nehru National Solar Mission, Ministry of New and Renewable Energy, available at: http://www.iitj.ac.in/CSP/material/JNNSM-Final.pdf (last access: 17 April 2020), 2010.
Korsbakken, J. I., Peters, G. P., and Andrew, R. M.: Uncertainties around reductions in China's coal use and CO2 emissions, Nat. Clim. Change, 6, 687–690, https://doi.org/10.1038/nclimate2963, 2016.
Le Quéré, C., Jackson, R. B., Jones, M. W., Smith, A. J. P., Abernethy, S., Andrew, R. M., De-Gol, A. J., Willis, D. R., Shan, Y., Canadell, J. G., Friedlingstein, P., Creutzig, F., and Peters, G. P.: Temporary reduction in daily global CO2 emissions during the COVID-19 forced confinement, Nat. Clim. Change, 10, 647–653, https://doi.org/10.1038/s41558-020-0797-x, 2020.
Liu, Z., Ciais, P., Deng, Z., Lei, R., Davis, S. J., Feng, S., Zheng, B., Cui, D., Dou, X., He, P., Zhu, B., Lu, C., Ke, P., Sun, T., Wang, Y., Yue, X., Wang, Y., Lei, Y., Zhou, H., Cai, Z., Wu, Y., Guo, R., Han, T., Xue, J., Boucher, O., Boucher, E., Chevallier, F., Wei, Y., Zhong, H., Kang, C., Zhang, N., Chen, B., Xi, F., Marie, F., Zhang, Q., Guan, D., Gong, P., Kammen, D. M., He, K., and Schellnhuber, H. J.: COVID-19 causes record decline in global CO2 emissions, available at: https://arxiv.org/abs/2004.13614, last access: 20 August 2020.
Mahato, S., Pal, S., and Ghosh, K. G.: Effect of lockdown amid COVID-19 pandemic on air quality of the megacity Delhi, India, Sci. Total Environ., 730, 139086, https://doi.org/10.1016/j.scitotenv.2020.139086, 2020.
Ministry of Coal: Report of the working group on coal & lignite for formulation of the eleventh five year plan (2007–12), available at: https://niti.gov.in/planningcommission.gov.in/docs/aboutus/committee/wrkgrp11/wg11_coal.pdf (last access: 14 April 2020), 2006.
Ministry of Coal: Report of the working group on coal & lignite for formulation of twelfth five year plan (2012–2017), available at: https://niti.gov.in/planningcommission.gov.in/docs/aboutus/committee/wrkgrp12/wg_Coal1406.pdf (last access: 14 April 2020), 2011.
Ministry of Coal: Coal Directory of India, Coal Controller's Organisation, Ministry of Coal, Kolkata, available at: http://www.coalcontroller.gov.in/pages/display/16-coal-directory, last access: 17 April 2020a.
Ministry of Coal: Monthly Summary for Cabinet, available at: https://coal.nic.in/content/monthly-summary-cabinet, last access: 3 October 2020b.
Ministry of Coal: Provisional Coal Statistics, Coal Controller's Organization, Ministry of Coal, Kolkata, available at: http://www.coalcontroller.gov.in/pages/display/20-provisional-coal-statistics, last access: 17 April 2020c.
Ministry of Mines: Press Release: Mineral Production (Provisional), available at: https://pib.gov.in/newsite/pmreleases.aspx?mincode=44, last access: 17 April 2020.
MNRE: Revision of cumulative targets under National Solar Mission from 20,000 MW by 2021–22 to 1,00,000 MW, Ministry of New and Renewable Energy, available at: https://pib.gov.in/newsite/PrintRelease.aspx?relid=122567 (last access: 17 April 2020), 2015.
MoP: Stressed/Non-Performing Assets in Gas based Power Plants, Standing Committee on Energy, Ministry of Power, available at: http://164.100.47.193/lsscommittee/Energy/16_Energy_42.pdf (last access: 8 April 2020), 2019.
MOSPI: Energy Statistics 2019, Ministry of Statistics and Programme Implementation, New Delhi, available at: http://www.mospi.gov.in/sites/default/files/publication_reports/Energy tatistics 2019-finall.pdf (last access: 3 October 2020), 2019.
MOSPI: Quarterly Estimates of GDP at Constant Prices, 2011–12 Series, Ministry of Statistics and Programme Implementation, New Delhi, available at: http://mospi.nic.in/data, last access: 19 March 2020a.
MOSPI: Annual Survey of Industries, Indian Ministry of Statistics and Programme Implementation, available at: http://mospi.nic.in/annual-survey-industries, last access: 10 August 2020b.
Nadeem, A.: The jobs data mystery: Understanding India's big crisis in a fraught poll season, The Economic Times 10 April 2019, available at: https://economictimes.indiatimes.com/news/economy/policy/the-jobs-data-mystery-understanding-indias-big-crisis-in-a-fraught-poll-season/articleshow/68809081.cms (last access: 21 April 2020), 2019.
NBS: Total Production of Energy (annual statistics), National Bureau of Statistics of China, Beijing, available at: http://data.stats.gov.cn/english/easyquery.htm?cn=C01, last access: 21 December 2019.
Oda, T., Maksyutov, S., and Andres, R. J.: The Open-source Data Inventory for Anthropogenic CO2, version 2016 (ODIAC2016): a global monthly fossil fuel CO2 gridded emissions data product for tracer transport simulations and surface flux inversions, Earth Syst. Sci. Data, 10, 87–107, https://doi.org/10.5194/essd-10-87-2018, 2018.
POSOCO: National Load Despatch Centre: Daily Reports, Power System Operation Corporation Limited, available at: https://posoco.in/reports/daily-reports/, last access: 16 April 2020.
PPAC: Natural Gas Consumption, Petroleum Planning & Analysis Cell, Ministry of Petroleum & Natural Gas, available at: https://www.ppac.gov.in/content/151_1_ProductionNaturalGas.aspx, last access: 3 October 2020a.
PPAC: Snapshot of India's Oil and Gas data (monthly), Petroleum Planning & Analysis Cell, Ministry of Petroleum & Natural Gas, available at: https://www.ppac.gov.in/View_All_Reports.aspx, last access: 3 October 2020b.
PPAC: Conversion Factors, Petroleum Planning & Analysis Cell, Ministry of Petroleum and Natural Gas, available at: https://www.ppac.gov.in/content/232_2_Others.aspx, last access: 17 April 2020c.
Reuters: Lockdown cuts India's fuel demand 50 % in first half of April, available at: https://www.reuters.com/article/us-india-fuel-deamand/lockdown-cuts-indias-fuel-demand-50-in-first-half-of-april-idUSKBN21Z1ZD (last access: 21 April 2020), 2020.
Rotty, R. M.: Estimates of seasonal variation in fossil fuel CO2 emissions, Tellus B, 39, 184–202, https://doi.org/10.3402/tellusb.v39i1-2.15336, 1987.
SCCL: Provisional Production and Dispatches Performance of SCCL, The Singareni Collieries Company Limited, available at: https://scclmines.com/scclnew/performance_production.asp, last access: 17 April 2020.
Sharma, S., Zhang, M., Anshika, Gao, J., Zhang, H., and Kota, S. H.: Effect of restricted emissions during COVID-19 on air quality in India, Sci. Total Environ., 728, 138878–138878, https://doi.org/10.1016/j.scitotenv.2020.138878, 2020.
Shiskin, J., Young, A., and Musgrave, J. C.: The X11 variant of the Census method II seasonal adjustment program, US Bureau of the Census, Washington DC, Technical Paper No 15, available at: https://www.census.gov/ts/papers/ShiskinYoungMusgrave1967.pdf (last access: 6 April 2020), 1967.
Singh, A. K.: Better accounting of greenhouse gas emissions from Indian coal mining activities – A field perspective, Environmental Practice, 21, 36–40, https://doi.org/10.1080/14660466.2019.1564428, 2019.
Singh, S. P.: CIL inflated productivity, says draft CAG report, Business Standard, New Delhi, available at: https://www.business-standard.com/article/economy-policy/cil-inflated-productivity-says-draft-cag-report-112041102013_1.html (last access: 10 August 2020), 2012.
Subramanian, A. and Felman, J.: India's Great Slowdown: What Happened? What's the Way Out?, CID Faculty Working Paper No. 370, Center for International Development at Harvard University, 2019.
The Hindu: Lockdown phase over, says Modi 17 June 2020, Chennai, available at: https://www.thehindu.com/news/cities/Hyderabad/lockdown-phase-over-says-modi/article31855472.ece, last access: 20 August 2020.
The Telegraph: Economists appeal to restore integrity to statistics, available at: https://www.telegraphindia.com/india/economists-appeal-to-restore-integrity-to-statistics/cid/1686880 (last access: 21 April 2020), 2019.
The Tribune: Centre extends nationwide lockdown till May 31, new guidelines issued 17 May 2020, New Delhi, available at: https://www.tribuneindia.com/news/nation/centre-extends-nationwide-lockdown-till-may-31-new-guidelines-issued-86042, last access: 20 August 2020.
UN Statistics Division: Monthly Bulletin of Statistics Online, United Nations Statistics Division, available at: https://unstats.un.org/unsd/mbs/app/DataSearchTable.aspx, last access: 17 April 2020.
Varadhan, S.: Coal India expects to resume a third of output at flooded Dipka mine within 10 days, Reuters, 2019, available at: https://www.reuters.com/article/coal-india-mine-floods/refile-update-1-coal-india-expects-to-resume-a-third-of-output-at-flooded-dipka-mine-within-10-days-idUSL3N26O2PY, last access: 6 November 2019.
Varadhan, S.: India's March electricity usage falls 9.2 % as lockdown bites, Reuters 1 April 2020, available at: https://www.reuters.com/article/india-electricity-supply/indias-march-electricity-usage-falls-9-2-as-lockdown-bites-idINKBN21J4SI, last access: 16 April 2020.
- Abstract
- Introduction
- Materials and methods
- Results and discussion
- Comparison with existing emissions estimates
- Deviations from forecasts
- COVID-19 effects
- Sources of uncertainty
- Data availability
- Conclusions
- Competing interests
- Acknowledgements
- Financial support
- Review statement
- References
- Supplement