the Creative Commons Attribution 4.0 License.
the Creative Commons Attribution 4.0 License.
 | 01 Oct 2020
A new dataset of soil carbon and nitrogen stocks and profiles from an instrumented Greenlandic fen designed to evaluate land-surface models
Birger Hansen
Christine Delire
Per Ambus
Mikhail Mastepanov
Bertrand Decharme
Arctic and boreal peatlands play a major role in the global carbon (C) cycle. They are particularly efficient at sequestering carbon because their high water content limits decomposition rates to levels below their net primary productivity. Their future in a climate-change context is quite uncertain in terms of carbon emissions and carbon sequestration.
Nuuk fen is a well-instrumented Greenlandic fen with monitoring of soil physical variables and greenhouse gas fluxes (CH4 and CO2) and is of particular interest for testing and validating land-surface models. But knowledge of soil carbon stocks and profiles is missing. This is a crucial shortcoming for a complete evaluation of models, as soil carbon is one of the primary drivers of CH4 and CO2 soil emissions. To address this issue, we measured, for the first time, soil carbon and nitrogen density, profiles and stocks in the Nuuk peatland (64∘07′51′′ N, 51∘23′10′′ W), colocated with the greenhouse gas measurements. Measurements were made along two transects, 60 and 90 m long and with a horizontal resolution of 5 m and a vertical resolution of 5 to 10 cm, using a 4 cm diameter gouge auger. A total of 135 soil samples were analyzed. Soil carbon density varied between 6.2 and 160.2 kg C m−3 with a mean value of 50.2 kg C m−3. Mean soil nitrogen density was 2.37 kg N m−3. Mean soil carbon and nitrogen stocks are 36.3 kg C m−2 and 1.7 kg N m−2. These new data are in the range of those encountered in other arctic peatlands. This new dataset, one of very few in Greenland, can contribute to further development of joint modeling of greenhouse gas emissions and soil carbon and nitrogen in land-surface models. The dataset is open-access and available at https://doi.org/10.1594/PANGAEA.909899 (Morel et al., 2019b).
- Article
(12136 KB) - Full-text XML
-
Supplement
(6371 KB) - BibTeX
- EndNote


The terrestrial biosphere plays an important role in regulating atmospheric greenhouse gas composition and climate through gas exchanges and its capacity to act as a carbon (C) sink (Friedlingstein et al., 2019). For instance, northern latitude wetlands account for one-third to one-half of the methane emissions from natural wetlands (Schlesinger and Bernhardt, 2013). Among all terrestrial ecosystems, peatlands are arguably the most efficient at sequestering C over long time scales (Loisel et al., 2014; Leifeld and Menichetti, 2018). Peatlands are permanently saturated wetlands and cover 3 % of the global land surface (Xu et al., 2018). In these ecosystems, the anaerobic conditions created by high water content lead to slow carbon decomposition. Because the accumulation rate of organic matter is greater than its decomposition rate, peatlands are an important long-term soil carbon reservoir (Gorham, 1991). When undisturbed, these ecosystems are a net sink for atmospheric CO2 (Jungkunst et al., 2012). Peatlands have consistently sequestered C although at variable rates throughout the entire Holocene period (Yu et al., 2011). Globally they are estimated to store between 550 and 694 Gt C, about a third of global soil organic carbon stocks (Yu et al., 2010; Yu, 2012). Peatlands play a major role in the global carbon cycle (Harenda et al., 2018; Limpens et al., 2008).
Their future in a changing climate is quite uncertain, in terms of the magnitude of carbon emissions and sequestration (Yu et al., 2011). Recent projections suggest that peatlands may remain a carbon sink in the future, although a weaker one (Gallego-Sala et al., 2018). Primary productivity and soil carbon decomposition depend on multiple factors such as solar irradiance, air temperature, vegetation type, soil moisture, soil temperature, soil carbon and soil nutrient content, all of which depend on climate. To be able to estimate how much litter and soil carbon might be decomposed, it is necessary to know the carbon stock at present time. It is also important to know its vertical profile in the soil because the decomposition rate and ratio of CH4 to CO2 production depend on depth through soil temperature and soil moisture vertical profiles.
Nitrogen (N) is a limiting factor for plant growth and microbial activity in northern soils (Vitousek and Howarth, 1991) and could play an important role in future northern land carbon storage (Kicklighter et al., 2019) and greenhouse gas emissions (Luan et al., 2019). Increased nitrous oxide release from northern soils with permafrost thaw has been reported (Elberling et al., 2010; Voigt et al., 2017). However, very little is known on nitrogen stocks in these soils.
Knowledge of carbon and nitrogen stocks and profiles is hence particularly important. In the last decades, a growing number of sites in the arctic and boreal regions were instrumented in order to measure the greenhouse gas emissions of these ecosystems, such as Abisko in Sweden (Jammet et al., 2017), Samoylov in Russia (Siewert et al., 2015, 2016) or Zackenberg in Greenland (Pirk et al., 2016, 2017) (see Table 1). Similarly, more and more measurements of soil carbon stocks and profiles are conducted every year. Unfortunately, although large-scale soil carbon databases already exist (e.g the Harmonized World Soil Database, FAO et al., 2012, or the Northern Circumpolar Soil Carbon Database (Hugelius et al., 2013), very few sites have both greenhouse gas flux and soil carbon content measurements (see Table 1). This is a substantial shortcoming that needs to be addressed, as carbon profiles are one of the primary drivers of CO2 and CH4 production and emission (Raich and Schlesinger, 1992). Moreover, for the few sites for which soil carbon stocks and greenhouse gas fluxes are available, both are quite often not measured at the same location (sometimes more than a few kilometers apart). Due to fine-scale heterogeneity (vegetation, microtopography, etc.), they may reflect completely different conditions (e.g. first datasets from the Zackenberg site; Sigsgaard et al., 2007; Palmtag et al., 2015). From a site-scale modeling point of view, it is therefore important to have greenhouse gas flux data (e.g. CH4 and CO2) and state variable data (C stocks and profiles) available at the same locations.
There are many challenges to simultaneously modeling greenhouse gas emissions and soil carbon in land-surface models. For instance, Chadburn et al. (2017) noted that models that simulate realistic soil temperature and soil carbon currently produce unrealistically low methane fluxes. It appears therefore necessary to improve the coupling of biogeochemical and physical processes of land-surface models. An example of recent attempts at this is the biogeochemical carbon and greenhouse gas emissions model presented in Morel et al. (2019a) and embedded in the land surface model Interactions between Soil, Biosphere, and Atmosphere (ISBA; Noilhan and Planton, 1989). Although the biogeochemical and physical parts of this model have been validated on three distinct boreal and arctic sites, the lack of soil carbon data did not allow a complete evaluation of this model. Hence, we conducted a field experiment in a well-instrumented Greenlandic peatland, Nuuk fen, to collect soil carbon stocks and profile data at the location of the automatic chambers measuring CH4 and CO2 fluxes and along two transects.
Jammet et al. (2017); Chadburn et al. (2017)Lüers et al. (2014); Chadburn et al. (2017)van der Molen et al. (2007); Chadburn et al. (2017)Sachs et al. (2008); Siewert et al. (2015, 2016); Rößger et al. (2019)Pirk et al. (2016, 2017); Chadburn et al. (2017); Sigsgaard et al. (2007)Pastukhov and Kaverin (2013)Pirk et al. (2016, 2017)Pirk et al. (2016, 2017); Tamstorf et al. (2008); Raundrup et al. (2010)Table 1Short review of available carbon stocks, profiles, and CO2 and CH4 fluxes for different sites.
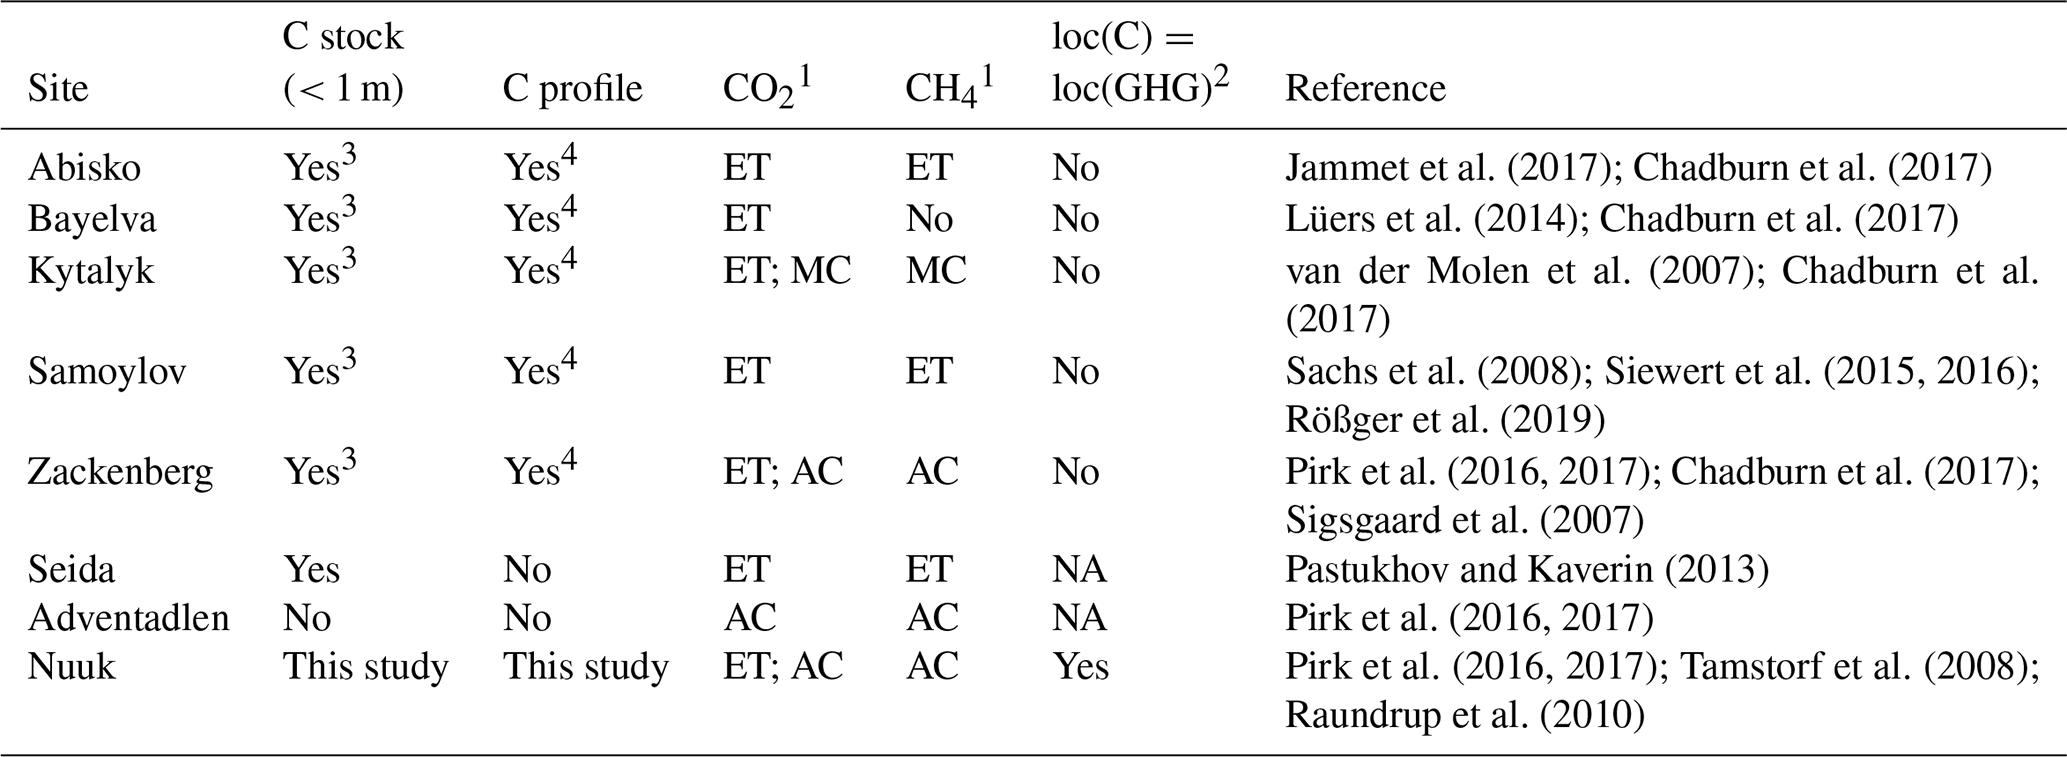
1 ET: eddy tower; MC: manual chambers; AC: automatic chambers. 2 loc(C): localization of soil carbon data measurement; loc(GHG) localization of greenhouse gas flux measurement; NA: not announced. 3 Computed via combination and harmonization of several plots (Palmtag et al., 2015; Siewert et al., 2015, 2016). 4 Computed via weighted average (Palmtag et al., 2015; Siewert et al., 2015, 2016).
There are very few data available on wetlands in Greenland in general and fens in particular due to logistical difficulties to reach them. Fen extent in Greenland was recently estimated using a combination of remote sensing data and ground measurements (Karami et al., 2018). Karami et al. (2018) find the extent of fen to be 4461 km2, about 1.4 % of the ice-free area and 5 % of the vegetated area of Greenland. In terms of in situ data Palmtag et al. (2015, 2018) sampled a few fens for soil carbon and nitrogen in the Zackenberg valley. Barthelmes et al. (2015) in their review only list a dozen published in-situ measurements of peat deposits (both active and inactive), fairly shallow (less than 1 m) for the active ones. Among those, only two deal with carbon fluxes or stocks (MacDonald et al., 2006; Horwath Burnham and Sletten, 2010), the others being mostly paleoecological and archeological studies. Except for Palmtag et al. (2018), none include nitrogen data. Hence, a new dataset on carbon and nitrogen content of a Greenland fen is important.
The aim of this paper is to present and validate this new dataset of soil carbon and nitrogen stocks and profiles from Nuuk fen. In Sect. 2 we present the Kobbefjord site, in particular the fen's physical characteristics and specificities. We present in Sect 3 the experimental protocol and the methods of the field and laboratory studies. Section 4 presents collected data of soil bulk density, water content, soil carbon content, profiles and stocks, as well as nitrogen and carbon ∕ nitrogen (C ∕ N) weight ratios. Finally, we discuss the dataset robustness and possible uses. These soil carbon and nitrogen data will complement the existing dataset of greenhouse gas fluxes from the fen. The combined dataset will allow the evaluation of the fluxes and stocks simulated by land-surface models in a completely consistent manner. The dataset is open-access and available at https://doi.org/10.1594/PANGAEA.909899 (Morel et al., 2019b).
The studied fen (Nuuk fen) is located within the Nuuk Ecological Research Station and is part of the Greenland Ecosystem Monitoring program, which provides detailed reports on an annual basis, dating back to 2007 (Nuuk Ecological Research Operations – NERO – Annual reports; Tamstorf et al., 2008). The Research Station is well-instrumented and participates in several research programs, studying the dynamics of organisms and biological processes, the physical characteristics of marine, coastal and terrestrial environments and performing climate and hydrology monitoring as well. Related data are public and open-access on the Greenland Ecosystem Monitoring database repository, to be found at http://data.g-e-m.dk/ (last access: 29 September 2020).
Nuuk Research Station is located in the southwest of Greenland, in Kobbefjord (64∘07′ N, 51∘21′ W), approximately 20 km from Nuuk. It is not in the permafrost region (Geng et al., 2019). According to the classification of Glooschenko et al. (1993) of Arctic and subarctic wetlands, Nuuk fen is in the low subarctic wetland region. The research station consists of a drainage basin of 32 km2 situated at the head of a fjord. The local climate is subarctic with a mean annual temperature of −1.4 ∘C and mean annual precipitation of 752 mm (1961–1990). Despite cold winter temperatures, the fen never freezes at depths below 10–15 cm. NERO annual reports (Tamstorf et al., 2008; Raundrup et al., 2010) show a significant variability in soil texture, soil moisture, vegetation and microtopography. The studied zone, the only fen of the fjord, is surrounded by high rocks (left top panel of Fig. 1). The fen is located between the fjord and the Bade So lake. Datings of the sedimentary layer of Bade So (Larsen et al., 2017) showed that the lake was under sea level until 8500 BP. Hence, the fen cannot be older. The underlying geology of the parent material is bedrock composed of Archaean tonalitic to granodioritic gneiss and Qorqût granite (Larsen et al., 2017).
The fen is instrumented with automatic chambers, an eddy flux tower and a regular automated weather station, particularly useful for land-surface models. Nuuk CO2 and CH4 automatic chamber flux measurements started in 2007 and are still ongoing. The chambers usually operate from mid-May to mid-October. Each year, the CH4 flux peaks in July–August with values around 6 mg CH4 m−2 h−1 and declines to about half of the maximum in early September. Peak CO2 fluxes happen at the end of July–early August, reach about −300 mg CO2 m−2 h−1, and occur at the peak of the growing season when photosynthesis is a much larger flux than soil respiration. These fluxes are described in Pirk et al. (2017) and Morel et al. (2019a).
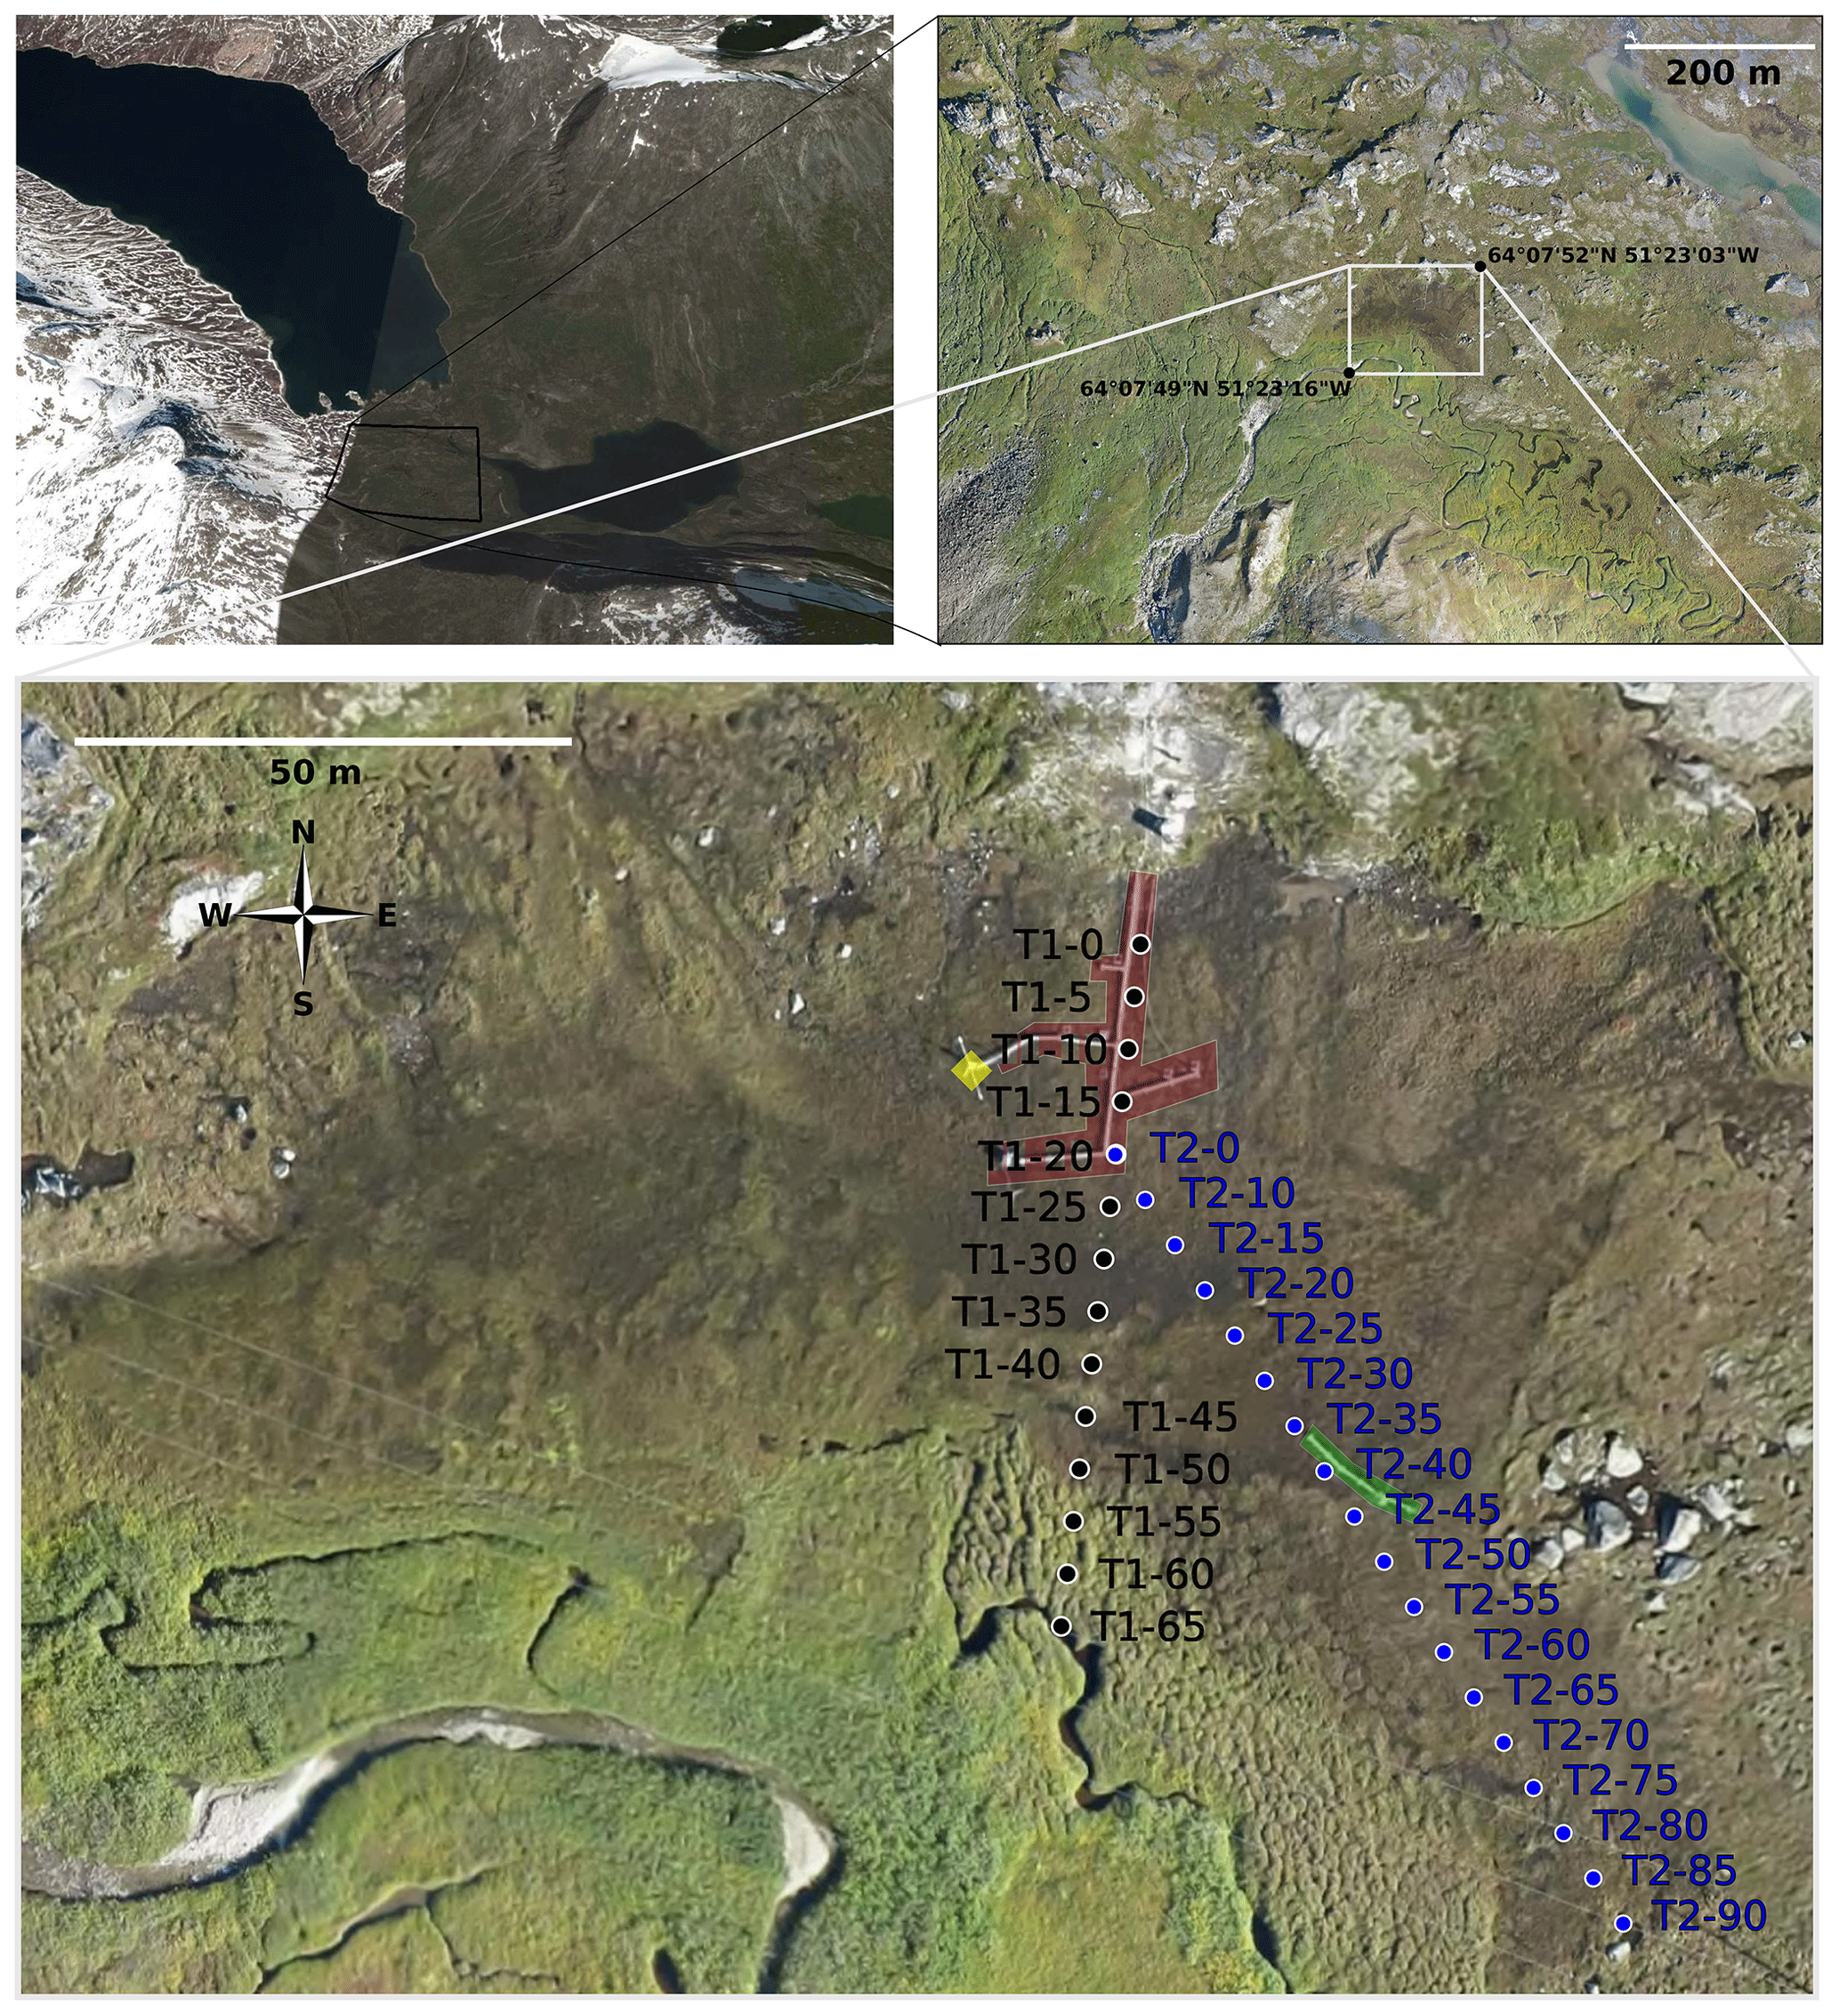
Figure 1Left top panel: satellite image (© Google Earth – 2009) of Kobbefjord, centered on 64∘7′51.5′′ N, 51∘23′10.5′′ W. Right top panel: high-resolution photography (taken by a drone in 2015) of the valley floor. The white rectangle surrounds the fen. The bottom panel shows a zoom of the fen, with the two studied transects: T1 (black circles) and T2 (blue circles). Zones highlighted in red represent the location of the automatic chambers, in green the soil temperature probes, and in yellow the eddy flux tower.
The main water inputs to the fen are from snowmelt and runoff from adjacent hills and inflow from a nearby stream located at the southern border of the fen (bottom panel of Fig. 1). One key factor of this site appears to be the snowmelt date, as snowmelt water runs through the fen, leading to saturated moisture conditions during the growing season. We show that the darker areas in the center roughly correspond to the wetter areas. In these zones, the vegetation is adapted to saturated conditions. This vegetation for instance, has a lower albedo than in the fen's outer area, thereby absorbing more solar radiation and compensating for the colder conditions. Figure 2 shows the different vegetation types encountered throughout the fen: green herbaceous species and mosses in the outer part and aquatic plants with aerenchymas and Sphagnum in the center of the fen. Section 3.1 explains more precisely the differences in vegetation.
All the measurements were made in July 2017 along two transects, shown in the bottom panel of Fig. 1. Each transect was sampled every 5 m, thus defining the plots T1–0, T1–5, T1–10 and so on.
The first transect (T1) roughly follows a N–S axis. The automatic chambers are situated on either side of the transect between plots T1–0 and T1–20. The second transect (T2) starts at the last automatic chamber, at the 20 m plot of the first transect, in the middle of the fen and goes through the fen in its larger axis. The soil temperature probes can be seen between plots T2–30 and T2–45.
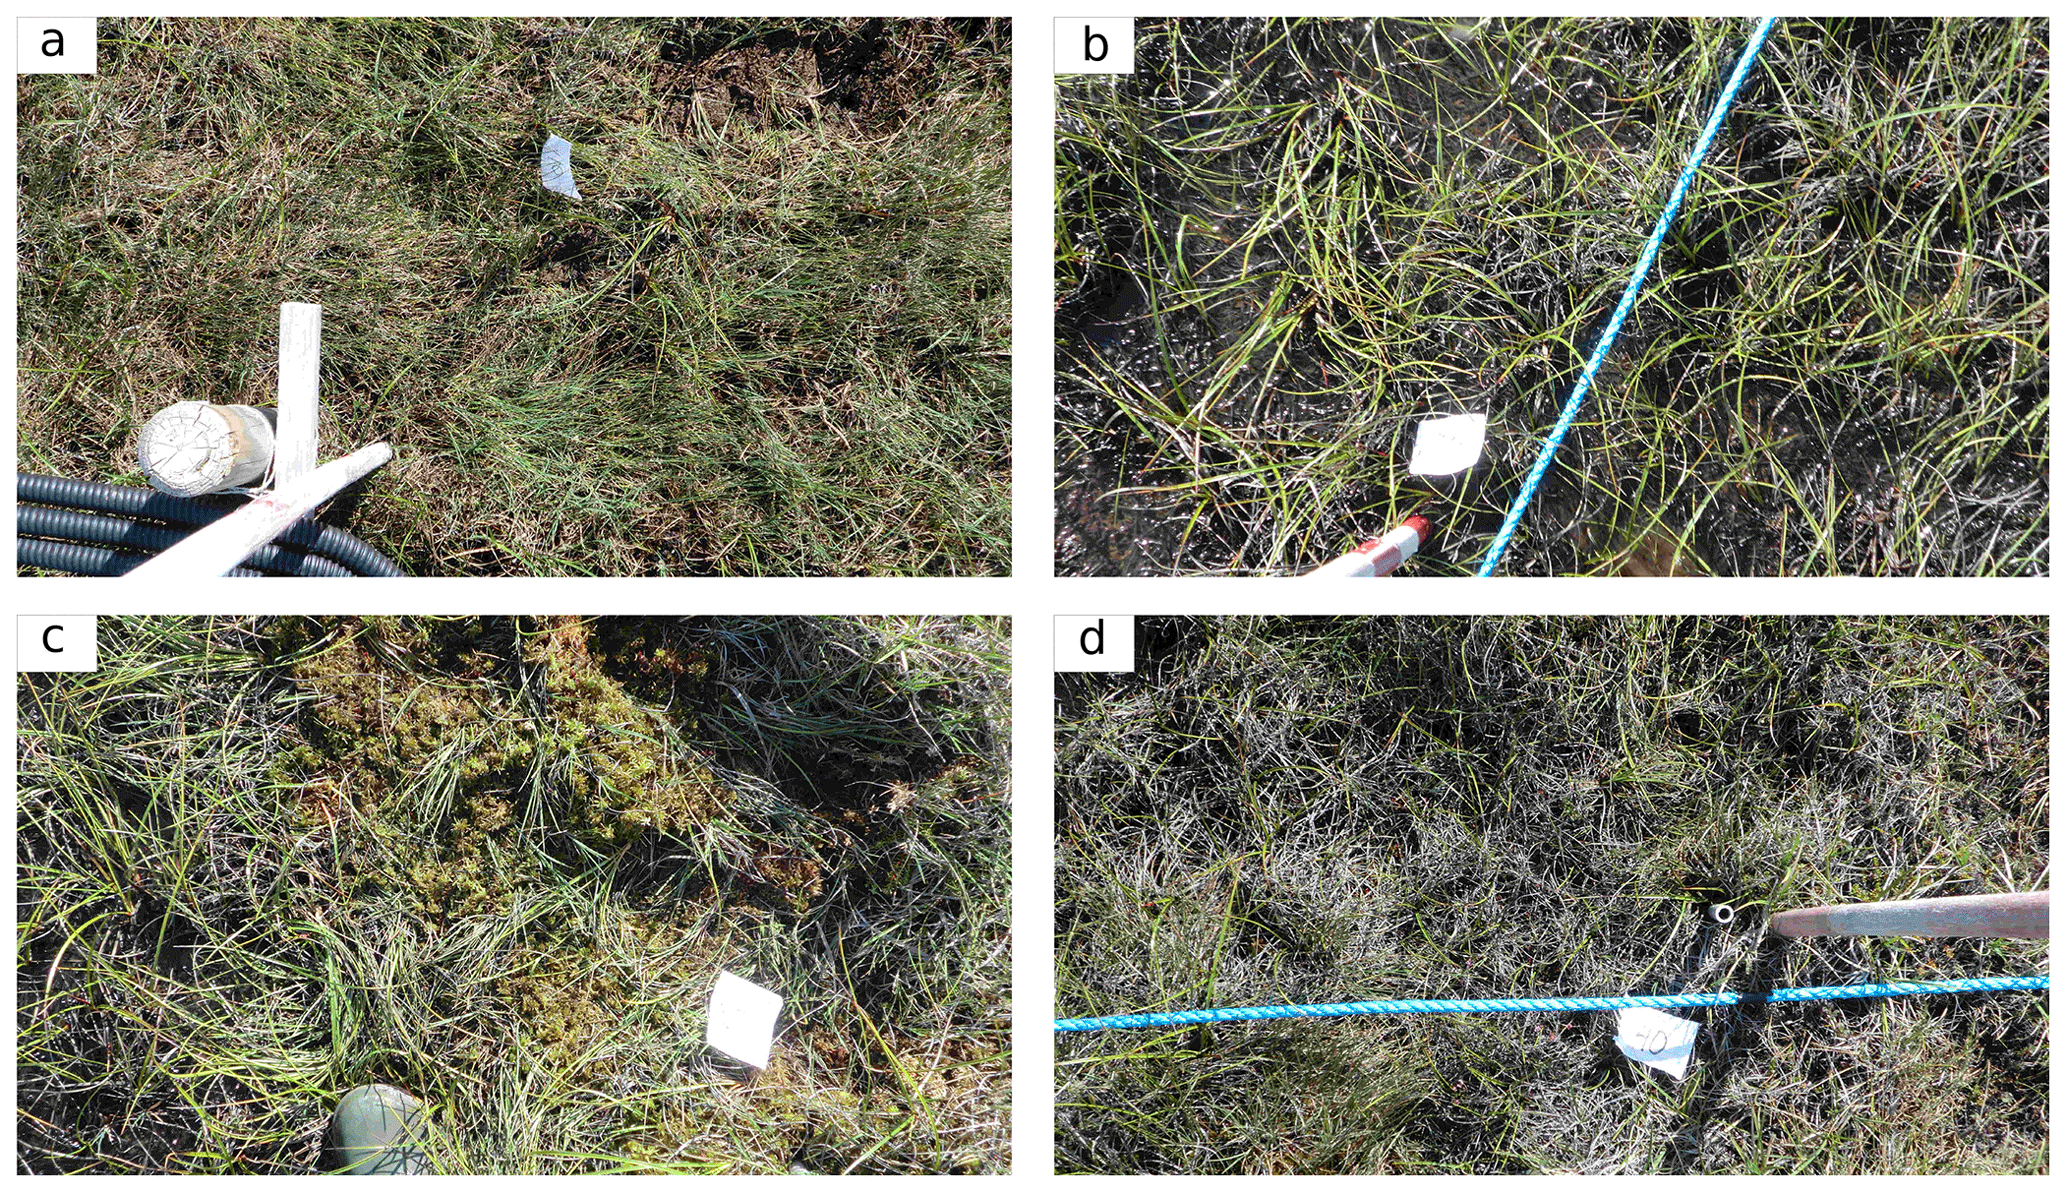
Figure 2Soil surface photographs along the first transect at several plots. (a) T1–10; (b) T1–30; (c) T1–35; (d) T1–40.
3.1 Fen physical characteristics
First, we measured the topography of the fen and the depth of the sediment layer that delimits organic and mineral soil horizons at every plot for both transects. The elevation was measured with a topographer rod. The depth of the organic–mineral interface (OMI) was measured with a rigid metallic probe. The probe was lowered into the ground until a strong resistance, characteristic of mineral soils, was encountered.
The first transect clearly revealed an accumulation basin at the center of the fen: while the ground elevation remained approximately constant, the OMI depth strongly increased between plots T1–0 and T1–25 (Fig. 3). This depression is characteristic for peatland formation and contributes to organic material accumulation and burial in these ecosystems. Its maximal depth, of approximately 1 m, was situated at T1–25 and roughly corresponds to the darker part of the fen surface (Fig. 1) and standing water (Figs. 3a and 2b). The OMI depth sharply increased in 15 m, then stayed relatively stable. The plot T1–40 seemed to mark the end of the fen. In this intermediate area from T1–40 to T1–60, surface moisture conditions were much drier (Fig. 2d) and the vegetation did not consist of aquatic plants such as Sphagnum anymore. Green herbaceous vegetation and mosses then became predominant. T1–40 to T1–60 are characterized by a hummocky topography (little mounds and depressions) that cannot be picked up by 5 m resolution measurements. The plot T1–65 was located at the shore of the nearby water stream.
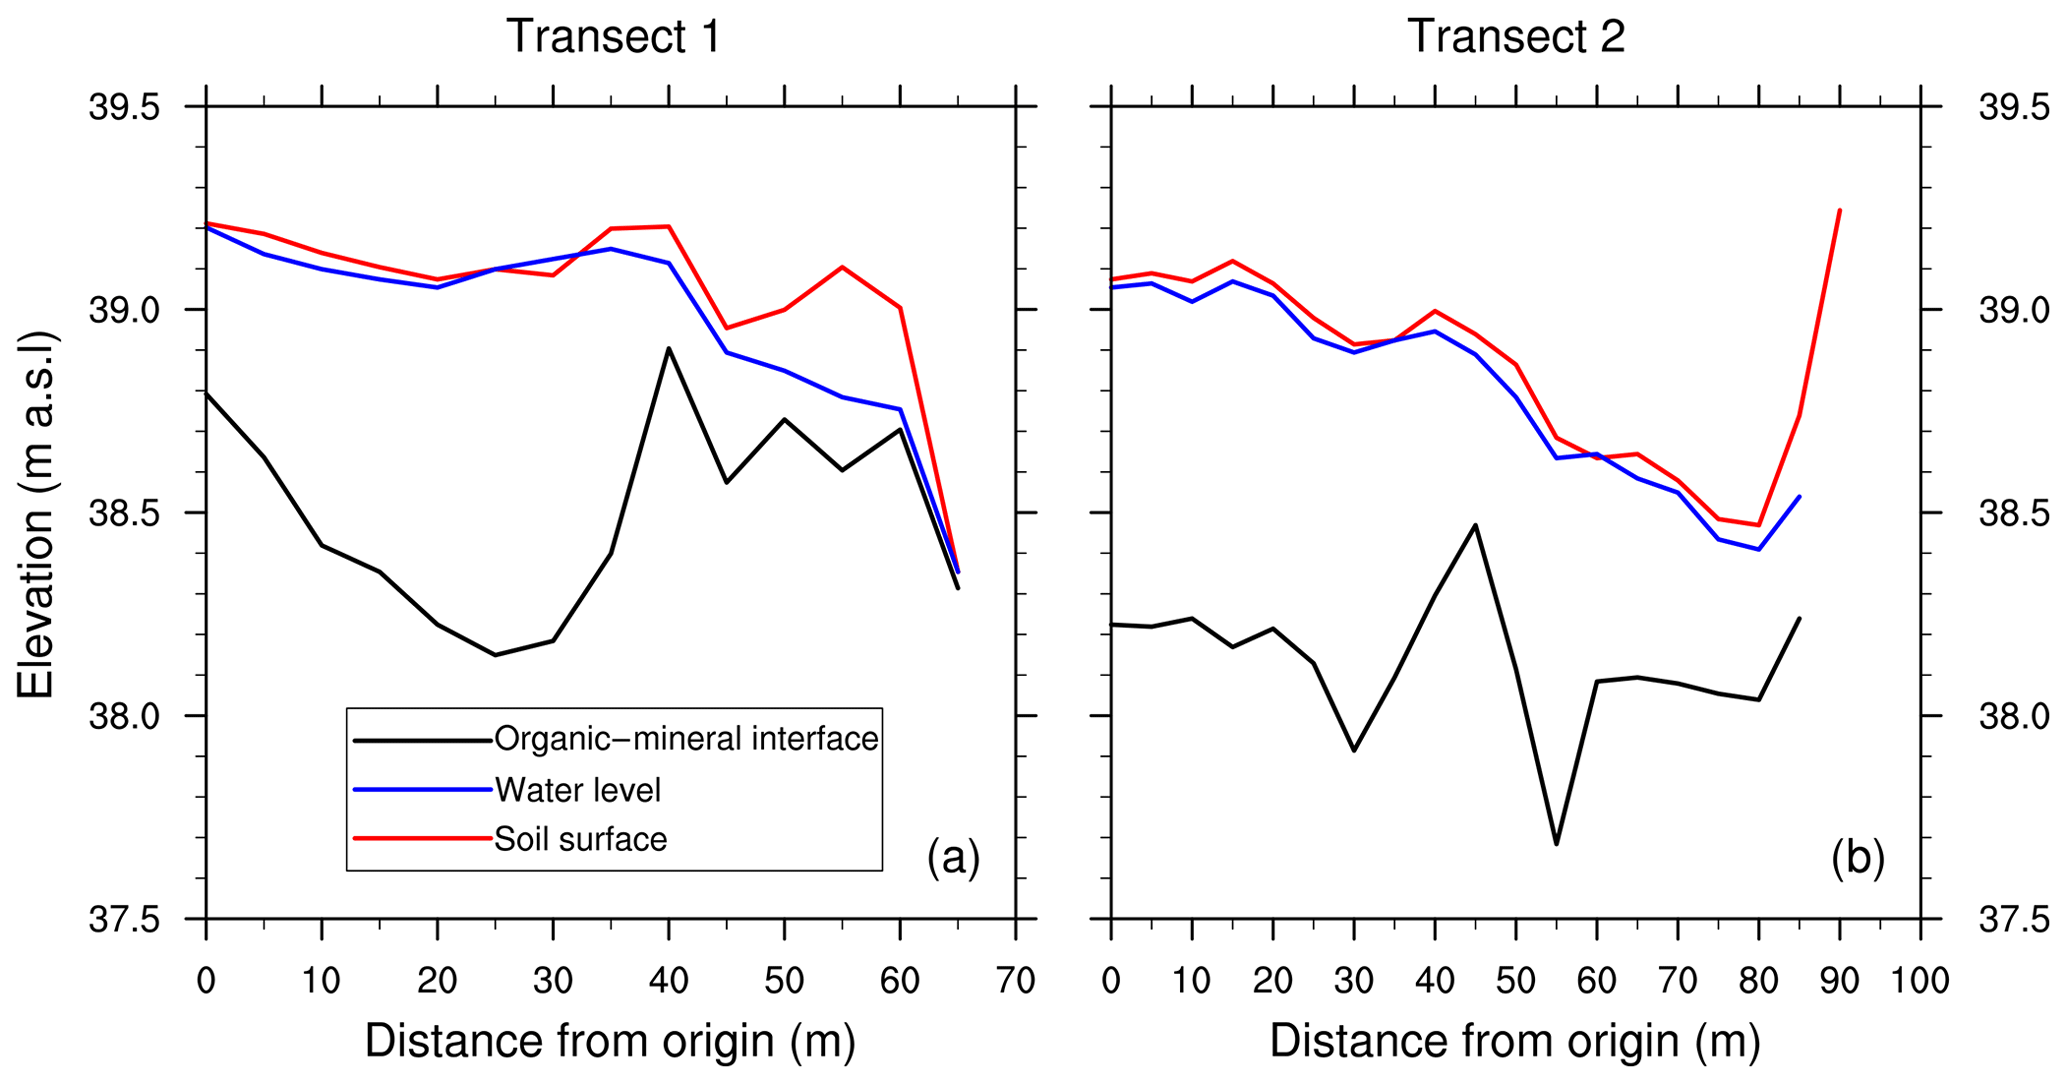
Figure 3Topographical measurements of soil surface (red) and manual measurements of water level (blue) and organic–mineral interface (black) along both transects. Manual measurements of water level were made on 27 July 2017.
The second transect started at the 20 m plot of the first transect (T2–0 = T1–20), in the middle of the fen. Until plot T2–30, the soil elevation and the OMI depth did not vary much. There was a peak in the OMI depth at T2–45, surrounded by two small depressions, while the soil elevation decreased. The end of the transect matched with the boundary of the fen. Approaching this boundary, the soil elevation and the mineral layer both rose.
3.2 Soil sampling along the transects
Soil samples were taken every 5 m along the first transect from the plots T1–0 to T1–35, as we focused solely on the peat deposit. As the second transect fully lay in the peat deposit, soil samples were taken every 10 m for the whole transect, i.e. between the plots T2–0 and T2–80. Samplings were made using a manual gouge auger, with double spade grip and a cylindrical semi-open lower part of 1 m depth and 4 cm in diameter. The general target depth of sampling was to reach below the peat–mineral transition. Samples were then extracted along the full soil core at regular intervals: every 5 cm in the top 15 cm, every 10 cm below. Soil samples were individually stored in small sealed plastic bags just after extraction in order to limit oxygen exchanges and halt decomposition.
Ideally, soil samples should be stored at a 4 ∘C temperature before being transferred to the lab. With no fridge on the site, we used an insulated cooler in order to best control the samples' temperature. The maximum elapsed time between sample collection and their deposit at the laboratory was 3 d. Although the temperature control of the samples may not have been optimal, this short delay between sample collection and handling prevented any significant decomposition.
3.3 Soil sample handling and analysis
Soil samples (n=135) were first analyzed at the Greenland Institute of Natural Resources, located in Nuuk. For each sample, volume and mass were carefully measured following the method of Chambers et al. (2010) by removing a known-volume sample of peat using a volumetric sampler, measuring it again with a 0.1 mm precision vernier, and weighing it in a crucible in order to determine the sample's density ρsample (g m−3).
Despite careful measurement and a method designed to limit sample compaction, we recognize that some uncertainties on the samples' densities difficult to quantify are the following.
-
The act of measurement and the soil core extraction can compress the samples within the manual gouge auger, hence modifying their structure.
-
Extracting the samples from the water-saturated soil layers without loss of water is obviously challenging, hence modifying the sample total mass. This potential loss of water can also change the available space within the soil pores, making the sample potentially more sensitive to any compaction.
-
The almost liquid texture of the water-saturated samples made it difficult to measure the sample volume. For these water-saturated samples, we used known-volume vials for volume measurements instead of the 0.1 mm precision vernier.
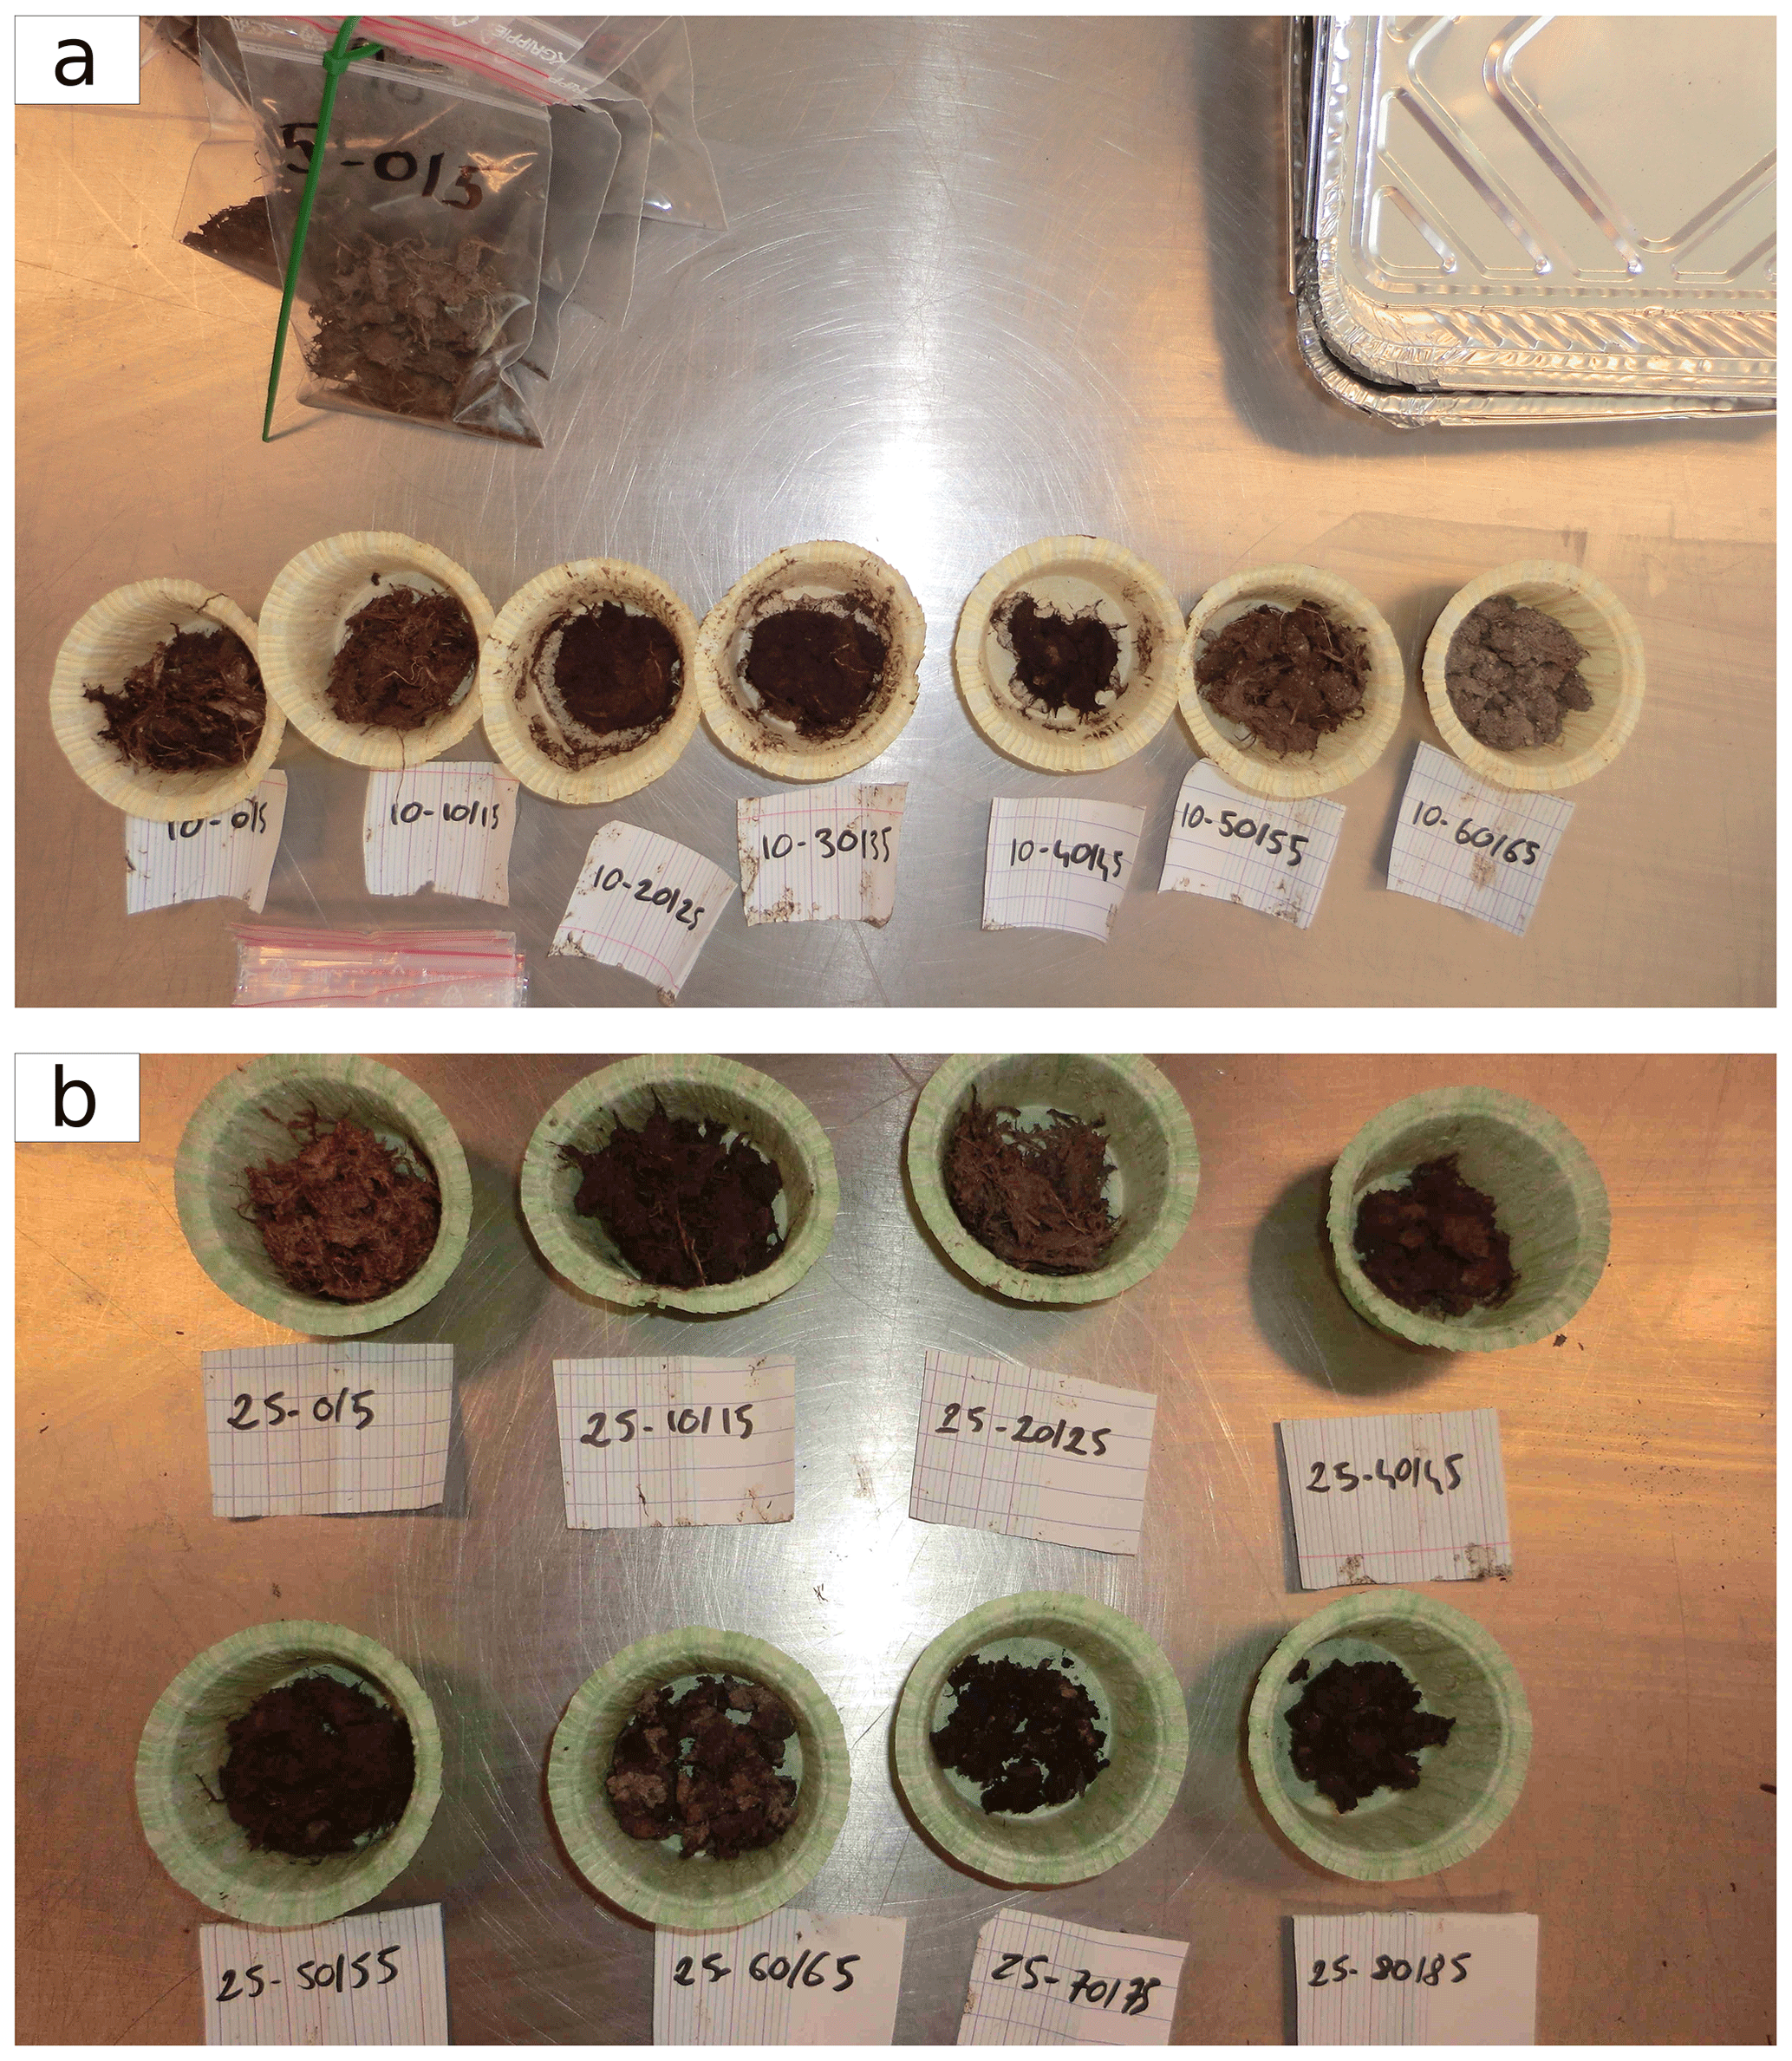
Figure 4First transect soil samples after 48 h of oven drying at 80 ∘C. Different samples depths are shown for plots (a) T1–10 and (b) T1–25.
Peat samples were then oven-dried at 80 ∘C for 48 h until a constant weight was reached (Djukic et al., 2018). Figure 4 shows samples at different depths for the soil cores T1–10 and T1–25 after drying. The samples of the T1–10 soil core present a well-marked color gradient indicating the different soil horizons. For example, the color and texture of sample (taken at 60–65 cm depth) of plot T1–10 is characteristic of a mineral soil and indeed corresponds to the OMI (Fig. 3). Conversely, the T1–25 soil core (in the center of the fen) did not have any significant gradient of color and texture, except for a mixed-appearance zone at 60–65 cm depth. We show later that these differences in color could be mainly explained by soil carbon content.
After drying, we determined the mass fraction of water of each sample, fwet. In order to estimate the carbon density within the soil, we need the soil bulk density, ρbulk, defined as the dry mass per unit of total volume (Boelter, 1969; Hossain et al., 2015). The observed bulk density was computed as
Dried peat samples were then sent to the Center for Permafrost (CENPERM – University of Copenhagen – Denmark) for further C and N analysis. Briefly, 10 mg portions of thoroughly mixed and finely ground sample material were weighed into tin combustion cups for Dumas combustion (1700 ∘C) on an elemental analyzer (CE 1110, Thermo Electron, Milan). Peat standards (Elemental Microanalysis, Okehampton, UK) were included for elemental analyzer mass calibration in order to obtain percentage of C and N content, fC and fN, respectively.
Soil carbon density ρC (g C m) was then computed as
Similarly, soil nitrogen density ρN (g N m) was computed as
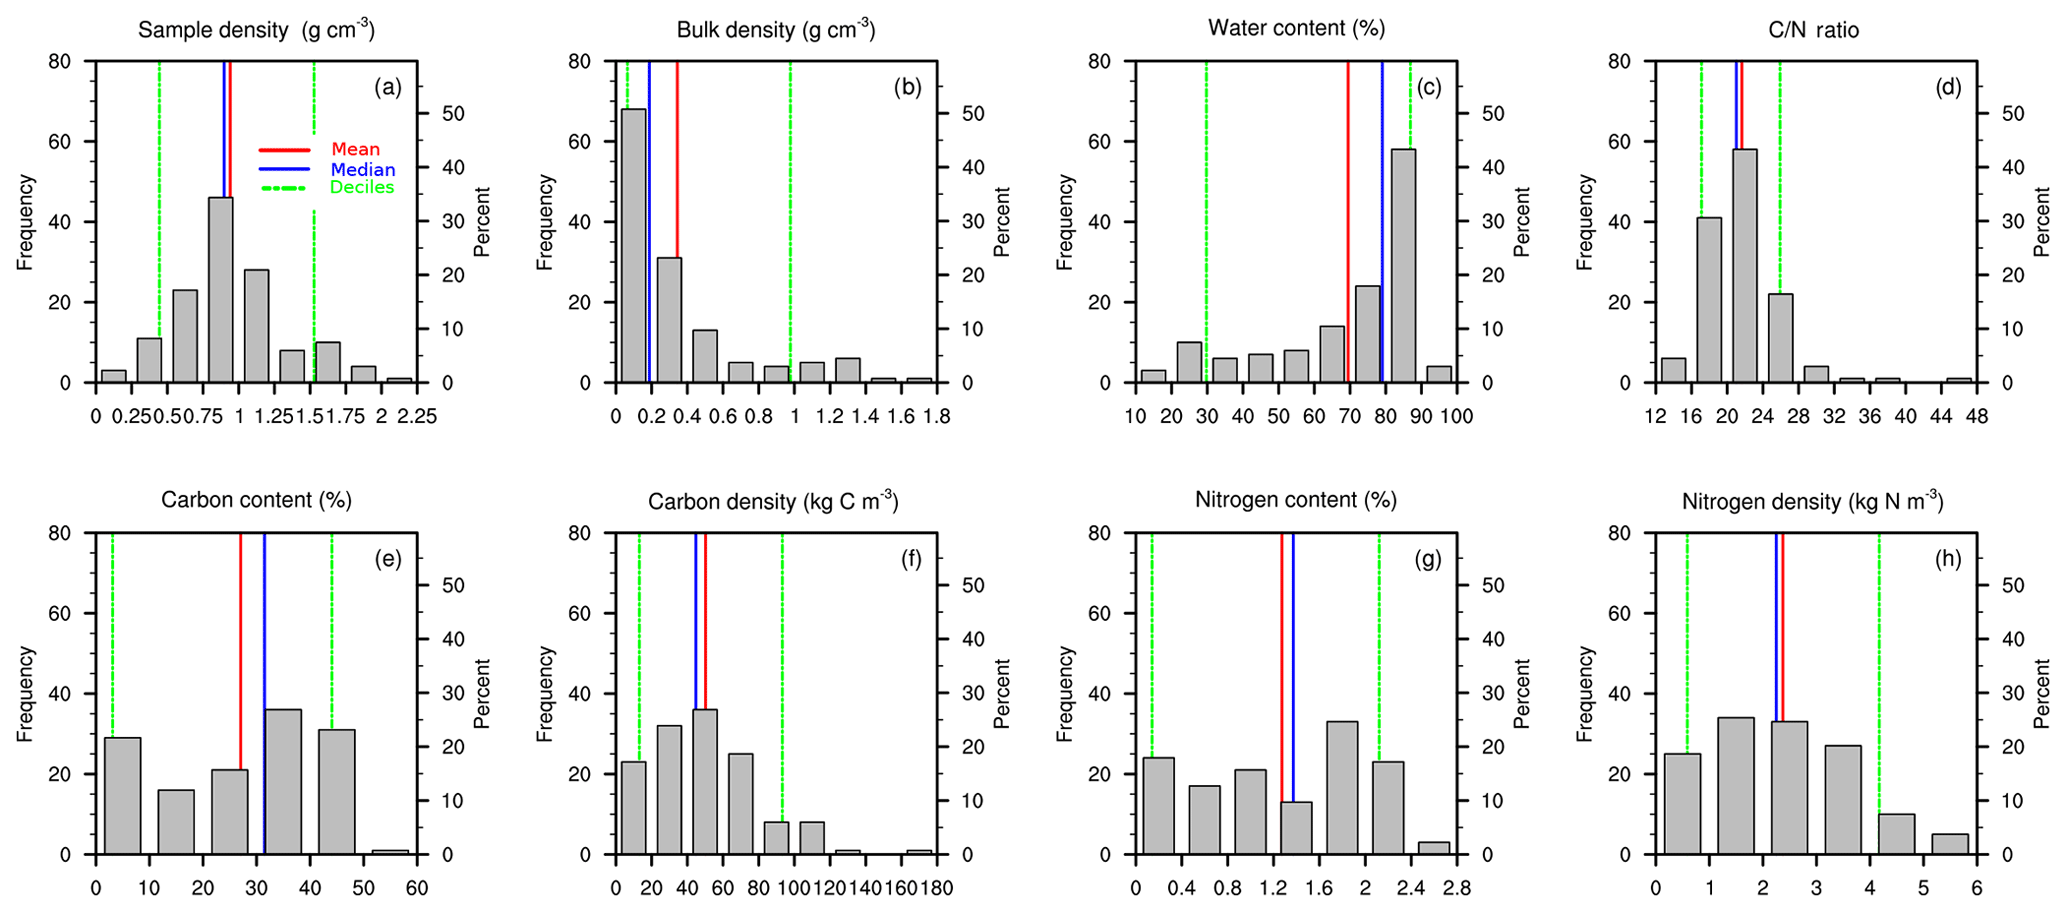
Figure 5Distribution histograms (nsamples=135) of (a) soil sample density ρsample (g cm−3), (b) soil bulk density (g cm−3), (c) soil water content (%), (d) C ∕ N ratio (–), (e) soil carbon content fC (%), (f) soil carbon density ρC (kg C m−3), (g) soil nitrogen content fN (%), and (h) soil nitrogen density ρN (kg N m−3). Red lines represent mean values, blue lines median values, dashed green lines upper and lower deciles.
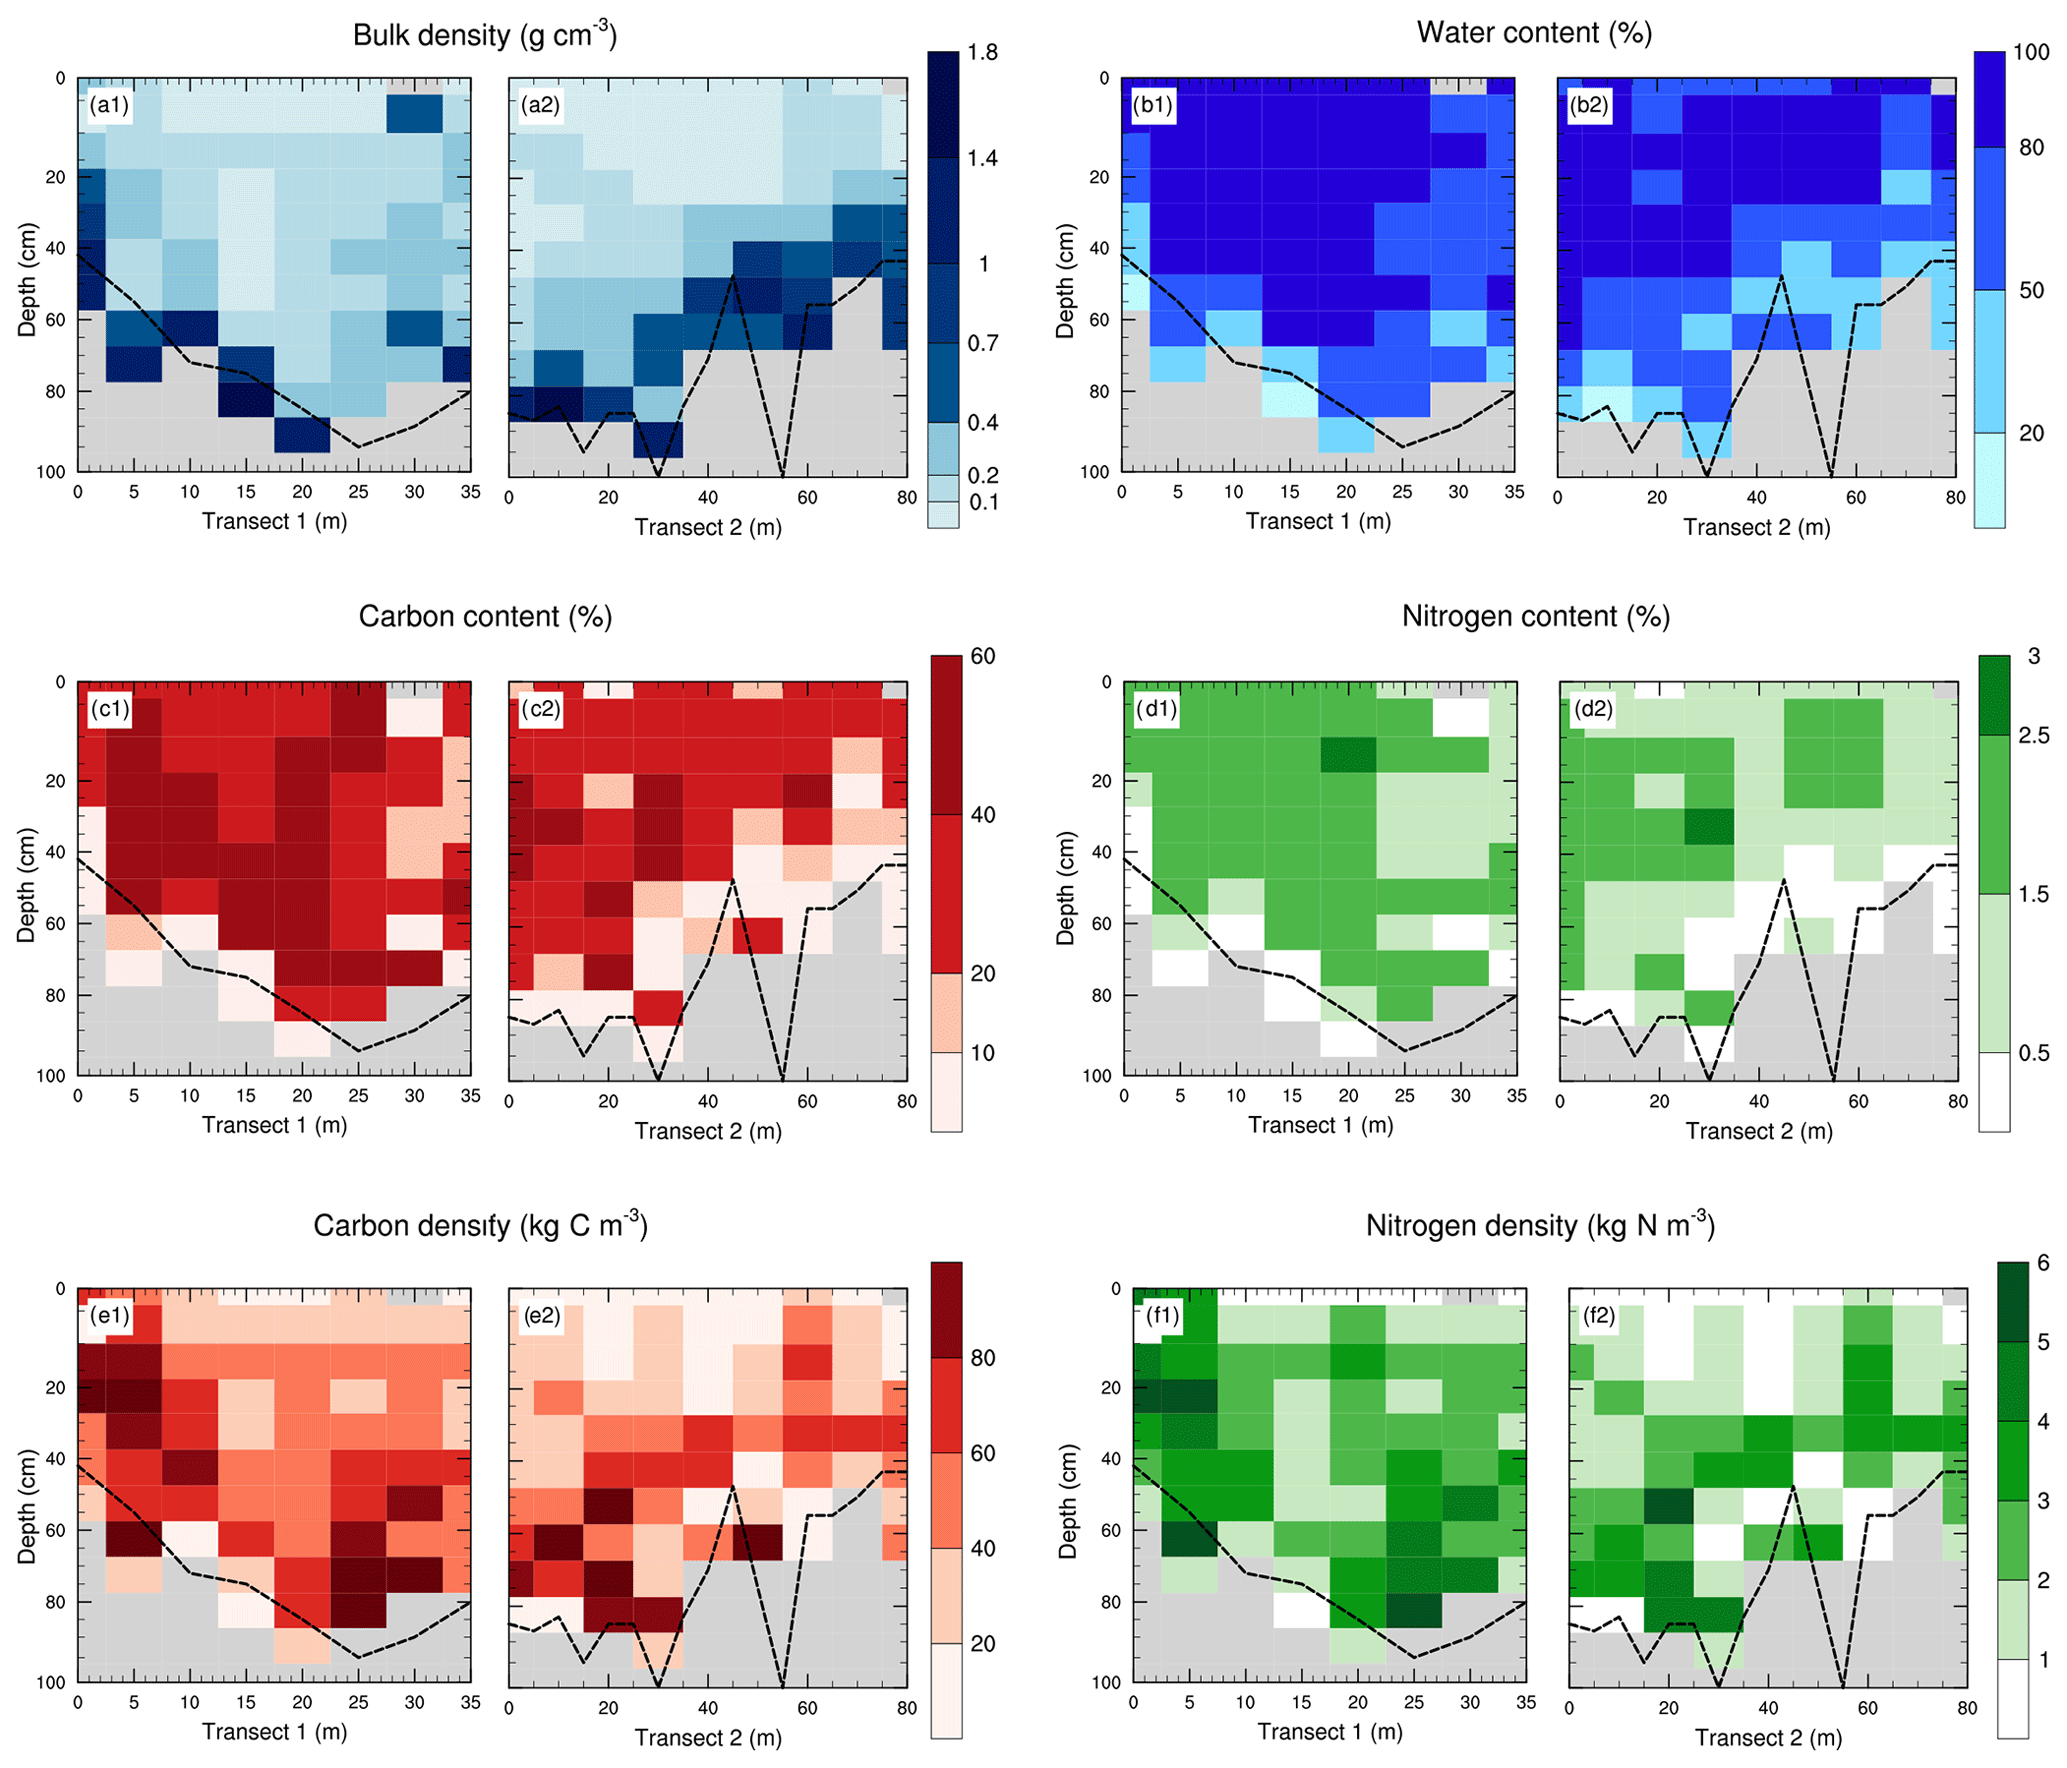
Figure 6Soil profiles of (a) soil bulk density (g cm−3), (b) soil water content (%), (c) soil carbon content fC (%), (d) soil nitrogen content fN (%), (e) soil carbon density ρC (kg C m−3), and (f) soil nitrogen density ρN (kg N m−3) along both transects. The dashed black line represents the measured organic–mineral interface. Grey zones indicate the absence of data (mineral soil).
A total of n=135 samples were collected along both transects (n1=65 and n2=70). For each of these samples, values of mass, volume, density, dry mass, bulk density, carbon and nitrogen content (%), and density (kg m−3) and carbon ∕ nitrogen (C ∕ N) weight ratios were measured and/or calculated. Figure 5 shows distribution histograms for all data, and descriptive statistics (mean, median, upper and lower deciles) are presented in Table 2.
Table 2Data statistics and dispersion (mean, median, lower and upper decile).
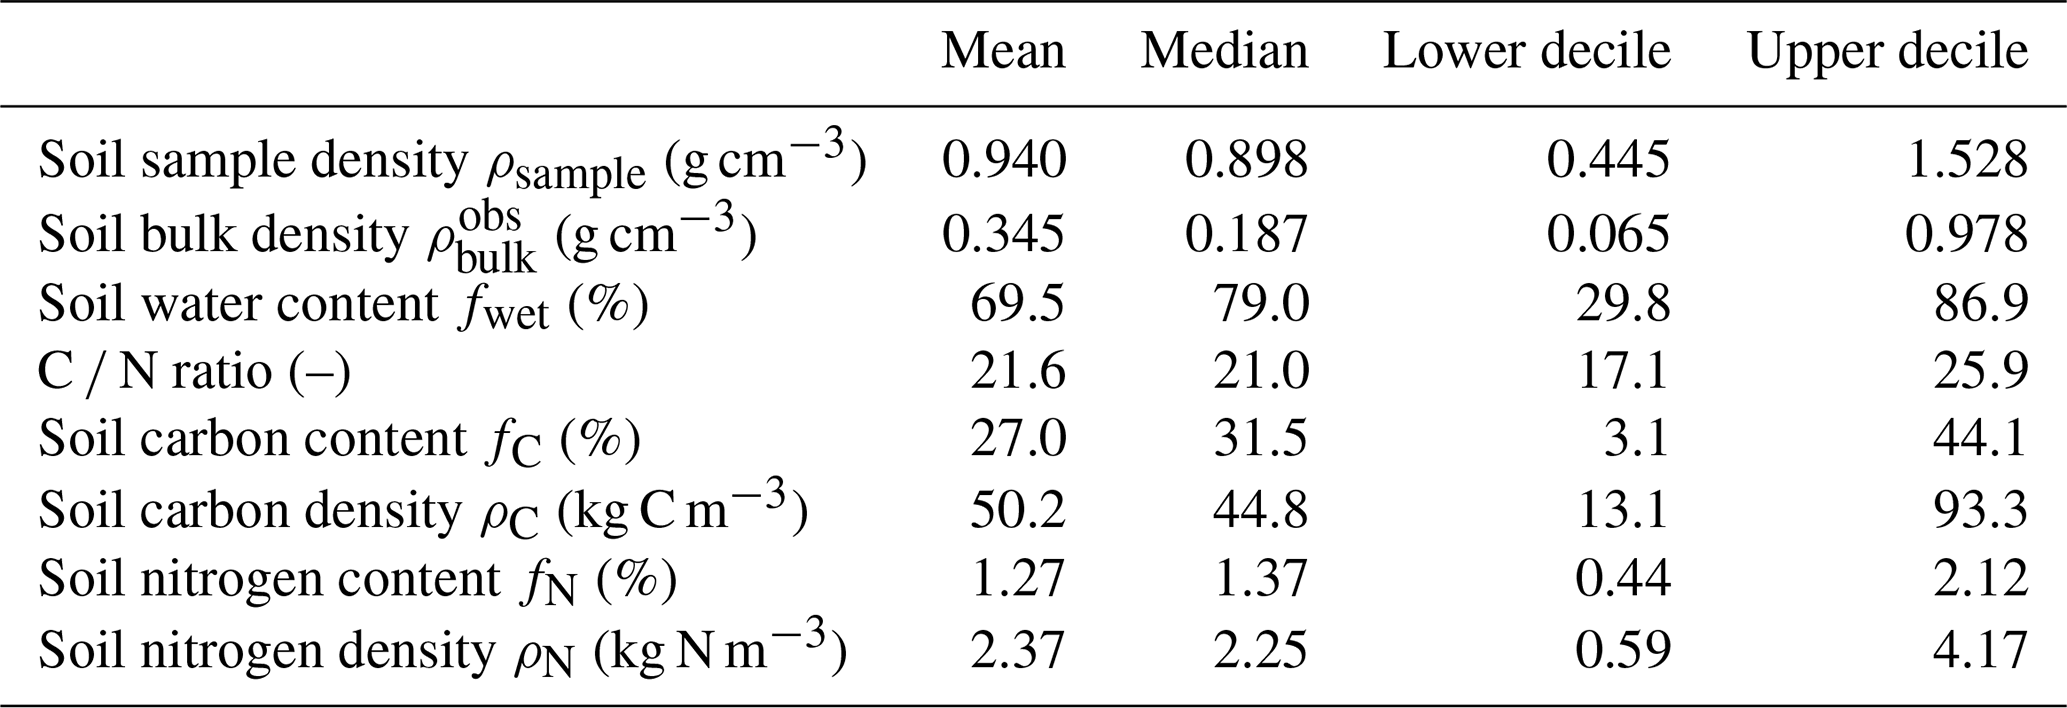
Figure 6 presents soil profiles of bulk density, water mass fraction, carbon and nitrogen content, and density along both transects. These soil profiles (n=17) were averaged over depth for both transects (Fig. 7). As the fen depth showed a substantial variability along the transects, resulting averaged profiles are noisy. For instance, samples extracted at 50 cm depth may be in a purely organic soil horizon or a quasi-mineral one depending on the fen area it was extracted from. Hence, mean soil profiles do not necessarily reflect the vertical distribution of data with respect to the OMI.
To reduce the noise due to the OMI heterogeneity, we renormalized all the data with respect to the OMI. For a sample extracted at a depth z from a peat core with an OMI depth zOMI, we define its normalized distance from OMI dOMI (%) as
These normalized profiles are shown in Fig. 8.
For each peat core, total carbon stocks CT (kg C m−2) were calculated by vertically integrating carbon density profiles using the trapezoidal rule:
with zj the sample depth and the soil carbon density, computed using Eq. (2).
Similarly, total nitrogen stocks NT (kg N m−2) were computed as
with the soil carbon density, computed using Eq. (3).
Note that because of the difficulties setting the manual gouge auger substantially below the OMI, the maximum sampling depth varied between the different peat cores. Hence, the integration depth also varied between peat cores. However, the carbon content below this interface did not exceed 7 % except for two unusual samples (Fig. 9), and we can consider that not taking into account the soil horizons below the OMI did not underestimate the computed total C stocks much. Similarly, nitrogen content below the OMI is much lower than in the organic horizons (Fig. 8), and not taking them into account did not underestimate the computed total N stocks much.
3.4 Calculation of 95 % confidence interval soil profile
The sampling mean most likely follows a normal distribution. Under this hypothesis, for a variable X, the standard error of the mean can be calculated as with N(z) the number of samples collected at a depth (z) and σ(z) the standard deviation over those samples. The confidence interval at 95 % is defined as .
4.1 Bulk density
Variation in bulk density is attributable to the relative proportion of organic and inorganic soil particles and is a reliable indicator of the mineral or organic nature of a soil. More than 50 % of the samples have a bulk density below 0.187 g m−3 (Fig. 5), characteristic of organic-rich material. Samples with bulk density between 0.5 and 1 g cm−3 correspond to mixed organic–mineral material (Loisel et al., 2014). The higher the bulk density, the higher the mineral content. Finally, the 10 % remaining samples with bulk densities higher than 0.978 g cm−3 (Table 2) correspond to the part of the soil with the highest mineral fraction, near or below the OMI, as most mineral soils have bulk densities between 1.0 and 2.0 g cm−3 (Rezanezhad et al., 2016).
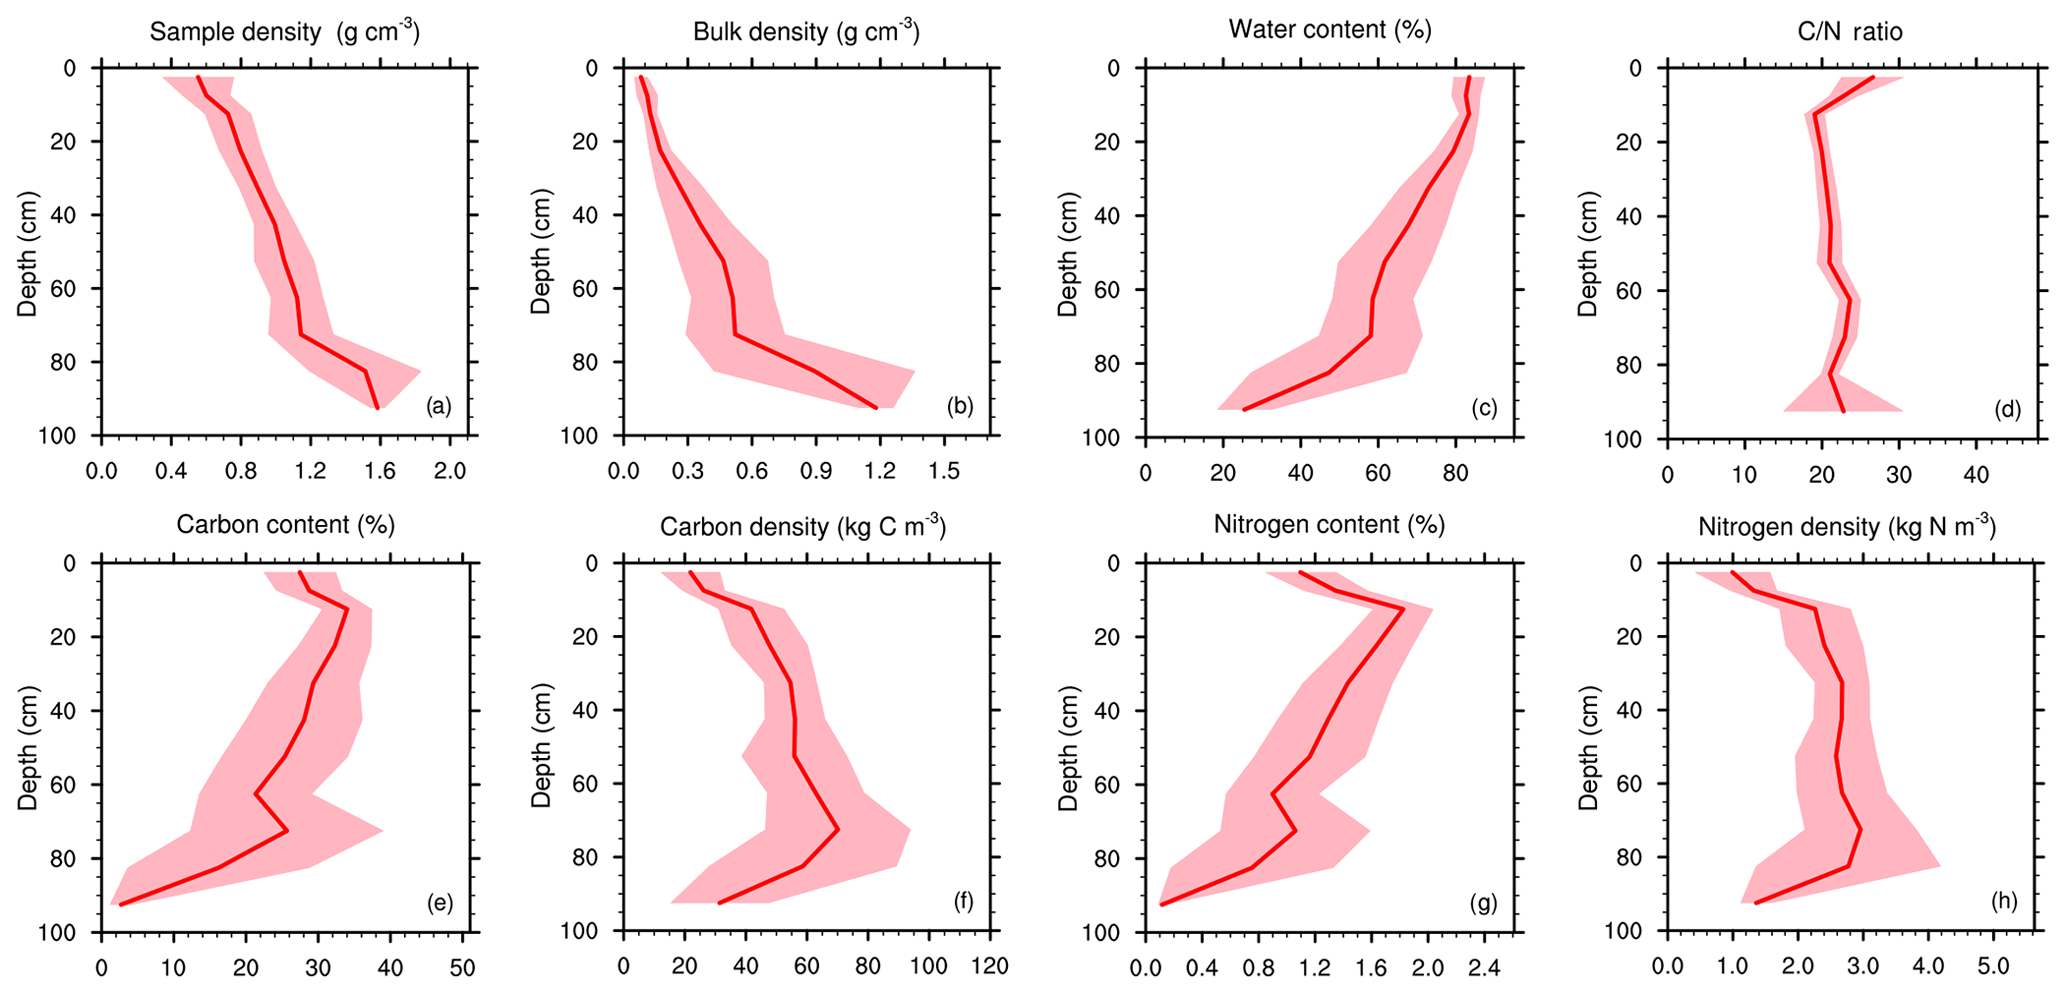
Figure 7Mean soil profiles over both transects (nsamples=135; nprofiles=17) of (a) soil sample density ρsample (g cm−3), (b) soil bulk density (g cm−3), (c) soil water content (%), (d) C ∕ N ratio (–), (e) soil carbon content fC (%), (f) soil carbon density ρC (kg C m−3), (g) soil nitrogen content fN (%), and (h) soil nitrogen density ρN (kg N m−3). The shaded area represents the 95 % confidence interval.
Strong vertical gradients in bulk density could be seen throughout both transects (Fig. 6a). The measured OMI depth delimited the transition between organic and mineral material well, as expected.
Typical bulk density profiles in peatlands tend to show a gradual increase with depth (Quinton et al., 2000): as peat decomposition reduces the proportion of large pores by breaking down plant debris into smaller fragments (Rezanezhad et al., 2016), it increases the mass of dry material per volume of peat. Normalized mean profiles of bulk density (Fig. 8b) clearly show this abrupt transition from mixed organic–mineral material to pure mineral soil below the OMI.
4.2 Carbon mass percentage
Mass percentage of carbon reached 50 % (Fig. 6c), which is coherent with the data given in the review of Yu (2012) on northern peatland carbon stocks.
As expected, concentration of soil organic carbon in the organic layer was much higher than in the mineral horizons. High carbon content in the depth of the first transect seemed to indicate a carbon burial in the natural accumulation basin. We also note that the limit between the soil horizons with high and low carbon content also follows the OMI. In particular, the drop of the sedimentary layer in the first transect is clearly visible and the variations in the mineral layer of the second transect between T2–30 and T2–60 as well. Normalized mean carbon content profiles (Fig. 8e) clearly showed the abrupt decrease in carbon content near the OMI. Below the OMI, carbon content values were below 10 %, which is coherent with the mineral characteristics of the soil horizons below.
4.3 Soil carbon density and soil carbon profiles
More than 70 % of the soil samples had soil carbon densities comprised between 20 and 80 kg C m−3 (Fig. 5f). Those values are coherent with those encountered in other arctic and boreal fen and peatlands (see Chadburn et al., 2017, Fig. 5). Mean local maximum of soil carbon density reached values up to 80 kg m−3 at 80 cm depth (Fig. 7f).
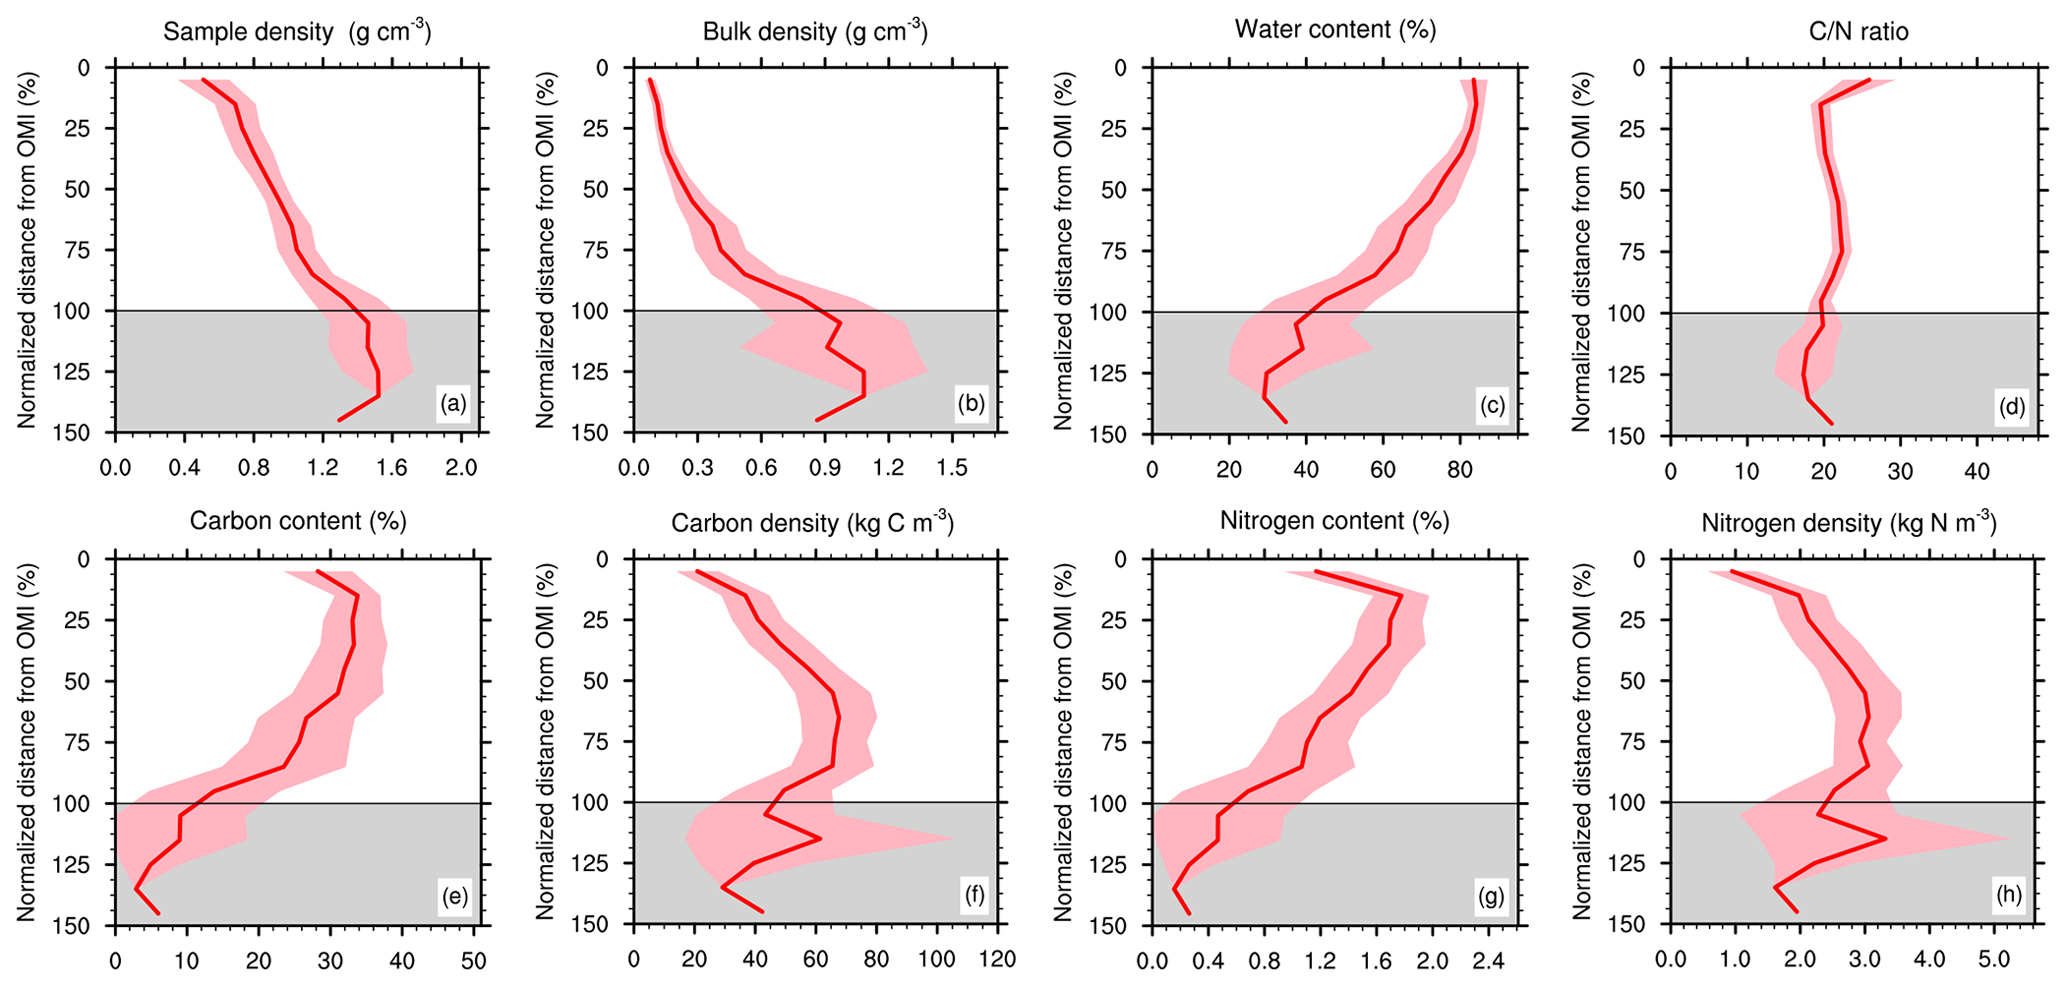
Figure 8Same as Fig. 7, except profile depths are re-normalized from the organic–mineral interface. The grey area represents the zone below the OMI.
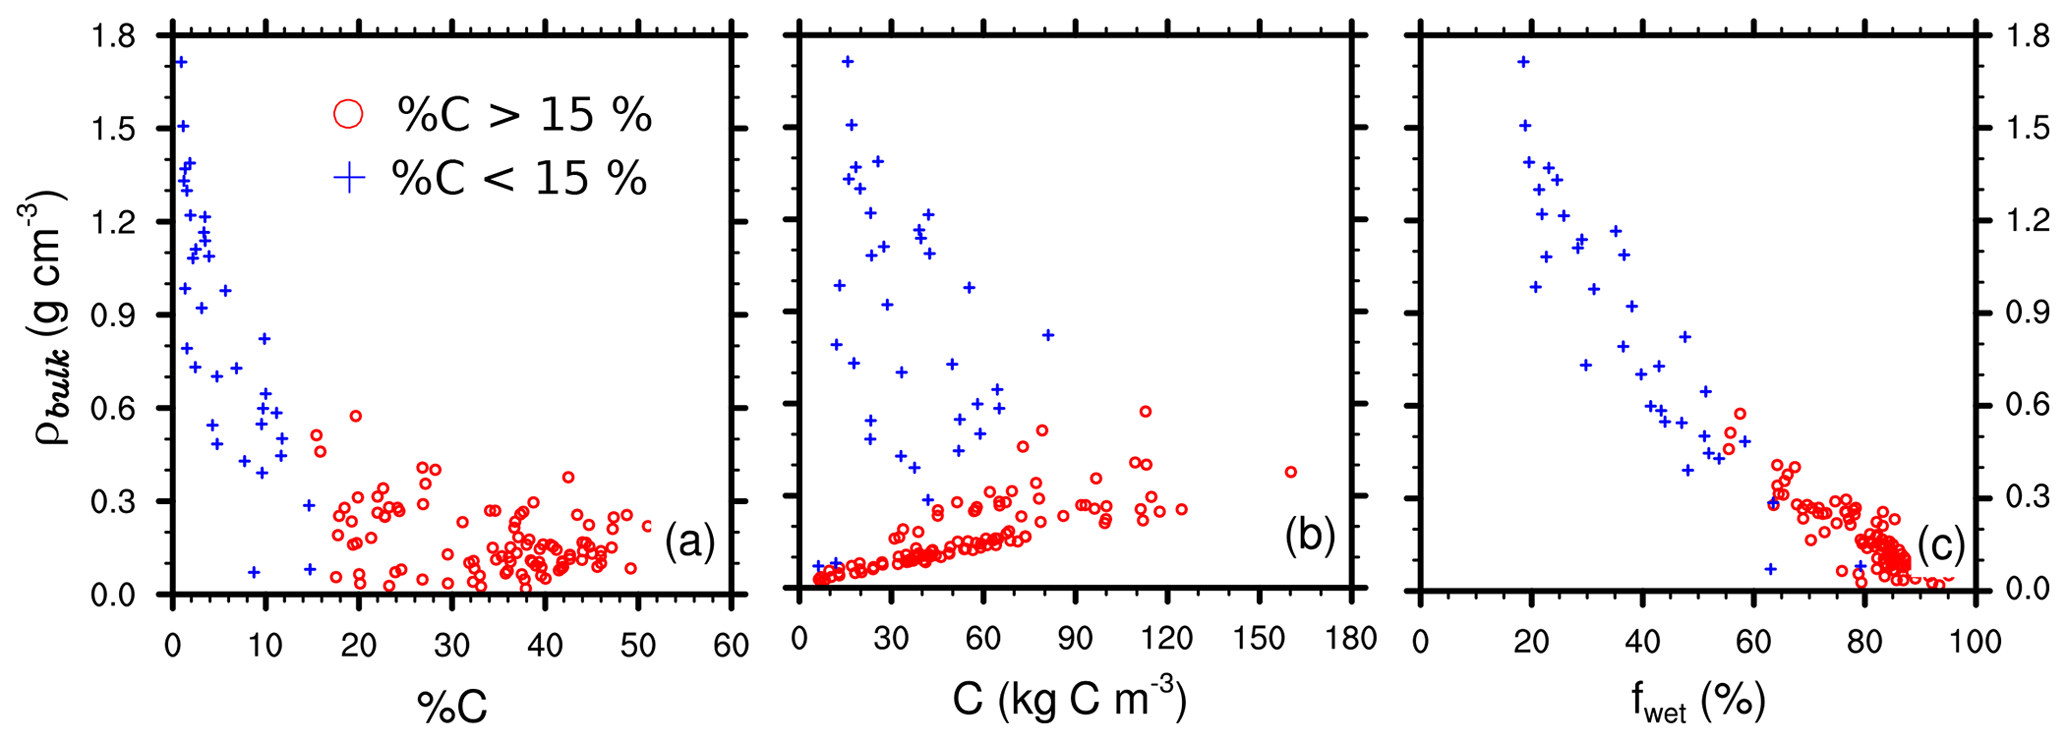
Figure 9Scatter plots of soil bulk density versus (a) soil carbon content fC (%), (b) soil carbon density ρC (kg C m−3), and (c) soil water content (%) for the 135 samples. Red circles represent samples with carbon content exceeding 15 % and blue crosses less than 15 %.
As expected, soil carbon density matched the measured organic–mineral interface well (Fig. 6.e1). The assumed carbon accumulation in the accumulation basin of the fen discussed in the previous section is confirmed, as a local maximum of soil carbon density was clearly visible at the bottom of the soil plots T1–25 and T2–30 (Fig. 6a1).
Mean soil carbon density profiles were non-monotonous. In the organic horizons, soil organic content (SOC) density increased with depth and reached its local maximum between 60 and 80 % of the organic–mineral interface depth (Fig. 8f). Near the OMI, coherent with the abrupt decrease in carbon content and increase in bulk density discussed in the previous sections, the soil carbon density decreased. Soil carbon density profiles that first increased and then decreased with depth are characteristic of arctic and boreal fens (see Chadburn et al., 2017, Fig. 5).
4.4 Integrated soil carbon stocks
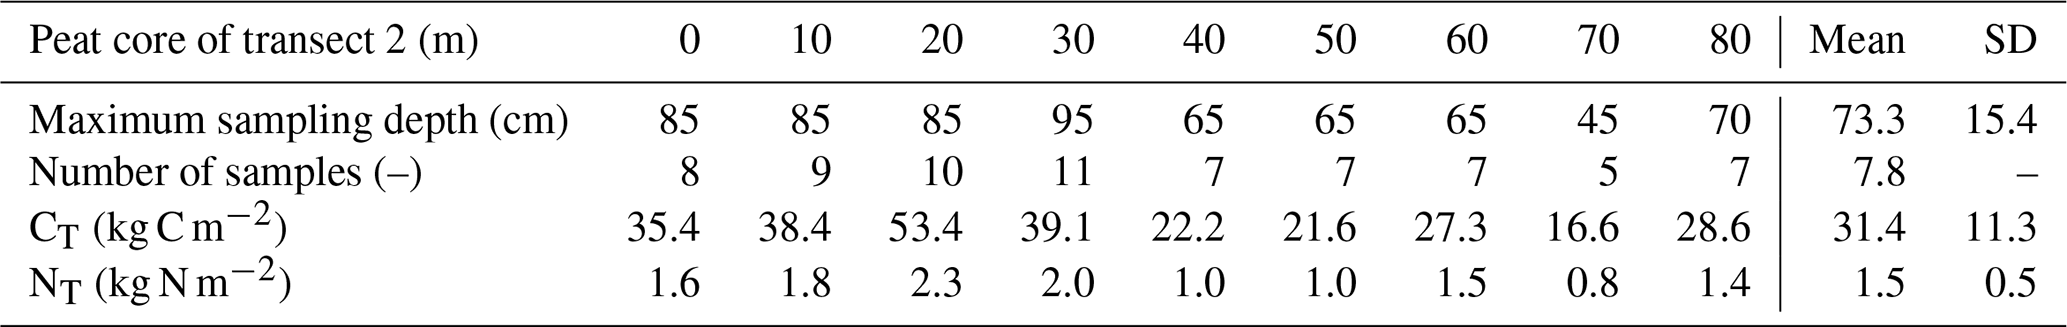
Tables 3 and 4 present the carbon stocks and the maximum sampling depth for each peat core along both transects. Mean carbon stocks over both transects were 36.3 kg C m−2. The review of Yu (2012) on high-latitude fens and peatlands reports integrated soil carbon stock values between 58.7 and 73.4 kg C m−2, except one extraordinary value of 113.6 kg C m−2. Those values are higher than those found in Nuuk. But they were computed by considering a fen depth of 1 m, which was not the case here, as the Nuuk fen is quite shallow: the mean sampling depth – which was often deeper than the OMI – did not exceed 76.3 cm in both transects (Tables 3 and 4). Hence, the results of our soil carbon stock measurements were then coherent and consistent with current estimates from similar ecosystems.
Finally, a basic estimate of total soil carbon content over the whole fen area is given by multiplying the mean soil carbon mass per unit surface (36.3 kg C m−2) by a rough estimate of the fen area (approx. 7500 m2; see Fig. S2). This gives a total carbon storage in the fen of 272 250 kg C.
Table 3Carbon and nitrogen stocks from peat cores along the first transect.
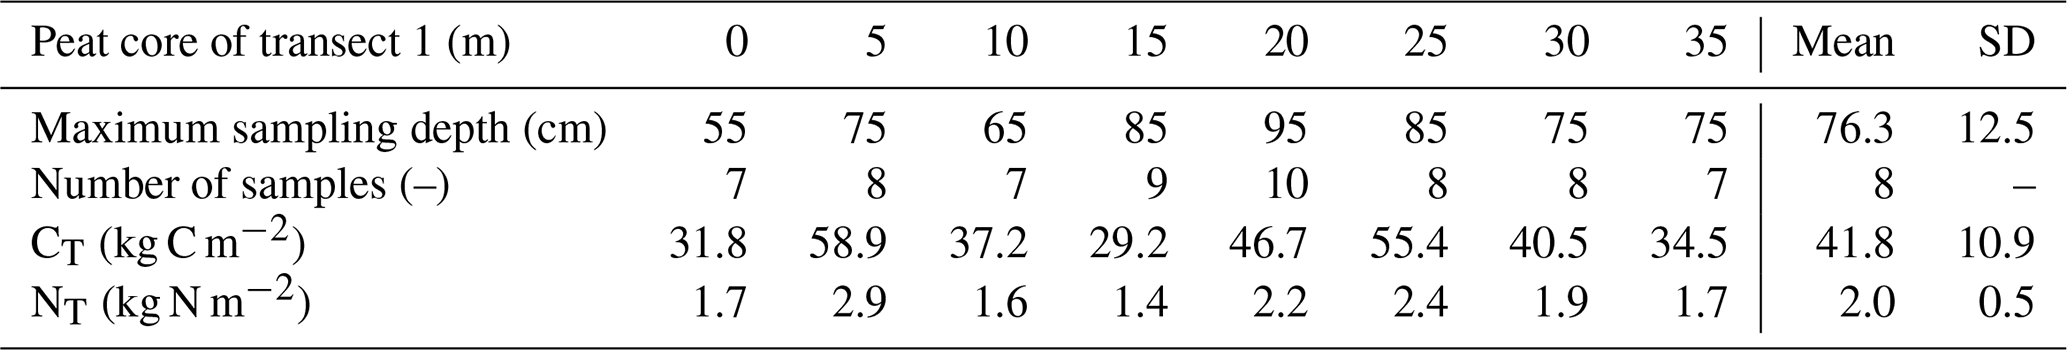
Table 4Carbon and nitrogen stocks from peat cores along the second transect.
4.5 Soil nitrogen density and soil nitrogen profiles
More than 70 % of the soil samples had soil nitrogen densities between 1 and 4 kg N m−3 (Fig. 5h), with a mean value of 2.37 kg N m−3. The lowest values of N mass indicated the OMI (Fig. 6d). A local maximum of soil N density was clearly visible at the bottom of the soil plots T1–25 and T2–20 (Fig. 6a1), indicating that nutrients tend to accumulate in the fen basin.
Soil N profiles closely follow the soil C profiles (Fig. 7f, h), indicating a quite uniform C ∕ N ratio through the soil profile (see Sect. 4.7).
4.6 Integrated soil nitrogen stocks
Nitrogen stocks range from 0.8 to 2.9 kg N m−2, with a mean value of 1.7 kg N m−2 (Tables 3 and 4). This is very similar to the 1.9±0.7 kg N m−2 value obtained by Palmtag et al. (2018) (Table 2) for the fens on alluvial fans in the Zackenberg valley, to our knowledge the only available in situ N data for Greenland peatlands. In a broader Arctic context, these values are in the same range of terrestrial deposits on the Alaskan Beaufort Sea coast with 1.9 kg N m−2 (0–100 cm; Ping et al., 2011) and slightly higher than an estimation for Arctic Alaska soils with 2.7 kg N m−2 (0–100 cm; Michaelson et al., 2013).
A basic estimate of total soil nitrogen storage for the whole fen area is given by multiplying the mean soil nitrogen mass per unit surface (1.7 kg N m−2) by a rough estimate of the fen area (approx. 7500 m2; see Fig. S2). This gives a total nitrogen storage in the fen of 12 882 kg N.
Hossain et al. (2015)Table 5Statistical scores for different regressions between bulk density ρbulk and carbon content fC.

1
2 c-RMSE =
3 mae =
4 bias =
4.7 C ∕ N ratios
Carbon∕nitrogen (C ∕ N) weight ratios can give useful information about the nutrient content and the quality and humification degree of organic matter: a low C ∕ N ratio is usually equivalent to a high humification level. With a mean value of 21.6, observed C ∕ N ratios were in the range of those observed from a variety of field and laboratory studies (Bridgham et al., 1998; Rezanezhad et al., 2016; Wang et al., 2015).
C ∕ N ratios were higher in the first few centimeters of depth (approx. 25 %), potentially indicating less microbial transformation of the peat in the upper layers (Kuhry and Vitt, 1996). At greater depth of the fen, C ∕ N ratios were lower because microorganisms slowly consume the carbon and recirculate the nitrogen, resulting in a gradual reduction of C ∕ N values (Rydin and Jeglum, 2013). In northern regions, due to colder temperatures, the decomposition activity is slow, explaining the small difference between maximal and minimal C ∕ N values. The C ∕ N profiles remained relatively stable throughout the depth (21.6 %), and the OMI did not seem to distinguish separate zones.
Although bulk density and C ∕ N ratios are reliable indicator for peat degradation, the lack of ash content data and isotopic measurements did not allow a quantification of carbon accumulation rate or carbon loss in the peatland (Krüger et al., 2015).
4.8 Discussion
Overall, this new dataset of soil bulk density, carbon and nitrogen content, profiles, and stocks from Nuuk fen was in the range of previous estimates of northern and Arctic wetlands (Yu, 2012; Loisel et al., 2014; Chimner et al., 2014).
As noted by Loisel et al. (2014), the accuracy of this type of measurement mostly depends on sample handling, in particular the care taken to avoid any peat compaction. Our sample density measurements may have been uncertain. On the other hand, mass carbon percentages are independent of any uncertainties or hazards in sample handling. It is known that soil carbon content and bulk density are strongly correlated. For instance, Hossain et al. (2015) noted that bulk density and carbon content fC follow an exponential relationship:
with a=1.5641 and b=0.0631.
We find a similar exponential behavior (Fig. 9a) between bulk density and carbon content with a strong correlation between our measured bulk density and Hossein’s exponential (r2=0.801, Table 5). Different types of two-parameter regressions could also be used to infer bulk densities from carbon content, as shown in Table 5. Soil carbon density profiles can hence be computed with two different methods: a “direct” method, using bulk density data (see Eq. 2), and an “indirect” method by computing bulk density using carbon content via one of these functional fits. This comparison shows that our measurements of bulk densities were at the right order of magnitude. But these relationships cannot capture the vertical variability of the observed soil carbon profiles. Mass percentage of carbon fC (% C) does not encapsulate all the causes of the variability of ρbulk. Consequently, inferred carbon profiles from indirect methods were deceptively flat and smooth (see Fig. S1). Hence, although testing whether bulk density and soil carbon content measurements follow this type of relationship provides a good indicator of the dataset quality, it is not recommended to infer soil carbon profiles from these empirical relationships.
Loisel et al. (2014) choose an arbitrary cutoff value of 0.5 g cm−3 to distinguish peat and non-peat material. It also roughly corresponds to the separation between samples with carbon content exceeding 15 % and the others (Fig. 9a–c). Below this threshold (i.e. for fully organic samples), there was a linear relationship between bulk density ρbulk and soil carbon density ρC (Fig. 9b), indicating a rather homogeneous soil carbon content fC for organic samples. For mixed-material and mineral samples, such a relationship is not true.
The well-known high water retention capacity of peat soils (e.g. Boelter, 1969) was also observed here (Fig. 9c) as the higher values of soil water content were found in the samples with the highest carbon content and lowest bulk density.
Finally, when using these data for performing a detailed one-dimensional evaluation of the litter and soil carbon together with the CO2 and CH4 emissions simulated by a land-surface model, it is best to use the soil carbon data corresponding to the automatic chambers area, that is the profiles from plots T1–0 to T1–20.
All the data used to produce the tables and figures of the paper are freely available in the repository: https://doi.org/10.1594/PANGAEA.909899 (Morel et al., 2019b).
In this paper, we have provided a complete description of a new dataset of the current distribution of soil organic carbon and nitrogen storage at the Nuuk peatland. This dataset is one of the very few on Greenland fens and will help in better understanding these poorly documented ecosystems. All data are in the range of the existing Arctic and low-Arctic fen studies. All data are in the range of previous studies. Automatic chamber flux measurements and carbon sampling are being recorded at the same location, making the Nuuk fen dataset an ideal candidate for evaluating the accuracy of land-surface model simulations of both soil carbon profiles and greenhouse gas emissions.
In the near future it will allow a complete evaluation of the biogeochemical model presented in Morel et al. (2019a). Completing this evaluation could help eventually resolve issues concerning biogeochemical models that model both soil carbon stocks/profiles and soil greenhouse gas fluxes raised by Chadburn et al. (2017). It could also be used to further validate recent developments in carbon and/or peatland modules for larger-scale studies, such as the specific peatland module developed by Largeron et al. (2018) or the soil carbon representation specific to fen and peatlands of Qiu et al. (2018).
The supplement related to this article is available online at: https://doi.org/10.5194/essd-12-2365-2020-supplement.
XM, BUH, MM, CD and BD designed the field campaign. XM and BUH conducted the fieldwork and collected and prepared the samples for analysis. PA conducted the laboratory analysis. XM, CD and BD designed the manuscript. All authors contributed to the writing.
The authors declare that they have no conflict of interest.
This work was supported by the Acceleration of Permafrost Thaw (APT) project through the BNP Paribas Foundation, grant 2014-00000004300. This work was also supported by the H2020 project CRESCENDO “Coordinated Research in Earth Systems and Climate: Experiments, kNowledge, Dissemation and Outreach”, which received funding from the European Union's Horizon 2020 Research and Innovation program under grant agreement 641816. The Institut Français du Danemark (AFD) supported this work through the grant 15/2017/CSU8.2.1. Finally, the authors want to thank Michael Coe for revising and correcting significant portions of the text.
This research has been supported by the Acceleration of Permafrost Thaw (APT) – BNP Paribas Foundation (grant no. 2014-00000004300), the CRESCENDO “Coordinated Research in Earth Systems and Climate: Experiments, kNowledge, Dissemation and Outreach” – European Union's Horizon 2020 Research and Innovation program (grant no. 641816), and the Institut Français du Danemark (AFD) (grant no. 15/2017/CSU8.2.1).
This paper was edited by Giulio G. R. Iovine and reviewed by eight anonymous referees.
Barthelmes, A., Couwenberg, J., Risager, M., Tegetmeyer, C., and Joosten, H.: Peatlands and Climate in a Ramsar context: A Nordic-Baltic Perspective, Nordisk Ministerråd, 245 pp., https://doi.org/10.6027/TN2015-544, 2015. a
Boelter, D. H.: Physical Properties of Peats as Related to Degree of Decomposition, Soil Sci. Soc. Am. J., 33, 606–609, https://doi.org/10.2136/sssaj1969.03615995003300040033x, 1969. a, b
Bridgham, S., Updegraff, K., and Pastor, J.: Carbon, Nitrogen, and Phosphorus Mineralization in Northern Wetlands, Ecology, 79, 1545–1561, https://doi.org/10.1890/0012-9658(1998)079[1545:CNAPMI]2.0.CO;2, 1998. a
Chadburn, S. E., Krinner, G., Porada, P., Bartsch, A., Beer, C., Belelli Marchesini, L., Boike, J., Ekici, A., Elberling, B., Friborg, T., Hugelius, G., Johansson, M., Kuhry, P., Kutzbach, L., Langer, M., Lund, M., Parmentier, F.-J. W., Peng, S., Van Huissteden, K., Wang, T., Westermann, S., Zhu, D., and Burke, E. J.: Carbon stocks and fluxes in the high latitudes: using site-level data to evaluate Earth system models, Biogeosciences, 14, 5143–5169, https://doi.org/10.5194/bg-14-5143-2017, 2017. a, b, c, d, e, f, g, h
Chambers, F., Beilman, D., and Yu, Z.: Methods for determining peat humification and for quantifying peat bulk density, organic matter and carbon content for palaeostudies of climate and peatland carbon dynamics, Mires and Peat, 7, 1–10, 2010. a
Chimner, R. A., Ott, C. A., Perry, C. H., and Kolka, R. K.: Developing and Evaluating Rapid Field Methods to Estimate Peat Carbon, Wetlands, 34, 1241–1246, https://doi.org/10.1007/s13157-014-0574-6, 2014. a
Djukic, I., Kepfer-Rojas, S., Schmidt, I. K., Larsen, K. S., Beier, C., Berg, B., Verheyen, K., and TeaComposition: Early stage litter decomposition across biomes, Sci. Total Environ., 628–629, 1369–1394, https://doi.org/10.1016/j.scitotenv.2018.01.012, 2018. a
Elberling, B., Christiansen, H., and Hansen, B.: High nitrous oxide production from thawing permafrost, Nat. Geosci., 3, 506, https://doi.org/10.1038/ngeo893, 2010. a
FAO, ISRIC, ISSCAS, and JRC: Harmonized World Soil Database (version 1.2), FAO, Rome, Italy and IIASA, Laxenburg, Austria, available at: http://webarchive.iiasa.ac.at/Research/LUC/External-World-soil-database/HTML/ (last access: 29 September 2020), 2012. a
Friedlingstein, P., Jones, M. W., O'Sullivan, M., Andrew, R. M., Hauck, J., Peters, G. P., Peters, W., Pongratz, J., Sitch, S., Le Quéré, C., Bakker, D. C. E., Canadell, J. G., Ciais, P., Jackson, R. B., Anthoni, P., Barbero, L., Bastos, A., Bastrikov, V., Becker, M., Bopp, L., Buitenhuis, E., Chandra, N., Chevallier, F., Chini, L. P., Currie, K. I., Feely, R. A., Gehlen, M., Gilfillan, D., Gkritzalis, T., Goll, D. S., Gruber, N., Gutekunst, S., Harris, I., Haverd, V., Houghton, R. A., Hurtt, G., Ilyina, T., Jain, A. K., Joetzjer, E., Kaplan, J. O., Kato, E., Klein Goldewijk, K., Korsbakken, J. I., Landschützer, P., Lauvset, S. K., Lefèvre, N., Lenton, A., Lienert, S., Lombardozzi, D., Marland, G., McGuire, P. C., Melton, J. R., Metzl, N., Munro, D. R., Nabel, J. E. M. S., Nakaoka, S.-I., Neill, C., Omar, A. M., Ono, T., Peregon, A., Pierrot, D., Poulter, B., Rehder, G., Resplandy, L., Robertson, E., Rödenbeck, C., Séférian, R., Schwinger, J., Smith, N., Tans, P. P., Tian, H., Tilbrook, B., Tubiello, F. N., van der Werf, G. R., Wiltshire, A. J., and Zaehle, S.: Global Carbon Budget 2019, Earth Syst. Sci. Data, 11, 1783–1838, https://doi.org/10.5194/essd-11-1783-2019, 2019. a
Gallego-Sala, A., Charman, D., Brewer, S., E. Page, S., Prentice, I., Friedlingstein, P., Moreton, S., J. Amesbury, M., W. Beilman, D., Björck, S., Blyakharchuk, T., Bochicchio, C., K. Booth, R., Bunbury, J., Camill, P., Carless, D., Chimner, R., Clifford, M., Cressey, E., and Zhao, Y.: Latitudinal limits to the predicted increase of the peatland carbon sink with warming, Nat. Clim. Change, 8, 907–913, https://doi.org/10.1038/s41558-018-0271-1, 2018. a
Geng, M. S., Christensen, J. H., and Christensen, T. R.: Potential future methane emission hot spots in Greenland, Environ. Res. Lett., 14, 035001, https://doi.org/10.1088/1748-9326/aaf34b, 2019. a
Glooschenko, W., Tarnocai, C., Zoltai, S., and Glooschenko, V.: Wetlands of Canada and Greenland, in: Wetlands of the world: inventory, ecology and management, chap. Wetlands of Canada and Greenland, Kluwer Academic Publishers, Dordrecht, The Netherlands, handbook of vegetation science 15/2 edn., 415–514, 1993. a
Gorham, E.: Northern Peatlands: Role in the Carbon Cycle and Probable Responses to Climatic Warming, Ecol. Appl., 1, 182–195, available at: http://www.jstor.org/stable/1941811, 1991. a
Harenda, K., Lamentowicz, M., Samson, M., and Chojnicki, B.: The Role of Peatlands and Their Carbon Storage Function in the Context of Climate Change, 169–187, Springer International Publishing, https://doi.org/10.1007/978-3-319-71788-3_12, 2018. a
Horwath Burnham, J. and Sletten, R.: Spatial distribution of soil organic carbon in northwest Greenland and underestimates of High Arctic carbon stores, Global Biogeochem. Cy., 24, GB3026, https://doi.org/10.1029/2010gb003933, 2010. a
Hossain, M., Chen, W., and Zhang, Y.: Bulk density of mineral and organic soils in the Canada’s arctic and sub-arctic, Inf. Process. Agr., 2, 183–190, https://doi.org/10.1016/j.inpa.2015.09.001, 2015. a, b, c
Hugelius, G., Tarnocai, C., Broll, G., Canadell, J. G., Kuhry, P., and Swanson, D. K.: The Northern Circumpolar Soil Carbon Database: spatially distributed datasets of soil coverage and soil carbon storage in the northern permafrost regions, Earth Syst. Sci. Data, 5, 3–13, https://doi.org/10.5194/essd-5-3-2013, 2013. a
Jammet, M., Dengel, S., Kettner, E., Parmentier, F.-J. W., Wik, M., Crill, P., and Friborg, T.: Year-round CH4 and CO2 flux dynamics in two contrasting freshwater ecosystems of the subarctic, Biogeosciences, 14, 5189–5216, https://doi.org/10.5194/bg-14-5189-2017, 2017. a
Jungkunst, H. F., Krüger, J. P., Heitkamp, F., Erasmi, S., Fiedler, S., Glatzel, S., and Lal, R.: Accounting More Precisely for Peat and Other Soil Carbon Resources, Springer Netherlands, Dordrecht, 127–157, https://doi.org/10.1007/978-94-007-4159-1_7, 2012. a
Karami, M., Westergaard-Nielsen, A., Normand, S., Treier, U. A., Elberling, B., and Hansen, B. U.: A phenology-based approach to the classification of Arctic tundra ecosystems in Greenland, ISPRS J. Photogramm., 146, 518–529, https://doi.org/10.1016/j.isprsjprs.2018.11.005, 2018. a, b
Kicklighter, D., Melillo, J., Monier, E., Sokolov, A., and Zhuang, Q.: Future nitrogen availability and its effect on carbon sequestration in Northern Eurasia, Nat. Commun., 10, 3024, https://doi.org/10.1038/s41467-019-10944-0, 2019. a
Krüger, J. P., Leifeld, J., Glatzel, S., Szidat, S., and Alewell, C.: Biogeochemical indicators of peatland degradation – a case study of a temperate bog in northern Germany, Biogeosciences, 12, 2861–2871, https://doi.org/10.5194/bg-12-2861-2015, 2015. a
Kuhry, P. and Vitt, D.: Fossil Carbon/Nitrogen Ratios as a Measure of Peat Decomposition, Ecology, 77, 271–275, https://doi.org/10.2307/2265676, 1996. a
Largeron, C., Krinner, G., Ciais, P., and Brutel-Vuilmet, C.: Implementing northern peatlands in a global land surface model: description and evaluation in the ORCHIDEE high-latitude version model (ORC-HL-PEAT), Geosci. Model Dev., 11, 3279–3297, https://doi.org/10.5194/gmd-11-3279-2018, 2018. a
Larsen, N. K., Strunk, A., Levy, L. B., Olsen, J., Bjørk, A., Lauridsen, T. L., Jeppesen, E., and Davidson, T. A.: Strong altitudinal control on the response of local glaciers to Holocene climate change in southwest Greenland, Quatern. Sci. Rev., 168, 69–78, https://doi.org/10.1016/j.quascirev.2017.05.008, 2017. a, b
Leifeld, J. and Menichetti, L.: The underappreciated potential of peatlands in global climate change mitigation strategies, Nat. Commun., 9, 1071, https://doi.org/10.1038/s41467-018-03406-6, 2018. a
Limpens, J., Berendse, F., Blodau, C., Canadell, J. G., Freeman, C., Holden, J., Roulet, N., Rydin, H., and Schaepman-Strub, G.: Peatlands and the carbon cycle: from local processes to global implications – a synthesis, Biogeosciences, 5, 1475–1491, https://doi.org/10.5194/bg-5-1475-2008, 2008. a
Loisel, J., Yu, Z., Beilman, D., Camill, P., Alm, J., J Amesbury, M., Anderson, D., Andersson, S., Bochicchio, C., Barber, K., Belyea, L., Bunbury, J., Chambers, F., Charman, D., Vleeschouwer, F., Fiałkiewicz-kozieł, B., Finkelstein, S., Gałka, M., Garneau, M., and Zhou, W.: A database and synthesis of northern peatland soil properties and Holocene carbon and nitrogen accumulation, The Holocene, 24, 1028–1042, https://doi.org/10.1177/0959683614538073, 2014. a, b, c, d, e
Luan, J., Wu, J., Liu, S., Roulet, N., and Wang, M.: Soil nitrogen determines greenhouse gas emissions from northern peatlands under concurrent warming and vegetation shifting, Communications Biology, 2, 132, https://doi.org/10.1038/s42003-019-0370-1, 2019. a
Lüers, J., Westermann, S., Piel, K., and Boike, J.: Annual CO2 budget and seasonal CO2 exchange signals at a high Arctic permafrost site on Spitsbergen, Svalbard archipelago, Biogeosciences, 11, 6307–6322, https://doi.org/10.5194/bg-11-6307-2014, 2014. a
MacDonald, G. M., Beilman, D. W., Kremenetski, K. V., Sheng, Y., Smith, L. C., and Velichko, A. A.: Rapid Early Development of Circumarctic Peatlands and Atmospheric CH4 and CO2 Variations, Science, 314, 285–288, https://doi.org/10.1126/science.1131722, 2006. a
Michaelson, G., Ping, C.-L., and Clark, M.: Soil Pedon Carbon and Nitrogen Data for Alaska: An Analysis and Update, Open J. Soil Sci., 3, 132–142, https://doi.org/10.4236/ojss.2013.32015, 2013. a
Morel, X., Decharme, B., Delire, C., Krinner, G., Lund, M., Hansen, B. U., and Mastepanov, M.: A New Process-Based Soil Methane Scheme: Evaluation Over Arctic Field Sites With the ISBA Land Surface Model, J. Adv. Model. Earth Sy., 11, 293–326, https://doi.org/10.1029/2018MS001329, 2019a. a, b, c
Morel, X., Hansen, B. U., Delire, C., Ambus, P. L., Mastepanov, M., and Decharme, B.: Soil Carbon and Nitrogen stocks and profiles from an instrumented Greenlandic fen, Pangaea, https://doi.org/10.1594/PANGAEA.909899, 2019b. a, b, c
Noilhan, J. and Planton, S.: A Simple Parameterization of Land Surface Processes for Meteorological Models, Mon. Weather Rev., 117, 536–549, https://doi.org/10.1175/1520-0493(1989)117<0536:ASPOLS>2.0.CO;2, 1989. a
Palmtag, J., Hugelius, G., Lashchinskiy, N., Tamstorf, M. P., Richter, A., Elberling, B., and Kuhry, P.: Storage, landscape distribution, and burial history of soil organic matter in contrasting areas of continuous permafrost, Arct. Antarct. Alpine Res., 47, 71–88, https://doi.org/10.1657/aaar0014-027, 2015. a, b, c, d
Palmtag, J., Cable, S., Christiansen, H. H., Hugelius, G., and Kuhry, P.: Landform partitioning and estimates of deep storage of soil organic matter in Zackenberg, Greenland, The Cryosphere, 12, 1735–1744, https://doi.org/10.5194/tc-12-1735-2018, 2018. a, b, c
Pastukhov, A. and Kaverin, D.: Soil carbon pools in tundra and taiga ecosystems of northeastern Europe, Eurasian Soil Sci/, 46, 958–967, https://doi.org/10.1134/S1064229313070077, 2013. a
Ping, C.-L., Michaelson, G. J., Guo, L., Jorgenson, M. T., Kanevskiy, M., Shur, Y., Dou, F., and Liang, J.: Soil carbon and material fluxes across the eroding Alaska Beaufort Sea coastline, J. Geophys. Res.-Biogeo., 116, G02004, https://doi.org/10.1029/2010JG001588, 2011. a
Pirk, N., Tamstorf, M. P., Lund, M., Mastepanov, M., Pedersen, S. H., Mylius, M. R., Parmentier, F. J. W., Christiansen, H. H., and Christensen, T. R.: Snowpack fluxes of methane and carbon dioxide from high Arctic tundra, J. Geophys. Res.-Biogeo., 121, 2886–2900, https://doi.org/10.1002/2016JG003486, 2016. a, b, c
Pirk, N., Mastepanov, M., López-Blanco, E., Christensen, L. H., Christiansen, H. H., Hansen, B. U., Lund, M., Parmentier, F. J. W., Skov, K., and Christensen, T. R.: Toward a statistical description of methane emissions from arctic wetlands, Ambio, 46, 70–80, https://doi.org/10.1007/s13280-016-0893-3, 2017. a, b, c, d
Qiu, C., Zhu, D., Ciais, P., Guenet, B., Krinner, G., Peng, S., Aurela, M., Bernhofer, C., Brümmer, C., Bret-Harte, S., Chu, H., Chen, J., Desai, A. R., Dušek, J., Euskirchen, E. S., Fortuniak, K., Flanagan, L. B., Friborg, T., Grygoruk, M., Gogo, S., Grünwald, T., Hansen, B. U., Holl, D., Humphreys, E., Hurkuck, M., Kiely, G., Klatt, J., Kutzbach, L., Largeron, C., Laggoun-Défarge, F., Lund, M., Lafleur, P. M., Li, X., Mammarella, I., Merbold, L., Nilsson, M. B., Olejnik, J., Ottosson-Löfvenius, M., Oechel, W., Parmentier, F.-J. W., Peichl, M., Pirk, N., Peltola, O., Pawlak, W., Rasse, D., Rinne, J., Shaver, G., Schmid, H. P., Sottocornola, M., Steinbrecher, R., Sachs, T., Urbaniak, M., Zona, D., and Ziemblinska, K.: ORCHIDEE-PEAT (revision 4596), a model for northern peatland CO2, water, and energy fluxes on daily to annual scales, Geosci. Model Dev., 11, 497–519, https://doi.org/10.5194/gmd-11-497-2018, 2018. a
Quinton, W., Gray, D., and Marsh, P.: Subsurface drainage from hummock-covered hillslopes in the Arctic tundra, J. Hydrol., 237, 113–125, https://doi.org/10.1016/S0022-1694(00)00304-8, 2000. a
Raich, J. W. and Schlesinger, W. H.: The global carbon dioxide flux in soil respiration and its relationship to vegetation and climate, Tellus B, 44, 81–99, https://doi.org/10.1034/j.1600-0889.1992.t01-1-00001.x, 1992. a
Raundrup, K., Aastrup, P., Nyman, J., Lauridsen, T. L., Sander Johannsson, L., Henning Krogh, P., Lund, M., and Rasmussen, L. M.: NUUK BASIC: The BioBasis programme, in: Nuuk Ecological Research Operations, 3rd Annual Report, 2009, edited by: Jensen, L. and Rasch, M., National Environmental Research Institute, Aarhus University, 2010. a, b
Rezanezhad, F., Price, J. S., Quinton, W., Lennartz, B., Milojevic, T., and Van Cappellen, P.: Structure of peat soils and implications for water storage, flow and solute transport: A review update for geochemists, Chem. Geol., 429, 75–84, https://doi.org/10.1016/j.chemgeo.2016.03.010, 2016. a, b, c
Rößger, N., Wille, C., Holl, D., Göckede, M., and Kutzbach, L.: Scaling and balancing carbon dioxide fluxes in a heterogeneous tundra ecosystem of the Lena River Delta, Biogeosciences, 16, 2591–2615, https://doi.org/10.5194/bg-16-2591-2019, 2019. a
Rydin, H. and Jeglum, J.: The biology of peatlands, 2nd edn., Oxford University Press, 2013. a
Sachs, T., Wille, C., Boike, J., and Kutzbach, L.: Environmental controls on ecosystem-scale CH4 emission from polygonal tundra in the Lena River Delta, Siberia, J. Geophys. Res., 113, G00A03, https://doi.org/10.1029/2007JG000505, 2008. a
Schlesinger, W. H. and Bernhardt, E. S.: Wetland Ecosystems, in: Biogeochemistry, Academic Press, Oxford, UK, 233–274, https://doi.org/10.1016/B978-0-12-385874-0.00007-8, 2013. a
Siewert, M., Hanisch, J., Weiss, N., Kuhry, P., C. Maximov, T., and Hugelius, G.: Comparing carbon storage of Siberian tundra and taiga permafrost ecosystems at very high spatial resolution, J. Geophys. Res. Biogeo., 120, 1973–1994, https://doi.org/10.1002/2015JG002999, 2015. a, b, c
Siewert, M., Hugelius, G., Heim, B., and Faucherre, S.: Landscape controls and vertical variability of soil organic carbon storage in permafrost-affected soils of the Lena River Delta, Catena, 147, 725–741, https://doi.org/10.1016/j.catena.2016.07.048, 2016. a, b, c
Sigsgaard, C., Thorsøe, K., Fugl, A., Mastepanov, M., Friborg, T., Tamstorf, M., Hansen, B., Ström, L., and Røjle Christensen, T.: Zackenberg Basic: The Climate Basis and GeoBasis programmes, in: 12th Annual Report 2006, Zackenberg Ecological Research Operations, National Environmental Research Institute, Aarhus University, 2007. a, b
Tamstorf, M., Iversen, K., Hansen, B., Sigsgaard, C., Fruergaard, M., Andreasen, R., Mastepanov, M., Falk, J., Ström, L., and Christensen, T.: NUUK BASIC: The GeoBasis programme, in: Nuuk Ecological Research Operations, 1st Annual Report, 2007, edited by: Jensen, L. and Rasch, M., National Environmental Research Institute, Aarhus University, 2008. a, b, c
van der Molen, M. K., van Huissteden, J., Parmentier, F. J. W., Petrescu, A. M. R., Dolman, A. J., Maximov, T. C., Kononov, A. V., Karsanaev, S. V., and Suzdalov, D. A.: The growing season greenhouse gas balance of a continental tundra site in the Indigirka lowlands, NE Siberia, Biogeosciences, 4, 985–1003, https://doi.org/10.5194/bg-4-985-2007, 2007. a
Vitousek, P. and Howarth, R.: Nitrogen limitation on land and in the sea: how can it occur?, Biogeochemistry, 13, 87–115, https://doi.org/10.1007/BF00002772, 1991. a
Voigt, C., Marushchak, M. E., Lamprecht, R. E., Jackowicz-Korczyński, M., Lindgren, A., Mastepanov, M., Granlund, L., Christensen, T. R., Tahvanainen, T., Martikainen, P. J., and Biasi, C.: Increased nitrous oxide emissions from Arctic peatlands after permafrost thaw, P. Natl. Acad. Sci. USA, 114, 6238–6243, https://doi.org/10.1073/pnas.1702902114, 2017. a
Wang, M., Moore, T. R., Talbot, J., and Riley, J. L.: The stoichiometry of carbon and nutrients in peat formation, Global Biogeochem. Cy., 29, 113–121, https://doi.org/10.1002/2014GB005000, 2015. a
Xu, J., Morris, P. J., Liu, J., and Holden, J.: PEATMAP: Refining estimates of global peatland distribution based on a meta-analysis, CATENA, 160, 134– 140, https://doi.org/10.1016/j.catena.2017.09.010, 2018. a
Yu, Z., Loisel, J., Brosseau, D. P., Beilman, D. W., and Hunt, S. J.: Global peatland dynamics since the Last Glacial Maximum, Geophys. Res. Lett., 37, L13402, https://doi.org/10.1029/2010GL043584, 2010. a
Yu, Z., Beilman, D. W., Frolking, S., MacDonald, G. M., Roulet, N. T., Camill, P., and Charman, D. J.: Peatlands and Their Role in the Global Carbon Cycle, Eos T. Am. Geophys., 92, 97–98, https://doi.org/10.1029/2011EO120001, 2011. a, b
Yu, Z. C.: Northern peatland carbon stocks and dynamics: a review, Biogeosciences, 9, 4071–4085, https://doi.org/10.5194/bg-9-4071-2012, 2012. a, b, c, d