the Creative Commons Attribution 4.0 License.
the Creative Commons Attribution 4.0 License.
 | 07 Sep 2020
GloFAS-ERA5 operational global river discharge reanalysis 1979–present
Ervin Zsoter
Lorenzo Alfieri
Christel Prudhomme
Peter Salamon
Fredrik Wetterhall
Christopher Barnard
Hannah Cloke
Florian Pappenberger
Estimating how much water is flowing through rivers at the global scale is challenging due to a lack of observations in space and time. A way forward is to optimally combine the global network of earth system observations with advanced numerical weather prediction (NWP) models to generate consistent spatio-temporal maps of land, ocean, and atmospheric variables of interest, which is known as a reanalysis. While the current generation of NWP models output runoff at each grid cell, they currently do not produce river discharge at catchment scales directly and thus have limited utility in hydrological applications such as flood and drought monitoring and forecasting. This is overcome in the Global Flood Awareness System (GloFAS; http://www.globalfloods.eu/, last access: 28 June 2020) by coupling surface and sub-surface runoff from the Hydrology Tiled ECMWF Scheme for Surface Exchanges over Land (HTESSEL) land surface model used within ECMWF's latest global atmospheric reanalysis (ERA5) with the LISFLOOD hydrological and channel routing model. The aim of this paper is to describe and evaluate the GloFAS-ERA5 global river discharge reanalysis dataset launched on 5 November 2019 (version 2.1 release). The river discharge reanalysis is a global gridded dataset with a horizontal resolution of 0.1∘ at a daily time step. An innovative feature is that it is produced in an operational environment so is available to users from 1 January 1979 until near real time (2 to 5 d behind real time). The reanalysis was evaluated against a global network of 1801 daily river discharge observation stations. Results found that the GloFAS-ERA5 reanalysis was skilful against a mean flow benchmark in 86 % of catchments according to the modified Kling–Gupta efficiency skill score, although the strength of skill varied considerably with location. The global median Pearson correlation coefficient was 0.61 with an interquartile range of 0.44 to 0.74. The long-term and operational nature of the GloFAS-ERA5 reanalysis dataset provides a valuable dataset to the user community for applications ranging from monitoring global flood and drought conditions to the identification of hydroclimatic variability and change and as raw input for post-processing and machine learning methods that can add further value. The dataset is openly available from the Copernicus Climate Change Service Climate Data Store: https://cds.climate.copernicus.eu/cdsapp#!/dataset/cems-glofas-historical?tab=overview (last access: 28 June 2020) with the following DOI: https://doi.org/10.24381/cds.a4fdd6b9 (C3S, 2019).
- Article
(6914 KB) - Full-text XML
-
Supplement
(137 KB) - BibTeX
- EndNote


A key challenge in hydrology is estimating past, present, and future hydrological conditions in rivers around the world. This is largely due to severe temporal and spatial gaps in the global river discharge observing network. In many parts of the world, there is simply not enough long-term river discharge observations at high enough spatial density, and in the vast majority of countries hydrometric data are not available in real time (Lavers et al., 2019). The lack of observations is therefore a major barrier in our ability to provide monitoring and early warning of hydrological extremes such as floods and droughts, which have, for example, implications for progressing international disaster risk reduction (UNDRR, 2015). A way forward pioneered in the field of meteorology and climate has been to optimally combine in situ and satellite earth system observations, together with advanced numerical weather prediction (NWP) models, to generate a reanalysis of land, ocean, and atmospheric variables of interest, thus providing consistent spatio-temporal “maps without gaps” (Hersbach et al., 2020). Several global hydrological products have been developed that provide estimates of runoff or river discharge with a wide range of forcing and methodological approaches (e.g. Fekete et al., 2002; Döll et al., 2003; Qian et al., 2006; Sperna Weiland et al., 2010; Reichle et al., 2011; Yamazaki et al., 2011; Beck et al., 2017; Ghiggi et al., 2019; Lin et al., 2019). While these datasets can be used to understand past variability and change in the terrestrial hydrological cycle, they are currently not produced in an operational environment in near real time and so cannot be used for monitoring current global river conditions or providing initial conditions to hydrometeorological forecasting systems.
A long-term and near-real-time river discharge reanalysis is produced operationally as part of the Global Flood Awareness System (GloFAS; http://www.globalfloods.eu/) which bridges this gap. GloFAS is the global flood service of the European Commission's Copernicus Emergency Management Service (CEMS), an operational system for monitoring and forecasting floods across the world with over 5000 registered users. GloFAS was developed together by the Joint Research Centre (JRC) of the European Commission, the University of Reading, and the European Centre for Medium-Range Weather Forecasts (ECMWF). The system went pre-operational in July 2011 (Alfieri et al., 2013), becoming a fully operational, 24/7 supported service in April 2018 (version 1.0, upgraded to version 2.0 in November 2018). GloFAS is provided through a free and open licence and is designed for decision makers and forecasters in national and international water authorities, water resources management, hydropower companies, civil protection authorities, and international humanitarian aid organizations. A recent example of the use of GloFAS was for supporting the humanitarian response to the devastating floods that affected large parts of Mozambique, Malawi, and Zimbabwe in the wake of tropical cyclone Idai in March 2019 (Magnusson et al., 2019). Given the large amount of openly available data that is generated by GloFAS, including a long-term, near-real-time river discharge reanalysis, a large set of reforecasts, and real-time flood and seasonal forecasts, it is also used by researchers and commercial industries for a wide range of projects and for developing value-added products.
In GloFAS, ensemble river discharge forecasts are produced each day at a daily time step and provide probabilities of flood thresholds being exceeding for a given river section with a lead up to 30 d ahead (GloFAS 30 d; Alfieri et al., 2013). There is also a seasonal component, GloFAS-Seasonal (Emerton et al., 2018), that provides forecasts once per month at a weekly time step with a lead time up to 4 months ahead. The river discharge reanalysis is used for two core tasks within GloFAS. First, flood thresholds at 2-, 5-, and 20-year return periods for each river cell are derived from the long-term reanalysis series. This allows for the magnitude of the real-time ensemble river discharge forecasts to be directly compared to the magnitude of the long-term flood thresholds and thus awareness of a flood signal if the threshold is exceeded. Second, it provides the basis to derive initial hydrometeorological conditions for both GloFAS 30 d and GloFAS-Seasonal real-time forecasts. Estimating initial conditions is a key step to determine the current status of soil moisture, groundwater, snow cover, and initial state of water within rivers and other waterbodies, and it has been identified as one of the major challenges in continental- and global-scale flood forecasting given the limited availability of observational data at these scales (Emerton et al., 2016).
The aim of this data paper is to describe the newly produced operational river discharge reanalysis dataset as part of the launch of GloFAS v2.1 on 5 November 2019 (see GloFAS technical documentation for details on upgrades: https://confluence.ecmwf.int/display/COPSRV/Global+Flood+Awareness+System, last access: 28 August 2020). GloFAS river discharge reanalysis is based on ERA5 (Hersbach et al., 2020), ECMWF's latest global atmospheric reanalysis which extends back to 1979 and was officially released in January 2019. An innovation of ERA5 is that it is produced in near real time in an operational environment, allowing for the production of GloFAS-ERA5 reanalysis with a latency of 2 to 5 d behind real time. This has the major advantage for GloFAS in that the initial hydrometeorological conditions can now be derived from the same product from which the long-term flood thresholds are derived, which will ensure a much better consistency with real-time forecasts compared to previous GloFAS model configurations. Uniquely, the global river discharge product is over 40 years long, produced in near real time, and is freely available to download for the community through the Copernicus Climate Change Service (C3S) Copernicus Climate Data Store (CDS): https://cds.climate.copernicus.eu/cdsapp#!/dataset/cems-glofas-historical?tab=overview (C3S, 2019), opening multitudes of hydroclimate applications across the world.
Section 2 outlines the production of the dataset and Sect. 3 describes its main attributes including available variables and file format. An evaluation of the dataset against a global network of observations is conducted in Sect. 4. The dissemination of the data through the CDS is shown in Sect. 5 before key conclusions and future work are offered in Sect. 6.
Pappenberger et al. (2010) first demonstrated that it was possible to achieve useful river discharge predictions by coupling a river routing scheme with the land surface model of the ECMWF global numerical weather prediction (NWP) system. The GloFAS-ERA5 river discharge reanalysis uses this concept and is produced by coupling the land surface model runoff component of the ECMWF ERA5 global reanalysis (Hersbach et al., 2020) with the LISFLOOD hydrological and channel routing model (van der Knijff et al., 2010). In ERA5, the runoff (m d−1) from one cell is not connected to neighbouring cells; hence, it is not possible to estimate river discharge (m3 s−1) at the catchment scale. Coupling ERA5 runoff with LISFLOOD allows for the lateral connectivity of grid cells with runoff routed through the river channel to produce river discharge. A schematic of the key components in the production of the GloFAS-ERA5 reanalysis is provided in Fig. 1. The open-access scientific publications and model documentation that describe the full methodological detail for each key component is provided in Table 1 and summarized below.
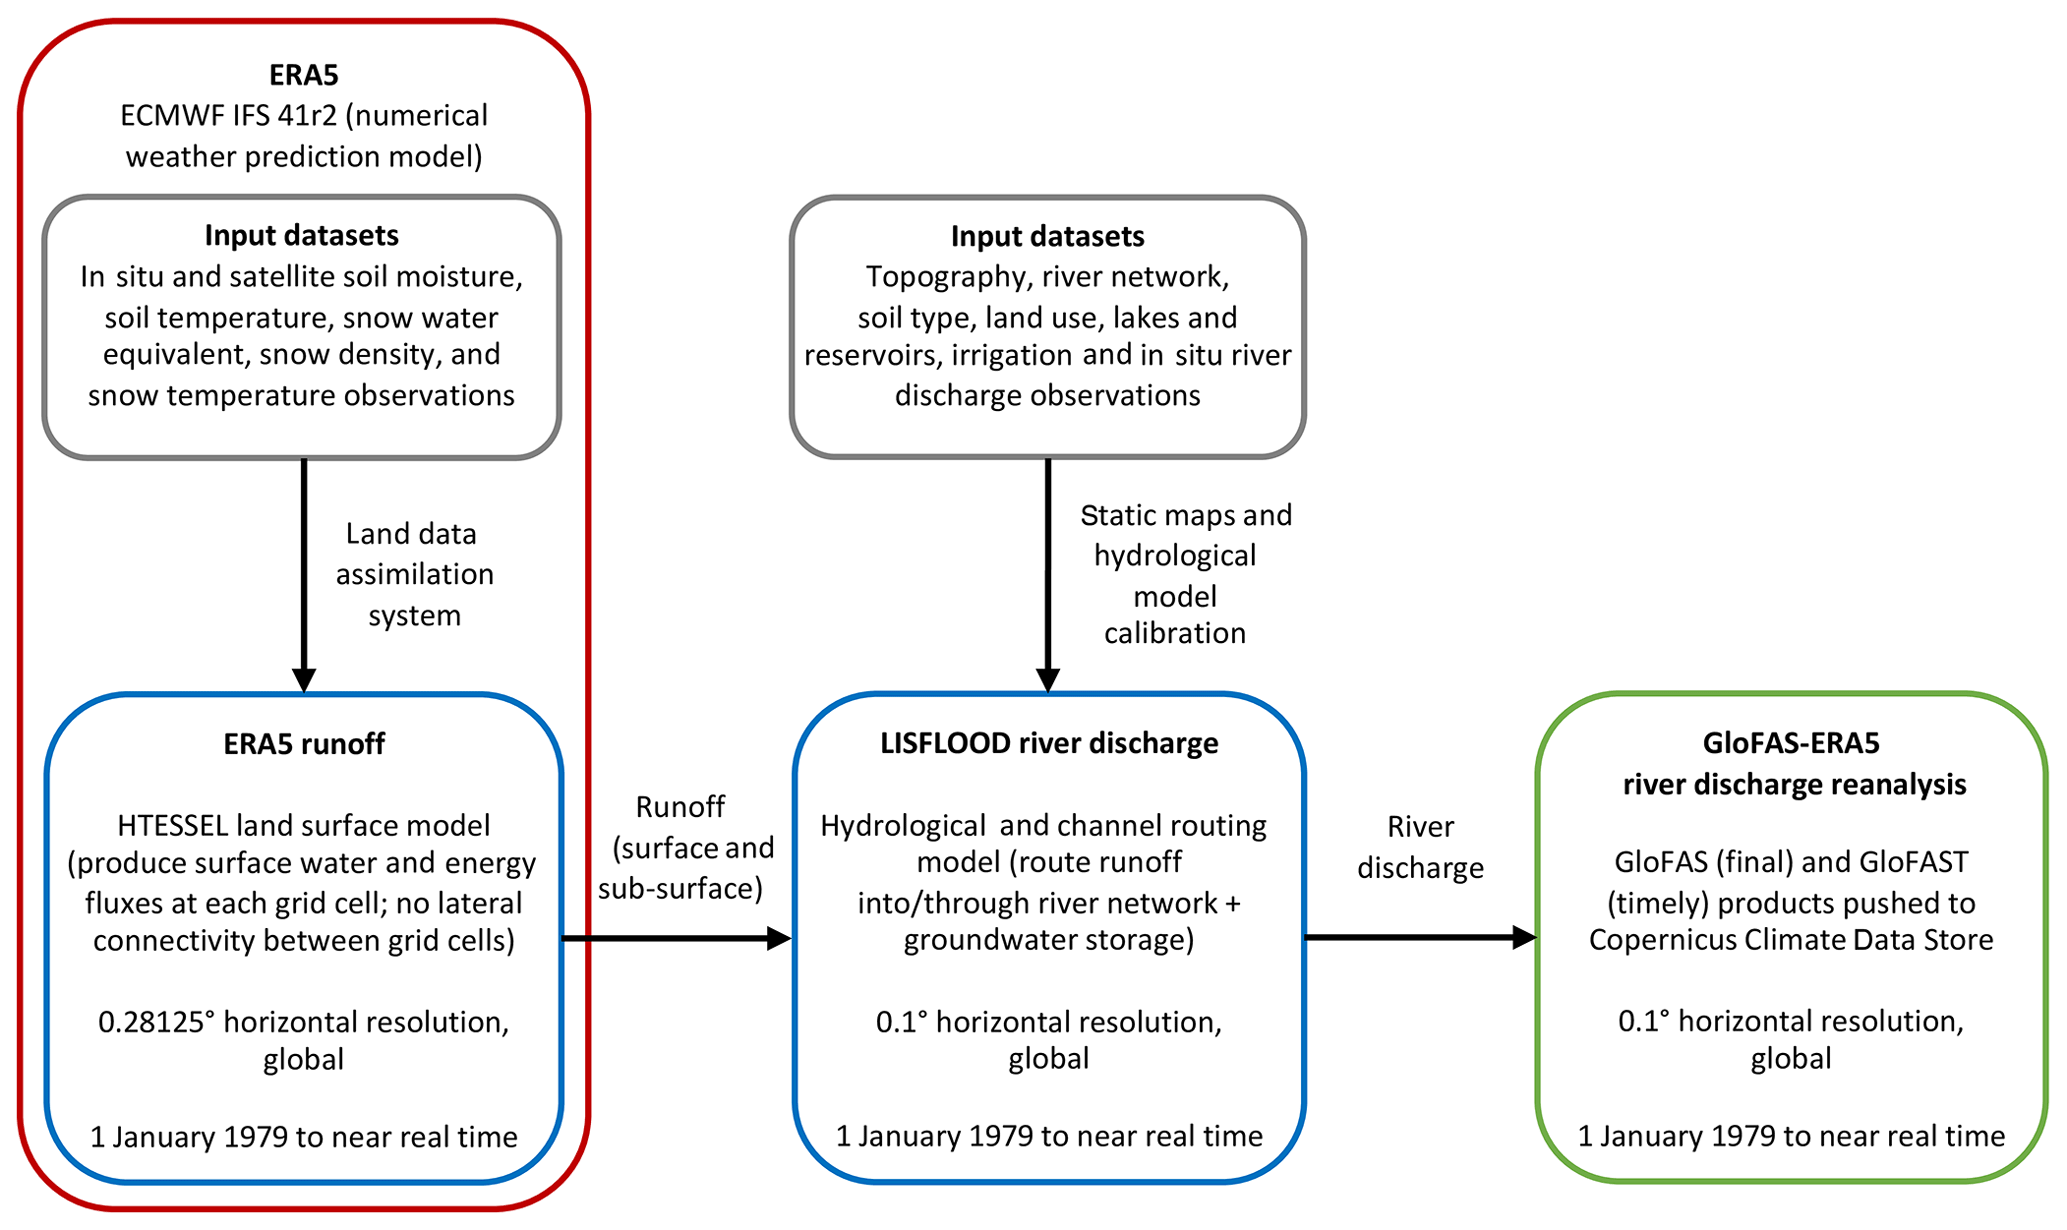
Figure 1A schematic of the key components in the production of GloFAS-ERA5 v2.1 river discharge reanalysis dataset.
Table 1Scientific papers and model documentation for the key components in the production of GloFAS-ERA5 v2.1 river discharge reanalysis dataset.

2.1 ERA5 runoff
ERA5 runoff is produced from the HTESSEL land surface model (Hydrology Tiled ECMWF Scheme for Surface Exchanges over Land; Balsamo et al., 2009) as used within the ECMWF Integrated Forecasting System (IFS). HTESSEL computes the surface water and energy fluxes and the temporal evolution of soil temperature, soil moisture, and snowpack. Excess precipitation and snowmelt are partitioned as surface runoff or infiltrated into a four-layer soil column (7 cm depth for top layer and then 21, 72, and 189 cm) at each ERA5 grid cell before draining from the bottom of the soil column as sub-surface runoff (Balsamo et al., 2009). ERA5 uses an advanced land data assimilation system to assimilate conventional in situ and satellite observations for land surface variables such as soil moisture, soil temperature, snow water equivalent, snow density, and snow temperature, as outlined in de Rosnay et al. (2014).
ERA5 benefits from a decade worth of numerical weather prediction developments in model physics, numerics, and data assimilation by using ECMWF IFS model cycle 41r2 (2016) compared to model cycle 31r2 (2006) as used in its predecessor, ERA-Interim (Dee et al., 2011). ERA5 has a horizontal resolution of approximately 31 km at the Equator (native octahedral grid) and since January 2019 has been openly available from 1979 to present. A key novelty of ERA5 is its operational production that makes available an intermediate timely product, ERA5T, in near real time, allowing the production the GloFAS-ERA5 river discharge reanalysis operationally with a latency of between 2 and 5 d behind real time.
2.2 LISFLOOD river discharge
River discharge is currently not calculated by HTESSEL. Instead, surface and sub-surface runoff from the HTESSEL land surface model coupled with a simplified global version of LISFLOOD, a spatially distributed grid-based hydrological and channel routing model. The details of the global version of LISFLOOD used within GloFAS v2.1 and its calibration can be found in Hirpa et al. (2018) but are briefly summarized here for context. The sub-surface runoff from HTESSEL is used as input for the LISFLOOD groundwater module, which consists of two parallel linear reservoirs that store and subsequently transport water to the river channel with a time delay. The upper zone represents quick groundwater and sub-surface flow, while the lower zone represents slow groundwater flow that generates base flow. In Hirpa et al. (2018), the upper zone time constant was given a default value of 10 d with a lower (upper) bound of 3 d (40 d) during calibration, and the lower zone time constant given a default value of 200 d with a lower (upper) bound of 40 d (500 d). The surface runoff from HTESSEL is used as input for the LISFLOOD river channel routing module. This is a two-stage process whereby the surface runoff for each cell is first routed to the nearest downstream river channel cell, then the water in the channel is routed through the river network using the kinematic wave approach. Groundwater and river routing parameters in GloFAS were calibrated against daily river discharge observations for 1287 catchments globally by Hirpa et al. (2018). A key feature of LISFLOOD is the ability to represent features that can severely alter the timing and magnitude of river discharge, such as lakes, reservoirs, and human water use (Burek et al., 2013). A total of 463 of the largest lakes (surface area >100 km2) and 667 of the largest reservoirs were incorporated into the GloFAS river network by Zajac et al. (2017).
To generate the GloFAS-ERA5 river discharge reanalysis, the LISFLOOD model is forced with daily HTESSEL surface and sub-surface runoff from ERA5 starting from 1 January 1979 (Fig. 1). In order to be consistent with the operational GloFAS procedure, the runoff fields from ERA5 were downscaled using the simple nearest neighbour method from the native ERA5 to the 0.1∘ GloFAS grid. To avoid the need for very long spin-up periods, LISFLOOD calculates a steady-state storage amount for the lower groundwater zone during a long-term “pre-run” and thus reduces the lower zone's spin-up time (Burek et al., 2013). LISFLOOD was therefore given a 1-year model spin-up using preliminary ERA5 output for 1978. To produce GloFAS-ERA5 reanalysis in near real time operationally, the latest available ERA5T data are used.
The key attributes of the current operational version (v2.1) of the GloFAS-ERA5 river discharge reanalysis dataset are shown in Table 2. The daily reanalysis is global in coverage, except for Antarctica, with a horizontal grid resolution of 0.1∘ (approximately 11 km at the Equator). The dataset is over 40 years long starting on 1 January 1979. An innovative aspect of the dataset is its operational production allowing it to be available 2 to 5 d behind real time, shortly after ERA5T becomes available. The intermediate ERA5T data are not quality assured due to its timely nature. Consequently, there will be two reanalysis streams available: GloFAS (consolidated) is the final product based on the consolidated ERA5 from 1 January 1979 until 2 to 3 months behind real time, updated on the CDS on a monthly basis; and GloFAST (intermediate) is the timely product based on the intermediate ERA5T from 1 August 2019 until 2 to 5 d behind real time, updated on the CDS on a daily basis whenever ERA5T becomes available.
Table 2Summary of GloFAS-ERA5 dataset attributes in the C3S Climate Data Store.
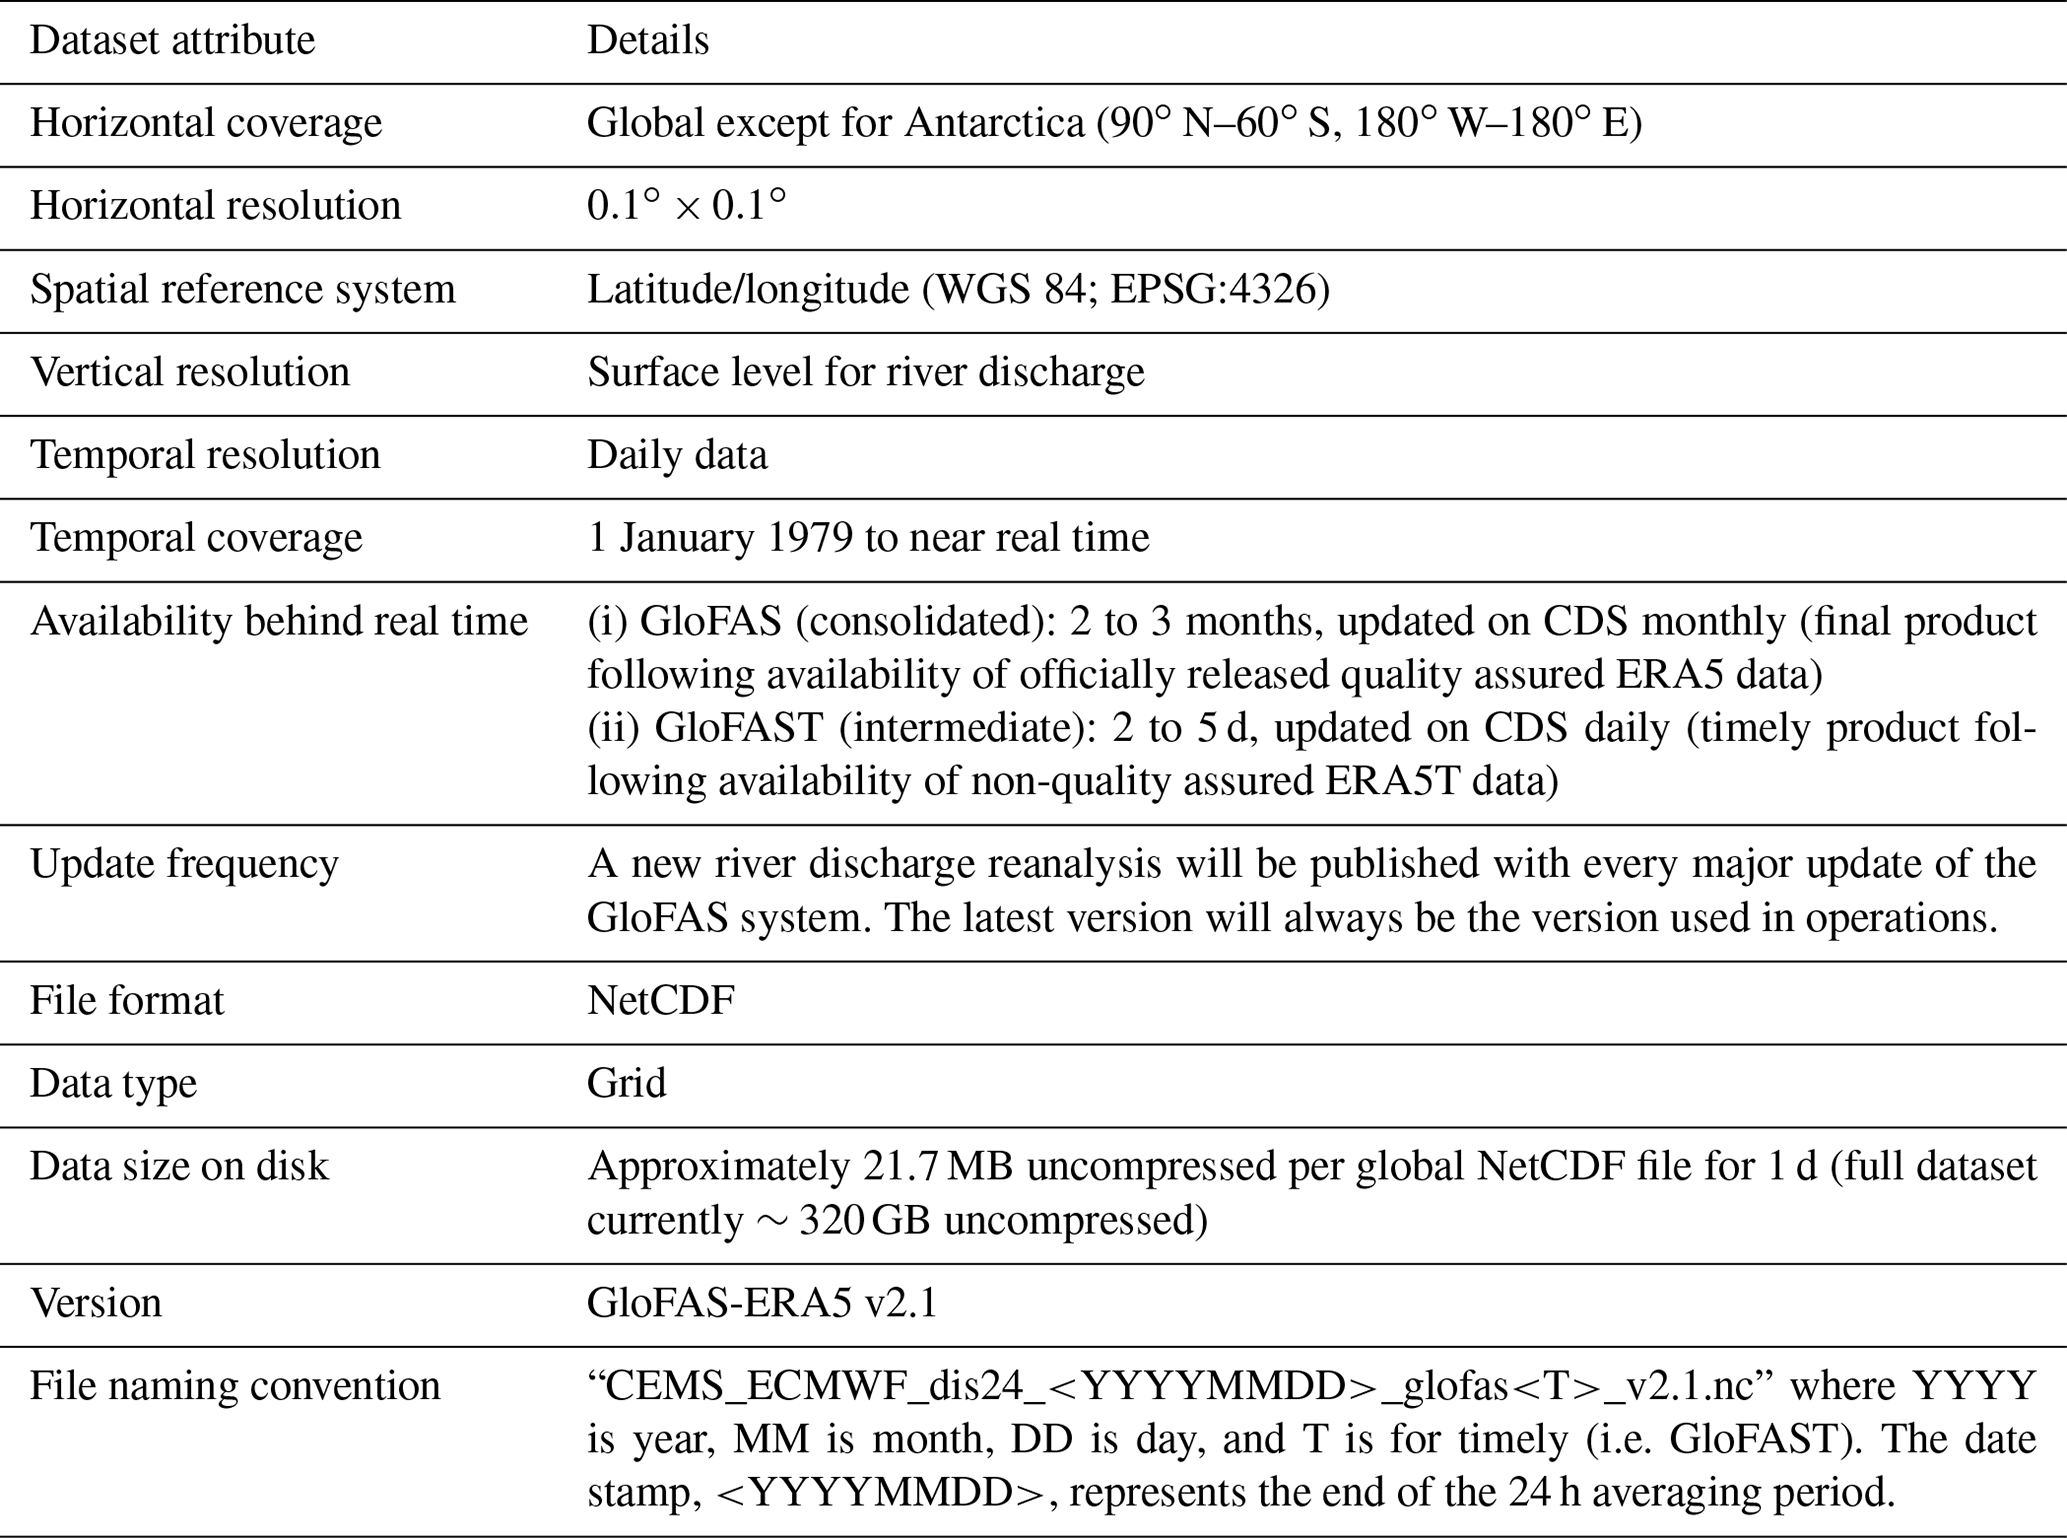
Table 3Variables available within GloFAS-ERA5 dataset in the C3S Climate Data Store.
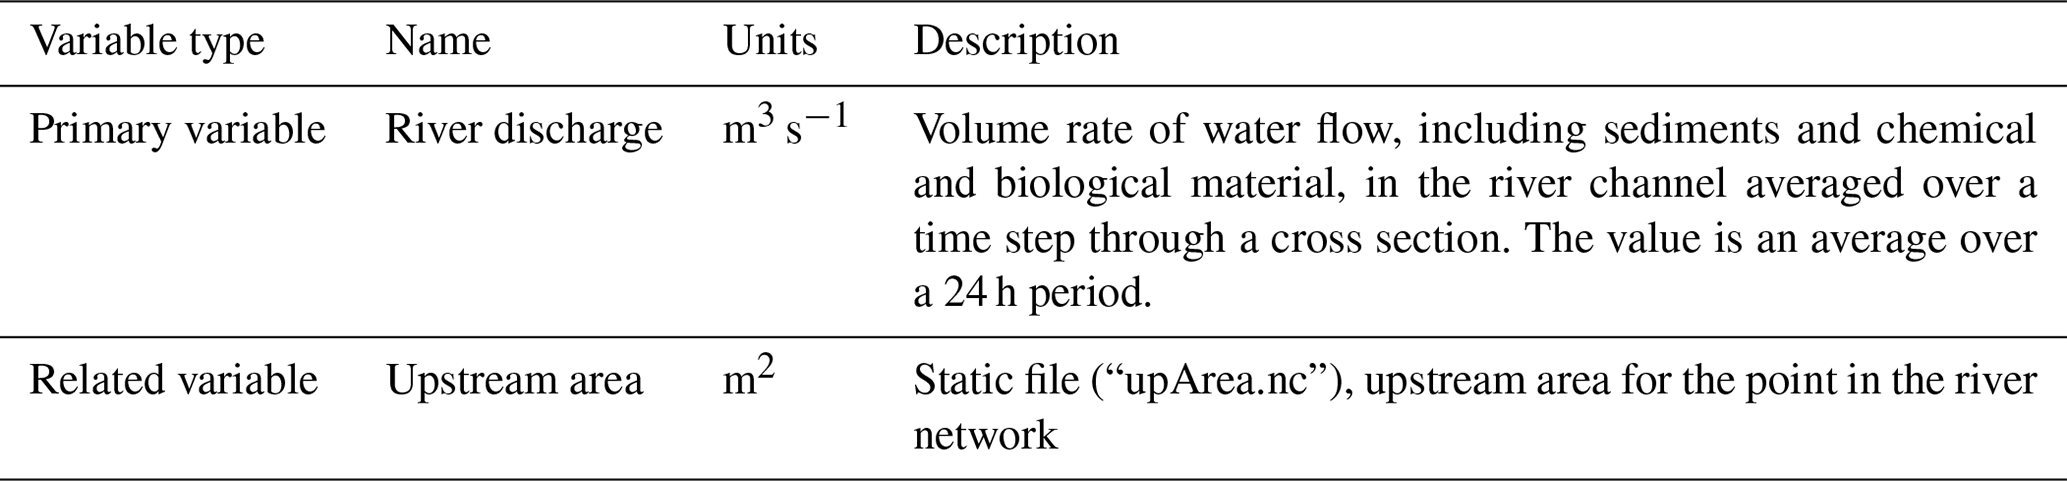
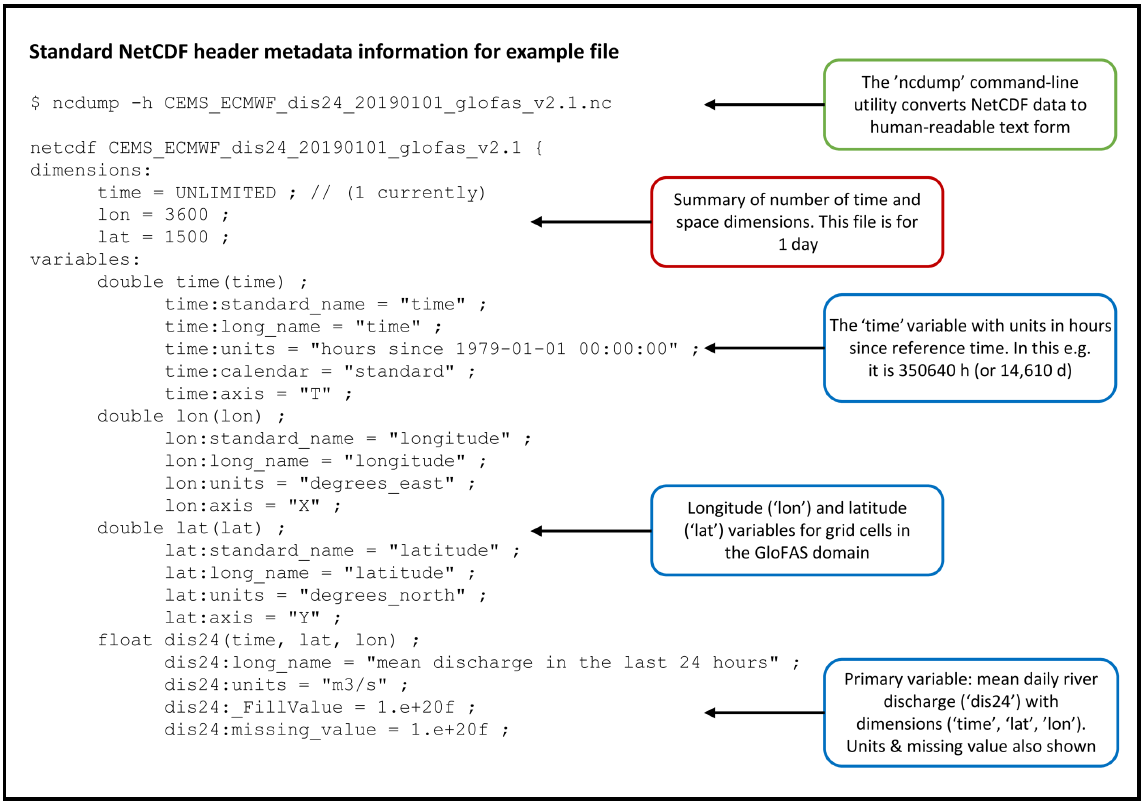
The GloFAS-ERA5 reanalysis dataset includes the variables river discharge and the upstream area for each GloFAS grid cell (Table 3). Data are stored in NetCDF format with one file per day containing the 24 h mean river discharge (00:00 UTC to 00:00 UTC). Each daily filename follows the convention “CEMS_ECMWF_dis24_<YYYYMMDD>_glofas<T> _v2.1.nc” whereby the date stamp represents the end of the 24 h averaging period. So, for example, the file “CEMS_ECMWF_dis24_20190101_glofas_v2.1.nc” contains the daily mean flow for the 24 h period 00:00 UTC 31 December 2018 to 00:00 UTC 1 January 2019. Appendix A shows the header metadata information contained within the example NetCDF file. Each daily NetCDF file for the whole globe has an uncompressed size of ∼21.7 MB; therefore, the estimated size of the dataset from January 1979 to October 2019 is ∼320 GB.
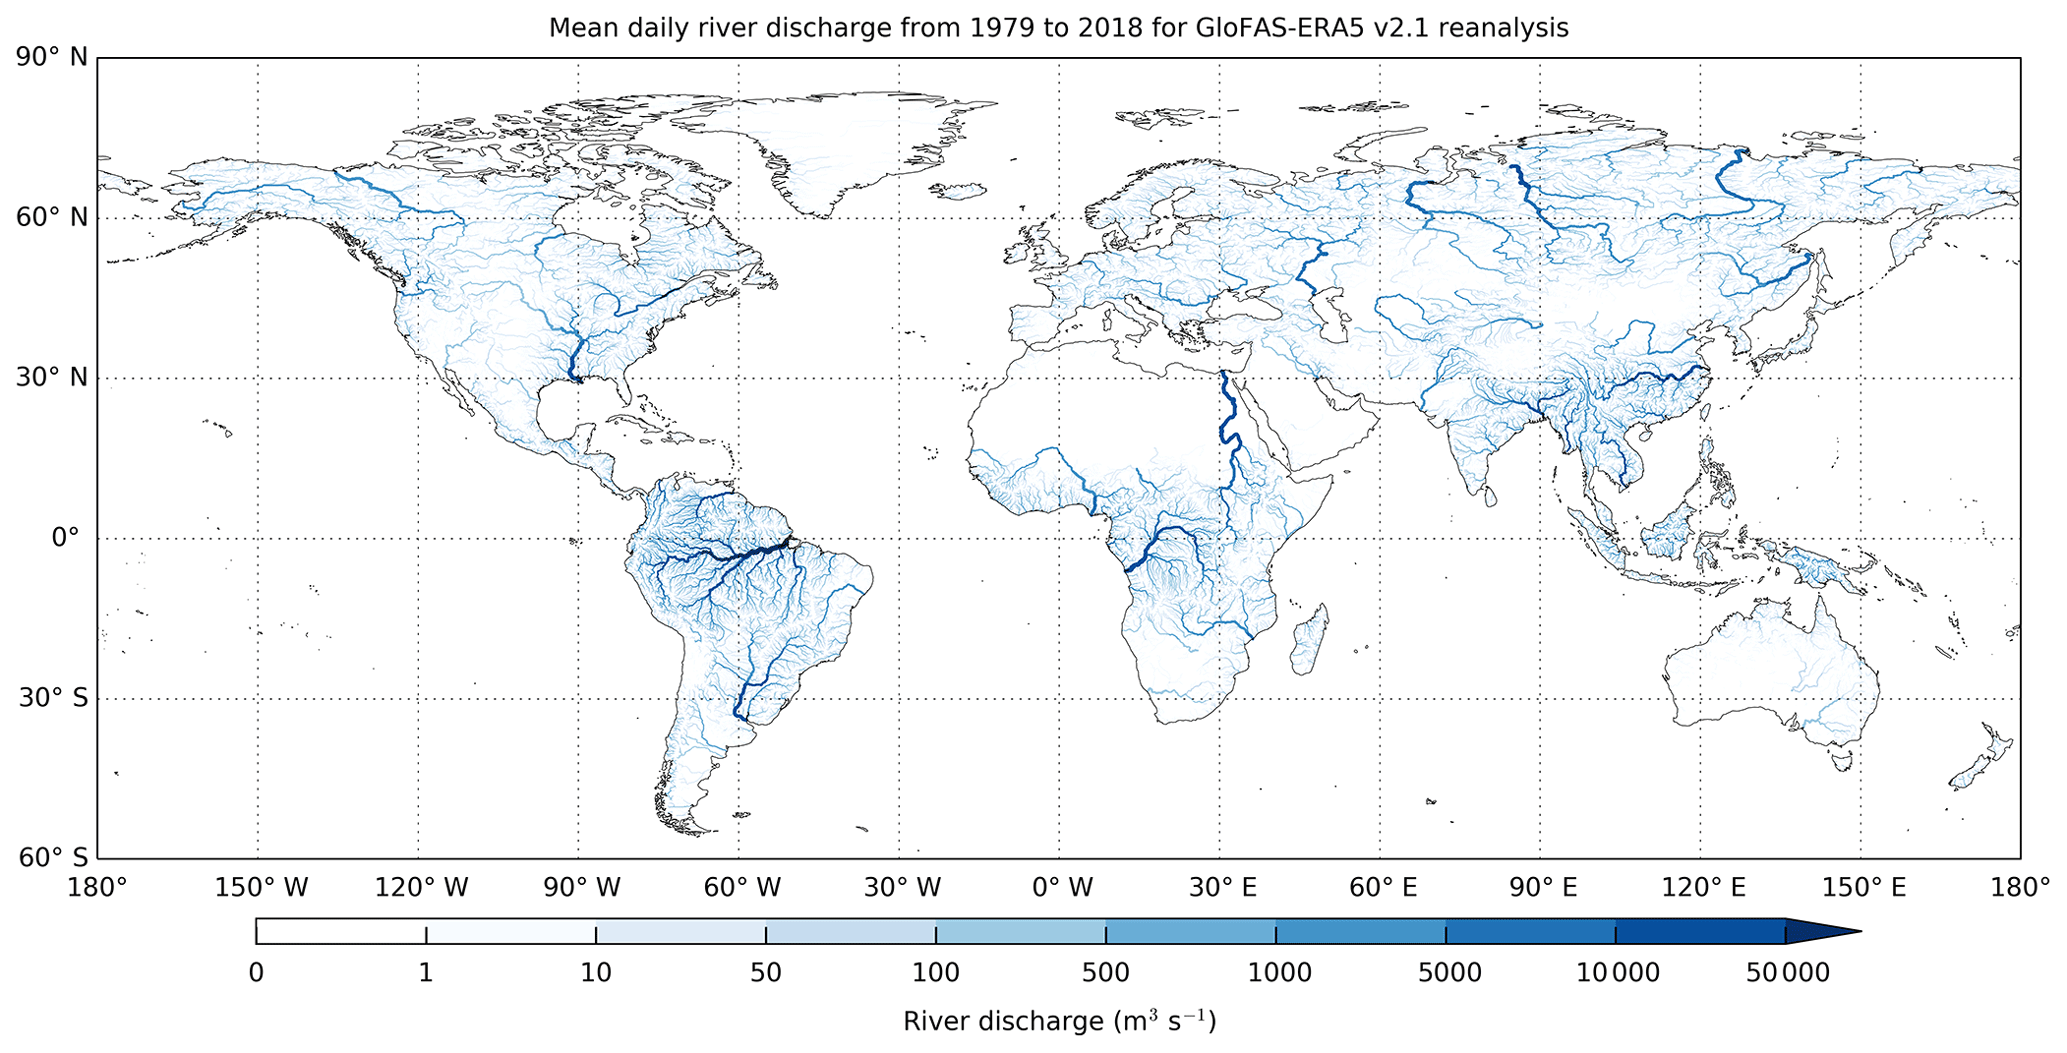
Figure 2Mean GloFAS-ERA5 daily river discharge from 1979 to 2018 for each GloFAS river grid cell with an upstream area greater than 1000 km2. Darker blue river sections have larger river discharge.

Figure 3Hydrograph for GloFAS-ERA5 river discharge reanalysis (blue line) from 1 January 1979 to 12 November 2019 and observations (red line), when available, for the Santa Rosa gauging station on the Teles Pires River, a sub-catchment of the Amazon, Brazil (GloFAS ID = 1250; GRDC ID = 3629770). Summary statistics from the evaluation of the reanalysis against observations in top right box as used in Sect. 4.
Figure 2 maps the mean daily river discharge from 1979 to 2018 for each GloFAS river with an upstream area greater than 1000 km2, revealing the main river arteries of the world. An example hydrograph of the long-term near-real-time reanalysis against available river discharge observations is shown in Fig. 3 for the Teles Pires River in the Amazon basin, Brazil.
GloFAS-ERA5 v2.1 river discharge reanalysis was evaluated against a global network of daily river discharge observations. As part of GloFAS, a database of global hydrological observations for 2042 stations is held, consisting predominantly (i.e. ∼75 %) of data from the Global Runoff Data Centre (GRDC) and supplemented by data collected through collaboration with GloFAS partners worldwide to improve spatial coverage. A number of criteria were used to select stations for the evaluation:
-
at least 4 years of daily data available between 1979 and 2018 (not necessarily contiguous) (78 stations removed);
-
minimum upstream area of 500 km2 (4 stations removed);
-
error in catchment area supplied by data provider and upstream area for corresponding cell on the GloFAS river network within 20 % (93 stations removed);
-
first order visual quality check on observed river discharge time series to remove stations with erroneous data; for example, time series truncated above a threshold, severe inhomogeneities, or series monitoring an artificial canal instead of a river (39 stations removed);
-
station with the longest record retained when multiple observation stations were matched to the same GloFAS river cell (27 stations removed).
This filtering procedure resulted in the selection of 1801 stations with drainage areas ranging between 575 to 4 664 200 km2 and a median of 30 046 km2. Individual metadata of all 1801 stations are given in Table S1 in the Supplement. Care must be taken in spatial representativeness of the following evaluation results as the observation network is sparse in some regions of the world, particularly in large parts of Africa and Asia.
Performance at the daily scale was assessed using the modified Kling–Gupta efficiency metric (KGE′; Gupta et al., 2009; Kling et al., 2012). The KGE′ is gaining popularity as the standard performance metric in hydrology (e.g. Beck et al., 2017; Harrigan et al., 2018; Lin et al., 2019) and can be decomposed into three components important for assessing hydrological dynamics: temporal errors through correlation, bias errors, and variability errors:
where r is the Pearson correlation coefficient between reanalysis simulations (s) and observations (o), β is the bias ratio, γ is the variability ratio, μ is the mean discharge, and σ is the discharge standard deviation. The KGE′ and its three decomposed components (correlation, bias ratio, and variability ratio) are all dimensionless with an optimum value of 1. In order to evaluate the hydrological simulation skill of GloFAS-ERA5 reanalysis, its performance is compared against a simpler benchmark. Here the observed mean flow is used as a benchmark as proposed by Knoben et al. (2019). This is not a difficult benchmark to beat but should arguably be the minimum reference for any hydrological system to be compared against. Here we represent KGE′ as a skill score, KGESS, to evaluate the performance of GloFAS-ERA5 river discharge reanalysis against the mean flow benchmark simulation, given as
where is the KGE′ value for the GloFAS-ERA5 reanalysis against observations, is the KGE′ value for the observed mean flow benchmark against observations (i.e. from Knoben et al., 2019), and is the value of KGE′ for a perfect simulation which is 1. A KGESS =0 means the GloFAS-ERA5 reanalysis is no better than the mean flow benchmark and so has no skill, KGESS >0 means the reanalysis is considered skilful, and KGESS <0 means the performance is worse than the benchmark and so has negative skill. Performance metrics for all 1801 stations are included in Table S1.
4.1 Overall performance
Results for overall performance show that the GloFAS-ERA5 river discharge reanalysis is skilful in 86 % of catchments (Fig. 4a). The global median KGESS (KGE′) is 0.51 (0.31) with an interquartile range (IQR) of 0.30 (0.00) to 0.66 (0.52). Performance is best in Brazil (particularly the Amazon basin), central Europe, and the eastern and western regions of the United States (Fig. 5). GloFAS-ERA5 reanalysis performance is poor (i.e. KGESS <0) in many catchments in Africa and the North American Great Plains extending into Mexico with notable patches in eastern Brazil, Thailand, and southern Spain. Results will be biased towards regions with a larger number of stations, especially when well performing large basins contain many sub-catchments (e.g. Amazon and Rhine basins).
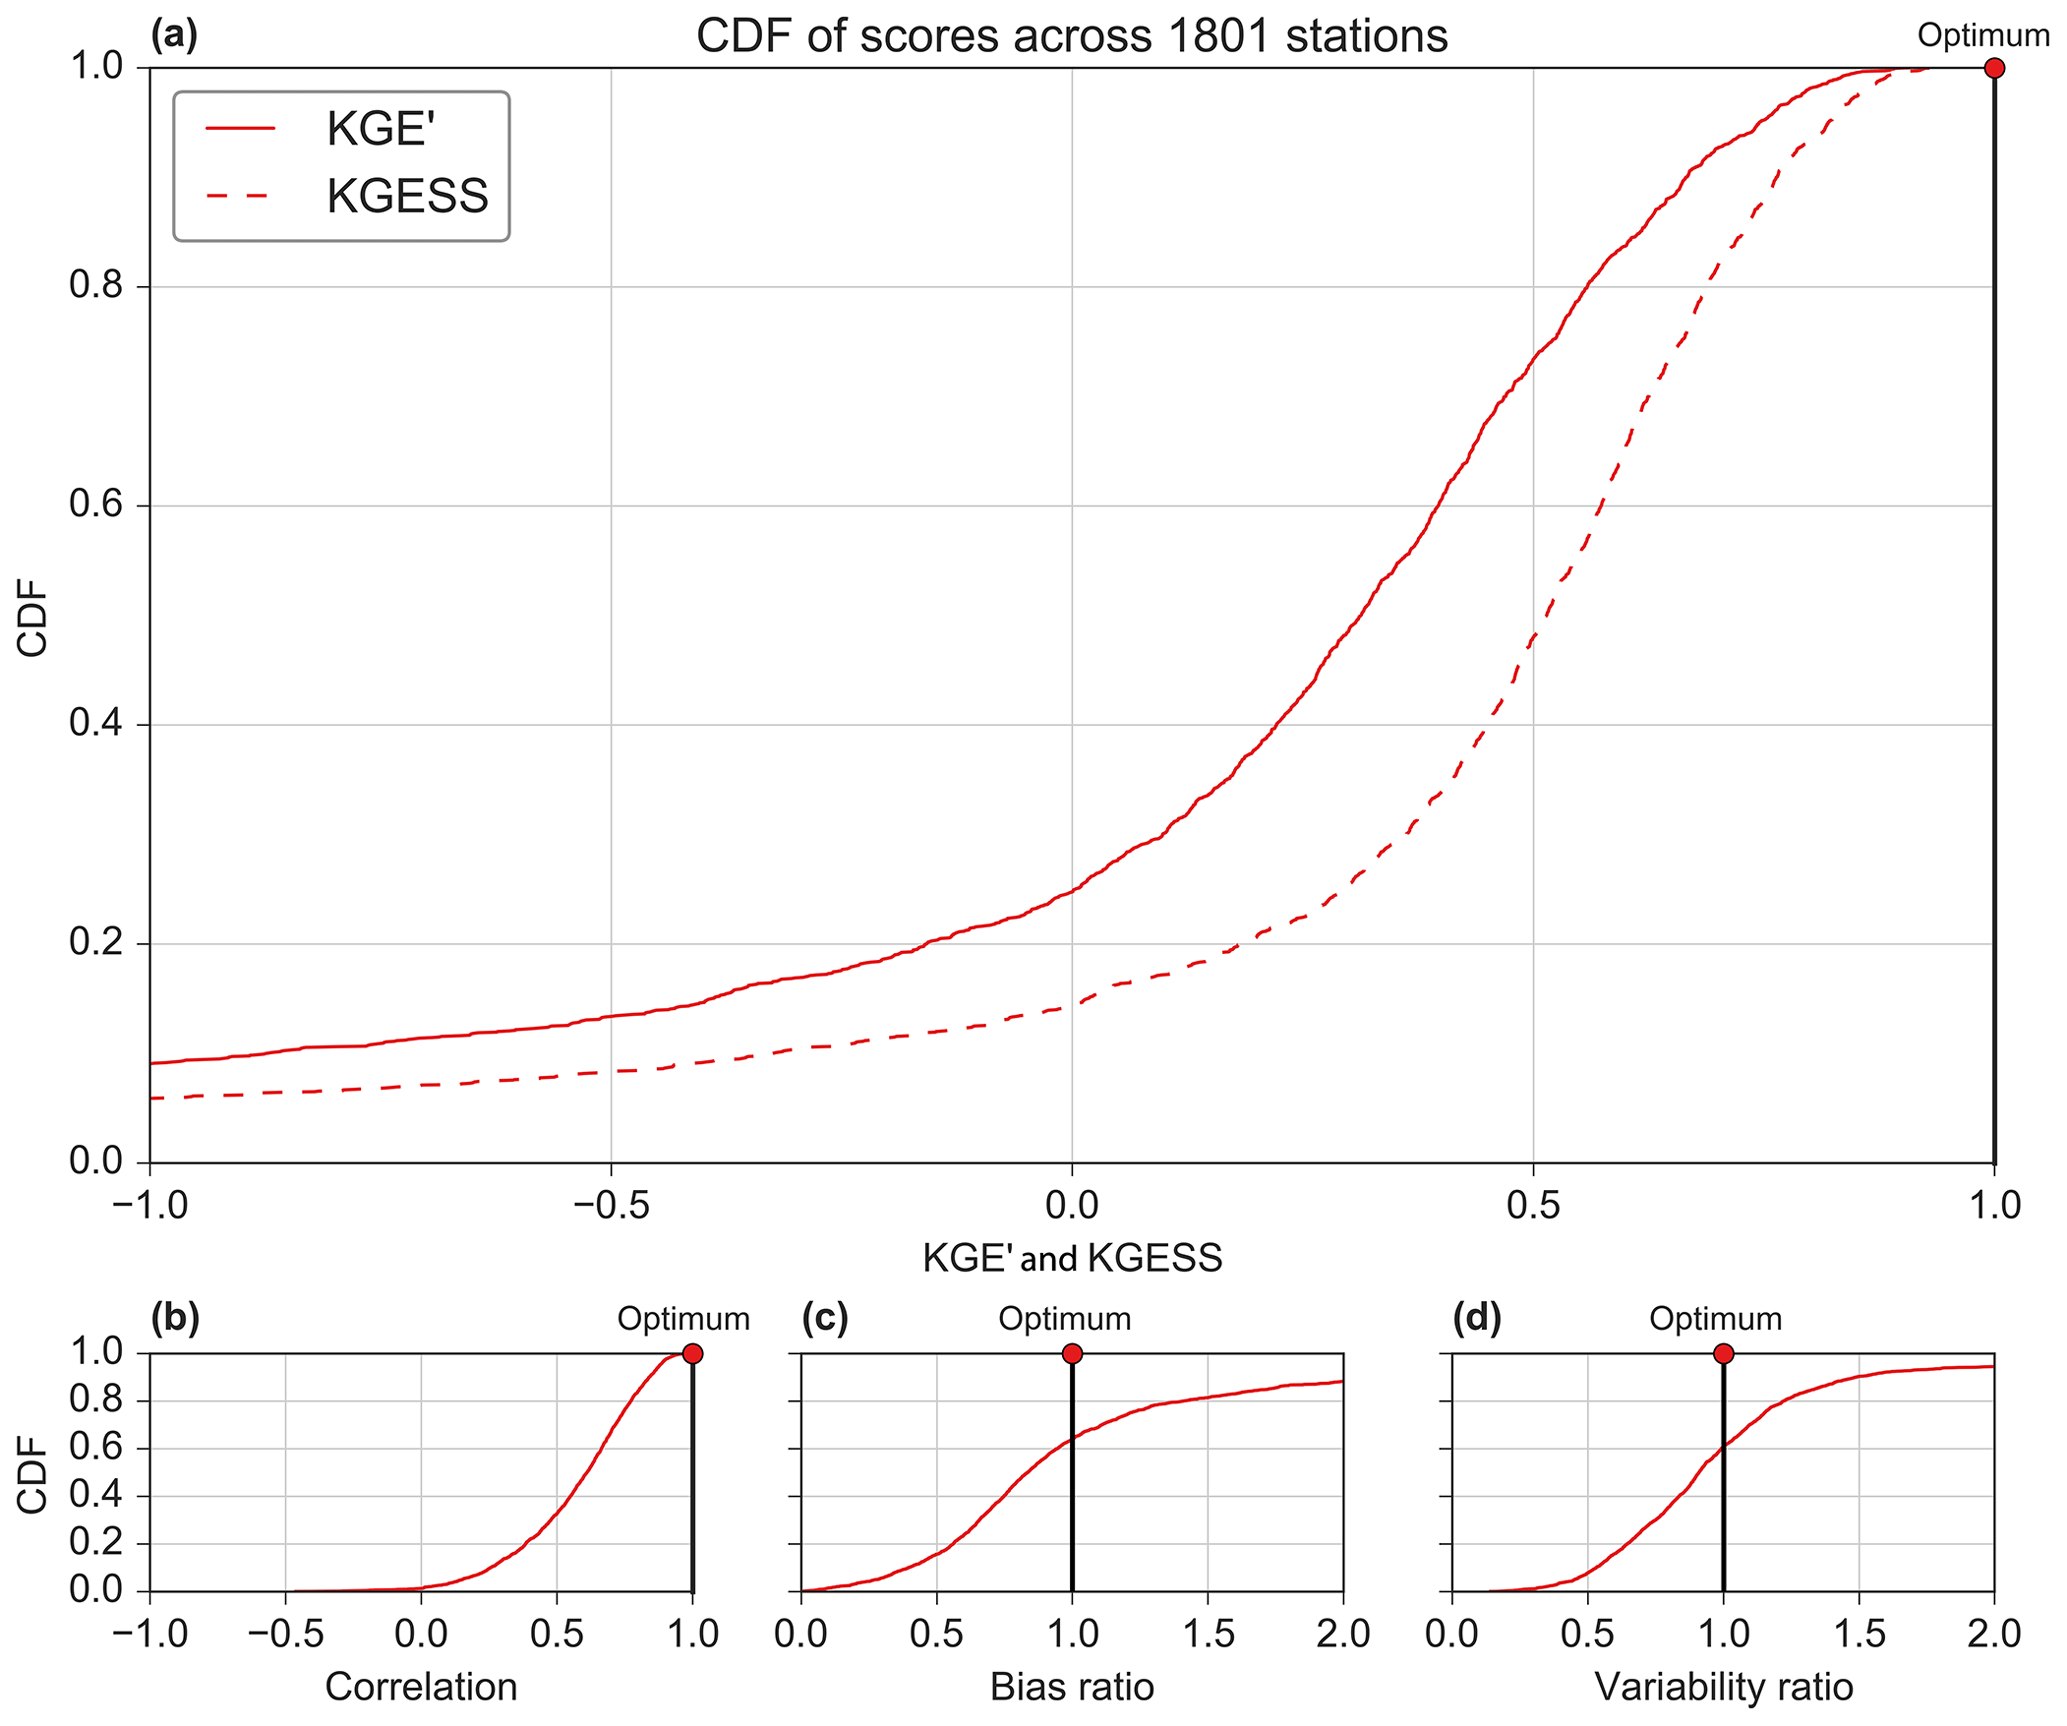
Figure 4Cumulative distribution function (CDF) of performance metrics across all 1801 stations. Modified Kling–Gupta efficiency (KGE′) and skill score (KGESS) (a) with decomposition of KGE′ into Pearson correlation (b), bias ratio (c), and variability ratio (d). The red dot marks the optimum value for each metric.
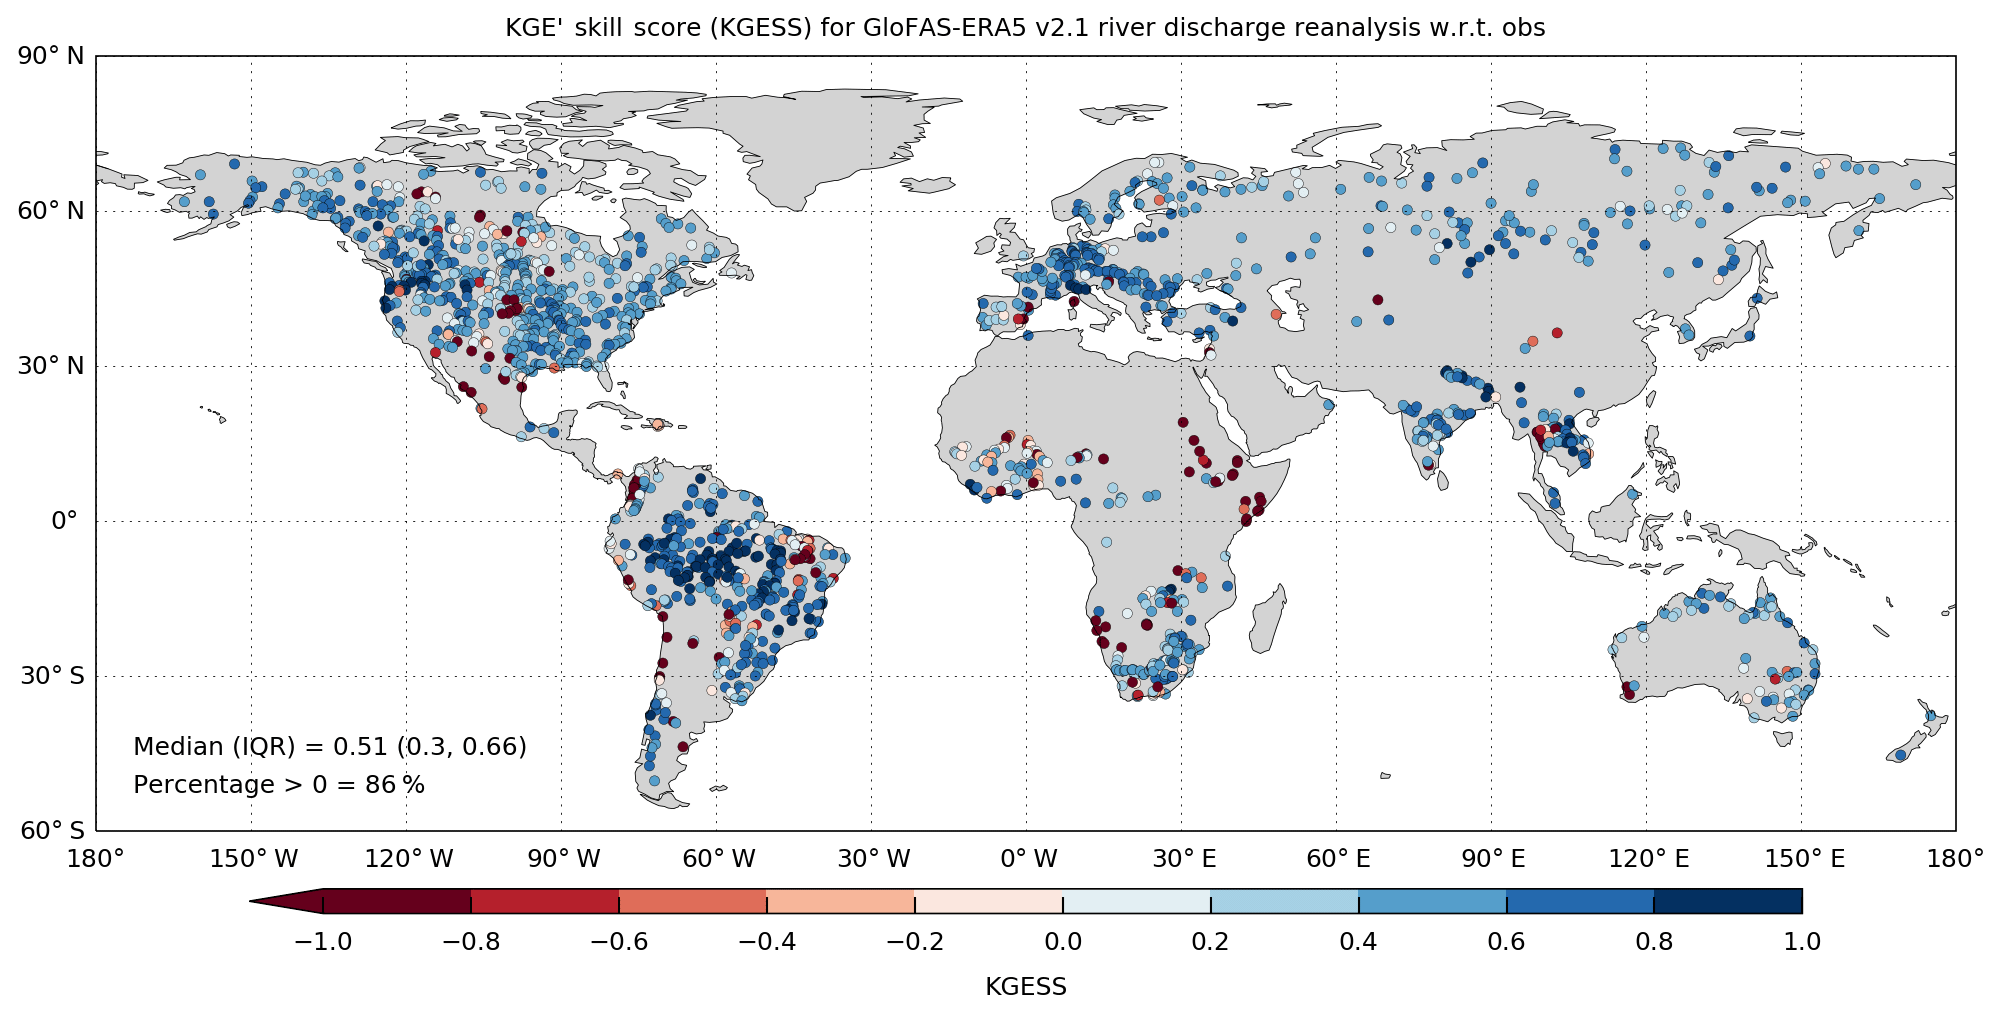
Figure 5Modified Kling–Gupta efficiency skill score (KGESS) for GloFAS-ERA5 river discharge reanalysis against 1801 observation stations. Optimum value of KGESS is 1. Blue (red) dots show catchments with positive (negative) skill.
4.2 Decomposition into correlation, bias, and variability
An advantage with the KGE′ is that it can be decomposed into three constituent components so that greater insights can be gained into which aspects of the GloFAS-ERA5 reanalysis are driving poor and good skills. Almost all (99 %) catchments show a positive correlation (Figs. 4b and 6a) with a global median Pearson correlation coefficient of 0.61 (IQR =0.44, 0.74). Figure 4c shows that river discharge reanalysis is negatively biased in 64 % of catchments (i.e. bias ratio <1) with a global median bias ratio of 0.84 (IQR =0.62, 1.21). In the evaluation of their global river simulation, Lin et al. (2019) consider a percentage bias within ±20 % (equivalent to a bias ratio within 0.8 to 1.2) to be very good. Whilst only 28 % of stations meet this criterion for the GloFAS-ERA5 reanalysis, results are in line with simulations in Lin et al. (2019). The worst performing catchments (dark red KGESS dots in Fig. 5) are predominantly driven by very large positive biases (dark blue dots in Fig. 6b) in dryer rivers of the central United States, Africa, and eastern Brazil, as well as the western coast of South America; in total 12 % of catchments have a bias ratio >2 (equivalent to a percent bias >100 %). Figure 4d (shown spatially in Fig. 6c) shows lower variability in GloFAS-ERA5 reanalysis than observations in 61 % of catchments (i.e. variability ratio <1), but errors in variability are less severe than bias errors with a global median variability ratio of 0.91 (IQR =0.69, 1.15).
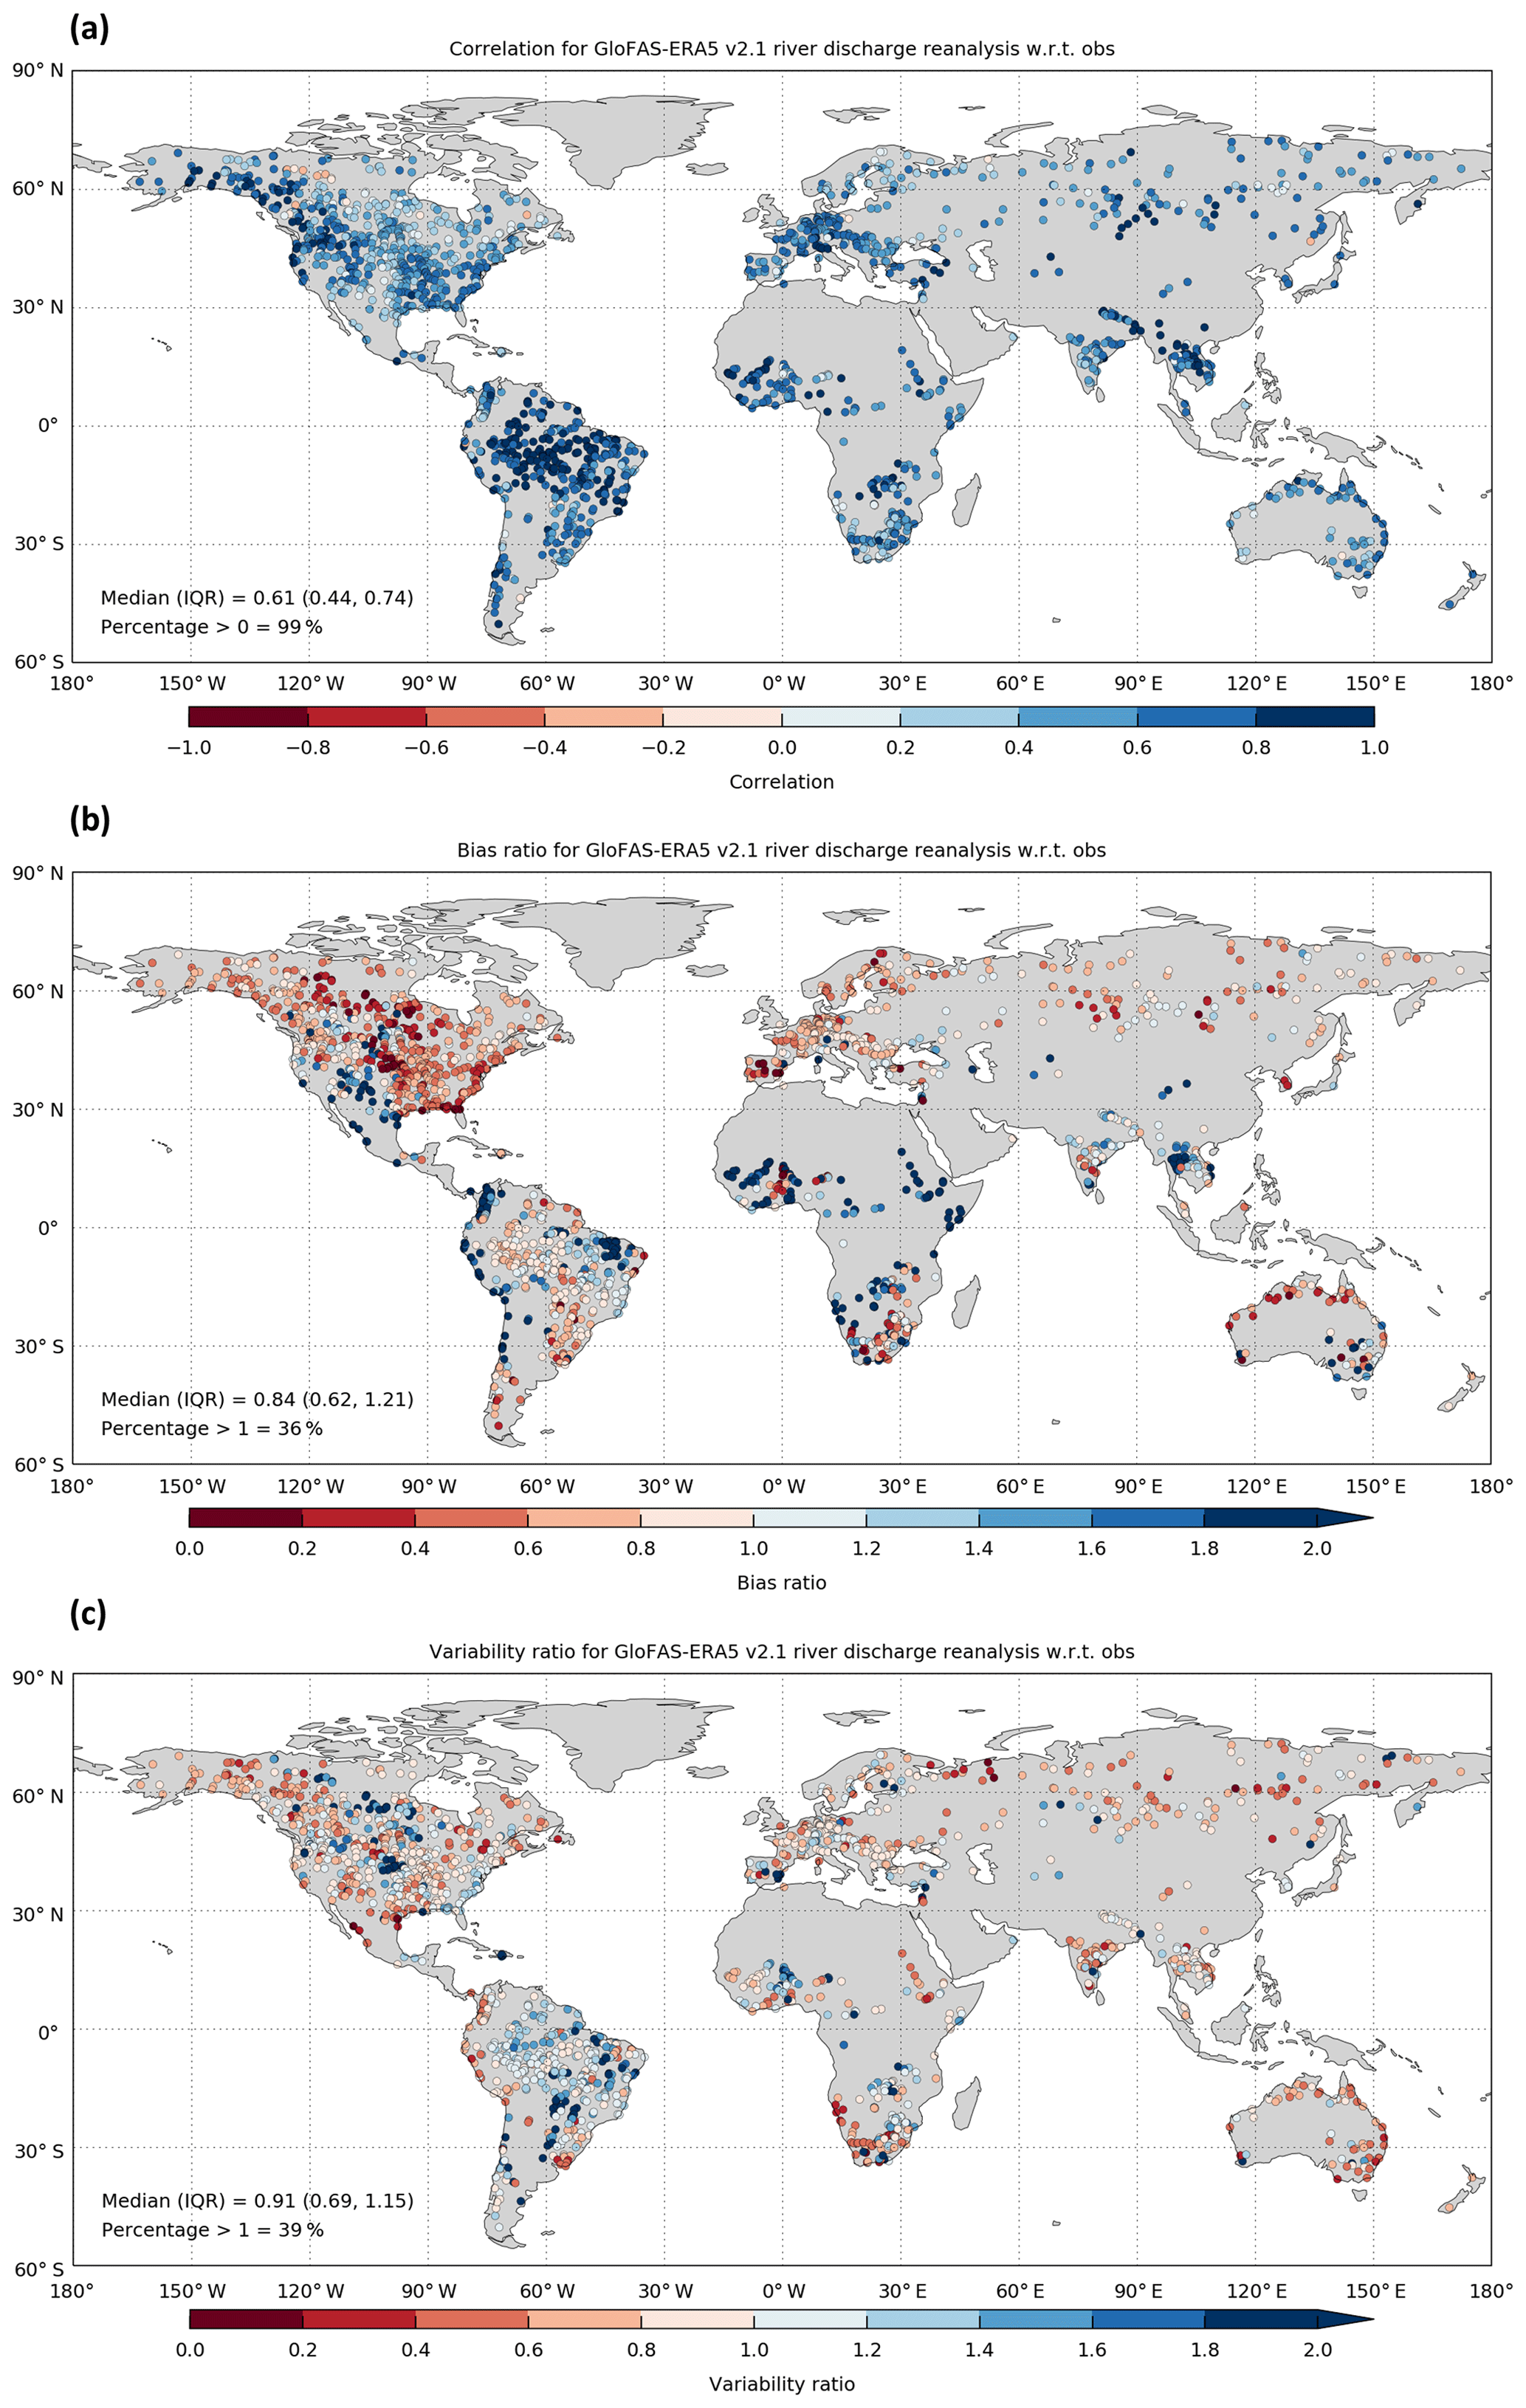
Figure 6Decomposition of the Modified Kling–Gupta efficiency (KGE′) into its three components: Pearson correlation (a), bias ratio (b), and variability ratio (c) for GloFAS-ERA5 river discharge reanalysis against 1801 observation stations. The optimum value for each of the three KGE′ components is 1. Blue (red) dots represent positive (negative) values.
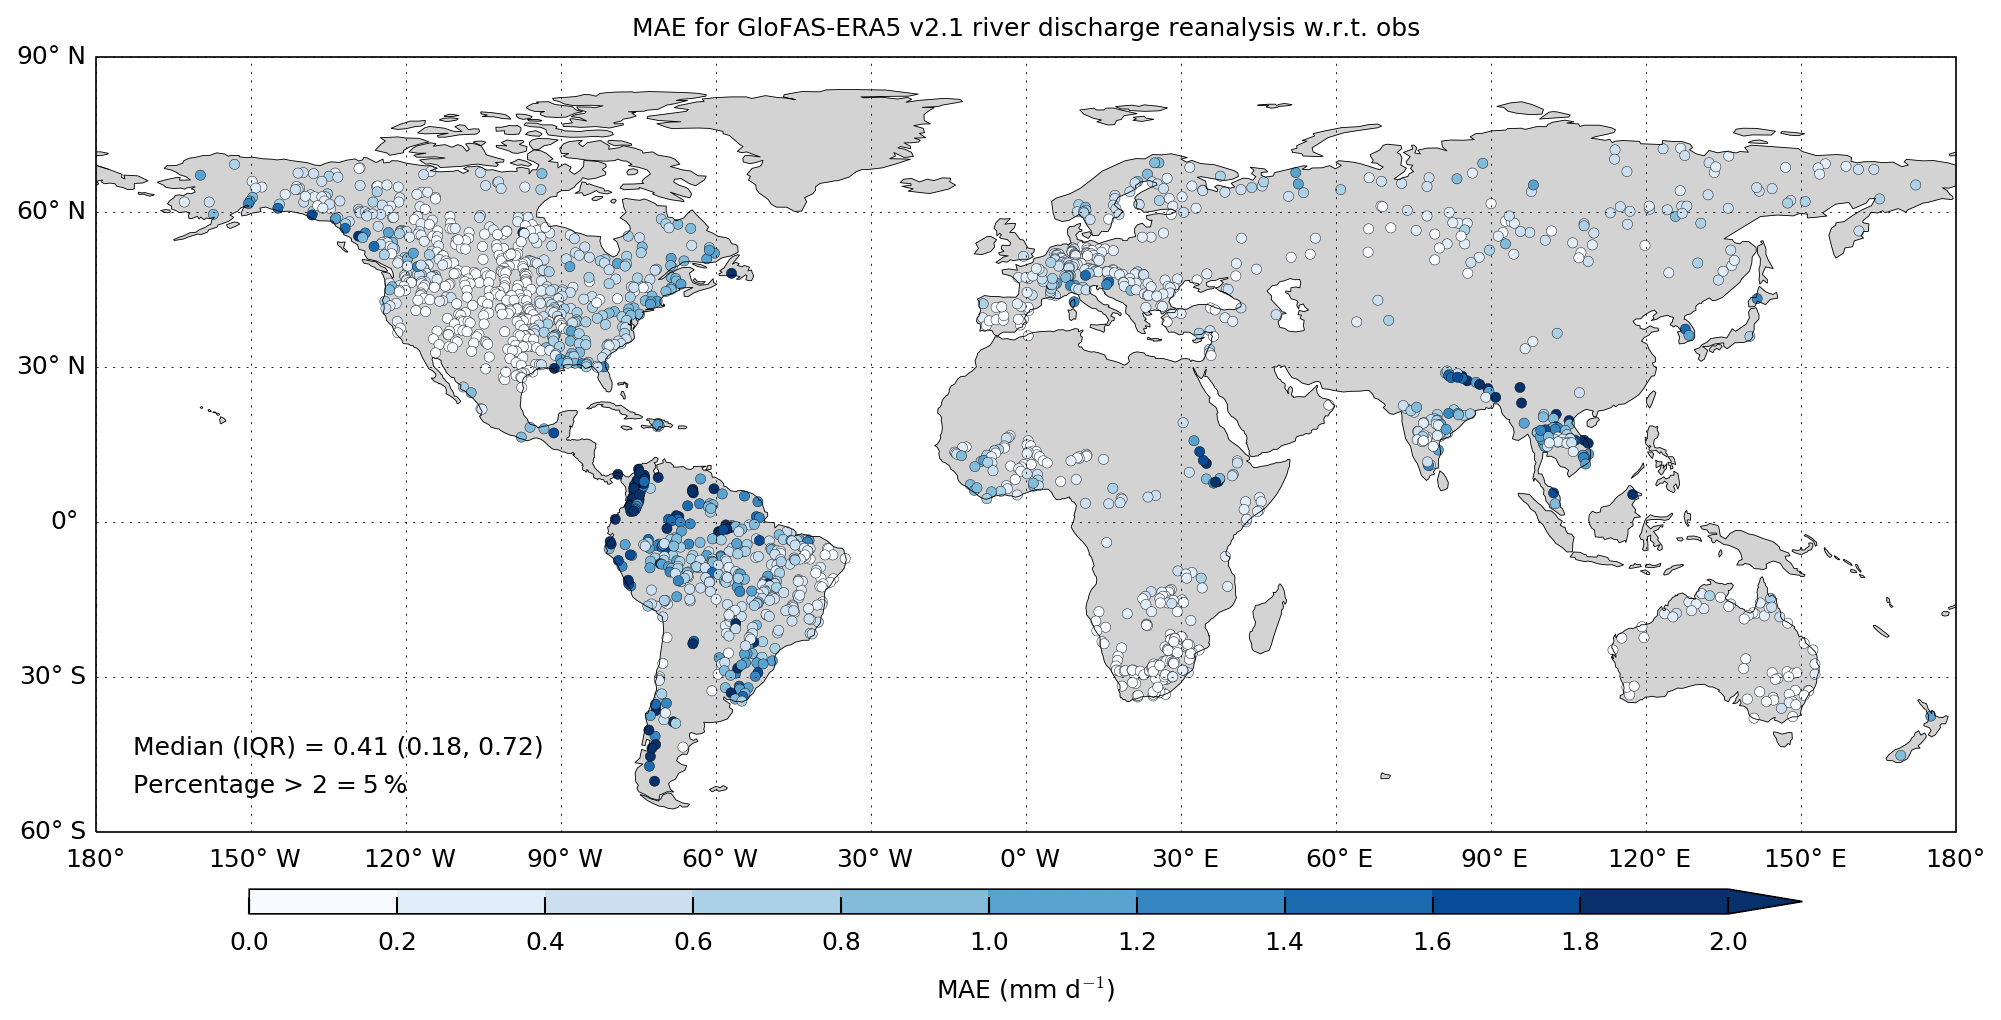
Figure 7Mean absolute error (MAE) for GloFAS-ERA5 reanalysis against 1801 observation stations. Units for both reanalysis and observations have been converted from cubic metres per second (m3 s−1) to runoff depth across the catchment area (mm d−1) to allow direct comparison of the magnitude of errors. Optimum value of MAE is 0; catchments with larger magnitude of errors are darker shades of blue dots.
It is important to also look at the average magnitude of errors as a small over/under estimation in dry rivers can produce large percentage biases (and hence bias ratios). This was done by converting the units of both the reanalysis and observation time series from cubic metres per second (m3 s−1) to runoff depth across the catchment area in millimetres per day (mm d−1) to allow direct comparison between catchments of different sizes and then computing the mean absolute error (MAE) metric (Fig. 7). The global median MAE is 0.41 mm d−1 (IQR =0.18 mm d−1, 0.72 mm d−1). Most areas with a bias ratio >2 (in Fig. 6b), namely much of Africa, the central United States, and eastern Brazil, have in fact a low absolute magnitude of errors given their dry locations. Other notable areas with a low absolute magnitude of errors include large parts of India, South East Asia, and Australia. There are, however, catchments on the western coast of South America, Sudan, and Ethiopia and tributaries of the River Ganges with a large MAE.
4.3 Performance by month
Figure 8 shows the global performance of GloFAS-ERA5 reanalysis for each month across all 1801 stations. Hydrological simulation skill is relatively consistent across each month with median KGESS ranging between 0.32 to 0.41 (Fig. 8a). The April to October months have the highest skill, with November to March having a higher proportion of catchments with negative skill. When the KGE′ is decomposed into correlation, bias, and variability components at the monthly scale (Fig. 8b–d, respectively), it shows that the months with higher incidence of negative KGESS are driven by a higher proportion of catchments with large positive biases in those months. Correlation and variability error metrics do not vary much from one month to the next in comparison to bias errors.
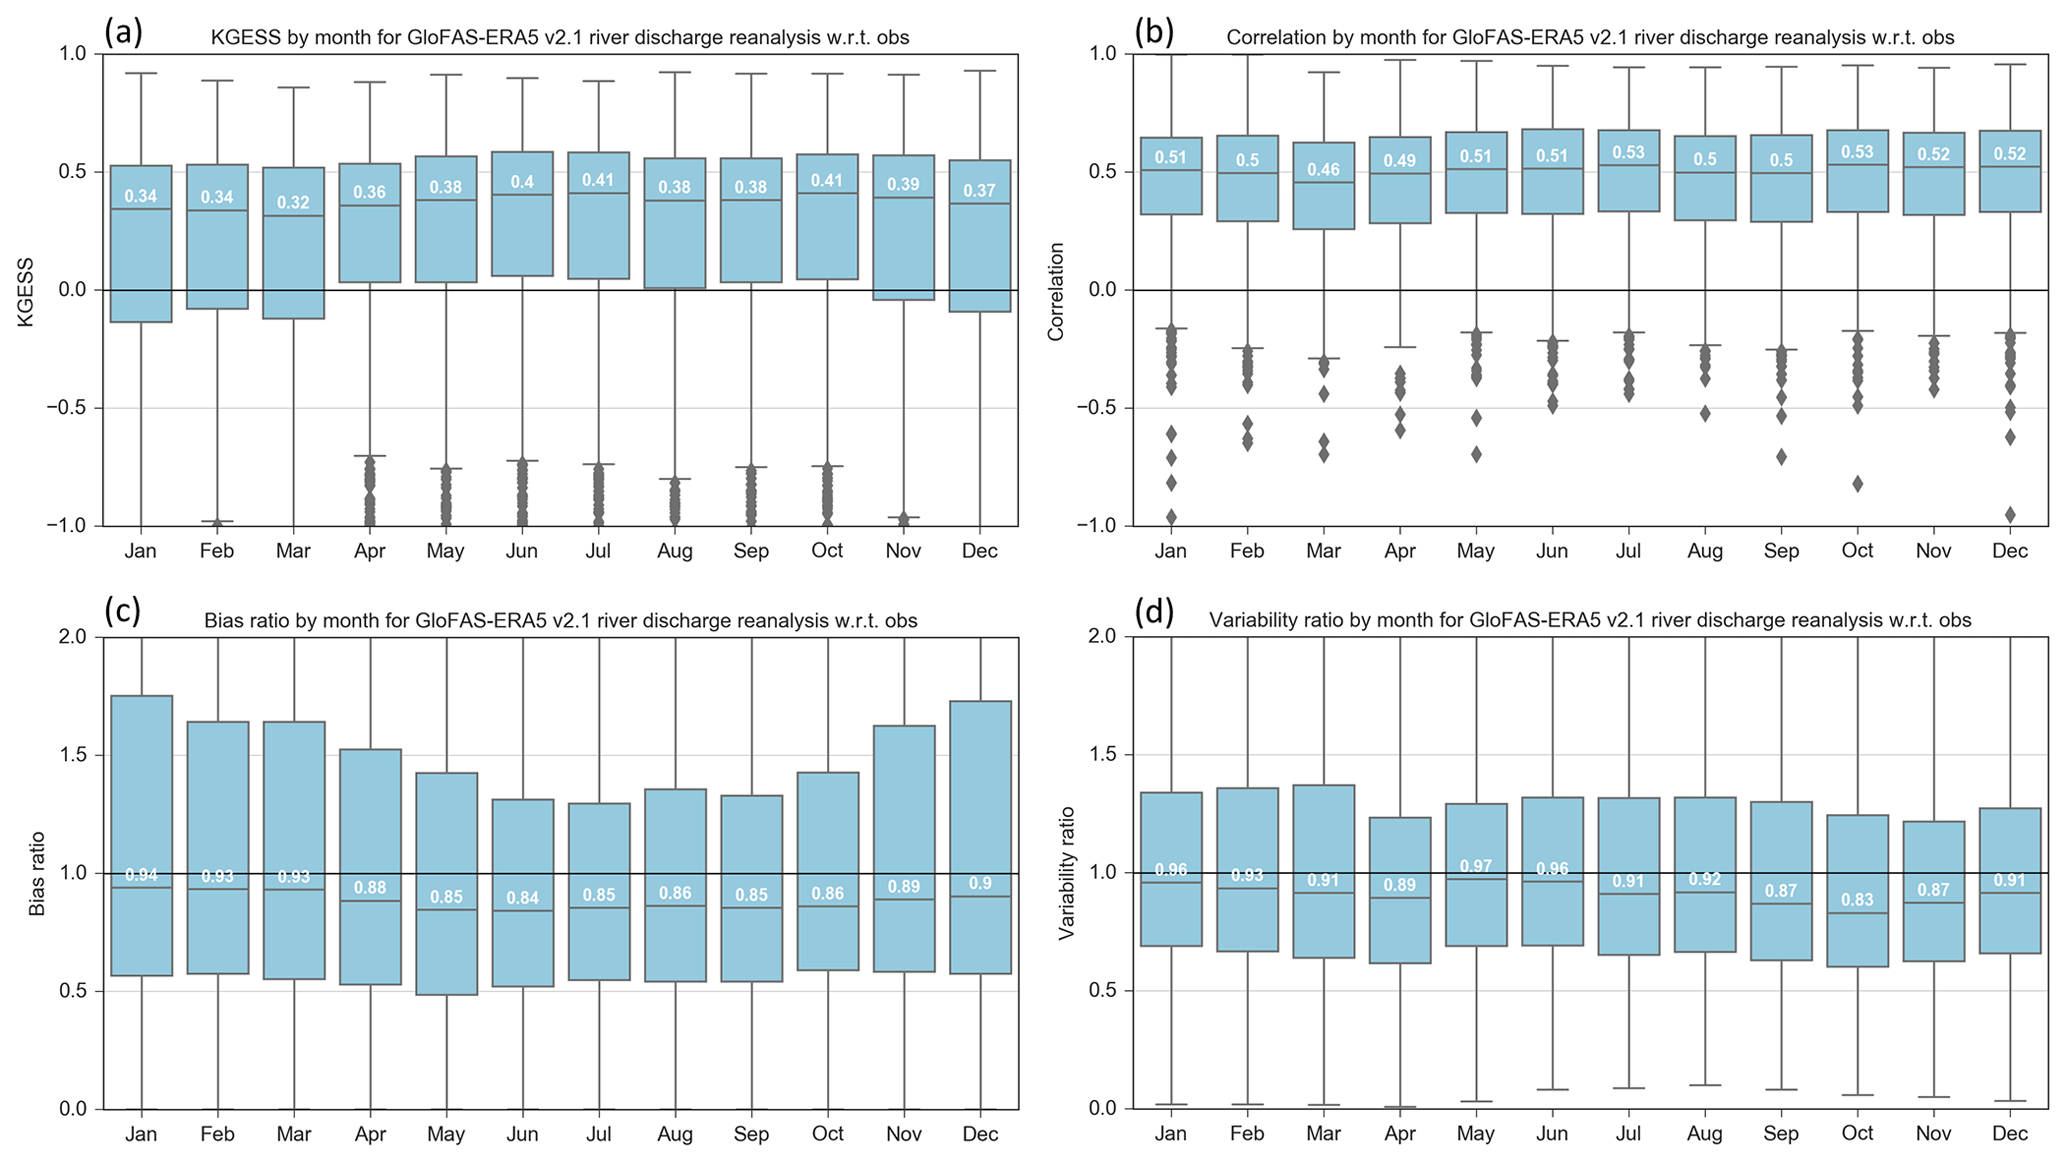
Figure 8Performance metrics for each month for all 1801 stations. Modified Kling–Gupta efficiency skill score (KGESS) (a) with decomposition of KGE′ into Pearson correlation (b), bias ratio (c), and variability ratio (d). Boxes represent the IQR and horizontal grey line the median. Whiskers extend to the most extreme data point unless the data point is more than 1.5 times the IQR from the box and is instead represented as an outlier (grey diamond).
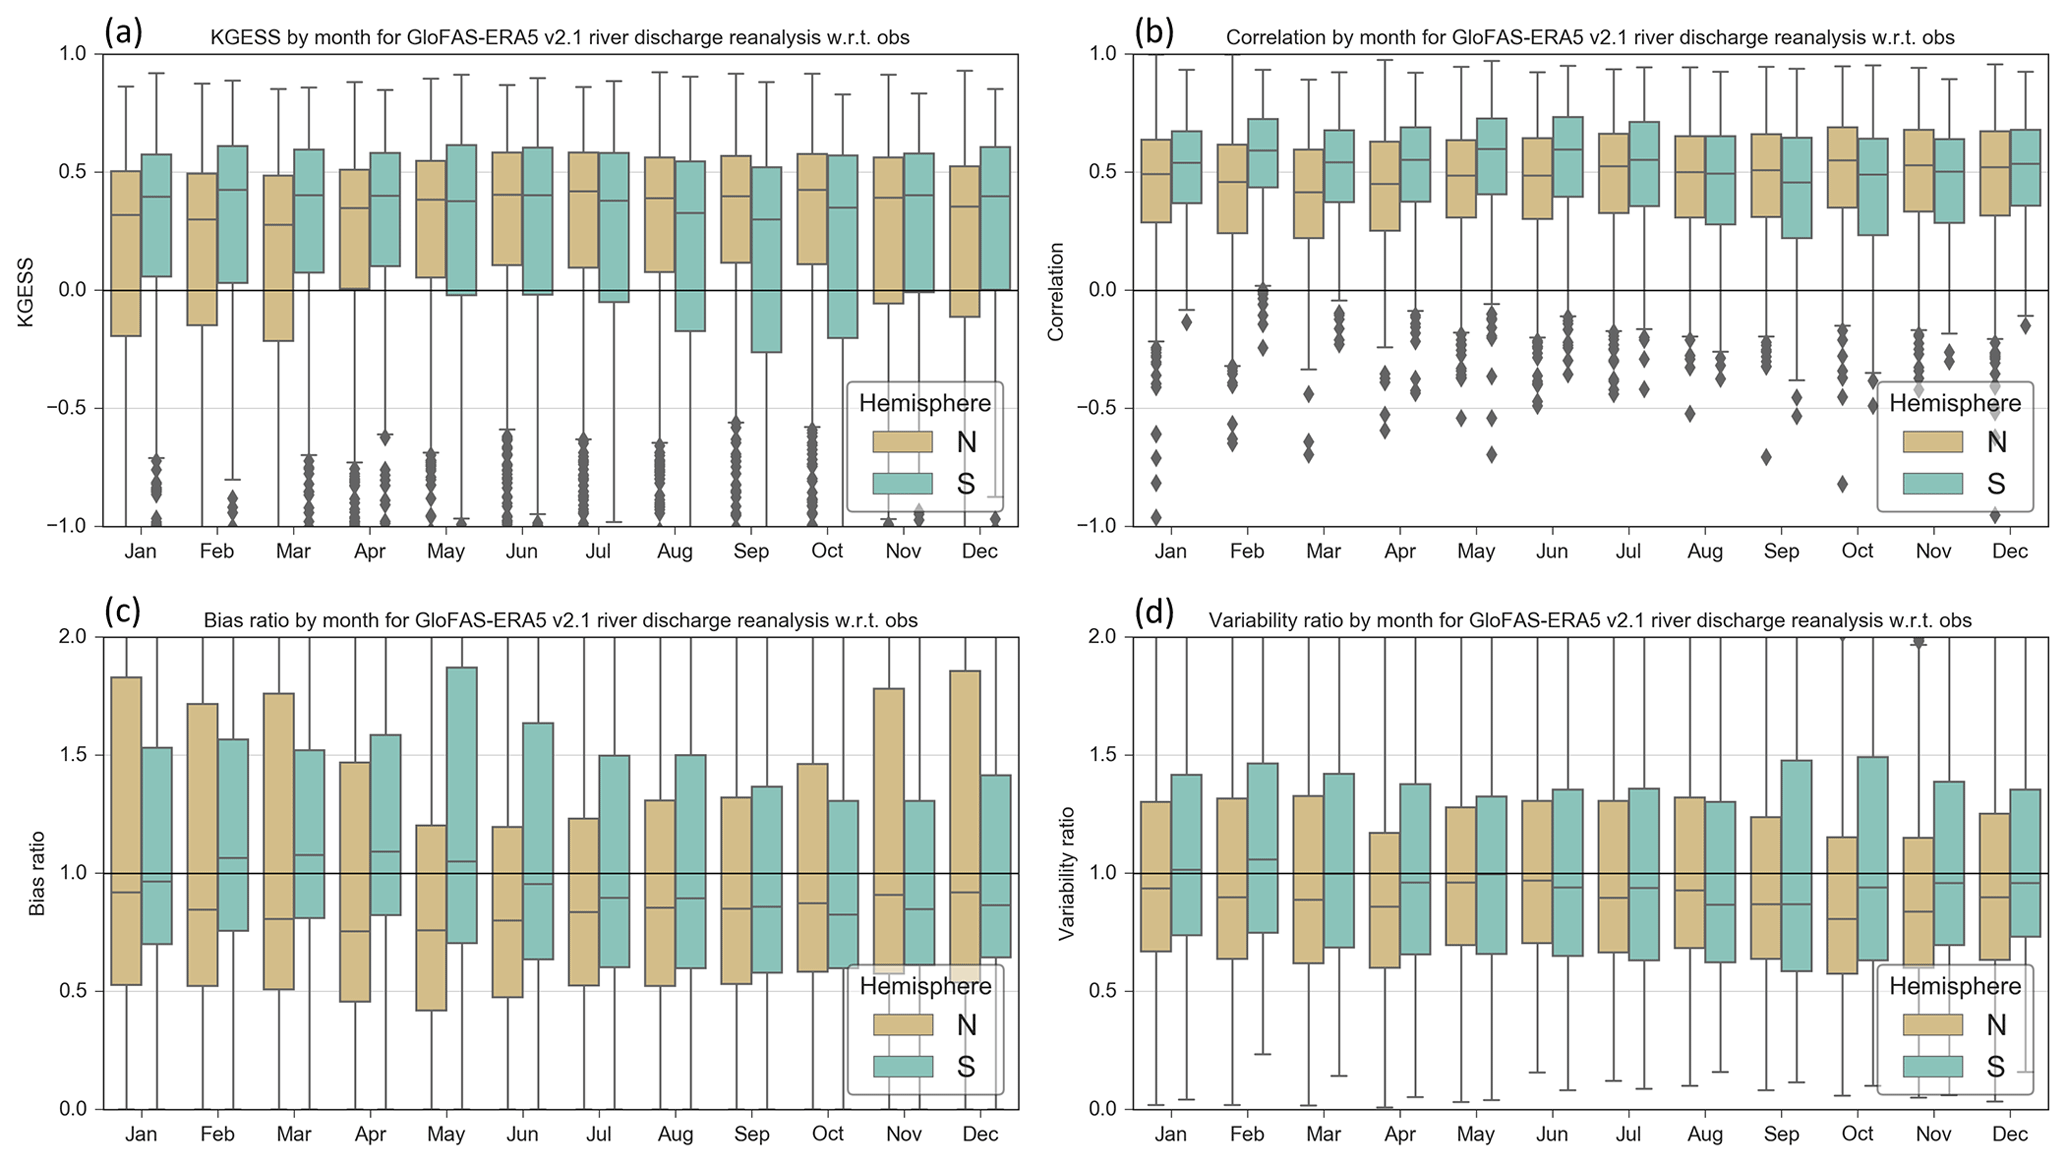
Figure 9As in Fig. 8 but by hemisphere: Northern Hemisphere (n=1268 stations) as brown boxes and Southern Hemisphere (n=533 stations) as green boxes.
Results are grouped into Northern Hemisphere (n=1268 stations) and Southern Hemisphere (n=533 stations) in Fig. 9. The overall GloFAS-ERA5 monthly performance in each hemisphere does not change substantially from the global analysis (Fig. 8). Nevertheless, there are some differences. The KGESS and bias ratio from the Northern Hemisphere (Fig. 9a and c, respectively) tend to follow the global analysis most strongly (i.e. Fig. 8a and c, respectively), which is not surprising given 70 % of all stations are located in the Northern Hemisphere. However, a higher proportion of Southern Hemisphere stations show large positive biases from April to June compared to November to March in the Northern Hemisphere. The largest proportion of stations with negative KGESS in the Southern Hemisphere is found from August to October (Fig. 9a). These months correspond with a lower Southern Hemisphere correlation (Fig. 9b) and a higher proportion of stations with large positive variability ratios (i.e. GloFAS-ERA5 has higher variability than observed river discharge).
4.4 Performance by catchment area
The skill of GloFAS-ERA5 river discharge reanalysis grouped into seven catchment area categories is shown in Fig. 10. In general, skill is lowest for catchments in the three categories <10 000 km2 with median KGESS =0.21 (n=39), 0.4 (n=41), and 0.42 (n=53), respectively. Performance improves as catchment size increases with median KGESS =0.56 for catchments >50 000 km2. It must be noted that results are affected by uneven samples of catchment sizes available within the GloFAS observation database, with catchments between 10 000 and 50 000 km2 being dominant (n=1013) and smaller catchments being under-represented.
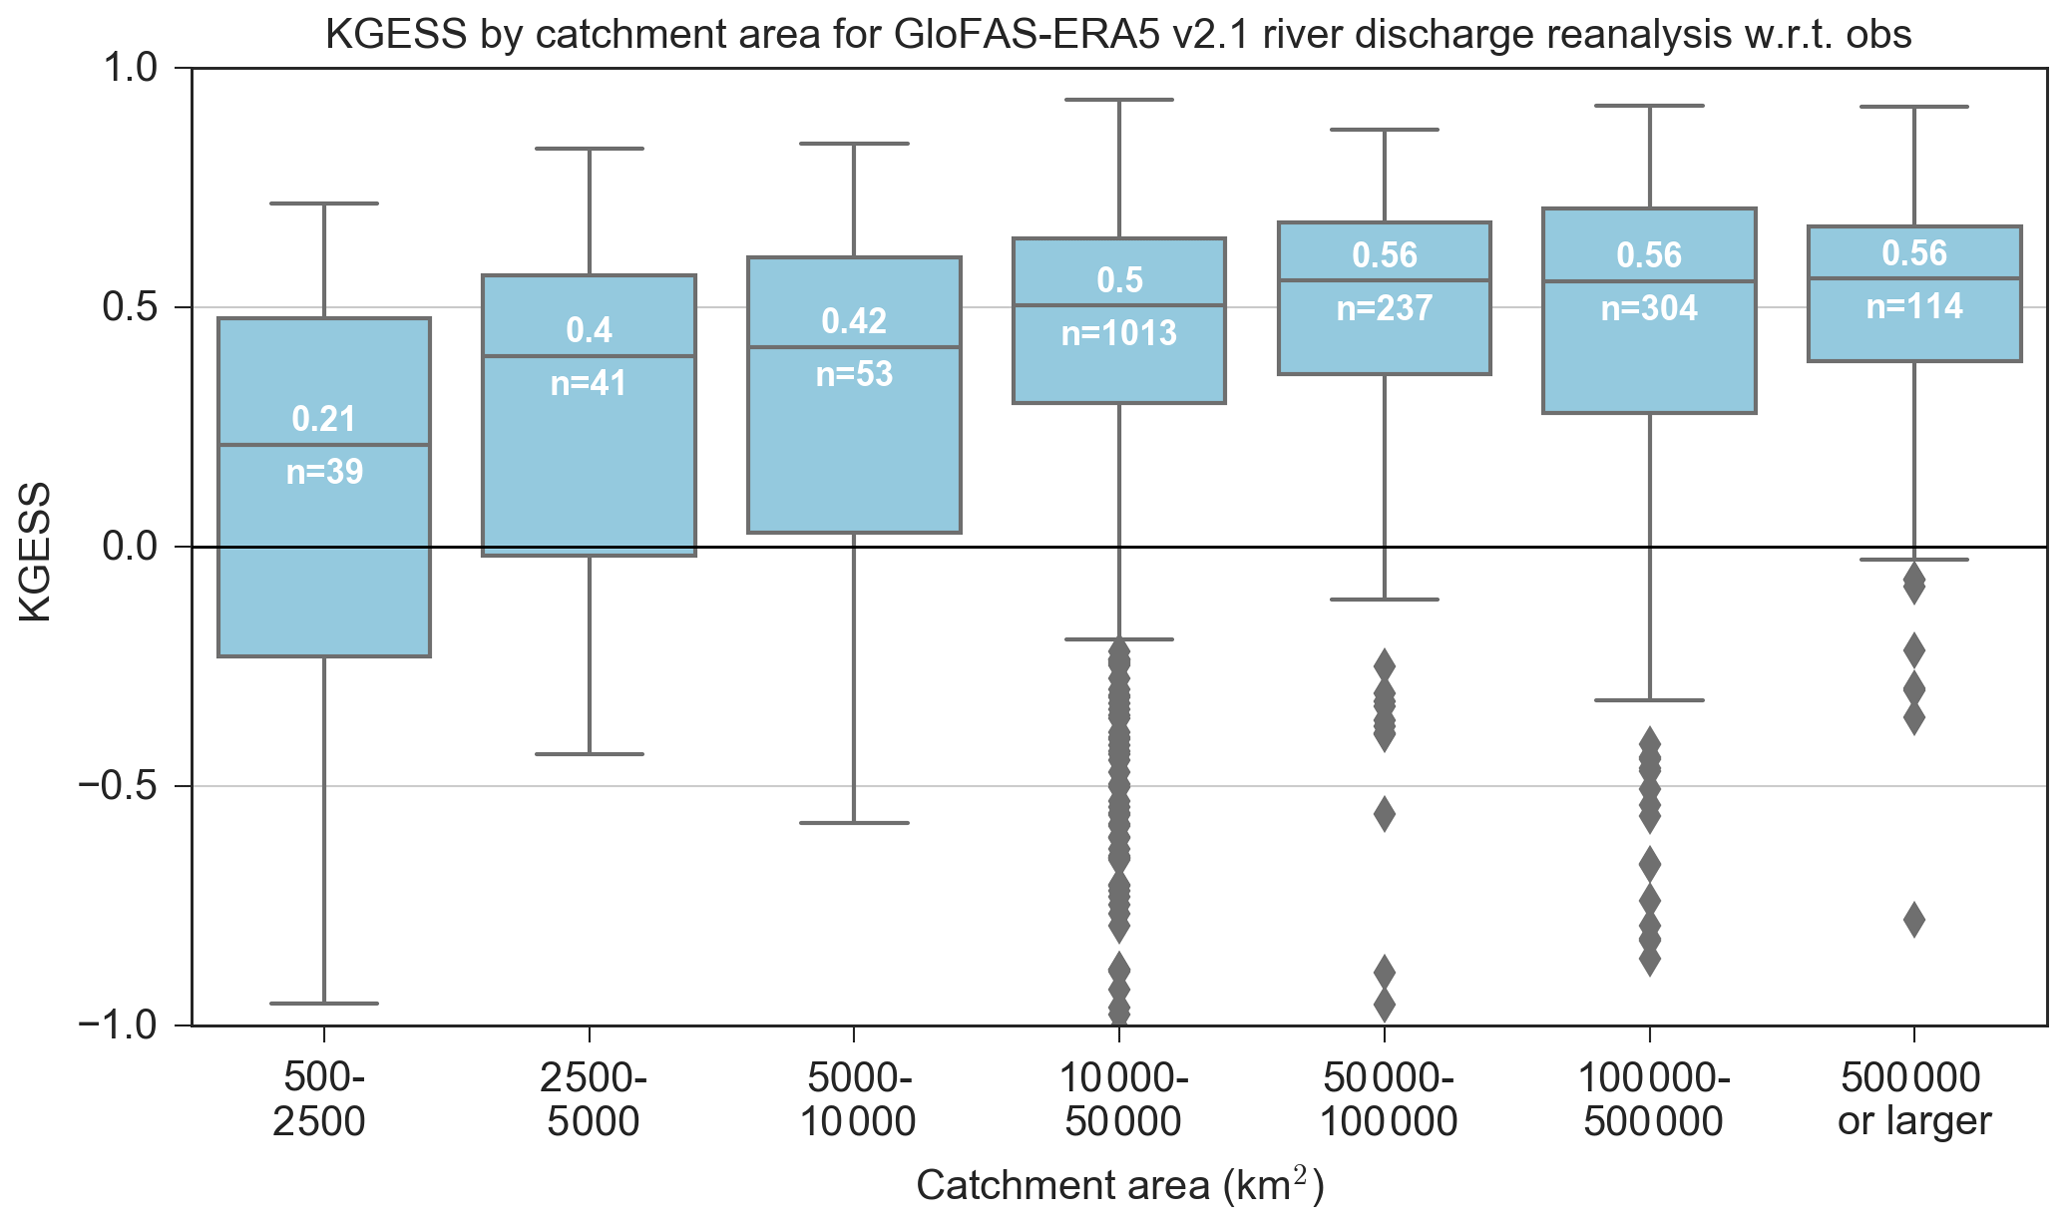
Figure 10Modified Kling–Gupta efficiency skill score (KGESS) grouped into seven catchment area categories. Box and whisker descriptions are as in Fig. 8.

Figure 11The GloFAS-ERA5 river discharge reanalysis landing page in the C3S Climate Data Store (CDS; https://cds.climate.copernicus.eu/cdsapp#!/dataset/cems-glofas-historical?tab=overview).
4.5 Limitations
This first evaluation has found the dataset to be hydrologically skilful in the vast majority of catchments tested, although the strength of skill can vary considerably depending on location. The degradation in skill, as defined using KGESS, is the combination of (lower) correlation, (larger) bias errors, and (larger) variability errors. The evaluation provides users with an overview of the global-scale quality of the dataset, although users are advised to undertake a more in-depth evaluation of the dataset for their region of interest. A key limitation of the dataset is the large biases identified in several regions (see above). The attribution of such biases in the GloFAS-ERA5 reanalysis is outside the scope of this data paper, but ongoing investigations such as Zsoter et al. (2019) have shown that biases can be introduced by the real-time land data assimilation within the HTESSEL land surface model. Another expected cause of differences between river discharge reanalysis and observations is due to human modification within catchments and river channels (e.g. Harrigan et al., 2014). It is estimated that just 37 % of rivers remain free-flowing globally with the construction of reservoirs and dams the main contributor to loss of connectivity (Grill et al., 2019). While GloFAS-ERA5 reanalysis does represent major dams and reservoirs on the modelled river network, simplified reservoir operating parameters were used based on expert opinion (outlined in Zajac et al., 2017) due to lack of availability of global operational release records. Given the fundamental dependence of the dataset on ERA5, it would be pertinent for users to be aware of the known ERA5 issues, which can be found in the ERA5 documentation: https://confluence.ecmwf.int/display/CKB/ERA5 (last access: 28 June 2020). In particular, “rain bombs” are known to occur from time to time in the numerical weather prediction model used by ERA5 whereby extremely large rainfall totals are generated, although these are rare (∼10 episodes per year) and happen mostly in isolated grid points over orographic areas in Africa (Hersbach et al., 2020). However, their impact on hydrology has not been assessed. As with any reanalysis product, care must be taken when calculating long-term trends in river discharge as discontinuities may be present in the record due to changes in the global observing system entering ERA5.
The GloFAS-ERA5 river discharge reanalysis is provided through the European Commission Copernicus Emergency Management Service (CEMS) and follows the Copernicus open data policy that users shall have free, full, and open access to Copernicus service information. With the drive for open data comes challenges. In the era of big data, it is clear that traditional ways of hosting and disseminating large earth system datasets is no longer fit for purpose. An exciting development in the way large climate datasets are discovered, accessed, and used is the Copernicus Climate Change Service (C3S) Climate Data Store (CDS; https://cds.climate.copernicus.eu/cdsapp#!/home, last access: 28 June 2020). The CDS hosts various global and regional reanalysis products, gridded records for essential climate variables (ECVs), in which river discharge is included as a key terrestrial ECV, and much more. The CDS requires standardization of data and metadata so that datasets are more useable and discoverable through the CDS metadata pages. The CDS website provides easy access to data through user-friendly download forms. There is also a CDS Python application programming interface (API) to allow programmatic access to data. An innovative feature of the CDS is the Toolbox, which makes it easier to handle large volumes of data by allowing users to make custom applications, filter data by geographical region and date range, and finally present the data using maps and charts directly through the CDS cloud infrastructure.
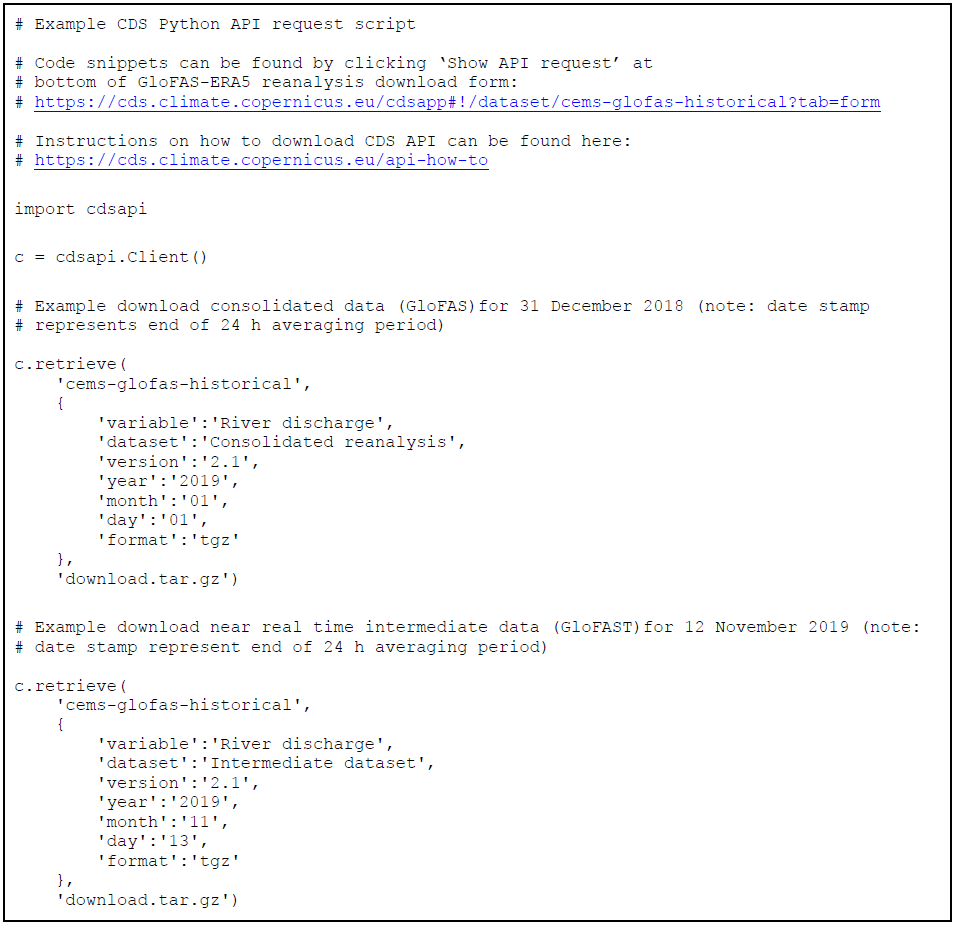
The GloFAS-ERA5 river discharge reanalysis product is available on the CDS: https://cds.climate.copernicus.eu/cdsapp#!/dataset/cems-glofas-historical?tab=overview with the following DOI: https://doi.org/10.24381/cds.a4fdd6b9 (C3S, 2019). The CDS landing page for the GloFAS-ERA5 reanalysis dataset is shown in Fig. 11. Both the long-term consolidated and the near-real-time intermediate reanalysis data are available in two ways. First, through the “Download data” tab whereby users can manually select options in a form for which data they would like to download. Second, data can be retrieved through the dedicated Python CDS API; an example API retrieval script is shown in Appendix B. Note that users must register for a CDS account (for free) before gaining access.
This paper outlines the production, description, evaluation, and access to the new GloFAS-ERA5 operational global river discharge reanalysis dataset available from 1979 and updated in near real time. This dataset is central to two key steps within GloFAS: (i) the calculation of flood thresholds against which real-time ensemble forecasts are compared to determine the probability of a flood signal and (ii) more consistent hydrometeorological initial conditions for the real-time flood and seasonal forecasts. The evaluation against observations showed that the product is skilful in 86 % of catchments according to the modified Kling–Gupta efficiency skill score against a mean flow benchmark. However, skill varies considerably with location, with several regions such as the central United States, Africa, eastern Brazil, and the western coast of South America having large systematic positive biases. The results from the evaluation are comparable with other long-term global river discharge products (e.g. Lin et al., 2019). The attribution of such biases in the GloFAS-ERA5 reanalysis is outside the scope of this data paper, but ongoing investigations such as Zsoter et al. (2019) on the biases introduced by the real-time land data assimilation within the HTESSEL land surface model will help us to better understand existing limitations. GloFAS is an operational system which undergoes constant developments with intensive research on future versions of the model. It is foreseen that a new model version will be made operational in 2021 based on the full LISFLOOD hydrological model and an improved model calibration (Alfieri et al., 2020).
The long-term and operational nature of the GloFAS-ERA5 reanalysis dataset opens avenues for further applications. Forecast evaluation activities within GloFAS now include skill assessment over longer time periods and has allowed a new operational forecast verification suite to be developed whereby the performance of the forecasts can be tracked in near real time for every river in the world. Other applications are envisaged for monitoring the global status of flood and drought conditions, the identification of hydroclimatic variability and change, and as raw input for post-processing and machine learning methods that can add further value.
The supplement related to this article is available online at: https://doi.org/10.5194/essd-12-2043-2020-supplement.
SH drafted the paper and performed the evaluation. EZ wrote the suite to produce the dataset. CB adapted the suite to produce the dataset operationally. FW and CB were responsible for the integration of the dataset into the Climate Data Store. LA, CP, PS, HC, and FP helped frame the paper. All co-authors contributed to the editing of the paper and to the discussion and interpretation of results.
The authors declare that they have no conflict of interest.
We thank colleagues from the Copernicus Climate Change Service (C3S) for helping with ingesting the dataset into the Climate Data Store (CDS) and Cinzia Mazzetti (ECMWF) and Domenico Nappo (JRC) for helpful discussions during the revision regarding LISFLOOD. The providers of observed river discharge observations are greatly thanked, as well as both GloFAS partners and the Global Runoff Data Centre (GRDC), 56068 Koblenz, Germany.
This research has been supported by the European Commission Copernicus Emergency Management Service (CEMS) (grant no. 198702).
This paper was edited by David Carlson and reviewed by two anonymous referees.
Alfieri, L., Burek, P., Dutra, E., Krzeminski, B., Muraro, D., Thielen, J., and Pappenberger, F.: GloFAS – global ensemble streamflow forecasting and flood early warning, Hydrol. Earth Syst. Sci., 17, 1161–1175, https://doi.org/10.5194/hess-17-1161-2013, 2013.
Alfieri, L., Lorini, V., Hirpa, F. A., Harrigan, S., Zsoter, E., Prudhomme, C., and Salamon, P.: A global streamflow reanalysis for 1980–2018, J. Hydrol., 6, 100049, https://doi.org/10.1016/j.hydroa.2019.100049, 2020.
Balsamo, G., Beljaars, A., Scipal, K., Viterbo, P., van den Hurk, B., Hirschi, M., and Betts, A. K.: A Revised Hydrology for the ECMWF Model: Verification from Field Site to Terrestrial Water Storage and Impact in the Integrated Forecast System, J. Hydrometeorol., 10, 623–643, https://doi.org/10.1175/2008JHM1068.1, 2009.
Beck, H. E., van Dijk, A. I. J. M., de Roo, A., Dutra, E., Fink, G., Orth, R., and Schellekens, J.: Global evaluation of runoff from 10 state-of-the-art hydrological models, Hydrol. Earth Syst. Sci., 21, 2881–2903, https://doi.org/10.5194/hess-21-2881-2017, 2017.
Burek, P., van der Knijff, J. M., and de Roo, A. P. J. D.: LISFLOOD – Distributed Water Balance and Flood Simulation Model – Revised User Manual, Publications Office of the European Union, https://doi.org/10.2788/24719, 2013.
C3S: River discharge and related historical data from the Global Flood Awareness System, Copernicus Climate Change Service (C3S) Climate Data Store (CDS), https://doi.org/10.24381/cds.a4fdd6b9, 2019.
Dee, D. P., Uppala, S. M., Simmons, A. J., Berrisford, P., Poli, P., Kobayashi, S., Andrae, U., Balmaseda, M. A., Balsamo, G., Bauer, P., Bechtold, P., Beljaars, A. C. M., van de Berg, L., Bidlot, J., Bormann, N., Delsol, C., Dragani, R., Fuentes, M., Geer, A. J., Haimberger, L., Healy, S. B., Hersbach, H., Hólm, E. V., Isaksen, L., Kållberg, P., Köhler, M., Matricardi, M., McNally, A. P., Monge-Sanz, B. M., Morcrette, J.-J., Park, B.-K., Peubey, C., de Rosnay, P., Tavolato, C., Thépaut, J.-N., and Vitart, F.: The ERA-Interim reanalysis: configuration and performance of the data assimilation system, Q. J. Roy. Meteor. Soc., 137, 553–597, https://doi.org/10.1002/qj.828, 2011.
de Rosnay, P., Balsamo, G., Albergel, C., Muñoz-Sabater, J., and Isaksen, L.: Initialisation of Land Surface Variables for Numerical Weather Prediction, Surv. Geophys., 35, 607–621, https://doi.org/10.1007/s10712-012-9207-x, 2014.
Döll, P., Kaspar, F., and Lehner, B.: A global hydrological model for deriving water availability indicators: model tuning and validation, J. Hydrol., 270, 105–134, https://doi.org/10.1016/S0022-1694(02)00283-4, 2003.
Emerton, R. E., Stephens, E. M., Pappenberger, F., Pagano, T. C., Weerts, A. H., Wood, A. W., Salamon, P., Brown, J. D., Hjerdt, N., Donnelly, C., Baugh, C. A., and Cloke, H. L.: Continental and global scale flood forecasting systems, WIREs Water, 3, 391–418, https://doi.org/10.1002/wat2.1137, 2016.
Emerton, R., Zsoter, E., Arnal, L., Cloke, H. L., Muraro, D., Prudhomme, C., Stephens, E. M., Salamon, P., and Pappenberger, F.: Developing a global operational seasonal hydro-meteorological forecasting system: GloFAS-Seasonal v1.0, Geosci. Model Dev., 11, 3327–3346, https://doi.org/10.5194/gmd-11-3327-2018, 2018.
Fekete, B. M., Vörösmarty, C. J., and Grabs, W.: High-resolution fields of global runoff combining observed river discharge and simulated water balances, Global Biogeochem. Cy., 16, 15-1–15-10, https://doi.org/10.1029/1999GB001254, 2002.
Ghiggi, G., Humphrey, V., Seneviratne, S. I., and Gudmundsson, L.: GRUN: an observation-based global gridded runoff dataset from 1902 to 2014, Earth Syst. Sci. Data, 11, 1655–1674, https://doi.org/10.5194/essd-11-1655-2019, 2019.
Grill, G., Lehner, B., Thieme, M., Geenen, B., Tickner, D., Antonelli, F., Babu, S., Borrelli, P., Cheng, L., Crochetiere, H., Macedo, H. E., Filgueiras, R., Goichot, M., Higgins, J., Hogan, Z., Lip, B., McClain, M. E., Meng, J., Mulligan, M., Nilsson, C., Olden, J. D., Opperman, J. J., Petry, P., Liermann, C. R., Sáenz, L., Salinas-Rodríguez, S., Schelle, P., Schmitt, R. J. P., Snider, J., Tan, F., Tockner, K., Valdujo, P. H., van Soesbergen, A., and Zarfl, C.: Mapping the world's free-flowing rivers, Nature, 569, 215–221, https://doi.org/10.1038/s41586-019-1111-9, 2019.
Gupta, H. V., Kling, H., Yilmaz, K. K., and Martinez, G. F.: Decomposition of the mean squared error and NSE performance criteria: Implications for improving hydrological modelling, J. Hydrol., 377, 80–91, https://doi.org/10.1016/j.jhydrol.2009.08.003, 2009.
Harrigan, S., Murphy, C., Hall, J., Wilby, R. L., and Sweeney, J.: Attribution of detected changes in streamflow using multiple working hypotheses, Hydrol. Earth Syst. Sci., 18, 1935–1952, https://doi.org/10.5194/hess-18-1935-2014, 2014.
Harrigan, S., Prudhomme, C., Parry, S., Smith, K., and Tanguy, M.: Benchmarking ensemble streamflow prediction skill in the UK, Hydrol. Earth Syst. Sci., 22, 2023–2039, https://doi.org/10.5194/hess-22-2023-2018, 2018.
Hersbach, H., Bell, B., Berrisford, P., Hirahara, S., Horányi, A., Muñoz-Sabater, J., Nicolas, J., Peubey, C., Radu, R., Schepers, D., Simmons, A., Soci, C., Abdalla, S., Abellan, X., Balsamo, G., Bechtold, P., Biavati, G., Bidlot, J., Bonavita, M., Chiara, G. D., Dahlgren, P., Dee, D., Diamantakis, M., Dragani, R., Flemming, J., Forbes, R., Fuentes, M., Geer, A., Haimberger, L., Healy, S., Hogan, R. J., Hólm, E., Janisková, M., Keeley, S., Laloyaux, P., Lopez, P., Lupu, C., Radnoti, G., Rosnay, P. de, Rozum, I., Vamborg, F., Villaume, S., and Thépaut, J.-N.: The ERA5 Global Reanalysis, Q. J. Roy. Meteor. Soc., 146, 1999–2049, https://doi.org/10.1002/qj.3803, 2020.
Hirpa, F. A., Salamon, P., Beck, H. E., Lorini, V., Alfieri, L., Zsoter, E., and Dadson, S. J.: Calibration of the Global Flood Awareness System (GloFAS) using daily streamflow data, J. Hydrol., 566, 595–606, https://doi.org/10.1016/j.jhydrol.2018.09.052, 2018.
Kling, H., Fuchs, M., and Paulin, M.: Runoff conditions in the upper Danube basin under an ensemble of climate change scenarios, J. Hydrol., 424–425, 264–277, https://doi.org/10.1016/j.jhydrol.2012.01.011, 2012.
Knoben, W. J. M., Freer, J. E., and Woods, R. A.: Technical note: Inherent benchmark or not? Comparing Nash–Sutcliffe and Kling–Gupta efficiency scores, Hydrol. Earth Syst. Sci., 23, 4323–4331, https://doi.org/10.5194/hess-23-4323-2019, 2019.
Lavers, D., Harrigan, S., Andersson, E., Richardson, D. S., Prudhomme, C., and Pappenberger, F.: A vision for improving global flood forecasting, Environ. Res. Lett., 14, 121002, https://doi.org/10.1088/1748-9326/ab52b2, 2019.
Lin, P., Pan, M., Beck, H. E., Yang, Y., Yamazaki, D., Frasson, R., David, C. H., Durand, M., Pavelsky, T. M., Allen, G. H., Gleason, C. J., and Wood, E. F.: Global Reconstruction of Naturalized River Flows at 2.94 Million Reaches, Water Resour. Res., 55, 6499–6516, https://doi.org/10.1029/2019WR025287, 2019.
Magnusson, L., Zsoter, E., Prudhomme, C., Baugh, C., Harrigan, S., Ficchi, A., Emerton, R., Cloke, H., Stephens, L., and Speight, L.: ECMWF works with universities to support response to tropical cyclone Idai, ECMWF Newsletter, 160, 2–3, 2019
Pappenberger, F., Cloke, H. L., Balsamo, G., Ngo-Duc, T., and Oki, T.: Global runoff routing with the hydrological component of the ECMWF NWP system, Int. J. Climatol., 30, 2155–2174, https://doi.org/10.1002/joc.2028, 2010.
Qian, T., Dai, A., Trenberth, K. E., and Oleson, K. W.: Simulation of Global Land Surface Conditions from 1948 to 2004. Part I: Forcing Data and Evaluations, J. Hydrometeorol., 7, 953–975, https://doi.org/10.1175/JHM540.1, 2006.
Reichle, R. H., Koster, R. D., De Lannoy, G. J. M., Forman, B. A., Liu, Q., Mahanama, S. P. P., and Touré, A.: Assessment and Enhancement of MERRA Land Surface Hydrology Estimates, J. Climate, 24, 6322–6338, https://doi.org/10.1175/JCLI-D-10-05033.1, 2011.
Sperna Weiland, F. C., van Beek, L. P. H., Kwadijk, J. C. J., and Bierkens, M. F. P.: The ability of a GCM-forced hydrological model to reproduce global discharge variability, Hydrol. Earth Syst. Sci., 14, 1595–1621, https://doi.org/10.5194/hess-14-1595-2010, 2010.
UNDRR: Sendai Framework for Disaster Risk Reduction 2015–2030, United Nations Office for Disaster Risk Reduction, Geneva, available at: https://www.unisdr.org/we/inform/publications/43291 (last access: 30 October 2019), 2015.
van der Knijff, J. M., Younis, J., and de Roo, A. P. J. D.: LISFLOOD: a GIS-based distributed model for river basin scale water balance and flood simulation, Int. J. Geogr. Inf. Sci., 24, 189–212, https://doi.org/10.1080/13658810802549154, 2010.
Yamazaki, D., Kanae, S., Kim, H., and Oki, T.: A physically based description of floodplain inundation dynamics in a global river routing model, Water Resour. Res., 47, W04501, https://doi.org/10.1029/2010WR009726, 2011.
Zajac, Z., Revilla-Romero, B., Salamon, P., Burek, P., Hirpa, F. A., and Beck, H.: The impact of lake and reservoir parameterization on global streamflow simulation, J. Hydrol., 548, 552–568, https://doi.org/10.1016/j.jhydrol.2017.03.022, 2017.
Zsoter, E., Cloke, H., Stephens, E., de Rosnay, P., Muñoz-Sabater, J., Prudhomme, C., and Pappenberger, F.: How Well Do Operational Numerical Weather Prediction Configurations Represent Hydrology?, J. Hydrometeorol., 20, 1533–1552, https://doi.org/10.1175/JHM-D-18-0086.1, 2019.