the Creative Commons Attribution 4.0 License.
the Creative Commons Attribution 4.0 License.
 | 07 Sep 2020
Heat stored in the Earth system: where does the energy go?
Karina von Schuckmann
Lijing Cheng
Matthew D. Palmer
James Hansen
Caterina Tassone
Valentin Aich
Susheel Adusumilli
Hugo Beltrami
Tim Boyer
Francisco José Cuesta-Valero
Damien Desbruyères
Catia Domingues
Almudena García-García
Pierre Gentine
John Gilson
Maximilian Gorfer
Leopold Haimberger
Masayoshi Ishii
Gregory C. Johnson
Rachel Killick
Brian A. King
Gottfried Kirchengast
Nicolas Kolodziejczyk
John Lyman
Ben Marzeion
Michael Mayer
Maeva Monier
Didier Paolo Monselesan
Sarah Purkey
Dean Roemmich
Axel Schweiger
Sonia I. Seneviratne
Andrew Shepherd
Donald A. Slater
Andrea K. Steiner
Fiammetta Straneo
Mary-Louise Timmermans
Susan E. Wijffels
Human-induced atmospheric composition changes cause a radiative imbalance at the top of the atmosphere which is driving global warming. This Earth energy imbalance (EEI) is the most critical number defining the prospects for continued global warming and climate change. Understanding the heat gain of the Earth system – and particularly how much and where the heat is distributed – is fundamental to understanding how this affects warming ocean, atmosphere and land; rising surface temperature; sea level; and loss of grounded and floating ice, which are fundamental concerns for society. This study is a Global Climate Observing System (GCOS) concerted international effort to update the Earth heat inventory and presents an updated assessment of ocean warming estimates as well as new and updated estimates of heat gain in the atmosphere, cryosphere and land over the period 1960–2018. The study obtains a consistent long-term Earth system heat gain over the period 1971–2018, with a total heat gain of 358±37 ZJ, which is equivalent to a global heating rate of 0.47±0.1 W m−2. Over the period 1971–2018 (2010–2018), the majority of heat gain is reported for the global ocean with 89 % (90 %), with 52 % for both periods in the upper 700 m depth, 28 % (30 %) for the 700–2000 m depth layer and 9 % (8 %) below 2000 m depth. Heat gain over land amounts to 6 % (5 %) over these periods, 4 % (3 %) is available for the melting of grounded and floating ice, and 1 % (2 %) is available for atmospheric warming. Our results also show that EEI is not only continuing, but also increasing: the EEI amounts to 0.87±0.12 W m−2 during 2010–2018. Stabilization of climate, the goal of the universally agreed United Nations Framework Convention on Climate Change (UNFCCC) in 1992 and the Paris Agreement in 2015, requires that EEI be reduced to approximately zero to achieve Earth's system quasi-equilibrium. The amount of CO2 in the atmosphere would need to be reduced from 410 to 353 ppm to increase heat radiation to space by 0.87 W m−2, bringing Earth back towards energy balance. This simple number, EEI, is the most fundamental metric that the scientific community and public must be aware of as the measure of how well the world is doing in the task of bringing climate change under control, and we call for an implementation of the EEI into the global stocktake based on best available science. Continued quantification and reduced uncertainties in the Earth heat inventory can be best achieved through the maintenance of the current global climate observing system, its extension into areas of gaps in the sampling, and the establishment of an international framework for concerted multidisciplinary research of the Earth heat inventory as presented in this study. This Earth heat inventory is published at the German Climate Computing Centre (DKRZ, https://www.dkrz.de/, last access: 7 August 2020) under the DOI https://doi.org/10.26050/WDCC/GCOS_EHI_EXP_v2 (von Schuckmann et al., 2020).


In the Paris Agreement of the United Nations Framework Convention on Climate Change (UNFCCC), article 7 demands that “Parties should strengthen […] scientific knowledge on climate, including research, systematic observation of the climate system and early warning systems, in a manner that informs climate services and supports decision-making”. This request of the UNFCCC expresses the need of climate monitoring based on best available science, which is globally coordinated through the Global Climate Observing System (GCOS). In the current Implementation Plan of GCOS, main observation gaps are addressed and it states that “closing the Earth's energy balance […] through observations remain outstanding scientific issues that require high-quality climate records of Essential Climate Variables (ECVs).” (GCOS, 2016). GCOS is asking the broader scientific community to establish the observational requirements needed to meet the targets defined in the GCOS Implementation Plan and to identify how climate observations could be enhanced and continued into the future in order to monitor the Earth's cycles and the global energy budget. This study addresses and intends to respond to this request.
The state, variability and change of Earth's climate are to a large extent driven by the energy transfer between the different components of the Earth system (Hansen, 2005; Hansen et al., 2011). Energy flows alter clouds, and weather and internal climate modes can temporarily alter the energy balance on subannual to multidecadal timescales (Palmer and McNeall, 2014; Rhein et al., 2013). The most practical way to monitor climate state, variability and change is to continually assess the energy, mainly in the form of heat, in the Earth system (Hansen et al., 2011). All energy entering or leaving the Earth climate system does so in the form of radiation at the top of the atmosphere (TOA) (Loeb et al., 2012). The difference between incoming solar radiation and outgoing radiation, which is the sum of the reflected shortwave radiation and emitted longwave radiation, determines the net radiative flux at TOA. Changes of this global radiation balance at TOA – the so-called Earth energy imbalance (EEI) – determine the temporal evolution of Earth's climate: If the imbalance is positive (i.e., less energy going out than coming in), energy in the form of heat is accumulated in the Earth system, resulting in global warming – or cooling if the EEI is negative. The various facets and impacts of observed climate change arise due to the EEI, which thus represents a crucial measure of the rate of climate change (von Schuckmann et al., 2016). The EEI is the portion of the forcing that has not yet been responded to (Hansen, 2005). In other words, warming will continue even if atmospheric greenhouse gas (GHG) amounts are stabilized at today's level, and the EEI defines additional global warming that will occur without further change in forcing (Hansen et al., 2017). The EEI is less subject to decadal variations associated with internal climate variability than global surface temperature and therefore represents a robust measure of the rate of climate change (von Schuckmann et al., 2016; Cheng et al., 2017a).
The Earth system responds to an imposed radiative forcing through a number of feedbacks, which operate on various different timescales. Conceptually, the relationships between EEI, radiative forcing and surface temperature change can be expressed as (Gregory and Andrews, 2016)
where ΔNTOA is Earth's net energy imbalance at TOA (in W m−2), ΔFERF is the effective radiative forcing (W m−2), ΔTS is the global surface temperature anomaly (K) relative to the equilibrium state and αFP is the net total feedback parameter (W m−2 K−1), which represents the combined effect of the various climate feedbacks. Essentially, αFP in Eq. (1) can be viewed as a measure of how efficient the system is at restoring radiative equilibrium for a unit surface temperature rise. Thus, ΔNTOA represents the difference between the applied radiative forcing and Earth's radiative response through climate feedbacks associated with surface temperature rise (e.g., Hansen et al., 2011). Observation-based estimates of ΔNTOA are therefore crucial both to our understanding of past climate change and for refining projections of future climate change (Gregory and Andrews, 2016; Kuhlbrodt and Gregory, 2012). The long atmospheric lifetime of carbon dioxide means that ΔNTOA, ΔFERF and ΔTS will remain positive for centuries, even with substantial reductions in greenhouse gas emissions, and lead to substantial committed sea-level rise (Cheng et al., 2019a; Hansen et al., 2017; Nauels et al., 2017; Palmer et al., 2018).
However, this conceptual picture is complicated by the presence of unforced internal variability in the climate system, which adds substantial noise to the real-world expression of this equation (Gregory et al., 2020; Marvel et al., 2018; Palmer and McNeall, 2014). For example, at timescales from interannual to decadal periods, the phase of the El Niño–Southern Oscillation contributes to both positive or negative variations in EEI (Cheng et al., 2019a; Loeb et al., 2018; Johnson and Birnbaum, 2017; Loeb et al., 2012). At multidecadal and longer timescales, systematic changes in ocean circulation can significantly alter the EEI as well (Baggenstos et al., 2019).
Timescales of the Earth climate response to perturbations of the equilibrium Earth energy balance at TOA are driven by a combination of climate forcing and the planet's thermal inertia: the Earth system tries to restore radiative equilibrium through increased thermal radiation to space via the Planck response, but a number of additional Earth system feedbacks also influence the planetary radiative response (Lembo et al., 2019; Myhre et al., 2013). Timescales of warming or cooling of the climate depend on the imposed radiative forcing, the evolution of climate and Earth system feedbacks, with ocean and cryosphere in particular leading to substantial thermal inertia (Clark et al., 2016; Marshall et al., 2015). Consequently, it requires centuries for Earth's surface temperature to respond fully to a climate forcing.
Contemporary estimates of the magnitude of the Earth's energy imbalance range between about 0.4 and 0.9 W m−2 (depending on estimate method and period; see also conclusion) and are directly attributable to increases in carbon dioxide and other greenhouse gases in the atmosphere from human activities (Ciais et al., 2013; Myhre et al., 2013; Rhein et al., 2013; Hansen et al., 2011). The estimate obtained from climate models (CMIP6) as presented by Wild (2020) amounts to 1.1±0.8 W m−2. Since the period of industrialization, the EEI has become increasingly dominated by the emissions of radiatively active greenhouse gases, which perturb the planetary radiation budget and result in a positive EEI. As a consequence, excess heat is accumulated in the Earth system, which is driving global warming (Hansen et al., 2005, 2011). The majority (about 90 %) of this positive EEI is stored in the ocean (Rhein et al., 2013) and can be estimated through the evaluation of ocean heat content (OHC, e.g., Abraham et al., 2013). According to previous estimates, a small proportion (∼3 %) contributes to the melting of Arctic sea ice and land ice (glaciers, the Greenland and Antarctic ice sheets). Another 4 % goes into heating of the land and atmosphere (Rhein et al., 2013).
Knowing where and how much heat is stored in the different Earth system components from a positive EEI, and quantifying the Earth heat inventory, is of fundamental importance to unravel the current status of climate change, as well as to better understand and predict its implications, and to design the optimal observing networks for monitoring the Earth heat inventory. Quantifying this energy gain is essential for understanding the response of the climate system to radiative forcing and hence to reduce uncertainties in climate predictions. The rate of ocean heat gain is a key component for the quantification of the EEI, and the observed surface warming has been used to estimate the equilibrium climate sensitivity (e.g., Knutti and Rugenstein, 2015). However, further insight into the Earth heat inventory, particularly to further unravel where the heat is going, can have implications on the understanding of the transient climate responses to climate change and consequently reduces uncertainties in climate predictions (Hansen et al., 2011). In this paper, we focus on the inventory of heat stored in the Earth system. The first four sections will introduce the current status of estimate of heat storage change in the ocean, atmosphere, land and cryosphere, respectively. Uncertainties, current achieved accuracy, challenges and recommendations for future improved estimates are discussed for each Earth system component and in the conclusion. In the last chapter, an update of the Earth heat inventory is established based on the results of Sects. 1–4, followed by a conclusion.
The storage of heat in the ocean leads to ocean warming (IPCC, 2020) and is a major contributor to sea-level rise through thermal expansion (WCRP, 2018). Ocean warming alters ocean stratification and ocean mixing processes (Bindoff et al., 2020), affects ocean currents (Hoegh-Guldberg, 2020; Rhein et al., 2018; Yang et al., 2016), impacts tropical cyclones (Hoegh-Guldberg, 2020; Trenberth et al., 2018; Woollings et al., 2012), and is a major player in ocean deoxygenation processes (Breitburg et al., 2018) and carbon sequestration into the ocean (Bopp et al., 2013; Frölicher et al., 2018). Together with ocean acidification and deoxygenation, ocean warming can lead to dramatic changes in ecosystems, biodiversity, population extinctions, coral bleaching and infectious disease, as well as redistribution of habitat (García Molinos et al., 2016; Gattuso et al., 2015; Ramírez et al., 2017). Implications of ocean warming are also widespread across Earth's cryosphere (Jacobs et al., 2002; Mayer et al., 2019; Polyakov et al., 2017; Serreze and Barry, 2011; Shi et al., 2018). Examples include the basal melt of ice shelves (Adusumilli et al., 2020; Pritchard et al., 2012; Wilson et al., 2017) and marine-terminating glaciers (Straneo and Cenedese, 2015), as well as the retreat and speedup of outlet glaciers in Greenland (King et al., 2018) and in Antarctica (Shepherd et al., 2018a) and of tidewater glaciers in South America and in the High Arctic (Gardner et al., 2013).
Opportunities and challenges in forming OHC estimates depend on the availability of in situ subsurface temperature measurements, particularly for global-scale evaluations. Subsurface ocean temperature measurements before 1900 had been obtained from shipboard instrumentation, culminating in the global-scale Challenger expedition (1873–1876) (Roemmich and Gilson, 2009). From 1900 up to the mid-1960s, subsurface temperature measurements relied on shipboard Nansen bottle and mechanical bathythermograph (MBT) instruments (Abraham et al., 2013), only allowing limited global coverage and data quality. The inventions of the conductivity–temperature–depth (CTD) instruments in the mid-1950s and the expendable bathythermograph (XBT) observing system about 10 years later increased the oceanographic capabilities for widespread and accurate (in the case of the CTD) measurements of in situ subsurface water temperature (Abraham et al., 2013; Goni et al., 2019).
With the implementation of several national and international programs, and the implementation of the moored arrays in the tropical ocean in the 1980s, the Global Ocean Observing System (GOOS, https://www.goosocean.org/, last access: 7 August 2020) started to grow. Particularly the global World Ocean Circulation Experiment (WOCE) during the 1990s obtained a global baseline survey of the ocean from top to bottom (King et al., 2001). However, measurements were still limited to fixed point platforms, major shipping routes, and naval and research vessel cruise tracks, leaving large parts of the ocean undersampled. In addition, detected instrumental biases in MBTs, XBTs and other instruments pose a further challenge for the global scale OHC estimate (Abraham et al., 2013; Ciais et al., 2013; Rhein et al., 2013), but significant progress has been made recently to correct biases and provide high-quality data for climate research (Boyer et al., 2016; Cheng et al., 2016; Goni et al., 2019; Gouretski and Cheng, 2020). Satellite altimeter measurements of sea surface height began in 1992 and are used to complement in situ-derived OHC estimates, either for validation purposes (Cabanes et al., 2013) or to complement the development of global gridded ocean temperature fields (Guinehut et al., 2012; Willis et al., 2004). Indirect estimates of OHC from remote sensing through the global sea-level budget became possible with satellite-derived ocean mass information in 2002 (Dieng et al., 2017; Llovel et al., 2014; Loeb et al., 2012; Meyssignac et al., 2019; von Schuckmann et al., 2014).
After the OceanObs conference in 1999, the international Argo profiling float program was launched with first Argo float deployments in the same year (Riser et al., 2016; Roemmich and Gilson, 2009). By the end of 2006, Argo sampling had reached its initial target of data sampling roughly every 3∘ between 60∘ S and 60∘ N. However, due to technical evolution, only 40 % of Argo floats provided measurements down to 2000 m depth in the year 2005, but that percentage increased to 60 % in 2010 (von Schuckmann and Le Traon, 2011). The starting point of the Argo-based best estimate for near-global-scale (60∘ S–60∘ N) OHC is either defined in 2005 (von Schuckmann and Le Traon, 2011) or in 2006 (Wijffels et al., 2016). The opportunity for improved OHC estimation provided by Argo is tremendous and has led to major advancements in climate science, particularly on the discussion of the EEI (Hansen et al., 2011; Johnson et al., 2018; Loeb et al., 2012; Trenberth and Fasullo, 2010; von Schuckmann et al., 2016; Meyssignac et al., 2019). The near-global coverage of the Argo network also provides an excellent test bed for the long-term OHC reconstruction extending back well before the Argo period (Cheng et al., 2017b). Moreover, these evaluations inform further observing system recommendations for global climate studies, i.e., gaps in the deep ocean layers below 2000 m depth, in marginal seas, in shelf areas and in the polar regions (e.g., von Schuckmann et al., 2016), and their implementations are underway, for example for deep Argo (Johnson et al., 2019).
Different research groups have developed gridded products of subsurface temperature fields for the global ocean using statistical models (Gaillard et al., 2016; Good et al., 2013; Ishii et al., 2017; Levitus et al., 2012) or combined observations with additional statistics from climate models (Cheng et al., 2017b). An exhaustive list of the pre-Argo products can be found in, for example, Abraham et al. (2013), Boyer et al. (2016), WCRP (2018) and Meyssignac et al. (2019). Additionally, specific Argo-based products are listed on the Argo web page (http://www.argo.ucsd.edu/, last access: 7 August 2020). Although all products rely more or less on the same database, near-global OHC estimates show some discrepancies which result from the different statistical treatments of data gaps, the choice of the climatology, and the approach used to account for the MBT and XBT instrumental biases (Boyer et al., 2016; Wang et al., 2018). Argo-based products show smaller differences, likely resulting from different treatments of currently undersampled regions (e.g., von Schuckmann et al., 2016). Ocean reanalysis systems have been also used to deliver estimates of near-global OHC (Meyssignac et al., 2019; von Schuckmann et al., 2018), and their international assessments show increased discrepancies with decreasing in situ data availability for the assimilation (Palmer et al., 2017; Storto et al., 2018). Climate models have also been used to study global and regional ocean heat changes and the associated mechanisms, with observational datasets providing valuable benchmarks for model evaluation (Cheng et al., 2016; Gleckler et al., 2016).
International near-global OHC assessments have been performed previously (e.g., Abraham et al., 2013; Boyer et al., 2016; Meyssignac et al., 2019; WCRP, 2018). These assessments are challenging, as most of the gridded temperature fields are research products, and only few are distributed and regularly updated operationally (e.g., https://marine.copernicus.eu/, last access: 7 August 2020). This initiative relies on the availability of data products, their temporal extensions and direct interactions with the different research groups. A complete view of all international temperature products can be only achieved through a concerted international effort and over time. In this study, we do not achieve a holistic view of all available products but present a starting point for future international regular assessments of near-global OHC. For the first time, we propose an international ensemble mean and standard deviation of near-global OHC (Fig. 1) which is then used to build an Earth climate system energy inventory (Sect. 5). The ensemble spread gives an indication of the agreement among products and can be used as a proxy for uncertainty. The basic assumption for the error distribution is Gaussian with a mean of zero, which can be approximated by an ensemble of various products. However, it does not account for systematic errors that may result in biases across the ensemble and does not represent the full uncertainty. The uncertainty can also be estimated in other ways including some purely statistical methods (Levitus et al., 2012) or methods explicitly accounting for the error sources (Lyman and Johnson, 2013), but each method has its caveats, for example the error covariances are mostly unknown, so adopting a straightforward method with a “data democracy” strategy has been chosen here as a starting point.
However, future evolution of this initiative is needed to include missing and updated in situ-based products, ocean reanalyses and indirect estimates (for example satellite based). The continuity of this activity will help to further unravel uncertainties due to the community's collective efforts on detecting/reducing errors, and it then provides up-to-date scientific knowledge of ocean heat uptake.
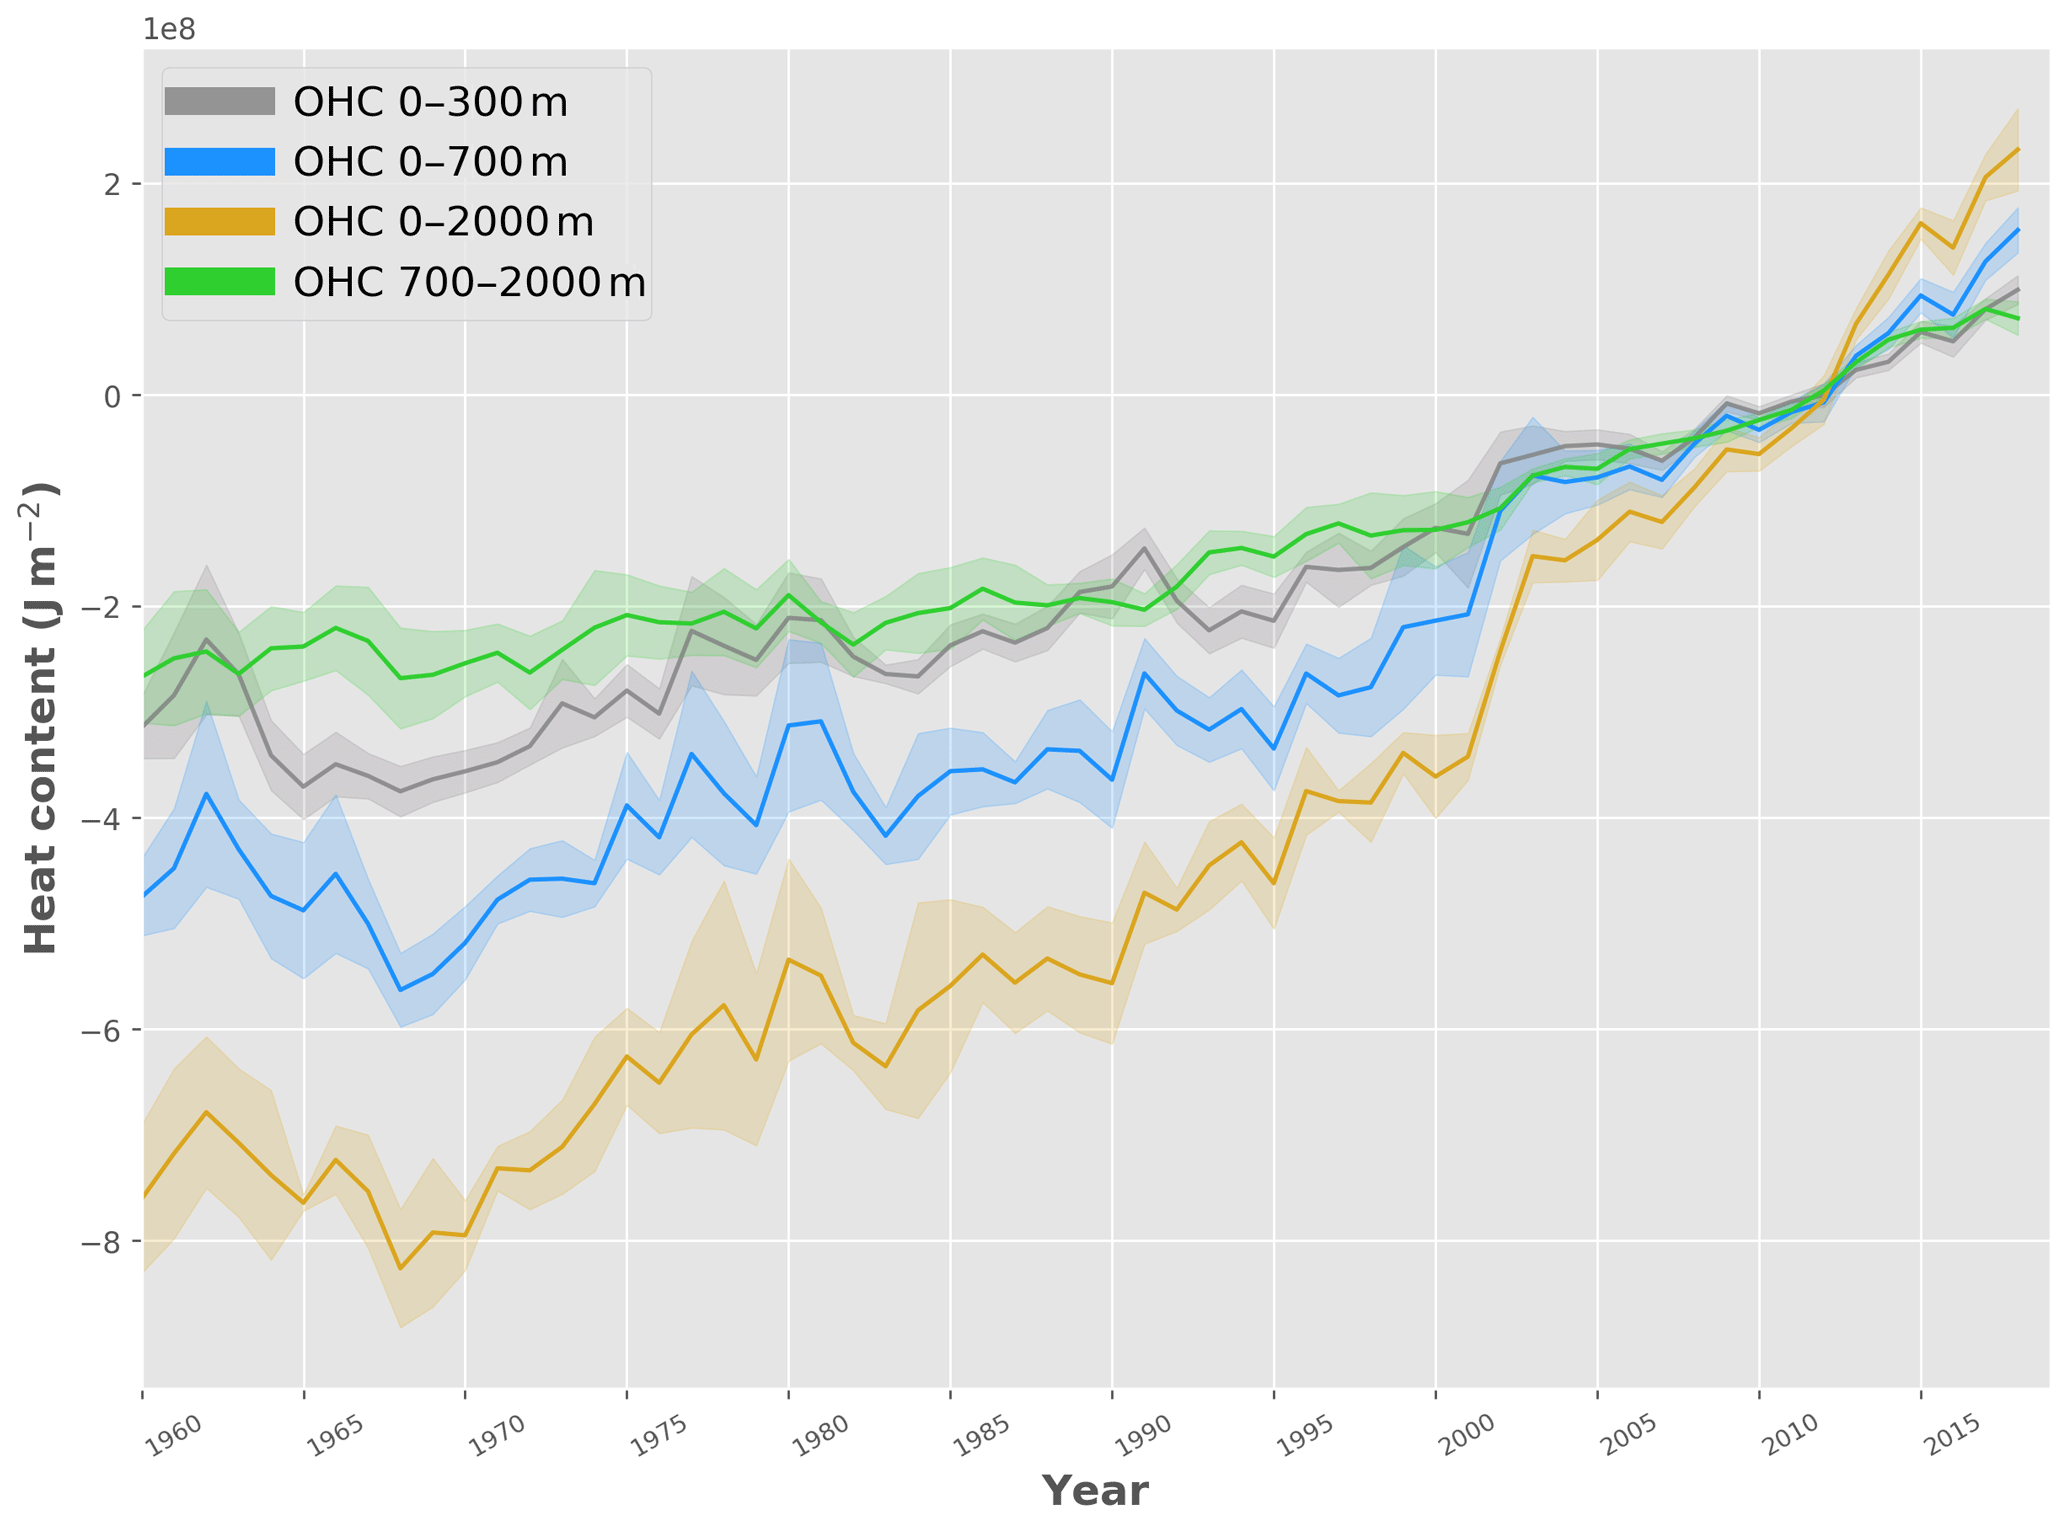
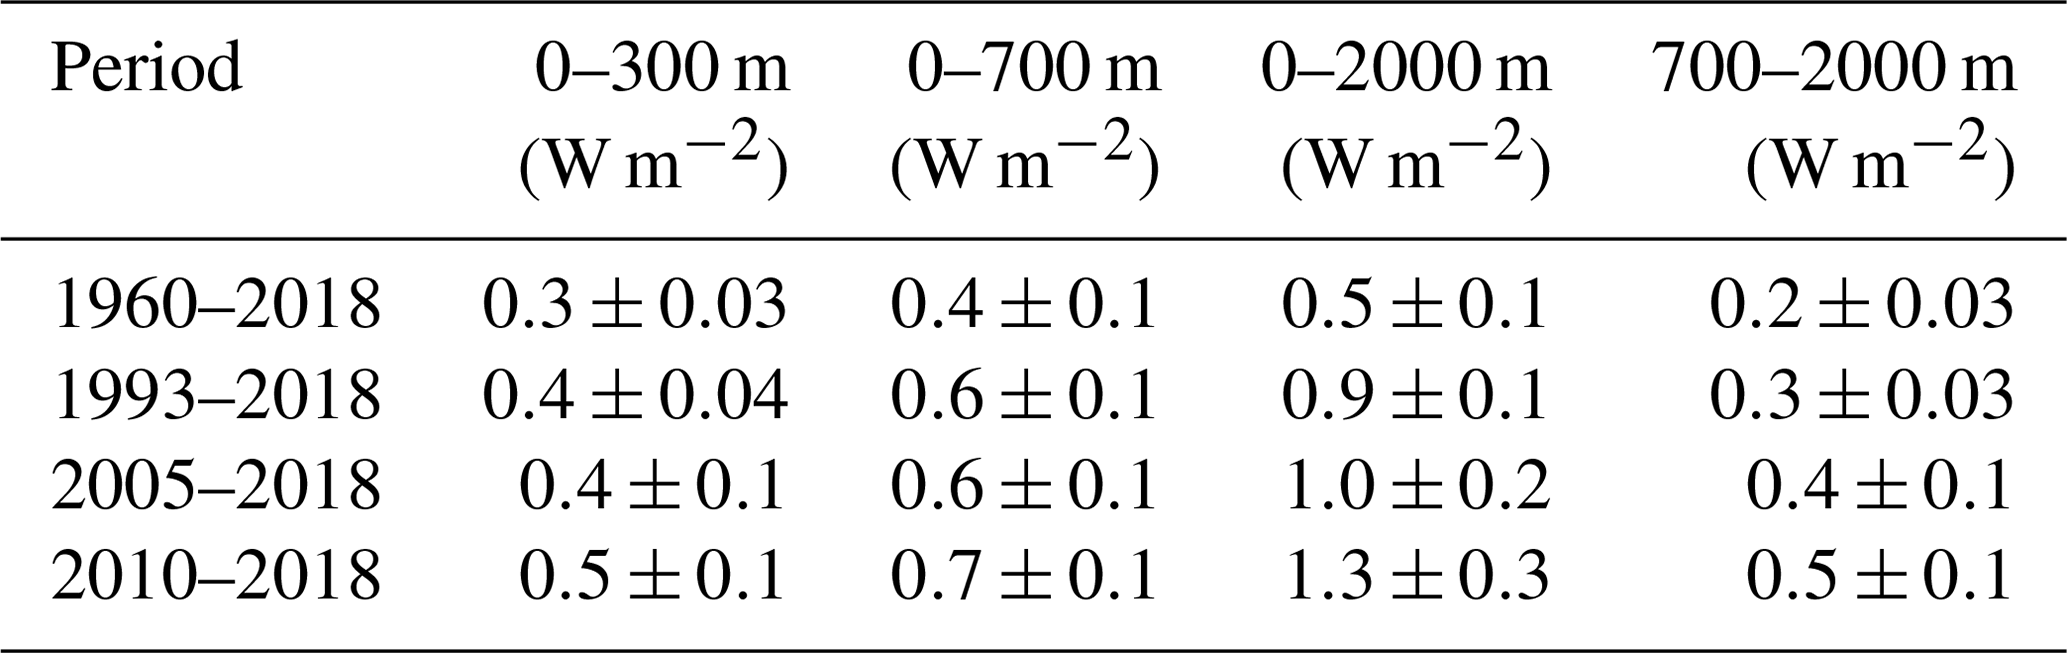
Figure 1Ensemble mean time series and ensemble standard deviation (2σ, shaded) of global ocean heat content (OHC) anomalies relative to the 2005–2017 climatology for the 0–300 m (gray), 0–700 m (blue), 0–2000 m (yellow) and 700–2000 m depth layer (green). The ensemble mean is an outcome of an international assessment initiative, and all products used are referenced in the legend of Fig. 2. The trends derived from the time series are given in Table 1. Note that values are given for the ocean surface area between 60∘ S and 60∘ N and are limited to the 300 m bathymetry of each product.
Table 1Linear trends (weighted least square fit; see for example von Schuckmann and Le Traon, 2011) as derived from the ensemble mean as presented in Fig. 1 for different time intervals, as well as different integration depth. The uncertainty on the trend estimate is given for the 95 % confidence level. Note that values are given for the ocean surface area between 60∘ S and 60∘ N and are limited to the 300 m bathymetry of each product. See text and Fig. 1 caption for more details on the OHC estimates.
Products used for this assessment are referenced in the caption of Fig. 2. Estimates of OHC have been provided by the different research groups under homogeneous criteria. All estimates use a coherent ocean volume limited by the 300 m isobath of each product and are limited to 60∘ S–60∘ N since most observational products exclude high-latitude ocean areas because of the low observational coverage, and only annual averages have been used. 60∘ S–60∘ N constitutes ∼91 % of the global ocean surface area, and limiting to 300 m isobath neglects the contributions from coastal and shallow waters, so the resultant OHC trends will be underestimated if these ocean regions are warming. For example, neglecting shallow waters can account for 5 %–10 % for 0–2000 m OHC trends (von Schuckmann et al., 2014). A first initial test using Cheng et al. (2017b) data indicates that OHC 0–2000 m trends can be underestimated by ∼10 % if the ocean warming in the area polewards of 60∘ latitude is not taken into account (not shown). This is a caveat of the assessment in this review and will be addressed in the future.
The assessment is based on three distinct periods to account for the evolution of the observing system, i.e., 1960–2018 (i.e., “historical”), 1993–2018 (i.e., “altimeter era”) and 2005–2018 (i.e., “golden Argo era”). In addition, ocean warming rates over the past decade are specifically discussed according to an apparent acceleration of global surface warming since 2010 (WMO, 2020; Blunden and Arndt, 2019). All time series reach the end in 2018 – which was one of the principal limitations for the inclusion of some products. Our final estimates of OHC for the upper 2000 m over different periods are the ensemble average of all products, with the uncertainty range defined by the standard deviation (2σ) of the corresponding estimates used (Fig. 1).
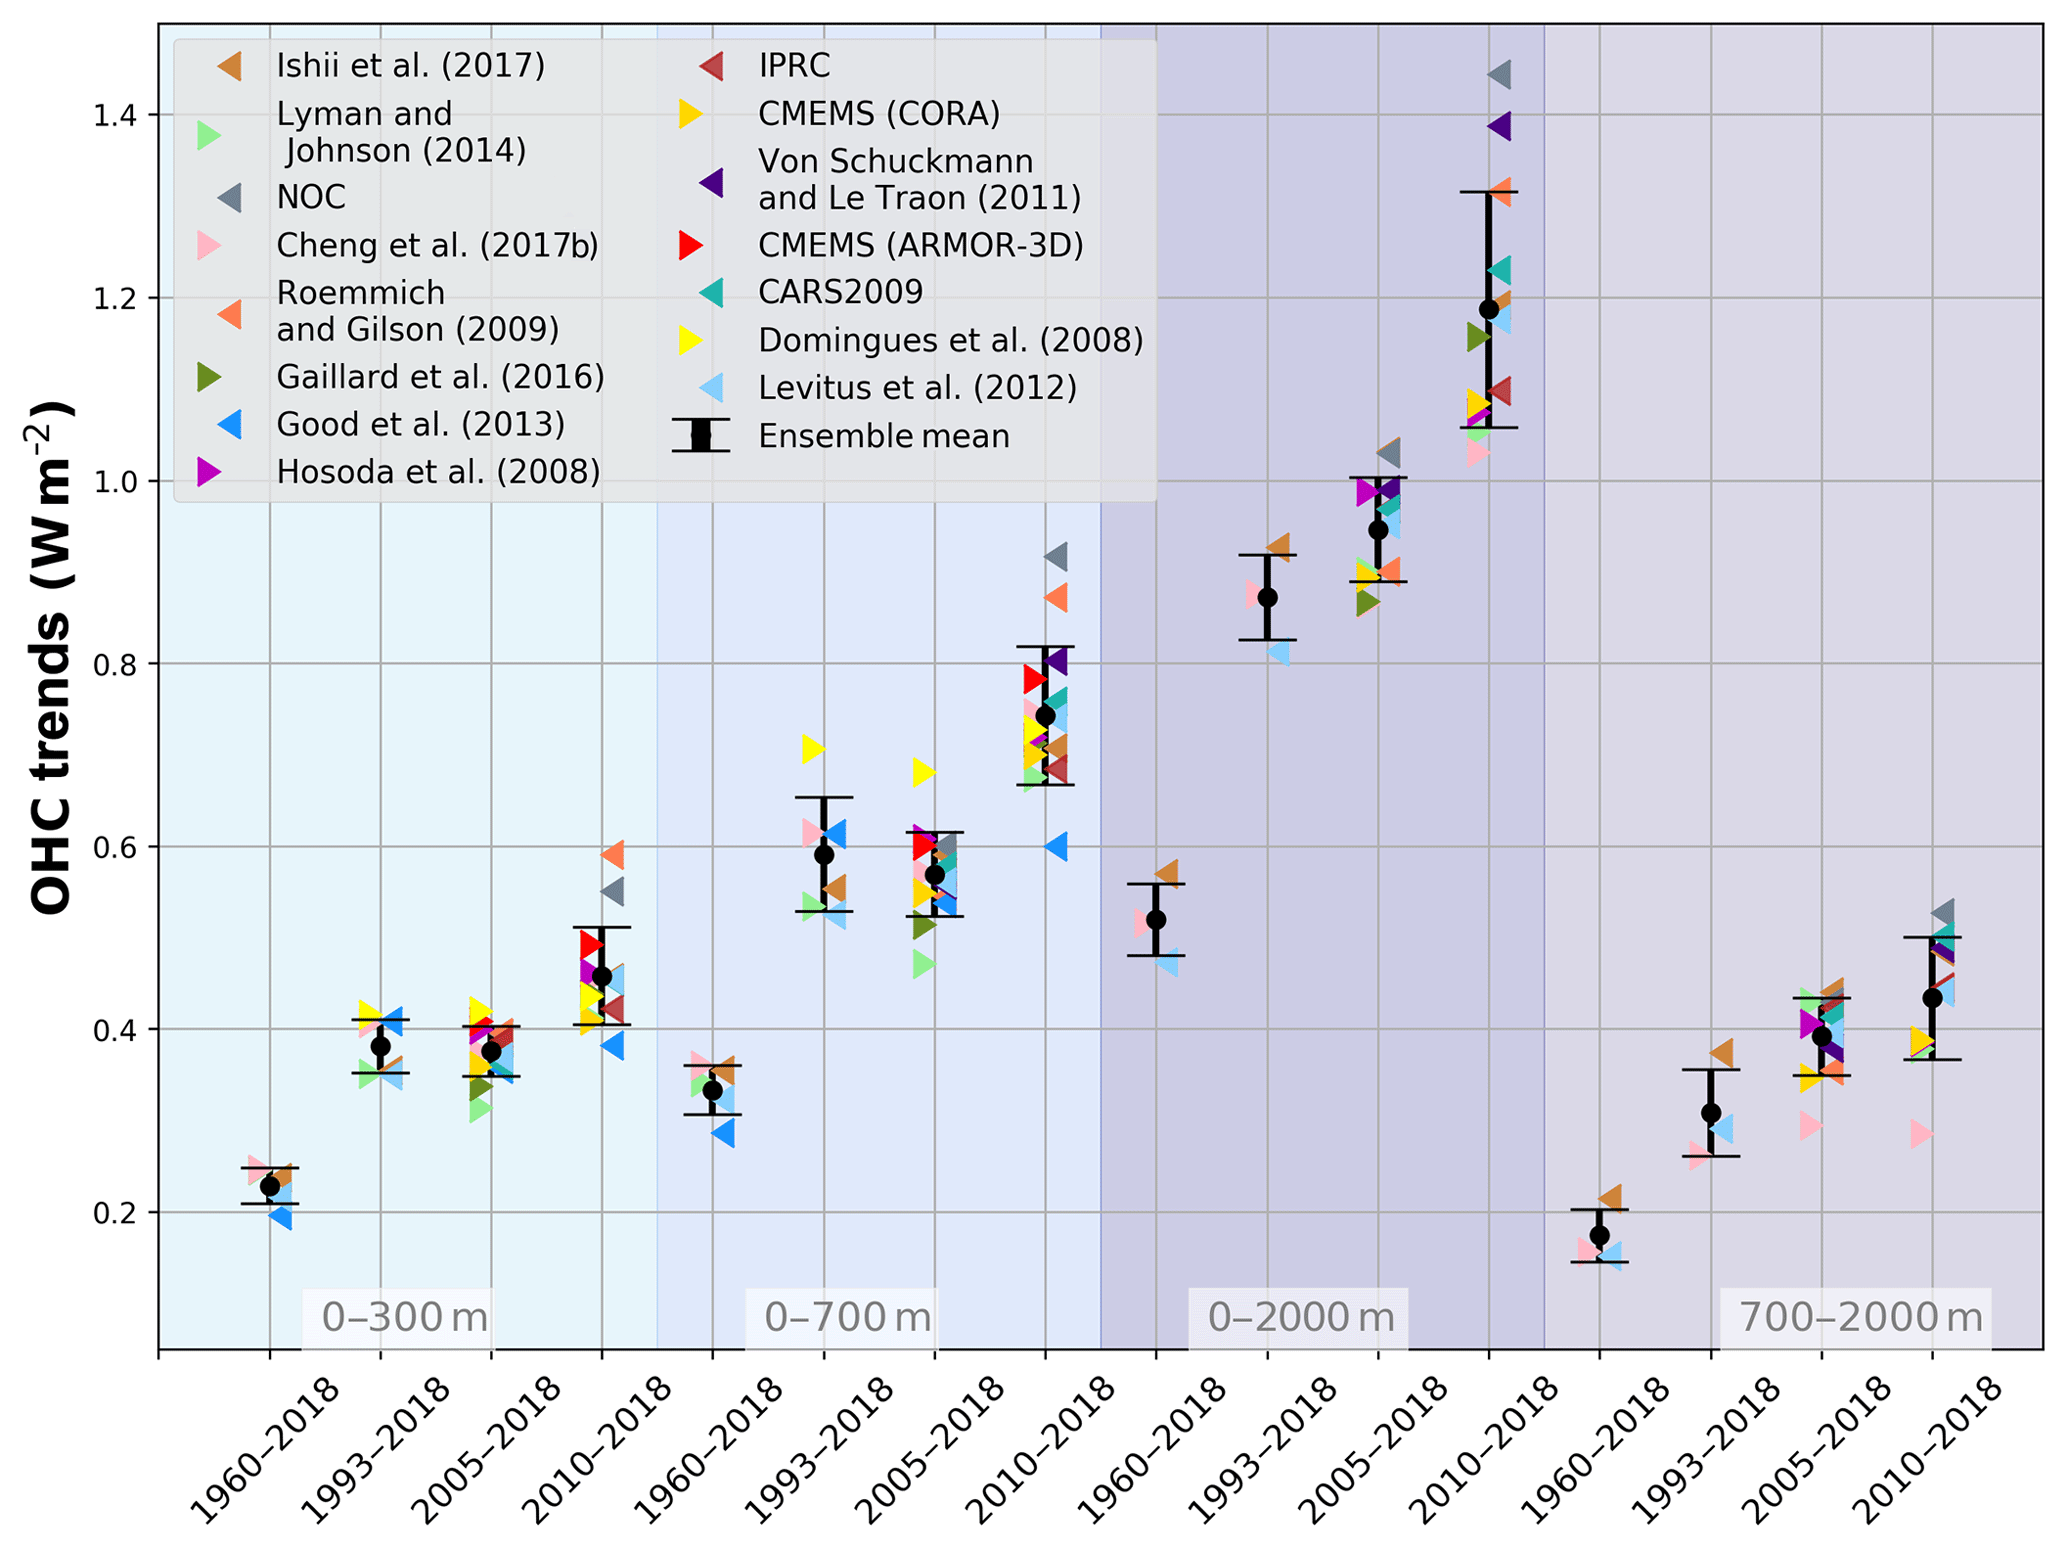
Figure 2Linear trends of global ocean heat content (OHC) as derived from different temperature products (colors). References are given in the figure legend, except for IPRC (http://apdrc.soest.hawaii.edu/projects/Argo/, last access: 7 August 2020), CMEMS (CORA and ARMOR-3D, http://marine.copernicus.eu/science-learning/ocean-monitoring-indicators, last access: 7 August 2020), CARS2009 (http://www.marine.csiro.au/~dunn/cars2009/, last access: 7 August 2020) and NOC (National Oceanographic Institution, Desbruyères et al., 2016). The ensemble mean and standard deviation (2σ) are given in black. The shaded areas show trends from different depth layer integrations, i.e., 0–300 m (light turquoise), 0–700 m (light blue), 0–2000 m (purple) and 700–2000 m (light purple). For each integration depth layer, trends are evaluated over the three study periods, i.e., historical (1960–2018), altimeter era (1993–2018) and golden Argo era (2005–2018). In addition, the most recent period 2010–2018 is included. See text for more details on the international assessment criteria. Note that values are given for the ocean surface area (see text for more details).
The first and principal result of the assessment (Fig. 1) is an overall increase in the trend for the two more recent study periods, e.g., the altimeter era (1993–2018) and golden Argo era (2005–2018), relative to the historical era (1960–2018), which is in agreement with previous results (e.g., Abraham et al., 2013). The trend values are all given in Table 1. A major part of heat is stored in the upper layers of the ocean (0–300 m and 0–700 m depth). However, heat storage at intermediate depth (700–2000 m) increases at a comparable rate as reported for the 0–300 m depth layer (Table 1, Fig. 2). There is a general agreement among the 15 international OHC estimates (Fig. 2). However, for some periods and depth layers the standard deviation reaches maximal values up to about 0.3 W m−2. All products agree on the fact that ocean warming rates have increased in the past decades and doubled since the beginning of the altimeter era (1993–2018 compared with 1960–2018) (Fig. 2). Moreover, there is a clear indication that heat sequestration into the deeper ocean layers below 700 m depth took place over the past 6 decades linked to an increase in OHC trends over time (Fig. 2). In agreement with observed accelerated Earth surface warming over the past decade (WMO, 2020; Blunden and Arndt, 2019), ocean warming rates for the 0–2000 m depth layer also reached record rates of 1.3 (0.9)±0.3 W m−2 for the ocean (global) area over the period 2010–2018.
For the deep OHC changes below 2000 m, we adapted an updated estimate from Purkey and Johnson (2010) (PG10) from 1991 to 2018, which is a constant linear trend estimate (1.15±0.57 ZJ yr−1, 0.07±0.04 W m−2). Some recent studies strengthened the results in PG10 (Desbruyères et al., 2016; Zanna et al., 2019). Desbruyères et al. (2016) examined the decadal change of the deep and abyssal OHC trends below 2000 m in the 1990s and 2000s, suggesting that there has not been a significant change in the rate of decadal global deep/abyssal warming from the 1990s to the 2000s and the overall deep ocean warming rate is consistent with PG10. Using a Green function method, Zanna et al. (2019) reported a deep ocean warming rate of ∼0.06 W m−2 during the 2000s, consistent with PG10 used in this study. Zanna et al. (2019) shows a fairly weak global trend during the 1990s, inconsistent with observation-based estimates. This mismatch might come from the simplified or misrepresentation of surface-deep connections using ECCO reanalysis data and the use of time-mean Green functions in Zanna et al. (2019), as well as from the limited spatial resolution of the observational network for relatively short time spans. Furthermore, combining hydrographic and deep-Argo floats, a recent study (Johnson et al., 2019) reported an accelerated warming in the South Pacific Ocean in recent years, but a global estimate of the OHC rate of change over time is not available yet.
Before 1990, we assume zero OHC trend below 2000 m, following the methodology in IPCC-AR5 (Rhein et al., 2013). The zero-trend assumption is made mainly because there are too few observations before 1990 to make an estimate of OHC change below 2000 m. But it is a reasonable assumption because OHC 700–2000 m warming was fairly weak before 1990 and heat might not have penetrated down to 2000 m (Cheng et al., 2017b). Zanna et al. (2019) also shows a near-zero OHC trend below 2000 m from the 1960s to 1980s. The derived time series is used for the Earth energy inventory in Sect. 5. A centralized (around the year 2006) uncertainty approach has been applied for the deep (>2000 m depth) OHC estimate following the method of Cheng et al. (2017b), which allows us to extract an uncertainty range over the period 1993–2018 within the given [lower (1.15–0.57 ZJ yr−1), upper (1.15+0.57 ZJ yr−1)] range of the deep OHC trend estimate. We then extend the obtained uncertainty estimate back from 1993 to 1960, with 0 OHC anomaly.
While the amount of heat accumulated in the atmosphere is small compared to the ocean, warming of the Earth's near-surface air and atmosphere aloft is a very prominent effect of climate change, which directly affects society. Atmospheric observations clearly reveal a warming of the troposphere over the last decades (Santer et al., 2017; Steiner et al., 2020) and changes in the seasonal cycle (Santer et al., 2018). Changes in atmospheric circulation (Cohen et al., 2014; Fu et al., 2019) together with thermodynamic changes (Fischer and Knutti, 2016; Trenberth et al., 2015) will lead to more extreme weather events and increase high-impact risks for society (Coumou et al., 2018; Zscheischler et al., 2018). Therefore, a rigorous assessment of the atmospheric heat content in context with all Earth's climate subsystems is important for a full view on the changing climate system. The atmosphere transports vast amounts of energy laterally and strong vertical heat fluxes occur at the atmosphere's lower boundary. The pronounced energy and mass exchanges within the atmosphere and with all other climate components is a fundamental element of Earth's climate (Peixoto and Oort, 1992). In contrast, long-term heat accumulation in the atmosphere is limited by its small heat capacity as the gaseous component of the Earth system (von Schuckmann et al., 2016).
Recent work revealed inconsistencies in earlier formulations of the atmospheric energy budget (Mayer et al., 2017; Trenberth and Fasullo, 2018), and hence a short discussion of the updated formulation is provided here. In a globally averaged and vertically integrated sense, heat accumulation in the atmosphere arises from a small imbalance between net energy fluxes at the top of the atmosphere (TOA) and the surface (denoted s). The heat budget of the vertically integrated and globally averaged atmosphere (indicated by the global averaging operator 〈.〉) reads as follows (Mayer et al., 2017):
where, in mean-sea-level altitude (z) coordinates used here for integrating over observational data, the vertically integrated atmospheric energy content AE per unit surface area [J m−2] reads
In Eq. (2), AE represents the total atmospheric energy content, NTOA the net radiation at TOA, Fs the net surface energy flux defined as the sum of net surface radiation and latent and sensible heat flux, and Fsnow the latent heat flux associated with snowfall (computed as the product of latent heat of fusion and snowfall rate). Here, we take constant latent heat of vaporization (at 0 ∘C) in the latent heat flux term that is contained in Fs, but variations in latent heat flux arising from the deviation of evaporated water from 0 ∘C are contained in FPE, which additionally accounts for sensible heat of precipitation (referenced to 0 ∘C). That is, FPE expresses a modification of Fs arising from global evaporation and precipitation occurring at temperatures different from 0 ∘C.
Snowfall is the fraction of precipitation that returns originally evaporated water to the surface in a frozen state. In that sense, Fsnow represents a heat transfer from the surface to the atmosphere: it warms the atmosphere through additional latent heat release (associated with freezing of vapor) and snowfall consequently arrives at the surface in an energetic state lowered by this latent heat. This energetic effect is most obvious over the open ocean, where falling snow requires the same amount of latent heat to be melted again and thus cools the ocean. Over high latitudes, Fsnow can attain values up to 5 W m−2, but its global average value is smaller than 1 W m−2 (Mayer et al., 2017). Although its global mean energetic effect is relatively small, it is systematic and should be included for accurate diagnostics. Moreover, snowfall is an important contributor to the heat and mass budget of ice sheets and sea ice (see Sect. 4).
FPE represents the net heat flux arising from the different temperatures of rain and evaporated water. This flux can be sizable regionally, but it is small in a global average sense (warming of the atmosphere ∼0.3 W m−2 according to Mayer et al., 2017).
Equation (3) provides a decomposition of the atmospheric energy content AE into sensible heat energy (sum of the first two terms, internal heat energy and gravity potential energy), latent heat energy (third term) and kinetic energy (fourth term), where ρ is the air density, cv the specific heat for moist air at constant volume, T the air temperature, g the acceleration of gravity, Le the temperature-dependent effective latent heat of condensation (and vaporization) Lv or sublimation Ls (the latter relevant below 0 ∘C), q the specific humidity of the moist air, and V the wind speed. We neglect atmospheric liquid water droplets and ice particles as separate species, as their amounts and especially their trends are small.
In the AE derivation from observational datasets based on Eq. (3), we accounted for the intrinsic temperature dependence of the latent heat of water vapor by assigning Le to Lv if ambient temperatures are above 0 ∘C and to Ls (adding in the latent heat of fusion Lf) if they are below −10 ∘C, respectively, with a gradual (half-sine weighted) transition over the temperature range between. The reanalysis evaluations similarly approximated Le by using values of Lv, Ls, and Lf, though in slightly differing forms. The resulting differences in AE anomalies from any of these choices are negligibly small, however, since the latent heat contribution at low temperatures is itself very small.
As another small difference, the AE estimations from observations neglected the kinetic energy term in Eq. (3) (fourth term), while the reanalysis evaluations accounted for it. This as well leads to negligible AE anomaly differences, however, since the kinetic energy content and trends at a global scale are more than three orders of magnitude smaller than for the sensible heat (Peixoto and Oort, 1992). Aligning with the terminology of ocean heat content (OHC) and given the dominance of the heat-related terms in Eq. (3), we hence refer to the energy content AE as atmospheric heat content (AHC) hereafter.
Turning to the actual datasets used, atmospheric energy accumulation can be quantified using various data types, as summarized in the following. Atmospheric reanalyses combine observational information from various sources (radiosondes, satellites, weather stations, etc.) and a dynamical model in a statistically optimal way. This data type has reached a high level of maturity, thanks to continuous development work since the early 1990s (Hersbach et al., 2018). Especially reanalyzed atmospheric state quantities like temperature, winds and moisture are considered to be of high quality and suitable for climate studies, although temporal discontinuities introduced from the ever-changing observation system remain a matter of concern (Berrisford et al., 2011; Chiodo and Haimberger, 2010).
Here we use the current generation of atmospheric reanalyses as represented by ECMWF's fifth-generation reanalysis ERA5 (Hersbach et al., 2018, 2020), NASA's Modern-Era Retrospective analysis for Research and Applications version 2 (MERRA2) (Gelaro et al., 2017) and JMA's 55-year-long reanalysis JRA-55 (Kobayashi et al., 2015). All these are available over 1980 to 2018 (ERA5 also in 1979), while JRA-55 is the only one covering the full early timeframe 1960 to 1979. We additionally used a different version of JRA-55 that assimilates only conventional observations also over the satellite era from 1979 onwards, which away from the surface only leaves radiosondes as data source and which is available to 2012 (JRA-55C). The advantage of this product is that it avoids potential spurious jumps associated with satellite changes. Moreover, JRA-55C is fully independent of satellite-derived Global Positioning System (GPS) radio occultation (RO) data that are also separately used and described below together with the observational techniques.
In addition to these four reanalyses, the datasets from three different observation techniques have been used for complementary observational estimates of the atmospheric heat content. We use the Wegener Center (WEGC) multisatellite RO data record, WEGC OPSv5.6 (Angerer et al., 2017), as well as its radiosonde (RS) data record derived from the high-quality Vaisala sondes RS80/RS92/VS41, WEGC Vaisala (Ladstädter et al., 2015). WEGC OPSv5.6 and WEGC Vaisala provide thermodynamic upper air profiles of air temperature, specific humidity and density from which we locally estimate the vertical AHC based on the first three integral terms of Eq. (3) (Kirchengast et al., 2019). In atmospheric domains not fully covered by the data (e.g., in the lower part of the boundary layer for RO or over the polar latitudes for RS), the profiles are vertically completed by collocated ERA5 information. The local vertical AHC results are then averaged into regional monthly means, which are finally geographically aggregated to global AHC. Applying this estimation approach in the same way to reanalysis profiles subsampled at the observation locations accurately leads to the same AHC anomaly time series records as the direct estimation from the full gridded fields.
The third observation-based AHC dataset derives from a rather approximate estimation approach using the microwave sounding unit (MSU) data records (Mears and Wentz, 2017). Because the very coarse vertical resolution of the brightness temperature measurements from MSU does not enable integration according to Eq. (3), this dataset is derived by replicating the method used in IPCC AR5 WGI Assessment Report 2013 (Rhein et al., 2013; chap. 3, Box 3.1 therein). We used the most recent MSU Remote Sensing System (RSS) V4.0 temperature dataset (Mears and Wentz, 2017), however, instead of MSU RSS V3.3 (Mears and Wentz, 2009a, b) that was used in the IPCC AR5. In order to derive global time series of AHC anomalies, the approach simply combines weighted MSU lower tropospheric temperature and lower stratospheric temperature changes (TLT and TLS channels) converted to sensible heat content changes via global atmospheric mass, as well as an assumed fractional increase in latent heat content according to water vapor content increase driven by temperature at a near-Clausius–Clapeyron rate (7.5 % ∘C−1).
Figure 3 shows the resulting global AHC change inventory over 1980 to 2018 in terms of AHC anomalies of all data types (top), mean anomalies and time-average uncertainty estimates including long-term AHC trend estimates (middle), and annual-mean AHC tendency estimates (bottom). The mean anomaly time series (middle left), preceded by the small JRA-55 anomalies over 1960–1979, is used as part of the overall heat inventory in Sect. 5 below. Results including MSU in addition are separately shown (right column), since this dataset derives from a fairly approximate estimation as summarized above and hence is given lower confidence than the others deriving from rigorous AHC integration and aggregation. Since MSU data were the only data for AHC change estimation in the IPCC AR5 report, bringing it into context is considered relevant, however.
The results clearly show that the AHC trends have intensified from the earlier decades represented by the 1980–2010 trends of near 1.8 TW (consistent with the trend interval used in the IPCC AR5 report). We find the trends about 2.5 times higher over 1993–2018 (about 4.5 TW) and about 3 times higher in the most recent 2 decades over 2002–2018 (near 5.3 TW), a period that is already fully covered also by the RO and RS records (which estimate around 6 TW). Checking the sensitivity of these long-term trend estimates to El Niño–Southern Oscillation (ENSO) interannual variations, by comparing to trends fitted to ENSO-corrected AHC anomalies (with ENSO regressed out via the Nino 3.4 index), confirms that the estimates are robust (trends consistent within about 10 %, slightly higher with ENSO correction).
The year-to-year annual-mean tendencies in AHC, reaching amplitudes as high as 50 to 100 TW (or 0.1 to 0.2 W m−2, if normalized to the global surface area), indicate the strong coupling of the atmosphere with the uppermost ocean. This is mainly caused by the ENSO interannual variations that lead to net energy changes in the climate system including the atmosphere (Loeb et al., 2012; Mayer et al., 2013) and substantial reshuffling of heat energy between the atmosphere and the upper ocean (Cheng et al., 2019b; Johnson and Birnbaum, 2017; Mayer et al., 2014, 2016).
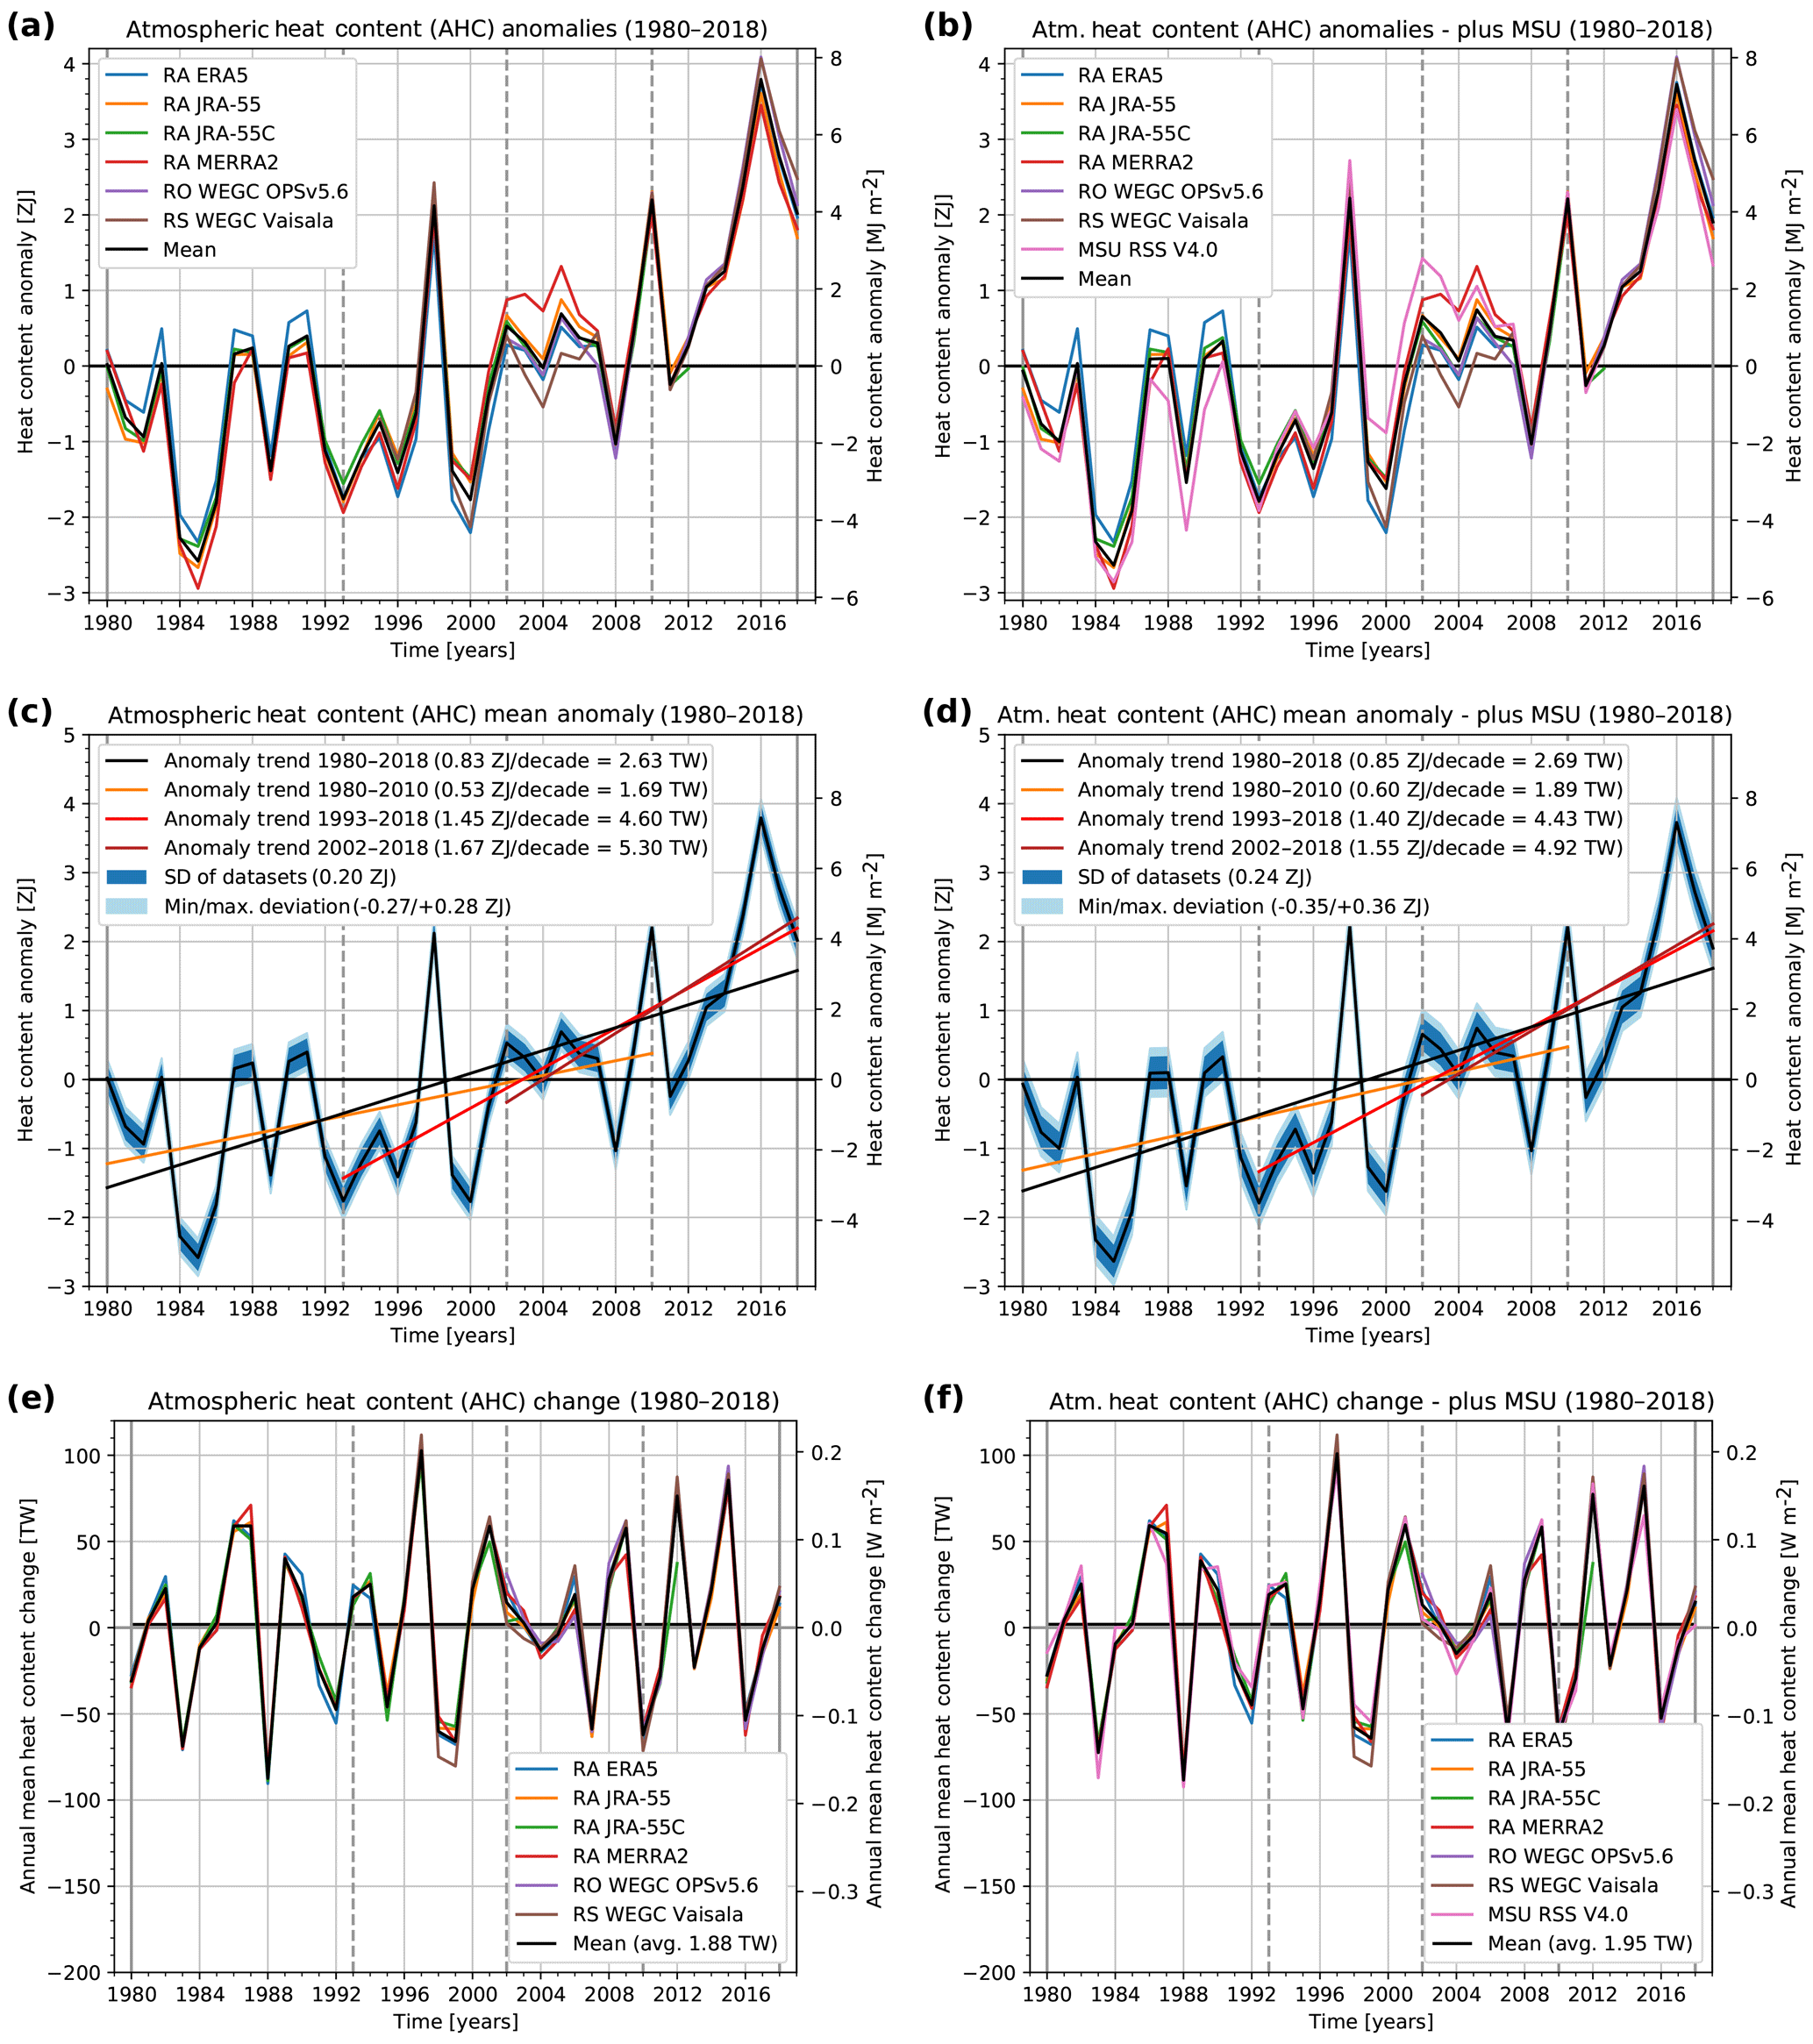
Figure 3Annual-mean global AHC anomalies over 1980 to 2018 of four different reanalyses and two (a, c, e) or three (b, d, f, plus MSU) different observational datasets shown together with their mean (a, b), the mean AHC anomaly shown together with four representative AHC trends and ensemble spread measures of its underlying datasets (c, d), and the annual-mean AHC change (annual tendency) shown for each year over 1980 to 2018 for all datasets and their mean (e, f). The in-panel legends identify the individual datasets shown (a, b and e, f) and the chosen trend periods together with the associated trend values and spread measures (c, d), with the latter including the time-average standard deviation and minimum/maximum deviations of the individual datasets from the mean.
Although the land component of the Earth's energy budget accounts for a small proportion of heat in comparison with the ocean, several land-based processes sensitive to the magnitude of the available land heat play a crucial role in the future evolution of climate. Among others, the stability and extent of the continental areas occupied by permafrost soils depend on the land component. Alterations of the thermal conditions at these locations have the potential to release long-term stored CO2 and CH4 and may also destabilize the recalcitrant soil carbon (Bailey et al., 2019; Hicks Pries et al., 2017). Both of these processes are potential tipping points (Lenton et al., 2008, 2019; Lenton, 2011) leading to possible positive feedback on the climate system (Leifeld et al., 2019; MacDougall et al., 2012). Increased land energy is related to decreases in soil moisture that may enhance the occurrence of extreme temperature events (Jeong et al., 2016; Seneviratne et al., 2006, 2014, 2010; Xu et al., 2019). Such extreme events carry negative health effects for the most vulnerable sectors of human and animal populations and ecosystems (Matthews et al., 2017; McPherson et al., 2017; Sherwood and Huber, 2010; Watts et al., 2019). Given the importance of properly determining the fraction of EEI flowing into the land component, recent works have examined the CMIP5 simulations and revealed that Earth system models (ESMs) have shortcomings in modeling the land heat content of the last half of the 20th century (Cuesta-Valero et al., 2016). Numerical experiments have pointed to an insufficient depth of the land surface models (LSMs) (MacDougall et al., 2008, 2010; Stevens, 2007) and to a zero heat-flow bottom boundary condition (BBC) as the origin of the limitations in these simulations. An LSM of insufficient depth limits the amount of energy that can be stored in the subsurface. The zero heat-flow BBC neglects the small but persistent long-term contribution from the flow of heat from the interior of the Earth, which shifts the thermal regime of the subsurface towards or away from the freezing point of water, such that the latent heat component is misrepresented in the northern latitudes (Hermoso de Mendoza et al., 2020). Although the heat from the interior of the Earth is constant at timescales of a few millennia, it may conflict with the setting of the LSM initial conditions in ESM simulations. Modeling experiments have also allowed us to estimate the heat content in land water reservoirs (Vanderkelen et al., 2020), accounting for 0.3±0.3 ZJ from 1900 to 2020. Nevertheless, this estimate has not been included here because it is derived from model simulations and its magnitude is small in relation to the rest of the components of the Earth's heat inventory.
4.1 Borehole climatology
The main premise of borehole climatology is that the subsurface thermal regime is determined by the balance of the heat flowing from the interior of the Earth (the bottom boundary condition) and the heat flowing through the interface between the lower atmosphere and the ground (the upper boundary condition). If the thermal properties of the subsurface are known, or if they can be assumed constant over short-depth intervals, then the thermal regime of the subsurface can be determined by the physics of heat diffusion. The simplest analogy is the temperature distribution along a (infinitely wide) cylinder with known thermal properties and constant temperature at both ends. If upper and lower boundary conditions remain constant (i.e., internal heat flow is constant and there are no persistent variations on the ground surface energy balance), then the thermal regime of the subsurface is well known and it is in a (quasi-)steady state. However, any change to the ground surface energy balance would create a transient, and such a change in the upper boundary condition would propagate into the ground, leading to changes in the thermal regime of the subsurface (Beltrami, 2002a). These changes in the ground surface energy balance propagate into the subsurface and are recorded as departures from the quasi-steady thermal state of the subsurface. Borehole climatology uses these subsurface temperature anomalies to reconstruct the ground surface temperature changes that may have been responsible for creating the subsurface temperature anomalies we observe. That is, it is an attempt to reconstruct the temporal evolution of the upper boundary condition. Ground surface temperature histories (GSTHs) and ground heat flux histories (GHFHs) have been reconstructed from borehole temperature profile (BTP) measurements at regional and larger scales for decadal and millennial timescales (Barkaoui et al., 2013; Beck, 1977; Beltrami, 2001; Beltrami et al., 2006; Beltrami and Bourlon, 2004; Cermak, 1971; Chouinard and Mareschal, 2009; Davis et al., 2010; Demezhko and Gornostaeva, 2015; Harris and Chapman, 2001; Hartmann and Rath, 2005; Hopcroft et al., 2007; Huang et al., 2000; Jaume-Santero et al., 2016; Lachenbruch and Marshall, 1986; Lane, 1923; Pickler et al., 2018; Roy et al., 2002; Vasseur et al., 1983). These reconstructions have provided independent records for the evaluation of the evolution of the climate system well before the existence of meteorological records. Because subsurface temperatures are a direct measure, which unlike proxy reconstructions of past climate do not need to be calibrated with the meteorological records, they provide an independent way of assessing changes in climate. Such records are useful tools for evaluating climate simulations prior to the observational period (Beltrami et al., 2017; Cuesta-Valero et al., 2019, 2016; García-García et al., 2016; González-Rouco et al., 2006; Jaume-Santero et al., 2016; MacDougall et al., 2010; Stevens et al., 2008), as well as for assessing proxy data reconstructions (Beltrami et al., 2017; Jaume-Santero et al., 2016).
Borehole reconstructions have, however, certain limitations. Due to the nature of heat diffusion, temperature changes propagated through the subsurface suffer both a phase shift and an amplitude attenuation (Smerdon and Stieglitz, 2006). Although subsurface temperatures continuously record all changes in the ground surface energy balance, heat diffusion filters out the high frequency variations of the surface signal with depth; thus the annual cycle is detectable up to approximately 16 m of depth, while millennial changes are recorded approximately to a depth of 500 m. Therefore, reconstructions from borehole temperature profiles represent changes at decadal-to-millennial timescales. Additionally, borehole data are sparse, since the logs were usually recorded from holes of opportunity at mining exploration sites. As a result, the majority of profiles were measured in the Northern Hemisphere, although recent efforts have been taken to increase the sampling rate in South America (Pickler et al., 2018) and Australia (Suman et al., 2017). Despite this uneven sampling, the spatial distribution of borehole profiles has been able to represent the evolution of land surface conditions at global scales (Beltrami and Bourlon, 2004; Cuesta-Valero et al., 2020; González-Rouco et al., 2006, 2009; Pollack and Smerdon, 2004). Another factor that reduces the number of borehole profiles suitable for climate analyses is the presence of nonclimatic signals in the measured profiles, mainly caused by groundwater flow and changes in the lithology of the subsurface. Therefore, all profiles are screened before the analysis in order to remove questionable logs. Despite all these limitations, the borehole methodology has been shown to be reliable based on observational analyses (Bense and Kooi, 2004; Chouinard and Mareschal, 2007; Pollack and Smerdon, 2004; Verdoya et al., 2007) and pseudoproxy experiments (García Molinos et al., 2016; González-Rouco et al., 2006, 2009).
4.2 Land heat content estimates
Global continental energy content has been previously estimated from geothermal data retrieved from a set of quality-controlled borehole temperature profiles. Ground heat content was estimated from heat flux histories derived from BTP data (Beltrami, 2002b; Beltrami et al., 2002, 2006). Such results have formed part of the estimate used in AR3, AR4 and AR5 IPCC reports (see Box 3.1, chap. 3 Rhein et al., 2013). A continental heat content estimate was inferred from meteorological observations of surface air temperature since the beginning of the 20th century (Huang, 2006). Nevertheless, all global estimates were performed nearly 2 decades ago. Since, those days, advances in borehole methodological techniques (Beltrami et al., 2015; Cuesta-Valero et al., 2016; Jaume-Santero et al., 2016), the availability of additional BTP measurements and the possibility of assessing the continental heat fluxes in the context of the FluxNet measurements (Gentine et al., 2020) require a comprehensive summary of all global ground heat fluxes and continental heat content estimates.
Table 2Ground surface heat flux and global continental heat content. Uncertainties in parenthesis.

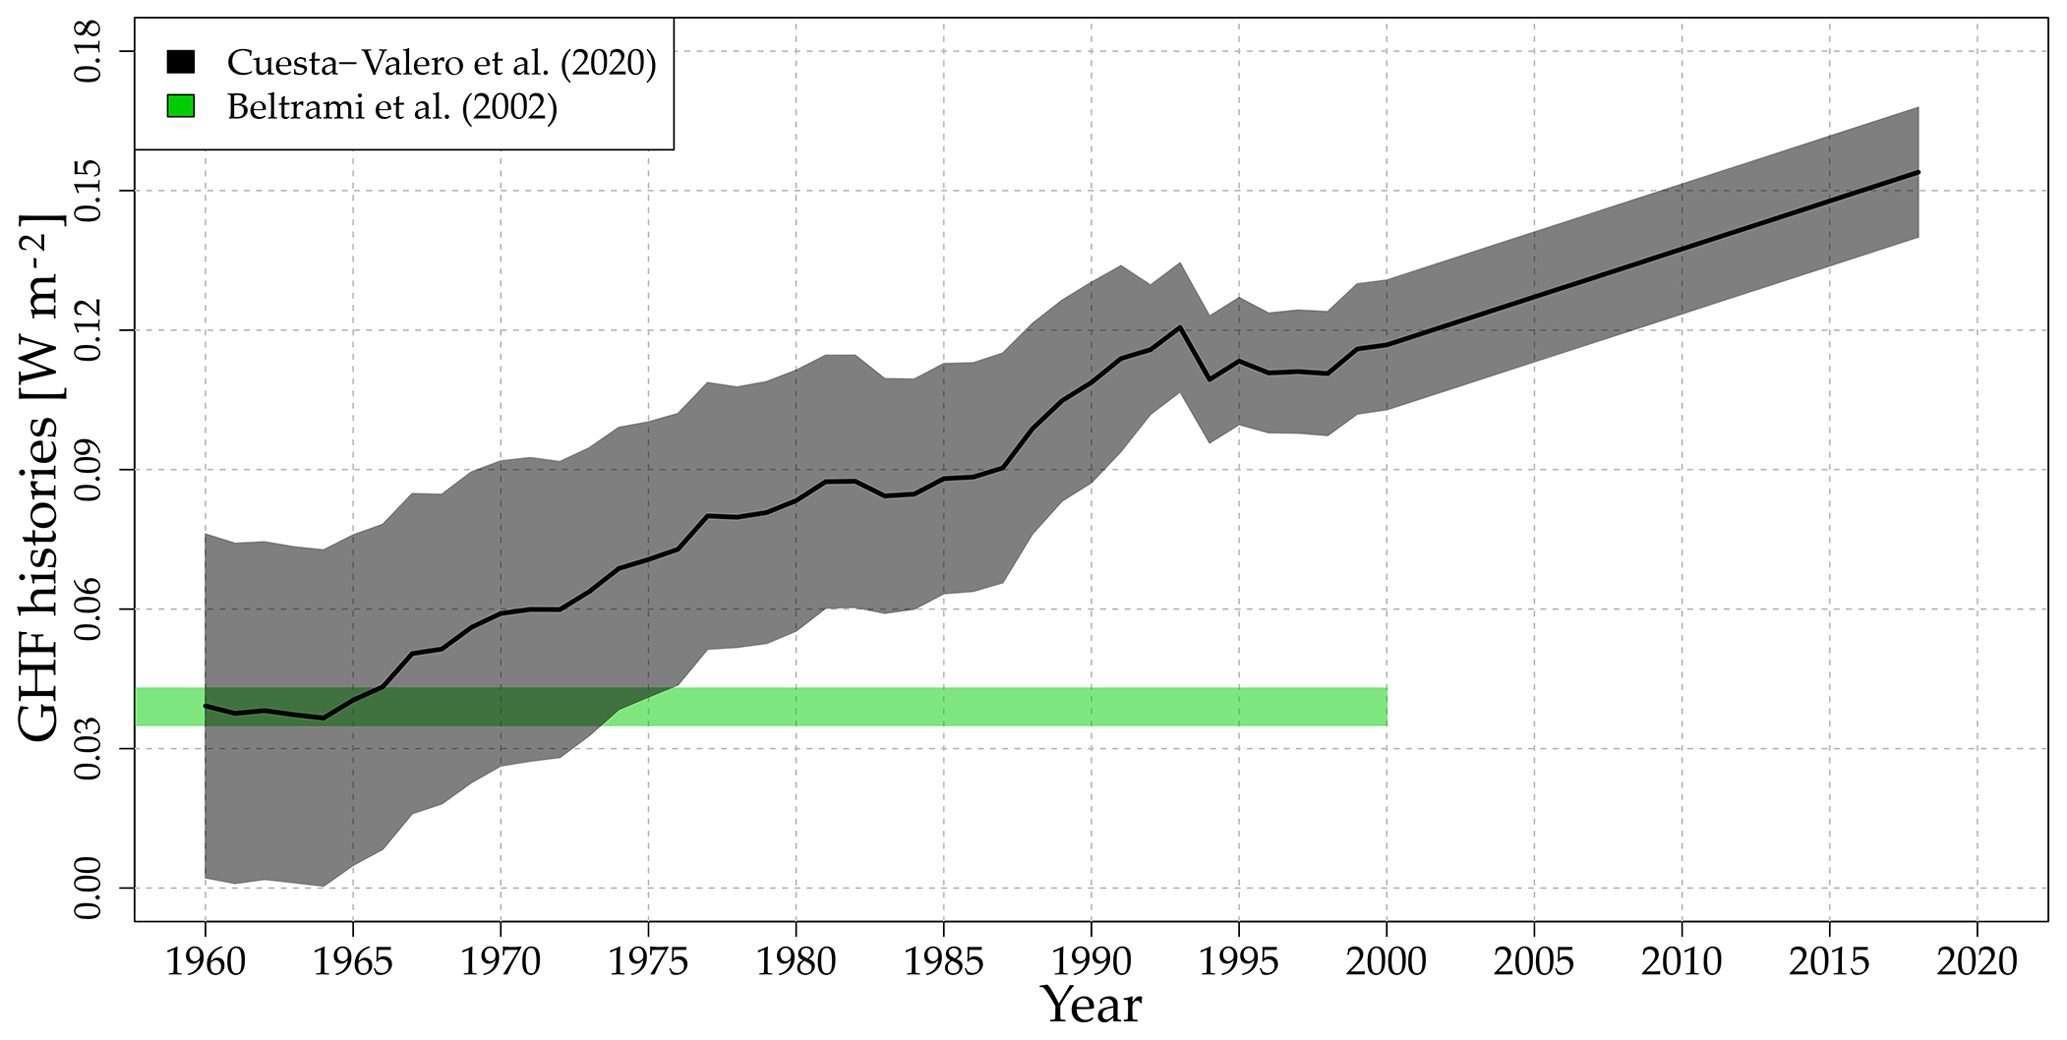
Figure 4Global mean ground heat flux history (black line) and 95 % confidence interval (gray shadow) from BTP measurements from Cuesta-Valero et al. (2020). Results for 1950–2000 from Beltrami et al. (2002) (green bar) are provided for comparison purposes.
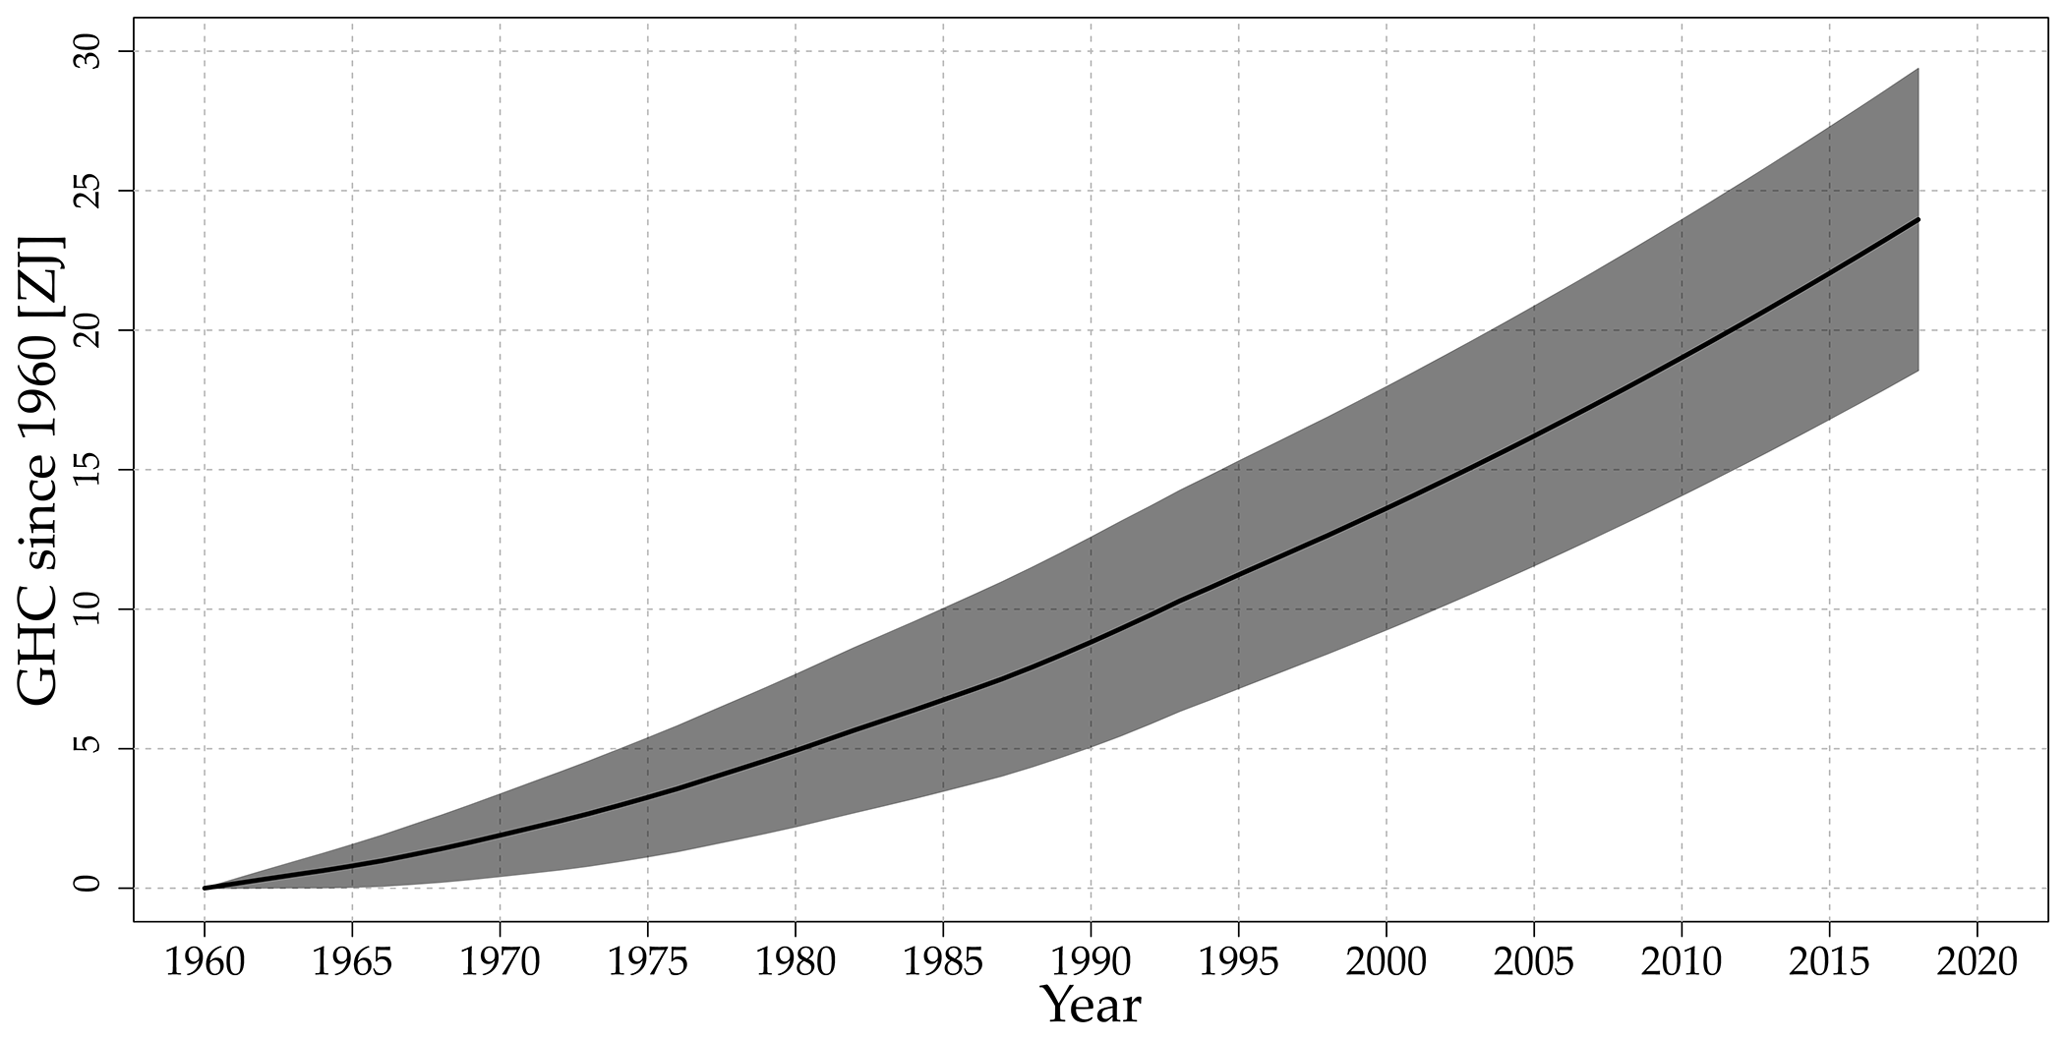
Figure 5Global cumulative heat storage within continental landmasses since 1960 CE (black line) and 95 % confidence interval (gray shadow) estimated from ground heat flux results displayed in Fig. 4. Data obtained from Cuesta-Valero et al. (2020).
The first estimates of continental heat content used borehole temperature versus depth profile data. However, the dataset in those analyses included borehole temperature profiles of a wide range of depths, as well as different data acquisition dates. That is, each borehole profile contained the record of the accumulation of heat in the subsurface for different time intervals. In addition, the borehole data were analyzed for a single ground surface temperature model using a single constant value for each of the subsurface thermal properties.
Although the thermal signals are attenuated with depth, which may partially compensate for data shortcomings, uncertainties were introduced in previous analyses that may have affected the estimates of subsurface heat change. A continental heat content change estimate was carried out using a gridded meteorological product of surface air temperature by Huang (2006). Such work yielded similar values to the estimates from geothermal data (see Table 2). This estimate, however, assumed that surface air and ground temperatures are perfectly coupled everywhere, and it used a single value for the thermal conductivity of the ground. Studies have shown that the coupling of the surface air and ground temperatures is mediated by several processes that may influence the ground surface energy balance and, therefore, the air–ground temperature coupling (García-García et al., 2019; Melo-Aguilar et al., 2018; Stieglitz and Smerdon, 2007). In a novel attempt to reconcile continental heat content from soil heat-plate data from the FluxNet network with estimates from geothermal data and a deep bottom boundary land surface model simulation, Gentine et al. (2020) obtained a much larger magnitude from the global land heat flux than all previous estimates. Cuesta-Valero et al. (2020) has recently updated the estimate of the global continental heat content using a larger borehole temperature database (1079 logs) that includes more recent measurements and a stricter data quality control. The updated estimate of continental heat content change also takes into account the differences in borehole logging time and restricts the data to the same depth range for each borehole temperature profile. Such depth range restriction ensures that the subsurface accumulation of heat at all BTP sites is synchronous. In addition to the standard method for reconstructing heat fluxes with a single constant value for each subsurface thermal property, Cuesta-Valero et al. (2020) also developed a new approach that considers a range of possible subsurface thermal properties – several models, each at a range of resolutions yielding a more realistic range of uncertainties for the fraction of the EEI flowing into the land subsurface.
Global land heat content estimates from FluxNet data, geothermal data and model simulations point to a marked increase in the amount of energy flowing into the ground in the last few decades (Figs. 4, 5 and Table 2). These results are consistent with the observations of ocean, cryosphere and atmospheric heat storage increases during the same time period as well as with EEI at the top of the atmosphere.
The energy uptake by the cryosphere is given by the sum of the energy uptake within each one of its components: sea ice, the Greenland and Antarctic ice sheets, glaciers other than those that are part of the ice sheets (“glaciers”, hereafter), snow, and permafrost. The basis for the heat uptake by the cryosphere presented here is provided by a recent estimate for the period 1979 to 2017 (Straneo et al., 2020). This study concludes that heat uptake over this period is dominated by the mass loss from Arctic sea ice, glaciers, and the Greenland and Antarctic ice sheets. The contributions from thawing permafrost and shrinking snow cover are either negligible, compared to these other components, or highly uncertain. (Note that warming of the land in regions where permafrost is present is accounted for in the land warming; however, the energy to thaw the permafrost is not.) Antarctic sea ice shows no explicit trend over the period described here (Parkinson, 2019). Here, we extend the estimate of Straneo et al. (2020) backwards in time to 1960 and summarize the method, the data and model outputs used. The reader is referred to Straneo et al. (2020) for further details.
Within each component of the cryosphere, energy uptake is dominated by that associated with melting, including both the latent heat uptake and the warming of the ice to its freezing point. As a result, the energy uptake by each component is directly proportional to its mass loss (Straneo et al., 2020). For consistency with previous estimates (Ciais et al., 2013), we use a constant latent heat of fusion of 3.34×10⁵ J kg−1, a specific heat capacity of 2.01×10³ J/(kg ∘C) and an ice density of 920 kg m−3.
For Antarctica, we separate contributions from grounded ice loss and floating ice loss building on recent separate estimates for each. Grounded ice loss from 1992 to 2017 is based on a recent study that reconciles mass balance estimates from gravimetry, altimetry and input–output methods from 1992 to 2017 (Shepherd et al., 2018b). For the 1972–1991 period, we used estimates from Rignot et al. (2019), which combined modeled surface mass balance with ice discharge estimates from the input/output method. Floating ice loss between 1994 and 2017 is based on thinning rates and iceberg calving fluxes estimated using new satellite altimetry reconstructions (Adusumilli et al., 2020). For the 1960–1994 period, we also considered mass loss from declines in Antarctic Peninsula ice shelf extent (Cook and Vaughan, 2010) using the methodology described in Straneo et al. (2020).
To estimate grounded ice mass loss in Greenland, we use the Ice Sheet Mass Balance Intercomparison Exercise for the time period 1992–2017 (Shepherd et al., 2019) and the difference between surface mass balance and ice discharge for the period 1979–1991 (Mankoff et al., 2019; Mouginot et al., 2019; Noël et al., 2018). Due to a lack of observations, from 1960–1978 we assume no mass loss. For floating ice mass change, we collated reports of ice shelf thinning and/or collapse together with observed tidewater glacier retreat (Straneo et al., 2020). Based on firn modeling we assessed that warming of Greenland's firn has not yet contributed significantly to its energy uptake (Ligtenberg et al., 2018; Straneo et al., 2020).
For glaciers we combine estimates for glaciers from the Randolph Glacier Inventory outside of Greenland and Antarctica, based on direct and geodetic measurements (Zemp et al., 2019), with estimates based on a glacier model forced with an ensemble of reanalysis data (Marzeion et al., 2015) and GRACE-based estimates (Bamber et al., 2018). An additional contribution from uncharted glaciers or glaciers that have already disappeared is obtained from Parkes and Marzeion (2018). Greenland and Antarctic peripheral glaciers are derived from Zemp et al. (2019) and Marzeion et al. (2015).
Finally, while estimates of Arctic sea ice extent exist over the satellite record, sea ice thickness distribution measurements are scarce, making it challenging to estimate volume changes. Instead we use the Pan-Arctic Ice Ocean Modeling and Assimilation System (PIOMAS) (Schweiger et al., 2011; Zhang and Rothrock, 2003) which assimilates ice concentration and sea surface temperature data and is validated with most available thickness data (from submarines, oceanographic moorings, and remote sensing) and against multidecadal records constructed from satellite (for example, Labe et al., 2018; Laxon et al., 2013; Wang et al., 2016). A longer reconstruction using a slightly different model version, PIOMAS-20C (Schweiger et al., 2019), is used to cover the 1960 to 1978 period that is not covered by PIOMAS.
These reconstructions reveal that all four components contributed similar amounts (between 2 and 5 ZJ) over the 1960–2017 period, amounting to a total energy uptake by the cryosphere of 14.7±1.9 ZJ. Compared to earlier estimates, and in particular the 8.83 ZJ estimate from Ciais et al. (2013), this larger estimate is a result both of the longer period of time considered and, also, the improved estimates of ice loss across all components, especially the ice shelves in Antarctica. Approximately half of the cryosphere's energy uptake is associated with the melting of grounded ice, while the remaining half is associated with the melting of floating ice (ice shelves in Antarctica and Greenland, Arctic sea ice).
The Earth has been in radiative imbalance, with less energy exiting the top of the atmosphere than entering, since at least about 1970, and the Earth has gained substantial energy over the past 4 decades (Hansen, 2005; Rhein et al., 2013). Due to the characteristics of the Earth system components, the ocean with its large mass and high heat capacity dominates the Earth heat inventory (Cheng et al., 2016, 2017b; Rhein et al., 2013; von Schuckmann et al., 2016). The rest goes into grounded and floating ice melt, as well as warming the land and atmosphere.
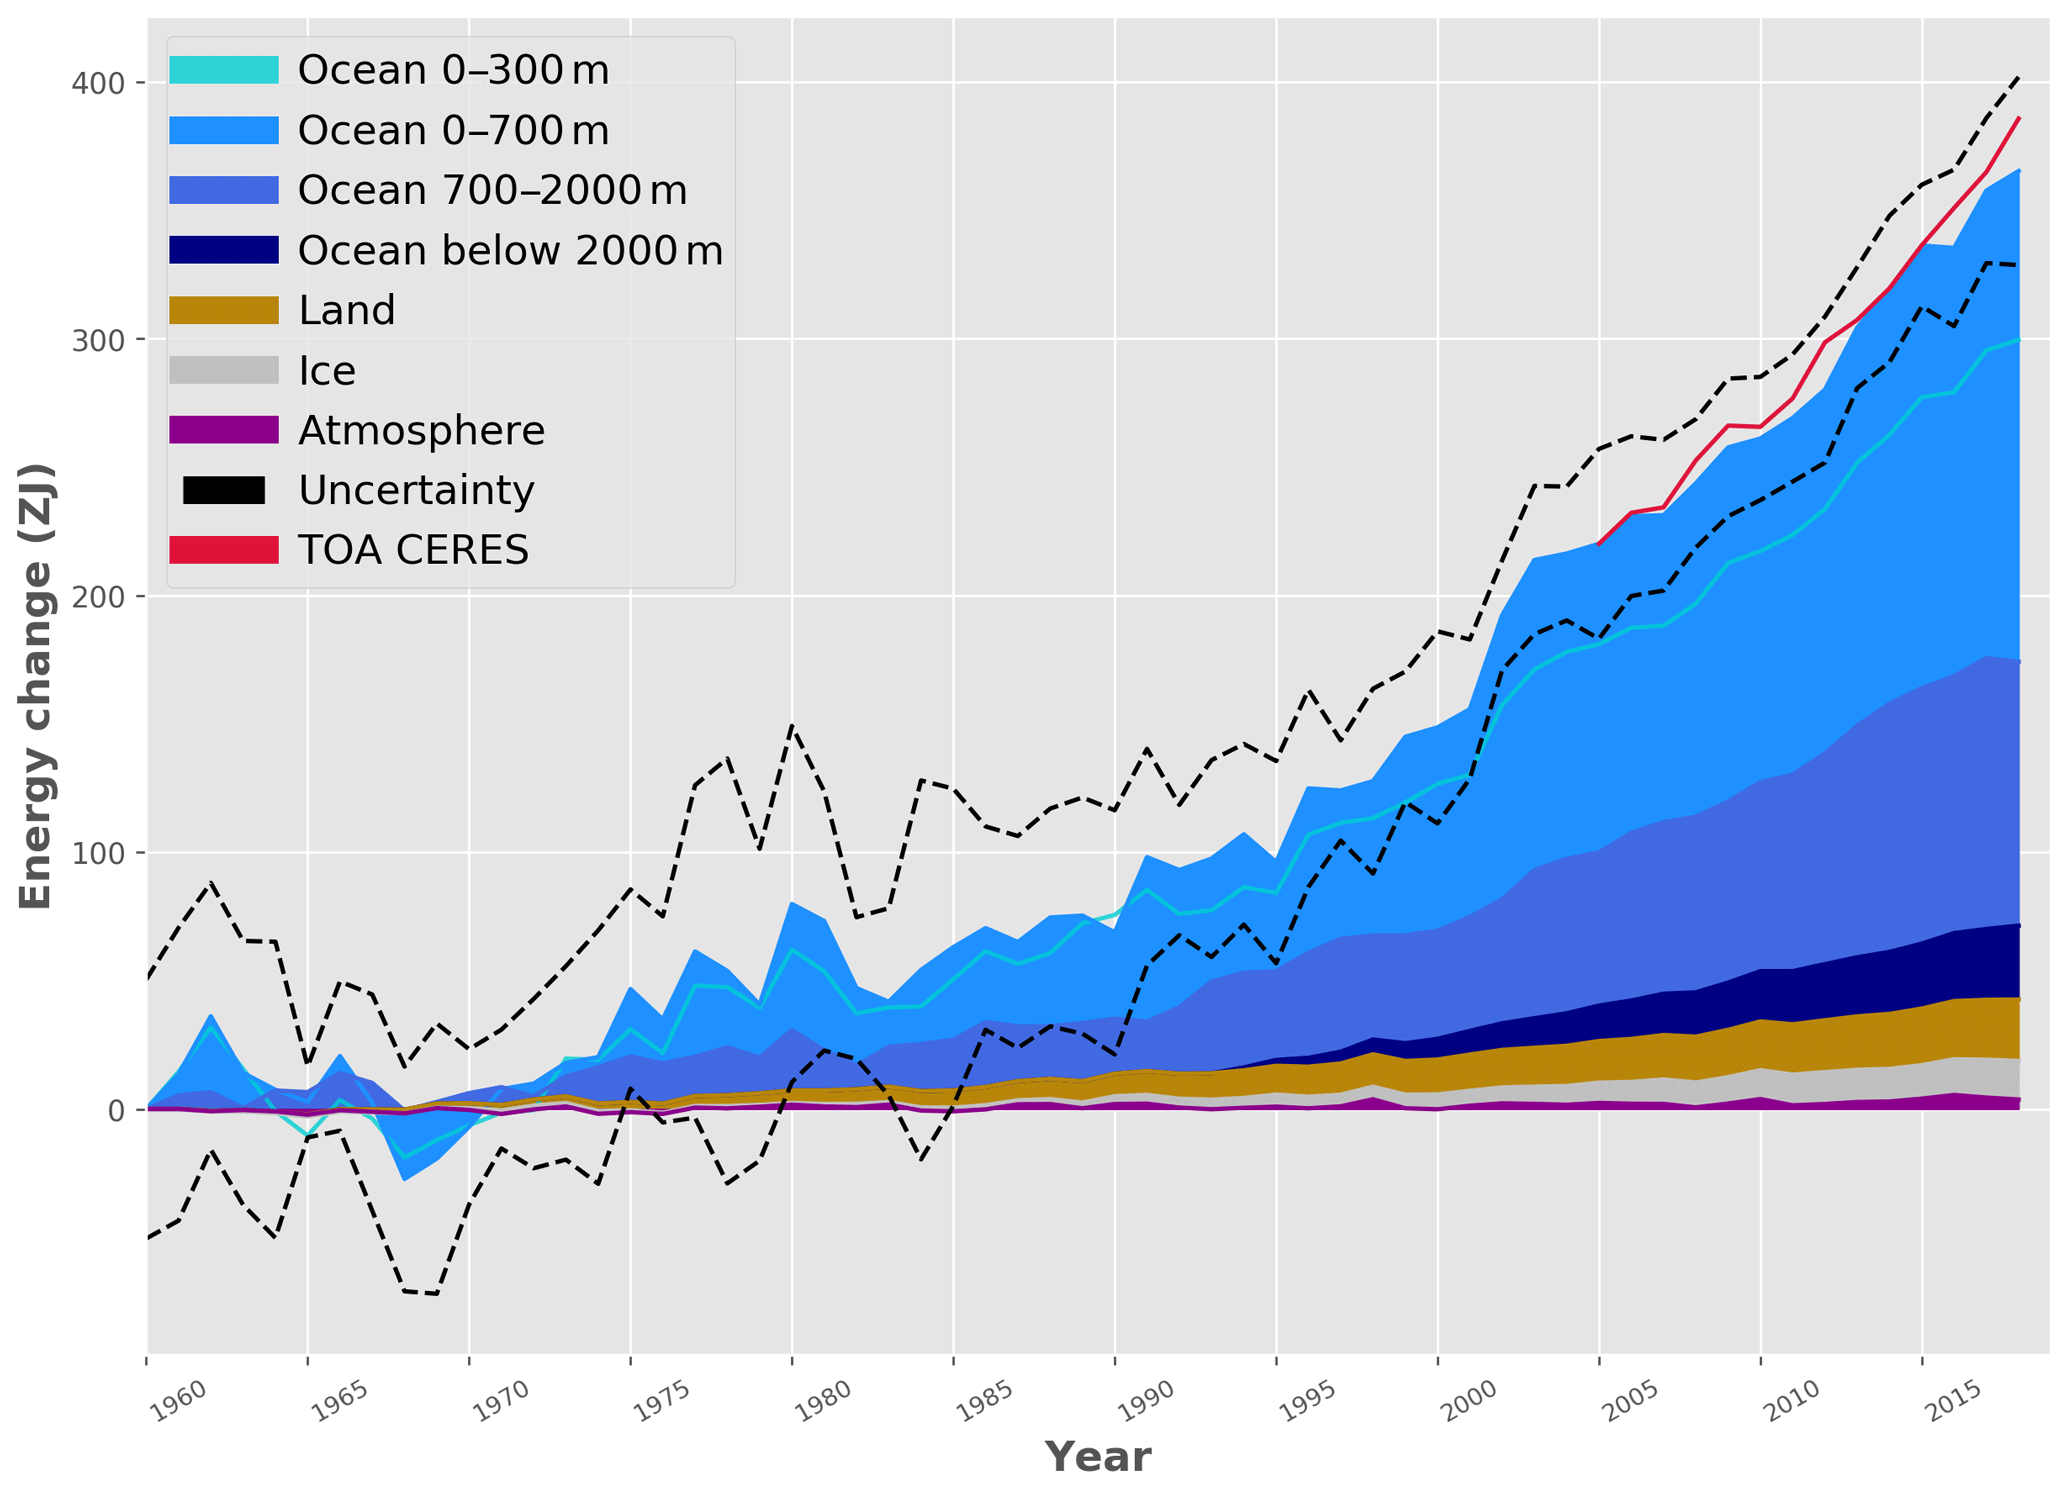
Figure 6Earth heat inventory (energy accumulation) in ZJ (1 ZJ =1021 J) for the components of the Earth's climate system relative to 1960 and from 1960 to 2018 (assuming constant cryosphere increase for the year 2018). See Sects. 1–4 for data sources. The upper ocean (0–300 m, light blue line, and 0–700 m, light blue shading) accounts for the largest amount of heat gain, together with the intermediate ocean (700–2000 m, blue shading) and the deep ocean below 2000 m depth (dark blue shading). Although much lower, the second largest contributor is the storage of heat on land (orange shading), followed by the gain of heat to melt grounded and floating ice in the cryosphere (gray shading). Due to its low heat capacity, the atmosphere (magenta shading) makes a smaller contribution. Uncertainty in the ocean estimate also dominates the total uncertainty (dot-dashed lines derived from the standard deviations (2σ) for the ocean, cryosphere and land; atmospheric uncertainty is comparably small). Deep ocean (>2000 m) is assumed to be zero before 1990 (see Sect. 1 for more details). The dataset for the Earth heat inventory is published at the German Climate Computing Centre (DKRZ, https://www.dkrz.de/) under the DOI https://doi.org/10.26050/WDCC/GCOS_EHI_EXP_v2. The net flux at TOA from the NASA CERES program is shown in red (https://ceres.larc.nasa.gov/data/, last access: 7 August 2020; see also for example Loeb et al., 2012) for the period 2005–2018 to account for the golden period of best available estimates. We obtain a total heat gain of 358±37 ZJ over the period 1971–2018, which is equivalent to a heating rate (i.e., the EEI) of 0.47±0.1 W m−2 applied continuously over the surface area of the Earth (5.10×10¹⁴ m2). The corresponding EEI over the period 2010–2018 amounts to 0.87±0.12 W m−2. A weighted least square fit has been used taking into account the uncertainty range (see also von Schuckmann and Le Traon, 2011).
In agreement with previous studies, the Earth heat inventory based on most recent estimates of heat gain in the ocean (Sect. 1), the atmosphere (Sect. 2), land (Sect. 3) and the cryosphere (Sect. 4) shows a consistent long-term heat gain since the 1960s (Fig. 6). Our results show a total heat gain of 358±37 ZJ over the period 1971–2018, which is equivalent to a heating rate of 0.47±0.1 W m−2, and it applied continuously over the surface area of the Earth (5.10×10¹⁴ m2). For comparison, the heat gain obtained in IPCC AR5 amounts to 274±78 ZJ and 0.4 W m−2 over the period 1971–2010 (Rhein et al., 2013). In other words, our results show that since the IPCC AR5 estimate has been performed, heat accumulation has continued at a comparable rate. The major player in the Earth inventory is the ocean, particularly the upper (0–700 m) and intermediate (700–2000 m) ocean layers (see also Sect. 1, Fig. 2).
Although the net flux at TOA as derived from remote sensing is anchored by an estimate of global OHC (Loeb et al., 2012), and thus does not provide a completely independent result for the total EEI, we additionally compare net flux at TOA with the Earth heat inventory obtained in this study (Fig. 6). Both rates of change compare well, and we obtain 0.7±0.1 W m−2 for the remote sensing estimate at TOA and 0.8±0.1 W m−2 for the Earth heat inventory over the period 2005–2018.
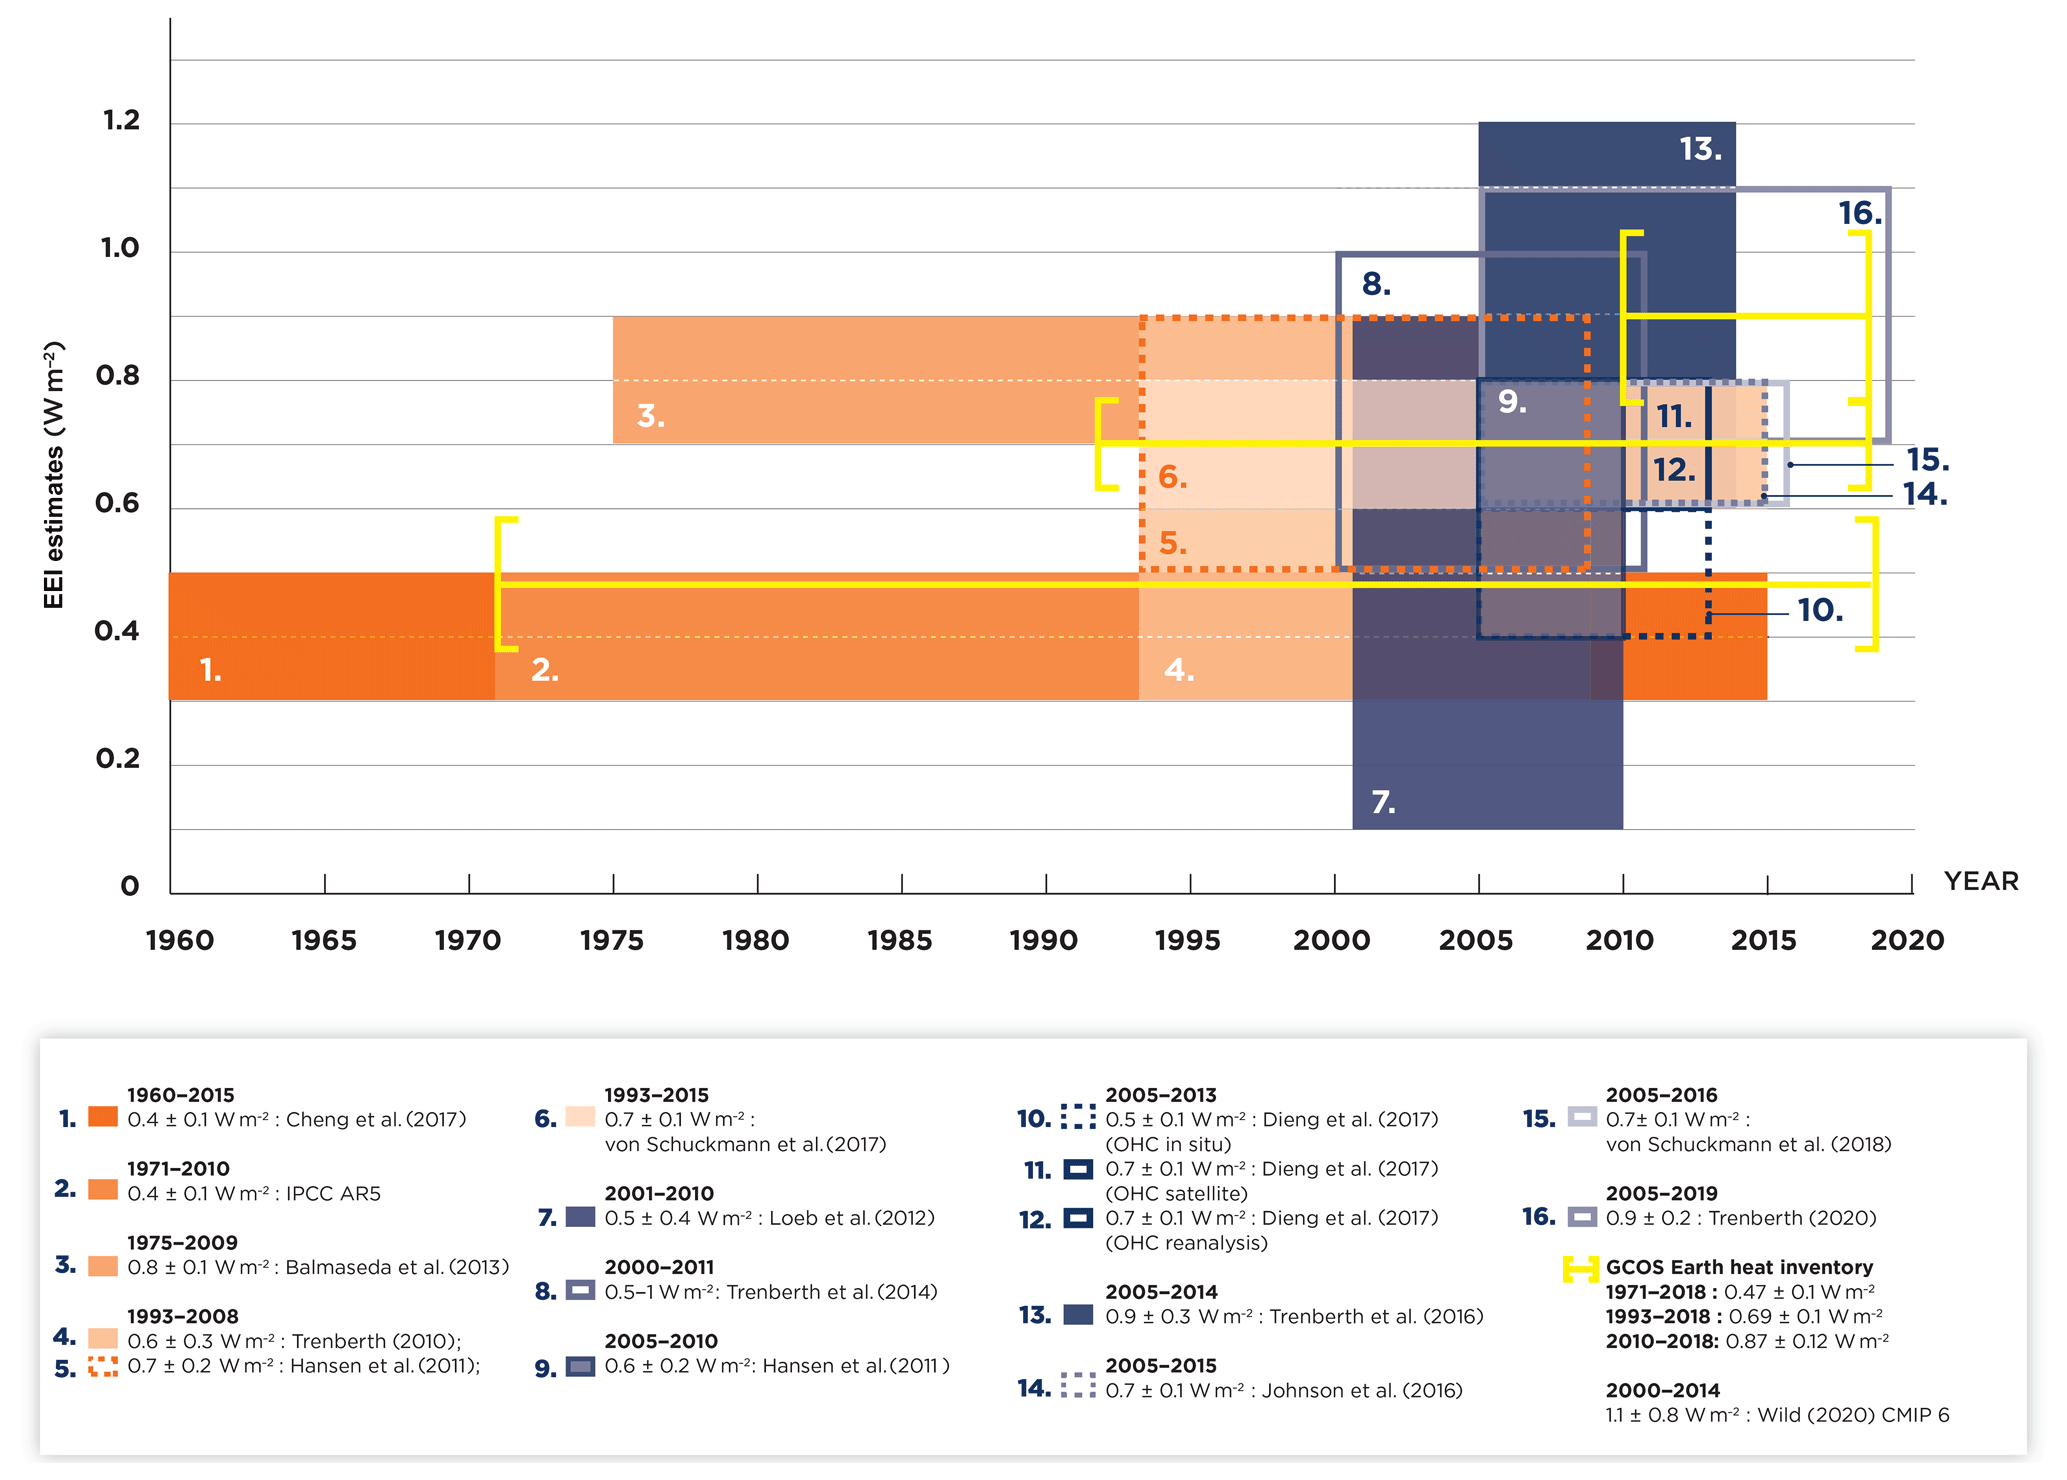
Figure 7Overview on EEI estimates as obtained from previous publications; references are listed in the figure legend. For IPCC AR5, Rhein et al. (2013) is used. The color bars take into account the uncertainty ranges provided in each publication, respectively. For comparison, the estimates of our Earth heat inventory based on the results of Fig. 6 have been added (yellow lines) for the periods 1971–2018, 1993–2018 and 2010–2018, and the trends have been evaluated using a weighted least square fit (see von Schuckmann and Le Traon, 2011, for details on the method).
Rates of change derived from Fig. 6 are in agreement with previously published results for the different periods (Fig. 7). Major disagreements occur for the estimate of Balmaseda et al. (2013) which is obtained from an ocean reanalysis and known to provide higher heat gain compared to results derived strictly from observations (Meyssignac et al., 2019). Over the last quarter of a decade this Earth heat inventory reports – in agreement with previous publications – an increased rate of Earth heat uptake reaching up to 0.9 W m−2 (Fig. 7). This period is also characterized with an increase in the availability and quality of the global climate observing system, particularly for the past 2 decades. The heat inventory as obtained in this study reveals an EEI of 0.87±0.12 W m−2 over the period 2010–2018 – a period which experienced record levels of Earth surface warming and is ranked as the warmest decade relative to the reference period 1850–1900 (WMO, 2020). Whether this increased rate can be attributed to an acceleration of global warming and Earth system heat uptake (e.g., Cheng et al., 2019a; WMO, 2020; Blunden and Arndt, 2019), an induced estimation bias due to the interplay between natural and anthropogenically driven variability (e.g., Cazenave et al., 2014), or underestimated uncertainties in the historical record (e.g., Boyer et al., 2016) needs further investigation.
The new multidisciplinary estimate obtained from a concerted international effort provides an updated insight in where the heat is going from a positive EEI of 0.47±0.1 W m−2 for the period 1971–2018. Over the period 1971–2018 (2010–2018), 89 % (90 %) of the EEI is stored in the global ocean, from which 52 % (52 %) is repartitioned in the upper 700 m depth, 28 % (30 %) at intermediate layers (700–2000 m) and 9 % (8 %) in the deep ocean layer below 2000 m depth. Atmospheric warming amounts to 1 % (2 %) in the Earth heat inventory, the land heat gain amounts to 6 % (5 %) and the heat uptake by the cryosphere amounts to 4 % (3 %). These results show general agreement with previous estimates (e.g., Rhein et al., 2013). Over the period 2010–2018, the EEI amounts to 0.87±0.12 W m−2, indicating a rapid increase in EEI over the past decade. Note that a near-global (60∘ N–60∘ S) area for the ocean heat uptake is used in this study, which could induce a slight underestimation, and needs further evaluation in the future (see Sect. 1). However, a test using a single dataset (Cheng et al., 2017b) indicates that the ocean contribution within 1960–2018 can increase by 1 % if the full global ocean domain is used (not shown).
The time series of the Earth heat inventory are published at DKRZ (https://www.dkrz.de/, last access: 7 August 2020) under the DOI https://doi.org/10.26050/WDCC/GCOS_EHI_EXP_v2 (von Schuckmann et al., 2020). The data contain an updated international assessment of ocean warming estimates as well as new and updated estimates of heat gain in the atmosphere, cryosphere and land over the period 1960–2018. This published dataset has been used to build the basis for Fig. 6 of this paper. The ocean warming estimate is based on an international assessment of 15 different in situ data-based ocean products as presented in Sect. 1. The new estimate of the atmospheric heat content is fully described in Sect. 2 and is based on a combined use of atmospheric reanalyses, multisatellite data and radiosonde records, and microwave sounding techniques. The land heat storage time series as presented in Sect. 3 relies on borehole data. The heat available to account for cryosphere loss is presented in Sect. 4 and is based on a combined use of model results and observations to obtain estimates of major cryosphere components such as polar ice sheets, Arctic sea ice and glaciers.
The UN 2030 Agenda for Sustainable Development states that climate change is “one of the greatest challenges of our time …” and warns “… the survival of many societies, and of the biological support systems of the planet, is at risk” (UNGA, 2015). The outcome document of the Rio+20 Conference, The Future We Want, defines climate change as “an inevitable and urgent global challenge with long-term implications for the sustainable development of all countries” (UNGA, 2012). The Paris Agreement builds upon the United Nations Framework Convention on Climate Change (UN, 1992) and for the first time all nations agreed to undertake ambitious efforts to combat climate change, with the central aim to keep global temperature rise this century well below 2 ∘C above preindustrial levels and to limit the temperature increase even further to 1.5 ∘C (UN, 2015). Article 14 of the Paris Agreement requires the Conference of the Parties serving as the meeting of the Parties to the Paris Agreement (CMA) to periodically take stock of the implementation of the Paris Agreement and to assess collective progress towards achieving the purpose of the agreement and its long-term goals through the so-called global stocktake based on best available science.
The EEI is the most critical number defining the prospects for continued global warming and climate change (Hansen et al., 2011; von Schuckmann et al., 2016), and we call for an implementation of the EEI into the global stocktake. The current positive EEI is understood to be foremost and primarily a result of increasing atmospheric greenhouse gases (IPCC, 2013), which have – according to the IPCC special report on Global Warming of 1.5 ∘C – already “caused approximately 1.0 ∘C of global warming above preindustrial levels, with a likely range of 0.8 ∘C to 1.2 ∘C” (IPCC, 2018). The IPCC special report further states with high confidence that “global warming is likely to reach 1.5 ∘C between 2030 and 2052 if it continues to increase at the current rate”. The EEI is the portion of the forcing that the Earth's climate system has not yet responded to (Hansen et al., 2005) and defines additional global warming that will occur without further change in forcing (Hansen et al., 2017). Our results show that EEI is not only continuing, but also increasing. Over the period 1971–2018 average EEI amounts to 0.47±0.1 W m−2, but it amounts to 0.87±0.12 W m−2 during 2010–2018 (Fig. 8). Concurrently, acceleration of sea-level rise (WCRP, 2018; Legelais et al., 2020), accelerated surface warming, record temperatures and sea ice loss in the Arctic (Richter-Menge et al., 2019; WMO, 2020; Blunden and Arndt, 2020) and ice loss from the Greenland ice sheet (King et al., 2020), and intensification of atmospheric warming near the surface and in the troposphere (Steiner et al., 2020) have been – for example – recently reported. To what degree these changes are intrinsically linked needs further evaluations.
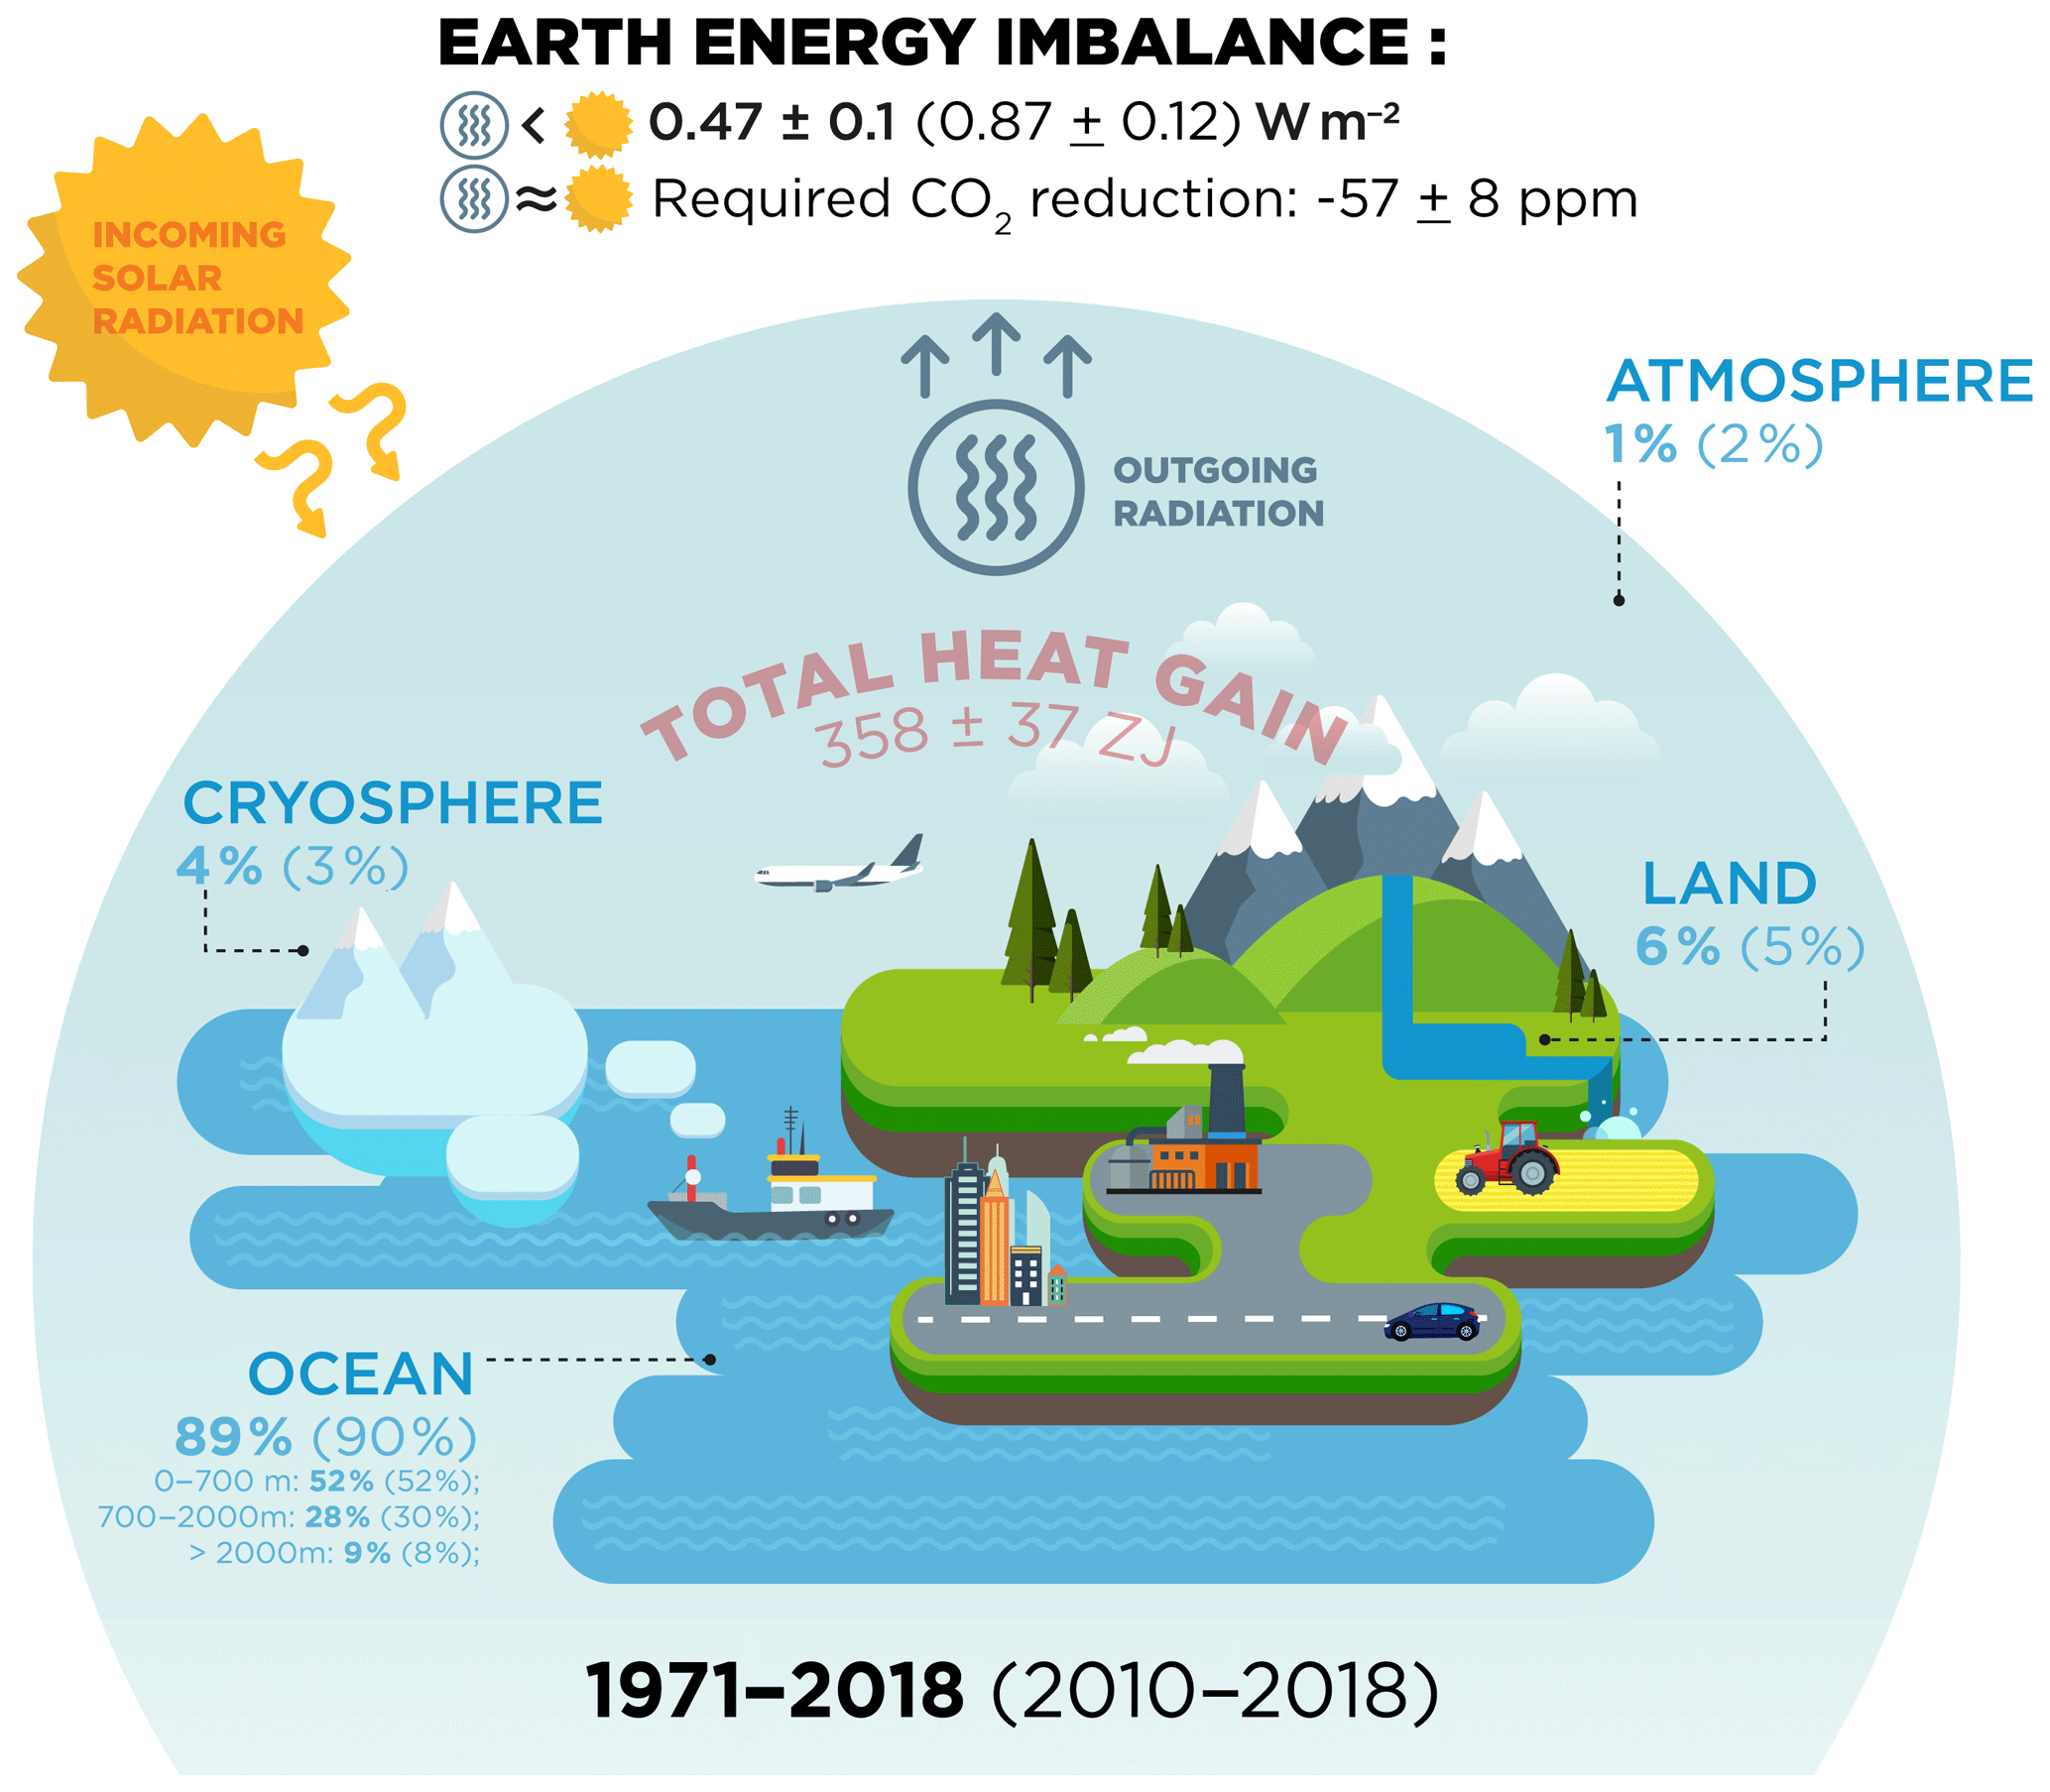
Figure 8Schematic presentation on the Earth heat inventory for the current anthropogenically driven positive Earth energy imbalance at the top of the atmosphere (TOA). The relative partition (in %) of the Earth heat inventory presented in Fig. 6 for the different components is given for the ocean (upper: 0–700 m, intermediate: 700–2000 m, deep: >2000 m), land, cryosphere (grounded and floating ice) and atmosphere, for the periods 1971–2018 and 2010–2018 (for the latter period values are provided in parentheses), as well as for the EEI. The total heat gain (in red) over the period 1971–2018 is obtained from the Earth heat inventory as presented in Fig. 6. To reduce the 2010–2018 EEI of 0.87±0.12 W m−2 towards zero, current atmospheric CO2 would need to be reduced by ppm (see text for more details).
Global atmospheric CO2 concentration reached 407.38±0.1 ppm averaged over 2018 (Friedlingstein et al., 2019) and 409.8±0.1 ppm in 2019 (Blunden and Arndt, 2020). WMO (2020) reports CO2 concentrations at the Mauna Loa measurement platform of 411.75 ppm in February 2019 and 414.11 ppm in February 2020. Stabilization of climate, the goal of the universally agreed UNFCCC (UN, 1992) and the Paris Agreement (UN, 2015), requires that EEI be reduced to approximately zero to achieve Earth's system quasi-equilibrium. The change of heat radiation to space for a given greenhouse gas change can be computed accurately. The amount of CO2 in the atmosphere would need to be reduced from 410 to 353 ppm (i.e., a required reduction of ppm) to increase heat radiation to space by 0.87 W m−2, bringing Earth back towards energy balance (Fig. 8), where we have used the analytic formulae of Hansen et al. (2000) for this estimation. Atmospheric CO2 was last 350 ppm in the year 1988, and the global Earth surface temperature was then +0.5 ∘C relative to the preindustrial period (relative to the 1880–1920 mean) (Hansen et al., 2017; Friedlingstein et al., 2019). In principle, we could reduce other greenhouse gases and thus require a less stringent reduction of CO2. However, as discussed by Hansen et al. (2017), some continuing increase in N2O, whose emissions are associated with food production, seems inevitable, so there is little prospect for much net reduction of non-CO2 greenhouse gases, and thus the main burden for climate stabilization falls on CO2 reduction. This simple number, EEI, is the most fundamental metric that the scientific community and public must be aware of as the measure of how well the world is doing in the task of bringing climate change under control (Fig. 8).
This community effort also addresses gaps for the evolution of future observing systems for a robust and continued assessment of the Earth heat inventory and its different components. Immediate priorities include the maintenance and extension of the global climate observing system to assure a continuous monitoring of the Earth heat inventory and to reduce the uncertainties. For the global ocean observing system, the core Argo sampling needs to be sustained and complemented by remote sensing data. Extensions such as into the deep ocean layer need to be further fostered (Desbruyères et al., 2017; Johnson et al., 2015), and technical developments for the measurements under ice and in shallower areas need to be sustained and extended. Moreover, continued efforts are needed to further advance bias correction methodologies, uncertainty evaluations and data processing of the historical dataset.
In order to allow for improvements on the present estimates of changes in the continental heat and to ensure that the database is continued into the future, an international, coordinated effort is needed to increase the number of subsurface temperature data from BTPs at additional locations around the world, in particular in the Southern Hemisphere. Additionally, repeated monitoring (after a few decades) of existing boreholes should help reduce uncertainties at individual sites. Such data should be shared through an open platform.
For the atmosphere, the continuation of operational satellite- and ground-based observations is important, but the foremost need is sustaining and enhancing a coherent long-term monitoring system for the provision of climate data records of essential climate variables. GNSS radio occultation observations and reference radiosonde stations within the Global Climate Observing System (GCOS) Reference Upper Air Network (GRUAN) are regarded as climate benchmark observations. Operational radio occultation missions for continuous global climate observations need to be maintained and expanded, ensuring global coverage over all local times, as the central node of a global climate observing system.
For the cryosphere, sustained remote sensing for all of the cryosphere components is key to quantifying future changes over these vast and inaccessible regions but must be complemented by in situ observations for calibration and validation. For sea ice, the albedo, the area and ice thickness are all essential, with ice thickness being particularly challenging to quantify with remote sensing alone. For ice sheets and glaciers, reliable gravimetric measurements, ice thickness and extent, snow/firn thickness and density are essential to quantify changes in mass balance of grounded and floating ice. We highlight Antarctic sea ice change and warming of firn as terms that are poorly constrained or have not significantly contributed to this assessment but may become important over the coming decades. Similarly, there exists the possibility for rapid change associated with positive ice dynamical feedbacks at the marine margins of the Greenland and Antarctic ice sheets. Sustained monitoring of each of these components will, therefore, serve the dual purpose of furthering the understanding of the dynamics and quantifying the contribution to Earth's energy budget. In addition to data collection, open access to the data and data synthesis products as well as coordinated international efforts are key to the continued monitoring of the ice loss from the cryosphere and related energy uptake.
Sustained and improved observations to quantify Earth's changing energy inventory are also critical to the development of improved physical models of the climate system, including both data assimilation efforts that help us to understand past changes and predictions (Storto et al., 2019) and climate models used to provide projections of future climate change (Eyring et al., 2019). For example, atmospheric reanalyses have shown to be a valuable tool for investigating past changes in the EEI (Allan et al., 2014) and ocean reanalyses have proven useful in estimating rates of ocean heating on annual and subannual timescales by reducing observational noise (Trenberth et al., 2016). Furthermore, both reanalyses and climate models can provide information to assess current observing capabilities (Fujii et al., 2019) and improve uncertainty estimates in the different components of Earth's energy inventory (Allison et al., 2019). Future priorities for expanding the observing system to improve future estimates of EEI should be cognizant of the expected evolution of the climate change signal, drawing on evidence from observations, models and theory (Meyssignac et al., 2019; Palmer et al., 2019).
A continuous effort to regularly update the Earth heat inventory is important to quantify how much and where heat accumulated from climate change is stored in the climate system. The Earth heat inventory crosses multidisciplinary boundaries and calls for the inclusion of new science knowledge from the different disciplines involved, including the evolution of climate observing systems and associated data products, uncertainty evaluations, and processing tools. The results provide indications that a redistribution and conversion of energy in the form of heat is taking place in the different components of the Earth system, particularly within the ocean, and that EEI has increased over the past decade. The outcomes have further demonstrated how we are able to evolve our estimates for the Earth heat inventory while bringing together different expertise and major climate science advancements through a concerted international effort. All of these component estimates are at the leading edge of climate science. Their union has provided a new and unique insight on the inventory of heat in the Earth system, its evolution over time and a revision of the absolute values. The data product of this effort is made available and can be thus used for model validation purposes.
This study has demonstrated the unique value of such a concerted international effort, and we thus call for a regular evaluation of the Earth heat inventory. This first attempt presented here has been focused on the global area average only, and evolving into regional heat storage and redistribution, the inclusion of various timescales (e.g., seasonal, year to year) and other climate study tools (e.g., indirect methods, ocean reanalyses) would be an important asset of this much needed regular international framework for the Earth heat inventory. This would also respond directly to the request of GCOS to establish the observational requirements needed to monitor the Earth's cycles and the global energy budget. The outcome of this study will therefore directly feed into GCOS' assessment of the status of the global climate observing system due in 2021, which is the basis for the next implementation plan. These identified observation requirements will guide the development of the next generation of in situ and satellite global climate observations by all national meteorological services and space agencies and other oceanic and terrestrial networks.
Overall coordination of this initiative has been driven by KvS, LC, MDP, CT and VA.
Author contributions to the ocean section include KvS, LC, TB, DD, CD, JG, MI, GCJ, REK, BAK, NK, JL, MM, DPM, SP, DR and SEW.
Author contributions to the atmosphere section include GK, MG, AKS, MM and LH.
Author contributions for the land section include AGG, FJCV, HB, SIS and PG.
Author contributions for the cryosphere section include FS, SA, DAS, MLT, BM, AS and AS.
All authors have contributed to the Earth energy inventory section, with specific contributions from KvS, AGG, FJCV, JH and MM.
All authors have contributed to the conclusion, with specific contributions from KvS, JH, CT, VA, LC, MDP, GK, AKS, AGG, FJCV, HB and FS.
This research benefited from long-term attention by GCOS and builds on initial work carried out under the WCRP core projects CLIVAR, GEWEX, CliC and SPARC.
We would like to thank the anonymous reviewers for their comments, which helped to improve the manuscript.
We also would like to thank Marianne Nail (https://girlsmakesense.com/, last access: 7 August 2020) for her support to the graphical development of Figs. 7 and 8.
We acknowledge the WEGC EOPAC team for providing the OPSv5.6 RO data (available online at https://doi.org/10.25364/WEGC/OPS5.6:2019.1, EOPAC Team, 2019) as well as quality-processed Vaisala RS data, UCAR/CDAAC (Boulder, CO, USA) for access to RO phase and orbit data, RSS (Santa Rosa, CA, USA) for providing MSU V4.0 data, ECMWF (Reading, UK) for access to operational analysis and forecast data, ERA5 reanalysis data, and RS data from the ERA-Interim archive, JMA (Tokyo, Japan) for provision of the JRA55 and JRA55C reanalysis data, and NASA GMAO (Greenbelt, MD, USA) for access of the MERRA-2 reanalysis data.
Matthew D. Palmer and Rachel E. Killick were supported by the Met Office Hadley Centre Climate Programme funded by the BEIS and Defra. PML authors were supported by contribution number 5053. Catia M. Domingues was supported by an ARC Future Fellowship (FT130101532). Lijing Cheng is supported by the Key Deployment Project of Centre for Ocean Mega-Research of Science, CAS (COMS2019Q01). Maximilian Gorfer was supported by WEGC atmospheric remote sensing and climate system research group young scientist funds. Michael Mayer was supported by Austrian Science Fund project P33177. This work was supported by grants from the National Sciences and Engineering Research Council of Canada Discovery Grant (NSERC DG 140576948) and the Canada Research Chairs Program (CRC 230687) to Hugo Beltrami. Almudena García-García and Francisco José Cuesta-Valero are funded by Beltrami's CRC program, the School of Graduate Studies at Memorial University of Newfoundland and the Research Office at St. Francis Xavier University. Fiamma Straneo was supported by NSF OCE 1657601. Susheel Adusumilli was supported by NASA grant 80NSSC18K1424.
This paper was edited by David Carlson and reviewed by two anonymous referees.
Abraham, J. P., Baringer, M., Bindoff, N. L., Boyer, T., Cheng, L. J., Church, J. A., Conroy, J. L., Domingues, C. M., Fasullo, J. T., Gilson, J., Goni, G., Good, S. A., Gorman, J. M., Gouretski, V., Ishii, M., Johnson, G. C., Kizu, S., Lyman, J. M., Macdonald, A. M., and Willis, J. K.: A review of global ocean temperature observations: Implications for ocean heat content estimates and climate change, Rev. Geophys., 51, 450–483, https://doi.org/10.1002/rog.20022, 2013.
Adusumilli, S., Fricker, H. A., Medley, B., Padman, L., and Siegfried, M. R.: Multi-year variability in ocean-driven melting of Antarctica's ice shelves, Nat. Geosci., https://doi.org/10.1038/s41561-020-0616-z, online first, 2020.
Allan, R. P., Liu, C., Loeb, N. G., Palmer, M. D., Roberts, M., Smith, D., and Vidale, P.-L.: Changes in global net radiative imbalance 1985-2012 (I10, trans.), Geophys. Res. Lett., 41, 5588–5597, https://doi.org/10.1002/2014GL060962, 2014.
Allison, L. C., Roberts, C. D., Palmer, M. D., Hermanson, L., Killick, R. E., Rayner, N. A., Smith, D. M., and Andrews, M. B.: Towards quantifying uncertainty in ocean heat content changes using synthetic profiles, Environ. Res. Lett., 14, 084037, https://doi.org/10.1088/1748-9326/ab2b0b, 2019.
Angerer, B., Ladstädter, F., Scherllin-Pirscher, B., Schwärz, M., Steiner, A. K., Foelsche, U., and Kirchengast, G.: Quality aspects of the Wegener Center multi-satellite GPS radio occultation record OPSv5.6, Atmos. Meas. Tech., 10, 4845–4863, https://doi.org/10.5194/amt-10-4845-2017, 2017.
Baggenstos, D., Häberli, M., Schmitt, J., Shackleton, S. A., Birner, B., Severinghaus, J. P., Kellerhals, T., and Fischer, H.: Earth's radiative imbalance from the Last Glacial Maximum to the present, P. Natl. Acad. Sci. USA, 116, 14881, https://doi.org/10.1073/pnas.1905447116, 2019.
Bailey, V. L., Pries, C. H., and Lajtha, K.: What do we know about soil carbon destabilization?, Environ. Res. Lett., 14, 083004, https://doi.org/10.1088/1748-9326/ab2c11, 2019.
Balmaseda, M. A., Trenberth, K. E., and Källén, E.: Distinctive climate signals in reanalysis of global ocean heat content, Geophys. Res. Lett., 40, 1754–1759, https://doi.org/10.1002/grl.50382, 2013.
Bamber, J. L., Westaway, R. M., Marzeion, B., and Wouters, B.: The land ice contribution to sea level during the satellite era, Environ. Res. Lett., 13, 063008, https://doi.org/10.1088/1748-9326/aac2f0, 2018.
Barkaoui, A. E., Correia, A., Zarhloule, Y., Rimi, A., Carneiro, J., Boughriba, M., and Verdoya, M.: Reconstruction of remote climate change from borehole temperature measurement in the eastern part of Morocco, Climatic Change, 118, 431–441, https://doi.org/10.1007/s10584-012-0638-7, 2013.
Beck, A. E.: Climatically perturbed temperature gradients and their effect on regional and continental heat-flow means, Tectonophysics, 41, 17–39, https://doi.org/10.1016/0040-1951(77)90178-0, 1977.
Beltrami, H.: Surface heat flux histories from inversion of geothermal data: Energy balance at the Earth's surface, J. Geophys. Res.-Sol. Ea., 106, 21979–21993, https://doi.org/10.1029/2000JB000065, 2001.
Beltrami, H.: Earth's Long-Term Memory, Science, 297, 206–207, https://doi.org/10.1126/science.1074027, 2002a.
Beltrami, H.: Climate from borehole data: Energy fluxes and temperatures since 1500, Geophys. Res. Lett., 29, 26-1–26-4, https://doi.org/10.1029/2002GL015702, 2002b.
Beltrami, H. and Bourlon, E.: Ground warming patterns in the Northern Hemisphere during the last five centuries, Earth Planet. Sc. Lett., 227, 169–177, https://doi.org/10.1016/j.epsl.2004.09.014, 2004.
Beltrami, H., Bourlon, E., Kellman, L., and González-Rouco, J. F.: Spatial patterns of ground heat gain in the Northern Hemisphere, Geophys. Res. Lett., 33, L06717, https://doi.org/10.1029/2006GL025676, 2006.
Beltrami, H., Matharoo, G. S., and Smerdon, J. E.: Impact of borehole depths on reconstructed estimates of ground surface temperature histories and energy storage, J. Geophys. Res.-Earth, 120, 763–778, https://doi.org/10.1002/2014JF003382, 2015.
Beltrami, H., Matharoo, G. S., Smerdon, J. E., Illanes, L., and Tarasov, L.: Impacts of the Last Glacial Cycle on ground surface temperature reconstructions over the last millennium, Geophys. Res. Lett., 44, 355–364, https://doi.org/10.1002/2016GL071317, 2017.
Beltrami, H., Smerdon, J. E., Pollack, H. N., and Huang, S.: Continental heat gain in the global climate system, Geophys. Res. Lett., 29, 8-1–8-3, https://doi.org/10.1029/2001GL014310, 2002.
Bense, V. F. and Kooi, H.: Temporal and spatial variations of shallow subsurface temperature as a record of lateral variations in groundwater flow, J. Geophys. Res.-Sol. Ea., 109, B04103, https://doi.org/10.1029/2003JB002782, 2004.
Berrisford, P., Kållberg, P., Kobayashi, S., Dee, D., Uppala, S., Simmons, A. J., Poli, P., and Sato, H.: Atmospheric conservation properties in ERA-Interim, Q. J. Roy. Meteor. Soc., 137, 1381–1399, https://doi.org/10.1002/qj.864, 2011.
Bindoff, N. L., Cheung, W. W. L., and Kairo, J. G.: Changing Oean, Marine Ecosystems, and Dependent Communities, in: Special Report: The Ocean and Cryosphere in a Changing Climate Summary for Policymakers, edited by: Pörtner, H. O., Roberts, D. C., Masson-Delmotte, V., Zhai, P., Tignor, M., Poloczanska, E., Mintenbeck, K., Alegría, A., Nicolai, M., Okem, A., Petzold, J., Rama, B., and Weyer, N. M., 447–587, available at: https://www.ipcc.ch/report/srocc/ (last access: 7 August 2020), in press, 2020.
Blunden, J. and Arndt, D. S.: State of the Climate in 2019, B. Am. Meteorol. Soc., 100, Si–S305, https://doi.org/10.1175/2019BAMSStateoftheClimate.1, 2019.
Blunden, J. and Arndt, D. S. (Eds.): State of the Climate in 2019, B. Am. Meteorol. Soc., 101, Si–S429, https://doi.org/10.1175/2020BAMSStateoftheClimate.1, 2020.
Bopp, L., Resplandy, L., Orr, J. C., Doney, S. C., Dunne, J. P., Gehlen, M., Halloran, P., Heinze, C., Ilyina, T., Séférian, R., Tjiputra, J., and Vichi, M.: Multiple stressors of ocean ecosystems in the 21st century: projections with CMIP5 models, Biogeosciences, 10, 6225–6245, https://doi.org/10.5194/bg-10-6225-2013, 2013.
Boyer, T., Domingues, C. M., Good, S. A., Johnson, G. C., Lyman, J. M., Ishii, M., Gouretski, V., Willis, J. K., Antonov, J., Wijffels, S., Church, J. A., Cowley, R., and Bindoff, N. L.: Sensitivity of Global Upper-Ocean Heat Content Estimates to Mapping Methods, XBT Bias Corrections, and Baseline Climatologies, J. Climate, 29, 4817–4842, https://doi.org/10.1175/JCLI-D-15-0801.1, 2016.
Breitburg, D., Levin, L. A., Oschlies, A., Grégoire, M., Chavez, F. P., Conley, D. J., Garçon, V., Gilbert, D., Gutiérrez, D., Isensee, K., Jacinto, G. S., Limburg, K. E., Montes, I., Naqvi, S. W. A., Pitcher, G. C., Rabalais, N. N., Roman, M. R., Rose, K. A., Seibel, B. A., and Zhang, J.: Declining oxygen in the global ocean and coastal waters, Science, 359, eaam7240, https://doi.org/10.1126/science.aam7240, 2018.
Cabanes, C., Grouazel, A., von Schuckmann, K., Hamon, M., Turpin, V., Coatanoan, C., Paris, F., Guinehut, S., Boone, C., Ferry, N., de Boyer Montégut, C., Carval, T., Reverdin, G., Pouliquen, S., and Le Traon, P.-Y.: The CORA dataset: validation and diagnostics of in-situ ocean temperature and salinity measurements, Ocean Sci., 9, 1–18, https://doi.org/10.5194/os-9-1-2013, 2013.
Cazenave, A., Dieng, H.-B., Meyssignac, B., von Schuckmann, K., Decharme, B., and Berthier, E.: The rate of sea-level rise, Nat. Clim. Change, 4, 358–361, https://doi.org/10.1038/nclimate2159, 2014.
Cermak, V.: Underground temperature and inferred climatic temperature of the past millenium, Palaeogeogr. Palaeocl., 10, 1–19, https://doi.org/10.1016/0031-0182(71)90043-5, 1971.
Cheng, L., Trenberth, K. E., Palmer, M. D., Zhu, J., and Abraham, J. P.: Observed and simulated full-depth ocean heat-content changes for 1970–2005, Ocean Sci., 12, 925–935, https://doi.org/10.5194/os-12-925-2016, 2016.
Cheng, L., Trenberth, K., Fasullo, J., Boyer, T., Abraham, J., von Schuckmann, K., and Zhou, J.: Taking the Pulse of the Planet, Eos Trans. AGU, 98, https://doi.org/10.1029/2017EO081839, 2017a.
Cheng, L., Trenberth, K. E., Fasullo, J., Boyer, T., Abraham, J., and Zhu, J.: Improved estimates of ocean heat content from 1960 to 2015, Science Advances, 3, e1601545. https://doi.org/10.1126/sciadv.1601545, 2017b.
Cheng, L., Abraham, J., Hausfather, Z., and Trenberth, K. E.: How fast are the oceans warming? Science, 363, 128–129, https://doi.org/10.1126/science.aav7619, 2019a.
Cheng, L. Trenberth, K. E., Fasullo, J. T., Mayer, M., Balmaseda, M., and Zhu, J.: Evolution of ocean heat content related to ENSO, J. Climate, 32, 3529–3556, https://doi.org/10.1175/JCLI-D-18-0607.1, 2019b.
Chiodo, G. and Haimberger, L.: Interannual changes in mass consistent energy budgets from ERA-Interim and satellite data, J. Geophys. Res.-Atmos., 115, D02112, https://doi.org/10.1029/2009JD012049, 2010.
Chouinard, C. and Mareschal, J.-C.: Selection of borehole temperature depth profiles for regional climate reconstructions, Clim. Past, 3, 297–313, https://doi.org/10.5194/cp-3-297-2007, 2007.
Chouinard, C. and Mareschal, J.-C.: Ground surface temperature history in southern Canada: Temperatures at the base of the Laurentide ice sheet and during the Holocene, Earth Planet. Sc. Lett., 277, 280–289, https://doi.org/10.1016/j.epsl.2008.10.026, 2009.
Ciais, P., Sabine, C., Bala, G., Bopp, L., Brovkin, V., Canadell, J., Chhabra, A., DeFries, R., Galloway, J., Heimann, M., Jones, C., Quéré, C. Le, Myneni, R. B., Piao, S., and Thornton, P.: The physical science basis. Contribution of working group I to the fifth assessment report of the intergovernmental panel on climate change, Change, IPCC Climate, 465–570, https://doi.org/10.1017/CBO9781107415324.015, 2013.
Clark, P. U., Shakun, J. D., Marcott, S. A., Mix, A. C., Eby, M., Kulp, S., Levermann, A., Milne, G. A., Pfister, P. L., Santer, B. D., Schrag, D. P., Solomon, S., Stocker, T. F., Strauss, B. H., Weaver, A. J., Winkelmann, R., Archer, D., Bard, E., Goldner, A., and Plattner, G.-K.: Consequences of twenty-first-century policy for multi-millennial climate and sea-level change, Nat. Clim. Change, 6, 360–369, https://doi.org/10.1038/nclimate2923, 2016.
Cohen, J., Screen, J. A., Furtado, J. C., Barlow, M., Whittleston, D., Coumou, D., Francis, J., Dethloff, K., Entekhabi, D., Overland, J., and Jones, J.: Recent Arctic amplification and extreme mid-latitude weather, Nat. Geosci., 7, 627–637, https://doi.org/10.1038/ngeo2234, 2014.
Cook, A. J. and Vaughan, D. G.: Overview of areal changes of the ice shelves on the Antarctic Peninsula over the past 50 years, The Cryosphere, 4, 77–98, https://doi.org/10.5194/tc-4-77-2010, 2010.
Coumou, D., Di Capua, G., Vavrus, S., Wang, L., and Wang, S.: The influence of Arctic amplification on mid-latitude summer circulation, Nat. Commun., 9, 2959, https://doi.org/10.1038/s41467-018-05256-8, 2018.
Cuesta-Valero, F. J., García-García, A., Beltrami, H., and Smerdon, J. E.: First assessment of continental energy storage in CMIP5 simulations, Geophy. Res. Lett., 43, 5326–5335, https://doi.org/10.1002/2016GL068496, 2016.
Cuesta-Valero, F. J., García-García, A., Beltrami, H., Zorita, E., and Jaume-Santero, F.: Long-term Surface Temperature (LoST) database as a complement for GCM preindustrial simulations, Clim. Past, 15, 1099–1111, https://doi.org/10.5194/cp-15-1099-2019, 2019.
Cuesta-Valero, F. J., García-García, A., Beltrami, H., González-Rouco, J. F., and García-Bustamante, E.: Long-Term Global Ground Heat Flux and Continental Heat Storage from Geothermal Data, Clim. Past Discuss., https://doi.org/10.5194/cp-2020-65, in review, 2020.
Davis, M. G., Harris, R. N., and Chapman, D. S.: Repeat temperature measurements in boreholes from northwestern Utah link ground and air temperature changes at the decadal time scale, J. Geophys. Res.-Sol. Ea., 115, B05203, https://doi.org/10.1029/2009JB006875, 2010.
Demezhko, D. Y. and Gornostaeva, A. A.: Late Pleistocene–Holocene ground surface heat flux changes reconstructed from borehole temperature data (the Urals, Russia), Clim. Past, 11, 647–652, https://doi.org/10.5194/cp-11-647-2015, 2015.
Desbruyères, D., McDonagh, E. L., King, B. A., and Thierry, V.: Global and Full-Depth Ocean Temperature Trends during the Early Twenty-First Century from Argo and Repeat Hydrography, J. Climate, 30, 1985–1997, https://doi.org/10.1175/JCLI-D-16-0396.1, 2017.
Desbruyères, D. G., Purkey, S. G., McDonagh, E. L., Johnson, G. C., and King, B. A.: Deep and abyssal ocean warming from 35 years of repeat hydrography, Geophys. Res. Lett., 43, 310–356, https://doi.org/10.1002/2016GL070413, 2016.
Dieng, H. B., Cazenave, A., Meyssignac, B., and Ablain, M.: New estimate of the current rate of sea level rise from a sea level budget approach, Geophys. Res. Lett., 44, 3744–3751, https://doi.org/10.1002/2017GL073308, 2017.
Domingues, C. M., Church, J. A., White, N. J., Gleckler, P. J., Wijffels, S. E., Barker, P. M., and Dunn, J. R.: Improved estimates of upper-ocean warming and multi-decadal sea-level rise, Nature, 453, 1090–1093, https://doi.org/10.1038/nature07080, 2008.
EOPAC Team: GNSS Radio Occultation Record (OPS 5.6 2001–2018), University of Graz, Austria, https://doi.org/10.25364/WEGC/OPS5.6:2019.1, 2019.
Eyring, V., Cox, P. M., Flato, G. M., Gleckler, P. J., Abramowitz, G., Caldwell, P., Collins, W. D., Gier, B. K., Hall, A. D., Hoffman, F. M., Hurtt, G. C., Jahn, A., Jones, C. D., Klein, S. A., Krasting, J. P., Kwiatkowski, L., Lorenz, R., Maloney, E., Meehl, G. A., and Williamson, M. S.: Taking climate model evaluation to the next level, Nat. Clim. Change, 9, 102–110, https://doi.org/10.1038/s41558-018-0355-y, 2019.
Fischer, E. M. and Knutti, R.: Observed heavy precipitation increase confirms theory and early models, Nat. Clim. Change, 6, 986–991, https://doi.org/10.1038/nclimate3110, 2016.
Friedlingstein, P., Jones, M. W., O'Sullivan, M., Andrew, R. M., Hauck, J., Peters, G. P., Peters, W., Pongratz, J., Sitch, S., Le Quéré, C., Bakker, D. C. E., Canadell, J. G., Ciais, P., Jackson, R. B., Anthoni, P., Barbero, L., Bastos, A., Bastrikov, V., Becker, M., Bopp, L., Buitenhuis, E., Chandra, N., Chevallier, F., Chini, L. P., Currie, K. I., Feely, R. A., Gehlen, M., Gilfillan, D., Gkritzalis, T., Goll, D. S., Gruber, N., Gutekunst, S., Harris, I., Haverd, V., Houghton, R. A., Hurtt, G., Ilyina, T., Jain, A. K., Joetzjer, E., Kaplan, J. O., Kato, E., Klein Goldewijk, K., Korsbakken, J. I., Landschützer, P., Lauvset, S. K., Lefèvre, N., Lenton, A., Lienert, S., Lombardozzi, D., Marland, G., McGuire, P. C., Melton, J. R., Metzl, N., Munro, D. R., Nabel, J. E. M. S., Nakaoka, S.-I., Neill, C., Omar, A. M., Ono, T., Peregon, A., Pierrot, D., Poulter, B., Rehder, G., Resplandy, L., Robertson, E., Rödenbeck, C., Séférian, R., Schwinger, J., Smith, N., Tans, P. P., Tian, H., Tilbrook, B., Tubiello, F. N., van der Werf, G. R., Wiltshire, A. J., and Zaehle, S.: Global Carbon Budget 2019, Earth Syst. Sci. Data, 11, 1783–1838, https://doi.org/10.5194/essd-11-1783-2019, 2019.
Frölicher, T. L., Fischer, E. M., and Gruber, N.: Marine heatwaves under global warming, Nature, 560, 360–364, https://doi.org/10.1038/s41586-018-0383-9, 2018.
Fu, Q., Solomon, S., Pahlavan, H. A., and Lin, P.: Observed changes in Brewer–Dobson circulation for 1980–2018, Environ. Res. Lett., 14, 114026, https://doi.org/10.1088/1748-9326/ab4de7, 2019.
Fujii, Y., Rémy, E., Zuo, H., Oke, P., Halliwell, G., Gasparin, F., Benkiran, M., Loose, N., Cummings, J., Xie, J., Xue, Y., Masuda, S., Smith, G. C., Balmaseda, M., Germineaud, C., Lea, D. J., Larnicol, G., Bertino, L., Bonaduce, A., and Usui, N.: Observing System Evaluation Based on Ocean Data Assimilation and Prediction Systems: On-Going Challenges and a Future Vision for Designing and Supporting Ocean Observational Networks, Front. Mar. Sci., 6, https://doi.org/10.3389/fmars.2019.00417, 2019.
Gaillard, F., Reynaud, T., Thierry, V., Kolodziejczyk, N., and von Schuckmann, K.: In Situ–Based Reanalysis of the Global Ocean Temperature and Salinity with ISAS: Variability of the Heat Content and Steric Height, J. Climate, 29, 1305–1323, https://doi.org/10.1175/JCLI-D-15-0028.1, 2016.
García Molinos, J., Halpern, B. S., Schoeman, D. S., Brown, C. J., Kiessling, W., Moore, P. J., Pandolfi, J. M., Poloczanska, E. S., Richardson, A. J., and Burrows, M. T.: Climate velocity and the future global redistribution of marine biodiversity, Nat. Clim. Change, 6(1), 83–88, https://doi.org/10.1038/nclimate2769, 2016.
García-García, A., Cuesta-Valero, F. J., Beltrami, H., and Smerdon, J. E.: Simulation of air and ground temperatures in PMIP3/CMIP5 last millennium simulations: implications for climate reconstructions from borehole temperature profiles, Environ. Res. Lett., 11, 044022, https://doi.org/10.1088/1748-9326/11/4/044022, 2016.
García-García, A., Cuesta-Valero, F. J., Beltrami, H., and Smerdon, J. E.: Characterization of Air and Ground Temperature Relationships within the CMIP5 Historical and Future Climate Simulations. J. Geophys. Res.-Atmos., 124, 3903–3929, https://doi.org/10.1029/2018JD030117, 2019.
Gardner, A. S., Moholdt, G., Cogley, J. G., Wouters, B., Arendt, A. A., Wahr, J., Berthier, E., Hock, R., Pfeffer, W. T., Kaser, G., Ligtenberg, S. R. M., Bolch, T., Sharp, M. J., Hagen, J. O., van den Broeke, M. R., and Paul, F.: A Reconciled Estimate of Glacier Contributions to Sea Level Rise: 2003 to 2009, Science, 340, 852–857, https://doi.org/10.1126/science.1234532, 2013.
Gattuso, J.-P., Magnan, A., Billé, R., Cheung, W. W. L., Howes, E. L., Joos, F., Allemand, D., Bopp, L., Cooley, S. R., Eakin, C. M., Hoegh-Guldberg, O., Kelly, R. P., Pörtner, H.-O., Rogers, A. D., Baxter, J. M., Laffoley, D., Osborn, D., Rankovic, A., Rochette, J., and Turley, C.: Contrasting futures for ocean and society from different anthropogenic CO2 emissions scenarios, Science, 349, aac4722, https://doi.org/10.1126/science.aac4722, 2015.
GCOS: The Global Observing System for Climate: Implementation needs, World Meteorological Organization, Geneva, Switzerland, https://doi.org/10.13140/RG.2.2.23178.26566, 2016.
Gelaro, R., McCarty, W., Suárez, M. J., Todling, R., Molod, A., Takacs, L., Randles, C. A., Darmenov, A., Bosilovich, M. G., Reichle, R., Wargan, K., Coy, L., Cullather, R., Draper, C., Akella, S., Buchard, V., Conaty, A., da Silva, A. M., Gu, W., and Zhao, B.: The Modern-Era Retrospective Analysis for Research and Applications, Version 2 (MERRA-2), J. Climate, 30, 5419–5454. https://doi.org/10.1175/JCLI-D-16-0758.1, 2017.
Gentine, P., Garcia-Garcia, A., Meier, R., Cuesta-Valero, F., Hugo., B., Davin, E. L., and Seneviratne, S. I.: Large recent continental heat storage, Nature, under revision, 2020.
Gleckler, P., Durack, P., Ronald, S., Johnson, G., and Forest, C.: Industrial-era global ocean heat uptake doubles in recent decades, Nat. Clim. Change, 6, 394–398, https://doi.org/10.1038/nclimate2915, 2016.
Goni, G. J., Sprintall, J., Bringas, F., Cheng, L., Cirano, M., Dong, S., Domingues, R., Goes, M., Lopez, H., Morrow, R., Rivero, U., Rossby, T., Todd, R. E., Trinanes, J., Zilberman, N., Baringer, M., Boyer, T., Cowley, R., Domingues, C. M., and Volkov, D.: More Than 50 Years of Successful Continuous Temperature Section Measurements by the Global Expendable Bathythermograph Network, Its Integrability, Societal Benefits, and Future, Front. Mar. Sci., 6, https://doi.org/10.3389/fmars.2019.00452, 2019.
González-Rouco, J. F., Beltrami, H., Zorita, E., and von Storch, H.: Simulation and inversion of borehole temperature profiles in surrogate climates: Spatial distribution and surface coupling, Geophys. Res. Lett., 33, L01703, https://doi.org/10.1029/2005GL024693, 2006.
González-Rouco, J. F., Beltrami, H., Zorita, E., and Stevens, M. B.: Borehole climatology: a discussion based on contributions from climate modeling, Clim. Past, 5, 97–127, https://doi.org/10.5194/cp-5-97-2009, 2009.
Good, S. A., Martin, M. J., and Rayner, N. A.: EN4: Quality controlled ocean temperature and salinity profiles and monthly objective analyses with uncertainty estimates, J. Geophys. Res.-Oceans, 118, 6704–6716, https://doi.org/10.1002/2013JC009067, 2013.
Gouretski, V. and Cheng, L.: Correction for Systematic Errors in the Global Dataset of Temperature Profiles from Mechanical Bathythermographs, J. Atmos. Ocean. Tech., 37, 841–855, https://doi.org/10.1175/JTECH-D-19-0205.1, 2020.
Gregory, J. M. and Andrews, T.: Variation in climate sensitivity and feedback parameters during the historical period, Geophys. Res. Lett., 43, 3911–3920, https://doi.org/10.1002/2016GL068406, 2016.
Gregory, J. M., Andrews, T., Ceppi, P., Mauritsen, T., and Webb, M. J.: How accurately can the climate sensitivity to CO2 be estimated from historical climate change?, Clim. Dynam., 54, 129–157, https://doi.org/10.1007/s00382-019-04991-y, 2020.
Guinehut, S., Dhomps, A.-L., Larnicol, G., and Le Traon, P.-Y.: High resolution 3-D temperature and salinity fields derived from in situ and satellite observations, Ocean Sci., 8, 845–857, https://doi.org/10.5194/os-8-845-2012, 2012.
Hansen, J.: Efficacy of climate forcings, J. Geophys. Res., 110, D18104, https://doi.org/10.1029/2005JD005776, 2005.
Hansen, J., Sato, M., Ruedy, R., Lacis, A., and Oinas, V.: Global warming in the twenty-first century: An alternative scenario, P. Natl. Acad. Sci. USA, 97, 9875–9880, https://doi.org/10.1073/pnas.170278997, 2000.
Hansen, J., Nazarenko, L., Ruedy, R., Sato, M., Willis, J., Del Genio, A., Koch, D., Lacis, A., Lo, K., Menon, S., Novakov, T., Perlwitz, J., Russell, G., Schmidt, G. A., and Tausnev, N.: Earth's Energy Imbalance: Confirmation and Implications, Science, 308, 1431–1435, https://doi.org/10.1126/science.1110252, 2005.
Hansen, J., Sato, M., Kharecha, P., and von Schuckmann, K.: Earth's energy imbalance and implications, Atmos. Chem. Phys., 11, 13421–13449, https://doi.org/10.5194/acp-11-13421-2011, 2011.
Hansen, J., Sato, M., Kharecha, P., von Schuckmann, K., Beerling, D. J., Cao, J., Marcott, S., Masson-Delmotte, V., Prather, M. J., Rohling, E. J., Shakun, J., Smith, P., Lacis, A., Russell, G., and Ruedy, R.: Young people's burden: requirement of negative CO2 emissions, Earth Syst. Dynam., 8, 577–616, https://doi.org/10.5194/esd-8-577-2017, 2017.
Harris, R. N., and Chapman, D. S.: Mid-latitude (30∘–60∘ N) climatic warming inferred by combining borehole temperatures with surface air temperatures, Geophys. Res. Lett., 28, 747–750, https://doi.org/10.1029/2000GL012348, 2001.
Hartmann, A. and Rath, V.: Uncertainties and shortcomings of ground surface temperature histories derived from inversion of temperature logs, J. Geophys. Eng., 2, 299–311, https://doi.org/10.1088/1742-2132/2/4/S02, 2005.
Hermoso de Mendoza, I., Beltrami, H., MacDougall, A. H., and Mareschal, J.-C.: Lower boundary conditions in land surface models – effects on the permafrost and the carbon pools: a case study with CLM4.5, Geosci. Model Dev., 13, 1663–1683, https://doi.org/10.5194/gmd-13-1663-2020, 2020.
Hersbach, H., Rosnay, P. de, Bell, B., Schepers, D., Simmons, A., Soci, C., Abdalla, S., Alonso-Balmaseda, M., Balsamo, G., Bechtold, P., Berrisford, P., Bidlot, J.-R., de Boisséson, E., Bonavita, M., Browne, P., Buizza, R., Dahlgren, P., Dee, D., Dragani, R., and Zuo, H.: Operational global reanalysis: progress, future directions and synergies with NWP, ERA Report Series (ERA Report), available at: https://www.ecmwf.int/node/18765 (last access: 7 August 2018), 2018.
Hersbach, H., Bell, B., Berrisford, P., Hirahara, S., Horányi, A., Muñoz-Sabater, J., Nicolas, J., Peubey, C., Radu, R., Schepers, D., Simmons, A., Soci, C., Abdalla, S., Abellan, X., Balsamo, G., Bechtold, P., Biavati, G., Bidlot, J., Bonavita, M., Chiara, G. D., Dahlgren, P., Dee, D., Diamantakis, M., Dragani, R., Flemming, J., Forbes, R., Fuentes, M., Geer, A., Haimberger, L., Healy, S., Hogan, R. J., Hólm, E., Janisková, M., Keeley, S., Laloyaux, P., Lopez, P., Lupu, C., Radnoti, G., Rosnay, P. de, Rozum, I., Vamborg, F., Villaume, S., and Thépaut, J.-N.: The ERA5 global reanalysis, Q. J. Roy. Meteor. Soc., 146, 1999–2049, https://doi.org/10.1002/qj.3803, 2020.
Hicks Pries, C. E., Castanha, C., Porras, R., and Torn, M. S.: The whole-soil carbon flux in response to warming, Science, 355, 1420–1423, https://doi.org/10.1126/science.aal1319, 2017.
Hoegh-Guldberg, O., Jacob, D., Taylor, M., Bindi, M., Brown, S., Camilloni, I., Diedhiou, A., Djalante, R., Ebi, K. L., Engelbrecht, F., Guiot, J., Hijioka, Y., Mehrotra, S., Payne, A., Seneviratne, S. I., Thomas, A., Warren, R., and Zhou, G.: Impacts of 1.5∘ C Global Warming on Natural and Human Systems, in: Global Warming of 1.5∘C. An IPCC Special Report on the impacts of global warming of 1.5∘C above pre-industrial levels and related global greenhouse gas emission pathways, in the context of strengthening the global response to the threat of climate change, sustainable development, and efforts to eradicate poverty, edited by: Masson-Delmotte, V., Zhai, P., Pörtner, H.-O., Roberts, D., Skea, J., Shukla, P. R., Pirani, A., Moufouma-Okia, W., Péan, C., Pidcock, R., Connors, S., Matthews, J. B. R., Chen, Y., Zhou, X., Gomis, M. I., Lonnoy, E., Maycock, T., Tignor, M., and Waterfield, T., in press, 2020.
Hopcroft, P. O., Gallagher, K., and Pain, C. C.: Inference of past climate from borehole temperature data using Bayesian Reversible Jump Markov chain Monte Carlo, Geophys. J. Int., 171, 1430–1439, https://doi.org/10.1111/j.1365-246X.2007.03596.x, 2007.
Hosoda, S., Ohira, T., and Nakamura, T.: A monthly mean dataset of global oceanic temperature and salinity derived from Argo float observations, JAMSTEC Report of Research and Development, 8, 47–59, https://doi.org/10.5918/jamstecr.8.47, 2008.
Huang, S.: 1851–2004 annual heat budget of the continental landmasses, Geophys. Res. Lett., 33, L04707, https://doi.org/10.1029/2005GL025300, 2006.
Huang, S., Pollack, H. N., and Shen, P.-Y.: Temperature trends over the past five centuries reconstructed from borehole temperatures, Nature, 403, 756–758, https://doi.org/10.1038/35001556, 2000.
IPCC: Climate Change 2013: The Physical Science Basis. Contribution of Working Group I to the Fifth Assessment Report of the Intergovernmental Panel on Climate Change, edited by: Stocker, T. F., Qin, D., Plattner, G.-K., Tignor, M., Allen, S. K., Boschung, J., Nauels, A., Xia, Y., Bex, V., and Midgley, P. M., Cambridge University Press, Cambridge, United Kingdom and New York, NY, USA, 1535 pp., 2013.
IPCC: Global warming of 1.5∘C. An IPCC Special Report on the impacts of global warming of 1.5∘C above pre-industrial levels and related global greenhouse gas emission pathways, in the context of strengthening the global response to the threat of climate change, sustainable development, and efforts to eradicate poverty, edited by: Masson-Delmotte, V., Zhai, P., Pörtner, H. O., Roberts, D., Skea, J., Shukla, P. R., Pirani, A., Moufouma-Okia, W., Péan, C., Pidcock, R., Connors, S., Matthews, J. B. R., Chen, Y., Zhou, X., Gomis, M. I., Lonnoy, E., Maycock, T., Tignor, M., Waterfield, T., 2018.
IPCC: IPCC Special Report on the Ocean and Cryosphere in a Changing Climate, edited by: Portner, H.-O., Roberts, D. C., Masson-Delmotte, V., Zhai, P., Tignor, M., Poloczanska, E., Mintenbeck, K., Alegriìa, A., Nicolai, M., Okem, A., Petzold, J., Rama, B., and Weyer, N. M., in press, 2020.
Ishii, M., Fukuda, Y., Hirahara, S., Yasui, S., Suzuki, T., and Sato, K.: Accuracy of Global Upper Ocean Heat Content Estimation Expected from Present Observational Data Sets, SOLA, 13, 163–167, https://doi.org/10.2151/sola.2017-030, 2017.
Jacobs, S. S., Giulivi, C. F., and Mele, P. A.: Freshening of the Ross Sea During the Late 20th Century, Science, 297, 386–389, https://doi.org/10.1126/science.1069574, 2002.
Jaume-Santero, F., Pickler, C., Beltrami, H., and Mareschal, J.-C.: North American regional climate reconstruction from ground surface temperature histories, Clim. Past, 12, 2181–2194, https://doi.org/10.5194/cp-12-2181-2016, 2016.
Jeong, D. I., Sushama, L., Diro, G. T., Khaliq, M. N., Beltrami, H., and Caya, D.: Projected changes to high temperature events for Canada based on a regional climate model ensemble, Clim. Dynam., 46, 3163–3180, https://doi.org/10.1007/s00382-015-2759-y, 2016.
Johnson, G. C., Lyman, J. M., Boyer, T., Cheng, L., Domingues, C. M., Gilson, J., Ishii, M., Killick, R., Monselesan, D., Purkey, S. G., and Wijffels, S. E.: Ocean heat content [in State of the Climate in 2017], B. Am. Meteorol. Soc., 99, S72–S77, 2018.
Johnson, G. C. and Birnbaum, A. N.: As El Niño builds, Pacific Warm Pool expands, ocean gains more heat, Geophys. Res. Lett., 44, 438–445, https://doi.org/10.1002/2016GL071767, 2017.
Johnson, G. C., Lyman, J. M., and Purkey, S. G.: Informing Deep Argo Array Design Using Argo and Full-Depth Hydrographic Section Data, J. Atmos. Ocean. Tech., 32, 2187–2198, https://doi.org/10.1175/JTECH-D-15-0139.1, 2015.
Johnson, G. C., Lyman, J. M., and Loeb, N. G.: Improving estimates of Earth’s energy imbalance, Nat. Clim. Change, 6, 639–640, https://doi.org/10.1038/nclimate3043, 2016.
Johnson, G. C., Purkey, S. G., Zilberman, N. V., and Roemmich, D.: Deep Argo Quantifies Bottom Water Warming Rates in the Southwest Pacific Basin, Geophys. Res. Lett., 46, 2662–2669, https://doi.org/10.1029/2018GL081685, 2019.
King, B. A., Firing, E., and Joyce, T.: Chapter 3.1 Shipboard observations during WOCE, Int. Geophys., 77, 99–122, https://doi.org/10.1016/S0074-6142(01)80114-5, 2001.
King, M. D., Howat, I. M., Jeong, S., Noh, M. J., Wouters, B., Noël, B., and van den Broeke, M. R.: Seasonal to decadal variability in ice discharge from the Greenland Ice Sheet, The Cryosphere, 12, 3813–3825, https://doi.org/10.5194/tc-12-3813-2018, 2018.
King, M. D., Howat, I. M., Candela, S. G., Noh, M. J., Jeong, S., Noël, B. P. Y., van den Broeke, M. R., Wouters, B., and Negrete, A.: Dynamic ice loss from the Greenland Ice Sheet driven by sustained glacier retreat, Commun. Earth Environ., 1, 1, https://doi.org/10.1038/s43247-020-0001-2, 2020.
Kirchengast, G., Ladstädter, F., Steiner, A. K., Gorfer, M., Lippl, F., and Angerer, B.: Climate trends and variability in atmosphere heat content and atmosphere-ocean heat exchanges: space geodesy is key, IUGG General Assembly 2019 Pres., available at: https://www.czech-in.org/cmPortalV15/CM_W3_Searchable/iugg19/#!sessiondetails/0000119801_0 (last access: 7 August 2020), 2019.
Knutti, R. and Rugenstein, M. A. A.: Feedbacks, climate sensitivity and the limits of linear models, Philos. T. R. Soc. A, 373, 20150146, https://doi.org/10.1098/rsta.2015.0146, 2015.
Kobayashi, S., Ota, Y., Harada, Y., Ebita, A., Moriya, M., Onoda, H., Onogi, K., Kamahori, H., Kobayashi, C., Endo, H., MiyaokaI, K., and Takahashi, K.: The JRA-55 Reanalysis: General Specifications and Basic Characteristics, J. Meteorol. Soc. Jpn. Ser. II, 93, 5–48, https://doi.org/10.2151/jmsj.2015-001, 2015.
Kuhlbrodt, T. and Gregory, J. M.: Ocean heat uptake and its consequences for the magnitude of sea level rise and climate change, Geophys. Res. Lett., 39, L18608, https://doi.org/10.1029/2012GL052952, 2012.
Labe, Z., Magnusdottir, G., and Stern, H.: Variability of Arctic Sea Ice Thickness Using PIOMAS and the CESM Large Ensemble, J. Climate, 31, 3233–3247, https://doi.org/10.1175/JCLI-D-17-0436.1, 2018.
Lachenbruch, A. H. and Marshall, B. V.: Changing Climate: Geothermal Evidence from Permafrost in the Alaskan Arctic, Science, 234, 689–696, 1986.
Ladstädter, F., Steiner, A. K., Schwärz, M., and Kirchengast, G.: Climate intercomparison of GPS radio occultation, RS90/92 radiosondes and GRUAN from 2002 to 2013, Atmos. Meas. Tech., 8, 1819–1834, https://doi.org/10.5194/amt-8-1819-2015, 2015.
Lane, A. C.: Geotherms of Lake Superior Copper Country, GSA Bulletin, 34, 703–720, https://doi.org/10.1130/GSAB-34-703, 1923.
Laxon, S. W., Giles, K. A., Ridout, A. L., Wingham, D. J., Willatt, R., Cullen, R., Kwok, R., Schweiger, A., Zhang, J., Haas, C., Hendricks, S., Krishfield, R., Kurtz, N., Farrell, S., and Davidson, M.: CryoSat-2 estimates of Arctic sea ice thickness and volume, Geophys. Res. Lett., 40, 732–737, https://doi.org/10.1002/grl.50193, 2013.
Leifeld, J., Wüst-Galley, C., and Page, S.: Intact and managed peatland soils as a source and sink of GHGs from 1850 to 2100, Nat. Clim. Change, 9, 945–947, https://doi.org/10.1038/s41558-019-0615-5, 2019.
Lembo, V., Folini, D., Wild, M., and Lionello, P.: Inter-hemispheric differences in energy budgets and cross-equatorial transport anomalies during the 20th century, Clim. Dynam., 53, 115–135, https://doi.org/10.1007/s00382-018-4572-x, 2019.
Lenton, T., Rockström, J., Gaffney, O., Rahmstorf, S., Richardson, K., Steffen, W., and Schellnhuber, H.: Climate tipping points – too risky to bet against, Nature, 575, 592–595, https://doi.org/10.1038/d41586-019-03595-0, 2019.
Lenton, T. M.: Early warning of climate tipping points, Nat. Clim. Change, 1, 201–209, https://doi.org/10.1038/nclimate1143, 2011.
Lenton, T. M., Held, H., Kriegler, E., Hall, J. W., Lucht, W., Rahmstorf, S., and Schellnhuber, H. J.: Tipping elements in the Earth's climate system, P. Natl. Acad. Sci. USA, 105, 1786–1793, https://doi.org/10.1073/pnas.0705414105, 2008.
Levitus, S., Antonov, J. I., Boyer, T. P., Baranova, O. K., Garcia, H. E., Locarnini, R. A., Mishonov, A. V, Reagan, J. R., Seidov, D., Yarosh, E. S., and Zweng, M. M.: World ocean heat content and thermosteric sea level change (0–2000 m), 1955–2010, Geophys. Res. Lett., 39, https://doi.org/10.1029/2012GL051106, 2012.
Ligtenberg, S. R. M., Kuipers Munneke, P., Noël, B. P. Y., and van den Broeke, M. R.: Brief communication: Improved simulation of the present-day Greenland firn layer (1960–2016), The Cryosphere, 12, 1643–1649, https://doi.org/10.5194/tc-12-1643-2018, 2018.
Llovel, W., Willis, J. K., Landerer, F. W., and Fukumori, I.: Deep-ocean contribution to sea level and energy budget not detectable over the past decade, Nat. Clim. Change, 4, 1031–1035, https://doi.org/10.1038/nclimate2387, 2014.
Loeb, N. G., Lyman, J. M., Johnson, G. C., Allan, R. P., Doelling, D. R., Wong, T., Soden, B. J., and Stephens, G. L.: Observed changes in top-of-the-atmosphere radiation and upper-ocean heating consistent within uncertainty, Nat. Geosci., 5, 110–113, https://doi.org/10.1038/ngeo1375, 2012.
Loeb, N. G., Thorsen, T. J., Norris, J. R., Wang, H., and Su, W.: Changes in Earth's Energy Budget during and after the “Pause” in Global Warming: An Observational Perspective, Climate, 6, https://doi.org/10.3390/cli6030062, 2018.
Lyman, J. M. and Johnson, G. C.: Estimating Global Ocean Heat Content Changes in the Upper 1800 m since 1950 and the Influence of Climatology Choice, J. Climate, 27, 1945–1957, https://doi.org/10.1175/JCLI-D-12-00752.1, 2014.
MacDougall, A. H., Avis, C. A., and Weaver, A. J.: Significant contribution to climate warming from the permafrost carbon feedback, Nat. Geosci., 5, 719–721, https://doi.org/10.1038/ngeo1573, 2012.
MacDougall, A. H., Beltrami, H., González-Rouco, J. F., Stevens, M. B., and Bourlon, E.: Comparison of observed and general circulation model derived continental subsurface heat flux in the Northern Hemisphere, J. Geophys. Res.-Atmos., 115, D12109, https://doi.org/10.1029/2009JD013170, 2010.
MacDougall, A. H., González-Rouco, J. F., Stevens, M. B., and Beltrami, H.: Quantification of subsurface heat storage in a GCM simulation, Geophys. Res. Lett., 35, L13702, https://doi.org/10.1029/2008GL034639, 2008.
Mankoff, K. D., Colgan, W., Solgaard, A., Karlsson, N. B., Ahlstrøm, A. P., van As, D., Box, J. E., Khan, S. A., Kjeldsen, K. K., Mouginot, J., and Fausto, R. S.: Greenland Ice Sheet solid ice discharge from 1986 through 2017, Earth Syst. Sci. Data, 11, 769–786, https://doi.org/10.5194/essd-11-769-2019, 2019.
Marshall, J., Scott, J. R., Armour, K. C., Campin, J.-M., Kelley, M., and Romanou, A.: The ocean's role in the transient response of climate to abrupt greenhouse gas forcing, Clim. Dynam., 44, 2287–2299, https://doi.org/10.1007/s00382-014-2308-0, 2015.
Marvel, K., Pincus, R., Schmidt, G. A., and Miller, R. L.: Internal Variability and Disequilibrium Confound Estimates of Climate Sensitivity From Observations, Geophys. Res. Lett., 45, 1595–1601, https://doi.org/10.1002/2017GL076468, 2018.
Marzeion, B., Leclercq, P. W., Cogley, J. G., and Jarosch, A. H.: Brief Communication: Global reconstructions of glacier mass change during the 20th century are consistent, The Cryosphere, 9, 2399–2404, https://doi.org/10.5194/tc-9-2399-2015, 2015.
Matthews, T. K. R., Wilby, R. L., and Murphy, C.: Communicating the deadly consequences of global warming for human heat stress, P. Natl. Acad. Sci. USA, 114, 3861, https://doi.org/10.1073/pnas.1617526114, 2017.
Mayer, M., Trenberth, K. E., Haimberger, L., and Fasullo, J. T.: The Response of Tropical Atmospheric Energy Budgets to ENSO, J. Climate, 26, 4710–4724, https://doi.org/10.1175/JCLI-D-12-00681.1, 2013.
Mayer, M., Haimberger, L., and Balmaseda, M. A.: On the Energy Exchange between Tropical Ocean Basins Related to ENSO, J. Climate, 27, 6393–6403, https://doi.org/10.1175/JCLI-D-14-00123.1, 2014.
Mayer, M., Fasullo, J. T., Trenberth, K. E., and Haimberger, L.: ENSO-driven energy budget perturbations in observations and CMIP models, Clim. Dynam., 47, 4009–4029, https://doi.org/10.1007/s00382-016-3057-z, 2016.
Mayer, M., Haimberger, L., Edwards, J. M., and Hyder, P.: Toward Consistent Diagnostics of the Coupled Atmosphere and Ocean Energy Budgets, J. Climate, 30, 9225–9246, https://doi.org/10.1175/JCLI-D-17-0137.1, 2017.
Mayer, M., Tietsche, S., Haimberger, L., Tsubouchi, T., Mayer, J., and Zuo, H.: An Improved Estimate of the Coupled Arctic Energy Budget, J. Climate, 32, 7915–7934, https://doi.org/10.1175/JCLI-D-19-0233.1, 2019.
McPherson, M., García-García, A., Cuesta-Valero Francisco, J., Beltrami, H., Hansen-Ketchum, P., MacDougall, D., and Ogden Nicholas, H.: Expansion of the Lyme Disease Vector Ixodes Scapularis in Canada Inferred from CMIP5 Climate Projections, Environ. Health Persp., 125, 057008, https://doi.org/10.1289/EHP57, 2017.
Mears, C. A. and Wentz, F. J.: Construction of the Remote Sensing Systems V3.2 Atmospheric Temperature Records from the MSU and AMSU Microwave Sounders, J. Atmos. Ocean. Techn. 26, 1040–1056, https://doi.org/10.1175/2008JTECHA1176.1, 2009a.
Mears, C. A. and Wentz, F. J.: Construction of the RSS V3.2 Lower-Tropospheric Temperature Dataset from the MSU and AMSU Microwave Sounders, J. Atmos. Ocean. Tech., 26, 1493–1509, https://doi.org/10.1175/2009JTECHA1237.1, 2009b.
Mears, C. A. and Wentz, F. J.: A Satellite-Derived Lower-Tropospheric Atmospheric Temperature Dataset Using an Optimized Adjustment for Diurnal Effects, J. Climate, 30, 7695–7718, https://doi.org/10.1175/JCLI-D-16-0768.1, 2017.
Melo-Aguilar, C., González-Rouco, J. F., García-Bustamante, E., Navarro-Montesinos, J., and Steinert, N.: Influence of radiative forcing factors on ground–air temperature coupling during the last millennium: implications for borehole climatology, Clim. Past, 14, 1583–1606, https://doi.org/10.5194/cp-14-1583-2018, 2018.
Meyssignac, B., Boyer, T., Zhao, Z., Hakuba, M. Z., Landerer, F. W., Stammer, D., Köhl, A., Kato, S., L'Ecuyer, T., Ablain, M., Abraham, J. P., Blazquez, A., Cazenave, A., Church, J. A., Cowley, R., Cheng, L., Domingues, C. M., Giglio, D., Gouretski, V., and Zilberman, N.: Measuring Global Ocean Heat Content to Estimate the Earth Energy Imbalance, Front. Mar. Sci., 6, https://doi.org/10.3389/fmars.2019.00432, 2019.
Mouginot, J., Rignot, E., Bjørk, A. A., van den Broeke, M., Millan, R., Morlighem, M., Noël, B., Scheuchl, B., and Wood, M.: Forty-six years of Greenland Ice Sheet mass balance from 1972 to 2018, P. Natl. Acad. Sci. USA, 116, 9239, https://doi.org/10.1073/pnas.1904242116, 2019.
Myhre, G., Shindell, D., Bréon, F.-M., Collins, W., Fuglestvedt, J., Huang, J., Koch, D., Lamarque, J.-F., Lee, D., Mendoza, B., Nakajima, T., Robock, A., Stephens, G., Takemura, T., and Zhang, H.: Anthropogenic and natural radiative forcing. In Climate Change 2013 the Physical Science Basis: Working Group I Contribution to the Fifth Assessment Report of the Intergovernmental Panel on Climate Change, 9781107057, 659–740, https://doi.org/10.1017/CBO9781107415324.018, 2013.
Nauels, A., Meinshausen, M., Mengel, M., Lorbacher, K., and Wigley, T. M. L.: Synthesizing long-term sea level rise projections – the MAGICC sea level model v2.0, Geosci. Model Dev., 10, 2495–2524, https://doi.org/10.5194/gmd-10-2495-2017, 2017.
Noël, B., van de Berg, W. J., van Wessem, J. M., van Meijgaard, E., van As, D., Lenaerts, J. T. M., Lhermitte, S., Kuipers Munneke, P., Smeets, C. J. P. P., van Ulft, L. H., van de Wal, R. S. W., and van den Broeke, M. R.: Modelling the climate and surface mass balance of polar ice sheets using RACMO2 – Part 1: Greenland (1958–2016), The Cryosphere, 12, 811–831, https://doi.org/10.5194/tc-12-811-2018, 2018.
Palmer, M. D. and McNeall, D. J.: Internal variability of Earth's energy budget simulated by CMIP5 climate models, Environ. Res. Lett., 9, 034016, https://doi.org/10.1088/1748-9326/9/3/034016, 2014.
Palmer, M. D., Roberts, C. D., Balmaseda, M., Chang, Y.-S., Chepurin, G., Ferry, N., Fujii, Y., Good, S. A., Guinehut, S., Haines, K., Hernandez, F., Köhl, A., Lee, T., Martin, M. J., Masina, S., Masuda, S., Peterson, K. A., Storto, A., Toyoda, T., and Xue, Y.: Ocean heat content variability and change in an ensemble of ocean reanalyses, Clim. Dynam., 49, 909–930, https://doi.org/10.1007/s00382-015-2801-0, 2017.
Palmer, M. D., Durack, P. J., Chidichimo, M. P., Church, J. A., Cravatte, S., Hill, K., Johannessen, J. A., Karstensen, J., Lee, T., Legler, D., Mazloff, M., Oka, E., Purkey, S., Rabe, B., Sallée, J.-B., Sloyan, B. M., Speich, S., von Schuckmann, K., Willis, J., and Wijffels, S.: Adequacy of the Ocean Observation System for Quantifying Regional Heat and Freshwater Storage and Change, Front. Mar. Sci., 6, p. 416, 2019.
Palmer, M. D., Harris, G. R., and Gregory, J. M.: Extending CMIP5 projections of global mean temperature change and sea level rise due to thermal expansion using a physically-based emulator, Environ. Res. Lett., 13, 084003, https://doi.org/10.1088/1748-9326/aad2e4, 2018.
Parkes, D. and Marzeion, B.: Twentieth-century contribution to sea-level rise from uncharted glaciers, Nature, 563, 551–554, https://doi.org/10.1038/s41586-018-0687-9, 2018.
Parkinson, C. L.: A 40-y record reveals gradual Antarctic sea ice increases followed by decreases at rates far exceeding the rates seen in the Arctic, P. Natl. Acad. Sci. USA, 116, 14414, https://doi.org/10.1073/pnas.1906556116, 2019.
Peixoto, J. P. and Oort, A. H.: Physics of climate, New York, NY (United States), American Institute of Physics, available at: https://www.osti.gov/servlets/purl/7287064 (last access: 7 August 2020), 1992.
Pickler, C., Gurza Fausto, E., Beltrami, H., Mareschal, J.-C., Suárez, F., Chacon-Oecklers, A., Blin, N., Cortés Calderón, M. T., Montenegro, A., Harris, R., and Tassara, A.: Recent climate variations in Chile: constraints from borehole temperature profiles, Clim. Past, 14, 559–575, https://doi.org/10.5194/cp-14-559-2018, 2018.
Pollack, H. N. and Smerdon, J. E.: Borehole climate reconstructions: Spatial structure and hemispheric averages, J. Geophys. Res.-Atmos., 109, D11106, https://doi.org/10.1029/2003JD004163, 2004.
Polyakov, I. V., Pnyushkov, A. V., Alkire, M. B., Ashik, I. M., Baumann, T. M., Carmack, E. C., Goszczko, I., Guthrie, J., Ivanov, V. V, Kanzow, T., Krishfield, R., Kwok, R., Sundfjord, A., Morison, J., Rember, R., and Yulin, A.: Greater role for Atlantic inflows on sea-ice loss in the Eurasian Basin of the Arctic Ocean, Science, 356, 285–291, https://doi.org/10.1126/science.aai8204, 2017.
Pritchard, H. D., Ligtenberg, S. R. M., Fricker, H. A., Vaughan, D. G., van den Broeke, M. R., and Padman, L.: Antarctic ice-sheet loss driven by basal melting of ice shelves, Nature, 484, 502–505, https://doi.org/10.1038/nature10968, 2012.
Purkey, S. G. and Johnson, G. C.: Warming of Global Abyssal and Deep Southern Ocean Waters between the 1990s and 2000s: Contributions to Global Heat and Sea Level Rise Budgets, J. Climate, 23, 6336–6351, https://doi.org/10.1175/2010JCLI3682.1, 2010.
Ramírez, F., Afán, I., Davis, L. S., and Chiaradia, A.: Climate impacts on global hot spots of marine biodiversity, Science Advances, 3, e1601198, https://doi.org/10.1126/sciadv.1601198, 2017.
Rhein, M., Rintoul, S. R., Aoki, S., Campos, E., Chambers, D., Feely, R. A., Gulev, S., Johnson, G. C., Josey, S. A., Kostianoy, A., Mauritzen, C., Roemmich, D., Talley, L. D., and Wang, F.: Observations: Ocean, in: Climate Change 2013: The Physical Science Basis, Contribution of Working Group I to the Fifth Assessment Report of the Intergovernmental Panel on Climate Change, edited by: Stocker, T. F., Qin, D., Plattner, G.-K., Tignor, M., Allen, S. K., Boschung, J., Nauels, A., Xia, Y., Bex, V., and Midgley, P. M., Cambridge University Press, Cambridge, United Kingdom and New York, NY, USA, 255–316, https://doi.org/10.1017/CBO9781107415324.010, 2013.
Rhein, M., Steinfeldt, R., Huhn, O., Sültenfuß, J., and Breckenfelder, T.: Greenland Submarine Melt Water Observed in the Labrador and Irminger Sea, Geophys. Res. Lett., 45, 510–570, https://doi.org/10.1029/2018GL079110, 2018.
Richter-Menge, J., Druckenmiller, M. L., and Jeffries, M. (Eds.): Arctic Report Card, 2019, available at: https://www.arctic.noaa.gov/Report-Card (last access: 7 August 2020), 2019.
Rignot, E., Mouginot, J., Scheuchl, B., van den Broeke, M., van Wessem, M. J., and Morlighem, M.: Four decades of Antarctic Ice Sheet mass balance from 1979–2017, P. Natl. Acad. Sci. USA, 116, 1095, https://doi.org/10.1073/pnas.1812883116, 2019.
Riser, S. C., Freeland, H. J., Roemmich, D., Wijffels, S., Troisi, A., Belbéoch, M., Gilbert, D., Xu, J., Pouliquen, S., Thresher, A., Le Traon, P.-Y., Maze, G., Klein, B., Ravichandran, M., Grant, F., Poulain, P.-M., Suga, T., Lim, B., Sterl, A., and Jayne, S. R.: Fifteen years of ocean observations with the global Argo array, Nat. Clim. Change, 6, 145–153, https://doi.org/10.1038/nclimate2872, 2016.
Roemmich, D. and Gilson, J.: The 2004–2008 mean and annual cycle of temperature, salinity, and steric height in the global ocean from the Argo Program, Prog. Oceanogr., 82, 81–100, https://doi.org/10.1016/j.pocean.2009.03.004, 2009.
Roy, S., Harris, R. N., Rao, R. U. M., and Chapman, D. S.: Climate change in India inferred from geothermal observations, J. Geophys. Res.-Earth, 107, ETG 5-1–ETG 5-16, https://doi.org/10.1029/2001JB000536, 2002.
Santer, B. D., Solomon, S., Wentz, F. J., Fu, Q., Po-Chedley, S., Mears, C., Painter, J. F., and Bonfils, C.: Tropospheric Warming Over The Past Two Decades, Sci. Rep., 7, 2336, https://doi.org/10.1038/s41598-017-02520-7, 2017.
Santer, B. D., Po-Chedley, S., Zelinka, M. D., Cvijanovic, I., Bonfils, C., Durack, P. J., Fu, Q., Kiehl, J., Mears, C., Painter, J., Pallotta, G., Solomon, S., Wentz, F. J., and Zou, C.-Z.: Human influence on the seasonal cycle of tropospheric temperature, Science, 361, eaas8806, https://doi.org/10.1126/science.aas8806, 2018.
Schweiger, A., Lindsay, R., Zhang, J., Steele, M., Stern, H., and Kwok, R.: Uncertainty in modeled Arctic sea ice volume, J. Geophys. Res.-Oceans, 116, C00D06, https://doi.org/10.1029/2011JC007084, 2011.
Schweiger, A. J., Wood, K. R., and Zhang, J.: Arctic Sea Ice Volume Variability over 1901–2010: A Model-Based Reconstruction, J. Climate, 32, 4731–4752, https://doi.org/10.1175/JCLI-D-19-0008.1, 2019.
Seneviratne, S., Lüthi, D., Litschi, M., and Schär, C.: Land-atmosphere coupling and climate change in Europe, Nature, 443, 205–209, https://doi.org/10.1038/nature05095, 2006.
Seneviratne, S., Donat, M., Mueller, B., and Alexander, L.: No pause in the increase of hot temperature extremes, Nat. Clim. Change, 4, 161–163, https://doi.org/10.1038/nclimate2145, 2014.
Seneviratne, S. I., Corti, T., Davin, E. L., Hirschi, M., Jaeger, E. B., Lehner, I., Orlowsky, B., and Teuling, A. J.: Investigating soil moisture–climate interactions in a changing climate: A review, Earth-Sci. Rev., 99, 125–161, https://doi.org/10.1016/J.EARSCIREV.2010.02.004, 2010.
Serreze, M. C. and Barry, R. G.: Processes and impacts of Arctic amplification: A research synthesis, Global Planet. Change, 77, 85–96, https://doi.org/10.1016/J.GLOPLACHA.2011.03.004, 2011.
Shepherd, A., Fricker, H. A., and Farrell, S. L.: Trends and connections across the Antarctic cryosphere, Nature, 558, 223–232, https://doi.org/10.1038/s41586-018-0171-6, 2018a.
Shepherd, A., Ivins, E. R., Rignot, E., Smith, B., Van den Broeke, M. R., Velicogna, I., Whitehouse, P. L., Briggs, K. H., Joughin, I., Krinner, G., Nowicki, S., Payne, A. J., Scambos, T. A., Schlegel, N., A, G., Agosta, C., Ahlstrøm, A. P., Babonis, G., Barletta, V. R., Blazquez, A., Bonin, J., Csatho, B., Cullather, R. I., Felikson, D., Fettweis, X., Forsberg, R., Gallée, H., Gardner, A. S., Gilbert, L., Groh, A., Gunter, B., Hanna, E., Harig, C., Helm, V., Horvath, A., Horwath, M., Khan, S., Kjeldsen, K. K., Konrad, H., Langen, P., Lecavalier, B., Loomis, B., Luthcke, S. B., McMillan, M., Melini, D., Mernild, S., Mohajerani, Y., Moore, P., Mouginot, J., Moyano, G., Muir, A., Nagler, T., Nield, G., Nilsson, J., Noël, B. P. Y., Otosaka, I., Pattle, M. E., Peltier, W. R., Pie, N., Rietbroek, R., Rott, H., Sandberg Sørensen, L., Sasgen, I., Save, H., Scheuchl, B., Schrama, E. J. O., Schröder, L., Seo, K.-W., Simonsen, S., Slater, T., Spada, G., Sutterly, T. C., Talpe, M., Tarasov, L., Van de Berg, W. J., Van der Wal, W., Van Wessem, J. M., Vishwakarma, B. D., Wiese, D., and Wouters, B.: Mass balance of the Antarctic Ice Sheet from 1992 to 2017, Nature, 558, 219–222, https://doi.org/10.1038/s41586-018-0179-y, 2018b.
Shepherd, A., Ivins, E., Rignot, E., Smith, B., van den Broeke, M., Velicogna, I., Whitehouse, P., Briggs, K., Joughin, I., Krinner, G., Nowicki, S., Payne, T., Scambos, T., Schlegel, N., Geruo, A., Agosta, C., Ahlstrøm, A., Babonis, G., Barletta, V. R., and IMBIE team: Mass balance of the Greenland Ice Sheet from 1992 to 2018, Nature, 579, 233–239, https://doi.org/10.1038/s41586-019-1855-2, 2019.
Sherwood, S. C. and Huber, M.: An adaptability limit to climate change due to heat stress, P. Natl. Acad. Sci. USA, 107, 9552, https://doi.org/10.1073/pnas.0913352107, 2010.
Shi, J.-R., Xie, S.-P., and Talley, L. D.: Evolving Relative Importance of the Southern Ocean and North Atlantic in Anthropogenic Ocean Heat Uptake, J. Climate, 31, 7459–7479, https://doi.org/10.1175/JCLI-D-18-0170.1, 2018.
Smerdon, J. E. and Stieglitz, M.: Simulating heat transport of harmonic temperature signals in the Earth's shallow subsurface: Lower-boundary sensitivities, Geophys. Res. Lett., 33, L14402, https://doi.org/10.1029/2006GL026816, 2006.
Steiner, A., Ladstädter, F., Randel, W. J., Maycock, A. C., Claud, C., Fu, Q., Gleisner, H., Haimberger, L., Ho, S.-P., Keckhut, P., Leblanc, T., Mears, C., Polvani, L., Santer, B., Schmidt, T., Sofieva, V., Wing, R., and Zou, C.-Z.: Observed temperature changes in the troposphere and stratosphere from 1979 to 2018, J. Climate, 33, 8165–8194, https://doi.org/10.1175/JCLI-D-19-0998.1, 2020.
Stevens, C. W.: Subsurface investigation of shallow-water permafrost located within the near-shore zone of the Mackenzie Delta, Northwest Territories, Canada, University of Calgary, 2007.
Stevens, M. B., González-Rouco, J. F., and Beltrami, H.: North American climate of the last millennium: Underground temperatures and model comparison, J. Geophys. Res.-Earth, 113, F01008, https://doi.org/10.1029/2006JF000705, 2008.
Stieglitz, M. and Smerdon, J. E.: Characterizing Land–Atmosphere Coupling and the Implications for Subsurface Thermodynamics, J. Climate, 20, 21–37, https://doi.org/10.1175/JCLI3982.1, 2007.
Storto, A., Masina, S., Simoncelli, S., Iovino, D., Cipollone, A., Drevillon, M., Drillet, Y., Schuckman, K., Parent, L., Garric, G., Greiner, E., Desportes, C., Zuo, H., Balmaseda, M., and Peterson, K.: The added value of the multi-system spread information for ocean heat content and steric sea level investigations in the CMEMS GREP ensemble reanalysis product, Clim. Dynam., 53, 287–312, https://doi.org/10.1007/s00382-018-4585-5, 2018.
Storto, A., Alvera-Azcárate, A., Balmaseda, M. A., Barth, A., Chevallier, M., Counillon, F., Domingues, C. M., Drevillon, M., Drillet, Y., Forget, G., Garric, G., Haines, K., Hernandez, F., Iovino, D., Jackson, L. C., Lellouche, J.-M., Masina, S., Mayer, M., Oke, P. R., and Zuo, H.: Ocean Reanalyses: Recent Advances and Unsolved Challenges, Front. Mar. Sci., 6, 418, https://doi.org/10.3389/fmars.2019.00418, 2019.
Straneo, F. and Cenedese, C.: The Dynamics of Greenland's Glacial Fjords and Their Role in Climate, Annu. Rev. Mar. Sci., 7, 89–112, https://doi.org/10.1146/annurev-marine-010213-135133, 2015.
Straneo, F., Adusumilli, S., Slater, D., Timmermanns, M., Marzeion, B., and Schweiger, A.: Inventory of Earth's ice loss and associated energy uptake from 1979 to 2017, Geophys. Res. Lett., in review, 2020.
Suman, A., Dyer, F., and White, D.: Late Holocene temperature variability in Tasmania inferred from borehole temperature data, Clim. Past, 13, 559–572, https://doi.org/10.5194/cp-13-559-2017, 2017.
Trenberth, K. E.: The ocean is warming, isn't it?, Nature, 465, p. 304, https://doi.org/10.1038/465304a, 2010.
Trenberth, K. E.: Understanding climate change through Earth’s energy flows, J. Roy. Soc. New Zeal., 50, 331–347, https://doi.org/10.1080/03036758.2020.1741404, 2020.
Trenberth, K. E. and Fasullo, J. T.: Tracking Earth's Energy, Science, 328, 316–317, https://doi.org/10.1126/science.1187272, 2010.
Trenberth, K. E. and Fasullo, J. T.: Applications of an Updated Atmospheric Energetics Formulation, J. Climate, 31, 6263–6279, https://doi.org/10.1175/JCLI-D-17-0838.1, 2018.
Trenberth, K. E., Fasullo, J. T., and Shepherd, T. G.: Attribution of climate extreme events, Nat. Clim. Change, 5, 725–730, https://doi.org/10.1038/nclimate2657, 2015.
Trenberth, K. E., Fasullo, J. T., and Balmaseda, M. A.: Earth's Energy Imbalance, J. Climate, 27, 3129–3144, https://doi.org/10.1175/JCLI-D-13-00294.1, 2014.
Trenberth, K. E., Fasullo, J. T., von Schuckmann, K., and Cheng, L.: Insights into Earth's Energy Imbalance from Multiple Sources, J. Climate, 29, 7495–7505, https://doi.org/10.1175/JCLI-D-16-0339.1, 2016.
Trenberth, K. E., Cheng, L., Jacobs, P., Zhang, Y., and Fasullo, J.: Hurricane Harvey Links to Ocean Heat Content and Climate Change Adaptation. Earth's Future, 6, 730–744, https://doi.org/10.1029/2018EF000825, 2018.
UN: United Nations Framework Convention on Climate Change, FCCC/INFORMAL/84 GE.05-62220 (E) 200705, available at: https://unfccc.int/resource/docs/convkp/conveng.pdf (last access: 7 August 2020), 1992.
UN: The Paris Agreement, available at: https://unfccc.int/sites/default/files/english_paris_agreement.pdf (last access: 7 August 2020), 2015.
UNGA: The future we want, Resolution adopted by the General Assembly on 27 July 2012, A/RES/66/288, 2012.
UNGA: Transforming our world: the 2030 Agenda for Sustainable Development, Resolution adopted by the General Assembly on 25 September 2015, A/RES/70/1, 2015.
Vanderkelen, I., van Lipzig, N. P. M., Lawrence, D. M., Droppers, B., Golub, M., Gosling, S. N., Janssen, A. B. G., Marcé, R., Schmied, H. M., Perroud, M., Pierson, D., Pokhrel, Y., Satoh, Y., Schewe, J., Seneviratne, S. I., Stepanenko, V. M., Tan, Z., Woolway, R. I., and Thiery, W.: Global Heat Uptake by Inland Waters, Geophys. Res. Lett., 47, e2020GL087867, https://doi.org/10.1029/2020GL087867, 2020.
Vasseur, G., Bernard, P., Van de Meulebrouck, J., Kast, Y., and Jolivet, J.: Holocene paleotemperatures deduced from geothermal measurements, Palaeogeogr. Palaeocl., 43, 237–259, https://doi.org/10.1016/0031-0182(83)90013-5, 1983.
Verdoya, M., Chiozzi, P., and Pasquale, V.: Thermal log analysis for recognition of ground surface temperature change and water movements, Clim. Past, 3, 315–324, https://doi.org/10.5194/cp-3-315-2007, 2007.
von Schuckmann, K. and Le Traon, P.-Y.: How well can we derive Global Ocean Indicators from Argo data?, Ocean Sci., 7, 783–791, https://doi.org/10.5194/os-7-783-2011, 2011.
von Schuckmann, K., Sallée, J.-B., Chambers, D., Le Traon, P.-Y., Cabanes, C., Gaillard, F., Speich, S., and Hamon, M.: Consistency of the current global ocean observing systems from an Argo perspective, Ocean Sci., 10, 547–557, https://doi.org/10.5194/os-10-547-2014, 2014.
von Schuckmann, K., Palmer, M. D., Trenberth, K. E., Cazenave, A., Chambers, D., Champollion, N., Hansen, J., Josey, S. A., Loeb, N., Mathieu, P.-P., Meyssignac, B., and Wild, M.: An imperative to monitor Earth's energy imbalance, Nat. Clim. Change, 6, 138–144, https://doi.org/10.1038/nclimate2876, 2016.
von Schuckmann, K., Le Traon, P.-Y., Alvarez-Fanjul, E., Axell, L., Balmaseda, M., Breivik, L.-A., Brewin, R. J. W., Bricaud, C., Drevillon, M., Drillet, Y., Dubois, C., Embury, O., Etienne, H., Sotillo, M. G., Garric, G., Gasparin, F., Gutknecht, E., Guinehut, S., Hernandez, F., and Verbrugge, N.: The Copernicus Marine Environment Monitoring Service Ocean State Report, J. Oper. Oceanogr., 9(sup2), s235–s320, https://doi.org/10.1080/1755876X.2016.1273446, 2017.
von Schuckmann, K., Le Traon, P.-Y., Smith, N., Pascual, A., Brasseur, P., Fennel, K., Djavidnia, S., Aaboe, S., Fanjul, E. A., Autret, E., Axell, L., Aznar, R., Benincasa, M., Bentamy, A., Boberg, F., Bourdallé-Badie, R., Nardelli, B. B., Brando, V. E., Bricaud, C.,and Zuo, H.: Copernicus Marine Service Ocean State Report, J. Oper. Oceanogr., 11(sup1), S1–S142, https://doi.org/10.1080/1755876X.2018.1489208, 2018.
von Schuckmann, K., Cheng, L., Palmer, M. D., Hansen, J., Tassone, C., Aich, V., Adusumilli, S., Beltrami, H., Boyer, T., Cuesta-Valero, F. J., Desbruyères, D., Domingues, C., García-García, A., Gentine, P., Gilson, J., Gorfer, M., Haimberger, L., Ishii, M., Johnson, G. C., Killick, R., King, B. A., Kirchengast, G., Kolodziejczyk, N., Lyman, J., Marzeion, B., Mayer, M., Monier, M., Monselesan, D. P., Purkey, S., Roemmich, D., Schweiger, A., Seneviratne, S. I., Shepherd, A., Slater, D. A., Steiner, A. K., Straneo, F., Timmermanns, M.-L., and Wijffels, S. E.: Heat stored in the Earth system: Where does the energy go? Version 2, World Data Center for Climate (WDCC) at DKRZ, https://doi.org/10.26050/WDCC/GCOS_EHI_EXP_v2, 2020.
Wang, G., Cheng, L., Abraham, J., and Li, C.: Consensuses and discrepancies of basin-scale ocean heat content changes in different ocean analyses, Clim. Dynam., 50, 2471–2487, https://doi.org/10.1007/s00382-017-3751-5, 2018.
Wang, X., Key, J., Kwok, R., and Zhang, J.: Comparison of Arctic Sea Ice Thickness from Satellites, Aircraft, and PIOMAS Data, Remote Sensing, 8, 1–17, https://doi.org/10.3390/rs8090713, 2016.
Watts, N., Amann, M., Arnell, N., Ayeb-Karlsson, S., Belesova, K., Boykoff, M., Byass, P., Cai, W., Campbell-Lendrum, D., Capstick, S., Chambers, J., Dalin, C., Daly, M., Dasandi, N., Davies, M., Drummond, P., Dubrow, R., Ebi, K. L., Eckelman, M., and Montgomery, H.: The 2019 report of The Lancet Countdown on health and climate change: ensuring that the health of a child born today is not defined by a changing climate, The Lancet, 394, 1836–1878, https://doi.org/10.1016/S0140-6736(19)32596-6, 2019.
WCRP Global Sea Level Budget Group: Global sea-level budget 1993–present, Earth Syst. Sci. Data, 10, 1551–1590, https://doi.org/10.5194/essd-10-1551-2018, 2018.
Wijffels, S., Roemmich, D., Monselesan, D., Church, J., and Gilson, J.: Ocean temperatures chronicle the ongoing warming of Earth, Nat. Clim. Change, 6, 116–118, https://doi.org/10.1038/nclimate2924, 2016.
Wild, M.: The global energy balance as represented in CMIP6 climate models, Clim. Dynam., 55, 553–577, https://doi.org/10.1007/s00382-020-05282-7, 2020.
Willis, J. K., Roemmich, D., and Cornuelle, B.: Interannual variability in upper ocean heat content, temperature, and thermosteric expansion on global scales, J. Geophys. Res.-Oceans, 109, https://doi.org/10.1029/2003JC002260, 2004.
Wilson, N., Straneo, F., and Heimbach, P.: Satellite-derived submarine melt rates and mass balance (2011–2015) for Greenland's largest remaining ice tongues, The Cryosphere, 11, 2773–2782, https://doi.org/10.5194/tc-11-2773-2017, 2017.
WMO: WMO Statement on the State of the Global Climate in 2019, available at: https://library.wmo.int/doc_num.php?explnum_id=10211, last access: 7 August 2020.
Woollings, T., Gregory, J. M., Pinto, J. G., Reyers, M., and Brayshaw, D. J.: Response of the North Atlantic storm track to climate change shaped by ocean–atmosphere coupling, Nat. Geosci., 5, 313–317, https://doi.org/10.1038/ngeo1438, 2012.
Xu, C., McDowell, N. G., Fisher, R. A., Wei, L., Sevanto, S., Christoffersen, B. O., Weng, E., and Middleton, R. S.: Increasing impacts of extreme droughts on vegetation productivity under climate change, Nat. Clim. Change, 9, 948–953, https://doi.org/10.1038/s41558-019-0630-6, 2019.
Yang, H., Lohmann, G., Wei, W., Dima, M., Ionita, M., and Liu, J.: Intensification and poleward shift of subtropical western boundary currents in a warming climate, J. Geophys. Res.-Oceans, 121, 4928–4945, https://doi.org/10.1002/2015JC011513, 2016.
Zanna, L., Khatiwala, S., Gregory, J. M., Ison, J., and Heimbach, P.: Global reconstruction of historical ocean heat storage and transport, P. Natl. Acad. Sci. USA, 116, 1126, https://doi.org/10.1073/pnas.1808838115, 2019.
Zemp, M., Huss, M., Thibert, E., Eckert, N., McNabb, R., Huber, J., Barandun, M., Machguth, H., Nussbaumer, S. U., Gärtner-Roer, I., Thomson, L., Paul, F., Maussion, F., Kutuzov, S., and Cogley, J. G.: Global glacier mass changes and their contributions to sea-level rise from 1961 to 2016, Nature, 568, 382–386, https://doi.org/10.1038/s41586-019-1071-0, 2019.
Zhang, J. and Rothrock, D. A.: Modeling Global Sea Ice with a Thickness and Enthalpy Distribution Model in Generalized Curvilinear Coordinates, Mon. Weather Rev., 131, 845–861, https://doi.org/10.1175/1520-0493(2003)131<0845:MGSIWA>2.0.CO;2, 2003.
Zscheischler, J., Westra, S., van den Hurk, B. J. J. M., Seneviratne, S. I., Ward, P. J., Pitman, A., AghaKouchak, A., Bresch, D. N., Leonard, M., Wahl, T., and Zhang, X.: Future climate risk from compound events, Nat. Clim. Change, 8, 469–477, https://doi.org/10.1038/s41558-018-0156-3, 2018.
- Abstract
- Introduction
- Heat stored in the ocean
- Heat available to warm the atmosphere
- Heat available to warm land
- Heat utilized to melt ice
- The Earth heat inventory: where does the energy go?
- Data availability
- Conclusions
- Author contributions
- Acknowledgements
- Financial support
- Review statement
- References
- Article
(4355 KB) - Full-text XML
- Abstract
- Introduction
- Heat stored in the ocean
- Heat available to warm the atmosphere
- Heat available to warm land
- Heat utilized to melt ice
- The Earth heat inventory: where does the energy go?
- Data availability
- Conclusions
- Author contributions
- Acknowledgements
- Financial support
- Review statement
- References