the Creative Commons Attribution 4.0 License.
the Creative Commons Attribution 4.0 License.
 | 26 Aug 2020
Spatial radionuclide deposition data from the 60 km radial area around the Chernobyl Nuclear Power Plant: results from a sampling survey in 1987
Valery Kashparov
Sviatoslav Levchuk
Marina Zhurba
Valentyn Protsak
Nicholas A. Beresford
The data set “Spatial radionuclide deposition data from the 60 radial km area around the Chernobyl nuclear power plant: results from a sampling survey in 1987” is the latest in a series of data to be published by the Environmental Information Data Centre (EIDC) describing samples collected and analysed following the Chernobyl Nuclear Power Plant accident in 1986. The data result from a survey carried out by the Ukrainian Institute of Agricultural Radiology (UIAR) in April and May 1987 and includes sample site information, dose rate, radionuclide (zirconium-95, niobium-95, ruthenium-106, caesium-134, caesium-137 and cerium-144) deposition, and exchangeable (determined following 1M NH4Ac extraction of soils) caesium-134 and 137.
The purpose of this paper is to describe the available data and methodology used for sample collection, sample preparation and analysis. The data will be useful in reconstructing doses to human and wildlife populations, answering the current lack of scientific consensus on the effects of radiation on wildlife in the Chernobyl Exclusion Zone and evaluating future management options for the Chernobyl-impacted areas of Ukraine and Belarus.
The data and supporting documentation are freely available from the EIDC under the terms and conditions of the Open Government Licence (Kashparov et al., 2019; https://doi.org/10.5285/a408ac9d-763e-4f4c-ba72-73bc2d1f596d).
- Article
(8168 KB) - Full-text XML
- Companion paper
- BibTeX
- EndNote


The dynamics of the release of radioactive substances from the number four reactor at the Chernobyl Nuclear Power Plant (ChNPP) and meteorological conditions over the 10 d following the accident on 26 April 1986 resulted in a complex pattern of contamination over most of Europe (IAEA, 2006).
The neutron flux rise and a sharp increase in energy emissions at the time of the accident resulted in the heating of the nuclear fuel and the leakage of fission products. The destruction of the fuel rods caused an increase in heat transfer to the surface of the superheated fuel particles and coolant and led to the release of radioactive substances into the atmosphere (Kashparov et al., 1996). According to the latest estimates (Kashparov et al., 2003; UNSCEAR, 2008), 100 % of inert radioactive gases (largely 85Kr and 133Xe), 20 %–60 % of iodine isotopes, 12 %–40 % of 134,137Cs and 1.4 %–4 % of less volatile radionuclides (95Zr, 99Mo, 89,90 Sr, 103,106 Ru, 141,144 Ce, 154,155 Eu, 238−241 Pu, etc.) in the reactor at the moment of the accident were released to the atmosphere.
As a result of the initial explosion on 26 April 1986, a narrow (100 km long and up to 1 km wide) relatively straight trace of radioactive fallout formed to the west of the reactor in the direction of the Red Forest and Tolsty Les village (this has subsequently become known as the “western trace”). This trace was mainly finely dispersed nuclear fuel (Kashparov et al., 2003, 2018) and could only have been formed as a consequence of the short-term release of fuel particles with overheated vapour at a comparatively low height during the stable atmospheric conditions at nighttime (the accident occurred at 01:24 local time – LT). At the time of the accident, surface winds were weak and did not have any particular direction; only at a height of 1500 m was there a southwestern wind with the velocity of 8–10 m s−1 (IAEA, 1992). Cooling of the release cloud, which included steam, resulted in the decrease in its volume, water condensation and wet deposition of radionuclides as mist (as the released steam cooled; Saji, 2005). Later, the main mechanism of the fuel particle formation was the oxidation of the nuclear fuel (Kashparov et al., 1996; Salbu et al., 1994). There was an absence of data on the meteorological conditions in the area of ChNPP at the time of the accident (the closest observations were more than 100 km away to the west; Izrael et al., 1990). There was also a lack of source term information and data on the composition of the dispersed radioactive fallout. Consequently, it was not possible to make accurate predictions of the deposition for the area close to the ChNPP (Talerko, 2005).
The relative leakage of fission products of uranium (IV) oxide in an inert environment at temperatures up to 2600 ∘C decreases in the order from volatile (Xe, Kr, I, Cs, Te, Sb and Ag) and semi-volatile (Mo, Ba, Rh, Pd and Tc) to nonvolatile (Sr, Y, Nb, Ru, La, Ce and Eu; Kashparov et al., 1996; Pontillon et al., 2010). As a result of the estimated potential remaining heat release from fuel at the time of the accident (∼ 230 W kg−1 U) and the heat accumulation in the fuel (National Report of Ukraine, 2011), highly mobile volatile fission products (Kr, Xe, iodine, tellurium and caesium) were released from the fuel of the reactor and raised to a height of more than 1 km on 26 April 1986 and to approximately 600 m over the following days (IAEA, 1992; Izrael et al., 1990). The greatest release of radiocaesium occurred during the period of maximum heating of the reactor fuel on 26–28 April 1986 (Izrael et al., 1990). This caused the formation of the western, southwestern (towards the settlements of Poliske and Bober), northwestern (ultimately spreading to Sweden and wider areas of western Europe), and northeastern condensed radioactive traces. Caesium deposition at distances from Chernobyl was largely determined by the degree of precipitation (e.g. see Chaplow et al., 2015, discussing deposition across Great Britain). After the covering of the reactor by dropping materials (including 40 t of boron carbide, 2500 t of lead, 1800 t of sand and clay, and 800 t of dolomite) from helicopters over the period 27 April–10 May 1986 (National Report of Ukraine, 2011), the ability for heat exchange in the fuel reduced, which caused a rise in temperature and a consequent increase in the leakage of volatile fission products, and the melting of the materials which had been dropped onto the reactor. Subsequently, there was a sharp reduction in the release of radionuclides from the destroyed reactor on 6 May 1986 (National Report of Ukraine, 2011) due to aluminosilicates forming thermally stable compounds with many fission products and fixing caesium and strontium at high temperatures (a process known prior to the Chernobyl accident; Hilpert et al., 1983).
The changes in the annealing temperature of the nuclear fuel during the accident had a strong effect on both the ratio of different volatile fission products released (the migratory properties of Xe, Kr, I, Te and Cs increased with the temperature rise and were influenced by the presence of UO2) and the rate of the destruction of the nuclear fuel which oxidized to form micronized fuel particles (Salbu et al., 1994; Kashparov et al., 1996). The deposition of radionuclides such as 90Sr, 238−241Pu and 241Am, which were associated with the fuel component of the Chernobyl releases, was largely limited to areas relatively close to the ChNPP. Areas receiving the deposition of these radionuclides were the Chernobyl Exclusion Zone (i.e. the area of approximately 30 km radius around the ChNPP), adjacent territories to the north of the Kiev region in the west of the Chernihiv region, and the Bragin and Hoyniki districts of the Gomel region (Belarus). Deposition was related to the rate of the dry gravitational sedimentation of the fuel particles caused by their high density (about 8–10 g cm−3; Kashparov et al., 1996); sedimentation of the lightweight condensation particles containing iodine and caesium radioisotopes was lower, and hence, these were transported further.
After the Chernobyl accident, western Europe and the Ukrainian–Belorussian Polessye were contaminated with radionuclides (IAEA, 1991, 1992, 2006). However, the area extending to 60 km around the ChNPP was the most contaminated (Izrael et al., 1990). Work on the assessment of the radiological situation within the zone started within a few days of the accident; the aim of this work was the radiation protection of the population and personnel. Subsequently, further quantification of terrestrial dose rates was carried out by an aerial gamma survey by the State Hydrometeorological Committee, together with Ministries of Geology and Defence of the USSR (as reported in Izrael et al., 1990). Large-scale sampling of soil was also conducted, with samples analysed using gamma spectrometry and radiochemistry methods (see Izrael et al., 1990). These studies showed high variability in dose rates and radionuclide activity concentrations, with spatial patterns in both radioactive contamination and the radionuclide composition of fallout (Izrael et al., 1990).
The initial area from which the population was evacuated was based on an arbitrary decision in which a circle around the Chernobyl nuclear power plant, with a radius of 30 km, was defined (IAEA, 1991). In the initial phase after the accident (before 7 May 1986), 99 195 people were evacuated from 113 settlements, including 11 358 people from 51 villages in Belarus and 87 837 people from 62 settlements in Ukraine (including about 45000 people evacuated between 14:00 and 17:00 LT on 27 April from the town of Pripyat located 4 km from the ChNPP; Aleksakhin et al., 2001).
The analysis of the data available in May 1986 showed that the extent of the territory with radioactive contamination, where comprehensive measures were required to protect the population, extended far beyond the 30 km Chernobyl Exclusion Zone (CEZ). A temporary annual effective dose limit of 100 mSv for the period from 26 April 1986 to 25 April 1987 (50 mSv from external exposure and 50 mSv from internal exposure) was set by the USSR's Ministry of Health. To identify areas outside of the CEZ where the population required evacuation, dose criteria had to be defined. Using the average value of the dose rate of gamma radiation in open air for an area (estimated for 10 May 1986) was proposed to help define an evacuation zone. An exposure dose rate of 5 mR h−1 estimated for 10 May 1986 (approximating to an effective dose rate (EDR) of gamma radiation in the air of 50 µSv h−1) equated to an external annual dose of 50 mSv for the period from 26 April 1986 to 25 April 1987.
At the end of May 1986, an approach for identifying areas where evacuation was required, using the estimated internal dose rates, was proposed. This used the average density of the surface contamination of the soil with long-lived biologically significant nuclides (137Cs, 90Sr and 239,240Pu) in a settlement and modelling to estimate the contamination of foodstuffs and, hence, diet. The numerical values suggested for identifying areas for evacuation were 15 Ci km−2 (555 kBq m−2) of 137Cs, 3 Ci km−2 (111 kBq m−2) of 90Sr, and 0.1 Ci km−2 (3.7 kBq m−2) of 239,240Pu; this equated to an internal dose of 50 mSv over the first year after the accident.
However, in reality, the main criterion for the evacuation was the exposure dose rate (R h−1), and where the exposure dose rate exceeded 5 mR h−1 (EDR in air of about 50 µSv h−1) the evacuated population were not allowed to return.
Hence, in 1986 the boundary of the population evacuation zone was set at an exposure dose rate of 5 mR h−1 (EDR of about 50 µSv h−1). However, the ratio of short-lived gamma-emitting radionuclides (95Zr, 95Nb, 106Ru and 144Ce), deposited as fuel particles to 134,137Cs deposited as condensation particles, was inconsistent across the evacuated areas. Therefore, after the radioactive decay of the short-lived radionuclides, the residual dose rate across the evacuated areas varied considerably and was largely determined by the pattern of long-lived 137Cs deposition (e.g. Fig. 1; Kashparov et al., 2018).
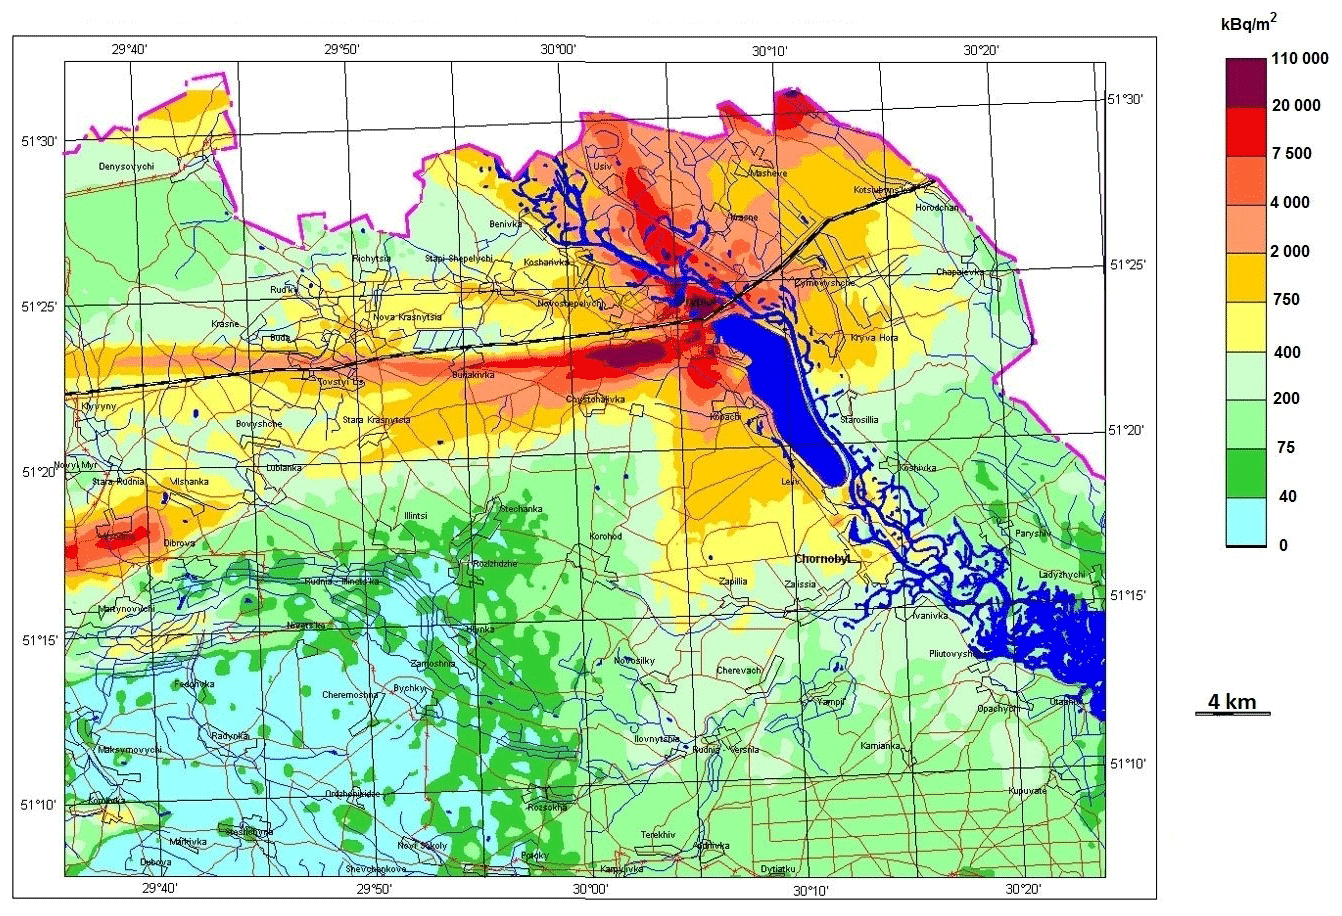
Figure 1Caesium-137 deposition in the Ukrainian 30 km exclusion zone estimated for 1997 (from UIAR, 1998).
The first measurements of the activity concentration of radionuclides in the soil showed that radionuclide activity concentration ratios depended on the distance and direction from the ChNPP (Izrael et al., 1990). Subsequent to this observation a detailed study of soil contamination was started in 1987 (Izrael et al., 1990). Taking into account the considerable heterogeneity of terrestrial contamination with radioactive substances in a large area, sampling along the western, southern and northern traces was carried out in stages, finishing in 1988.
In 1987 the State Committee of Hydrometeorology and the Scientific Centre of the Defence Ministry of the USSR established a survey programme to monitor radionuclide activity concentrations in the soil. For this purpose, 540 sampling sites were identified at a distance of 5 to 60 km around the ChNPP, using a polar coordinate system centred on the ChNPP. A total of 15 sampling sites were selected on each of the 36 rays drawn every 10∘ (Loshchilov et al., 1991; Figs. 3–4). Radionuclide activity concentrations in the soil samples collected on the radial network were determined by the UIAR and used to calculate the radionuclide contamination density. These data are discussed in this paper, and the full data set is freely available from Kashparov et al. (2019).
The data (Kashparov et al., 2019) include the location of the sample sites (angle and distance from the ChNPP), dose rate, radionuclide deposition data, counting efficiency and information on exchangeable 134,137Cs.
The data are presented in a table with 21 columns and 540 rows of data (plus column headings) as one Microsoft Excel Comma Separated Value File (.csv) as per the requirements of the Environmental Information Data Centre. Table A1 in the Appendix presents an explanation of the column headings and units used in the data (Kashparov et al., 2019).
2.1 Sampling
To enable long-term monitoring and contamination mapping of the 60 km zone around the ChNPP, 540 points were defined and sampled in April–May 1987. The sampling strategy used a radial network with points at every 10∘ (from 10 to 360∘); sampling points were located at distances of 5, 6, 7, 8.3, 10, 12, 14.7, 17, 20, 25, 30, 37.5, 45, 52.5 and 60 km (Figs. 3–4). The locations of the sampling points were identified using military maps (1 : 10 000 scale) and the local landscape. Sampling sites (identified using an index post) were estimated to be within 10 m of the distances and directions as recorded in the accompanying data set. Sites were resampled regularly until 1990 and sporadically thereafter; however, data for these subsequent samplings are not reported here as they are unavailable (including to the UIAR).
Samples were not collected from points located in swamps, rivers and lakes; in total, 489 samples were collected. A corer with a diameter of 14 cm was used to collect soil samples down to a depth of 5 cm from five points at each location, using the envelope method (with approximately 5–10 m between sampling points; Fig. 2; Loshchilov et al., 1991). Soil cores were retained intact during transportation to the laboratory. At each sampling point, the exposure dose rate was determined 1 m above ground level.
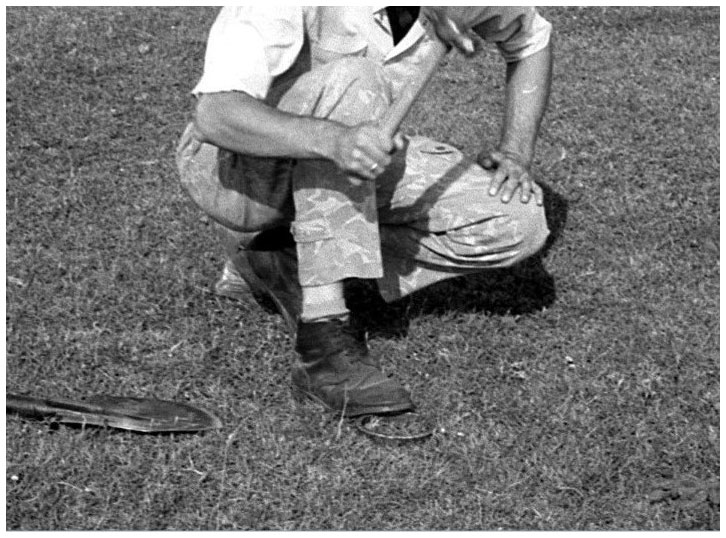
Figure 2Soil sampling using a ring of 14 cm diameter to collect a 5 cm deep soil core (courtesy of UIAR, 1989).
2.2 Analysis
Using a high-purity germanium detector (GEM-30185; EG&G, ORTEC, USA) and a multichannel analyser (ADCAM-300; EG&G, ORTEC, USA), the activity concentration of gamma-emitting radionuclides (zirconium-95 (95Zr), niobium-95 (95Nb), ruthenium-106 (106Ru), caesium-134 (134Cs), caesium-137 (137Cs) and cerium-144 (144Ce)) was determined in one soil sample from each sampling site. Information on the gamma lines used in the analyses and the radioisotope half-lives assumed for decay correction are presented in Appendix 2. Soil samples were analysed in a 1 L Marinelli container. The other four cores were sent to different laboratories in the Soviet Union (data for these cores are unfortunately not available). Using a 1M NH4Ac solution (pH 7), a 100 g subsample of soil was leached (solid to liquid ratio of 1 : 5). The resultant leachate solution was shaken for 1 h and then left at room temperature for 1 d before filtering through ashless filter paper (3–5 µm). The filtrate was then put into a suitable container for gamma analysis to determine the fraction of exchangeable 134,137Cs. Measured activity concentrations were reported at a 68 % confidence level (which equates to 1 standard deviation).
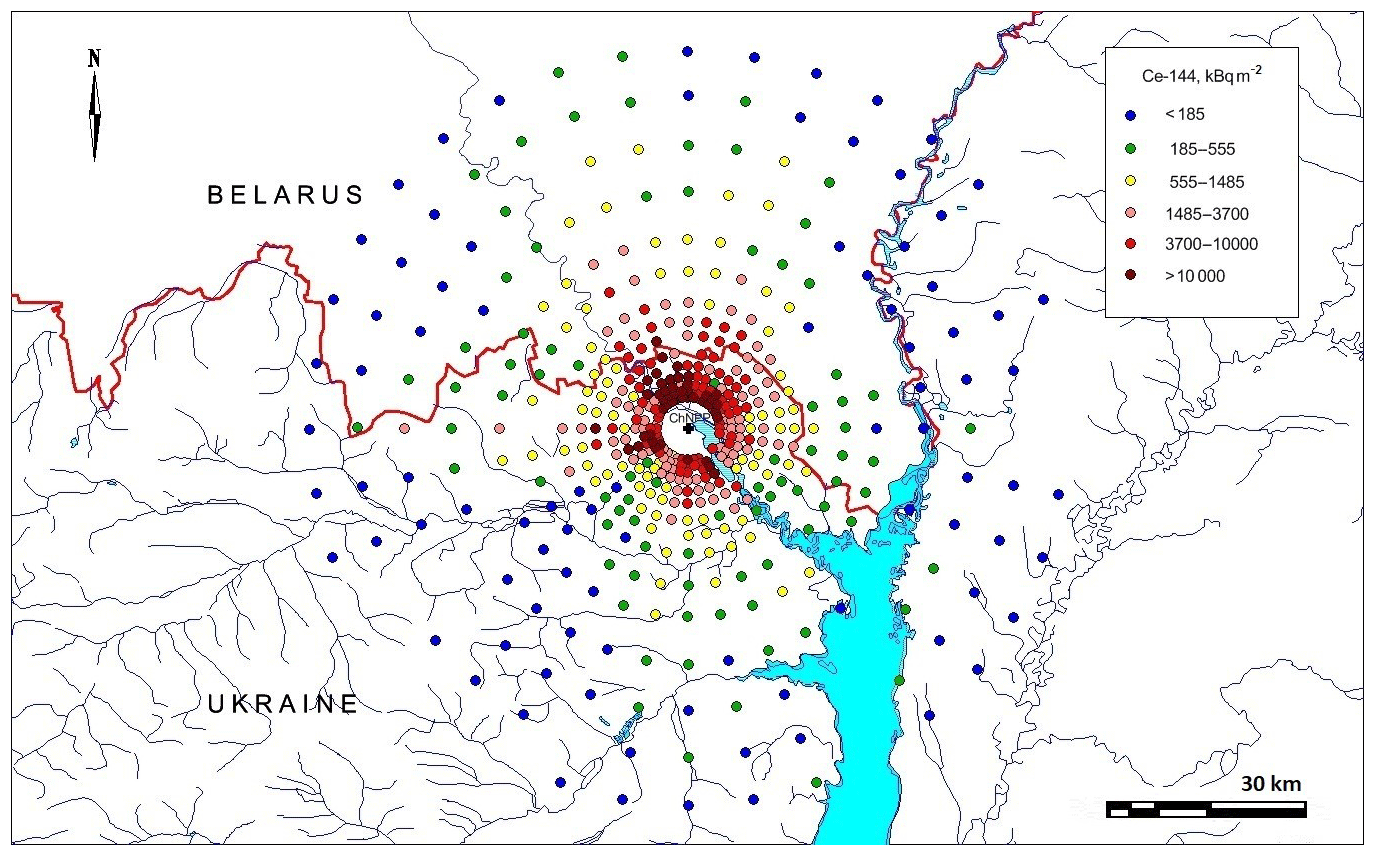
Figure 3The fallout density of 144Ce (kBq m−2) within the 60 km zone around the ChNPP decay corrected to 6 May 1986.
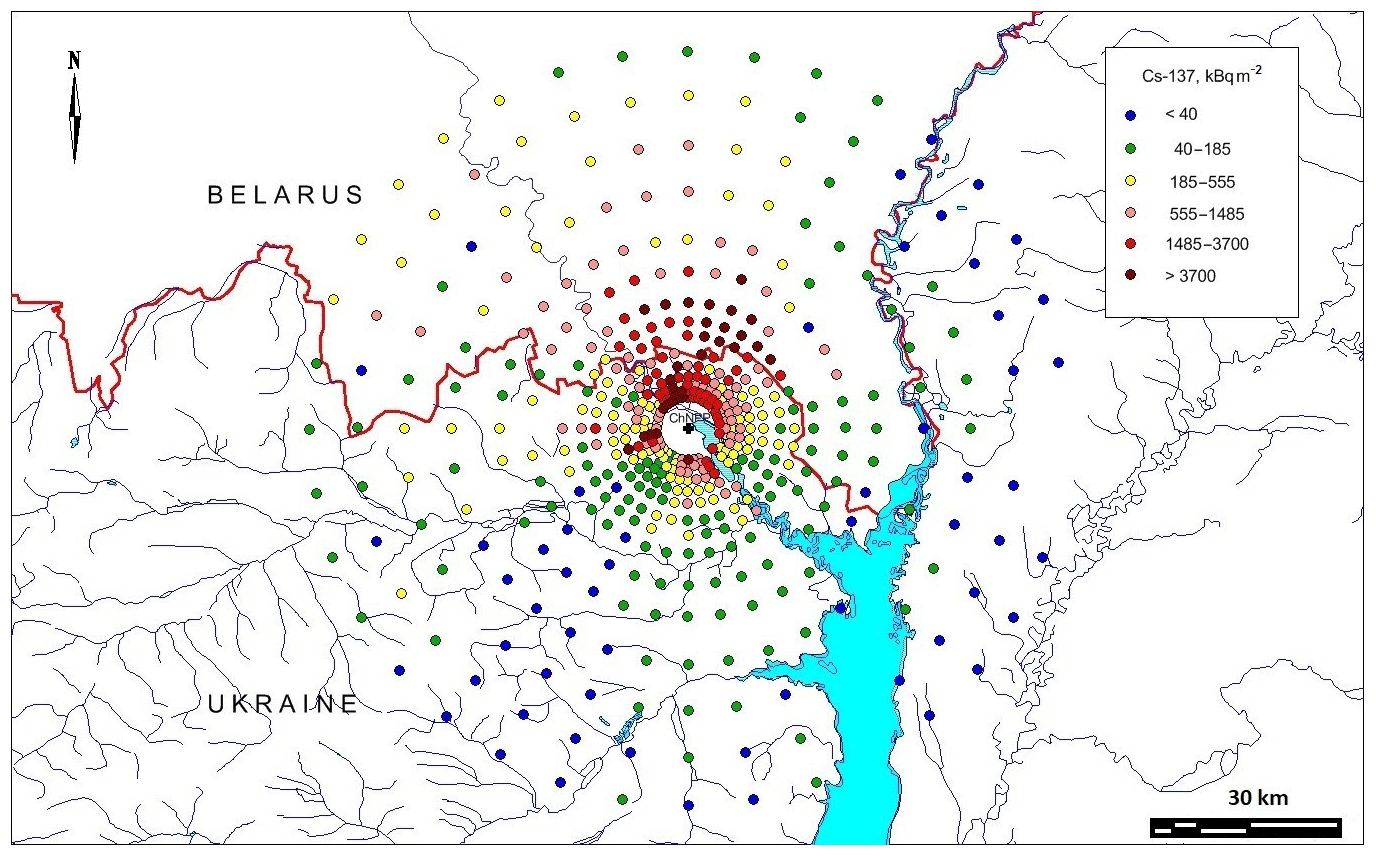
Figure 4The fallout density of 137Cs (kBq m−2) within the 60 km zone around the ChNPP decay corrected to 6 May 1986.
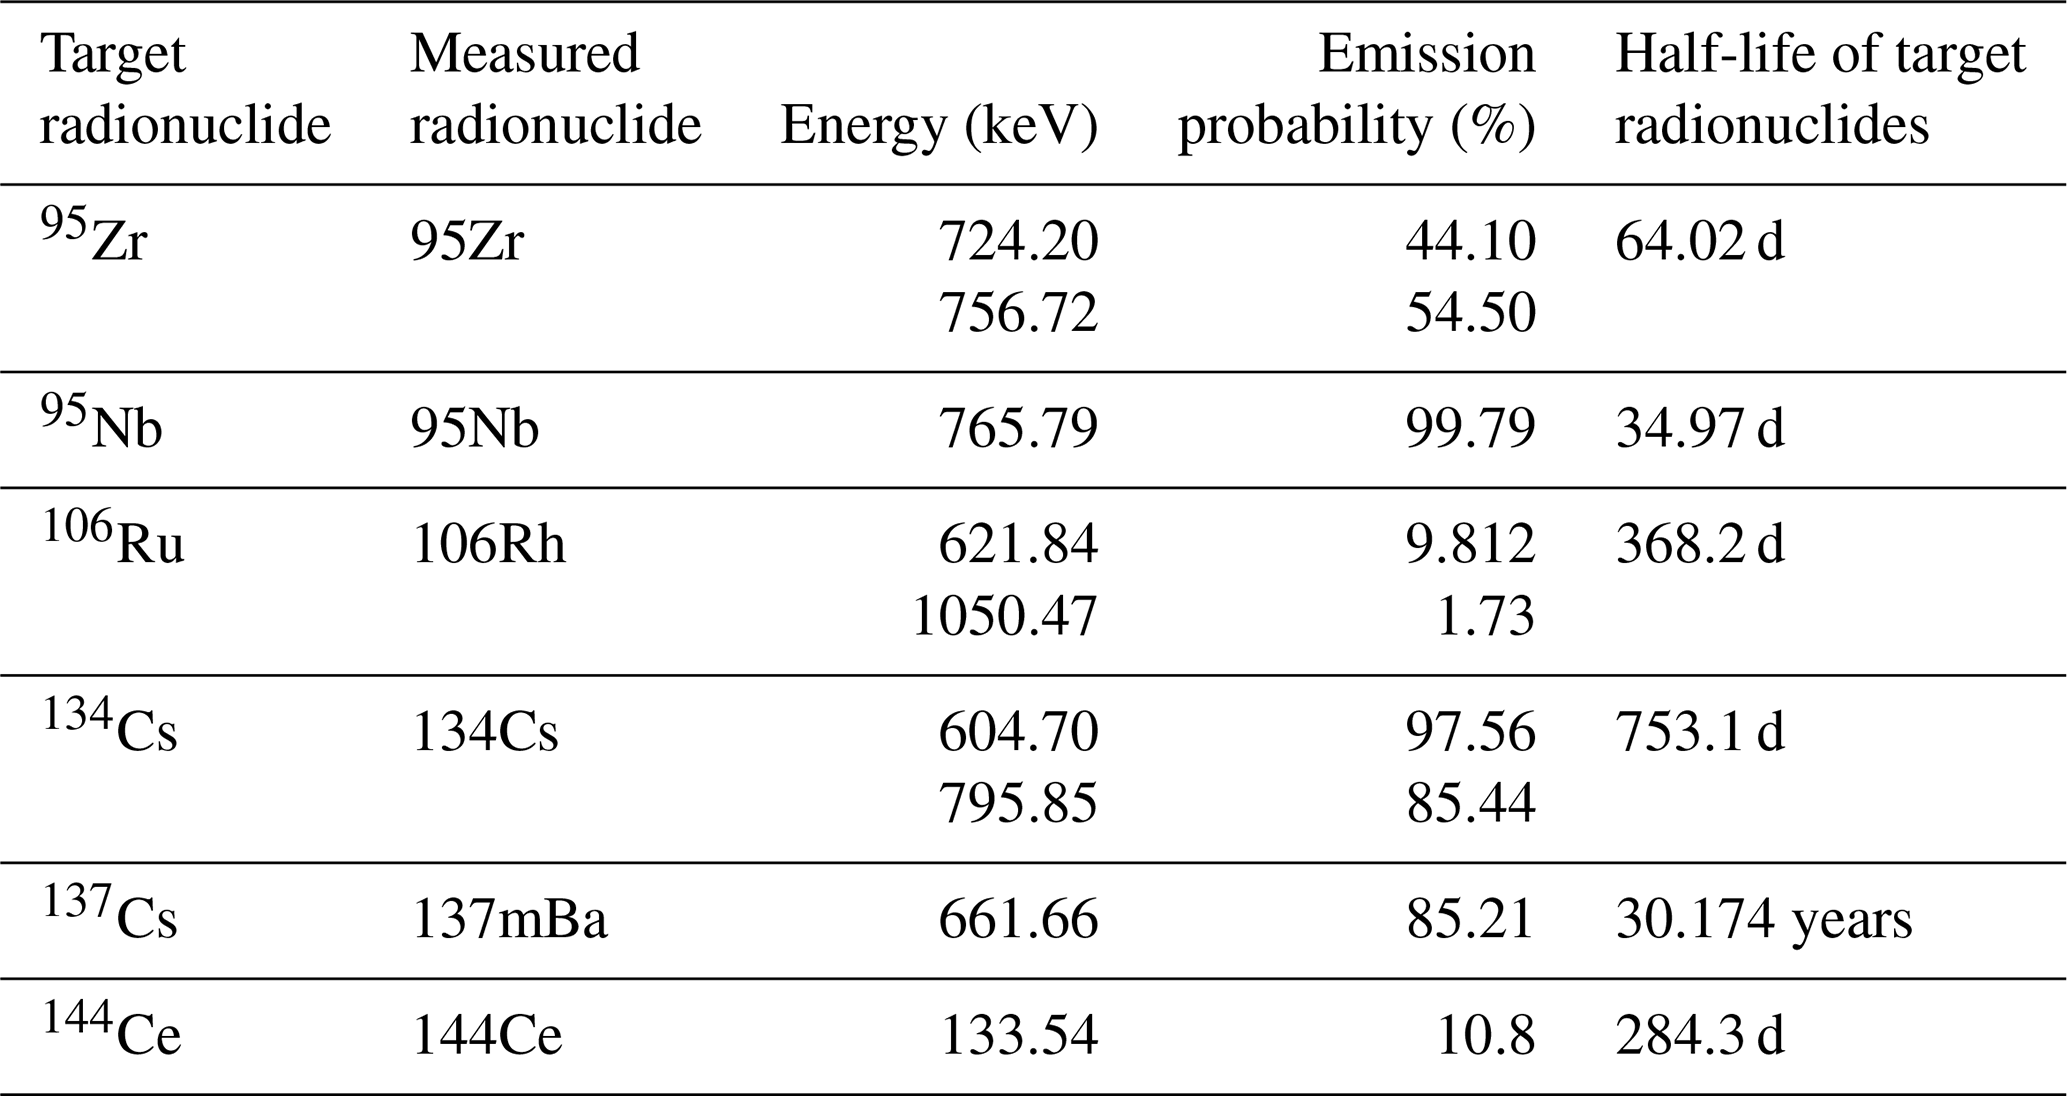
Decay radiation information from the master library, integrated in the spectrum-analysing software tool Gelicam (EG&G, ORTEC, USA), was used in the gamma analyses. Activities of 106Ru and 137Cs in the samples were estimated via their gamma radiation emitting progenies, namely 106Rh and 137mBa, respectively.
Calibration of the spectrometer was conducted using certified standards (soil equivalent multi-radionuclide standard; V. G. Khlopin Radium Institute, Russia). Quality assurance and/or quality control procedures included regular monitoring of the system performance, efficiency, background and full width at half maximum (FWHM) for the 144Ce, 137Cs and 95Nb photo peaks. To validate the accuracy and precision of the method employed for 137Cs activity concentration measurements, quality control samples (i.e. different matrix samples including water, soil and sawdust spiked with known certified activities of radionuclides) and certified reference materials (CRMs) were analysed alongside the samples. Analysis of IAEA CRMs showed satisfactory results for radionuclide mean activity concentrations with results being within the 95 % confidence interval; the limit of detection for 137Cs in all samples was 1 Bq. Subsamples were analysed in a different laboratory (USSR Ministry of Defence), and the results for the two laboratories were within the error of determination.
The density of soil contamination (Bq m−2) was calculated from the estimated radionuclide activity concentrations in soils. It has been estimated that uncertainty from using a single soil sample (of the area 0.015 m2) to estimate the value of the contamination density of a sampling site (the area from which five cores were collected) may be up to 50 % (IAEA, 2019).
The data described in this paper (Kashparov et al., 2020) comprise the exposure dose rate (mR h−1), date of gamma activity measurement, density of contamination (Bq m−2) of 95Zr, 95Nb, 106Ru, 134Cs, 137Cs and 144Ce (with associated activity measurement uncertainties), and density of contamination of 134+137Cs in an exchangeable form. Reported radionuclide activity concentration values are for the date of measurement (samples were analysed within 1.5 months of collection).
For the presentation below, radionuclide activity concentrations have been decay corrected to 6 May 1986 (the date on which releases from the reactor in effect stopped), using the following equation:
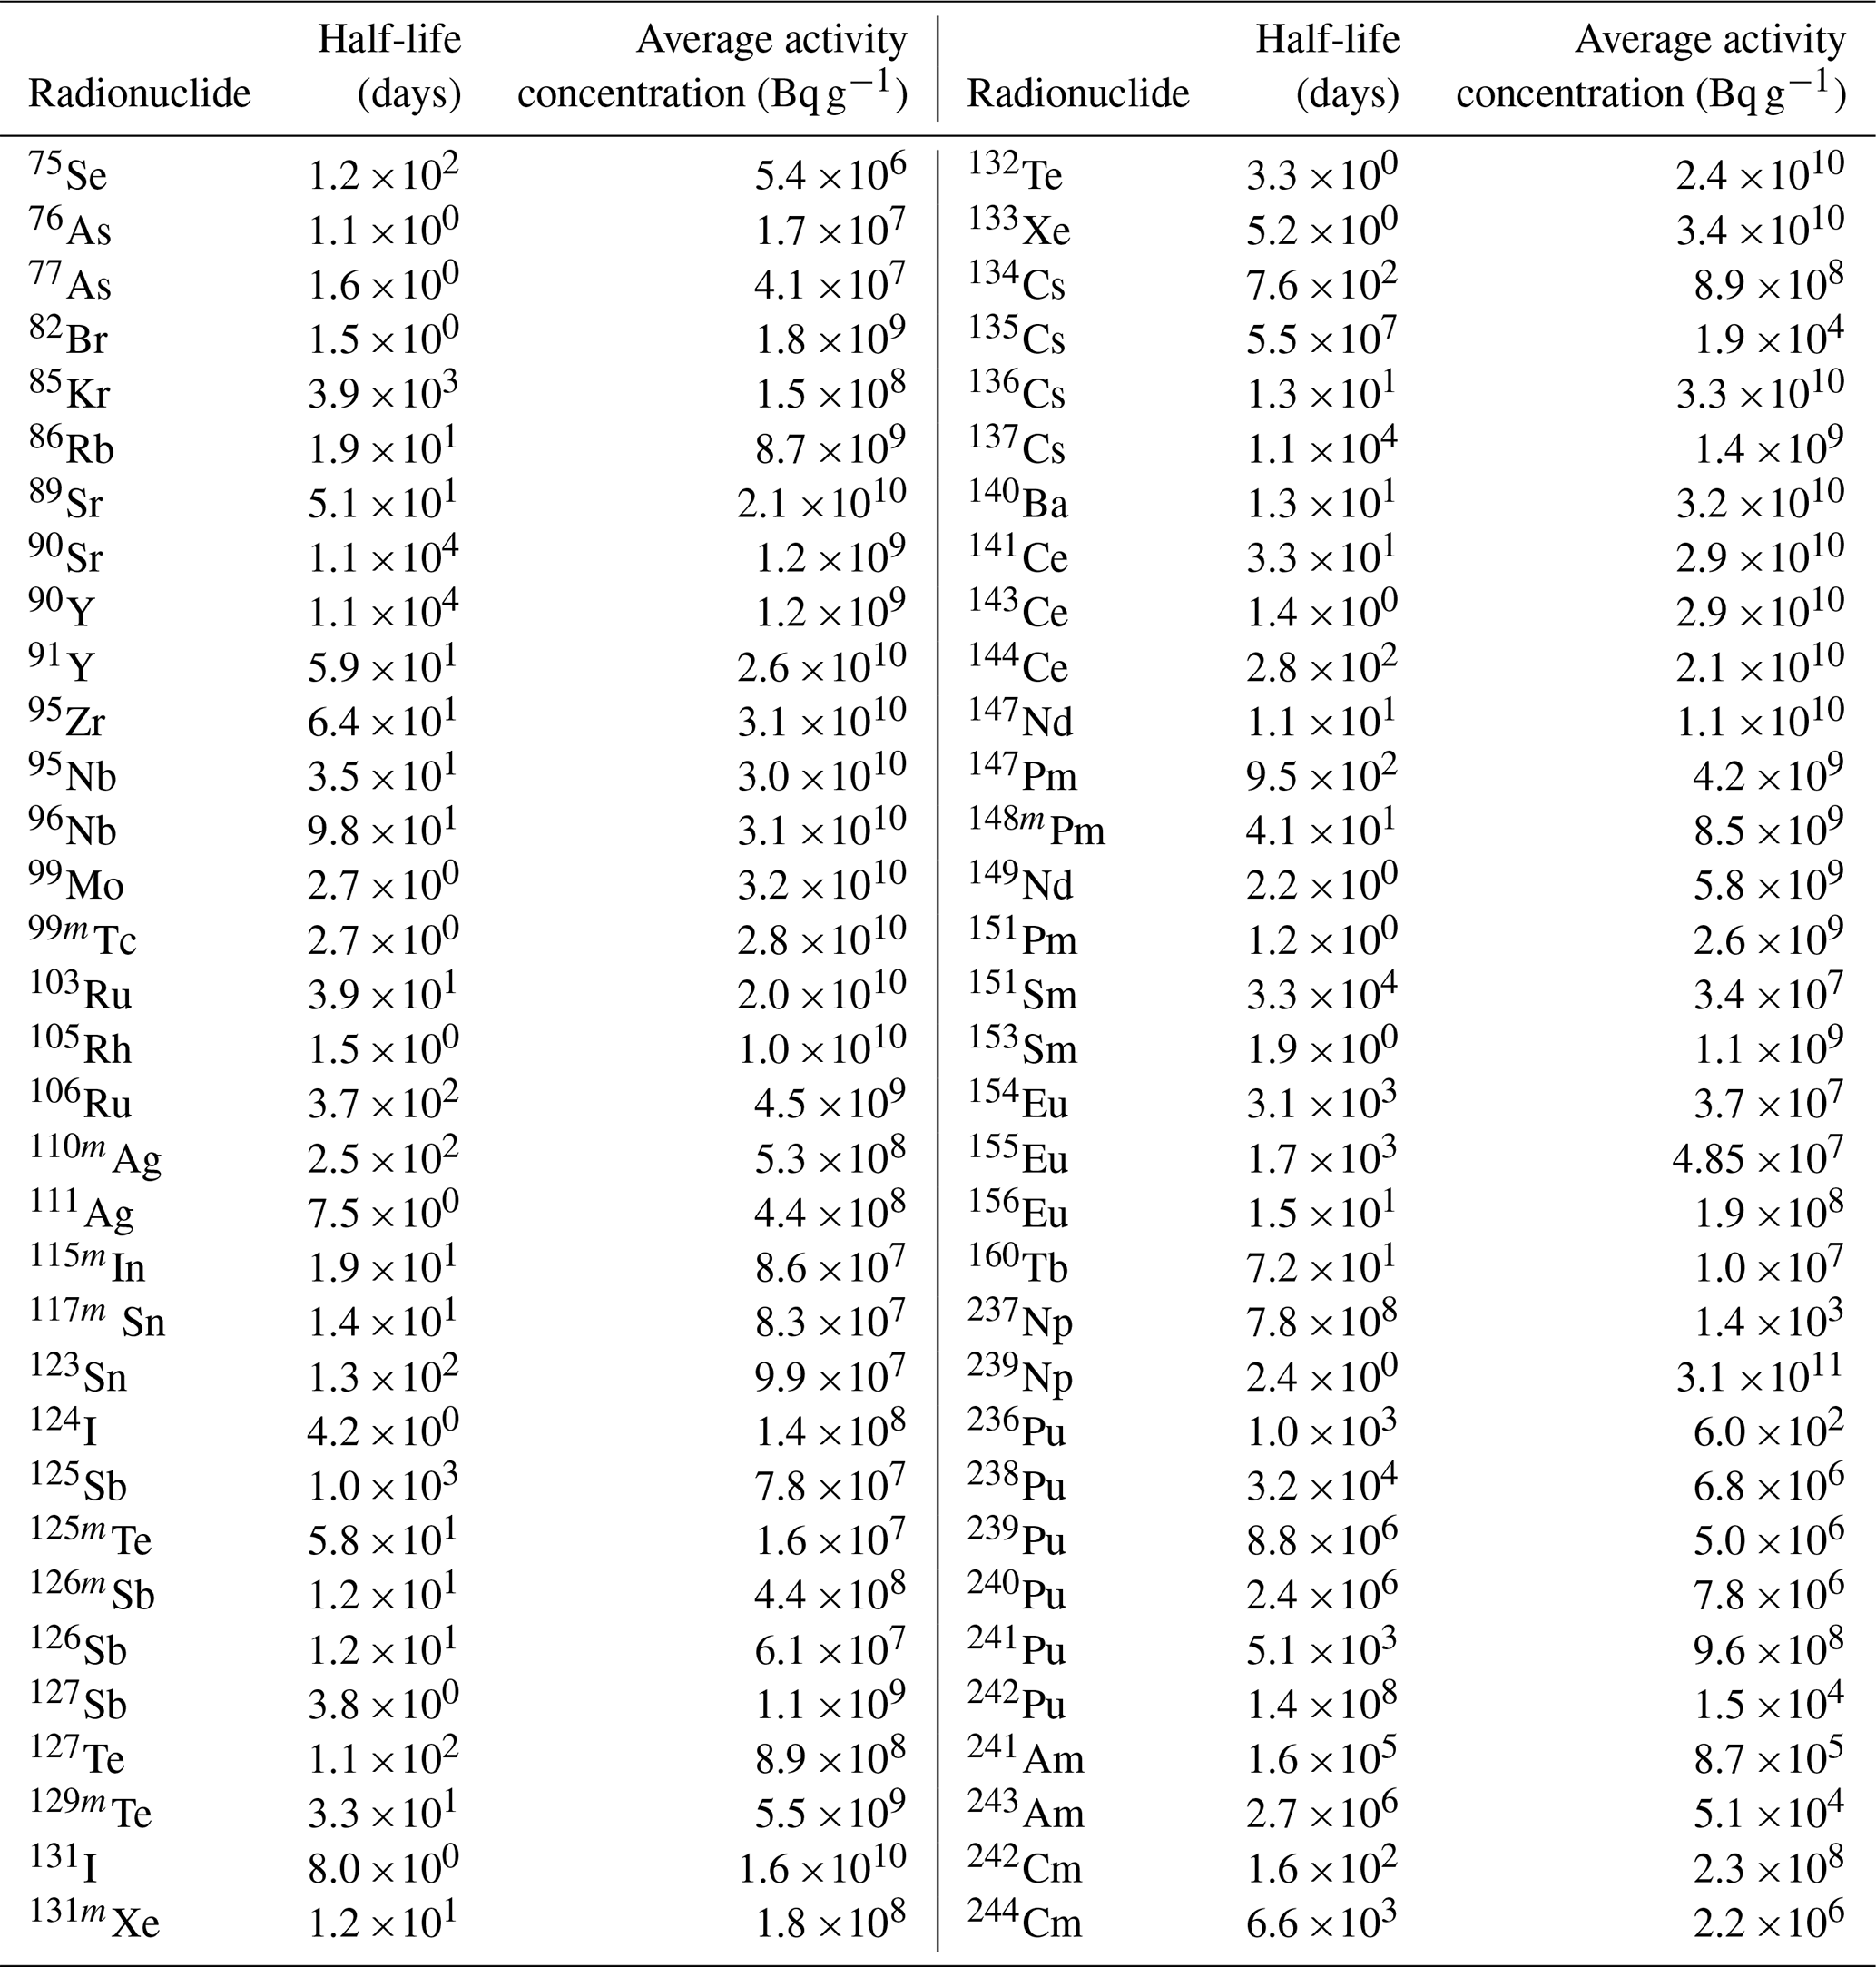
where AT equals the radionuclide activity concentration at the time of measurement (t); AO is the activity concentration on 6 May 1986, and λ is the decay constant (i.e. 0.693/radionuclide physical half-life; see Table 1 for radionuclide half-lives).

Figure 5Relationship between fallout density of 144Ce (1) and 137Cs (2) and distance from the ChNPP towards the south (a) (150–210∘), the west (b) (240–300∘) and the north (c) (330–30∘).
Table 1The average activity concentrations of radionuclides with half-life d estimated in the fuel of the ChNPP number four reactor recalculated for 6 May 1986 (Begichev et al., 1990).
2.3 Results
The contamination density of 144Ce and 137Cs are presented in Figs. 3–4; the activity concentrations, as presented in the figures, have been decay corrected to 6 May 1986. The density of 144Ce contamination decreased exponentially with distance (Figs. 3 and 5) because 144Ce was released in the fuel particles, which had a high dry deposition velocity (Kuriny et al., 1993). The fallout density of 144Ce decreased by 7–9 times, between the 5 and 30 km sampling sites, and by 70–120 times, between the 5 and 60 km sampling sites (Fig. 5).
The fallout density of 137Cs decreased similarly to that of 144Ce along the southern “fuel trace” (Fig. 5a). The contamination density of 137Cs along the western trace decreased less than the 144Ce contamination density due to the importance of the condensation component of the fallout in this direction (with a resultant R2 value for the relationship between 137Cs and a distance lower than for 144Ce and 137Cs in different directions; Fig. 5b). The comparative decrease in 137Cs contamination density along the northern trace (mixed fuel and condensation fallout) was in between that of the southern and western traces (Fig. 5c), although there were caesium hotspots in the northern condensation trace (Figs. 4 and 5c). The activity ratio of 144Ce to 137Cs decreased with the distance from the ChNPP due to the condensation component being more important for 137Cs; the condensation component had a lower deposition velocity compared with the fuel particles (with which 144Ce was associated; Fig. 6). The ratio 144Ce ∕ 137Cs for the Chernobyl reactor fuel on 6 May 1986 can be estimated to be 15 from the data presented in Table 1. The ratio was about 11 (geometric mean of 1167 measurements) in the Chernobyl fuel particles larger than 10 µm due to the caesium escape during the high-temperature annealing (Kuriny et al., 1993). The ratio of 144Ce ∕ 137Cs in the deposition exceeded five in the southeast and in the south up to 60 and 30 km from the ChNPP, respectively (Fig. 6). Thus, activities of 134,137Cs in the condensate and in the fuel components in these directions were of approximate equal importance. The condensation component of caesium was more important in the north and dominated in the west (Fig. 8; Loshchilov et al., 1991; Kuriny et al., 1993); the more rapidly changing 144Ce ∕ 137Cs ratios in these directions are reflective of this (Fig. 6).
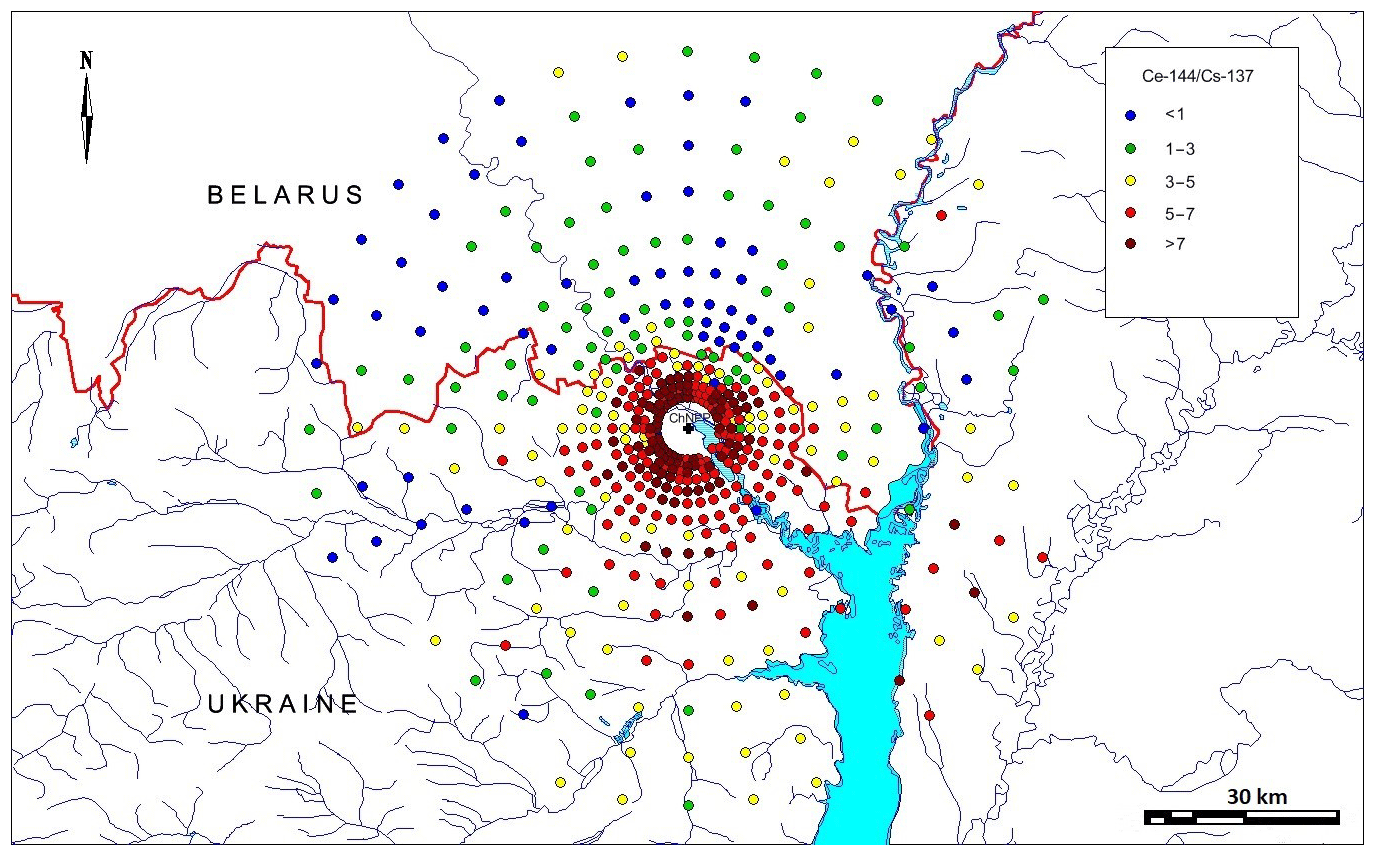
Figure 6144Ce ∕ 137Cs ratio within the 60 km zone around the ChNPP decay corrected to 6 May 1986.
A good correlation (R2=0.98) was observed between fallout densities of 95Zr (estimated from the activity concentration of the daughter product 95Nb)1 and 144Ce (Fig. 7a) because both radionuclides were released and deposited as fuel particles (Kuriny et al., 1993; Kashparov et al., 2003; Kashparov, 2003). The fallout density ratio of 144Ce ∕ 95Zr , decay corrected to 6 May 1986, was similar to that estimated for the Chernobyl reactor fuel (144Ce ∕ 95Zr=0.68; Table 1).
The activity ratio of 144Ce to 106Ru in the fallout was correlated (R2=0.93) and was 3.9±0.4 decay corrected to 6 May 1986 (Fig. 7b). The value was close to the ratio of 144Ce ∕ 106Ru estimated for the fuel in the ChNPP number four reactor (4.7; Table 1). Excess 106Ru activity relative to 144Ce activity in some soil samples was observed, likely due to the presence of “ruthenium particles” (a matrix of iron group elements with a high content of 103,106Ru; Kuriny et al., 1993; Kashparov et al., 1996).
There was a weak correlation (R2=0.41) between 144Ce and 137Cs activities in the fallout because, as already discussed, caesium was largely deposited as condensation particles while cerium was deposited in fuel particles only. However, in highly contaminated areas close to the ChNPP, a significant part of the 137Cs was deposited as fuel particles and the activity ratio of 144Ce ∕ 137Cs of 9.1 (Fig. 7c) broadly corresponded to that of 15 in the reactor fuel (Table 1).
Different radioisotopes of caesium escaped from the nuclear fuel and were deposited in the same way. This similar behaviour of 134Cs and 137Cs resulted in a strong correlation (R2=0.99) between their activities in the soil samples, and the ratio of 134Cs ∕ 137Cs was similar to that estimated for the reactor fuel (0.64; Table 1).
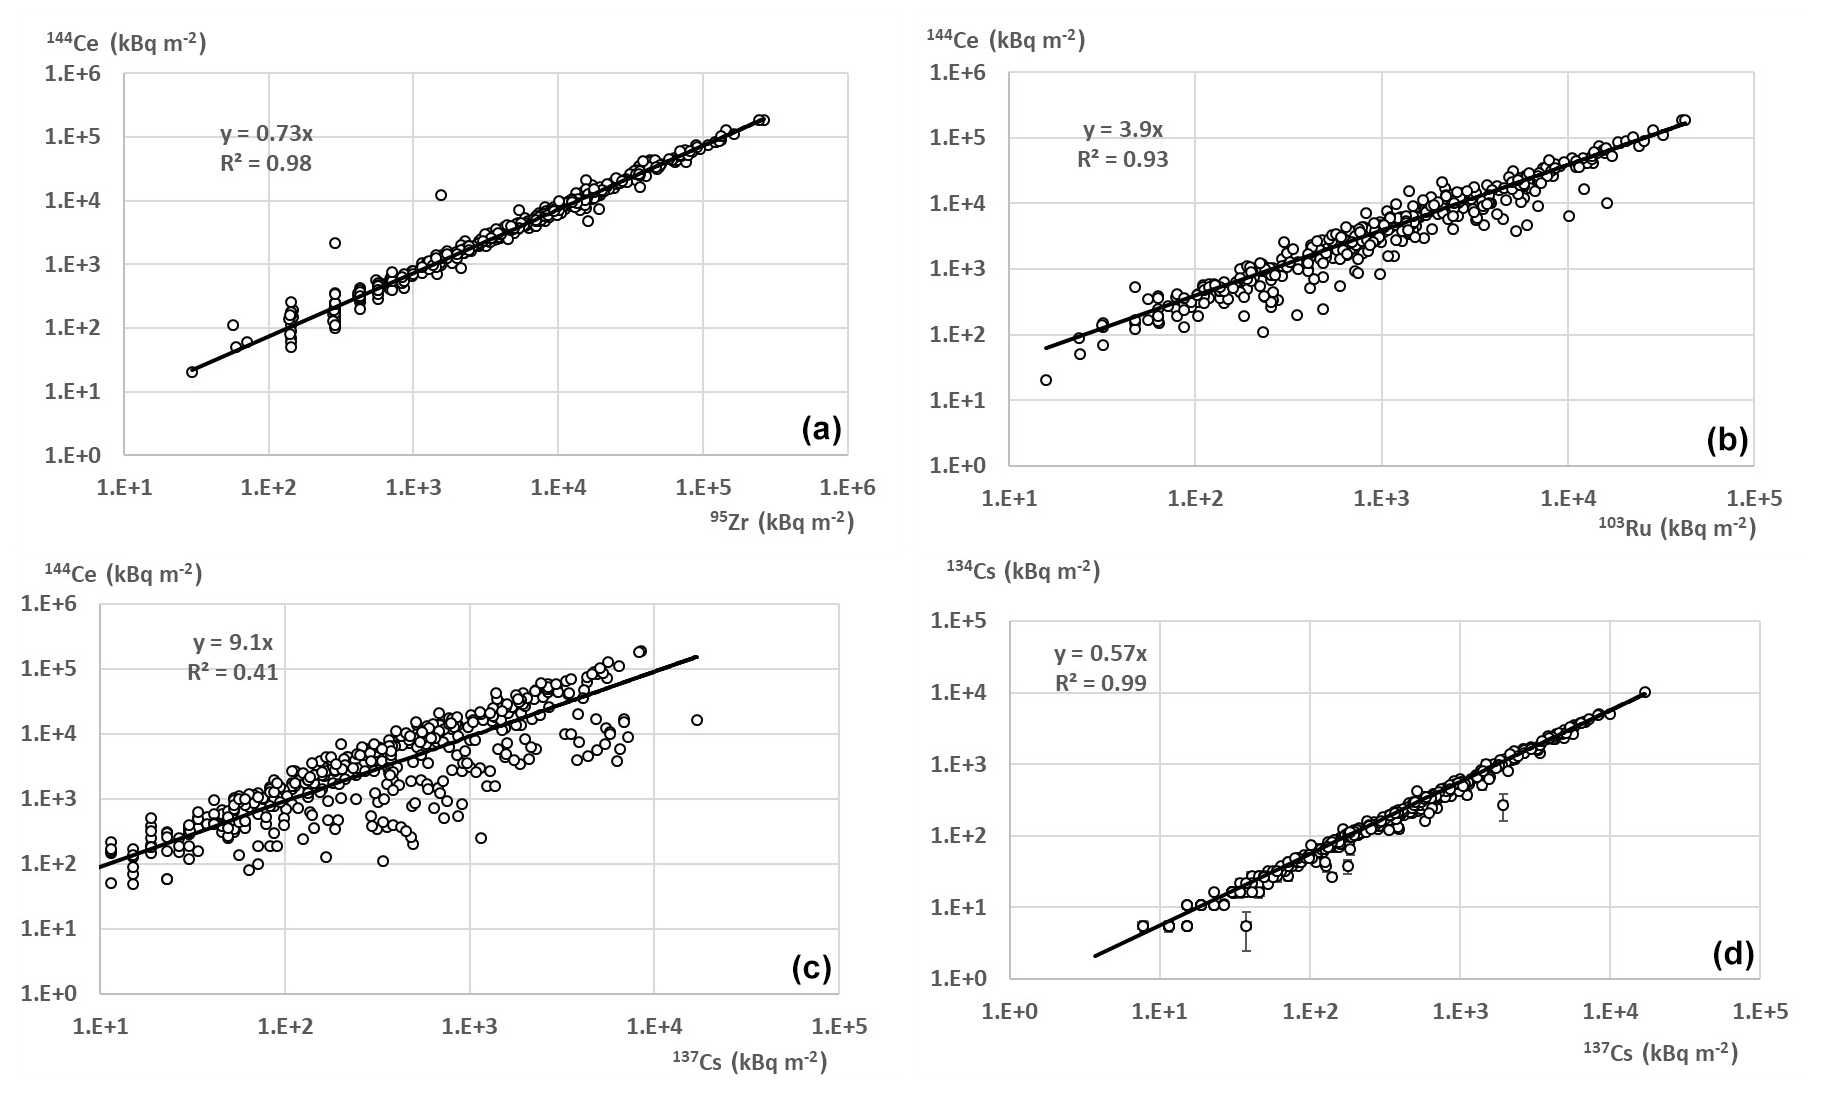
Figure 7Correlation between deposition densities of different radionuclides decay corrected to 6 May 1986.
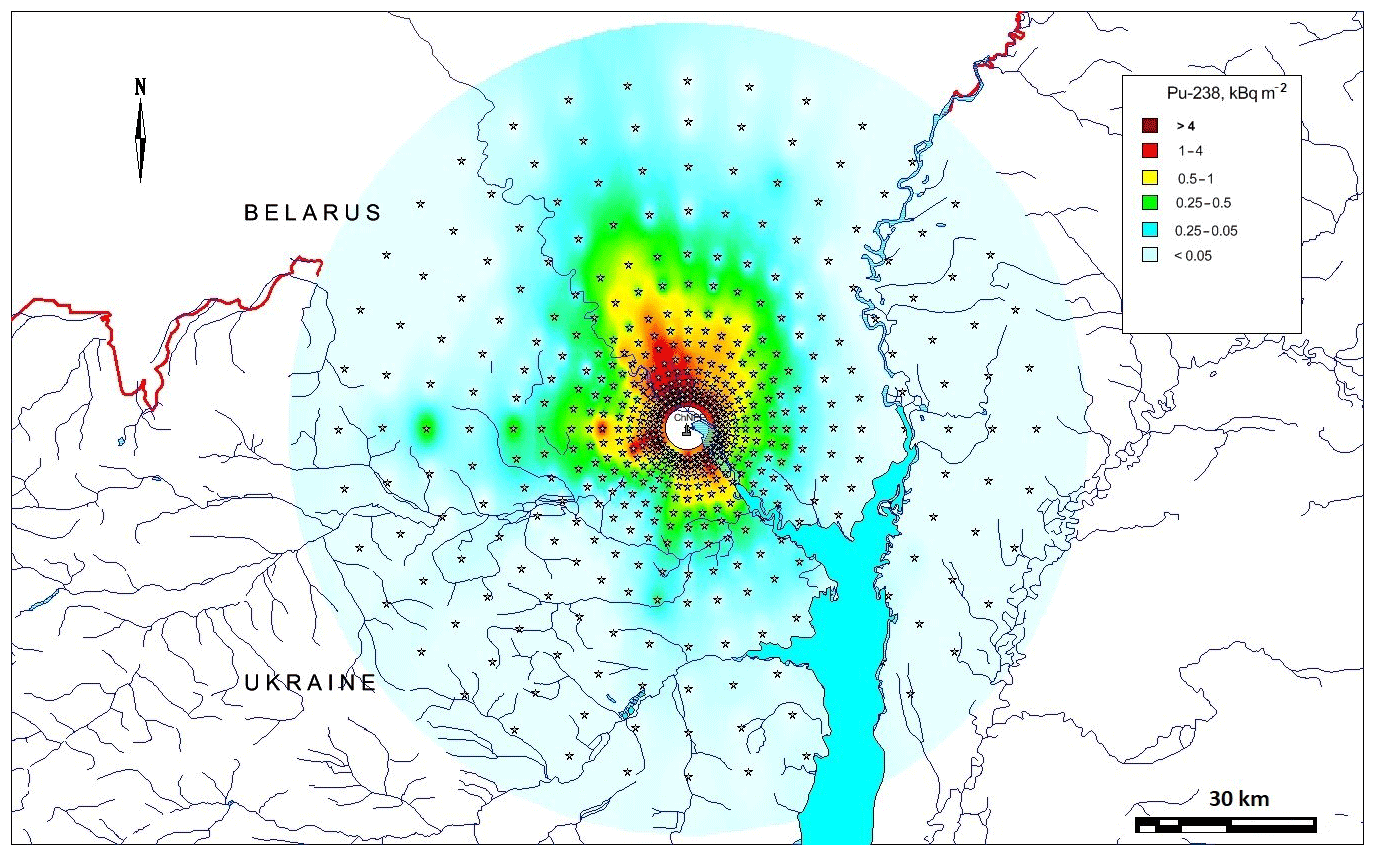
Figure 8The fallout density of 238Pu (kBq m2) corrected to 6 May 1986; estimated from measurements of 144Ce in the soil and estimated activity concentrations in the fuel of the ChNNP reactor number four (note that no data were available for less than 5 km from ChNPP and no interpolation for this area has been attempted).
Apart from adding to the available data, with which contamination maps for the CEZ and surrounding areas can be generated (e.g. Kashparov et al., 2018), the data discussed in this paper can be used to make predictions for less well studied radionuclides.
The determination of beta- and alpha-emitting radionuclides in samples requires radiochemical extraction, which is both time-consuming and relatively expensive. Large-scale surveys of the deposition of alpha- and beta-emitting radionuclides are therefore more difficult than those for gamma-emitting radionuclides and are not conducive to responding to a large-scale accident such as that which occurred at Chernobyl. Above we have demonstrated that the deposition behaviour of different groups of radionuclides was determined by the form in which they were present in the atmosphere (i.e. associated with fuel particles or condensation particles).
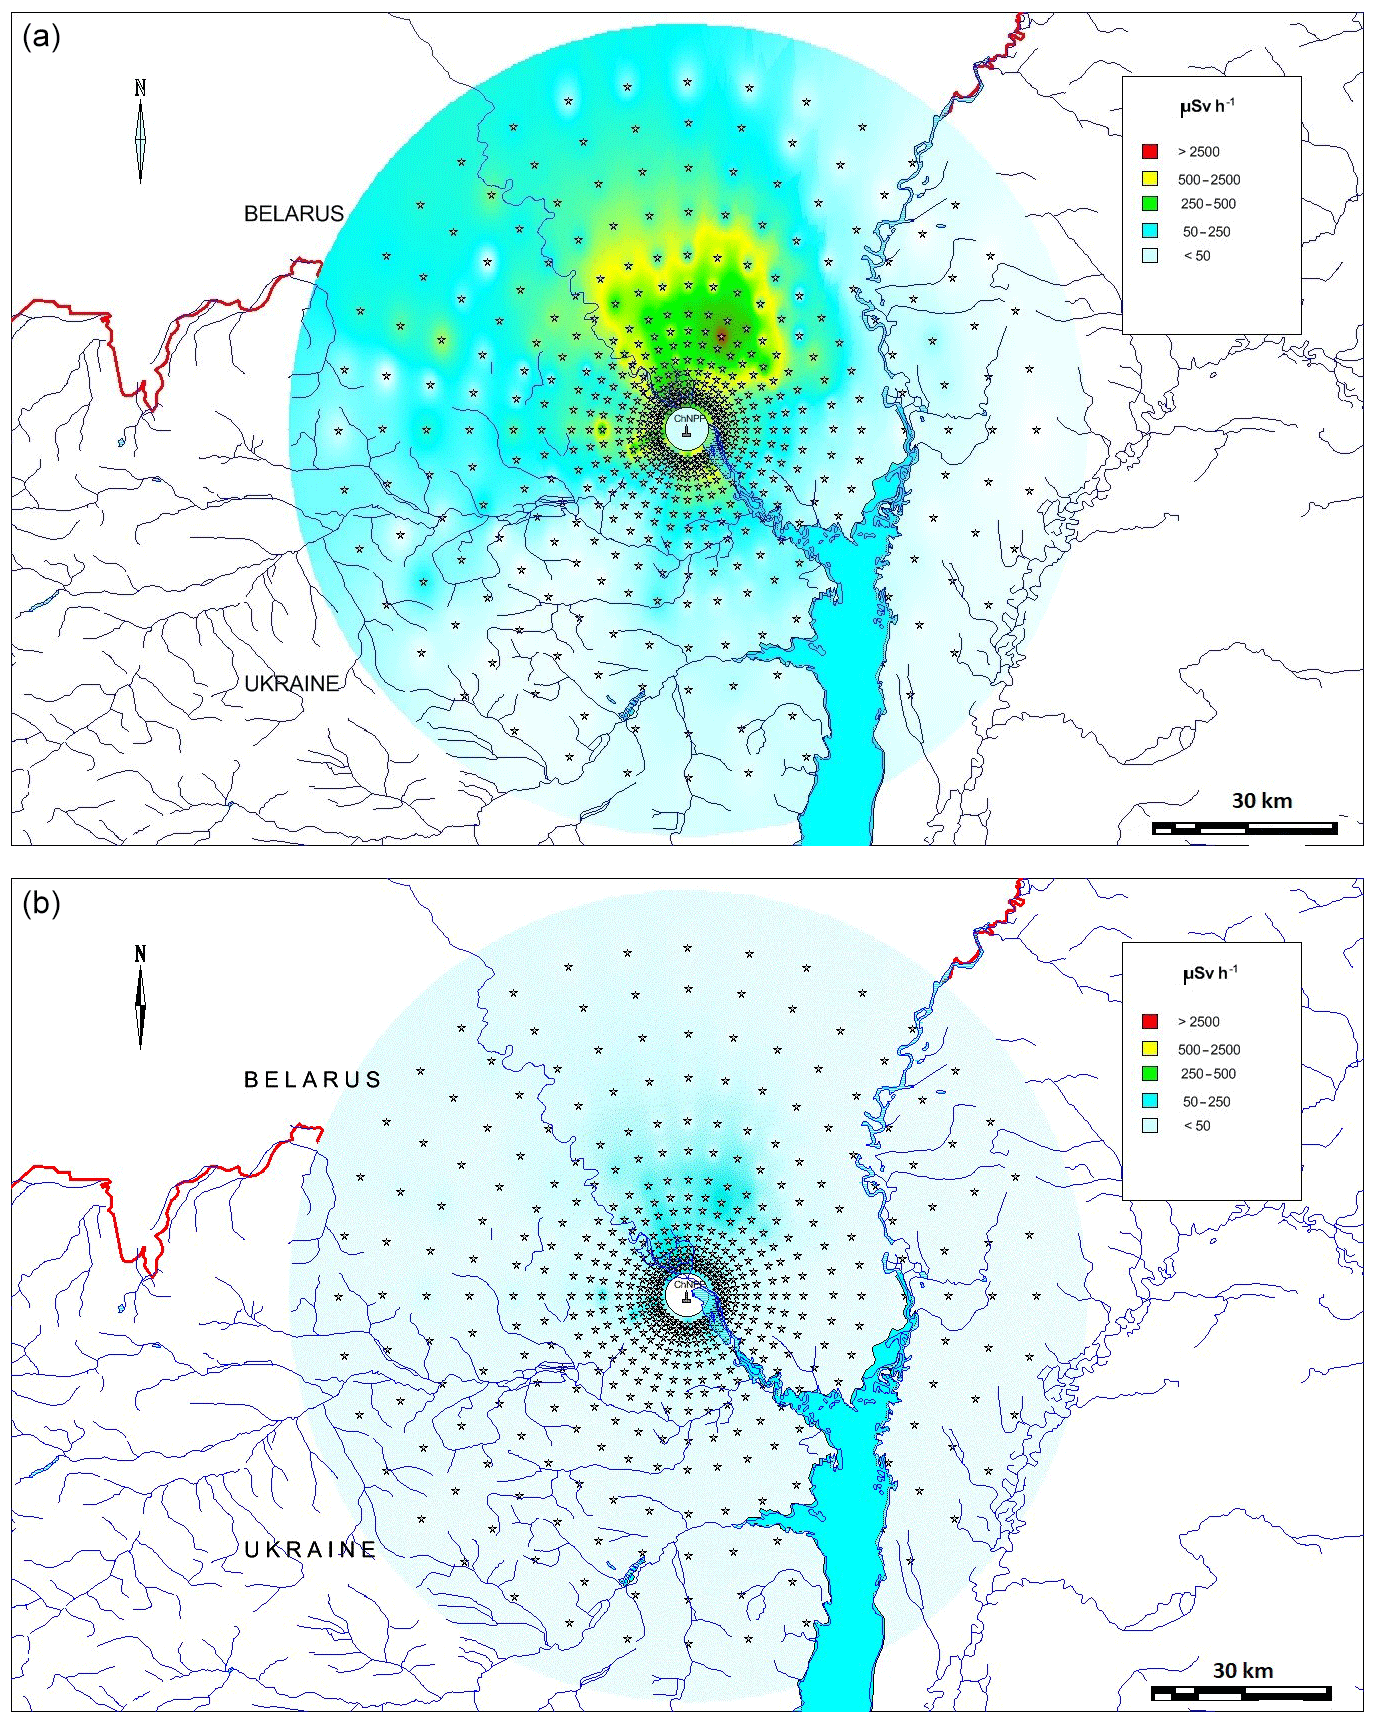
Figure 9Spatial distribution, interpolated as for Fig. 8, of the effective dose rate within the 60 km zone around the ChNPP on 10 May 1986 (a) and 10 August 1986 (b). Note that no data were available for less than 5 km from ChNPP, and no interpolation for this area has been attempted.
We propose that 144Ce deposition can be used as a marker of the deposition of fuel particles; fuel particles were the main deposition form of nonvolatile radionuclides (i.e. Sr, Y, Nb, Ru, La, Ce, Eu, Np, Pu, Am and Cm). Therefore, using 144Ce activity concentrations determined in soil samples and estimates of the activities in reactor fuel, we can make estimates of the deposition of radionuclides such as Pu isotopes and Cm that have been relatively less studied. For example, activity ratios of 238Pu, 239Pu, 240Pu and 241Pu to 144Ce, at the time of measurement would be , , and , respectively (estimated by decay correcting data presented in Table 1). Fallout densities of these plutonium isotopes can therefore be calculated for all sampling points where the deposition density of 144Ce was measured either in this study (e.g. Fig. 3) or in other data sets. As an example of the application of the data in this manner, Fig. 8 presents the estimated deposition of 238Pu; Fig. 8 was prepared using the triangulated irregular network (TIN) interpolation within MapInfo. The first maps of the 90Sr and 239+240Pu surface contamination from the Chernobyl accident were prepared in the frame of an international project (IAEA, 1992) in a similar way.
The dynamic spatial distribution of the gamma dose rate can be reconstructed using the data on radionuclide contamination densities (Kashparov et al., 2019) in combination with the ratios between the activities of radionuclides in fuel and in condensed components of the Chernobyl fallout (Table 1) and also the dose coefficients for exposure to contaminated ground surfaces, (Sv s−1 Bq m−2; Eckerman and Ryman, 1993). A total of 5 d after the deposition, the following radionuclides were major contributors (about 95 %) to the gamma dose rate: 136Cs, 140La, 239Np, 95Nb, 95Zr, 131I, 148m Pm, 103Ru, 140Ba and 132Te. After 3 months the major external dose contributors were 95Nb, 95Zr, 148mPm, 134Cs, 103Ru, 137mBa, 110mAg, 136Cs and 106Rh. A total of 3 years thereafter, the major contributors were 137mBa, 134Cs, 106Rh, 110mAg and 154Eu. At the present time, the gamma dose can be estimated to be mainly (99 %) due to the gamma-emitting daughter radionuclide of 137Cs (137mBa). Bondar (2015), from a survey of the CEZ along the Ukrainian–Belarussian border, showed a good relationship between 137Cs contamination (ACs−137; in the range of 17–7790 kBq m−2) and ambient dose rates at 1 m above the ground (Dext; in the range of 0.1–6.0 µSv h−1). The relationship was described by the following equation with a correlation coefficient of 0.99:
As an example of the application of the data in this manner, Fig. 9 presents the estimated external effective gamma dose rate 5 and 95 d after the cessation of the radioactive releases from the reactor on 6 May 1986.
The estimated effective dose rate values exceed the evacuation dose criteria of 50 µSv h−1 over a large area (especially in the north and west) of the 60 km area around the ChNPP on 10 May 1986 (Fig. 9a); as discussed above, a dose rate of 50 µSv h−1 on 10 May 1986 equated to a total dose, over the first year after the accident, of 50 mSv – the value used to define areas for evacuation. On 10 August 1986 the area estimated to exceed 50 µSv h−1 was restricted to the north (Fig. 9b). The dose rate decreased quickly after the accident due to the radioactive decay of short-lived radionuclides. The dominance of these short-lived radionuclides and a lack of knowledge about the radionuclide composition of the fallout made it difficult, in 1986, to estimate the external dose rates to the public for an evaluation date of 10 May 1986 (most dose rate measurements were made after 10 May). This likely resulted in the overestimation of dose rates for some villages in 1986, leading to their evacuation when the external dose rate would not have been in excess of the 50 mSv limit used by the authorities.
There is a need for deposition data for the CEZ and surrounding areas for a number of reasons. These include exploring the risks associated with future management options for the CEZ (e.g. management of the water table, forest fire prevention, increased tourism, etc.) and also the return of abandoned areas outside the CEZ to productive use. The long-term effect of radiation exposure on wildlife in the CEZ is an issue of much debate (e.g. see the discussion in Beresford et al., 2019). Improved data, which can be used to map the contamination of a range of radionuclides, will be useful in improving dose assessments to wildlife (including retrospective assessments of earlier exposure rates). The CEZ has been declared a “radioecological observatory” (Muikku et al., 2018; where a radioecology observatory is defined as a radioactively contaminated field site that provides a focus for joint, long-term radioecological research). The open provision of data, as described in this paper, fosters the spirit of collaboration and openness required to make the observatory site concept successful and joins a growing amount of data made available for the CEZ (Kashparov et al., 2017; Fuller et al., 2018; Kendrick et al., 2018; Gaschak et al., 2018; Beresford et al., 2018; Lerebours and Smith, 2019).
The data described here (https://doi.org/10.5285/a408ac9d-763e-4f4c-ba72-73bc2d1f596d; Kashparov et al., 2019) are freely available for registered users of the Natural Environment Research Council (NERC) Environmental Information Data Centre (https://eidc.ac.uk/, last access: 17 August 2020) under the terms of the Open Government Licence.
Table A1A detailed explanation of the column headings and units (where applicable) which accompany the data (Kashparov et al., 2019).

Table A2Decay radiation information from the master library, integrated into a spectrum-analysing software tool, Gelicam (EG&G ORTEC, USA), used in gamma analyses. Activities of 106Ru and 137Cs in samples were estimated via their gamma-radiation-emitting progenies, namely 106Rh and 137mBa, respectively.
Soil samples were collected by the USSR Ministry of Defence and delivered to UIAR. Sample preparation, analysis and data interpretation were carried out by UIAR staff. In addition, VK, SL and VP prepared the samples and measured radionuclide activity concentrations in the samples. VK analysed the results, and MZ created the database and prepared the figures (maps) in the paper. The paper was prepared by JSC, NAB, VK, SL and MZ.
The authors declare that they have no conflict of interest.
Funding for the UKCEH staff enabled their contributions to preparing this paper, and the accompanying data set (Kashparov et al., 2019) was provided by the TREE project (http://www.ceh.ac.uk/tree, last access: 17 August 2020). This research was funded by NERC, the Environment Agency (EA) and Radioactive Waste Management Ltd under the RATE programme and associated iCLEAR (https://tree.ceh.ac.uk/content/iclear-0, last access: 17 August 2020; funded by NERC) projects.
This research has been supported by the Natural Environment Research Council (TREE and iCLEAR projects; grant nos. NE/L000318/1 and NE/R009619/1, respectively), the Environment Agency (TREE project) and the Radioactive Waste Management Ltd (TREE project).
This paper was edited by Giulio G. R. Iovine and reviewed by four anonymous referees.
Aleksakhin, R. M., Buldakov, L. A., Gubanov, V. A., Drozhko, E. G., Ilyin, L. A., Kryshev, I. I., Linge, I. I., Romanov, G. N., Savkin, M. N., Saurov, M. M., Tikhomirov, F. A., and Kholina, Yu. B.: Major radiation accidents: consequences and protective measures, edited by: Ilyin, L. A. and Gubina, V. A., Moscow, Publishing House IzdAT, 752 pp., available at: http://elib.biblioatom.ru/text/krupnye-radiatsionnye-avarii_2001/go,0/ (last access: 17 August 2020), 2001.
Begichev, S. N., Borovoy, A. A., Burlakov, E. V., Gavrilov, S. L., Dovbenko, A. A., Levina, L. A., Markushev, V. M., Marchenko, A. E., Stroganov, A. A., and Tataurov, A. L.: Preprint IAE-5268/3: Reactor Fuel of Unit 4 of the Chernobyl NPP (a brief handbook), Kurchatov In st. Atomic Energy, 1990.
Beresford, N. A., Gaschak, S., Barnett, C. L., Maksimenko, A., Guliaichenko, E., Wells, C., and Chaplow, J. S.: A “Reference Site” in the Chernobyl Exclusion Zone: radionuclide and stable element data, and estimated dose rates NERC-Environmental Information Data Centre, https://doi.org/10.5285/ae02f4e8-9486-4b47-93ef-e49dd9ddecd4, 2018.
Beresford, N. A., Scott, E. M., and Copplestone, D.: Field effects studies in the Chernobyl Exclusion Zone: Lessons to be learnt, J. Environ. Radioact., 211, 105893, https://doi.org/10.1016/j.jenvrad.2019.01.005, 2019.
Bondar, Yu.: Field studies in the Chernobyl exclusion zone along the Belarusian border (dosimetric monitoring and soil radiation analysis), Report of Polesye State Radiation and Ecological Reserve, Belarus, Khoiniki, 2015.
Chaplow, J. S., Beresford, N. A., and Barnett, C. L.: Post-Chernobyl surveys of radiocaesium in soil, vegetation, wildlife and fungi in Great Britain, Earth Syst. Sci. Data, 7, 215–221, https://doi.org/10.5194/essd-7-215-2015, 2015.
Eckerman, K. F. and Ryman, J. C.: External exposure to radionuclides in air, water, and soil, Federal guidance report No. 12, EPA-402-R-93-081, Oak Ridge National Laboratory, Tennessee, USA, 238 pp., 1993.
Fuller, N., Smith, J. T., and Ford, A. T.: Effects of low-dose ionising radiation on reproduction and DNA damage in marine and freshwater amphipod crustaceans. NERC Environmental Information Data Centre, https://doi.org/10.5285/b70afb8f-0a2b-40e6-aecc-ce484256bbfb, 2018.
Gaschak, S. P., Beresford, N. A., Barnett, C. L., Wells, C., Maksimenko, A., and Chaplow, J. S.: Radionuclide data for vertebrates in the Chernobyl Exclusion Zone NERC-Environmental Information Data Centre, https://doi.org/10.5285/518f88df-bfe7-442e-97ad-922b5aef003a, 2018.
Hilpert, K., Odoj, R., and Nurnberg, H. W.: Mass spectrometric study of the potential of Al203/Si02 additives for the retention of cesium in coated particles, Nucl. Technol., 61, 71–77, 1983.
IAEA: International Chernobyl Project: Technical Report, International Advisory Committee, Vienna, 1991.
IAEA: International Chernobyl project, technical report, ISBN 92-0-400192-5, available at: http://www-pub.iaea.org/MTCD/publications/PDF/Pub886_web/Start.pdf (last access: 17 August 2020), 1992.
IAEA: Environmental consequences of the Chernobyl accident and their remediation: twenty years of experience, Report of the Chernobyl Forum Expert Group “Environment”, edited by: Anspaugh, L. and Balonov, M., Radiological assessment reports series, IAEA, STI/PUB/1239, 166 pp., 2006.
IAEA: Guidelines on soil and vegetation sampling for radiological monitoring, Technical Reports Series No. 486, International Atomic Energy Agency, Vienna, 247 pp., available at: https://www.iaea.org/publications/12219/guidelines-on-soil-and-vegetation-sampling-for-radiological-monitoring (last access: 17 August 2020), 2019.
Izrael, Yu. A., Vakulovsky, S. M., Vetrov, V. A., Petrov, V. N., Rovinsky, F. Ya., and Stukin, E. D.: Chernobyl: Radioactive Contamination of the Environment, Gidrometeoizdat publishers, Leningrad, 223 pp., 1990 (in Russian).
Kashparov, V. A.: Hot Particles at Chernobyl, Environ. Sci. Pollut. R., 10, 21–30, 2003.
Kashparov, V. A., Ivanov, Y. A., Zvarich, S. I., Protsak, V. P., Khomutinin, Y. V., Kurepin, A. D., and Pazukhin, E. M.: Formation of Hot Particles During the Chernobyl Nuclear Power Plant Accident, Nucl. Technol., 114, 246–253, 1996.
Kashparov, V. A., Lundin, S. M., Zvarich, S. I., Yoschenko, V. I., Levtchuk, S. E., Khomutinin, Yu. V., Maloshtan, I. N., and Protsak, V. P.: Territory contamination with the radionuclides representing the fuel component of Chernobyl fallout, Sci. Total Environ., 317, 105–119, https://doi.org/10.1016/S0048-9697(03)00336-X, 2003.
Kashparov, V., Levchuk, S., Zhurba, M., Protsak, V., Khomutinin, Y., Beresford, N. A., and Chaplow, J. S.: Spatial datasets of radionuclide contamination in the Ukrainian Chernobyl Exclusion Zone, NERC-Environmental Information Data Centre, https://doi.org/10.5285/782ec845-2135-4698-8881-b38823e533bf, 2017.
Kashparov, V., Levchuk, S., Zhurba, M., Protsak, V., Khomutinin, Y., Beresford, N. A., and Chaplow, J. S.: Spatial datasets of radionuclide contamination in the Ukrainian Chernobyl Exclusion Zone, Earth Syst. Sci. Data, 10, 339–353, https://doi.org/10.5194/essd-10-339-2018, 2018.
Kashparov, V., Levchuk, S., Zhurba, M., Protsak, V., Beresford, N. A., and Chaplow, J. S.: Spatial radionuclide deposition data from the 60 km radial area around the Chernobyl nuclear power plant, 1987, NERC Environmental Information Data Centre, https://doi.org/10.5285/a408ac9d-763e-4f4c-ba72-73bc2d1f596d, 2019.
Kendrick, P., Barçante, L., Beresford, N. A., Gashchak, S., and Wood, M. D.: Bird Vocalisation Activity (BiVA) database: annotated soundscapes from the Chernobyl Exclusion Zone, NERC Environmental Information Data Centre, https://doi.org/10.5285/be5639e9-75e9-4aa3-afdd-65ba80352591, 2018.
Kuriny, V. D., Ivanov, Y. A., Kashparov, V. A., Loschilov, N. A., Protsak, V. P., Yudin, E. B., Zhurba, M. A., and Parshakov, A. E.: Particle associated Chernobyl fall-out in the local and intermediate zones, Ann. Nucl. Energy, 20, 415–420, 1993.
Lerebours, A. and Smith, J. T.: Water chemistry of seven lakes in Belarus and Ukraine 2014 to 2016, NERC Environmental Information Data Centre, https://doi.org/10.5285/b29d8ab8-9aa7-4f63-a03d-4ed176c32bf3, 2019.
Loshchilov, N. A., Kashparov, V. A., Yudin, Y. B., Protsak, V. P., Zhurba, M. A., and Parshakov, A. E.: Experimental assessment of radioactive fallout from the Chernobyl accident, Sicurezza e Protezione, 25–26, 46–49, 1991.
Muikku, M., Beresford, N. A., Garnier-Leplace, J., Real, A., Sirkka, L., Thorne, M., Vandenhove, H., and Willrodt, C.: Sustainability and integration of radioecology—position paper, J. Radiol. Prot., 38, 152–163, https://doi.org/10.1088/1361-6498/aa9c0b, 2018.
National Report of Ukraine: Twenty-five Years after Chornobyl Accident: Safety for the Future, Kyiv KIM, 328 p., 2011.
Pontillon, Y., Ducros, G., and Malgouyres, P. P.: Behaviour of fission products under severe PWR accident conditions VERCORS experimental programme – Part 1: General description of the programme, Nucl. Eng. Des., 240, 1843–1852, https://doi.org/10.1016/j.nucengdes.2009.06.028, 2010.
Saji, G. A.: scoping study on the environmental releases from the Chernobyl accident (part I): Fuel particles, American Nuclear Society International Topical Meeting on Probabilistic Safety Analysis, PSA 05, 685–696, 2005.
Salbu, B., Krekling, T., Oughton, D. H., Ostby, G., Kashparov, V. A., Brand, T. L., and Day, J. P.: Hot Particles in Accidental Releases from Chernobyl and Windscale Nuclear Installations, Analyst, 119, 125–130, 1994.
Talerko, N.: Mesoscale modelling of radioactive contamination formation in Ukraine caused by the Chernobyl accident, J. Env. Radioactivity, 78, 311–329, 2005.
UIAR: The map of the 30-km Chernobyl zone terrestrial density of contamination with cesium-137 (in 1997), UIAR, Kyiv, Ukraine, 1998.
United Nations Scientific Committee on the Effects of Atomic Radiation, UNSCEAR, Sources and effects of ionizing radiation, Report to the General Assembly with Scientific Annexes, volume II, Annex D. Health effects due to radiation from the Chernobyl accident, United Nations, New York, 178 pp., 2008.
Niobium-95 ( d) is the daughter radionuclide of 95Zr ( d), and the ratio of their activities at an equilibrium equals 95Nb ∕ 95Zr = 2.1.