the Creative Commons Attribution 4.0 License.
the Creative Commons Attribution 4.0 License.
 | 24 Aug 2020
A Canadian River Ice Database from the National Hydrometric Program Archives
Laurent de Rham
Yonas Dibike
Spyros Beltaos
Daniel Peters
Barrie Bonsal
Terry Prowse
River ice, like open-water conditions, is an integral component of the cold-climate hydrological cycle. The annual succession of river ice formation, growth, decay and clearance can include low flows and ice jams, as well as midwinter and spring break-up events. Reports and associated data of river ice occurrence are often limited to single locations or regional assessments, are season-specific, and use readily available data. Within Canada, the National Hydrometric Program (NHP) operates a network of gauging stations with water level as the primary measured variable to derive discharge. In the late 1990s, the Water Science and Technology Directorate of Environment and Climate Change Canada initiated a long-term effort to compile, archive and extract river-ice-related information from NHP hydrometric records. This data article describes the original research data set produced by this near 20-year effort: the Canadian River Ice Database (CRID). The CRID holds almost 73 000 recorded variables from a subset of 196 NHP stations throughout Canada that were in operation within the period 1894 to 2015. Over 100 000 paper and digital files were reviewed, representing 10 378 station years of active operation. The task of compiling this database involved manual extraction and input of more than 460 000 data entries on water level, discharge, ice thickness, date, time and data quality rating. Guidelines on the data extraction, rating procedure and challenges are provided. At each location, time series of up to 15 variables specific to the occurrence of freeze-up and winter-low events, midwinter break-up, ice thickness, spring break-up, and maximum open-water level were compiled. This database follows up on several earlier efforts to compile information on river ice, which are summarized herein, and expands the scope and detail for use in Canadian river ice research and applications. Following the Government of Canada Open Data initiative, this original river ice data set is available at https://doi.org/10.18164/c21e1852-ba8e-44af-bc13-48eeedfcf2f4 (de Rham et al., 2020).
Please read the corrigendum first before continuing.
-
Notice on corrigendum
The requested paper has a corresponding corrigendum published. Please read the corrigendum first before downloading the article.
-
Article
(6067 KB)
-
The requested paper has a corresponding corrigendum published. Please read the corrigendum first before downloading the article.
- Article
(6067 KB) - Full-text XML
- Corrigendum
- BibTeX
- EndNote


River ice is an intrinsic component of cold climate watersheds. The Committee on River Ice Processes and the Environment (CRIPE; http://www.cripe.ca/, last access: 20 July 2020) has been quite active and productive since the 1970s (Beltaos, 2012a), during which time the study of river ice processes and hydraulics has emerged as an important research area (Hicks, 2008). The past decade includes a renewed focus on its ecological aspects (e.g. Peters et al., 2016; Lindenschmidt et al., 2018). Given recent rapid changes to the cryosphere, there is a need to better understand river ice processes and hydraulics as they relate to a warming climate (Derksen et al., 2019). Advances in river ice process science are largely driven by observation and collection of field data supplemented by hydraulic modelling. While there are a growing number of publications on river ice processes that focus on specific locations or river reaches and that look at a specific part of the ice period, such as the spring break-up, there are only few large-scale (countrywide) studies on the complete river ice season because of the absence of a comprehensive and multisite river ice database. It is not commonly known by the wider hydrology research community that a valuable source of river ice information can be extracted from the archives of hydrometric networks. In Canada, the National Hydrometric Program (NHP), in partnership with the Water Survey of Canada (WSC), and several Canadian provinces and territories, operates a current network of more than 2800 hydrometric stations covering a broad range of hydroclimatic and hydrologic conditions, thus providing a good cross section of the various river ice types and regimes. Historically, the primary mandate of the NHP was to provide water quantity information published as a time series of river discharge. The associated water level data, a requisite for estimating channel discharge, was not published up until the turn of the 21st century. Importantly, the NHP accounts for the hydraulic effects of ice on river channels when producing discharge estimates. Archival data used to compute discharge values in the form of field site visit notes, occasional ice thickness measurements and continuous water level records are a valuable source of information for the scientific, engineering and water management communities.
The CRIPE-sponsored report “Working Group on River Ice Jams – Field Studies and Research Needs” by Beltaos et al. (1990) includes a chapter with detailed guidelines on the extraction of river ice data from hydrometric archives. Although field observations and data can be imperfect, with evidence of ice recorded only to improve the hydrometric program's discharge estimates, the archives cover a range of locations and are accessible upon request. Based on these beneficial attributes, efforts towards the creation of a database of river ice parameters were recommended (Beltaos, 1990), and a compilation of the hydrometric archives for a pan-Canadian river ice database began in the late 1990s. Prowse and Lacroix (2001) reported on the extraction of spring break-up extreme events at a subset of 143 NHP gauging sites up to the year 1999, covering major drainage basins and ecological zones in Canada. This work was followed by a preliminary analysis on 111 sites proximal and north of the annual 0 ∘C isotherm, differentiating between ice-induced and open-water flood-generating mechanisms (Prowse et al., 2001). A study from von de Wall et al. (2009, 2010) also used NHP sites north of the temperate ice zone, covering the years 1913 to 2006, for analysis of the spring break-up period. These works reported on the geographical distribution and statistical analysis of physical controls on flood-generating mechanisms, a trend analysis (1969–2006), and correlations of ice event occurrence with both the 0 ∘C isotherm and various atmospheric teleconnection patterns.
More common in Canada are watershed- and reach-scale studies of river ice processes. Examples include the work of de Rham et al. (2008a, b), who examined spatial and temporal characteristics of the timing and magnitude of the spring break-up period from 1913 to 2002 throughout the Mackenzie River basin. Downstream, in the Mackenzie River delta, Goulding et al. (2009a, b) assessed spring break-up and ice jam water level event timing and magnitude to provide insights on hydro-climatic controls of the break-up sequence over the 1974–2006 period. For the upstream Peace watershed, Beltaos (2003a, b) and Beltaos and Carter (2009) utilized field-based data and hydraulic modelling to examine the effects of hydroelectric reservoir operation on fall freeze-up and spring break-up flows and levels in the lower Peace River; the objective was to address the question of declining ice jam flooding of the Peace–Athabasca Delta (Beltaos, 2019). Peters et al. (2006) examined the maximum extent of flooding of ice jam versus open-water flood events in this delta. Other well-studied Canadian locations include, to mention but a few, Hay River (De Coste et al., 2017), Red River (Wazney and Clark, 2015) and Chaudiere River (De Munck et al., 2017).
Expanding beyond Canada, Newton et al. (2017) reported on hydro-climatic drivers on midwinter break-up occurrence derived from NHP hydrometric records for western Canada and the Cold Regions Research and Engineering Laboratory Ice Jam Database (IJDB) for Alaska (1950–2014). The IJDB (Carr et al., 2015) includes the timing and magnitude of ice jam events across the United States since the year 1780. While data sources are wide in scope, the initial creation of the IJDB during the 1990s drew largely from the United States Geological Survey (USGS) gauging station data, including peak backwater level events (White, 1996). Outside of North America, efforts to compile river ice information from hydrometric data have included work to assess river break-up dates (1893–1991) in Russia (Soldatova, 1993). The National Snow and Ice Data Centre (NSIDC) provides online access to Russian River Ice Thickness and Duration (1917–1992) data set (Vuglinsky, 2000). These databases have been used for assessments of river ice conditions (e.g. Smith, 2000; Vuglinsky, 2006), with selected on-site updates up to the year 2012 (Shiklomanov and Lammers, 2014). The NSIDC also provides access to the Global Lake and River Ice Phenology Database, Version 1 (Benson et al., 2000), which includes time series of freeze, thaw, and break-up dates and descriptions of ice cover for 237 rivers. A compilation and analysis of Norwegian river ice was described by Gebre and Alfredsen (2011). Although not specific to river ice processes, the national-scale Canadian Ice Database (CID; Lenormand et al., 2002) also compiled visual observations of freeze-up and break-up dates, along with measurements of ice thickness, at 288 rivers across Canada. Brooks et al. (2013) used the data from the CID, along with international and NHP archives, to quantify freshwater ice characteristics in the Northern Hemisphere.
Beltaos and Prowse (2009) presented a comprehensive review of global changes in river ice processes. While the overall results indicated a shortening ice season, the authors noted that the majority of published studies assessed freeze-up and break-up dates, which can be more readily obtained from hydrometric agencies, rather than the more difficult to obtain daily and instantaneous ice-affected water levels. Specifically, these authors noted that broadscale studies assessing river ice data extracted directly from hydrometric archives are yet to be completed. Thus, only a limited body of published research is available that assesses the magnitude and timing of specific dynamic river ice variables during the fall freeze-up, midwinter, winter-low and spring break-up periods.
This paper expands upon the brief overview of the Canadian River Ice Database (CRID) presented at CRIPE (de Rham et al., 2019) and aims to provide a comprehensive reference document to accompany the publication of the CRID on the Government of Canada Open Data Portal. The main objectives are to (1) describe the NHP archives and data collection history of this study; (2) present the 15 variables identified from the NHP archives recordings outlining the data extraction procedure, while providing justification and relevant references for process-based understanding; (3) report on challenges, assumptions, and uncertainties encountered in the extraction of river ice information from hydrometric archives; and (4) identify resource requirements if others elect to undertake similar efforts and highlight potential uses for this river ice database. The paper begins by describing the study area and hydrometric monitoring sites followed by the methodology covering details of the data extraction procedure. The discussion section summarizes the data and highlights database utility and future research needs. The paper ends with a description of the data availability and data disclaimers and a conclusion.
The locations and characteristics of the near 8400 active and discontinued NHP stations, including their operation and regulation history, are available (in downloadable .csv format) at https://wateroffice.ec.gc.ca/station_metadata/reference_index_e.html (20 July 2020). The CRID includes data on river-ice-affected water level, associated channel flows and timing at a subset of 196 gauging stations across Canada (Fig. 1). These select monitoring sites are located within 11 of the 13 Canadian provinces and territories and extend over 10 of the 11 Canadian climate regions (Gullet et al., 1992). In the beginning, the database focused on 143 stations with a minimum 20-year record, drainage area greater than 10 000 km2 and that are located north of the mean annual 0 ∘C isotherm (Prowse and Lacroix, 2001). Thereafter, an examination of spring break-up at 136 northern gauging sites was reported (von de Wall, 2011). For the current study, the geographic criterion was expanded south into a “temperate zone” (Newton et al., 2017) and the drainage area threshold was removed. A review of literature and correspondence with WSC staff and provincial flood authorities identified an additional 60 southern sites prone to midwinter break-up events. Inclusion of these sites resulted in a network of 196 sites, with drainage areas ranging from 20.4 km2 to 1.68×10⁶ km2, including both natural and regulated flow conditions, with the latter distributed throughout this range.
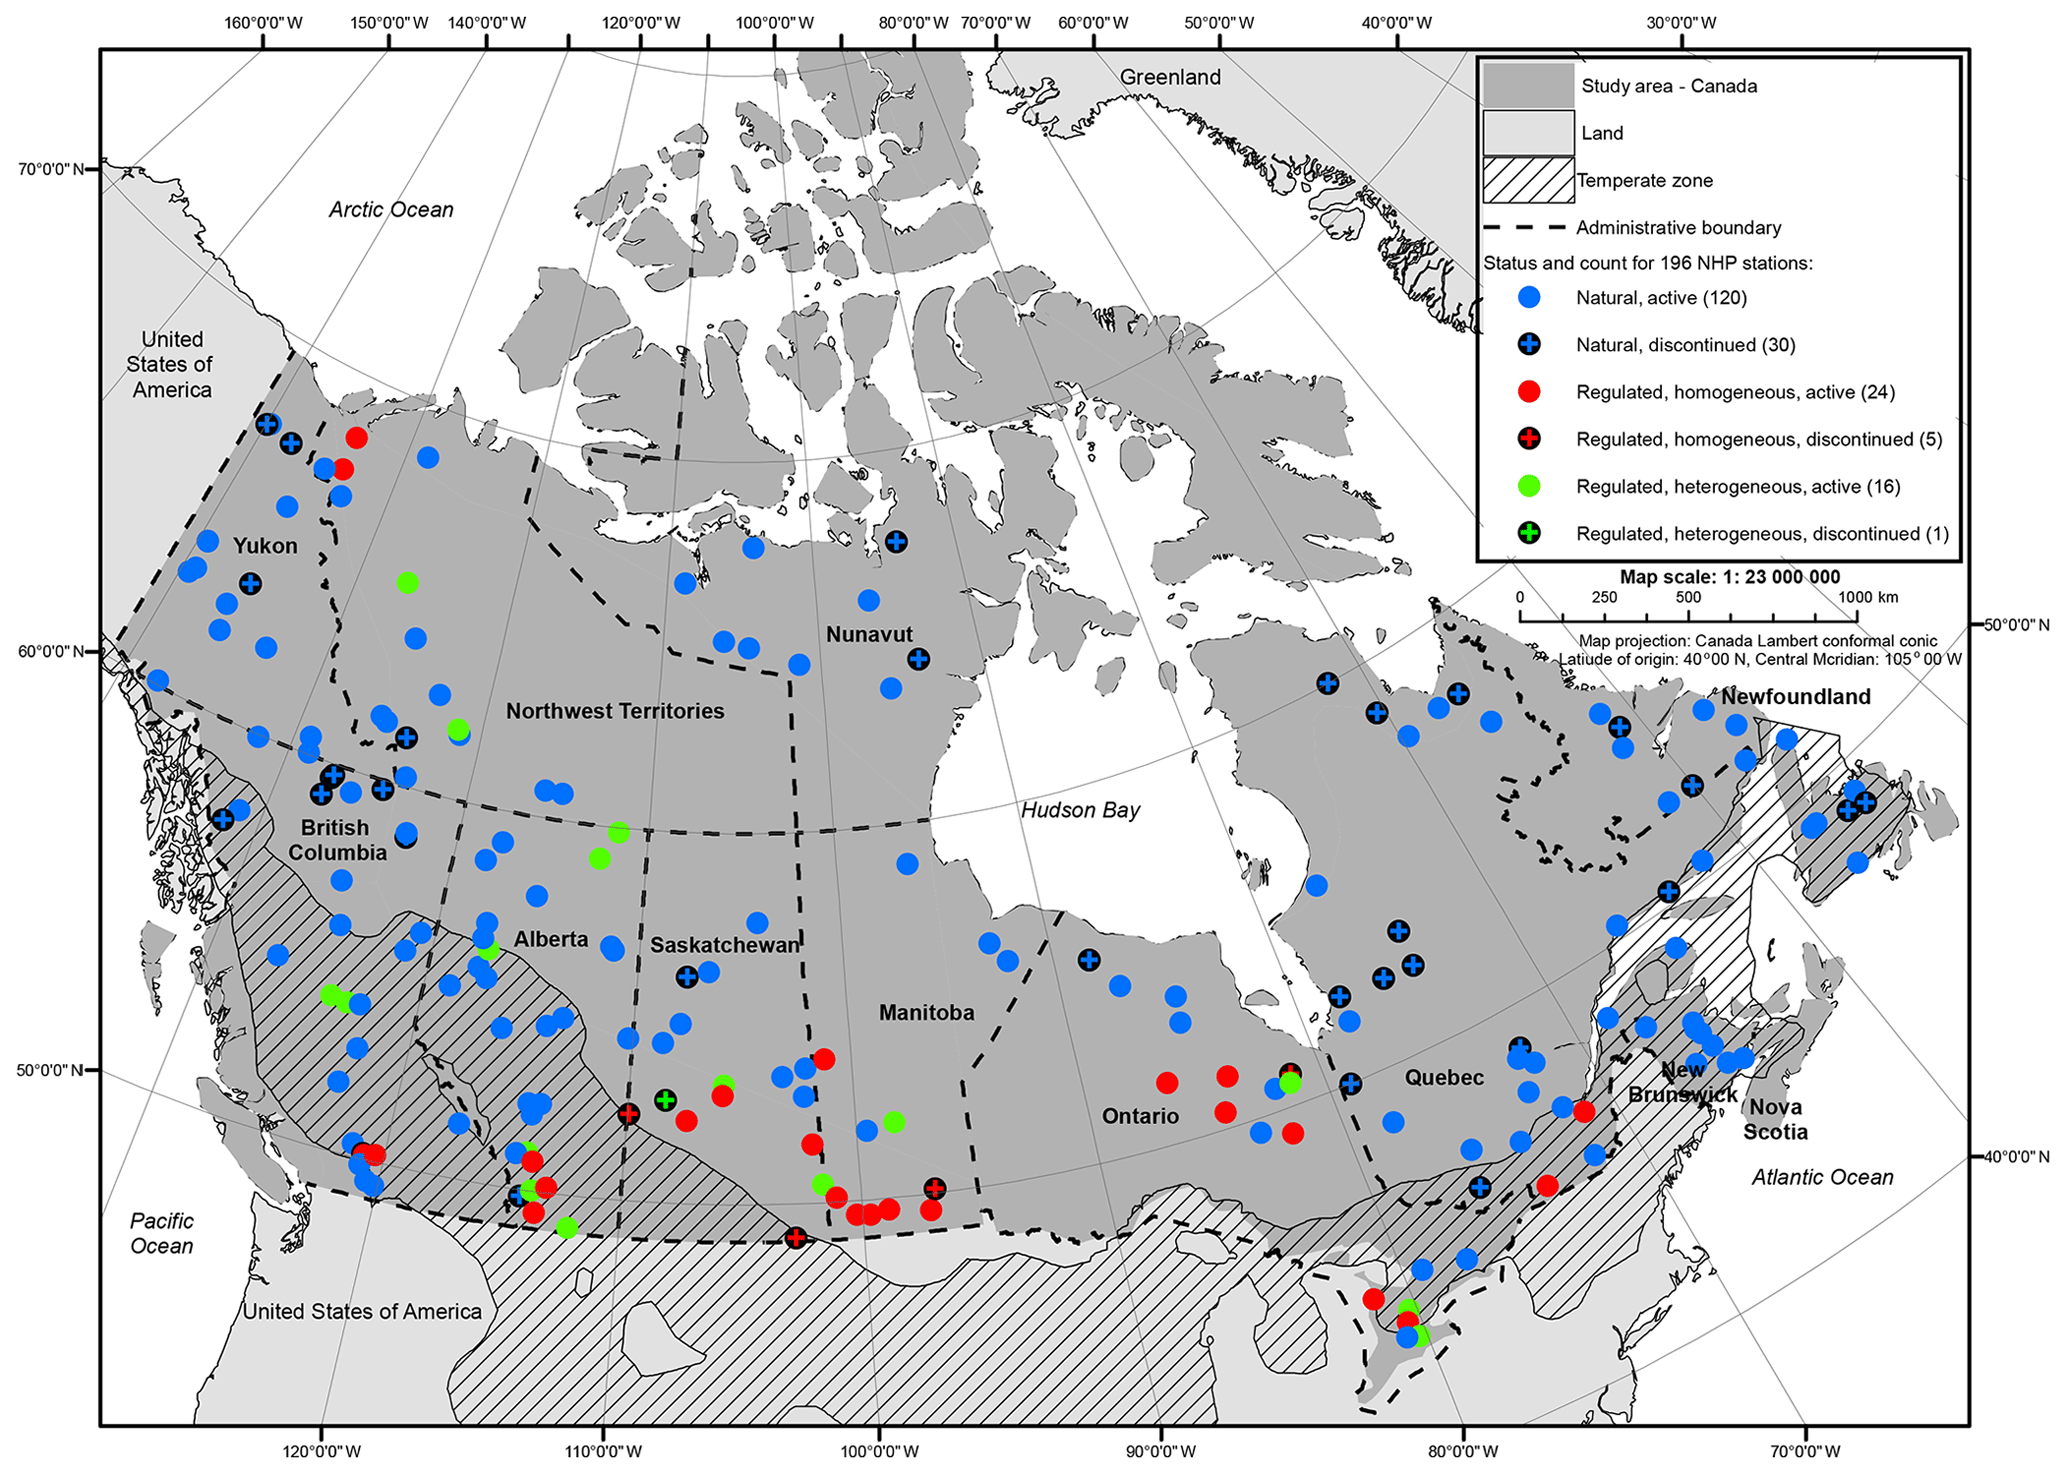
Figure 1Location of the 196 National Hydrometric Program (NHP) hydrometric gauging stations included in the Canadian River Ice Database. Status and count for the stations are based on flow condition (natural or regulated), whether they are active (in operation up to end of 2015) or discontinued, and if the flow condition is homogeneous (always regulated) or heterogeneous (regulated during specific period of operation).
The flow regime at the 150 natural sites has not been affected by any significant upstream waterworks. At the remaining 46 regulated gauging stations, predominantly in southern Canada (Fig. 1), flows were affected by instream waterworks, such as weirs, dams, and water diversion or abstraction. The majority of natural sites (120) were in operation up to the end of the study period of 31 December 2015, while most of the discontinued (30) stations ceased operating in the mid-1990s (Fig. 2). This late 20th century reduction in the monitoring network has also been reported by others (Lenormand et al., 2002; Lacroix et al., 2005). The regulated sites include 29 homogeneous (entire period of operation regulated) and 17 heterogeneous (natural and then regulated flow during period of operation) hydraulic conditions (Fig. 2). The Peace River system, an example of a heterogeneous hydrometric archive, is affected by both climate and regulation and a system of hydro-ecological focus (e.g. Hall et al., 2018; Timoney et al., 2018; Beltaos, 2019). A large number of the older stations have periods of inactive operation during 1920 to 1960. A few inactive stations have resumed operation since their shutdown in the mid-1990s (Fig. 2). After removing the combined 1012 years of inactive status, the 196 NHP sites considered represent 10 378 station years of data prior to 2016. Appendix A1 provides a list of all the stations selected for the CRID, including the start and end dates and station type. Specific CRID locations within this paper are referenced by gauging site name followed by the NHP alphanumeric identifier in brackets.
3.1 National Hydrometric Program archives
The various documents and digital hydrometric archives compiled and reviewed for this study include (1) continuous water level pen recorder charts (before ca. 2000) during the freeze-up, midwinter break-up (if applicable), and spring break-up periods; (2) digital files (after ca. 2000) with water level data at discrete 5 to 15 to 60 min intervals, some including minimum and maximum instantaneous water level for an entire annual period; (3) station descriptions; (4) site visit survey notes, including ice thickness summary files; (5) gauge and benchmark history; (6) stage–discharge (S-Q) relationship tables; (7) annual station analyses; (8) annual water level tables; (9) discharge measurement summaries; and (10) yearly station summary files (ca. 2003–2009). Archives since 2009 are primarily in digital format extracted from the Aquarius water data management platform, which simplified the data extraction, as compared to reading handwritten notes and pen charts for prior years. The last year of the CRID is 2015, as finalized NHP archival data can be delayed by up to 2 years while the data control protocol is followed. The NHP works with provincial governments and partner organizations at some network stations; therefore, archives also include those provided by the governments of Alberta and Saskatchewan, as well as the Centre d'Expertise Hydrique du Quebec (CEHQ). An earlier report (Groudin, 2001) included baseline break-up and open-water river information for 16 Quebec sites. Supplementary digital daily water level data for Quebec stations (Table A1; stations with “rivière” in their name) prior to ∼1997 were limited to the first water level recording of the day, and thereafter summaries of 15 min and daily average water level were provided. Information on discharge and river ice data qualifiers (such as the B dates, discussed below) were gleaned from the following WSC and CEHQ internet sites: https://wateroffice.ec.gc.ca/index_e.html (last access: 20 July 2020) and http://www.cehq.gouv.qc.ca/hydrometrie/index-en.htm (last access: 20 July 2020). Finally, note that the vast majority of historical annual water levels (item 8) are reported by NHP as preliminary since these values were never published. Similarly, some recent digital water level files (item 2) were also preliminary as NHP had not yet screened these data.
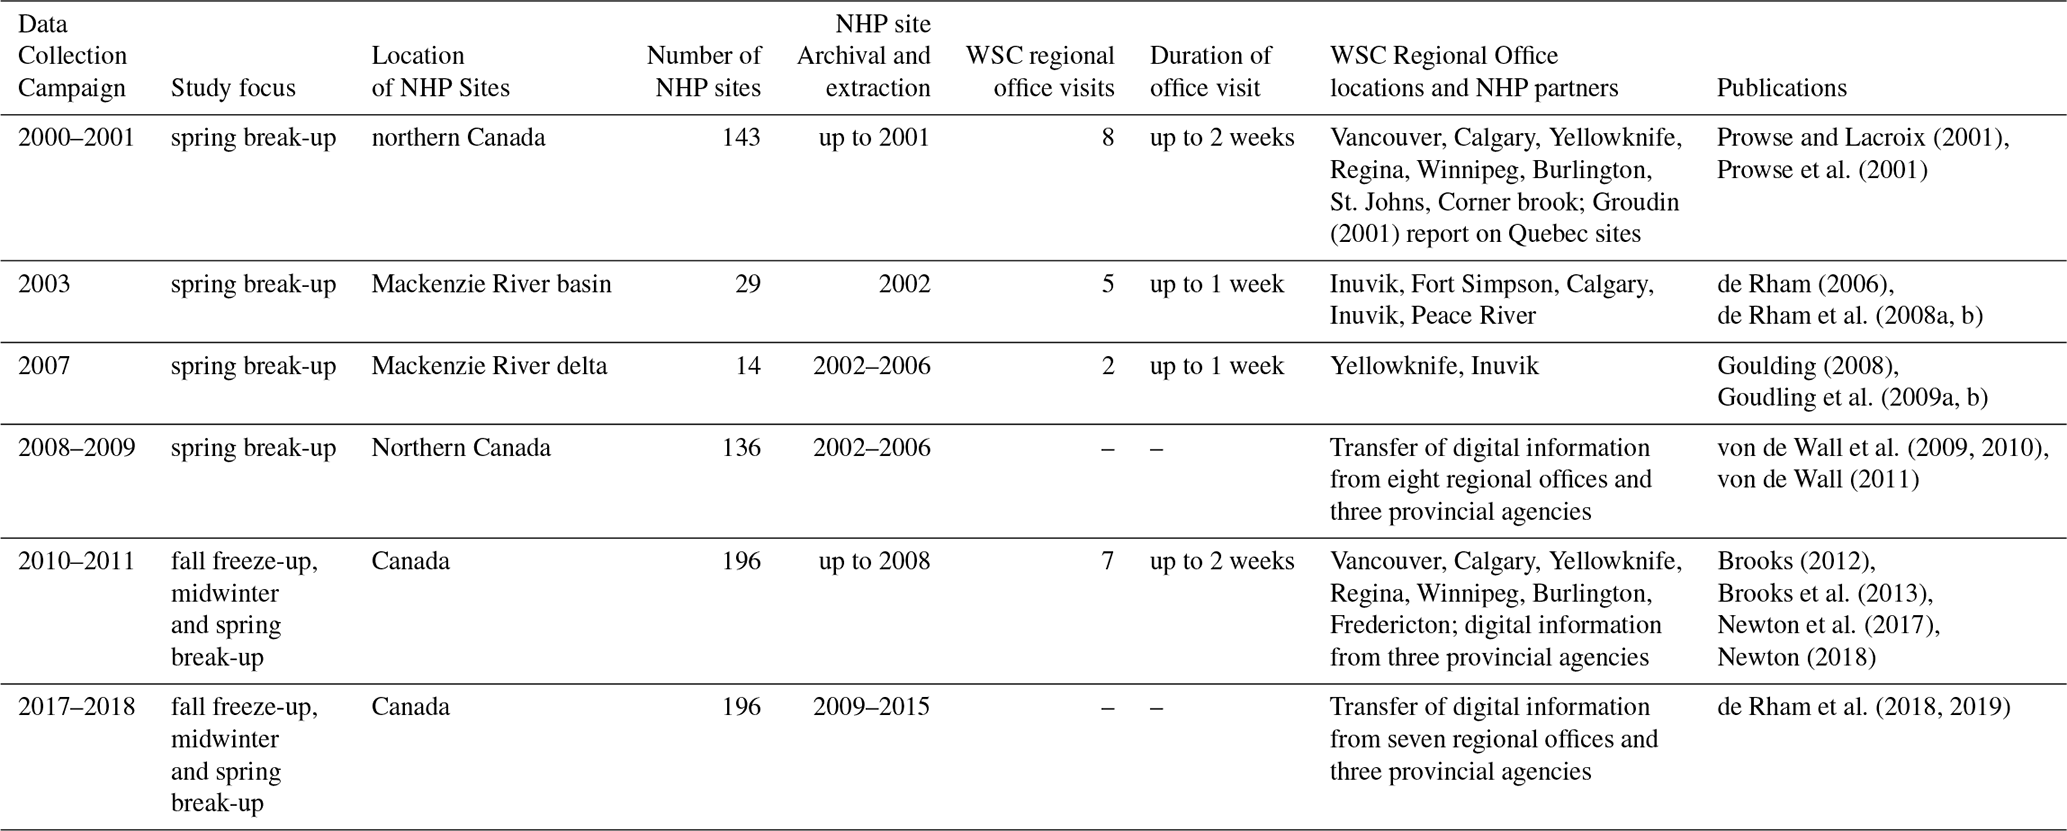
The evolution of the CRID was comprised of six data collection campaigns undertaken since the year 2000 (Table 1). Major data archival efforts in the years 2000–2001 and 2010–2011 required a team of two to three people visiting up to eight WSC regional offices, with each visit lasting up to 2 weeks, to photocopy and/or scan hydrometric archives. Following that, all paper-based information, except for that taken from the Quebec stations, was digitally scanned and filed to a central electronic repository. This 0.5 Terabyte collection digital data consists of over 30 000 folders and 100 000 files and is currently stored on a secure Environment and Climate Change Canada server. The CRID digital archive is available on request.
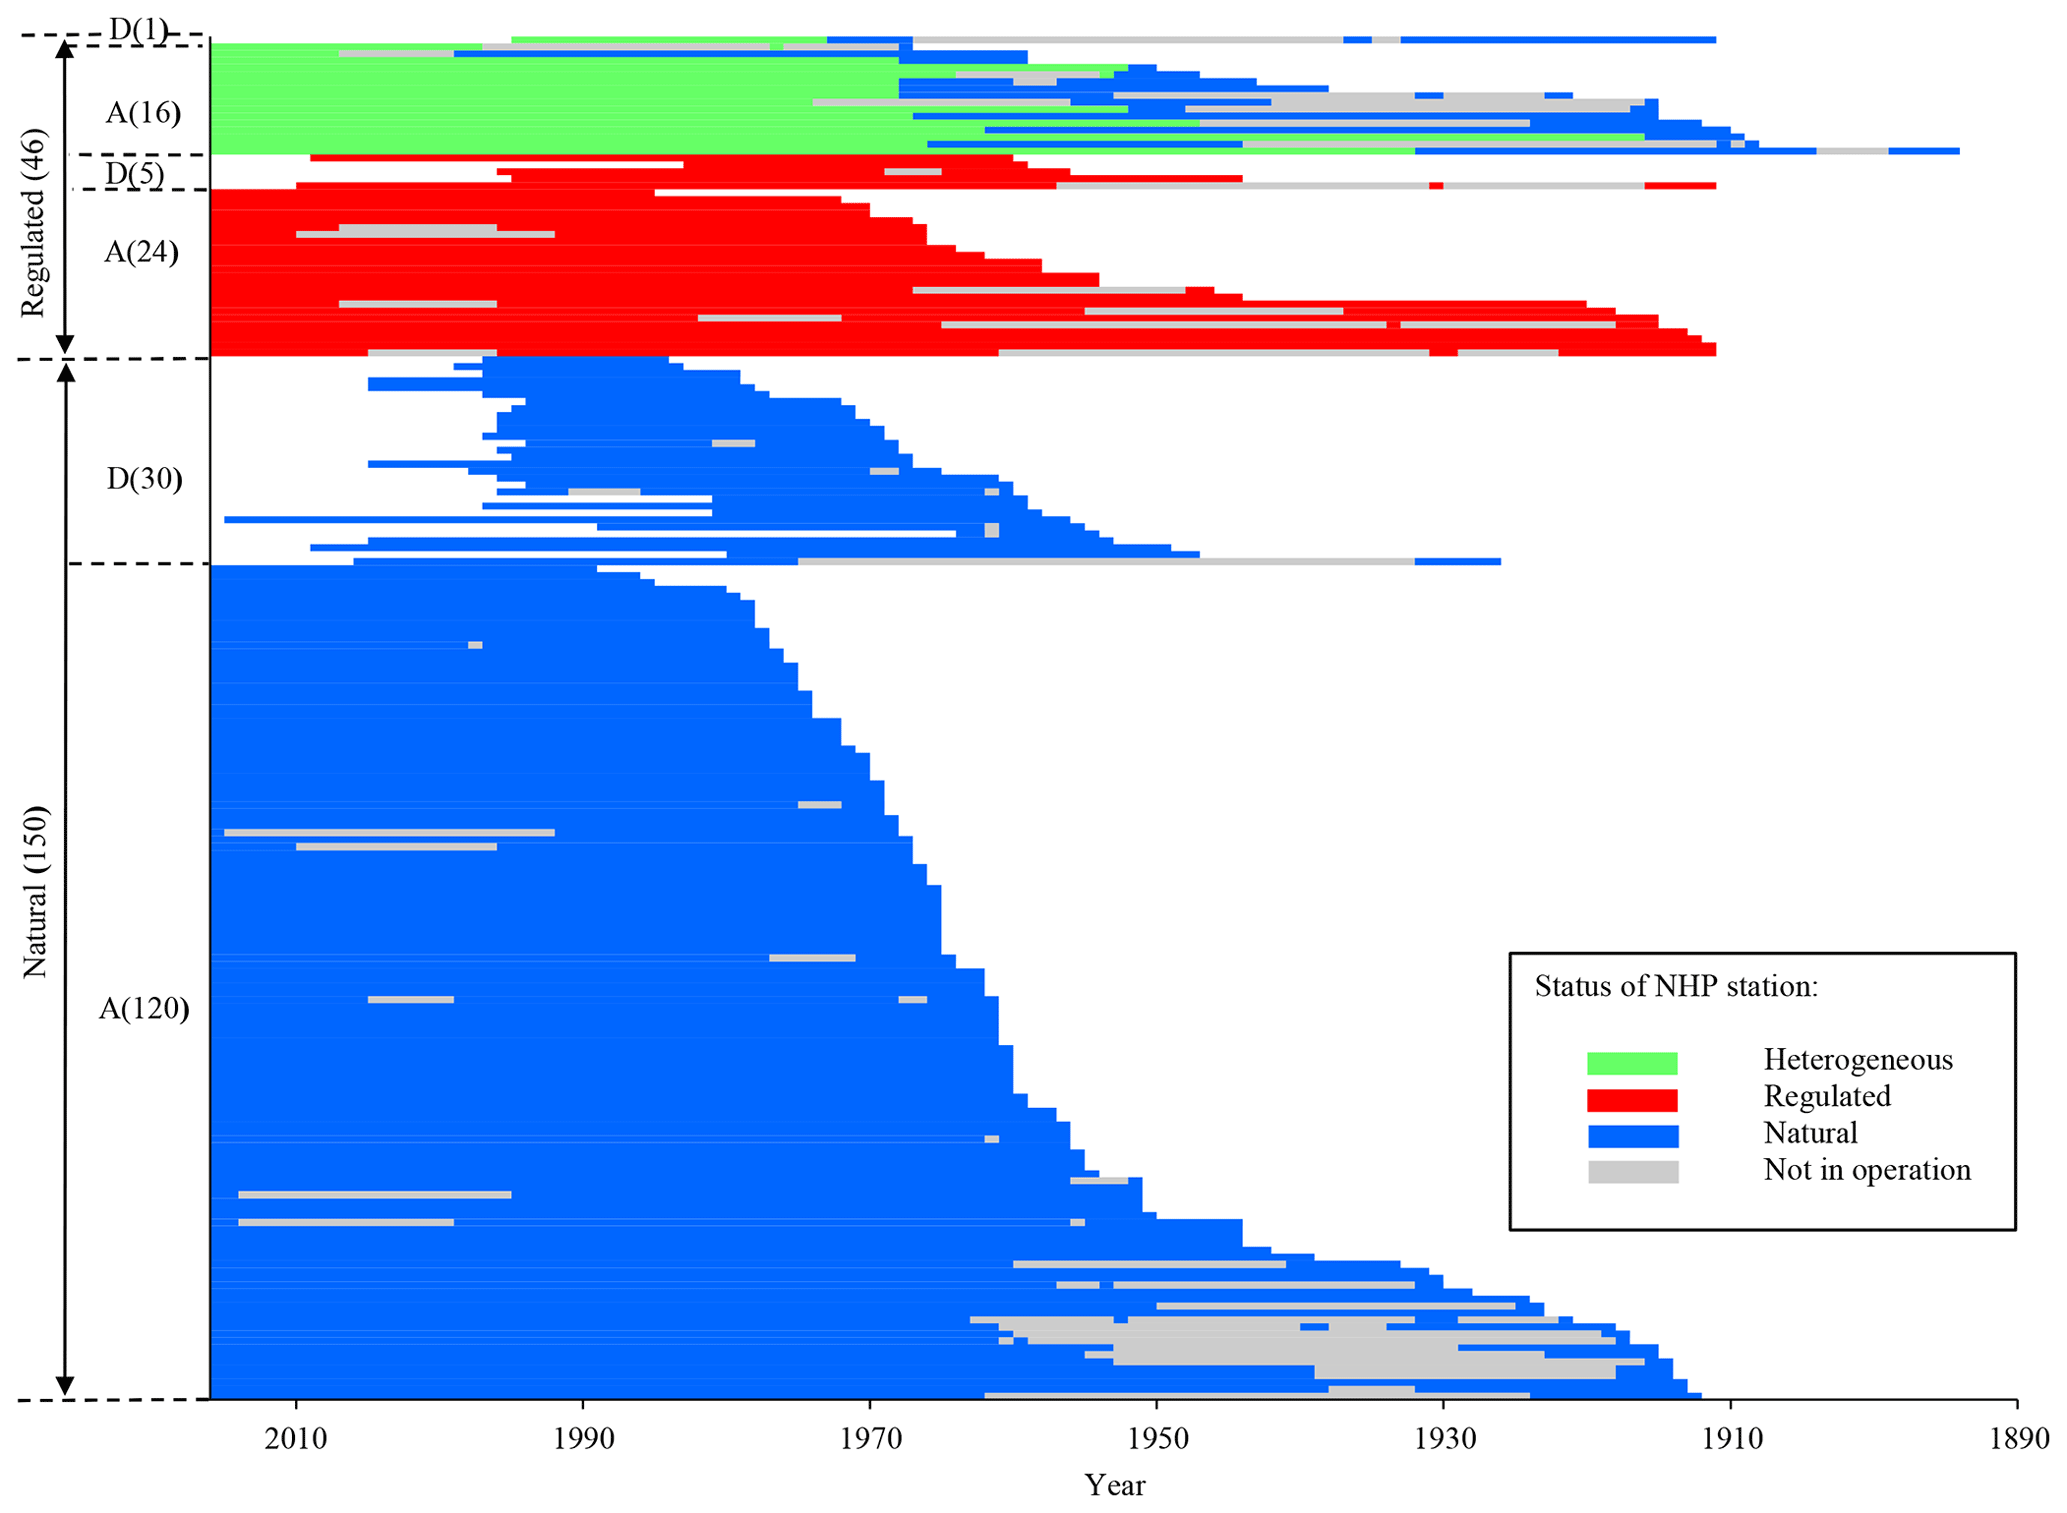
Figure 2Bar chart showing the operational history of the 196 National Hydrometric Program (NHP) stations included in the Canadian River Ice Database. Stations are categorized by flow condition (natural or regulated), operational status (active, A, or discontinued, D) and flow condition (homogeneous or heterogeneous). The number in each subcategory is shown brackets.
Table 1List of the six data collection campaigns during the development of the Canadian River Ice Database. The Water Survey of Canada (WSC) is the federal agency of the National Hydrometric Program (NHP), which also includes provincial and territorial agencies.
3.2 Data extraction and quality rating
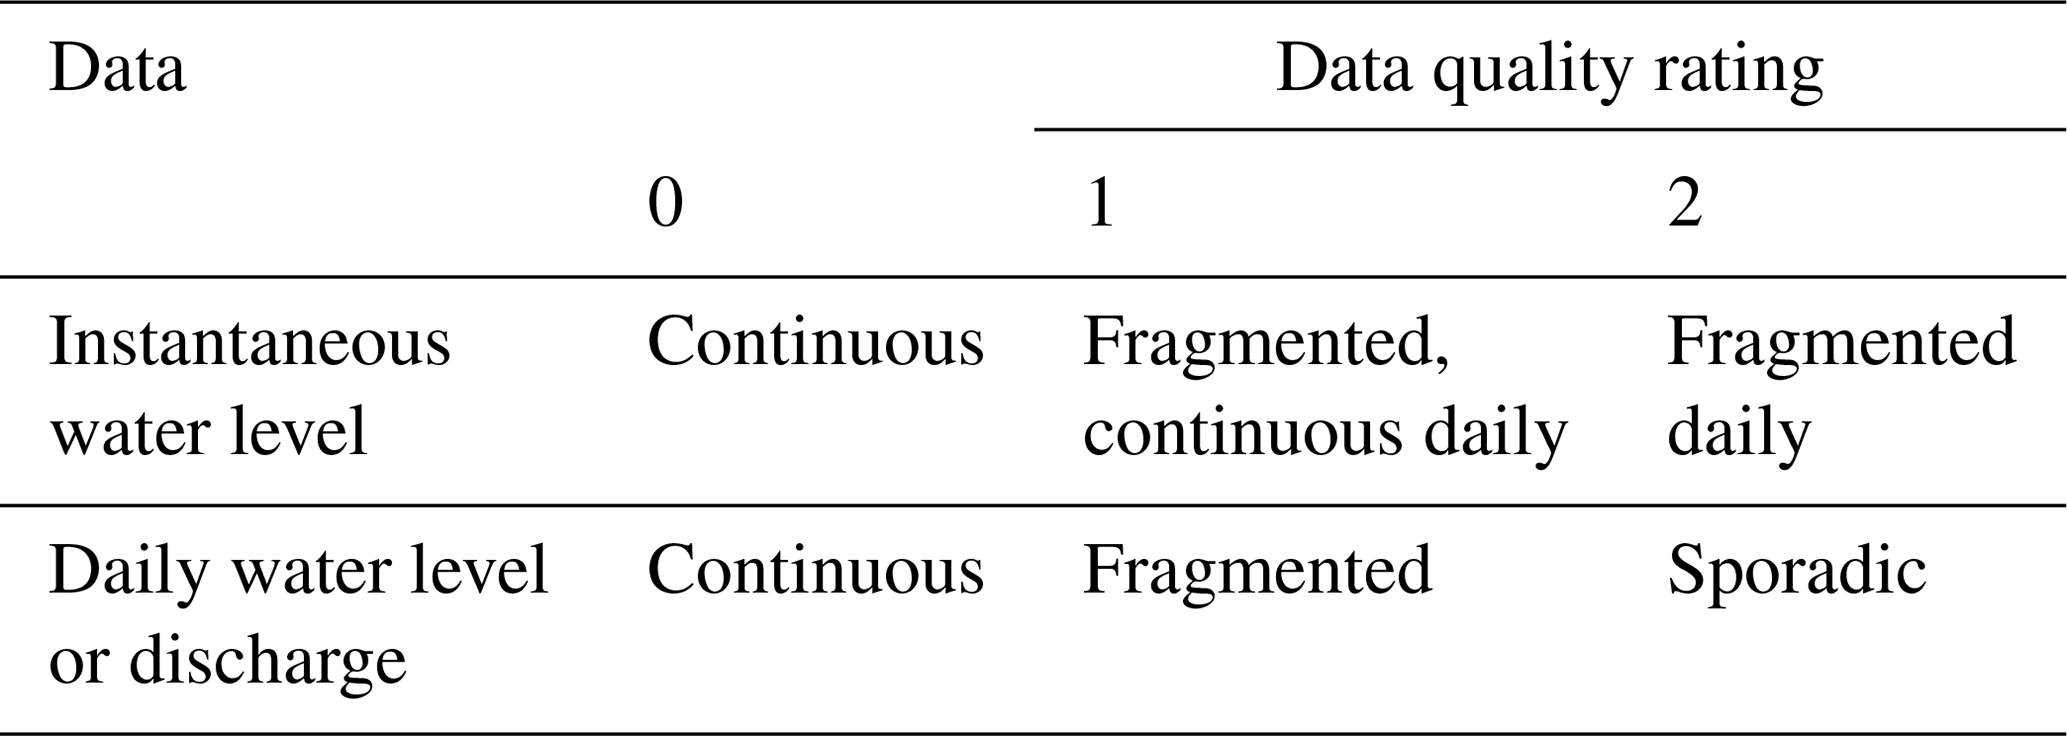
A conceptual schematic of a water level hydrograph showing all typical ice-affected metrics is plotted in Fig. 3. The CRID includes up to 15 variables that cover the water year (Table 2). These variables are categorized as occurring during one of four seasons: freeze-up, ice cover, break-up or open-water. For the variables shaded in grey, the objective was to record data on instantaneous water level and the associated date and time. These instantaneous values correspond with the water level at the initiation and maximum flood level for ice-specific and open-water conditions during each calendar year. The procedure for extracting river ice data follows the guidelines of Beltaos (1990) and primarily involves visual examination of water level records. Hence, identification and extraction of river ice data is a subjective process and the resolution to which water level, discharge and event timings were registered is included in Table 2. Depending on the possibility of extracting variables based on instantaneous (Table 2, grey shading), mean daily water level or mean daily discharge (HLQ1, HLQ2), a data quality rating scheme with values of 0, 1 and 2 was used to quantify the continuum of higher to lower data resolution (Table 3). Under some circumstances, judgement was applied to rate data quality higher or lower depending on various circumstances, such as termination of a continuous water level record during the spring break-up season where ice movement, synonymous with variable spring break-up initiation (Sect. 3.4.6), damaged the recording instrument. Such data would rate as 0, even though data from the fragmented record rates as 1 in Table 3.
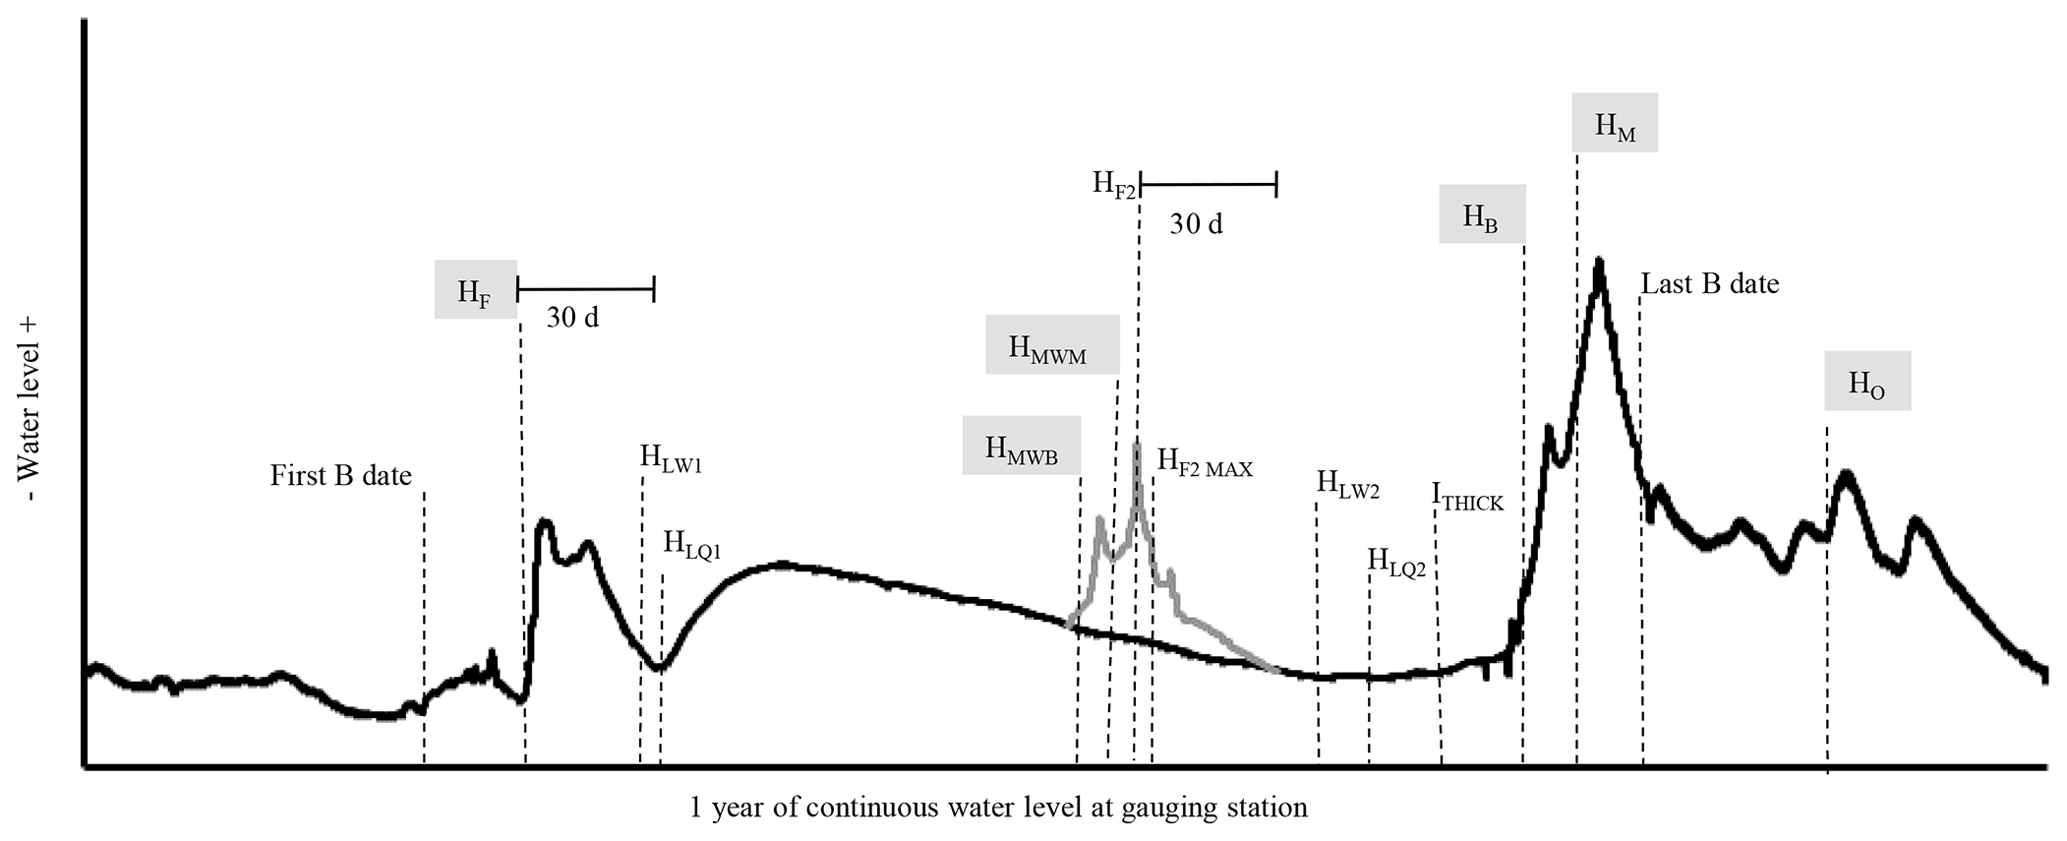
Figure 3Conceptual schematic of a continuous river water level hydrograph (black line) spanning 1 September to 31 August. The period of ice-affected flow is constrained by the first B date and last B date. A possible midwinter break-up event is shown as a grey line at the approximate centre of the hydrograph. Symbols for the 15 variables that populate the Canadian River Ice Database are shown in the figure (see Table 2 for additional information). The variables shaded in grey show the instantaneous water level and associated time when the event occurred. Compression of the x axis and vertical exaggeration of the y axis accentuate the water level changes observed during ice conditions. The relative magnitudes of variables and water level pathology should not be considered as typical.
Table 2The 15 variables extracted from the National Hydrometric Program archives and input to the Canadian River Ice Database (CRID). The CRID includes the date of all variables classified by season. The resolution of the water level or discharge record examined is summarized with grey shading that denotes an attempt to identify instantaneous water level events. Data quality rating was applied to the data in bold.
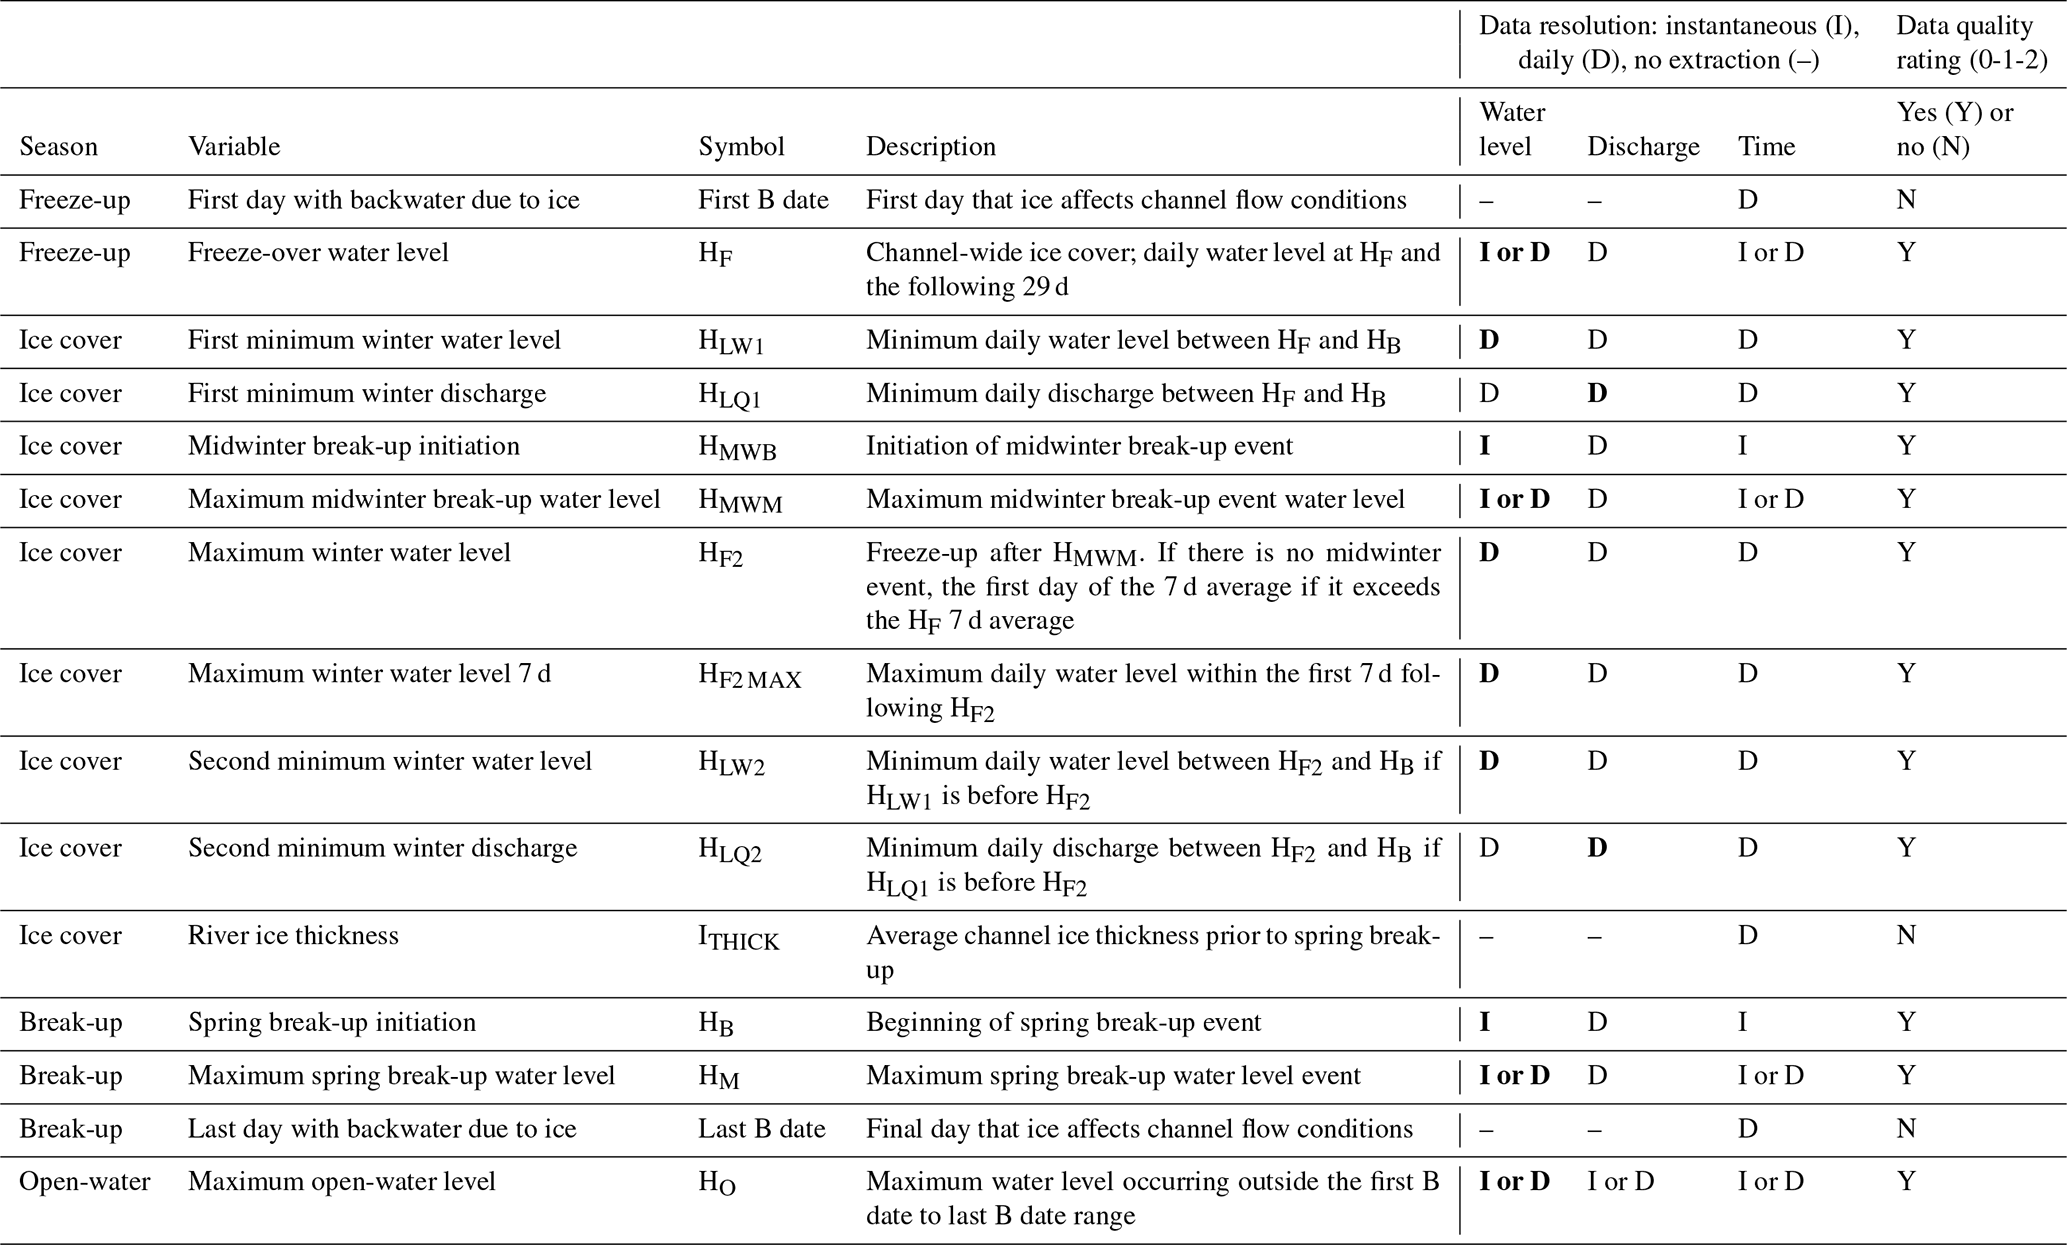
Table 3The data quality rating for water level or discharge associated with 12 of the 15 variables in the Canadian River Ice Database. Continuous indicates that there is no gap in the recorded hydrometric data, fragmented means that there are some gaps over the period of review and sporadic indicates that only limited data are available. This was a qualitative expert-judgement-based rating.
3.3 Ice-affected stage–discharge relationship and b dates
This section highlights challenges related to data collection during the ice season through excerpts from hydrometric program operational manuals and other publications, in addition to experiences during the development of this database. This background information is considered to be of high value to users when interpreting spatial and temporal characteristics of river ice data.
A fundamental concept in hydrometry is the stage–discharge (S-Q) relationship. At each NHP monitoring location, a reach-specific relationship is established via field surveys. Each year, hydrometric staff complete multiple site visits to measure in situ stream velocity and flow area to calculate discharge for a given water level. This work is ongoing with occasional refinement and adjustment of the S-Q relationship to account for changes in channel morphology and bed roughness, in some cases requiring relocation of the station due to a loss of a stable control section in response to natural and/or anthropogenic impacts. Besides, the open-water S-Q relationship is not valid during river ice conditions due to well-known hydraulic effects of ice on flow conveyance. In Canada, ice-influenced flows are identified with a “B” flag to inform the user that the water level is affected by “`backwater” conditions that lead to a higher water level associated with a given discharge on the S-Q curve. The specific river ice condition can take different forms, such as frazil and slush ice, anchor ice, partial ice cover, complete ice cover, ice jams, flowing ice chunks, or a mix of these forms (Poyser et al., 1999). The data user, therefore, has to be aware of these possibilities when using “B” dates as a metric for river ice conditions. In reference to S-Q relationships under ice, Environment Canada (1980) makes the following statement:
Because of the many variable factors involved, no single standard procedure is suggested for the computation of daily discharges during periods when the stage–discharge relation is affected by the presence of ice. Several methods of computing discharges under ice conditions are available and it is suggested that the Regional Offices use the method that best suits each individual station.
The CRID, with data sourced from regional offices and partner organizations across the country, inherits this discharge calculation legacy for the 11 reported on-site ice-affected discharge time series (Table 2: discharge in the data resolution column). Cold-region hydrometric programs have to contend with measurement problems and uncertainties of under-ice flows (Pelletier, 1990). The accuracy of measurements receives continued attention since water resource managers, dam operators and the flooding research community seek to reduce data uncertainty for ice-affected periods (e.g. Healy and Hicks, 2004; Fulton et al., 2018). The apparently chaotic flow condition during the freeze-up and break-up periods, along with Kennedy's (1975) observation that “an ice-jammed river is among the most deranged of hydraulic phenomena”, further complicates discharge estimation. The WSC Lesson Package No. 20 – Computation of Daily Discharge (Ice Conditions) (Poyser et al., 1999) reiterated freeze-up and break-up as follows: “two periods are often the most difficult ones for which to produce reliable discharge estimates, even for seasoned hydrometrists, who must use ingenuity, experience, and a knowledge of the characteristic traits that indicate transition” and that “computation under ice conditions involves a high level of personal judgement on the part of the technician in the interpretation of the available data”.
Thus, interpretation of ice-affected conditions remains a challenge for hydrometric programs. For example, at a gauge station along the Peace River (https://wateroffice.ec.gc.ca/report/historical_e.html?stn=07KC001, last access: 20 July 2020) the WSC informs users that “data quality during spring break-up [is] considered poor and [quality during the] remaining ice period [is] considered fair”. An example schematic showing the ice-affected condition is provided in Fig. 4, where the latest time when ice-covered flow can be estimated with a fair degree of confidence is at point A. Under conditions of a stable ice cover, hydrometric staff can apply site-specific methods to estimate the applicable discharge, based in part on sporadic flow measurements during the winter period. Point B in Fig. 4 denotes the last day of backwater; therefore, after that time discharge can be estimated with very good confidence using the gauge-specific S-Q relationship that applies to open-water conditions. Point C in Fig. 4 approximately delineates the periods of pre-breakup (sheet ice cover, possibly subjected to hinge and transverse cracking) and actual breakup when various events such as ice jams and ice runs generate repeated increases and decreases in the water level that are too sharp to be generated by runoff. For the breakup period, hydrometric staff estimate daily flows by taking into account the general trend of the water level hydrograph, prevailing weather conditions, flows at upstream gauges and tributaries, and any in situ visual observations that may be available. Once the ice cover is fractured, mobilized and broken up, flow measurement is inhibited by problematic access and safety considerations. Consequently, it is not possible to assign reliable flow estimates during the break-up period, leading to the aforementioned “poor” characterization since there is no way at this time to quantify the reliability of these data.
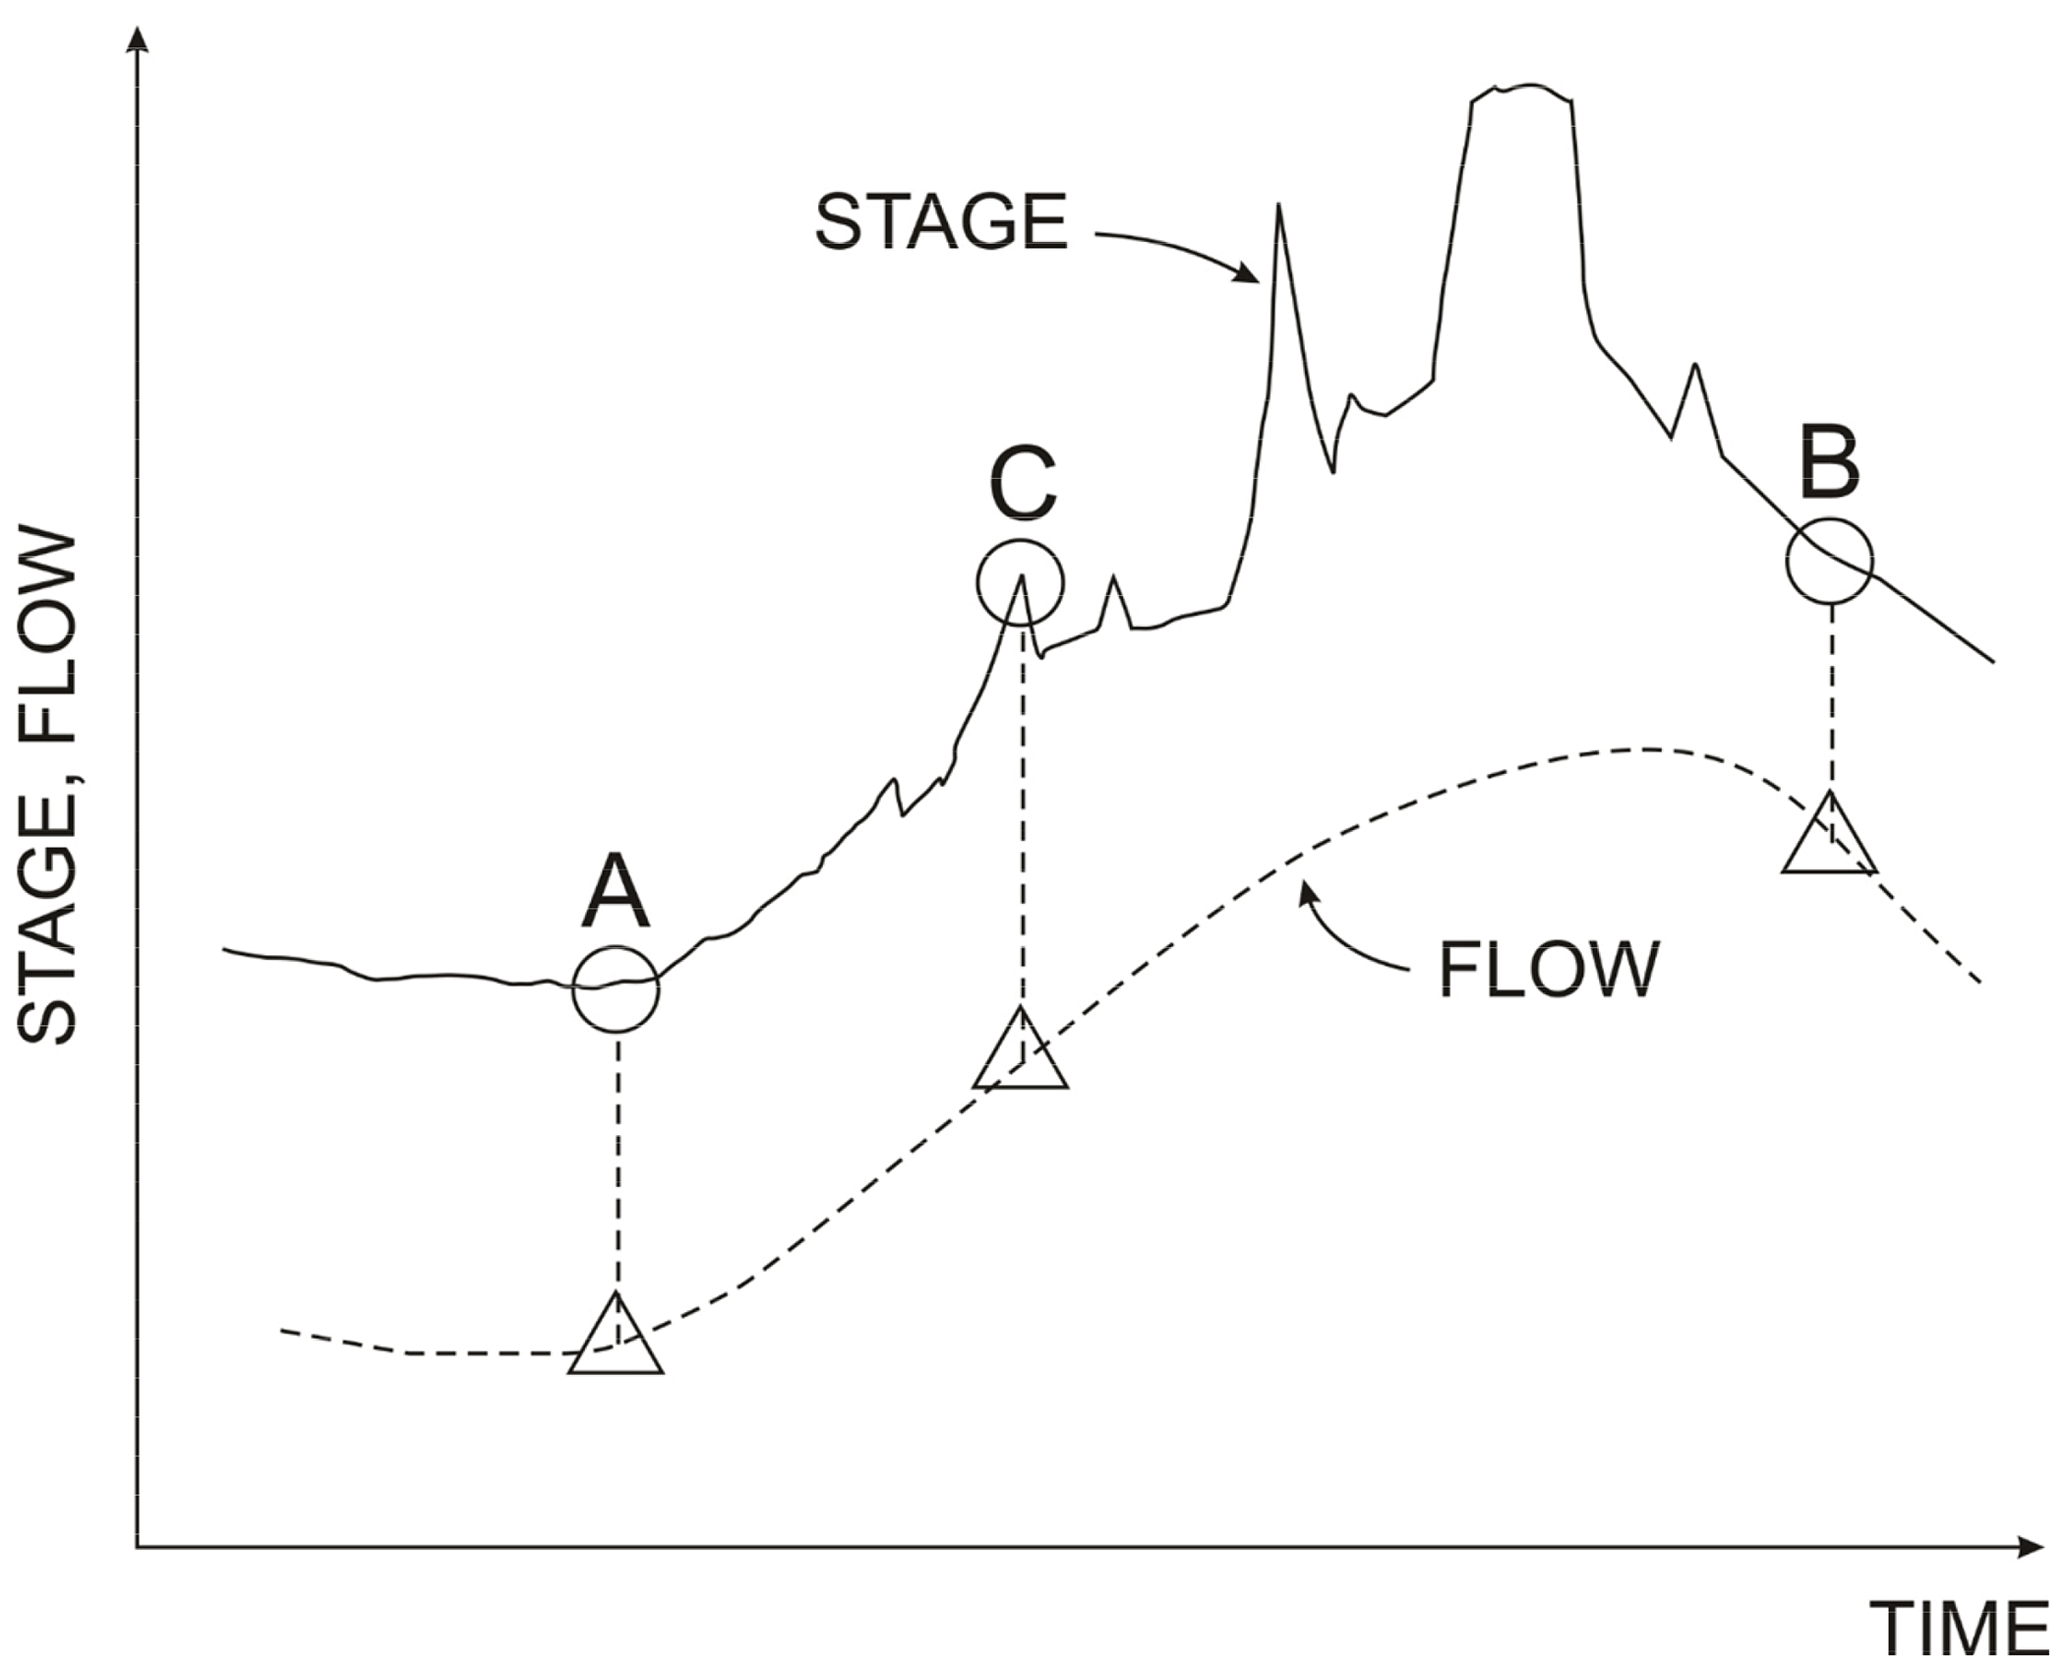
Figure 4Schematic illustration of typical stage (i.e. water level) and flow (i.e. discharge) variations during the early phase of the spring runoff event. Figure taken from Beltaos (© Crown Copyright, 2012b; published by NRC Research Press).
National assessments that analyze flow data often make no mention of the uncertainties associated with the collection and interpretation of hydrometric data during ice conditions (e.g. Cunderlik and Ouarda, 2009; Burn and Whitfield, 2015). More discussion on these issues is needed to inform the water community of the challenges related to cold-region hydrometric data collection (Hamilton, 2003) and caution when interpreting study results. The first ever published analysis of WSC “B” dates was completed by Brimley and Freeman (1997), who examined trends in the Atlantic region. Their observations on station locations and the dynamic ice conditions “that the data on river ice should only be considered valid at the gauging station site and may not be transferable to the entire watershed” are applicable to the CRID product.
3.4 CRID variables
The following subsections, corresponding to the four seasons of occurrence (Table 2), provide the background, extraction details and justifications for the selected CRID variables. For ease of reference the ice cover season is divided into three subsections that describe a maximum of four variables.
3.4.1 Freeze-up: first B date, HF
As mentioned above, the NHP daily discharge values include a “B” flag to inform users of discharge estimates that consider the ice “backwater” effect in the stream reach (Environment Canada, 2012). Users can access these data in the online archive and/or downloadable HYDAT database with the freeware Environment Canada Data Explorer (https://wateroffice.ec.gc.ca/mainmenu/tools_and_downloads_index_e.html, last access: 20 July 2020). The first occurrence of this flag, the first B date, marks the beginning of the ice-affected channel flow condition and has been used to investigate changes in the timing of river freeze-up (Zhang et al., 2001; Peters et al., 2014). However, the first B date does not indicate the presence of an ice cover at a hydrometric gauge since the backwater effect may be a result of ice conditions far downstream of the station or the nearby presence of significant anchor ice build-up on the riverbed. The MODIS time-lapse satellite images in Fig. 5 illustrate the freeze-up and ice cover conditions on a reach of the Mackenzie River in the fall of 2000. For that year, NHP reports a first B date of 10 October, but open-water sections appear on 14 October and even 1 month later on 7 November. Only the 12 November image shows ice cover over the entire river channel with no open-water sections apparent. The first B date in the CRID therefore only marks the beginning of ice effects on a river reach and cannot be assumed to be a channel-wide ice cover condition. Though extraction of CRID variables did not use alternative means of verification, using satellite images from the WorldView interface (accessed at https://worldview.earthdata.nasa.gov/, last access: 20 July 2020) in this example is a simple way to view time series of changing ice cover conditions since the year 2000. For locations with several freeze-up and break-up cycles, such as the temperate zone locations (Fig. 1) or gauges with associated intermittent daily B data flags (depicted on Fig. 9, Sect. 3.4.4), the first B occurrence was recorded as the first B date. For CEHQ stations in Quebec, the data qualifier R was assumed synonymous to B, and in the very few situations where the date did not match, the NHP first B date was used.
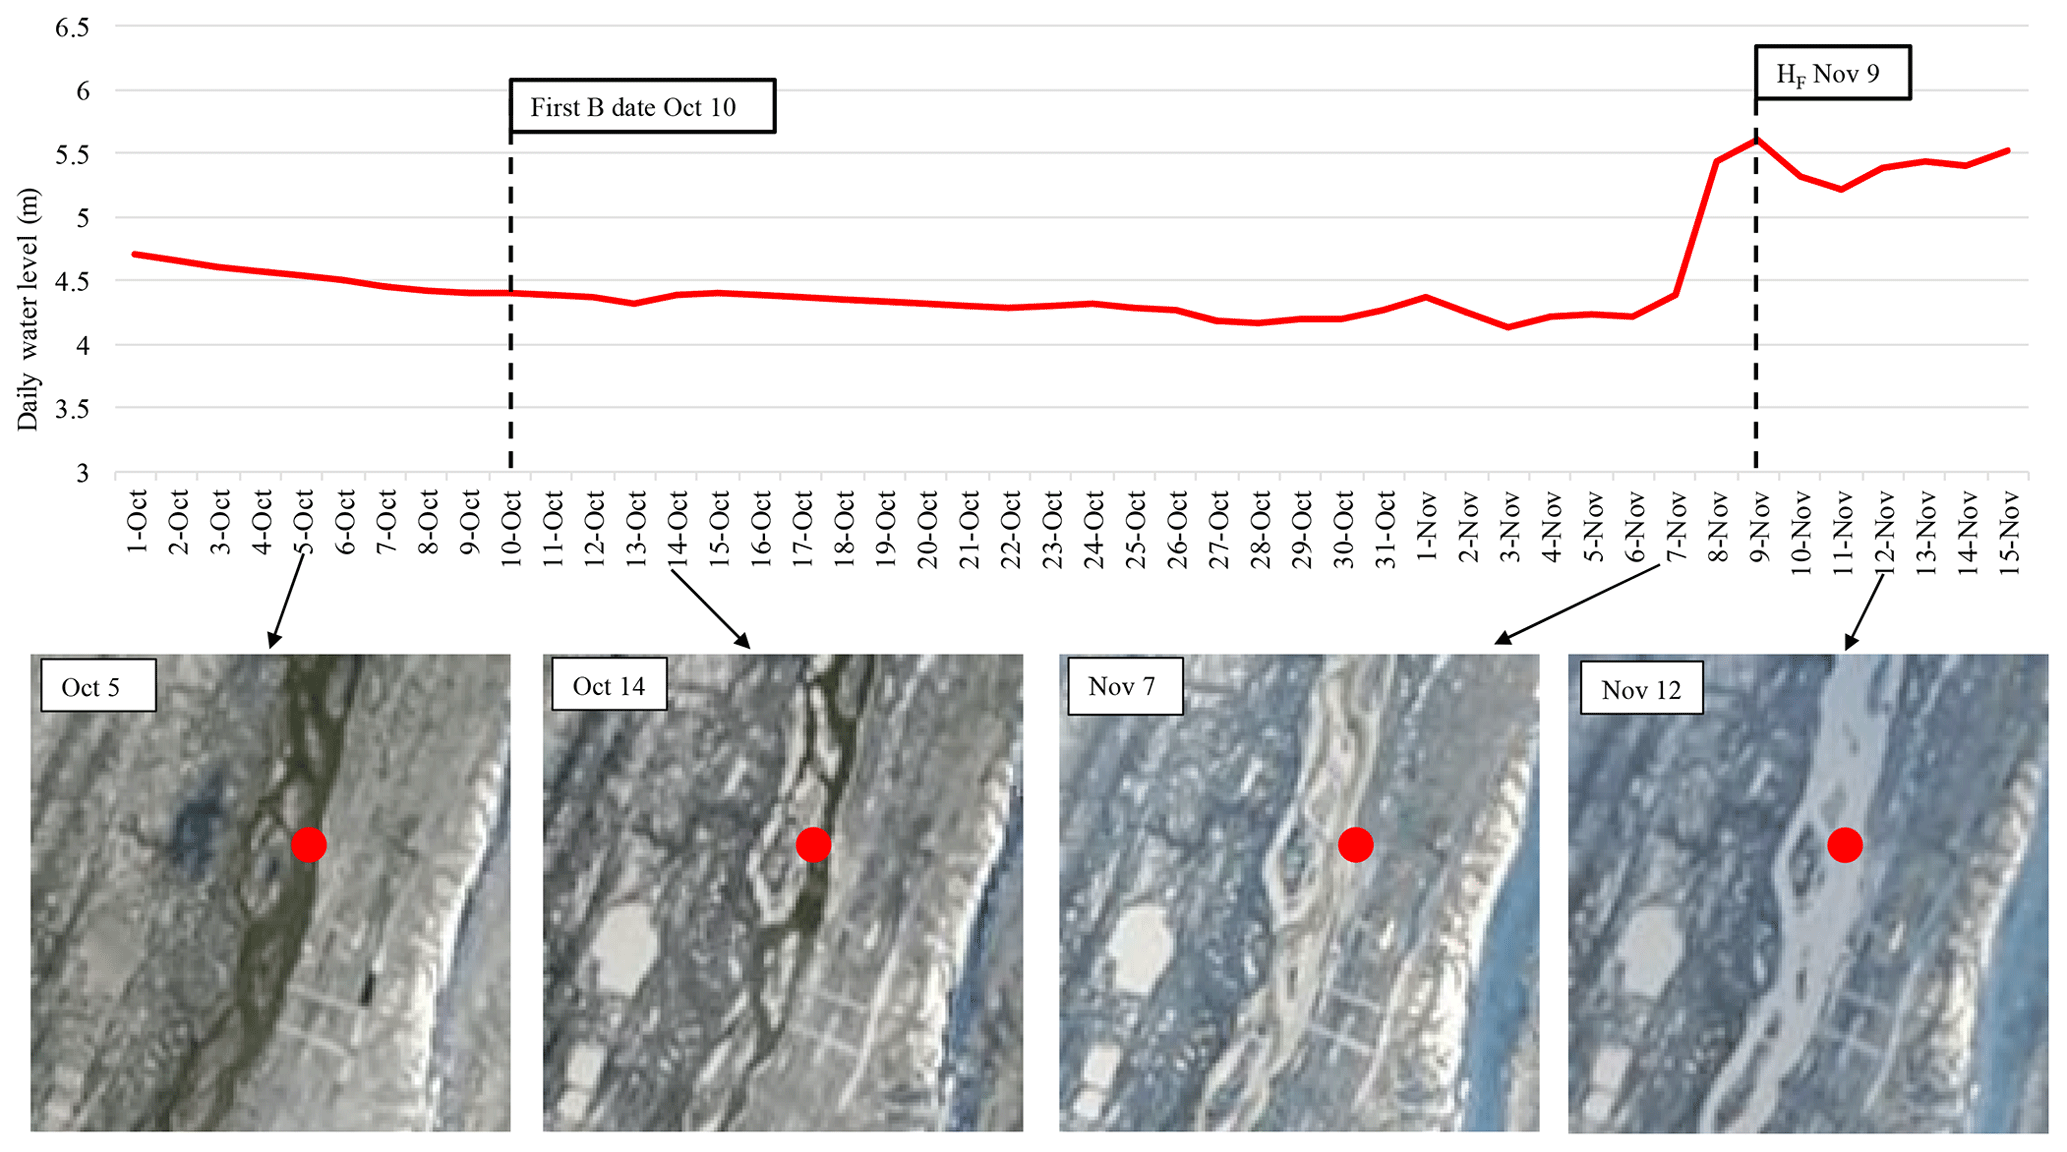
Figure 5Daily mean water level hydrograph for 1 October to 15 November 2000 at National Hydrometric Program gauging station Mackenzie River at Norman Wells (10KA001), along with MODIS time-lapse satellite images (accessed at https://worldview.earthdata.nasa.gov/, last access: 20 July 2020). The station location is indicated by red circle. The width of the channel is approximately 1300 m and includes numerous islands. Flow is from bottom to top. The first B date is 10 October, while the freeze-over water level (HF) occurred on 9 November and these images were obscured by clouds. River channel open water is green and ice cover is white on these true-colour images.
Formation of a channel-wide ice cover is the culmination of various processes that include frazil ice growth and ice pan development, juxtaposition, and upstream progression. When the ice cover “bridges” or is present “bank to bank” across the river channel the increasing frictional resistance causes a rise in the water level. This initial ice cover progression upstream past the gauge will cause a gradual increase to a maximum in the water level chart and is depicted as HF (freeze-over water level) in Fig. 3. The CRID includes transcription of the NHP-recorded instantaneous water level; up-to-the-minute timing, date, and associated daily discharge, as available, are manually extracted and given a “0” rating. Instantaneous discharge during ice conditions is not a NHP data product since the open water S-Q relationship is invalid. If no instantaneous record was available, the lower-resolution daily water levels are used to identify the maximum water level occurring after the first B date, with the data quality rated as “1”. Review of daily meteorological data at proximal climate stations can help the interpretation by showing that air temperatures remained below 0 ∘C and the observed spike was not a result of rainfall in the region (Beltaos, 1990). Meteorological data review was accomplished using the “Search by Proximity” function from: https://climate.weather.gc.ca/historical_data/search_historic_data_e.html (last access: 20 July 2020). Southern locations generally have a climate station within a 10 km radius, while at some northern locations it was necessary to assume a representative meteorological site beyond a 200 km radius. The archived hydrometric station analysis (item 7, Sect. 3.1) often includes reference to a nearby meteorological site with “rainfall or temperature records used for estimating the missing periods or the ice-affected periods”. It was generally observed, though not recorded, that maximum freeze-over water level tends to occur when temperatures dropped to −10 ∘C. While ice-jamming at freeze-up is a known occurrence (e.g. Jasek, 1999), there was no attempt to distinguish these events in the current exercise due to the complex hydrological and hydraulic conditions affecting these processes. Beltaos (1990) discussed the unlikelihood that a complete ice cover forms at the instant of HF. A later recommendation was to define the freeze-up water level as the average water level for 1 week after formation of a complete ice cover (Beltaos, 1997). Following this methodology, the CRID includes all available daily water levels at HF and the following 29 d to (1) allow for calculation of a 7 d average to parameterize a water level threshold of exceedance for the ice to detach from channel banks at break-up (Beltaos, 1997) and (2) tabulate the water level for 1 month as liquid water goes into hydraulic storage and ice formation, temporarily reducing the discharge at the gauge. This process can take place over a distance of several hundred kilometres upstream (e.g. Prowse and Carter, 2002; Beltaos, 2009) and (3) allows for the application of peak factors concept (Zhang et al., 2005) as the ratio between instantaneous and mean daily water level to aid in the design of river structures.
3.4.2 Ice cover: HLW1, HLQ1
Along with the drainage of surface water storage, a primary source of flow in unregulated rivers during the winter ice cover period is groundwater. The gradual drawdown of these contributions over the ice cover season leads to a reduction in river flow, with the water level eventually reaching a corresponding minimum value. In small streams, the minimum flow of the year may occur just after the first extremely cold period (United States Geological Survey, 1977). Since the open-water S-Q relationship does not hold under ice, the NHP daily reported first minimum winter water level (HLW1) and estimated first minimum winter discharge (HLQ1) over the ice period may not occur on the same day. For example, Fig. 6 depicts more than 3 months of separation between the two on the lower Athabasca River, where the higher reported water level in March has a smaller discharge compared to the November minimum water level event. This example illustrates how a thick late winter ice cover would raise water levels due to reductions in channel cross-sectional area. The HLQ1 is one of several water quality and aquatic habitat indicators in ice-affected rivers (Beltaos and Prowse, 2009; Peters et al., 2014), while an occurrence synonymous with the first minimum winter water level (HLW1) was recently highlighted as a determining factor for navigation within the Mississippi watershed (Giovando and Daly, 2019). These data on under-ice minimum magnitude and occurrence are to inform regional low-flow analyses (Beltaos and Prowse, 2009), environmental flow need assessments, water intake elevations, water withdrawal guidelines and cross-sectional habitat reductions during ice conditions (e.g. Peters et al., 2014).
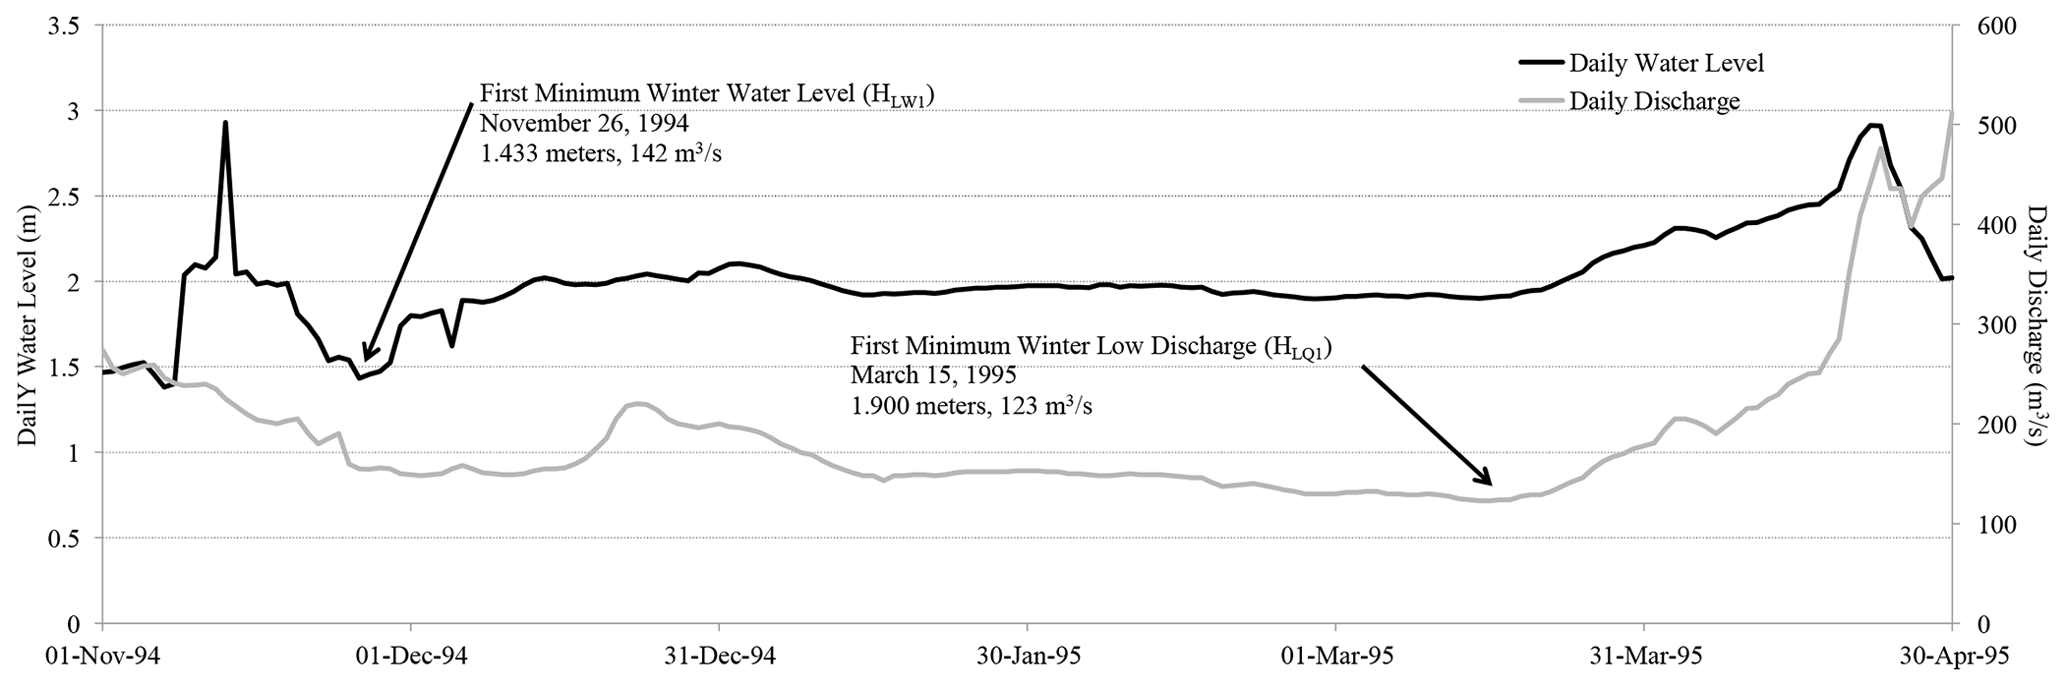
Figure 6Daily reported water level and discharge for the Athabasca River below Fort McMurray (07DA001) for the ice-affected (B flagged) period spanning 1 November 1994 to 30 April 1995. Note that an increase in water level does not necessarily result in more discharge due to the varying hydraulic effects of ice. Figure adapted from de Rham et al. (2019).
3.4.3 Ice cover: HMWB, HMWM
Rapidly warming air temperatures (above 0 ∘C) and associated rain-on-snow events during the ice cover season are the main causes of midwinter break-up events depicted as the water level trace in grey on Fig. 3. These events occur on both regulated (Picco et al., 2003) and unregulated rivers (Newton et al., 2017). The possibility of midwinter ice jams, elevated water levels and, in extreme cases, the freezing of overbank floodwaters, as shown in Fig. 7, are major threats to riverside communities and infrastructure (e.g. Beltaos, 2002; Beltaos et al., 2003; Curi et al., 2019). Interpretation of these “winter peaks” from water level records to determine if they are results of ice cover break-up is a challenge (Beltaos, 1990), especially in the absence of other supporting evidence (e.g. site observations, new reports, flood summaries). Similar to freeze-over interpretation (Sect. 3.4.1), the review of daily climate data from nearby stations informs us if temperatures exceed 0 ∘C and associated rainfall occurred. During data extraction it was often observed that midwinter break-up occurrence corresponded with tens of centimetres of reductions in daily snow on ground for day(s) prior to the event. A review of the discharge measurement summary (item 9, Sect. 3.1) also increased interpretation confidence when station visit remarks were available days before or after the “winter peak”, alluding to the channel ice condition or whether discharge measurements were collected from the ice cover or wading.
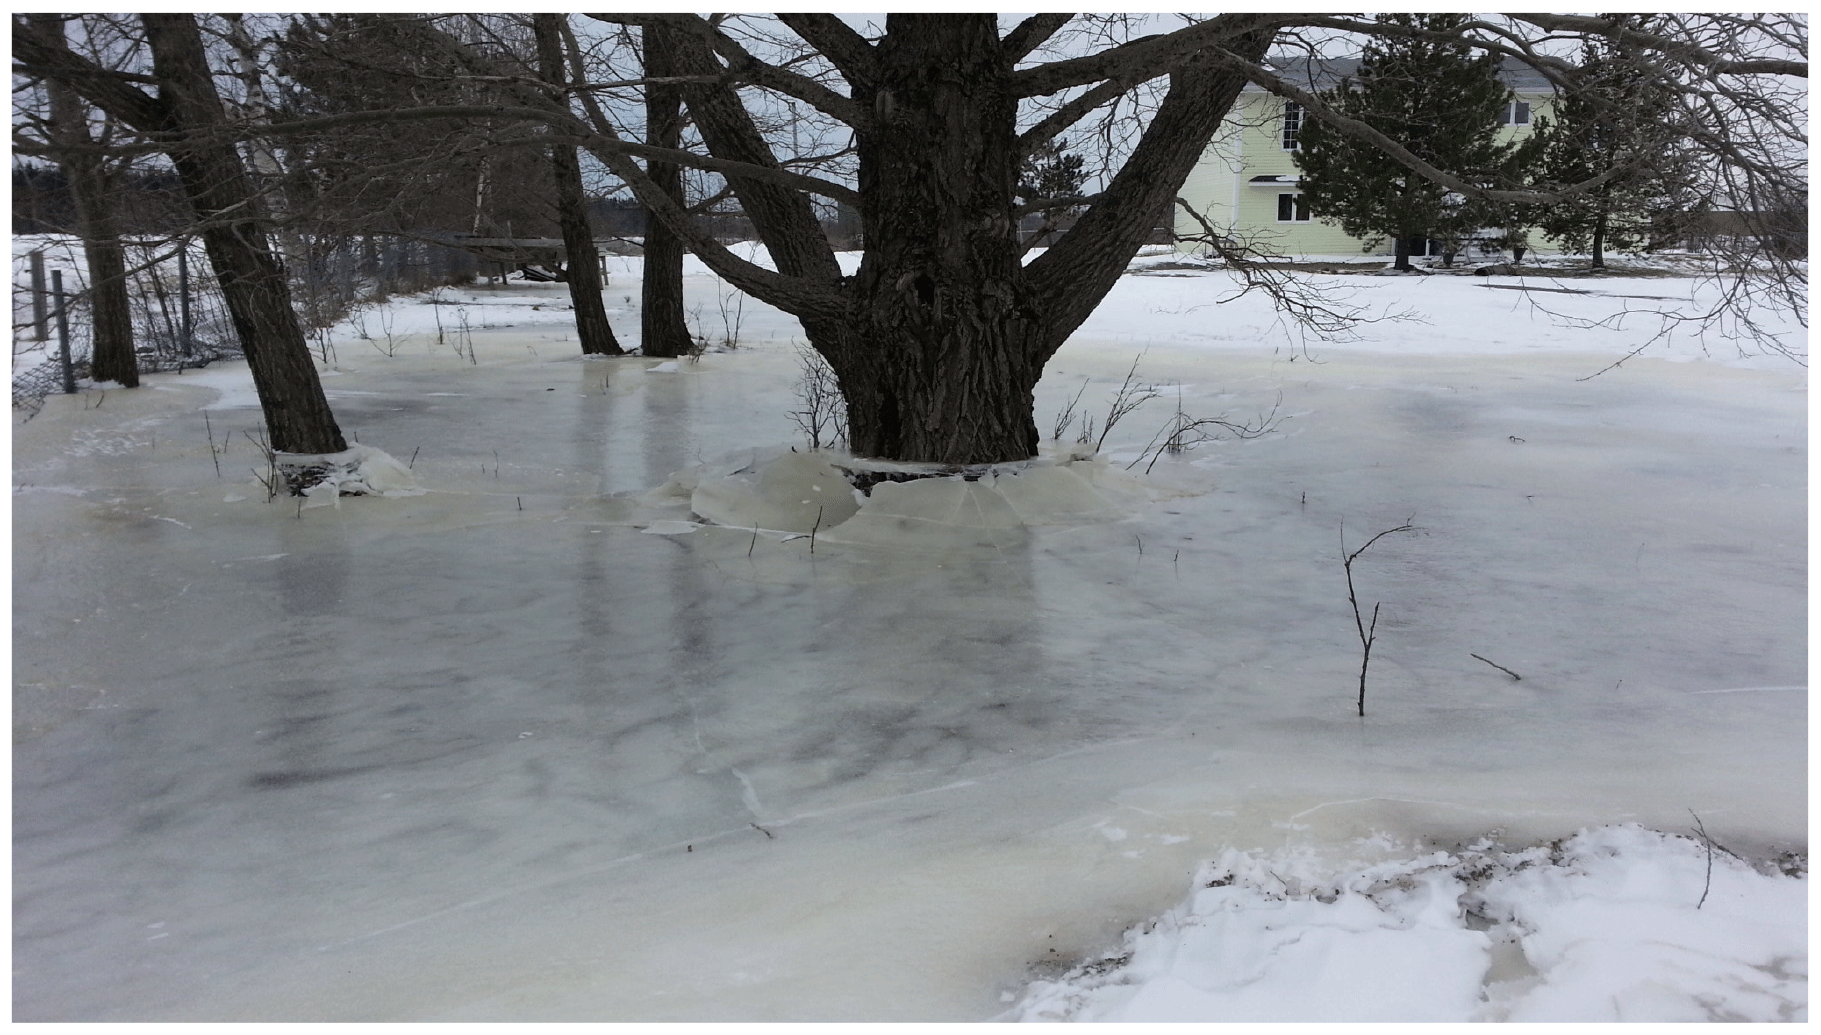
Figure 7Frozen water after midwinter break-up and over-bank flooding on the Exploits River. Image was taken on 9 February 2013 on Beothuck Street in Badger, Newfoundland. The ring of frozen ice around the tree trunk indicates the highest water level. Hydrometric station Exploits River at Badger (02YO013), which is not a CRID station, is ∼100 m from this location. Image taken from Rebello (2013).
The instantaneous HMWB represents the onset of ice cover movement at a site during the winter season and is identified as a spike on the rising limb of the water level record. The cause of this spike is a rapid decrease in hydraulic resistance as the ice cover breaks and starts moving downstream. This variable cannot be determined from mean daily summaries of water levels. Following the initial break-up event, the water level will typically continue to rise until it reaches a maximum value represented by instantaneous HMWM. For some stations, HMWB and HMWM can occur more than once during a single ice season (e.g. Beltaos, 2002). In such cases, only the first HMWB and the highest HMWM are included in the CRID. In some cases, a midwinter breakup event is followed by a dramatically cold period during which frazil generation is significant. The result may be very thick ice accumulations, more ice-jamming or new anchor ice cycles. For years with no continuous water level records, daily summaries (item 8, Sect. 3.1) were examined for a presence of a HMWM. NHP notations in the other archival documents (Sect. 3.1) and meteorological data review assisted judgement of whether these daily maximums likely represented a midwinter break-up. On occasion, a rudimentary internet search was used to find alternative verification. Midwinter break-up sites usually occurred in the temperate zone where B date flags can be intermittent, leading to complexity and additional interpretation in extracting the midwinter variables. For instance, a few winter break-up events were interpreted to occur during non-B dates because of the extreme water level magnitudes reported. Due to these inherent challenges of interpreting midwinter break-up events, a closer examination of the CRID time series and comparison to nearby hydrometric stations may be required before pursing further analysis.
3.4.4 Ice cover: HF2, HF2 MAX, HLW2, HLQ2
The occurrence of ice cover season maximum water levels not associated with the freeze-up or break-up of the ice cover were identified from the hydrometric archive and input to the CRID. If there was midwinter break-up event, an attempt was made to extract the first 7 d maximum average winter water level (HF2) after the event. As with HF (Sect. 3.4.1), these data may mark important parameters for the onset of break-up prediction. No attempt was made to identify an instantaneous HF2 since the CRID archive does not have historical pen recorder charts (Sect. 3.2) that extend far beyond the HMWM event. Examination of more recent continuous digital water level records reveals that after midwinter break-up, limited “stage up”, synonymous with HF, was usually observed. This may be due to the lack of complete ice flush down the channel after HMWM. Since large, fragmented ice blocks likely remain in the channel, the hydraulic resistance and refreezing of the ice cover is probably a less dynamic event. Daily water level values after midwinter break-up generally reveal a pattern of steadily declining daily water levels. Notably, this pattern is likely typical on relatively flat river channels, while on steep river sections, progressive frazil accumulation produced in newly open sections exposed to cold could increase water levels even during receding flows. If HMWM was followed by days with no “B” data flag, HF2 was restricted to days when the “B” data flag appeared again. As with the first freeze-up events, HF2 and the following 29 d of daily water level were recorded. Water levels within the first 7 d after HF2 were also assessed to extract a maximum (HF2 MAX) daily water level exceeding HF2. This variable may more closely match the instantaneous processes resulting in the HF occurrence
Maximum winter water level was also recorded at select locations with no midwinter break-up event. In this situation, the 7 d average water level beginning at HF2 exceeds that commencing from HF. This may correspond with a secondary stage during extreme cold events described by Hamilton (2003), with Fig. 8 depicting 1 month between the two peak stages. It is possible that rising water levels after HF are caused by secondary consolidation events (Andres, 1999; Andres et al., 2003; Wazney et al., 2018); however, the daily resolution may be too coarse to capture this short-lived occurrence. An HF2 is also reported (Beltaos, unpublished data) to occasionally occur on the regulated Peace River station at Peace Point (07KC001), when midwinter flow releases cause increasing water levels, but the ice cover remains stable. Some CRID stations reveal “creeping” water levels exceeding HF for most of the ice season (Fig. 9). In such cases, it was not possible to establish HF2, and their occurrences are not included in the CRID. This continuous wintertime increase in water levels could be caused by the development of anchor ice or continuous build-up of a hanging dam by frazil ice, although both cases require open water at or upstream of the gauging location. However, anchor ice formations are not known to remain in place for several months. Another possible explanation may be that, in the case of Fig. 9, the Pembina drainage area contains many swamps and muskegs with a water table at or near the surface (Farvolden, 1961), though this assumes no depletion of the water table during the period of ice cover.
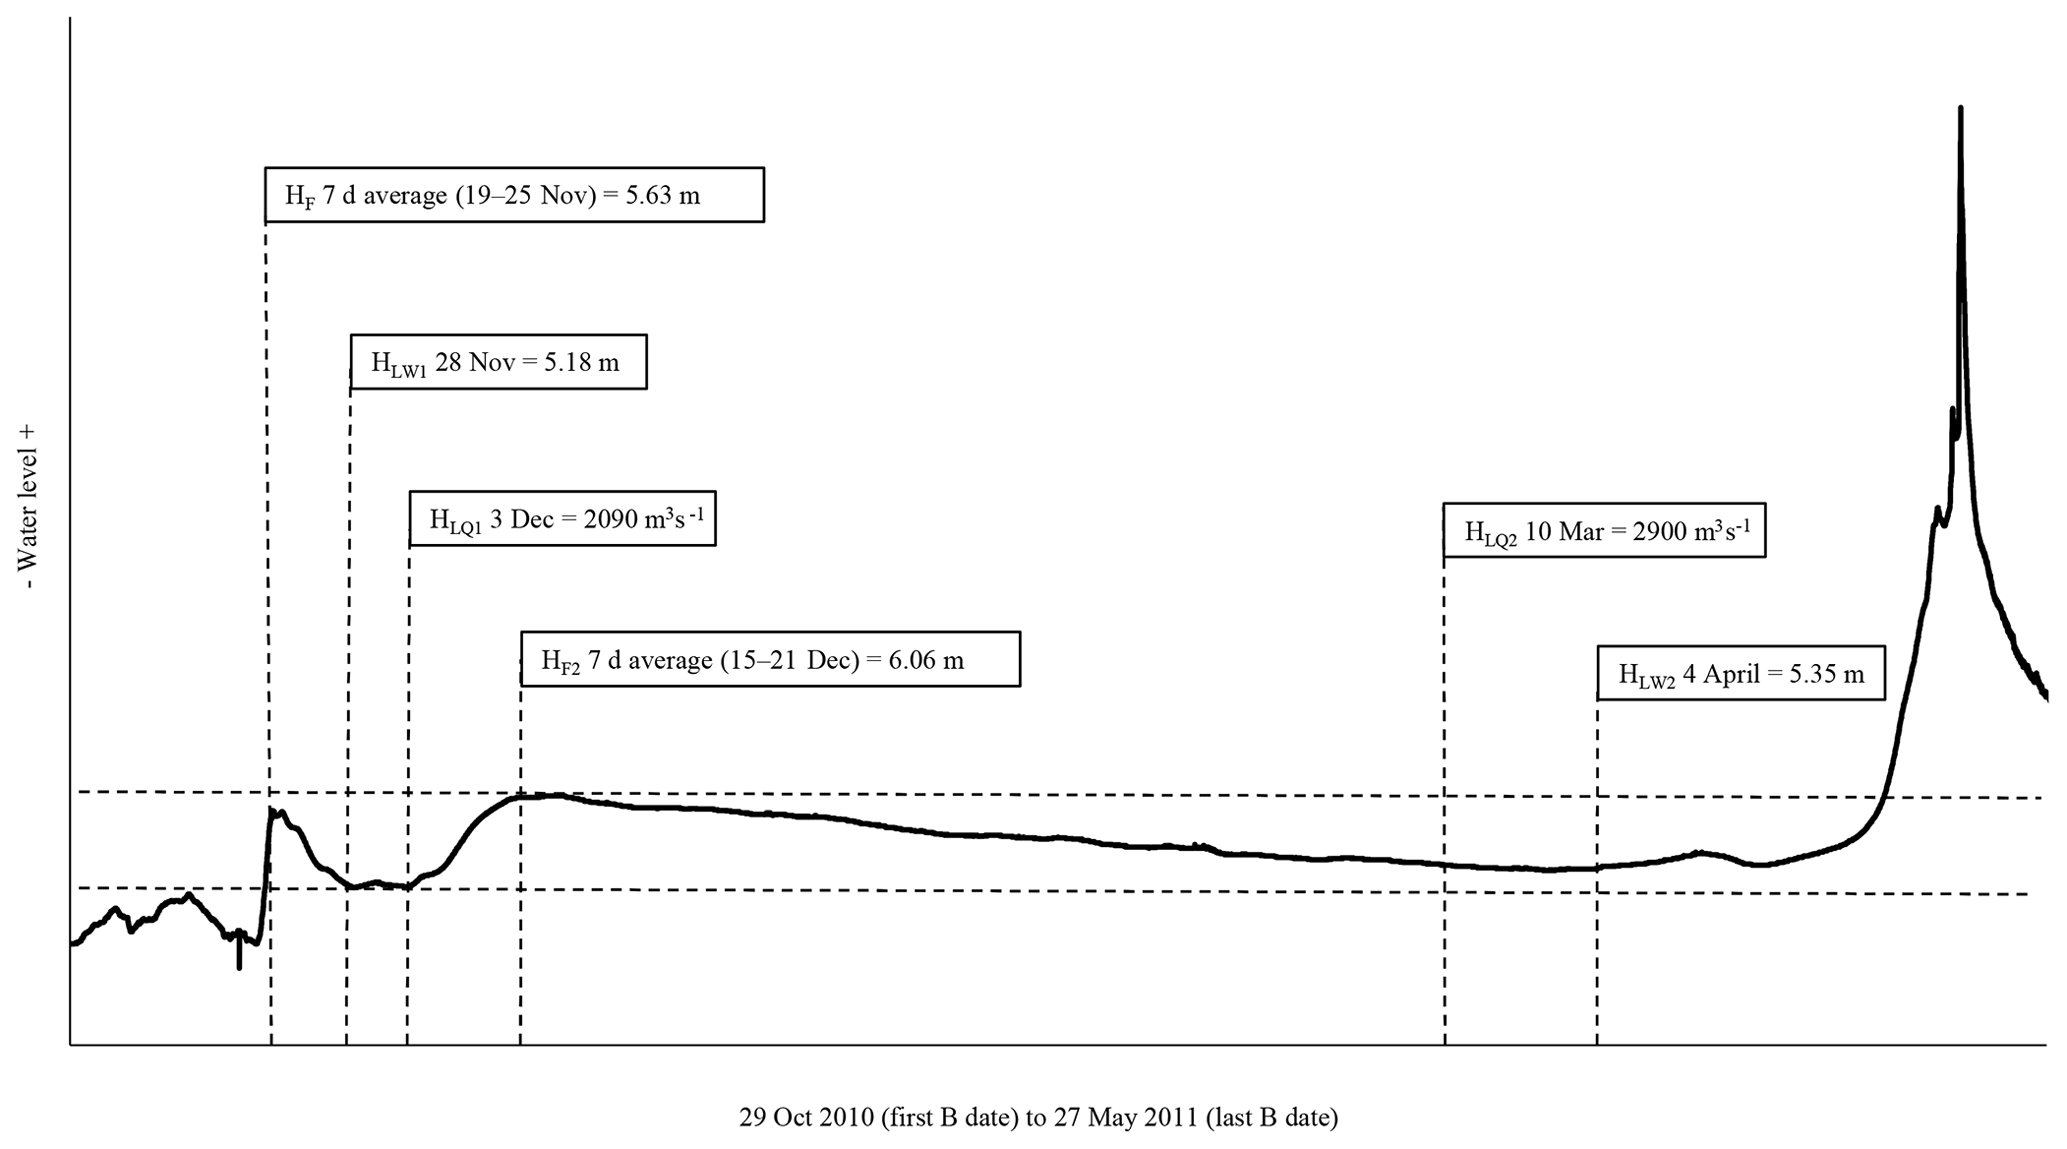
Figure 8Continuous water level record for Mackenzie River at Norman Wells during the 2010–2011 ice-affected flow period. Note the occurrence of a higher magnitude 7 d average following HF2 in comparison to HF and the corresponding second winter minimums (HLW2 and HLQ2) in addition to the first occurrence (HLW1 and HLQ1).
Whenever an HF2 variable was identified, the ice cover period was examined for a second winter-low water level (HLW2) and discharge (HLQ2) event. These data were only added to the CRID if HLW1 or HLQ1 were before HF2. At some locations, several months may have lapsed between the first and second occurrences of winter-low events, as shown in Fig. 8. The incident of a second winter-low is probably one of the most understudied events in ice-covered channels, while it can have all the water-quality- and navigation-related implications as that of the first winter-low events described in Sect. 3.4.2 above.
3.4.5 Ice cover: ITHICK
Hydrometric technicians visit gauging stations for velocity, water depth, discharge, and water level measurements and instrument maintenance approximately six to eight times per year, which includes both open-water and ice-covered conditions. During the latter, a measure related to the solid portion of the ice cover thickness is recorded on the site survey note (item 4, Sect. 3.1). End of ice cover season measurements quantify ice thickness prior to the spring break-up, and in some cases this may represent a pre-melt ice thickness, a relevant factor in break-up initiation and potential severity (Beltaos, 1997). Measurements prior to ∼1995 are generally limited to water surface elevation to bottom of ice cover and thus may underestimate the actual thickness of the ice cover as the specific gravity of river ice is commonly taken as 0.92. Nevertheless, these measurements are assumed to represent the actual ice cover thickness. WSC regional office and provincial partner protocols for collection and summary of these ancillary ice thickness data differ, while some of the more recent digital data archives may have actual ice thickness measurements. Figure 10 shows 19 channel depth and water surface to bottom of ice measurements. Some hydrometric survey notes report the presence of slush that results in an overestimate of channel ice depth. For the CRID, all cross-sectional ice thickness measurements were reviewed for the reporting of slush conditions, while all data were plotted to aid in visual identification and removal of measurements that include slush (see caption for Fig. 10). The remaining measurements were used to calculate the average river ice thickness (ITHICK).

Figure 9Daily water level from first B date to last B date at Pembina River station at Jarvie (07BC002) during the 2009–2010 ice-affected flow season that depict “creeping” water level. There are no B data flags from 17 October to 1 November and daily average water levels creeping upwards throughout the ice cover period.

Figure 10A bar plot of the 19 water surface to bottom of ice thickness measurements collected on 28 March 1978 at Nashwaak River below Durham Bridge (01AL002). The hydrometric survey note indicates that the measurement, at 30 m river cross section distance is slush to bottom. Visual examination of this plot reveals 4 other measurements (shown with white fill) that likely include slush. These 5 measurements are removed when calculating average river ice thickness.
In some years, visits and data collection at hydrometric stations were hampered by weather conditions, logistics or on-ice safety considerations. As an example, Fig. 11 shows a time series of 47 average ice thickness data points at one CRID location. Over the time series, the measurement dates range over a 10 week (72 d) time window. In addition to data collection timing, incomplete archiving and scanning for the database may also be a reason for missing or wide ranges in time series. Thus, any time series analysis of ITHICK needs to account for this year-to-year sample date variability. While an attempt was made to compile the time series of final (season's end) ice thickness measurements, a more detailed climatological analysis will be required to establish if this measurement was collected prior to the ice cover beginning to melt.
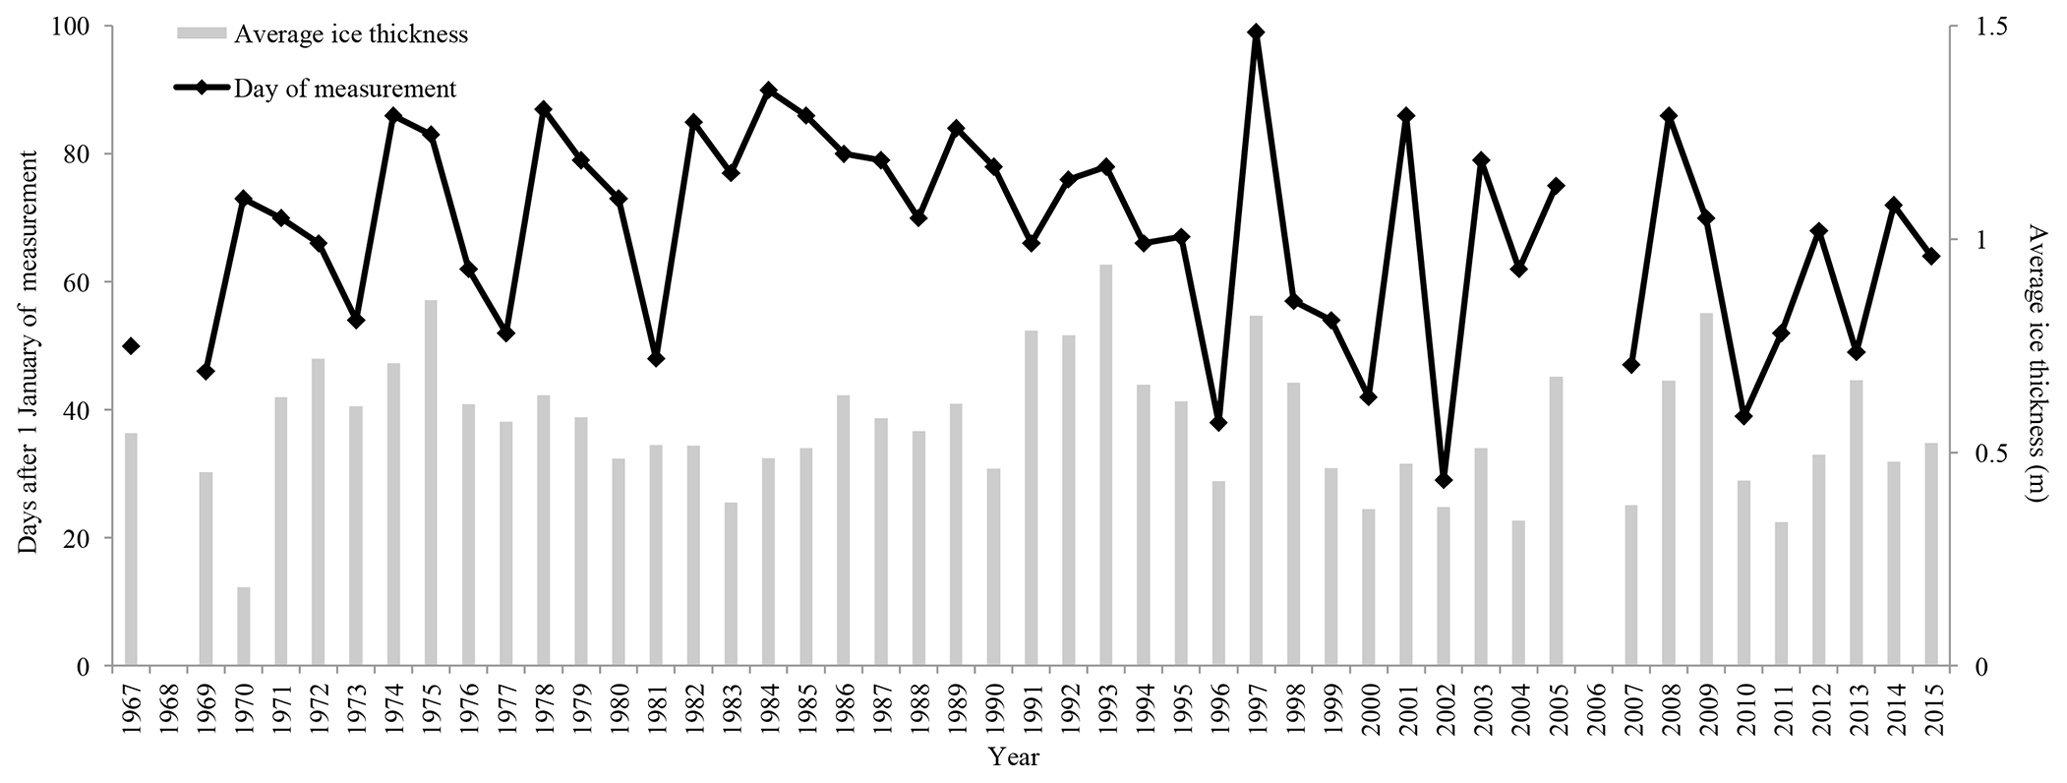
Figure 11Plot showing average ice thickness (grey bars) day of measurement (black line) at site Nashwaak River below Durham Bridge (01AL002). Measurement dates input to CRID represent a range of 72 d from 29 January (2002) to 9 April (1997). Initiation of break-up at this location ranges from 27 February (2010) to 13 April (2001) with the average being 25 March (84 d after 1 January).
3.4.6 Break-up: HB, HM, last B date
The end of the river ice season progresses through a continuum of spring break-up initiation (HB), maximum spring break-up water level (HM) and the last day of ice-affected flow (last B date). HB occurs at the initial downstream movement of river ice cover. The associated decrease in resistance to flow registers as a spike on the rising limb of the water level hydrograph (see Fig. 3). Beltaos (1990) indicated that identification of break-up initiation can be uncertain and that it is not possible to establish HB from a record of mean daily water level. Therefore, the timing and magnitude of HB may be less accurate than HM, the maximum instantaneous or daily water level established following HB. Data ratings are provided to indicate the resolution of these events. The last B date was the final day with a B data flag (R data flag for CEHQ sites).
The break-up period can be characterized as either thermal (overmature) or mechanical (dynamic) (Gray and Prowse, 1993; Beltaos, 2003). In the case of a thermal event, increasing air temperatures and solar radiation inputs during early spring cause the ice cover to decay. A slow increase in channel flow will prolong the decay period, and the resulting water levels do not reach magnitudes much beyond those with similar flow indicated by the open-water S-Q relationship. Conversely, a mechanical break-up is characterized by limited reduction in the mechanical strength of the ice cover and rapid increase in channel flow. As the rising flow eventually overcomes the resistance of the ice cover, the latter is mobilized in dynamic fashion and breaks down into slabs and blocks, which eventually are arrested by still-intact ice cover to form ice jams, typically at morphologically conducive locations such as constrictions and abrupt slope reductions. According to an anonymous reviewer, ice jams can also form at morphologically conducive locations even without an intact ice cover stopping the ice run. Earlier analysis reports indicated that HM can far exceed water levels that occur under similar open-water flow conditions (von de Wall et al., 2009, 2010; von de Wall, 2011). For example, at Liard River near the mouth (10ED001), the 25-year return period magnitude for ice-affected water level was 16.11 m versus 9.69 m for the open-water event (de Rham et al., 2008a). Depending on their location and persistence, ice jams lodged at or below the gauge site affect the local water levels to a varying degree. A jam lodged upstream of a gauge can also have measurable stage (actual discharge) depressions for several hours before reaching an equilibrium. The release of a jam can generate a sharp wave called a “jave” (Beltaos, 2013), yet another dynamic mechanism that can generate the identified HM on instantaneous water level recordings. Highly dynamic events, initiated with minimal or negligible ice cover decay, are sometimes referred to as “premature” and typically result from midwinter thaws accompanied by intense rain-on-snow runoff events (Deslauriers, 1968). It is likely that much of the CRID midwinter data described above in Sect. 3.4.3 are these highly dynamic events. The less common “overmature” break-up sequence was observed at some CRID stations with less obvious “spiking” of water levels. An example water level with this characteristic on the Peace River in 1982 (Fonstad, 1982) is included in Beltaos (1990), where minor water level perturbations are followed by a generally smooth reduction to open-channel conditions. In some cases the HB and HM were interpreted to occur at the same time.
Figure 12 shows an example timeline, with images of changing ice conditions for the year 2010 break-up sequence at Hay River station near Hay River (07OB001). Unfortunately, images at the extracted CRID timings of HB and HM are not available; however, images 5 min later are illustrative. The night-time image (24 April, 04:30 UTC) shows a large chunk of ice along the left channel bank, indicating fracture of the ice cover and initiation of break-up. An hour later, the near-open-channel condition (24 April, 05:30 UTC) highlights the downstream forces involved in flushing of in-channel ice. The image on 25 April at 15:30 UTC shows stranded ice fragments on the channel banks, 5 min after HM (25 April, 15:25 UTC). The peak water levels at HM and subsequent water level drop would raft and settle the ice fragments outside the channel.
While no last B date image is available, it is notable that the river ice break-up processes described occur prior to this date. While spring break-up peak water level magnitude and timing in the CRID have high degree of accuracy, classification of events as ice jam or not was not pursued as this would require local observations and/or photos. The last B date is sometimes used to represent break-up for time series analysis (e.g. Zhang et al., 2001; Chen and She, 2019), and a recent publication used B dates and discharge to assess trends in ice jam flooding events (Rokaya et al., 2018). Unlike using the last B date as a surrogate and/or index, the water-level-based data in the CRID provide the science community with a direct and thus more accurate data set towards analysis of spring break-up timing, magnitude and processes. For instance, the identification of HM provides the means to assess change in the flow magnitude driving spring breakup flooding, which would not be possible with discharge analysis alone and/or by solely identifying the last B date.

Figure 12Continuous 15 min interval water level hydrograph for 15 to 30 April 2010 at the National Hydrometric Program Hay River gauging station near Hay River (07OB001), along with images courtesy of the Alberta Research Group. (b) Image looking upstream taken 7 d prior to spring break-up initiation (HB) of 24 April 2010, 04:25 UTC. Channel width of approximately 63 m. Panel (c) is a night-time image 5 min after HB and shows evidence of fragmented ice in the channel. Panel (d) was taken 65 min after HB and shows the channel nearly clear of ice. Panel (e) was taken 5 min after the maximum spring break-up water level on 25 April 2010, 15:25 UTC. Stranded ice on channel banks indicates higher water levels. The last B date was 28 April 2010.
3.4.7 Open-water: HO
The CRID includes the magnitude and timing of the annual maximum open-water level (HO) and the associated discharge value at each station, along with data quality rating. These data are extracted from the hydrometric archives and are easily verified, as NHP web pages generally report both daily and instantaneous maximum annual discharge and timing. In the event of damaged or non-functioning instrumentation, NHP or CEHQ may estimate (data flagged with E) daily discharge values. The S-Q relationship (Sect. 3.1) can be used to estimate the associated water level. Gerard and Karpuk (1979) provided one of the earlier examples of comparing maximum ice-affected level versus open-water level on the Peace River. These types of analyses inform the hydrological community of the importance of looking at ice effects as the likely causes of maximum annual flood for nearly one-third of hydrometric stations in Canada (e.g. von de Wall, 2009) and most probably for a similar proportion of unmonitored sites. A Canadian perspective on flood processes (snowmelt, rain-on-snow, rainfall) and their seasonality is detailed in Buttle et al. (2016). Visual examination of HO time series on a stage–discharge plot is a cursory method to identify station movements, benchmark or datum shifts, or changes to the stage–discharge relationship. This is discussed in more detail below.
3.5 Data accuracy and precision, uncertainty, quality control and interpretation
The accuracy and precision of extracting water level, discharge and timing of the CRID variables is as follows. For the six grey-shaded instantaneous variables in Table 2 (HF, HMWB, HMWM, HB, HM, HO), extraction precision of up to two decimal places for the pre-1978 data (given in feet) and three decimal places for the post-1978 data (in metres) was possible based on visual inspection of the continuous (i.e. analogue) water level recording charts (pre ∼2000). All imperial data in feet were converted to metres using factor of 0.3048 and are reported to three decimal places in the CRID database. Although a lot of the water level records are continuous, the visual extraction method often limited the associated timing of an event to a 15 min resolution. Instantaneous timing at finer resolution within the CRID was usually obtained from alternative archival documents (e.g. annual water level page, station analysis or published online summaries). The widespread use of digital water level recording instrumentation after ca. 2000 decreased the temporal resolution (i.e. accuracy) of water level records as data collection interval varied from 5 to 15 to 60 min. Some data loggers also recorded hourly to sub-hourly maxima and minima, which increased the accuracy towards instantaneous events, though selection does require judgement. The vast majority of mean daily water level pages and some of the more recent digital water level recordings were deemed “preliminary” by NHP. Different methods of collecting requisite information for mean daily water level have existed over the archive from on-site station observers that viewed a staff gauge once daily to the more modern arithmetic averages determined from continuous water levels.
Quality control (QC) for the CRID has included preliminary data analysis and peer review of associated publications (Table 1). CRID station data were initially compiled as single-station Excel files that include all extracted water levels; discharges; date, time, and accuracy ratings; average ice thicknesses; and time series plots for visual identification of outliers. A separate station Excel file contains all available ice thickness measurements and average calculations. All finalized station data were compiled in to a single .csv file (118 columns×22 736 rows with 464 891 cell entries) for further QC. This single spreadsheet was examined for data entry errors using the filter and count capabilities inherent to Excel.
A quantification of human error in transcribing CRID data was undertaken using automated scripts to extract and compare the CRID daily discharge and first and last B date to those published by the NHP. Daily discharge was incorrectly transcribed on 4.7 % to 7.8 % of the time series depending on the variable, while midwinter associated discharge had the highest input error at 16 %. This higher percentage of error is a likely a remnant of the multiple rounds of revisions to midwinter time series and confusion that arises when examining non-consecutive events that can occur across calendar years. For ice seasons when both a first and last B date were available, dates were incorrectly transcribed on 7.5 % of time series. All erroneous daily discharge and first and last B date values were replaced. The remaining CRID data entries are not amendable to automated quality control since they were manually extracted. Based on these QC activities, the CRID likely has a 5 %–10 % data interpretation or entry error. The CRID initiation of break-up (HB) time series at the Red River site near Lockport (05OJ010) was provided to Becket (2020) who reported that, of the 34 years, 3 years of timing were revised based on evidence in newspapers (an ancillary evidence source not included in the CRID), while 2 years were found to be incorrectly interpreted and input to the CRID. One year was 12 h too early and another was 2 d too early. While it would be impractical to review the entire database for errors, users are encouraged to undertake their own QC activities and review the data disclaimer in Sect. 7. The data quality ratings should not replace the professional responsibility of engineers and geoscientists for the conception of flood maps and for the design of hydraulic structures. Original archival documents can be requested from the authors. Upload of this archive to a more convenient format may be pursued in the future. As is indicated on the open data portal where the CRID can be downloaded, ongoing work with the CRID may include error-checking and corrections, so users should use the latest version of the CRID by referring to the version number that appears in the .csv file name (http://data.ec.gc.ca/data/water/scientificknowledge/canadian-river-ice-database/CRID_BDCGF_Versioning_EN_FR.txt, last access: 20 July 2020).
Extraction of river ice data from hydrometric records is a time-consuming and detail-oriented task. The average time needed by an experienced investigator to identify and input data associated with the 15 CRID variables for a 1-year period at a single station was about 1 h. Besides the laborious nature of this work, additional uncertainties are caused by site-specific phenomena that can have varying effects on water level. The NHP archives include field observations of beaver dams in the channels; open water leads at, upstream, or downstream of the gauge; percentage of ice cover at gauge; water flowing between the ice layers; and anchor ice at a cross section. While these types of observations are not part the CRID, users should be aware of such factors that add further complexity to wintertime water level interpretation. Furthermore, collection of data using a stilling well (von de Wall, 2011) could also affect resultant water level interpretation. Since river ice processes are site specific, users should be aware of possible spatial discrepancy in location of gauge site versus where ice thickness and flow measurements are collected. Access to ice cover and worker safety are field-based considerations that can result in wintertime cross section measurements taken metres or kilometres upstream or downstream from the actual gauge. Another consideration is that many gauges are located near a bridge, which provides a safe platform from which water velocity measurements can be performed. Bridge pilings would change the hydraulics and very likely the ice condition on a river channel, such as promoting a thicker ice cover in the deck shadow and promoting ice-jamming against abutment or piers. Finally, changes to watershed characteristics such as urbanization and agriculture likely have effects on river ice hydrology.
CRID users should also bear in mind that all variables were transcribed directly as recorded in the NHP archive. There is no tabulation of at-station movements, benchmark, or datum shifts or changes to the stage–discharge relationship. Since river ice processes are site specific, prior to time series analysis of phenology or water level data an accounting for these factors towards assessments of station homogeneity is a necessary next step. For example, Fig. 13 shows all Albany River CRID data on a stage–discharge plot. The WSC website informs us that the station was relocated in 1988 with a new gauge height, and as a result this rudimentary visualization of data towards confirming non-homogeneity reveals the maximum open-water level magnitudes (blue circles) plots as two separate populations that are not directly comparable for many types of analysis.
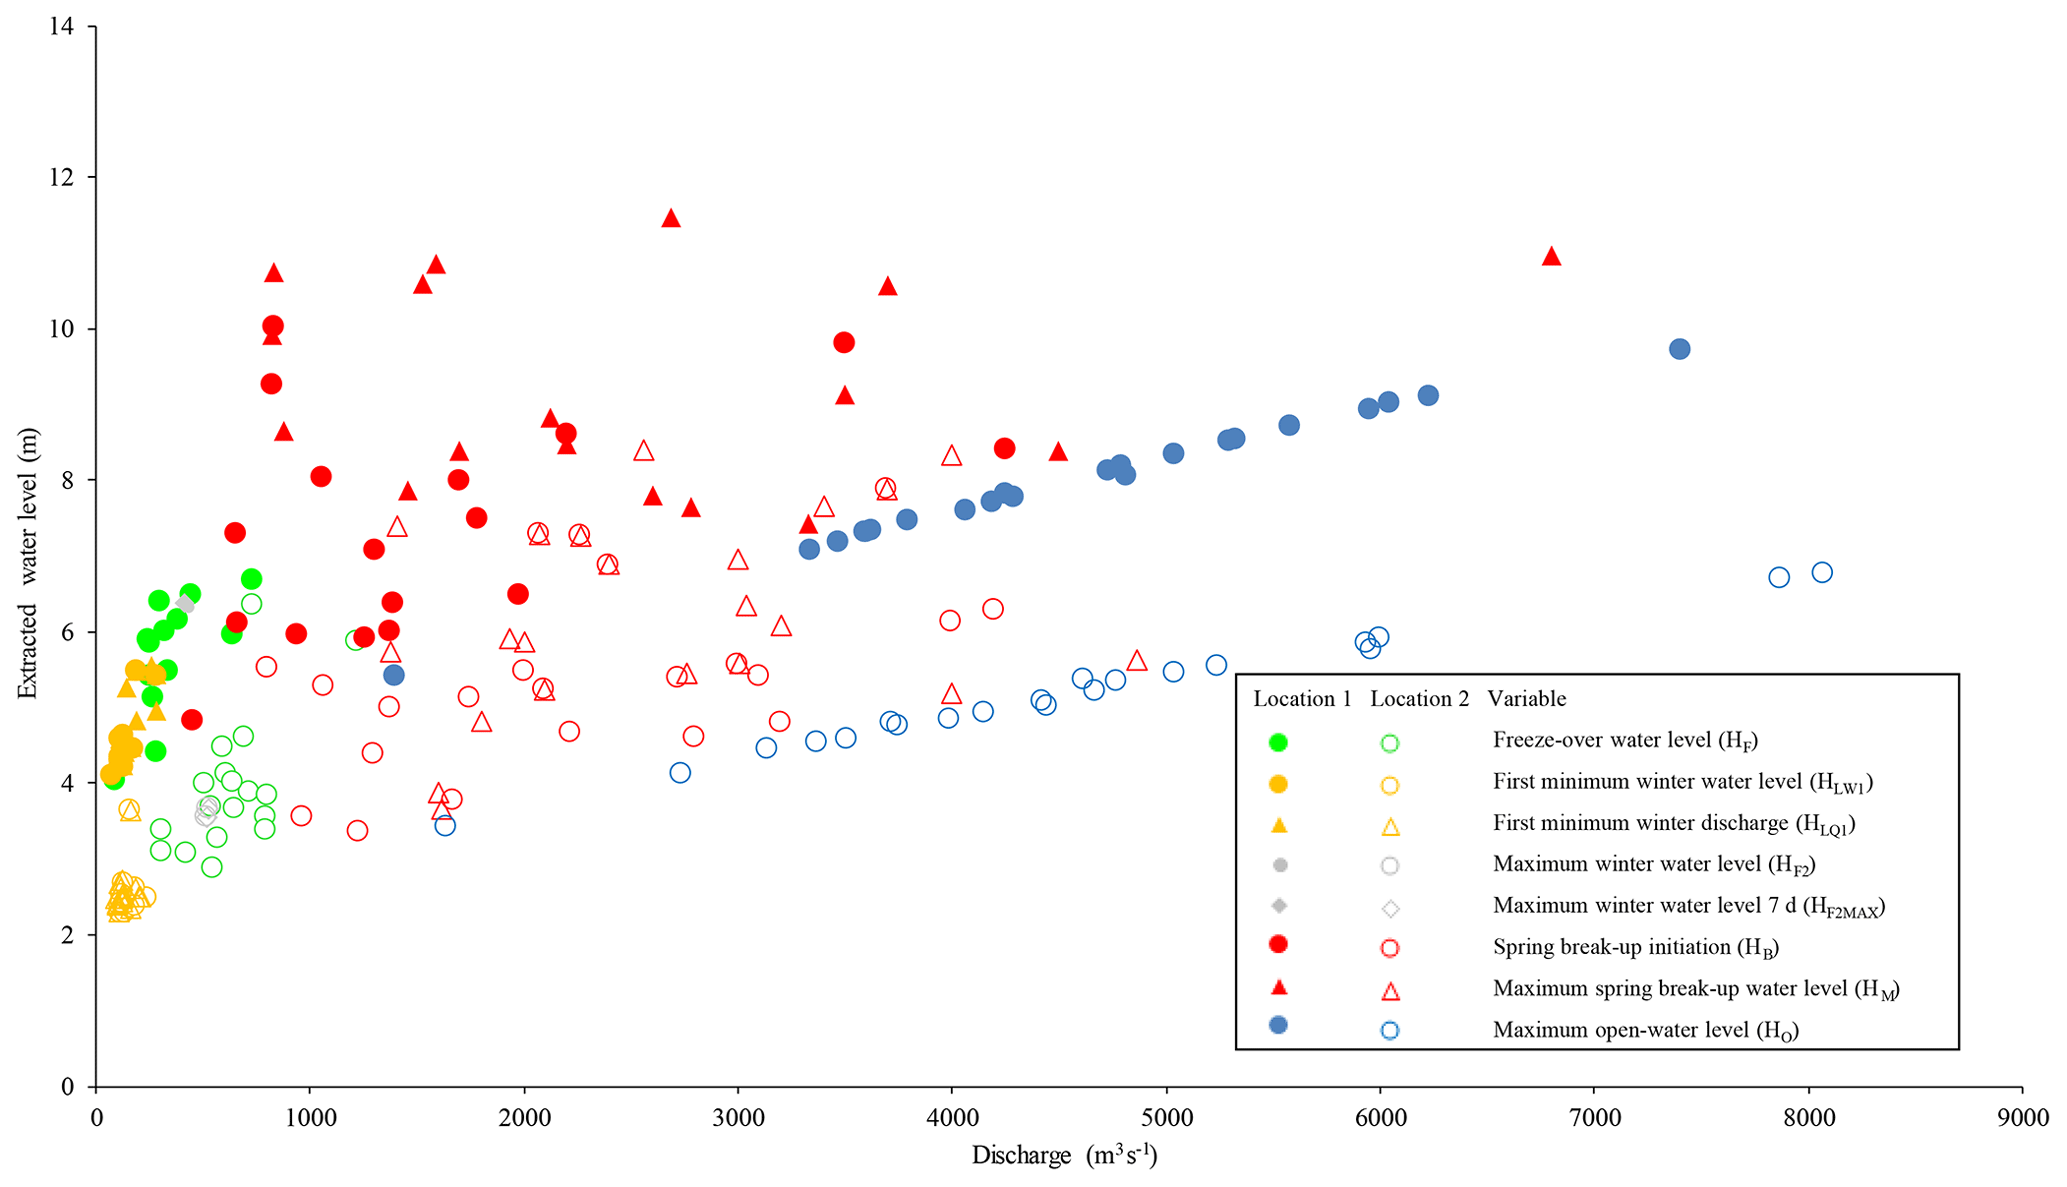
Figure 13A stage–discharge plot of Canadian River Ice Database variables for the Albany River site near Hat Island (04HA001). Time series (1964–2015) symbols are separated into location 1 and location 2 to illustrate the effect of the gauge being moved approximately 3.5 km downstream on 29 September 1988. Since the stage–discharge relationship is invalid during ice conditions, visual inspection of river ice variables reveals considerable scatter. The blue open-water time series (HO) illustrate a shift caused by a station movement and the two separate data populations.
4.1 The CRID
Nearly 2 decades of data collection efforts and study have culminated in the CRID, which covers a network of 196 hydrometric stations with data up to 31 December 2015 that collectively represent 10 378 station years of active operation. During the first decade, the work focused primarily on the spring break-up season, while for the past decade it was expanded to include the entire period of ice-affected flow. The 15 variables are spread over different stages of the annual period (Table 4) and include minimum daily and maximum instantaneous water level events, ice thickness, and discharge-based metrics and provide a comprehensive baseline data set for research purposes. The CRID is available for download at https://doi.org/10.18164/c21e1852-ba8e-44af-bc13-48eeedfcf2f4 (de Rham et al., 2020).
Table 4Total number of variables that populate the Canadian River Ice Database and their data quality ratings. Grey shading indicates that an attempt was made to extract the instantaneous water level. Also included are column totals per river type: natural versus regulated, active versus discontinued and homogeneous versus heterogeneous.
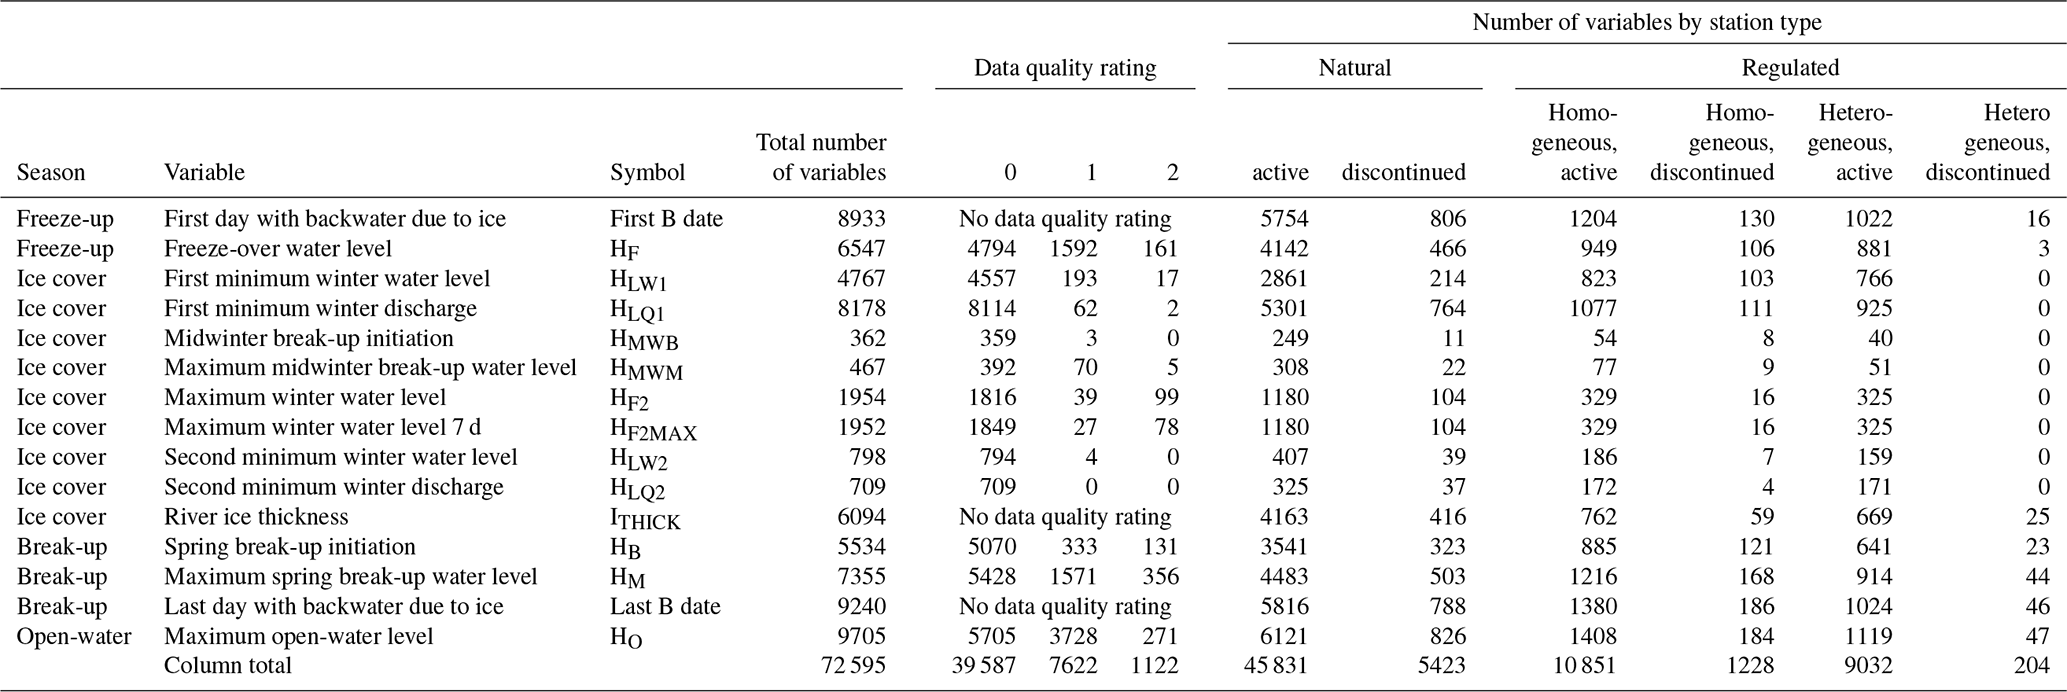
In total, the CRID holds 72 595 recorded variables with more than 460 000 data entries of water level, discharge, date, time and data quality rating based on the review of over 100 000 hydrometric archive files. Tabulation of the 6094 ice thickness measurements required examination on the order of 100 000 cross-sectional measurements and removal of slush-affected data. In terms of data completeness, extraction of maximum open-water level (Ho) was the most successful, covering 9705 (94 %) of the 10 378 active station years. Similarly, the 8933 (9240) first (last) day with backwater due to ice (B dates) and 8178 first minimum winter discharge populate the majority of active station years and attest to the NHP historical mandate to publish discharge information. Freeze-over water level and maximum spring break-up water level were extracted from 72 % and 80 % of those years reporting first and last B date. This first known attempt to centralize data on midwinter break-up occurrence includes 467 maximum midwinter break-up water level and 362 associated midwinter break-up initiation events. The data quality rating presented in Table 4 confirms that the NHP archive is a high-quality source of river ice information, with 82 % of data rated as “0”. Although some of the data have lower quality ratings, their inclusion increases the population size and helps provide a more complete spatial and temporal coverage over Canada.
While the CRID represents the largest existing effort to extract river ice variables from hydrometric archives, it does not provide a complete time series of ice events at the nearly 2800 active and 5500 discontinued hydrometric stations in Canada. However, it covers a representative sample with six station types (Table 4), including natural and regulated sites, along with their status as active or discontinued during time of operation up until 31 December 2015. Regulated locations are also split into homogeneous and heterogeneous depending on when the regulation began during the measurement timeline. Active station data comprise over 90 % of the CRID. Discontinued stations provide additional information and help increase the density of the network. Reasons for less than complete at-station time series include seasonal operation, damage to water level recording instrumentation, no available hydrometric archive for a particular year, or loss of information during the CRID archival and scanning process.
4.2 Utility of the database and research needs
The CRID can be used for the study of river ice processes and the key characteristics of different ice regimes that are encountered within Canada and how these characteristics may have changed over time. From a practical standpoint, there are many flood-prone sites across Canada, and various municipalities often commission engineering studies to assess open-water and ice jam flood risk. If a site happens to be included in the database, much effort could be saved by, for example, having a readily available historical record of maximum ice-influenced levels and related flows, their time of occurrence, and the thickness of the winter ice cover. Maximum ice-affected water levels in the CRID are a good candidate for inclusion to the National Ice Jam Database (Muise et al., 2019), a Natural Resources Canada contribution to the Federal Floodplain Mapping Guidelines (https://www.publicsafety.gc.ca/cnt/mrgnc-mngmnt/dsstr-prvntn-mtgtn/ndmp/fldpln-mppng-en.aspx, last access: 20 July 2020).
It has been established that extreme flooding in ∼30 % of Canadian rivers is often the result of ice processes and jamming (Beltaos, 1984; von de Wall, 2009), with water levels exceeding those occurring under open-water conditions (e.g. Gerard, 1989). At these locations stream discharge cannot be used to quantify flood level since the open-water stage–discharge relationship is invalid during ice conditions. Some classification schemes have been proposed to help educate current and future hydrological practitioners on the types and significance of river ice processes and ice jams (IAHR Working Group on River Ice Hydraulics 1986; Turcotte and Morse, 2013). However, river ice is generally omitted from major Canadian hydrological and hydraulic research initiatives (e.g. NSERC FloodNet, 2015, and other groups mentioned by Turcotte et al., 2019), likely as a result of the limited long-term field data representing these complex and sometimes chaotic events of ice formation, growth and decay. Many national-scale assessments of flooding make little mention of river ice conditions, their implications to extreme water levels, and the inherent challenges encountered in the estimation and reporting of discharge under ice (e.g. Cunderlink and Ouarda, 2009; Burn and Whitfield, 2015). Variables from the CRID should, when applicable, be considered for use in future hydrological initiatives and flood assessments. Beltaos and Prowse (2009) also made numerous research recommendations towards the study of river ice conditions. Examples include calculation of trends in the frequency and magnitude of ice jams and the thickness and strength of pre-break-up ice covers, the evaluation of climate-induced changes on river ice hydrology, and quantification of intervals between major river ice events. The CRID provides the necessary baseline data for a complete national assessment of river ice conditions and can help identify rivers and regions where climate change adaptation may be of high priority.
There are a variety of other research questions that can be addressed using the CRID. Many were detailed in CRIPE 2019 proceedings (de Rham et al., 2019) and are reiterated or updated here, such as application of site-specific break-up forecast methodologies (e.g. Beltaos, 1997; Beltaos et al., 2003), flood studies and their relations with regional climate (Buttle et al., 2016), evaluation of locations using the global river ice classification model (Turcotte and Morse, 2013), cold-region ecological assessments (e.g. Peters et al., 2014, 2016), baseline information for under-ice sediment transportation studies (as reviewed by Turcotte et al., 2011) and riverine habitats stressors (as reviewed by Prowse and Culp, 2008), calibration and validation of river ice hydrology (Morales-Marin et al., 2019) and hydraulic (Lindenschmidt, 2017) modelling efforts, and ground truth observations for remote sensing applications (Pavelsky and Smith, 2004; Yang et al., 2020).
The CRID is available for download as a single .csv format file on the Government of Canada open data portal at https://doi.org/10.18164/c21e1852-ba8e-44af-bc13-48eeedfcf2f4 (de Rham et al., 2020). A 0.5 Terabyte digital archive of all available scanned and digital hydrometric archives, which contains around 30 000 folders and over 100 000 files, is stored on the ECCC server and is available up request.
The Watershed Hydrology and Ecology Research Division of Environment and Climate Change Canada has compiled the CRID for public access through the Government of Canada open data portal. This effort follows the recommendation of the 1990 CRIPE sponsored report “Working Group on River Ice Jams”, specifically “Chapter 2: Guideline for Extraction of Ice-Break-Up Data From Hydrometric Station Records” (Beltaos, 1990). National Hydrometric Program gauge records proved to be very valuable sources of field data for parameterization of ice-related hydrologic events on Canadian rivers. This work involved reviewing over 10 000 station years worth of data from a select subset of 196 stations, covering a range of stream types and climatic regions, to identify and extract recorded data corresponding to 15 variables comprising water levels, discharges, timings, ice thickness and data quality ratings. Close to 73 000 records of river ice variables are now available to the water research community. For sites that are not included, the CRID can represent a template to extract pertinent information for various purposes, including flood mapping and hydraulic structure design. It is recommended that periodic updates be made to this database since a longer time series record is of more value. Based on the 160 locations in operation up to 31 December 2015 (Table A1), a 5-year update of CRID time series (2016–2020) would require 800 person-hours of work. Evaluation of future research priorities is needed to formalize whether this task would be completed by the same group or undertaken by others. It is fortunate that much of the task of data acquisition discussed above could be automated using the Aquarius platform currently in use by NHP partner organizations (Stuart Hamilton, personal communication, 25 June 2019). It is also recommended that a tabulation of station movements, benchmark, or datum shifts and changes to the stage–discharge relationship be compiled to rectify the site-specific nature of river ice conditions and non-homogeneous time series. Lastly, the CRID follows on several other notable national and international efforts to compile river ice information. The Global Lake and River Ice Phenology Database (Benson et al., 2000), the Canadian Ice Database (Lenormand et al., 2002), CRREL Ice Jam Database (Carr et al., 2015), and Russian River Ice Thickness and Duration database (updated by Shiklomanov and Lammers, 2014) represent major open data contributions to river ice science over the past 2 decades. The CRID expands on the number of variables considered, as well as the temporal and spatial scope of these earlier databases for stations in Canada. The work highlights the excellence of NHP agencies in the collection and dissemination of hydrometric data, adds value to the NHP archive, and delivers on Environment and Climate Change Canada's commitment to making water science knowledge and data openly available to the scientific community and the general public. The CRID supports continued research on river ice processes and the extreme water level fluctuations common to many cold-region river systems.
Table A1List of the 196 National Hydrometric Program stations that comprise the Canadian River Ice Database. Data extraction time period are shown in the “start” and “end” columns. Locations with “rivière” in the name of the water course are in Quebec. The “type” column is the regime type, defined as follows: natural, active (NA); natural, discontinued (ND); regulated, heterogeneous, active (RHEA); regulated, heterogeneous, discontinued (RHED); regulated, homogeneous, active (RHOA); regulated, homogeneous discontinued (RHOD).

LdR coordinated this study, completing data extraction, data entry, and quality control and also wrote the manuscript. YD supervised this study as principal investigator since 2017 and reviewed the manuscript. SB conceptualized the extraction of river-ice-related data from hydrometric records in 1990, provided technical guidance throughout the study and reviewed the manuscript. DP provided technical input in the data extraction, data quality, and ecological and flood aspects and also reviewed the manuscript. BB advised on river regulation, hydroclimatic regions, and time series uncertainties and also reviewed the manuscript. TP, ECCC Emeritus Scientist since 2017, initiated this study as a principle investigator in the late 1990s.
The authors declare that they have no conflict of interest.
Environment and Climate Change Canada employs every reasonable effort, whenever feasible, to ensure the currency, accuracy and precision of the information provided. However, there are some limitations due to the sources of the data and the technology used in their processing and management. Furthermore, the material or any data derived using the data are subject to interpretation. Users are responsible for verifying that the supplied material is appropriate for the use or application for which they wish to employ it.
The authors are extremely grateful to NHP partner organizations (WSC, CEHQ, and the governments of AB and SK), along with their regional staff, for providing access to the hydrometric data archives, in-kind support and technical input though multiple phases of this long-term project. We thank the effort of the hydrometric field workers in the collection and maintenance of this data over the period covered in the CRID. The authors want to make mention of individuals (with affiliation at the time) who spent many hours compiling and extracting data at various phases of the study: Tom Carter, Martin Lacroix, Jennifer Pesklevits (ECCC), Dwayne Keir, Kyle Eyvindson, Shannon Croutch (University of Saskatchewan), Steeve Deschenes, Jane Drengson, Holly Goulding, Graham McGrenere, Peter Bi, Kirsten Brown, and Simon von de Wall (University of Victoria). Thank you to Josh Hartmann (University of Victoria) for his work automating the compilation of the CRID from individual Excel files and quality control of the B dates and discharge values. Thank you very much to Benoit Turcotte, Zoe Li and an anonymous referee for the detailed reviews that improved this paper.
This paper was edited by Giulio G. R. Iovine and reviewed by Benoit Turcotte, Zoe Li, and one anonymous referee.
Andres, D. D.: The effect of freezing on the stability of a juxtaposed ice cover, in: Proceedings of the 10th Workshop on the Hydraulics of Ice Covered Rivers, Winnipeg, Canada, 1999.
Andres, D. D., Van Der Vinne, G., Johnson, B., and Fonstad, G.: Ice consolidation on the Peace River: release patterns and downstream surge characteristics, in: Proceedings of the 12th Workshop on the Hydraulics of Ice Covered Rivers, Edmonton, Canada, 2003.
Becket, M.: Investigation of the Occurrence of Ice Jams on the Lower Red River in Manitoba, M. Sc. thesis, Department of Civil Engineering, University of Manitoba, Winnipeg, Canada, 2020.
Beltaos, S.: Guidelines for extraction of ice break-up data from hydrometric station records, in: Working Group on River Ice Jams – Field Studies and Research Needs, edited by: Beltaos, S., Gerard, R., Petryk, S., and Prowse, T. D., NHRI Science Report No. 2. National Hydrology Research Institute. Environment Canada, Saskatoon, Saskatchewan, 37–70, 1990.
Beltaos, S.: Onset of river ice break-up, Cold Reg. Sci. Technol., 25, 183–196, https://doi.org/10.1016/S0165-232X(96)00011-0, 1997.
Beltaos, S.: Effects of climate on mid-winter ice jams, Hydrol. Process., 16, 789–804, https://doi.org/10.1002/hyp.370, 2002.
Beltaos, S: Reply to Discussions by Timoney et al. (2018) and Hall et al. (2018) on “Frequency of ice-jam flooding of Peace-Athabasca Delta”, Can. J. Civil Eng., 46, 243–248, https://doi.org/10.1139/cjce-2018-0724, 2019.
Beltaos, S.: Numerical modelling of ice-jam flooding on the Peace–Athabasca delta, Hydrol. Process., 17, 3685–3702, https://doi.org/10.1002/hyp.1355, 2003a.
Beltaos, S.: Threshold between mechanical and thermal breakup of river ice cover, Cold Reg. Sci. Technol., 37, 1–13, https://doi.org/10.1016/S0165-232X(03)00010-7, 2003b.
Beltaos, S.: River flow abstraction due to hydraulic storage at freezeup, Can. J. Civil Eng., 36, 519–523, https://doi.org/10.1139/L08-128, 2009.
Beltaos, S.: Canadian Geophysical Union Hydrology Section Committee on River Ice Processes and the Environment: Brief History, J. Cold Reg. Eng., 26,, 71–78, https://doi.org/10.1061/(ASCE)CR.1943-5495.0000046, 2012a.
Beltaos, S.: Mackenzie Delta flow during spring breakup: Uncertainties and potential improvements, Can. J. Civil Eng., 39, 579–588, https://doi.org/10.1139/l2012-033, 2012b.
Beltaos, S.: Hydrodynamic characteristics and effects of river waves cause by ice jam releases, Cold Reg. Sci. Technol., 85, 42–55, https://doi.org/10.1016/j.coldregions.2012.08.003, 2013.
Beltaos, S. and Carter, T.: Field studies of ice breakup and jamming in lower Peace River, Canada, Cold Reg. Sci. Technol., 56, 102–114, https://doi.org/10.1016/j.coldregions.2008.11.002, 2009.
Beltaos, S. and Prowse T.: River-ice hydrology in a shrinking cryosphere, Hydrol. Process., 23, 122–144, https://doi.org/10.1002/hyp.7165, 2009.
Beltaos, S., Gerard, R., Petryk, S., and Prowse, T.D.: Working Group on River Ice Jams – Field Studies and Research Needs, NHRI Science Report No. 2. National Hydrology Research Institute, Environment Canada, Saskatoon, Saskatchewan, 1990.
Beltaos, S., Ismail, S., and Burrell, B. C.: Midwinter breakup and jamming on the upper Saint John River: a case study, Can. J. Civil Eng., 30, 77–88, https://doi.org/10.1139/l02-062, 2003.
Benson, B., Magnuson, J., and Sharma, S.: updated 2013. Global Lake and River Ice Phenology Database, Version 1, National Snow and Ice Data Center, https://doi.org/10.7265/N5W66HP8, 2000.
Brimley, W. A. and Freeman, C. N.: Trends in River ice cover in Atlantic Canada, in: Proceedings 9th Workshop on the Hydraulics of Ice Covered Rivers, Fredericton, Canada, available at: http://cripe.ca/publications/proceedings/9 (last access: 20 July 2020), 1997.
Brooks, R. N.: Quantifying peak freshwater ice across the Northern Hemisphere using a regionally defined degree-day ice-growth model, M.Sc. thesis, Department of Geography, University of Victoria, Victoria, Canada, available at: http://hdl.handle.net/1828/4035, (last access: 20 July 2020), 2012.
Brooks, R. N., Prowse, T. D., and O'Connell, I. J.: .Quantifying Northern Hemisphere freshwater ice, Geophys. Res. Lett., 40, 1128–1131, https://doi.org/10.1002/grl.50238, 2013.
Burn, D. H. and Whitfield, P. H.: Changes in floods and flood regimes in Canada, Can. Water Resour. J., 41, 139–150, https://doi.org/10.1080/07011784.2015.1026844, 2015.
Buttle, J. M., Allen, D. M., Cassie, D., Davison, B., Hayashi, M., Peters, D. L., Pomeroy, J. W., Simonovic, S., St-Hilaire, A., and Whitfield, P. H.: Flood processes in Canada, regional and special aspects, Can. Water Resour. J., 41, 7–30, https://doi.org/10.1080/07011784.2015.1131629, 2016.
Carr, M. L., Gaughan, S. P., George, C. R., and Mason, J. G.: CRREL'S Ice Jam Database: Improvement and Updates, in: Proceedings of the 18th Workshop on the Hydraulics of Ice Covered Rivers, Quebec City, Canada, 18–20, available at: http://cripe.ca/publications/proceedings/18 (last access: 20 July 2020), 2015.
Chen, Y. and She, Y.: Temporal and Spatial Variation of River Ice Breakup Timing across Canada, in: Proceedings of the 20th Workshop on the Hydraulics of Ice Covered Rivers, Ottawa, Canada, available at: http://cripe.ca/publications/proceedings/20 (last access: 20 July 2020), 2019.
Cunderlik, J. M. and Ouardra, T. B. M. J.: Trends in the timing and magnitude of floods in Canada, J. Hydrol., 375, 471–480, https://doi.org/10.1016/j.jhydrol.2009.06.050, 2009.
Curi, F., Boyd, D., Carson, R., and Rungis, G.: Brantford 2018 Ice Jam, in: Proceedings of the 20th Workshop on the Hydraulics of Ice Covered Rivers, Ottawa, Canada, available at: http://cripe.ca/publications/proceedings/20 (last access: 20 July 2020), 2019.
De Coste, M., She, Y., and Blackburn, J.: Incorporating the effects of upstream ice jam releases in the prediction of flood levels in the Hay River delta, Canada, Can. J. Civil Eng., 44, 643–651, https://doi.org/10.1139/cjce-2017-0123, 2017.
De Munck, S., Gauthier, Y., Bernier, M., Chokmani, K., and Légaré, S.: River predisposition to ice jams: a simplified geospatial model, Nat. Hazards Earth Syst. Sci., 17, 1033–1045, https://doi.org/10.5194/nhess-17-1033-2017, 2017.
de Rham, L. P.: Spatial and Temporal Variations of River-ice Break-up, Mackenzie River Basin, Canada, M.Sc. thesis, Department of Geography, University of Victoria, Victoria, Canada, available at: http://hdl.handle.net/1828/1609 (last access: 20 July 2020), 2006.
de Rham, L. P., Prowse, T. D., Beltaos, S., and Lacroix, M. P.: Assessment of annual high-water events for the Mackenzie River basin, Canada, Hydrol. Process., 22, 3864–3880, https://doi.org/10.1002/hyp.7016, 2008a.
de Rham, L. P., Prowse, T. D., and Bonsal, B. R.: Temporal variations in river-ice break-up over the Mackenzie River Basin, Canada, J. Hydrol., 349, 441–454, https://doi.org/10.1016/j.jhydrol.2007.11.018, 2008b.
de Rham, L., Prowse, T., and Dibike, Y.: Progress towards the development of a Canadian River-ice Database, poster at: 71st Canadian Water Resources Association National Conference, Victoria, Canada, 2 May–June 1, 2018, 2018.
de Rham, L., Dibike, Y., Prowse, T. D., and Beltaos, S.: Overview of a Canadian River Ice Database Derived from Water Survey of Canada Hydrometric Archives, in: Proceedings of the 20th Workshop on the Hydraulics of Ice Covered Rivers, Ottawa, Canada, available at: http://cripe.ca/publications/proceedings/20 (last access: 20 July 2020), 2019.
de Rham, L., Dibike, Y., Beltaos, S., Peters, D., Bonsal, B., and Prowse, T.: Canadian River Ice Database, Environment and Climate Change Canada, https://doi.org/10.18164/c21e1852-ba8e-44af-bc13-48eeedfcf2f4, 2020.
Derksen, D., Burgress, D., Duguay, D., Howell, S., Mudryk, L., Smith, S., Thackeray., C., and Kirchmeier-Young, M.: Chapter 5: Changes in Snow, Ice and Permafrost Across Canada, in: Canada's Change Climate Report, https://changingclimate.ca/CCCR2019, 2019.
Deslauriers, C. E.: Ice break-up in rivers, in Proceedings of the Conference on Ice Pressures against Structures, NRC Technical Memorandum No. 92, 217–229, 1968.
Environment Canada: Manual of Hydrometric Data Computation and Publication Procedures, Fifth Edition, Inland Waters Directorate, Internal Report, Ottawa, 1980.
Environment Canada: Hydrometric Manual – Data Computations. Prepared by Water Survey of Canada, available at: http://www.wmo.int/pages/prog/hwrp/qmf-h/documents/qmsdoc/qSOP-Eng-LevelQ3/qSOP-NA037-00-2012 Hydrometric Manual - Data Computations.pdf (last access: 20 July 2020), 2012.
Farvolden, R. N.: Groundwater Resource Pembina Area, Alberta. Research Council of Alberta, Preliminary Report 61-4, available at: https://ags.aer.ca/document/ESR/ESR_1961_04.pdf (last access: 20 July 2020), 1961.
Fonstad, G. D.: Peace river 1981/92 ice observation report, River Engineering Branch, Alberta Environment, Edmonton, Alberta, 61 pp., 1982.
Fulton, J. W., Henneberg, M. F., Mills, T. J., Kohn, M. S., Epstien, B., Hittle, E. A., Damshen, W. C., Laveau, C. D., Lambrecht, J. M., and Farmer, W. H.: Computing under-ice discharge: A proof-of-concept using hydro acoustics and the Probability Concept, J. Hydrol., 562, 733–748, https://doi.org/10.1016/j.jhydrol.2018.04.073, 2018.
Gebre, S. B. and Alfredson, K. T.: Investigation of river ice regimes in some Norwegian water courses, in Proceeding of the 15th Workshop on the Hydraulics of Ice Covered Rivers, Winnipeg, Manitoba, Canada, available at: http://www.cripe.ca/publications/proceedings/16 (last access: 20 July 2020), 2011.
Gerard, R.: Chapter 10: Ice jam floods, in: Hydrology of Floods in Canada, edited by: Watt, W. E., National Research Council of Canada, Ottawa, Canada, 169–184, 1989.
Gerard, R. and Karpuk, E.: Probability analysis of historical flood data, J. Hydraul. Div. ASCE, 105, 1153–1165, 1979.
Giovando, J. and Daly, S.: Mississippi River Ice Bite, in: Proceedings of the 20th Workshop on the Hydraulics of Ice Covered Rivers, Ottawa, Canada, available at: http://cripe.ca/publications/proceedings/20 (last access: 20 July 2020), 2019.
Goulding, H. L.: Spatial and temporal patterns and hydroclimatic controls of river ice break-up in the Mackenzie Delta, NWT, M.Sc. thesis, Department of Geography, University of Victoria, Victoria, Canada, available at: http://hdl.handle.net/1828/1285 (last access: 20 July 2020), 2008.
Goulding, H. L., Prowse, T. D., and Beltaos, S.: Spatial and temporal patterns of break-up and jam flooding in the Mackenzie Delta, NWT, Hydrol. Process., 23, 2654–2670, https://doi.org/10.1002/hyp.7251, 2009a.
Goulding, H. L., Prowse, T. D., and Bonsal, B.: Hydroclimatic controls on the occurrence of break-up and ice-jam flooding in the Mackenzie Delta, NWT, Canada, J. Hydrol., 379, 251–267, https://doi.org/10.1016/j.jhydrol.2009.10.006, 2009b.
Gray, D. M. and Prowse, T. D.: Snow and floating ice, in: Handbook of Hydrology, edited by: Maidment, D., McGraw-Hill, New York, 7.1–7.58, 1993.
Groudin, D.: Summary Reports of maximum water levels under open-water and ice affected conditions at 16 hydrometric sites in Quebec, Environment Canada contract KW504-000117, 2001.
Gullet, D. W., Skinner, W. R., and Vincent, L.: Development of an historical Canadian climate database for temperature and other climate elements, Climatol. Bull., 26, 125–131, 1992.
Hall, R. I., Wolfe, B. B., and Wiklund, J. A.: Discussion of “Frequency of ice-jam flooding of Peace-Athabasca Delta”, Can. J. Civil Eng., 45, 71–75, https://doi.org/10.1139/cjce-2017-0434, 2018.
Hamilton, S.: Winter Hydrometry. Real-time data issues, in: Proceedings of the 12th Workshop on the Hydraulics of Ice Covered Rivers, Edmonton, Canada, available at: http://www.cripe.ca/publications/proceedings/12 (last access: 20 July 2020), 2003.
Healy, D. and Hicks, F.: Index velocity methods for winter discharge measurement, Can. J. Civil Eng., 31, 407–419, https://doi.org/10.1139/l04-001, 2004.
Hicks, F.: An overview of river ice problems: CRIPE07 guest editorial, Cold Reg. Sci. Technol., 55, 175–185, https://doi.org/10.1016/j.coldregions.2008.09.006, 2008.
IAHR Working Group on River Ice Hydraulics: River ice jams: a state of the art report. Proceedings, IAHR International Ice Symposium, Iowa City, U.S.A., III, 561–594, 1986.
Jasek, M. J.: 1998 break-up and flood on the Yukon River at Dawson Did El Nino and Climate change play in role?, in: Ice in Surface Waters, edited by: Shen, H. T., Balkema, Rotterdam, 761–768, 1999.
Kennedy, J. F.: Ice-jam mechanics, in Proceedings of the 3rd IAHR international Symposium on Ice Problems, Hanover, New Hampshire, 143–164, 1975.
Lacroix, M., Prowse, T. D., Bonsal, B., Duguay, C., and Menard, P.: River Ice Trends in Canada, in: Proceedings of the 13th Workshop on Hydraulics of Ice Covered Rivers, Hanover, USA, available at: http://cripe.ca/publications/proceedings/13 (last access: 20 July 2020), 2005.
Lenormand, F., Duguay, C. R., and Gauthier, R.: Development of a historical ice database for the study of climate change in Canada, Hydrol. Process., 16, 3707–3722, https://doi.org/10.1002/hyp.1235, 2002.
Lindenschmidt, K. E.: RIVICE – A Non-Proprietary, Open-Source, One-Dimensional River-Ice Model, Water, 9, 314, https://doi.org/10.3390/w9050314, 2017.
Lindenschmidt, K.-E., Baulch, H. M., and Cavalier, E.: River and Lake Ice Processes – Impacts of Freshwater Ice on Aquatic Ecosystems in a Changing Globe, Water, 10, 1586, https://doi.org/10.3390/w10111586, 2018.
Morales-Marin, L. A., Sanyal, P. R., Kadowaki, H., Li, X., Royaka, P., and Lindenschmidt, K. E.: A hydrological and water temperature modelling framework to simulate the timing of river freeze-up and ice-cover breakup in large-scale catchments, Environ. Modell. Softw., 114, 49–63, https://doi.org/10.1016/j.envsoft.2019.01.009, 2019.
Muise, P., Tolszczuk-Leclerc, S., and Gauthier, Y.: Proposal for a National River Ice Database Model and Integration with NRCan Observer, NRCan's CGI Mobile Application. poster at: Proceedings of the 20th Workshop on the Hydraulics of Ice Covered Rivers, Ottawa, Canada, available at: http://cripe.ca/publications/proceedings/20 (last access: 20 July 2020), 2019.
Newton, B. W.: An evaluation of winter hydroclimatic variables conducive to snowmelt and the generation of extreme hydrologic events in western Canada, Ph.D. thesis, Department of Geography,, University of Victoria, Victoria, Canada, available at: https://dspace.library.uvic.ca//handle/1828/9965 (last access: 20 July 2020), 2018.
Newton, B. W., Prowse, T. D., and de Rham, L. P.: Hydro-climate drivers of mid-winter break-up of river ice in western Canada and Alaska, Hydrol. Res., 48, 945–956, https://doi.org/10.2166/nh.2016.358, 2017.
NSERC FloodNet: NSERC Canadian Strategic Network for Enhancing Flood Forecasting and Management Capacity in Canada, McMaster University, Hamilton, ON, 41 pp., 2015.
Pavelsky, T. M. and Smith, L. C.: Spatial and temporal patterns in Arctic river ice breakup observed with MODIS and AVHRR time series, Remote Sens. Environ., 93, 328–338, https://doi.org/10.1016/j.rse.2004.07.018, 2004.
Pelletier, P. M.: A Review of Techniques used by Canada and other Northern Countries for Measurement and Computation of Streamflow under Ice Conditions: Paper presented at the 8th Northern Res. Basins Symposium/Workshop (Abisko, Sweden, March 1990), Hydrol. Res., 21, 317–340, https://doi.org/10.2166/nh.1990.0023, 1990.
Peters, D. L., Prowse, T. D., Pietroniro, A., and Leconte, R.: Flood Hydrology of the Peace-Athabasca Delta, Northern Canada, Hydrol. Process., 20, 4073–4096, https://doi.org/10.1002/hyp.6420, 2006.
Peters, D. L., Monk, W. A., and Baird, D. J.: Cold-regions Hydrological Indicators of Changes (CHIC) for ecological flow needs assessments, Hydrol. Sci. J., 59, 502–516, https://doi.org/10.1080/02626667.2013.835489, 2014.
Peters, D. L., Cassie, D., Monk, W. A., Rood, S. B., and St-Hilaire, A.: An ecological perspective on floods in Canada, Can. Water Resour. J., 41, 288–306, https://doi.org/10.1080/07011784.2015.1070694, 2016.
Picco, R., Ali Khan, A., and Rollings, K.: Badger Flood 2003 Situation Report. Newfoundland Department of Environment, Water Resour. Div., available at: https://www.mae.gov.nl.ca/waterres/flooding/badger.html (last access: 20 July 2020), 2003.
Poyser, B., Leblanc, R., and Kirk, D: Lesson Package No. 20 – Computation of Daily Discharge (Ice Conditions), The Water Survey of Canada, Hydrometric Career Development Program, 1999.
Prowse, T. D. and Carter, T.: Signification of ice-induced storage to spring runoff: a case study of the Mackenzie River, Hydrol. Process., 14, 779–788, https://doi.org/10.1002/hyp.371, 2002.
Prowse, T. D. and Culp, J. M.: River ice breakup: a neglected factor in river ecology, in: River ice breakup, edited by: Beltaos, S., Water Resources Publications, Highlands Ranch, Colorado, USA, 2008.
Prowse, T. D. and Lacroix, M.: Hydrologic Extremes on Arctic Flowing Rivers: Analysis and Recovery Summary Data Archive Report, Climate Change Action Fund Project S99-13-13, 6 pp. + Appendices, 2001.
Prowse, T. D., Lacroix, M. P., and Beltaos, S.: Flood frequencies on cold-regions rivers, in: abstracts of the 27th Scientific Meeting of the Canadian Geophysical Union, Ottawa, Canada, 14–17 May 2001.
Rebello, K.: Badger Flood Event – Field Report Februrary 2013, Government of Newfoundland and Labrador, available at: https://www.mae.gov.nl.ca/waterres/flooding/badger.html (last access: 20 July 2020), 2013.
Rokaya, P., Budhathoki, S., and Lindenschmidt, K.-E.: Trends in the Timing and Magnitude of Ice-Jam Floods in Canada, Nat. Sci. Rep., 8, 1–9, https://doi.org/10.1038/s41598-018-24057-z, 2018.
Shiklomanov, A. and Lammers, R. B.: River ice responses to a warming Arctic – recent evidence from Russian rivers, Environ. Res. Lett., 9, 1–0, https://doi.org/10.1088/1748-9326/9/3/035008, 2014.
Smith, L. C.: Trends in Russian Arctic River-ice formation and breakup, 1917 to 1994, 21, 46–56, https://doi.org/10.1080/02723646.2000.10642698, 2000.
Soldatova, I. I.: Secular variation in river break-up dates and their relationship with climate variation, Russ. Meteorol. Hydrol., 9, 70–76, 1993.
Timoney, K., Smith, J. D., Lamontagne, J. R., and Jasek, M.: Discussion of “Frequency of ice-jam flooding of Peace-Athabasca Delta”, Can. J. Civil Eng., 46, 1–4, https://doi.org/10.1139/cjce-2018-0409, 2018.
Turcotte, B. and Morse, B.: A global river ice classification model, J. Hydrol., 507, 134–148, https://doi.org/10.1016/j.jhydrol.2013.10.032, 2013.
Turcotte, B., Morse, B., Bergeron, N. E., and Roy, A. G.: Sediment transport in ice affected rivers, J. Hydrol., 409, 561–577, https://doi.org/10.1016/j.jhydrol.2011.08.009, 2011.
Turcotte, B., Burrell, B. C., Beltaos, S., and She, Y.: The Impact of Climate Change on Breakup Ice Jams in Canada: State of knowledge and research approached, in: Proceedings of the 20th Workshop on the Hydraulics of Ice Covered Rivers, Ottawa, Canada, available at: http://cripe.ca/publications/proceedings/20 (last access: 20 July 2020), 2019.
United States Geological Survey: National Handbook of Recommended Methods for Water Data Acquisition, Office of Water Data Coordination, Reston, VA, 1977.
von de Wall, S. J.: An Assessment of the river ice break-up season in Canada, M.Sc. thesis, Department of Geography, University of Victoria, Victoria, Canada, available at: http://hdl.handle.net/1828/3752 (last access: 20 July 2020), 2011.
von de Wall, S. J., de Rham, L. P., and Prowse, T. D.:Open water and ice-induced extreme water levels on Canadian rivers, in: 17th International Northern Research Basins Symposium and Workshop, Iqaluit-Pangnirtung-Kuujjuaq, Canada, 12–18 August, 2009.
von de Wall, S. J., de Rham, L. P., and Prowse, T. D.: The river ice break-up season in Canada: variations in water levels and timing. 67th Eastern Snow Conference, Jiminy Peak Mountain Resort, Hancock, MA, USA, 8–10 June 2010.
Vuglinsky, V.: Russian River Ice Thickness and Duration, Version 1, National Snow and Ice Data Center, https://doi.org/10.7265/N5J10129, 2000.
Vuglinsky, V. S.: Ice regime in the rivers of Russia, its dynamics during last decades and possible future changes, in: 18th IAHR International Symposium on Ice, Sapporo, Japan, 1, 93–98, 2006.
Wazney, L. and Clark, S. P.: The 2009 flood event in the Red River Basin: Causes, assessment and damages, Can. Water Resour. J., 41, 56–64, https://doi.org/10.1080/07011784.2015.1009949, 2015.
Wazney, L., Clark, S. P., and Wall, A. J.: Field monitoring of secondary consolidation events and ice cover progression during freeze-up on the Lower Dauphin River, Manitoba, Cold Reg. Sci. Technol., 148, 159–171, https://doi.org/10.1016/j.coldregions.2018.01.014, 2018.
White, K. D.: A New Ice Jam Database, J. Am. Water Resour. Assoc., 32, 341–348, https://doi.org/10.1111/j.1752-1688.1996.tb03456.x, 1996.
Yang, X., Pavelsky, T. M., and Allen, G. H.: The past and future of global River Ice, Nature, 577, 69–73, https://doi.org/10.1038/s41586-019-1848-1 , 2020.
Zhang, X., Harvey, K. D., Hogg, W. D., and Yuzyk, T. R.: Trends in Canadian streamflow, Water Resour. Res., 37, 987–998, https://doi.org/10.1029/2000WR900357, 2001.
Zhang, X., Buchberger, S. G., van Zyl, J. E.: A Theoretical Explanation for Peaking Factors. World Water and Environmental Resources Congress, ASCE Library, availble at: https://ascelibrary.org/doi/10.1061/40792%28173%2951 (last access: 20 July 2020), 2005.
The requested paper has a corresponding corrigendum published. Please read the corrigendum first before downloading the article.
- Article
(6067 KB) - Full-text XML