the Creative Commons Attribution 4.0 License.
the Creative Commons Attribution 4.0 License.
 | 15 Jul 2020
Development of a global 30 m impervious surface map using multisource and multitemporal remote sensing datasets with the Google Earth Engine platform
Xiao Zhang
Changshan Wu
Xidong Chen
Yuan Gao
Shuai Xie
Bing Zhang
The amount of impervious surface is an important indicator in the monitoring of the intensity of human activity and environmental change. The use of remote sensing techniques is the only means of accurately carrying out global mapping of impervious surfaces covering large areas. Optical imagery can capture surface reflectance characteristics, while synthetic-aperture radar (SAR) images can be used to provide information on the structure and dielectric properties of surface materials. In addition, nighttime light (NTL) imagery can detect the intensity of human activity and thus provide important a priori probabilities of the occurrence of impervious surfaces. In this study, we aimed to generate an accurate global impervious surface map at a resolution of 30 m for 2015 by combining Landsat 8 Operational Land Image (OLI) optical images, Sentinel-1 SAR images and Visible Infrared Imaging Radiometer Suite (VIIRS) NTL images based on the Google Earth Engine (GEE) platform. First, the global impervious and nonimpervious training samples were automatically derived by combining the GlobeLand30 land-cover product with VIIRS NTL and MODIS enhanced vegetation index (EVI) imagery. Then, the local adaptive random forest classifiers, allowing for a regional adjustment of the classification parameters to take into account the regional characteristics, were trained and used to generate regional impervious surface maps for each geographical grid using local training samples and multisource and multitemporal imagery. Finally, a global impervious surface map, produced by mosaicking numerous regional maps, was validated by interpretation samples and then compared with five existing impervious products (GlobeLand30, FROM-GLC, NUACI, HBASE and GHSL). The results indicated that the global impervious surface map produced using the proposed multisource, multitemporal random forest classification (MSMT_RF) method was the most accurate of the maps, having an overall accuracy of 95.1 % and kappa coefficient (one of the most commonly used statistics to test interrater reliability; Olofsson et al., 2014) of 0.898 as against 85.6 % and 0.695 for NUACI, 89.6 % and 0.780 for FROM-GLC, 90.3 % and 0.794 for GHSL, 88.4 % and 0.753 for GlobeLand30, and 88.0 % and 0.745 for HBASE using all 15 regional validation data. Therefore, it is concluded that a global 30 m impervious surface map can accurately and efficiently be generated by the proposed MSMT_RF method based on the GEE platform. The global impervious surface map generated in this paper is available at https://doi.org/10.5281/zenodo.3505079 (Zhang and Liu, 2019).
- Article
(12579 KB) - Full-text XML
- BibTeX
- EndNote


Impervious surfaces are usually covered by anthropogenic materials which prevent water penetrating into the soil (Weng, 2012) and are primarily composed of asphalt, sand and stone, concrete, bricks, glass, etc. (Chen et al., 2015). Due to the rapid growth in the area covered by impervious surfaces, a series of climate, environmental and social problems are emerging, including urban heat islands, traffic congestion, waterlogging and the deterioration of the urban environment (Fu and Weng, 2016; Gao et al., 2012; Weng, 2001; Zhou et al., 2017, 2018). Furthermore, as an important indicator in the monitoring of the intensity of human activity and of ecological and environmental changes, the mapping of impervious surfaces is of great interest in many disciplines (Xie and Weng, 2017). Accurate large-area impervious surface mapping is, therefore, urgent and necessary.
Due to the frequent and large-area coverage that it provides, increasing attention has been paid to the use of remote sensing technology for impervious surface mapping. In recent years, a lot of effort has gone into mapping impervious surfaces at different spatial resolutions (Elvidge et al., 2007; Schneider et al., 2010, 2009). For example, Schneider et al. (2010) used multitemporal MODIS data to produce a 500 m global urban land map, achieving an overall accuracy of 93 % and kappa coefficient of 0.65. Elvidge et al. (2007) combined the Defense Meteorological Satellite Program (DMSP) Operational Linescan System (OLS) and LandScan population count data to produce a 1 km global impervious surface area map. However, because of the complex characteristics of impervious landscapes and inherent resolution of human activity, coarse-resolution global impervious surface maps are not suitable for many applications and policymakers at local or regional scales, for example, for urban–rural pattern planning and road network monitoring, which usually require fine-spatial-resolution impervious surface products (Gao et al., 2012).
Recently, with the advent of free medium-resolution satellite data (e.g., Landsat and Sentinel-2), combined with rapidly increasing data storage and computation capabilities, many regional or global fine-resolution impervious surface maps have been produced using Landsat and Sentinel-2 images (Chen et al., 2015; Gao et al., 2012; Goldblatt et al., 2018; Gong et al., 2019, 2013; Homer et al., 2015; Li et al., 2018; Liu et al., 2018; Sun et al., 2017). Specifically, the National Land Cover Database (NLCD) produced the first 30 m map of the United States including impervious surface as three separate land-cover types (Developed, Low Intensity; Developed, Medium Intensity; and Developed, High Intensity), using Landsat imagery, DMSP OLS and United States Geological Survey (USGS) National Elevation Dataset (NED) digital elevation data and achieving a user's accuracy of 0.48–0.66 (Homer et al., 2004). Similarly, the Finer Resolution Observation and Monitoring of Global Land Cover (FROM-GLC) produced the global 30 m impervious surface map as an independent land-cover type with a user's accuracy of 0.307 (Gong et al., 2013); the 30 m Global Land Cover data product (GlobeLand30) combined pixel-based classification, segmentation and manual editing based on high-resolution imagery to develop the 30 m impervious surface map as an independent layer with a user's accuracy of 0.867 (Chen et al., 2015). However, as sparse training samples of impervious surfaces cannot capture all relevant spectral heterogeneity when producing these land-cover products, the impervious surface layers usually suffered low accuracy except for GlobeLand30 (which includes manual interpretation). Therefore, a few studies have proposed independently producing the impervious surface products. For example, Liu et al. (2018) proposed the Normalized Urban Areas Composite Index (NUACI) method to produce a global 30 m impervious surface map and achieved an overall accuracy of 0.81–0.84 and kappa values of 0.43–0.50. However, the NUACI product had a relatively poor performance in terms of producer's accuracy (0.50–0.60) and user's accuracy (0.49–0.61). Brown de Colstoun et al. (2017) combined object-based segmentation, random forest classification and postprocessing to develop the 30 m Global Man-made Impervious Surface (GMIS) and Human Built-up and Settlement Extent (HBASE) dataset in 2010 which achieved a kappa coefficient of 0.91 using scene-level cross validation in Europe (Wang et al., 2017b). Pesaresi et al. (2016) used the multitemporal Landsat imagery and symbolic machine learning method to produce the 30 m Global Human Settlement Layer (GHSL) in 2014 and achieved a total accuracy of 96.28 % and kappa coefficient of 0.3233 based on Land Use/Cover Area frame Survey (LUCAS) reference data. Therefore, an accurate impervious surface map at a fine spatial resolution is still urgently needed using an efficient mapping method.
There are three critical challenges for global impervious surface mapping at a medium spatial resolution. These are finding an adequate image identification method, image selection scheme and image processing platform (Liu et al., 2018).
First, although a wide range of methods have already been presented for impervious surface mapping, it is still hard to generate an operational and accurate global impervious surface map at a 30 m resolution. The methods used so far can be divided into three main groups: spectral mixture analysis methods (Ridd, 1995; Wetherley et al., 2017; Wu, 2004; Wu and Murray, 2003; Yang and He, 2017; Zhuo et al., 2018), spectral index-based methods (Deng and Wu, 2012; Liu et al., 2018; Xu, 2010) and image classification methods (Chen et al., 2015; Okujeni et al., 2013; H. Zhang et al., 2018, 2012; Zhang and Weng, 2016). The spectral mixture analysis methods have great advantages in terms of the repeatable and accurate extraction of quantitative subpixel information (Weng, 2012). However, these spectral mixture methods can produce underestimates in areas with high-density impervious surfaces and overestimates in areas with low-density impervious surfaces and may have great difficulties in identifying one suitable endmember to represent all types of impervious surfaces (Sun et al., 2017; Weng, 2012). The spectral index-based methods have been widely applied in regional impervious surface mapping due to their simplicity, flexibility and convenience (Liu et al., 2018; Z. Sun et al., 2019; Xu, 2010). However, these methods have great difficulty in finding the optimal threshold for separating the impervious pixels from bare areas and vegetation pixels (Sun et al., 2017). The image classification methods can efficiently combine remote sensing datasets from multiple sources (H. Zhang et al., 2016, 2018; Zhou et al., 2017) and have great capabilities in spectrally complex impervious surface mapping (Okujeni et al., 2013), which has been an area of great interest in recent years (Goldblatt et al., 2018; L. Zhang et al., 2018). However, it is very hard to select training samples for large-area impervious surface mapping using these methods (Weng, 2012).
Second, although individual optical datasets have been successfully employed for regional or global impervious surface mapping, the accurate estimation of impervious surfaces remains challenging due to the diversity of urban land-cover types, which leads to difficulties in separating different land-cover types with similar spectral signatures (Y. Zhang et al., 2014). The incorporation of multisource and multitemporal remote sensing imagery has been demonstrated to improve impervious surface mapping accuracy (Weng, 2012; Zhu et al., 2012). For example, optical imagery is only able to capture surface reflectance characteristics, while synthetic-aperture radar (SAR) data can provide details of the structure and dielectric properties of the surface materials (Z. Sun et al., 2019; Y. Zhang et al., 2014; Zhu et al., 2012). Zhang et al. (2016) found that the addition of dual-polarimetric SAR features resulted in an accuracy improvement of 3.5 % compared with using optical SPOT 5 imagery only and also that dual-polarimetric SAR data had a superior performance to single-polarimetric SAR data for impervious mapping. Similarly, Shao et al. (2016) explained that the combination of Gaofen-1 optical imagery with Sentinel-1 SAR imagery efficiently reduced the confusion between impervious surfaces and water and bare areas. Furthermore, Zhu et al. (2012) found that the inclusion of multiseasonal imagery increased the mapping accuracy from 77.96 % to 86.86 % and that the further addition of texture variables increased the mapping accuracy to 92.69 % for urban and peri-urban land-cover classification. The reasons for the accuracy increase were that the texture imagery could capture the local spatial structure and the variability in land-cover categories and also that the temporal information could describe the phenological variability. Schug et al. (2018) also used the multiseasonal Landsat imagery to successfully map impervious extent and land-cover fractions. In addition, as an important data source for the measurement of socioeconomic activities, DMSP OLS nighttime light (NTL) imagery has been widely used in many impervious-related applications (Li and Zhou, 2017). For example, Elvidge et al. (2007) successfully produced a global 1 km impervious map using DMSP OLS NTL imagery, Goldblatt et al. (2018) combined DMSP OLS NTL and Landsat 8 imagery to accurately produce 30 m impervious surface maps at a national scale. Therefore, the integration of multisource and multitemporal datasets is necessary and crucial to the production of accurate global impervious surface maps.
Lastly, the mapping of impervious surfaces at the global scale usually requires huge amounts of computation and large storage capabilities. Fortunately, the Google Earth Engine (GEE) cloud-based platform consists of a multipetabyte analysis-ready data catalog co-located with a high-performance, intrinsically parallel computation service (Gorelick et al., 2017), meaning that the requirements for large-area image collection and very large computational resources can easily be met by using the free-access GEE cloud-computation platform. For example, Liu et al. (2018) produced multitemporal global impervious surface maps and Pekel et al. (2016) developed global high-resolution surface water maps and analyzed long-term changes using the GEE cloud-computation platform. Recently, Massey et al. (2018) produced a continental-scale cropland extent map for North America at a 30 m spatial resolution for the nominal year 2010 based on the GEE platform. It can be seen, therefore, that the GEE is an efficient and useful computation platform for regional and global applications.
So far, due to the limitations of data collection and computation capability, impervious surface mapping has mainly focused on using a single type of remote sensing data source or on case studies made at the regional scale. Although the GEE platform provides multipetabyte analysis-ready data and efficient data-processing capabilities, an efficient method that can fully integrate these multisource and multitemporal datasets and produce accurate impervious surface maps at a spatial resolution of 30 m for the whole world is still lacking. The aims of this study, therefore, were (1) to produce a global 30 m impervious surface map from multisource multitemporal remote sensing datasets including Landsat 8 Operational Land Imager (OLI), Sentinel-1 SAR, Visible Infrared Imaging Radiometer Suite (VIIRS) NTL and MODIS imagery using the GEE platform and (2) to investigate the accuracy of the global 30 m impervious surface mapping using validation samples and cross comparison with five existing impervious surface products (GlobeLand30, Chen et al., 2015; FROM-GLC, Gong et al., 2013; NUACI, Liu et al., 2018; GHSL, Florczyk et al., 2019; and HBASE, Wang et al., 2017a). The results indicate that the global impervious surface map produced by the proposed method is accurate and is suitable for regional or global impervious surface applications.
2.1 Remote sensing datasets
In this study, three kinds of data sources including Landsat 8 optical imagery, Sentinel-1 SAR data and digital elevation model (DEM) topographical variables were selected and collected for the mapping of impervious surfaces across the world on the GEE platform. Furthermore, the combination of VIIRS NTL imagery and MODIS enhanced vegetation index (EVI) products was used to derive the set of global impervious surface and nonimpervious surface training data.
All available Landsat 8 surface reflectance (SR) imagery from 2015 and 2016 (USGS, 2015), which had been archived on the GEE platform, was used in this study for the nominal year 2015 because of the frequent cloud contamination in the tropic areas. All the SR images were radiometrically corrected by the Landsat Surface Reflectance Code (LaSRC) atmospheric correction method (Hu et al., 2014; Vermote et al., 2016), and bad pixels including clouds, cloud shadow, and saturated pixels were identified by the CFMask algorithm (USGS, 2018).
The Sentinel-1 satellite provides C-band SAR imagery at a variety of polarizations and resolutions (Berger et al., 2012; ESA, 2016; Torres et al., 2012). Due to the high-dielectric properties of the building materials, the unique geometry of artificial features and the special radar echo properties of artificial structures, the impervious surfaces usually had stronger backscattered signals than other land-cover types (such as barren land and cropland) in the SAR imagery. In this study, all available Sentinel-1 imagery from 2015 and 2016, which had already been calibrated and orthocorrected and then archived on the GEE platform, was also used for the nominal year 2015. In addition, each Sentinel-1 image on the GEE had been preprocessed with the Sentinel-1 Toolbox, including thermal noise removal, radiometric calibration and terrain correction (https://developers.google.com/earth-engine/sentinel1, last access: 8 July 2020). Also, as HH- and HV-polarized Sentinel-1 SAR imagery does not cover the whole world (G. Sun et al., 2019), a combination of dual-band cross-polarized (VV and VH) Interferometric Wide (IW) swath mode imagery in both “ascending” and “descending” orbits was used. The spatial resolution of this imagery is 10 m, and the repeat cycle of the polar-orbiting two-satellite constellation is 6 d.
The Shuttle Radar Topography Mission (SRTM) DEM, provided by the NASA Jet Propulsion Laboratory (JPL) at a resolution of 1 arcsec (approximately 30 m) and covering the area between 60∘ N and 56∘ S (Farr et al., 2007), was used as an auxiliary dataset for impervious surface mapping, because numerous studies have demonstrated that the spatial distribution of impervious surfaces is related to the topographical variables (Ban et al., 2015; Z. Sun et al., 2019). For example, Z. Sun et al. (2019) used a slope threshold to exclude impervious surface over mountain areas if the slope was larger than 15∘ for impervious mapping in China. This dataset has undergone a void-filling process using other open-source data (Advanced Spaceborne Thermal Emission and Reflection Radiometer Global Digital Elevation Model Version 2, ASTER GDEM2; Global Multi-resolution Terrain Elevation Data, GMTED2010; and NED) in the GEE platform. As for the high-latitude areas that lacked the SRTM data, the ASTER GDEM2 (Tachikawa et al., 2011) was used instead.
The VIIRS NTL, collected by the NASA–NOAA Suomi National Polar-orbiting Partnership satellite (https://maps.ngdc.noaa.gov/viewers/VIIRS_DNB_nighttime_imagery/index.html, last access: 8 July 2020), has the unique ability to record emitted visible and near-infrared (VNIR) radiation at night with a spatial resolution of 15 arcsec (equivalent to 0.5 km at the Equator; Elvidge et al., 2017). Compared to the DMSP OLS NTL data, the VIIRS NTL data provide a higher spatial resolution and finer radiometric resolution, which allows for weaker surface radiation to be detected (Bennett and Smith, 2017). It is also the main data source used for studying the expansion of impervious surfaces and related sociodemographic issues (Elvidge et al., 2017). In this study, a combination of VIIRS NTL, MODIS EVI imagery and GlobeLand30 land-cover products was used to derive the set of global training samples.
The MODIS EVI imagery (MYD13Q1) from the MODIS V6 products contains the best available EVI data from among all the acquisitions obtained over a 16 d compositing period and has a spatial resolution of 250 m (Didan et al., 2015), which was used to mitigate the NTL data's saturation problem and exclude false positive impervious samples (vegetated samples in urban settings) when deriving the global training samples. In this study, the EVI imagery for 2015 in the GEE used the blue band to remove residual atmospheric contamination caused by smoke and subpixel thin clouds (https://developers.google.com/earth-engine/datasets/catalog/MODIS_006_MYD13Q1, last access: 8 July 2020).
2.2 Global impervious surface products
In this study, five global impervious surface products (GlobeLand30, FROM-GLC, NUACI, HBASE and GHSL) were used to validate the global impervious surface map produced using the multisource, multitemporal random forest classification (MSMT_RF) method. The GlobeLand30 data were also used to automatically derive the global impervious and nonimpervious training samples.
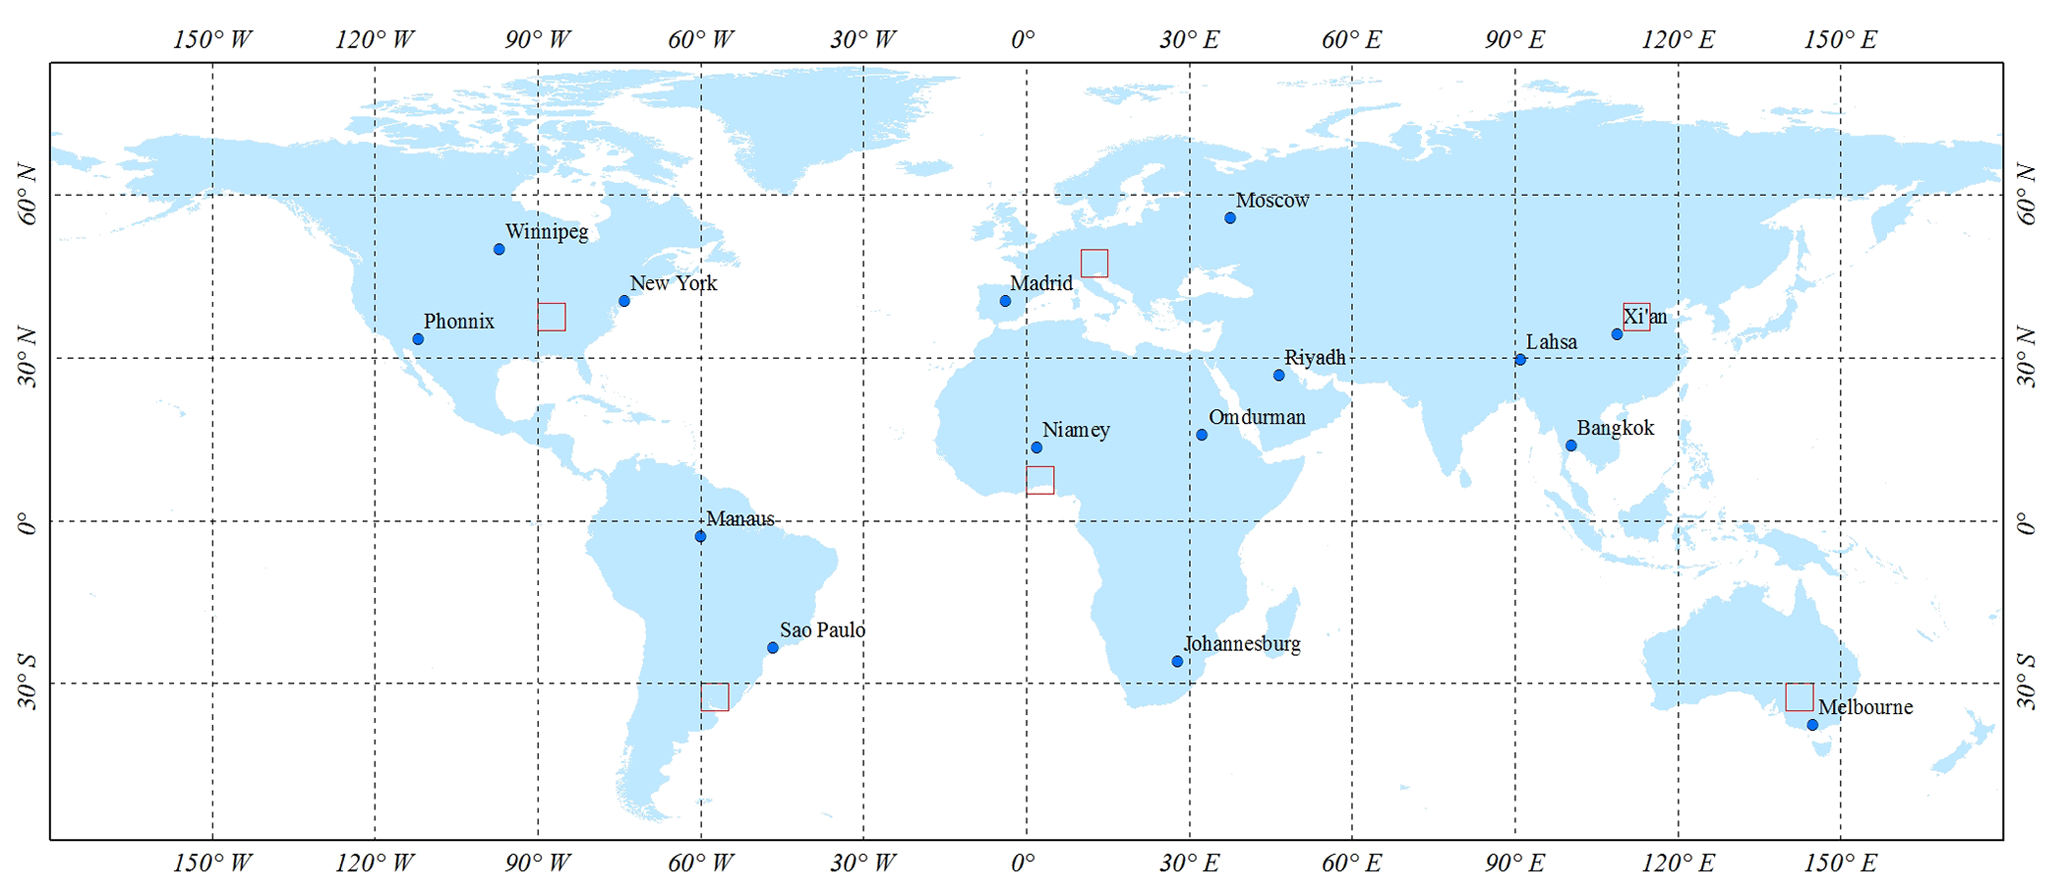
Figure 1The spatial distribution of the 15 validation regions (blue) corresponding to regions of different impervious landscapes on different continents together with the six validation regions (red) used to measure variable importance.
GlobeLand30 is an operational 30 m global land-cover dataset produced using the pixel–object–knowledge-based method (POK-based) approach in 2000 and 2010 (Chen et al., 2015). In this study, the global impervious product derived from GlobeLand30 in 2010 (GlobeLand30-2010; http://www.globallandcover.com/GLC30Download/index.aspx, last access: 8 July 2020) was produced by combining pixel-based classification, multiscale segmentation and manual editing based on the high-resolution imagery and had been validated as having a user's accuracy of 86.7 %.
FROM-GLC, first produced in 2010, was the first 30 m resolution global land-cover dataset and was produced by the supervised classification of 8900 Landsat images (Gong et al., 2013). In this study, the second generation of FROM-GLC from 2015 (FROM-GLC-2015; http://data.ess.tsinghua.edu.cn/, last access: 8 July 2020) was used. This dataset was produced by using multiseasonal Landsat imagery acquired between 2013 and 2015 and incorporates the day of year, geographical coordinates and elevation data (Li et al., 2017).
The NUACI-based maps, developed using the spectral index-based method applied to Landsat and DMSP OLS NTL imagery, are multitemporal global 30 m impervious surface datasets (Liu et al., 2018). In this study, the NUACI impervious map from 2015 (NUACI-2015) was used (http://www.geosimulation.cn/GlobalUrbanLand.html, last access: 8 July 2020). This map has been validated as having an overall accuracy of 0.81–0.84 and kappa coefficient of 0.43–0.50 at the global level (Liu et al., 2018).
The HBASE dataset was the first global 30 m dataset of artificial impervious cover derived from the Global Land Survey (GLS) Landsat data for 2010 (HBASE-2010; https://sedac.ciesin.columbia.edu/data/set/ulandsat-hbase-v1, last access: 8 July 2020). It was produced by combining meter-resolution training data (exceeding 20 million), OpenStreetMap, VIIRS NTL, GLS Landsat SR and MODIS normalized difference vegetation index (NDVI) products and achieved a kappa coefficient of 0.91 using scene-level cross validation in Europe (Wang et al., 2017a, b).
The GHSL, a global information baseline describing the spatial evolution of human settlements in the past 40 years, was developed by using a symbolic machine learning model trained by the collected high-resolution samples, multitemporal Landsat imagery in the epochs 1975, 1990, 2000 and 2015 (Florczyk et al., 2019). In this study, the GHSL impervious surface map at 30 m for 2015 (GHSL-2015; https://ghsl.jrc.ec.europa.eu/download.php, last access: 8 July 2020) was employed for comparison analysis, which achieved an overall accuracy of 96.28 % and kappa coefficient of 0.3233 validated using Land Use/Cover Area frame Survey reference data (Pesaresi et al., 2016).
2.3 Validation samples
To quantitatively assess the performance of the global impervious surface datasets, 15 validation regions, covering different continents and various urban landscapes (bare-soil prevalent cities Phoenix, PNX; Madrid, MDR; Riyadh, RYH; Niamey, NIM; Johannesburg, JHB; Omdurman, ODM; and Lhasa, LHS, vegetation-prevalent cities New York, NYK; Manaus, MNS; Moscow, MSC; São Paulo, SPL; and Melbourne, MBN, as well as cropland-prevalent cities Winnipeg, WIP; Bangkok, BGK; and Xi'an, XAN), were selected (Fig. 1). For each validation region, 600–1000 samples were randomly generated using the stratified random sampling strategy (Bai et al., 2015). As there were significant advantages to using Google Earth for validation sample selection (X. Zhang et al., 2018), each sample was labeled as either “nonimpervious surface” or “impervious surface” based on visual interpretation of the available high-resolution remote sensing imagery in Google Earth. To ensure the reliability of each validation sample, two prior impervious products, namely NLCD impervious products (Homer et al., 2015) and Copernicus Land Monitoring Surface high-resolution-layer imperviousness products (Langanke et al., 2016), which were validated to achieve high overall, user's and product's accuracies exceeding 82 % and 90 %, respectively, were overlaid with the high-resolution remote sensing imagery. In addition, the location of each sample was moved to the center of the relevant surface object (building, road, etc.) because of the greater spectral mixing effect and uncertainty at the boundary of the objects. Like in the work of Z. Sun et al. (2019), if the impervious area in the 30 m × 30 m validation window was more than a predefined threshold of 50 %, we considered this validation point as impervious surface, otherwise, it was labeled as nonimpervious surface. After careful interpretation, a total of 11 942 samples including 4952 impervious samples and 6990 nonimpervious samples were obtained. In order to minimize the subjective influence of interpretation, the validation samples were collected independently by three different scientists. If there was a dispute over the interpretation results of the three scientists, the validation point was discarded.
As the reliability and representativeness of the training samples would affect the classification accuracy directly (Foody and Mathur, 2004), we proposed combining GlobeLand30, VIIRS NTL and MODIS EVI data to derive accurate impervious and nonimpervious samples. The GlobeLand30 land-cover product was used to derive global training samples because it had many advantages including (1) the impervious surface layer in GlobeLand30 being accurately developed by combining pixel-based classification, multiscale segmentation and manual editing based on high-resolution imagery and validated to achieve a user's accuracy of 86.7 % and (2) it simultaneously contained the impervious surface and other land-cover types similar to impervious surface (such as cropland and bare land), so the global training samples including several nonimpervious land-cover types could be easily collected to build the RF model for accurately mapping impervious surface. However, as there was a temporal interval of 5 years between GlobeLand30 and our study, it was assumed that the process of transforming nonimpervious surfaces into impervious surfaces was irreversible during the period 2010 to 2015, meaning that the global impervious training samples derived from GlobeLand30-2010 could also be used to represent the situation in 2015.
Specifically, as GlobeLand30 used an object-based labeling method to remove the “salt-and-pepper effect” caused by the pixel-based classification method (Chen et al., 2015), the impervious surfaces consisted of independent blocks. Usually, a large number of mixed pixels and misclassifications occur at the boundary of image blocks or objects, and Yang et al. (2017) also found that GlobeLand30 exhibited higher accuracy in homogeneous areas. The land-cover heterogeneity was calculated as the number of land-cover types occurring in a local window (Jokar Arsanjani et al., 2016). According to the statistics of Chen et al. (2015), there were a few commission and omission errors in each scene when the area of the impervious surface block was less than 8×8. In this study, the local window size was set to 9×9 after balancing the sample reliability and completeness because the higher window size would cause the candidate samples to miss small and broken impervious objects (such as rural villages). Therefore, if the land-cover heterogeneity in the 9×9 local window was greater than 1 (meaning that the land-cover types within the window consisted of both impervious and nonimpervious types), the center pixel was removed from the candidate training point set (CanTPS_Imp).
Secondly, to minimize the effects of mapping error in GlobeLand30-2010 and the temporal interval between GlobeLand30-2010 and the input imagery for training samples in CanTPS_Imp, the VIIRS NTL data, revealing the intensity of socioeconomic activities, were imported to refine each training point in 2015. However, as the coarse spatial resolution of VIIRS NTL imagery might cause a “blooming effect” in suburban areas, the EVI-adjusted nighttime light index (EANTLI) proposed by Zhuo et al. (2018) was applied to reduce the blooming effects:
where NTLnorm is the normalized NTL value, EVI is the annual mean value of the time-series MODIS EVI products and NTL is the actual value of the VIIRS NTL data.
The EANTLI measured the likelihood of the pixel corresponding to an impervious surface, so it was reasonable to assume that the pixels where EANTLI exceeded a certain threshold were impervious surface pixels. In this study, as the candidate training points in CanTPS_Imp were collected from homogenous 9 pixel × 9 pixel areas (270 m × 270 m), the EANTLI image in 2015 (EANTLI-2015) was first resampled to the 270 m dimensions to match with these candidate points. The GlobeLand30-2010 impervious surface map had a user's accuracy of 86.7 %, and we assumed that the process of transforming nonimpervious surfaces into impervious surfaces was irreversible during the period 2010 to 2015, so the impervious segmentation threshold was selected as being the lowest 15th quantile of the cumulative probability of all candidate impervious points for EANTLI-2015; namely, if the cumulative probability of the impervious point in CanTPS_Imp was lower than the threshold, the candidate point was removed from CanTPS_Imp. As for the nonimpervious pixels, there was usually a negative correlation between nonimpervious surfaces and EANTLI values, and the nonimpervious surface samples turned into impervious surface would have high EANTLI values in 2015, so if the cumulative probability of a candidate nonimpervious point in CanTPS_Imp was greater than the top 20th percentile of the cumulative probability of all candidate nonimpervious points (the threshold being based on the overall accuracy of 80.33 % for GlobeLand30-2010 and a few potential conversion samples), the candidate nonimpervious point was also removed.
It should be noted that the definition of artificial surfaces in the GlobeLand30 was slightly different from that of impervious surfaces in this study. Specifically, artificial surfaces in the GlobeLand30 were divided into three subclasses including high reflectance, low reflectance and vegetated type (Chen et al., 2015), and a small part of purely vegetated artificial surfaces (such as small vegetation patches in the residential zones with good greenness) actually did not belong to the impervious surfaces. Fortunately, the ENATLI, measuring the likelihood of the pixel corresponding to an impervious surface, usually revealed the low values over these vegetation patches. Therefore, these purely vegetated artificial surface pixels could be removed from the CanTPS_Imp using the lowest 15th quantile of the cumulative probability of all candidate impervious points for EANTLI-2015.
Lastly, although the candidate training points were refined using the GlobeLand30 land-cover product and EANTLI-2015 imagery, the volume of candidate training points was still huge, and so it was necessary to further resample the CanTPS_Imp. As the nonimpervious surfaces consisted of many land-cover types (water, vegetation, cropland and bare soil), some of them were spectrally similar to the impervious surface. For example, the bare soil and high-reflectance impervious surfaces usually shared similar surface reflectance, especially in arid and semiarid areas with large areas of bare soils, because the composition of impervious surfaces included rock material which was also found in bare areas (Z. Sun et al., 2019; Weng, 2012), and the cropland showed similar reflectance to low-reflectance impervious surfaces (such as rural villages, old cities) because they were usually composed of vegetation and high-reflectance artificial materials or bare soils (Li et al., 2015). Therefore, the nonimpervious training samples were split into three independent groups: bare area, cropland and other nonimpervious land-cover types. Furthermore, many studies have demonstrated that the distribution and balance of training samples has great influence on the mapping accuracy. For example, Zhu et al. (2016) found unbalanced training samples directly resulted in rare land-cover types being underrepresented relative to more abundant classes. Since the impervious surface was usually sparser than the nonimpervious land-cover types (bare soil, cropland and so on), the training samples with uniform distribution were selected to ensure the rationality of training samples and capture all relevant spectral heterogeneity within impervious surfaces; namely, the approximate ratio of 1 : 3 was used to represent the proportion of impervious to nonimpervious surfaces (bare area, cropland and other nonimpervious land-cover types). In addition, as the land-cover distribution varied with geographical region, the stratified random sampling strategy was applied to every geographical grid to ensure the training samples were locally adaptive. Using the stratified random sampling strategy with a uniform distribution, a total of 4 483 000 training samples, including 3 499 000 nonimpervious samples and 984 000 impervious samples, were collected over the land areas across the globe.
Although a series of rules were applied to guarantee the high confidence of global training samples, due to the classification error in GlobeLand30 and the temporal interval between GlobeLand30 and input imagery, the global training dataset inevitably contained some erroneous samples. The relationship between the percentage of the erroneous samples and the mapping accuracy of impervious surface is analyzed in Sect. 6.1, and the results indicate that the error in the training samples had little effect on the mapping accuracy.
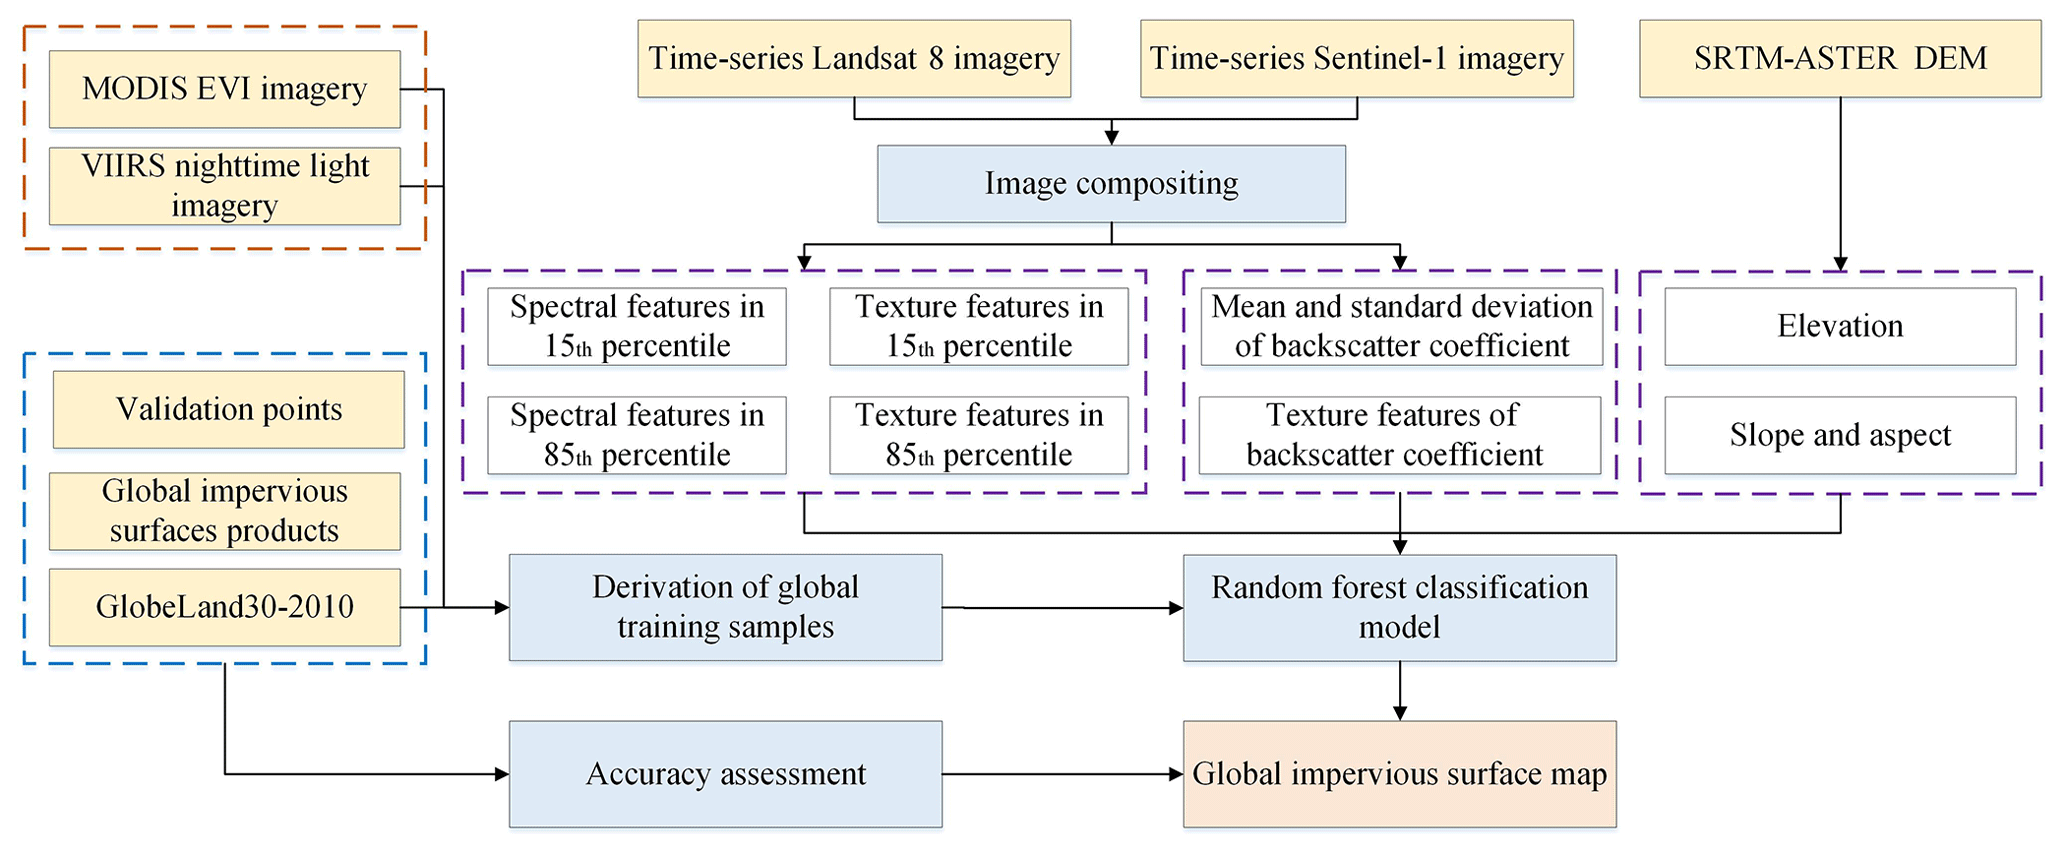
To develop the global 30 m impervious surface map for 2015, the MSMT_RF method was proposed. The method is illustrated in Fig. 2. Firstly, time series of Landsat 8 SR and Sentinel-1 SAR imagery archived on the GEE platform were collected. Secondly, temporal–spectral–textural features and temporal–SAR features were derived from the Landsat 8 and Sentinel-1 imagery using image compositing methods. Thirdly, based on the global training samples derived from GlobeLand30-2010, VIIRS NTL and MODIS EVI imagery, the random forest classifier was trained at each geographical grid cell using temporal–spectral–textural–SAR–topographical features. Finally, the global impervious surface map was compared with existing impervious surface products and further validated using visual interpretation samples.
4.1 Multisource and multitemporal feature selection
As mentioned above, the datasets used in this study were acquired from various satellite sensors and have distinctive features. Also the incorporation of multisource and multitemporal remote sensing data has been demonstrated to improve the accuracy of the mapping of impervious surfaces. In this study, three kinds of satellite imagery, namely Landsat 8 SR, Sentinel-1 SAR and SRTM–ASTER DEM imagery, were collected for the global classification of impervious surfaces.
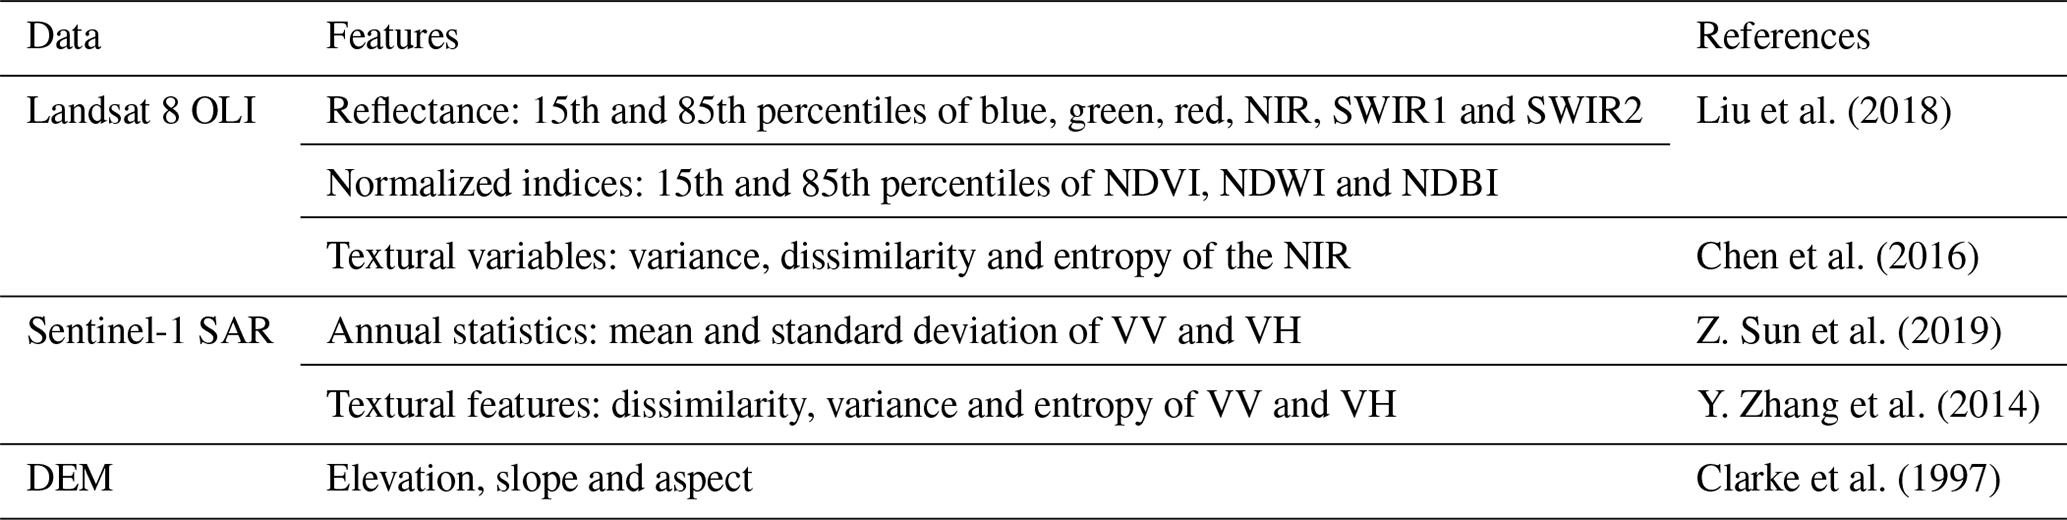
After masking out the bad pixels (cloud, shadow and saturated pixels), the time-series Landsat SR imagery was needed to reduce the number of dimensions of the temporal–spectral features to guard against the Hughes phenomenon (Zhang et al., 2019). Similar to what Hansen et al. (2014) and Zhang and Roy (2017) introduced to capture phenology, the 15th and 85th percentiles of Landsat SR were used instead of the minimum and maximum values to minimize the effects of residual shadows and cloud caused by the errors in the CFMask method (Massey et al., 2018). In addition, as Sun et al. (2017) explained that the growing season was the best time for impervious surface mapping over temperate continental climate zones and H. Zhang et al. (2014) found that winter (dry season) is the best season in which to estimate impervious surface in subtropical monsoon regions, a combination of the 15th and 85th percentiles of Landsat SR was used to efficiently capture intra-annual variation information of various land-cover types. It should be noted that only the six optical bands (blue; green; red; near infrared, NIR; shortwave infrared 1, SWIR1; and shortwave infrared 2, SWIR2) were selected because the coastal band was sensitive to atmospheric scattering (Wang et al., 2016). Liu et al. (2018) found that the normalized difference water index (NDWI), normalized difference vegetation index (NDVI) and normalized difference built-up index (NDBI) were of great help in impervious surface identification; therefore, these three spectral indices were added to the spectral features, giving a total of 18 features for the two-epoch imagery. Furthermore, as the texture information contributed to the classification performance (Weng, 2012), the local textural measures based on the gray-level co-occurrence matrix (GLCM) were adopted; however, because of the redundancy and similarity between texture features (Rodriguez-Galiano et al., 2012), only the variance, dissimilarity and entropy of the NIR band were selected from the 7×7 local window for the two-epoch imagery (Chen et al., 2016; Y. Zhang et al., 2014). The optimal window size for texture measurements is highly dependent on the image spatial resolution and the land-cover characteristics (Zhu et al., 2012), and Shaban and Dikshit (2001) computed texture measurements with different window sizes as inputs for urban area classification and suggested window sizes of 7 pixels × 7 pixels perform best.
As the Sentinel-1 SAR imagery had been preprocessed in the GEE platform, the annual mean and standard deviation of the VV and VH imagery were directly derived from the time-series of Sentinel-1 SAR imagery. Y. Zhang et al. (2014b) found that SAR texture features were also relevant to impervious surfaces, and the dissimilarity, variance and entropy features of the VV and VH imagery were identified as effective indicators of the texture description of different urban land-cover types. As Y. Zhang et al. (2014b) explained the window size for calculating the GLCM should be smaller as terrains are smaller under coarser resolution, the window size was chosen as 9 pixels × 9 pixels at a 10 m spatial resolution, equivalent to 3 pixels × 3 pixels at 30 m. Moreover, as the spatial resolution of the Landsat SR (30 m) was 3 times that of the Sentinel-1 imagery (10 m), the SAR data were resampled to 30 m for integration with the Landsat SR data.
Lastly, as Sentinel-1 SAR imagery usually had high backscatter similar to the impervious surface over mountainous areas, terrain information was useful auxiliary information for removing these false positives in these areas (Ban et al., 2015). Similarly, Clarke et al. (1997) found that terrain variables were of great help in identifying impervious surfaces because such surfaces are usually located in flat areas. In this study, the elevation, slope and aspect, calculated from the SRTM–ASTER DEM data, were added to the feature vector. This gave a total of 37 features for each pixel location, including 18 spectral features and 6 texture features from the Landsat imagery, 10 SAR features, and 3 topographical variables. The features are listed in Table 1.
Table 1Training features for global impervious surface mapping.
4.2 Random forest classification model
There are two kinds of models used for generating a global impervious surface product – global modeling (building a single classifier using global training data) and local adaptive modeling (dividing the globe into a number of regions and then building local classifiers using corresponding regional training data). For example, Gong et al. (2013) built a single global classifier using 91 433 training samples to produce the FROM-GLC land-cover products and Bontemps et al. (2011) first split the world into 22 ecological regions and then trained the classifier for each region using local training samples to produce the GlobeCover2009 land-cover products. Recently, Zhang and Roy (2017) demonstrated that the local adaptive model performed better than the single global classification model, while Radoux et al. (2014) found that using a local window increased the sensitivity to the quality of the training dataset. Therefore, after balancing the data volume, computation efficiency and classification accuracy, we first split the global land surface into 954 geographical tiles of and then trained local adaptive classifiers for each geographical tile. In addition, to ensure the classification consistency across neighboring geographical tiles, the training data from adjacent 3 tiles × 3 tiles were imported to train the random forest classifier and classify the central tile.
As for the specific techniques used in classifiers, according to our previous investigations (Zhang et al., 2019), the Random Forest classifier is more capable of handling high-dimensional multicollinearity data. It is also less affected by noise and feature selection as well as being more accurate and efficient than other widely used classifiers such as the SVM (support vector machine), CART (classification and regression tree) and ANN (artificial neural network) classifiers. Therefore, the RF classifier was selected for the development of the global impervious surface map.
The RF classifier has only two parameters: the number of classification trees (Ntree) and the number of selected predication features (Mtry). Furthermore, many researchers have demonstrated that there is almost no correlation between these two parameters and the classification accuracy (Belgiu and Drăguţ, 2016; Du et al., 2015; Gislason et al., 2006); therefore, the default values of 500 for Ntree and the square root of the total number of training features for Mtry were selected.
4.3 Accuracy assessment
To completely analyze the performance of the MSMT_RF-based method, two validation methods namely “fraction-based” and “pixel-based” were adopted. First, the fraction-based validation method mainly illustrated the spatial agreement of impervious surfaces between the MSMT_RF-based impervious surface map and several existing products (GlobeLand30-2010, FROM-GLC-2015, NUACI-2015, HBASE-2010 and GHSL-2015) from a global perspective. Specifically, all these global 30 m impervious surface maps were aggregated to a resolution of and the fraction of impervious area was then calculated. Following that, scatterplots of the linear regression between the MSMT_RF-based results and the reference data were produced to provide the quantitative metrics of the agreement, including the coefficient of determination (R2) and root mean square error (RMSE).
In addition, a pixel-based validation method, based on the visual interpretation samples over 15 regions of covering different impervious landscapes and continents, was used to quantitatively analyze the accuracy metrics, including the overall accuracy (OA), producer's accuracy (PA), user's accuracy (UA) and kappa coefficient (Olofsson et al., 2014), for assessing the performance of the MSMT_RF-based global impervious surface mapping.
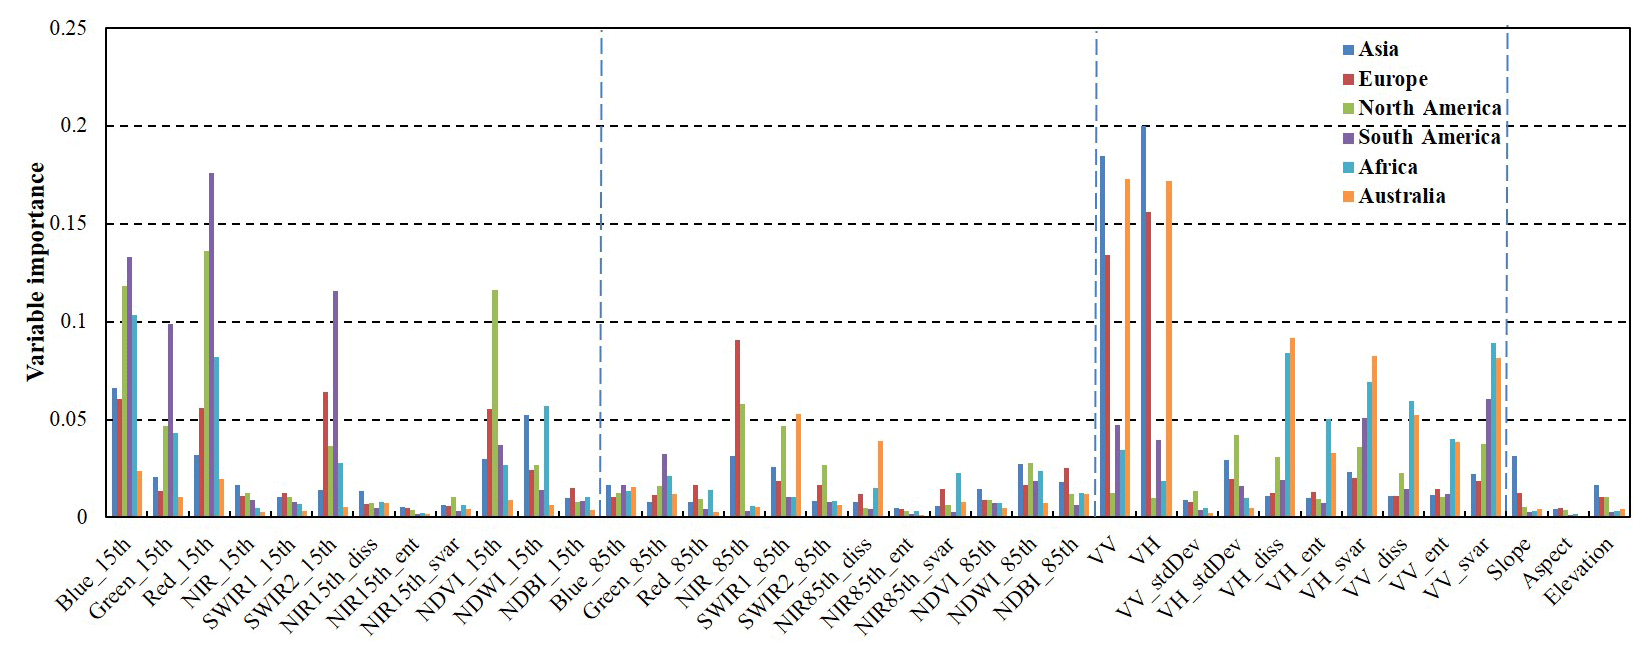
Figure 3The importance of the input features derived from the random forest model using the training samples in six continental regions.
5.1 The importance of multisource and multitemporal features
Because of the spectral heterogeneity of impervious surfaces, it is very difficult to accurately map impervious surfaces using only optical remote sensing imagery (Y. Zhang et al., 2014). Although a few studies have demonstrated that the integration of multisource and multitemporal information can improve mapping accuracy, these studies mainly focused on regions with high impervious surface density (Y. Zhang et al., 2014; Zhu et al., 2012). At present, global impervious surface maps are still produced by optical imagery alone or by using a combination of optical and DMSP OLS or VIIRS NTL imagery (Huang et al., 2016; Liu et al., 2018; Schneider et al., 2010). This is the first study that has developed the global 30 m impervious surface map using multisource and multitemporal imagery. To quantitatively demonstrate the need for using multisource, multitemporal information, we randomly selected six regions (red rectangles in Fig. 1) from six different continents and then calculated the importance of the training features using the RF model. Specifically, the RF model computed the average increase in the mean square error by permuting out-of-bag data for a variable while keeping all the other variables constant, thus measuring the variable's importance (Pflugmacher et al., 2014). Training features that had a high importance were the drivers of the model decision, and their values had a significant impact on the output values.
The importance of all 37 training features for the six regions is illustrated in Fig. 3. These results indicate that the Sentinel-1 SAR features (VV and VH) had the greatest contribution to the final decision in most regions because SAR images can provide information about the structure and dielectric properties of the surface materials. Next in importance were the 15th percentile of Landsat SR in the blue, green, red and SWIR2 bands and the corresponding NDVI and NDWI indices, as well as the texture variance and dissimilarity for Sentinel-1 SAR. The importance of these feature was close to or exceeded 5 % in most cases. Then came the 85th percentile of Landsat SR in the NIR and SWIR1 bands as well as the SAR texture features, with a mean importance about 3 %.
To intuitively understand the characteristics of different land-cover types in optical and SAR imagery, two regions (the vegetation-prevalent region of Asia and bare-soil-prevalent semiarid region of Australia) were selected for comparison analysis. Figure 4 illustrates the reflectance and backscatter statistics (mean and standard deviation) of five typical land-cover types (cropland, vegetation, bare soil, impervious surfaces and water body). Obviously, impervious surfaces had the highest backscatter signals in VV because of the high-dielectric properties of the building materials, the unique geometry of artificial features and the special radar echo properties of artificial structures, followed by the vegetation land-cover types. Further, since only a small part of the polarized signals (vertical turning horizontal) were returned to the sensor, the VH was significantly lower than VV but the ranking orders of different land-cover types in VH was similar to that of VV. Due to the complicated construction and heterogeneity of the impervious surfaces, these surfaces also had the highest standard deviation; for example, the urban center usually reflected higher VV and VH signals than the village buildings. If only Sentinel-1 SAR features were used to identify impervious surfaces, there would be serious confusion between the mountainous vegetation and low-reflectance impervious surfaces (such as villages and small cities); fortunately, the optical reflectance features performed well to distinguish them because of significant spectral differences. However, if only the multitemporal optical imagery were used to detect the impervious surfaces, there would be obvious confusion between impervious surfaces and bare soils and croplands; for example, the spectral characteristics of impervious surfaces, bare soils and croplands overlapped in the Asia region (Fig. 4). In summary, only the combination of multisource training features could guarantee the classification accuracy across different impervious landscapes.
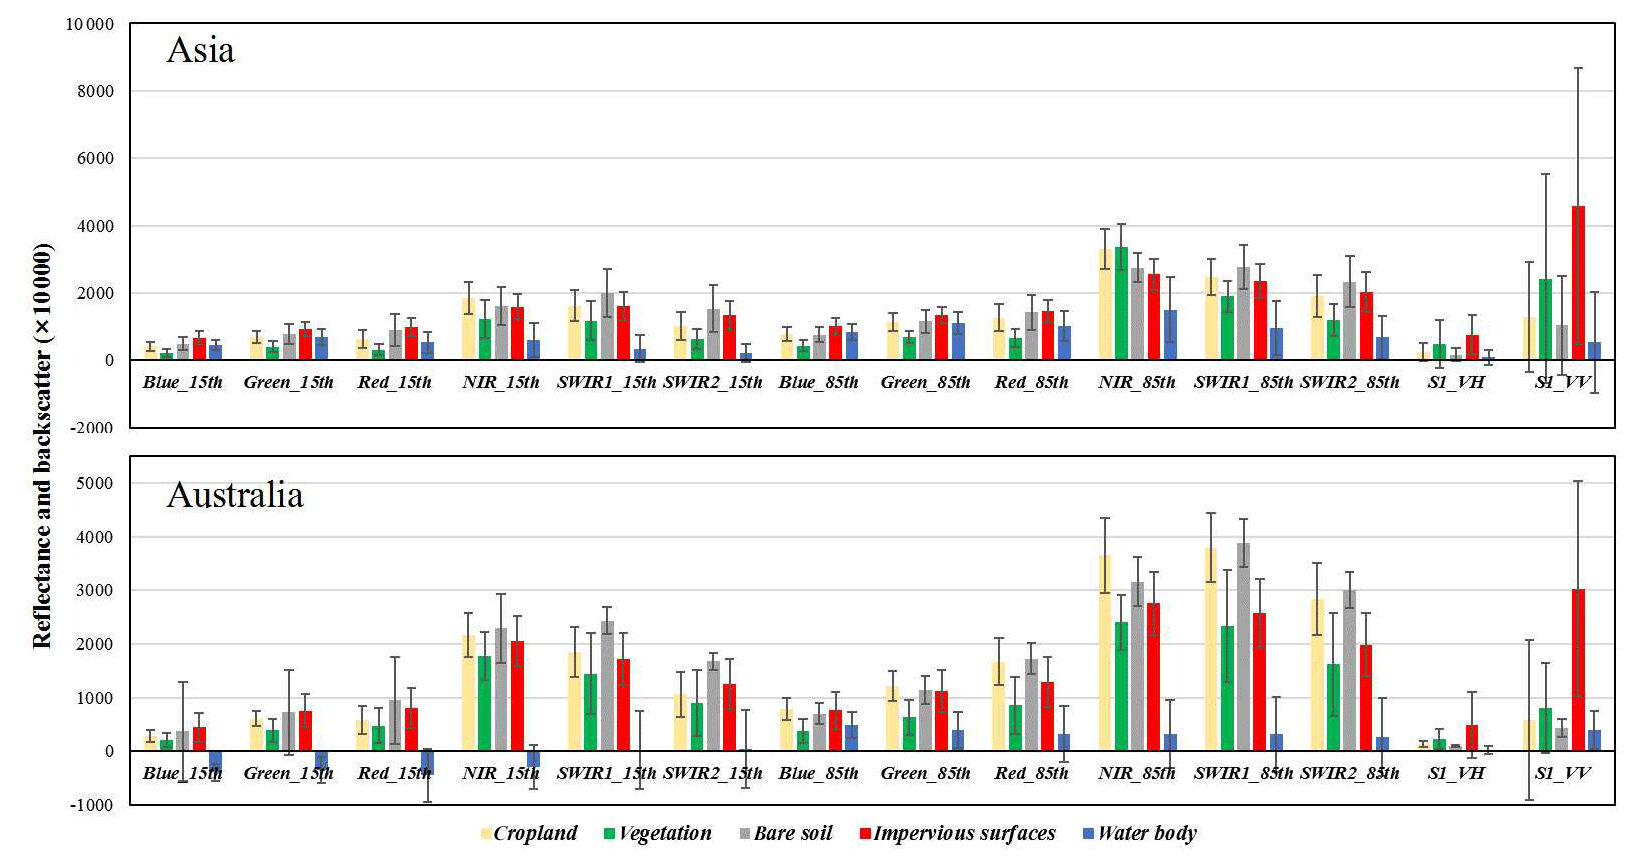
Figure 4The reflectance and backscatter characteristics of different land-cover types over Landsat optical and Sentinel-1 SAR imagery in the Asia and Australia regions.
Secondly, although the 15th percentile had a higher importance than the 85th percentile in most of the spectral bands, we found that there was a large degree of complementarity between the images from two different seasons (Fig. 3). For example, the importance of the 15th percentile in the NIR and SWIR1 bands was low, while that of the 85th percentile was high, and the total importance of the biseasonal spectral features exceeded 70 % in some cases. The reasons that the temporal information was important for accurately mapping impervious surface included (1) some land-cover types such as cropland had similar spectra to impervious surface in the fallow season, but with the growing season imagery imported, this misclassification could be easily removed and (2) Sun et al. (2017) explained that the growing season was the best time for impervious surface mapping over temperate continental climate zones, and H. Zhang et al. (2014) found that winter (dry season) is the best season in which to estimate impervious surface in subtropical monsoon regions. The multitemporal information can address the problem of seasonal variability in different geographical zones. Figure 4 (Australia region) also illustrates that the cropland and impervious surfaces were spectrally inseparable at the 15th percentile but the difference was obvious at the 85th percentile. Therefore, temporal variability can be considered an important contribution for accurate impervious surface mapping.
Thirdly, the importance of Landsat texture features was lower than 5 % in these six regions because the Sentinel-1 SAR backscatter and texture features were able to provide information on the surface material and its spatial structure and variation. Due to the complexity of land surfaces and different mechanisms of optical and SAR imagery, the optical textures could complement SAR features in mountainous and semiarid areas (Asia and Australia regions) a lot. Some studies have demonstrated that these features contributed a lot to the improvement of impervious mapping accuracy. For example, Shaban and Dikshit (2001) emphasized that the integration of texture variables increased the accuracy from 86.86 % to 92.69 % because texture imagery could capture the local spatial structure and the variability of land-cover categories.
Lastly, since most regions are located in the flat areas, only the cumulative importance of topographical variables over the region in Asia exceeded 5 %. The reasons why topographical information reached high importance over mountainous areas were because the impervious surfaces were usually located in the flat areas (Ban et al., 2015) and Sentinel-1 SAR imagery had high backscatter signals over mountainous areas similar to the impervious surfaces, which increased the importance of topographical variables. Similarly, Clarke et al. (1997) explained that topographical variables (slope, aspect and DEM) contribute a lot to impervious surface mapping over mountainous areas. These features are, therefore, indispensable in the accurate mapping of impervious surfaces in mountainous regions.

Figure 5Global fraction of impervious cover derived from multisource and multitemporal Landsat 8 SR and Sentinel-1 SAR imagery acquired from 2015 to 2016. The spatial resolution of the map is 0.05∘.
5.2 Global impervious surface map
The global distribution of the fraction of impervious area (FIA) at a spatial resolution of 0.05∘ is illustrated in Fig. 5, while the meridional and zonal total FIA for each 0.05∘ longitude and latitude bin are shown at the top and left of the same figure. From an intuitive and statistical perspective, globally, impervious surfaces are mainly concentrated in three continents: Asia (34.43 %), North America (28.04 %) and Europe (24.98 %), followed by South America (5.89 %), Africa (5.63 %) and Australia (1.06 %). In addition, the zonal statistics indicate that 70 % of the impervious surfaces are distributed between 30 and 60∘ N because these regions contain the key areas of Asia, North America and Europe, which are the locations of the most developed countries and highest population densities. The meridional results illustrate that there are four peak intervals: 100–70∘ W (United States), 10∘ W–40∘ E (Europe), 60–90∘ E (India) and 100–130∘ E (China and southeastern Asia). The two peak values in the meridional direction are located in the centers of the United States and China.
Summaries of the impervious surface areas at a national scale were also produced. The statistical results indicated that the total impervious surface areas of the top 20 countries account for 75.96 % of the total global area. Figure 6 presents the top 20 counties in terms of impervious surface area and corresponding fractions of the world total. Overall, there is a positive correlation between these statistical fractions and the land area, population and degree of economic development of these nations. Specifically, it was found that the United States has the biggest impervious surface area, accounting for more than 20 % of the global total, and only the top three countries (USA, China and Russia) exceed 5 % of the total global area. The ranking is also basically consistent with the statistics produced by the Organisation for Economic Co-operation and Development (OECD) for built-up areas in 2014 (https://stats.oecd.org/Index.aspx?DataSetCode=BUILT_UP, last access: 8 July 2020).
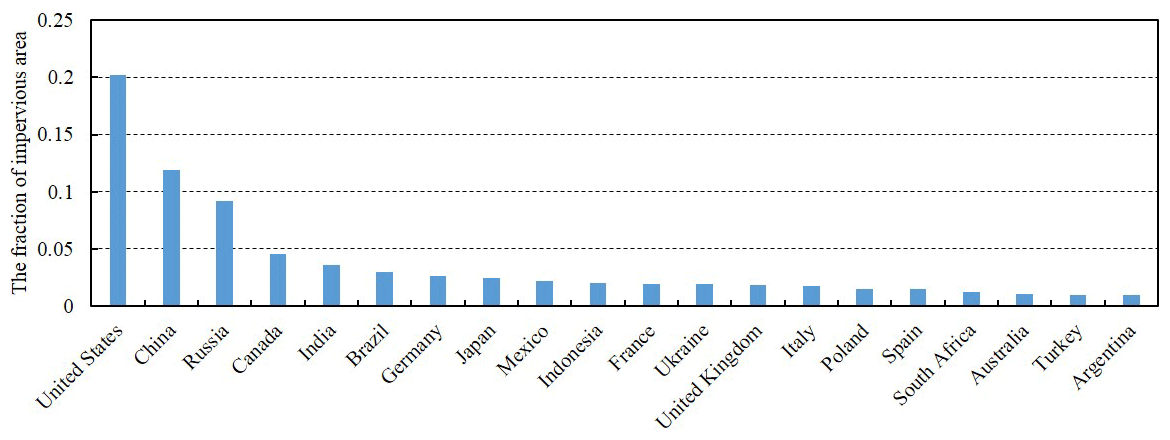
Figure 6The top 20 countries in terms of impervious surface area and corresponding fractions of the global total.
5.3 Spatial variations in global impervious products
To quantitatively analyze the spatial agreement between the MSMT_RF-based impervious surface map and the five existing products (GlobeLand30-2010, FROM-GLC-2015, NUACI-2015, GHSL-2015 and HBASE-2010), all global 30 m impervious surface maps were first aggregated to a resolution of 0.05∘. Figure 7 illustrates the spatial patterns of six global impervious products; intuitively, it can be seen that NUACI-2015 had lower impervious areas than other products, especially in North America and Europe, and GHSL-2015, GlobeLand30-2010 and our product (MSMT-2015 map) had greater spatial agreement because the impervious areas of FROM-GLC-2015 and HBASE-2010 in China were obviously smaller. Further, our product had higher impervious areas over North America than other products, especially over Canada, because the method used had greater ability in identifying small and fragmented impervious objects such as villages and roads, which will be demonstrated in the following section (Sect. 5.4) over the Winnipeg region.
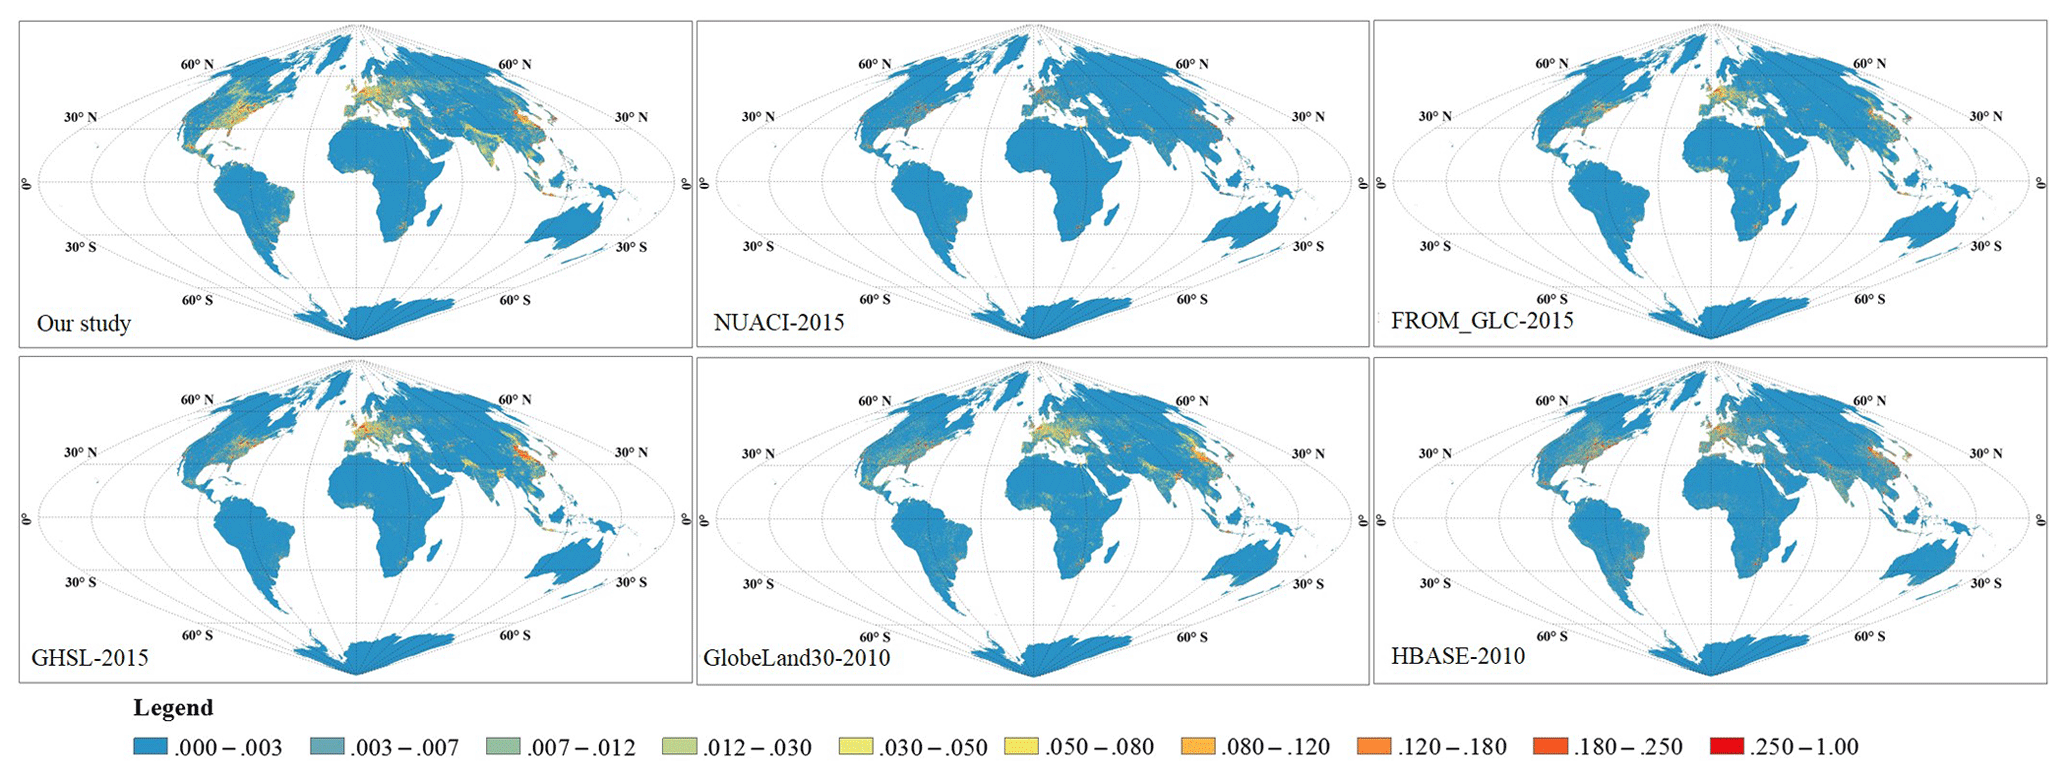
Figure 7The spatial patterns of six global 30 m impervious products after aggregating to the resolution of 0.05∘.
Scatterplots of the five products against the MSMT-2015 impervious map were then made, as illustrated in Fig. 8. The results indicate that there was a greater agreement between the MSMT-2015 map and GHSL-2015 (R2=0.783, RMSE = 0.038 and slope = 0.921) than for other products. Specifically, as NUACI-2015 has been demonstrated to miss some small, fragmented villages and roads (Z. Sun et al., 2019), the slope of the regression line was less than 1.0 and R2 was the low value of 0.655 in this case. The scatterplot between FROM-GLC-2015 and MSMT-2015 indicates that there was a high degree of agreement between FROM-GLC-2015 and MSMT-2015 results in “high-fraction” regions (close to 1 : 1) but FROM-GLC-2015 was obviously lower than MSMT-2015 over “low-fraction” regions, so the slope of the regression line for FROM-GLC-2015 was also less than 1. The main differences between the GlobeLand30- and the MSMT_RF-based maps were due to the temporal interval of 5 years and the limitations of the minimum 4×4 mapping unit for GlobeLand30-2010 (Chen et al., 2015), so the scatters were mainly concentrated below the 1 : 1 line. HBASE-2010 had higher impervious areas than MSMT-2015 especially for the “high-fraction” regions, but the following section demonstrates that it suffered from an overestimation problem, so the regression slope was higher than 1 and R2 only reached the value of 0.730. In addition, to intuitively understand the stability of the regression model, error bars, calculated as the standard deviation of reference data with the fitted results, were added to the scatterplots. It was found that the error bars increased first and then stabilized as the impervious fraction increased.
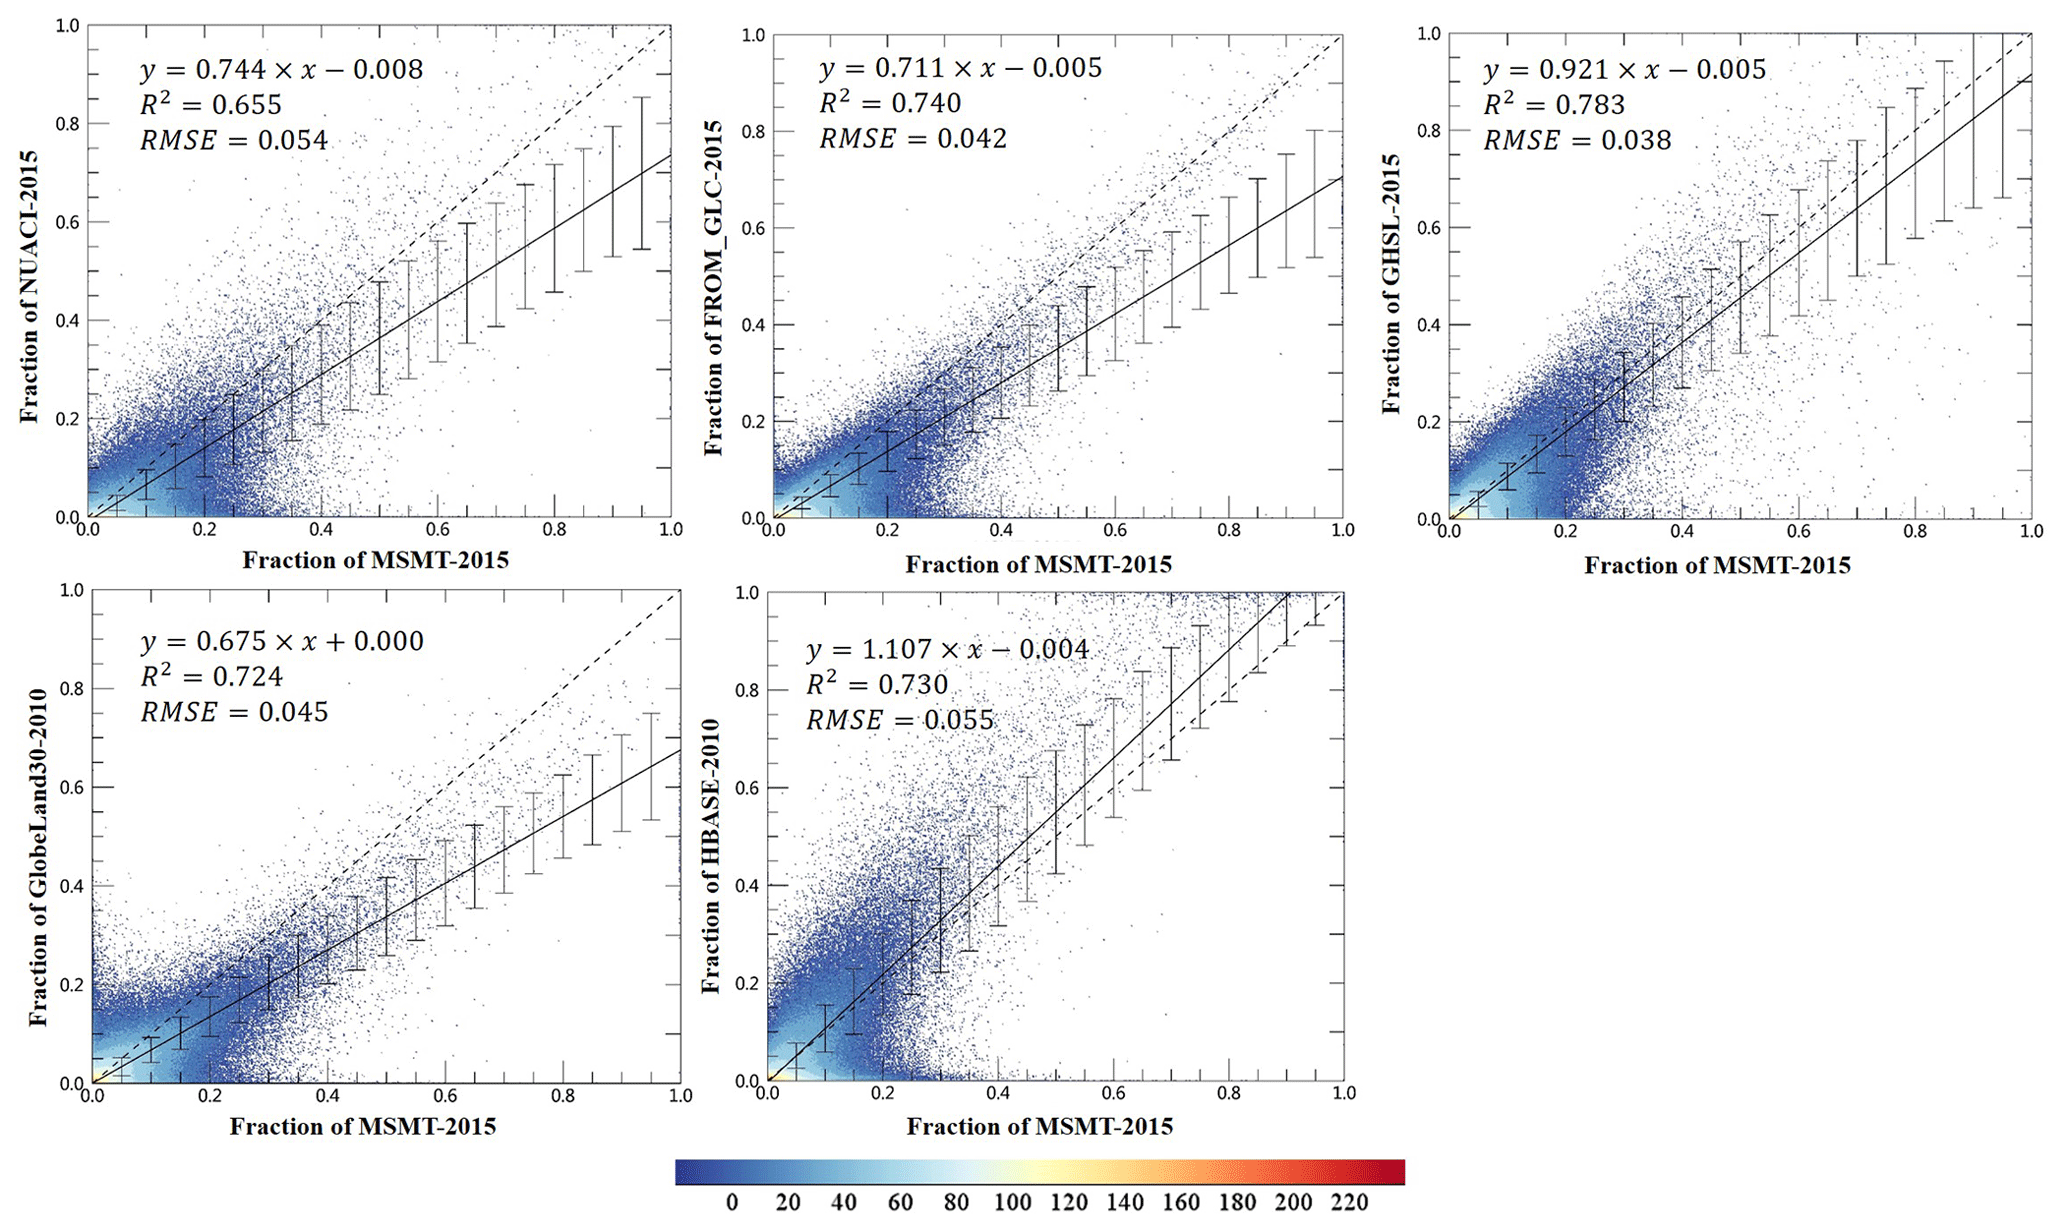
Figure 8Scatterplots between the MSMT_RF-based impervious map and the GlobeLand30-2010, FROM-GLC-2015, NUACI-2015, GHSL-2015 and HBASE-2010 global impervious surface products at a spatial grid of . The error bars are the standard deviation between reference datasets with fitted results.
5.4 Accuracy assessment using validation samples
The accuracy of the five global impervious surface maps over 15 validation regions with different impervious landscapes is presented in Table 2. Six evaluation metrics, including the producer's accuracy (which measures the commission error) and user's accuracy (which measures the omission error) of the impervious surface and the producer's and user's accuracy of nonimpervious surfaces as well as the overall accuracy and kappa coefficient, were used to assess the accuracy. Overall, the MSMT_RF-based map achieved the highest overall accuracy of 0.951 and kappa coefficient of 0.898 compared with 0.896 and 0.780 for FROM-GLC-2015, 0.856 and 0.695 for NUACI-2015, 0.903 and 0.794 for GHSL-2015, 0.884 and 0.753 for GlobeLand30-2010, and 0.880 and 0.754 for HBASE-2010 using all 15 regional validation data.
From the perspective of the value of the user's accuracy for impervious surfaces, the MSMT_RF method performed better than the other impervious surface products (meaning lower omission error), achieving an accuracy of 0.932, especially in the cropland-prevalent and vegetation-prevalent impervious landscapes (such as Bangkok, Winnipeg, Xi'an). Specifically, NUACI-2015 had the lowest user's accuracy of 0.562, and this might be due to its poor performance over small impervious surfaces (Z. Sun et al., 2019). FROM-GLC-2015 had a similar performance to the MSMT_RF method for big cities (such as New York, Moscow and Johannesburg), but its accuracy decreased sharply over “small-city” regions (such as Lhasa, Winnipeg). The performance of GHSL-2015 was closest to MSMT-2015 over most validation regions, but it also missed the fragmented objects (villages and roads) over cropland-prevalent city (such as Bangkok and Winnipeg). As the minimum mapping unit of GlobeLand30 was a 4 pixel × 4 pixel area, many rural impervious surfaces were ignored in these validation regions, which caused large omission errors of 23.9 %. Finally, partly due to the 5-year interval between the HBASE-2010 and validation samples, HBASE-2010 also suffered an omission error of 12.5 %.
As for the producer's accuracy for impervious surface (measuring the commission error), the GHSL-2015 products performed best and achieved an accuracy of 0.973, followed by the MSMT-2015 value of 0.948, GlobeLand30-2010 value of 0.947, FROM-GLC-2015 value of 0.946, NUACI-2015 value of 0.898 and HBASE-2010 value of 0.841. Compared with user's accuracy of impervious surface, these reference products had better performance on this metric, which meant they had a lower commission error.
Table 2Accuracy of the six impervious surface maps over 15 validation regions.
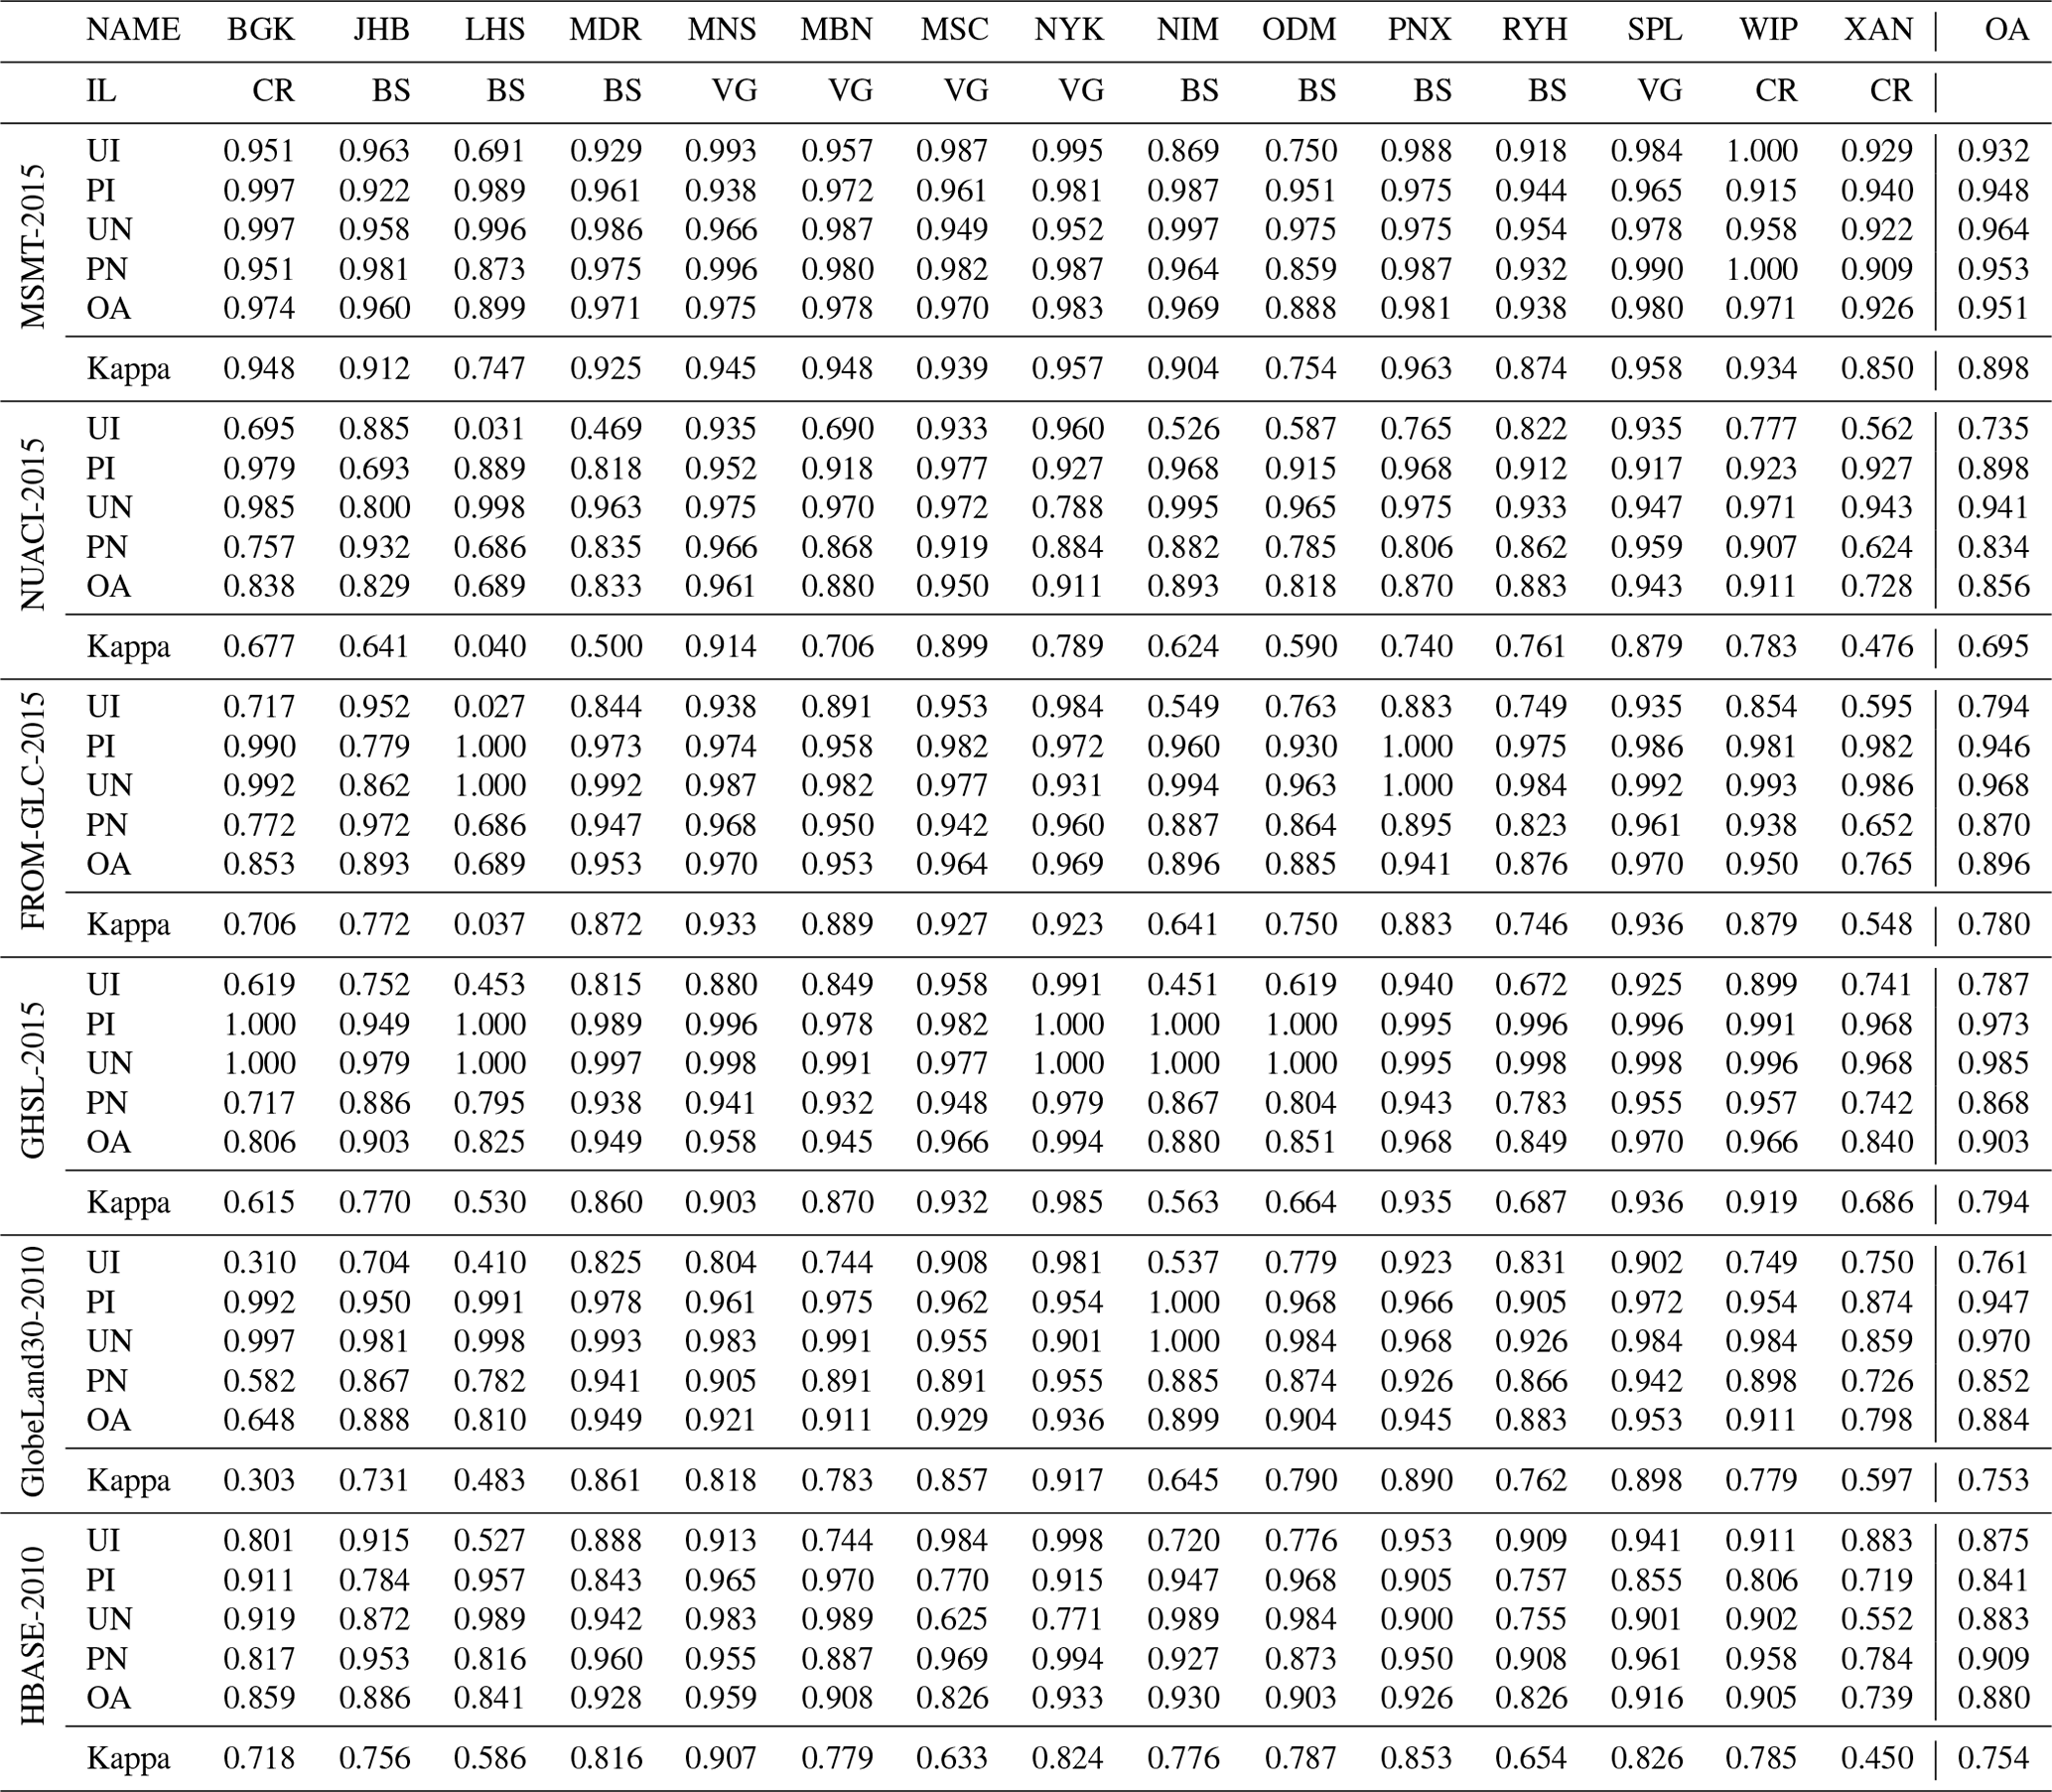
Note: IL, impervious landscape; CR, cropland-prevalent impervious landscape; BS, bare-soil-prevalent impervious landscape; VG, vegetation-prevalent impervious landscape; PI, producer's accuracy of impervious surfaces; UI, user's accuracy of impervious surfaces; PN, producer's accuracy of nonimpervious surfaces; UN, user's accuracy of nonimpervious surfaces; OA, overall accuracy.
To intuitively compare the performance of these six impervious products, five validation regions, including two bare-soil-prevalent regions (Phoenix and Niamey), one vegetation-prevalent city (New York) and two cropland-prevalent regions (Winnipeg and Bangkok), were selected for presentation in Fig. 9. Specifically, in the first bare-soil-prevalent region of Phoenix, NUACI-2015 obviously underestimated the impervious surfaces in the center of Phoenix city. The causes of omission possibly came from the threshold method used by NUACI-2015. Liu et al. (2018) developed a novel NUACI index to enhance the impervious surfaces, suppressed the nonimpervious surfaces, and then found an optimal threshold for the NUACI index to split the impervious and nonimpervious surfaces. However, the NUACI values of rural villages and roads were usually located in the mixed areas of impervious and nonimpervious surfaces, so the NUACI-2015 had great ability for large-size impervious surfaces but poor performance for fragmented impervious surfaces. FROM-GLC-2015 performed well in the central city but missed impervious objects over peripheral urban areas. For example, the enlarged region (red rectangle), composed of sparse buildings and bare soils, was underestimated by FROM-GLC-2015. This omission error possibly came from the sparse training samples (91 433 training samples across the globe; Gong et al., 2013). GHSL-2015, accurately capturing the central and peripheral impervious objects, had significant agreement with MSMT-2015; it achieved a user's accuracy of 0.940 and producer's accuracy of 0.995 in this region (Table 2). As for GlobeLand30-2010, there was little omission for the fragmented impervious objects over peripheral urban areas because of the temporal interval of 5 years and the minimum 4×4 mapping unit (Chen et al., 2015). HBASE-2010 had the biggest impervious areas among several global products, but it misclassified the vegetation and bare soils into impervious surfaces in the urban central, so it had the highest commission error of 9.5 %, as seen in Table 2. As for the second bare-soil-prevalent city of Niamey, these products, except for GHSL-2015 which had a smaller impervious area than other products and missed the peripheral impervious objects, had similar performance to that for Phoenix: NUACI-2015 had a high omission error especially for the fragmented objects; HBASE-2010 lost the impervious details and achieved the highest commission error of 5.3 %, as seen in Table 2; GlobeLand30-2010 missed some small objects (the limitation of minimum 4×4 mapping unit) and peripheral impervious objects caused by the temporal interval; and FROM-GLC-2015 had great performance in the dense impervious areas but it underestimated over peripheral areas.
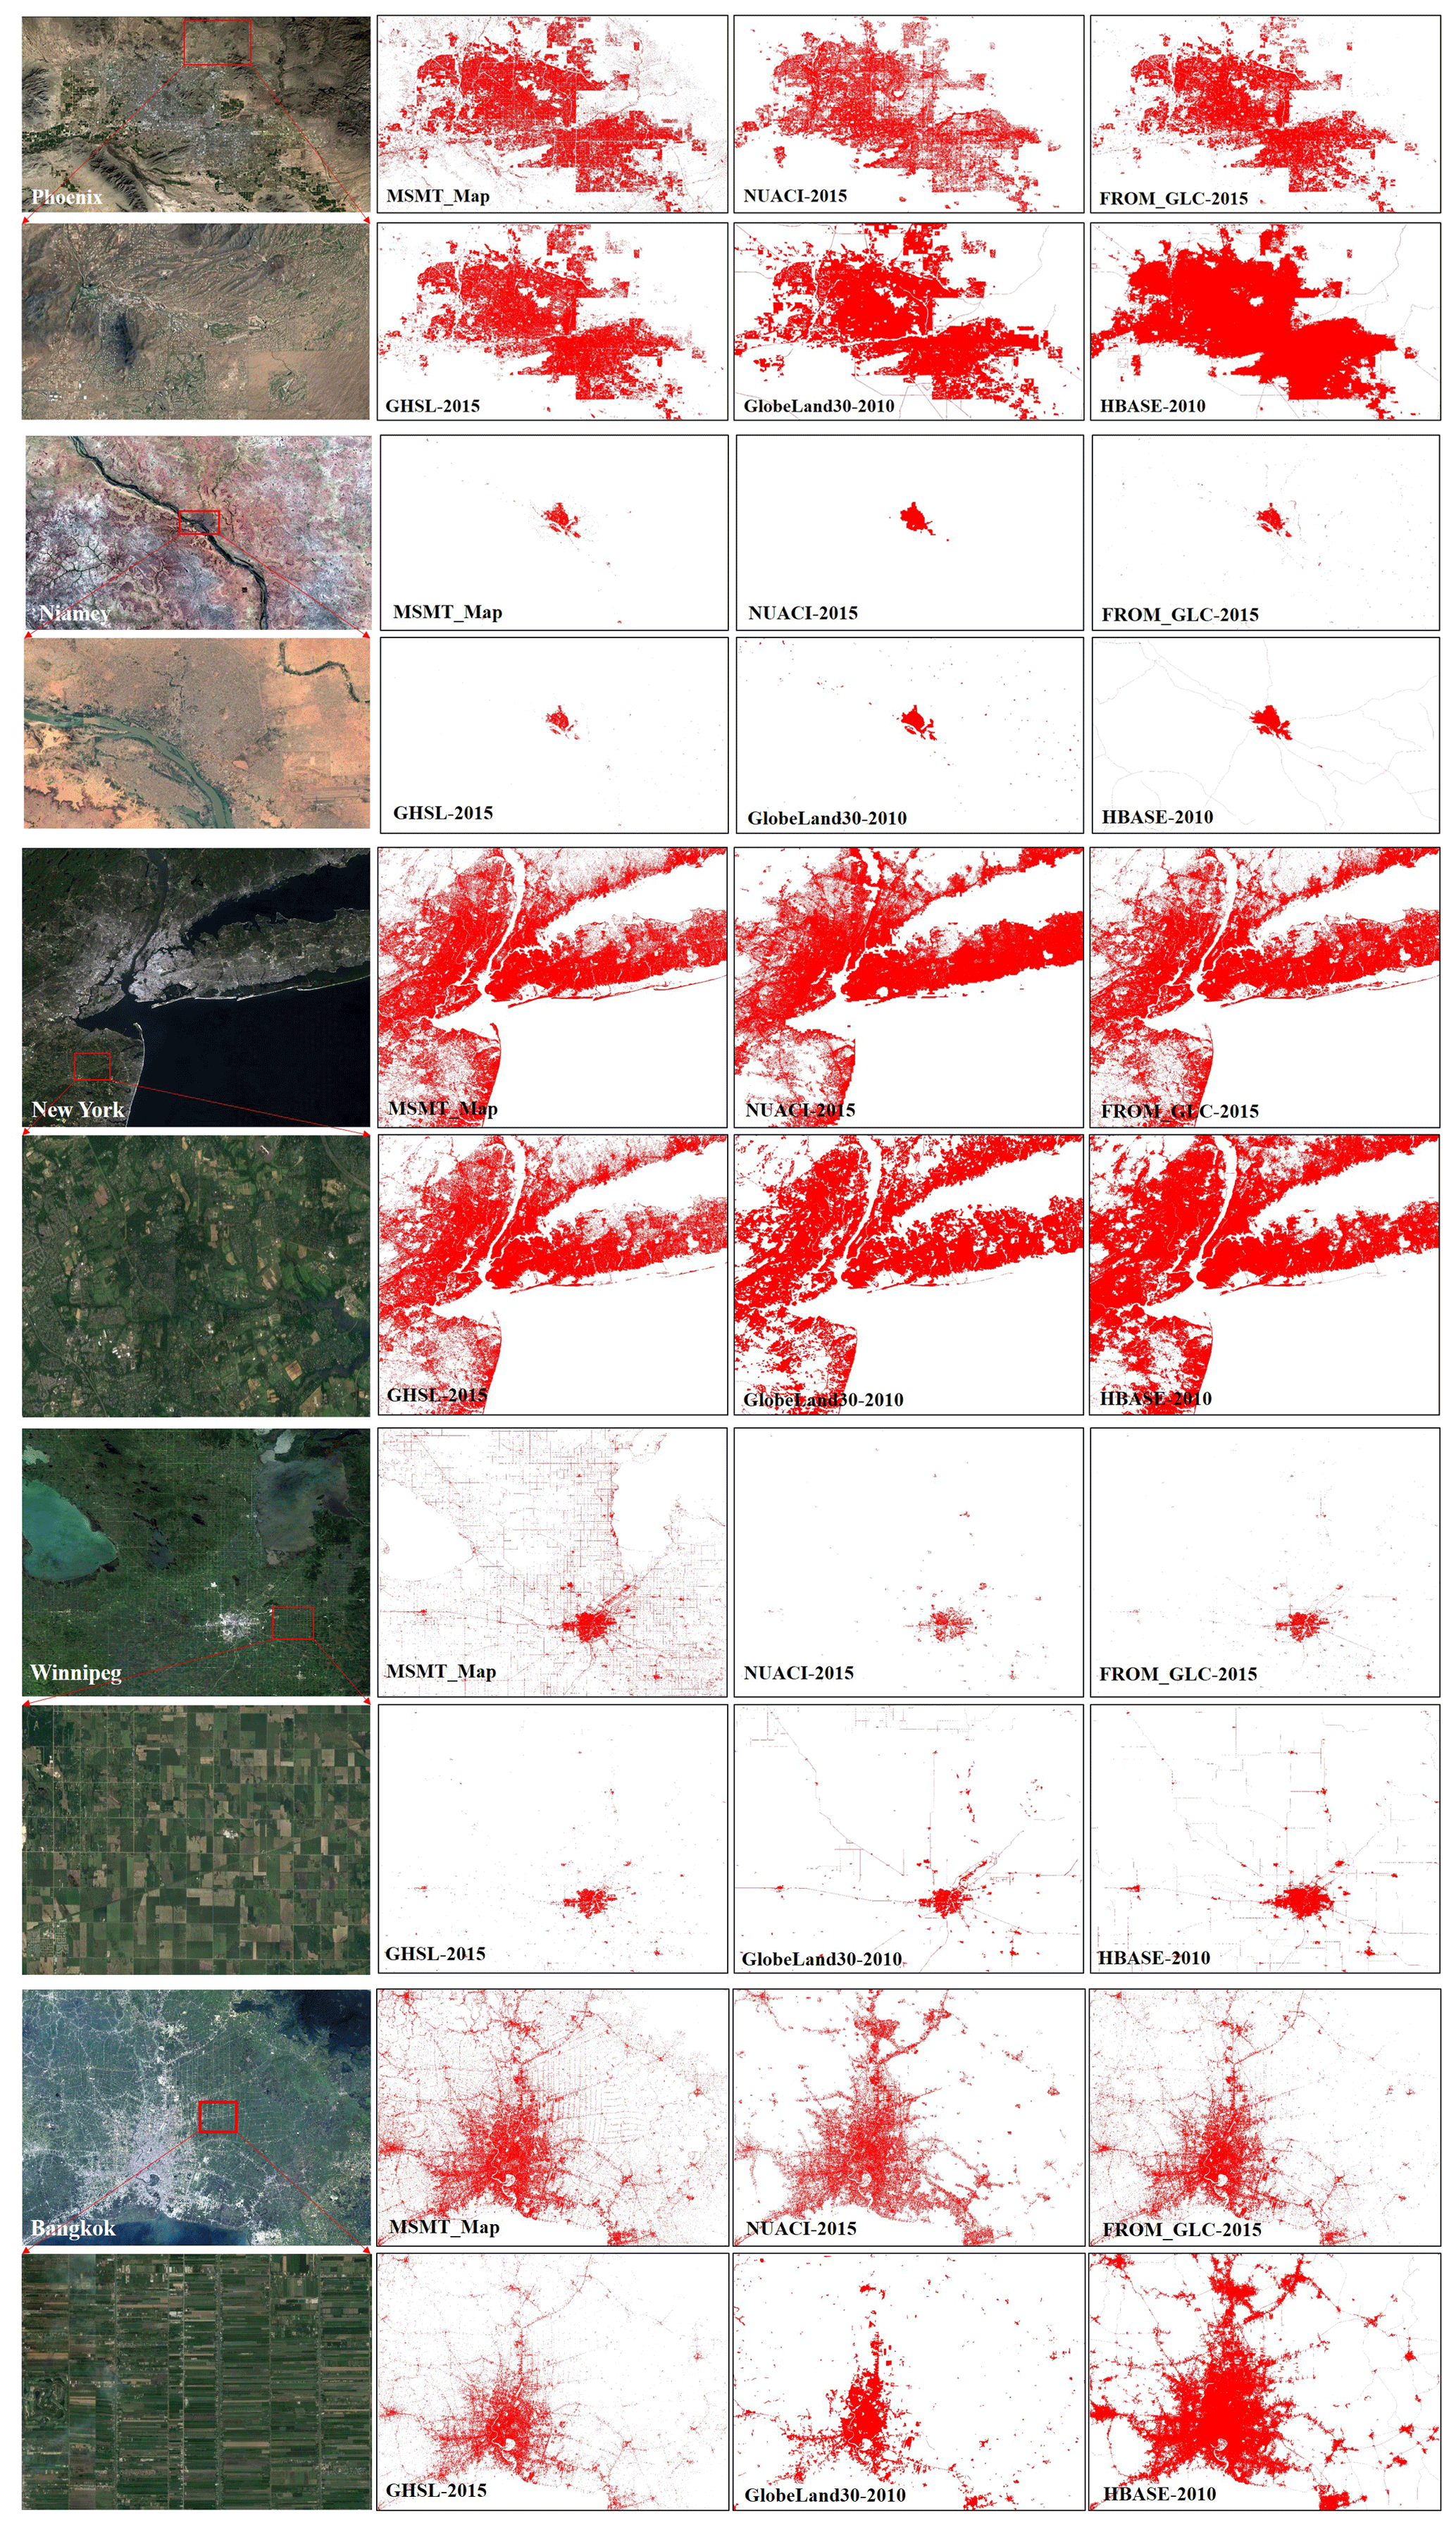
Figure 9Comparisons between the MSMT_RF-based impervious surface maps and other products (corresponding to the NUACI products developed by Liu et al., 2018; the FROM-GLC products developed by Gong et al., 2013; the GHSL products developed by Florczyk et al., 2019; the GlobeLand30 products developed by Chen et al., 2015; and the HBASE products developed by Wang et al., 2017a, respectively) for five regions with various impervious landscape. The Landsat imagery and corresponding local enlargements came from the United States Geological Survey (https://earthexplorer.usgs.gov/, last access: 8 July 2020).
Next, in the vegetation-prevalent region of New York, six products generally had similar identification results and accurately captured the spatial distribution of New York city, so they achieved high mapping accuracy exceeding 90 %, as seen in Table 2. However, from a detailed perspective, there were still differences between these products. Specifically, NUACI-2015 performed well in the center of the city but missed the sparse impervious objects over the peripheral city – for example, the enlarged region (Fig. 9, red rectangle) illustrates the mixture of vegetation and sparse buildings over the peripheral city – and NUACI-2015 and GlobeLand30-2010 had smaller impervious areas than other products. HBASE-2010 still suffered the highest commission error of 8.5 % and had the biggest impervious areas because it misclassified the bare soils and vegetation in the central city into impervious surfaces (blue rectangles). GHSL-2015, FROM-GLC-2015 and MSMT-2015 achieved higher mapping accuracy because they captured both dense and sparse impervious objects in the central and peripheral city.
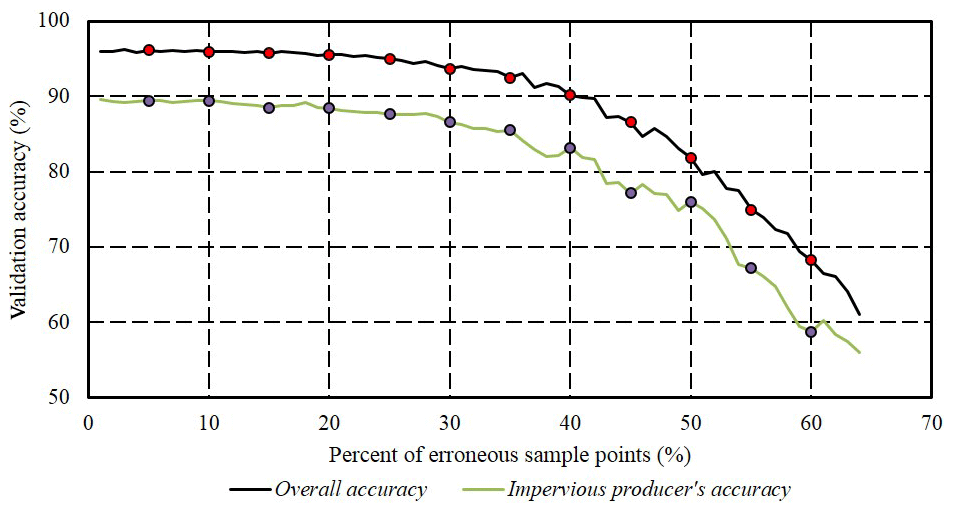
Figure 10Sensitivity analysis showing the relation between the classification accuracy and the percentage of erroneous samples points.
Lastly, in the two cropland-prevalent cities of Bangkok and Winnipeg, the MSMT-2015 had greater advantages and achieved the highest user's accuracy of 95.1 % and 100 % compared to the NUACI-2015 values of 69.5 % and 77.7 %, the FROM-GLC-2015 values of 71.7 % and 85.4 %, the GHSL-2015 values of 61.9 % and 89.9 %, the GlobeLand30-2010 values of 31.0 % and 74.9 %, and the HBASE-2010 values of 80.1 % and 91.1 %, as seen in Table 2. Figure 9 intuitively illustrates the performance of each product. GlobeLand30-2010 had smaller impervious areas in the central city because of the temporal interval and missed the road networks due to the minimum mapping unit of 4×4. As a result, GlobeLand30-2010 achieved the lowest user's accuracy. NUACI-2015 captured impervious surfaces in the central city but missed the road networks and sparse village buildings in the peripheral cities. FROM-GLC-2015 and HBASE-2015 had a similar performance in these two regions, which captured medium and large cities but missed the road networks and villages buildings. As HBASE-2010 contained the OpenStreetMap data to provide information on major road networks (Wang et al., 2017a), the omission error in HBASE-2010 was relatively low and only these village roads and buildings were missed; however, it still suffered from a serious overestimation problem. Especially in Bangkok city, the nonimpervious pixels (bare soils, water and vegetation) were misclassified as impervious surfaces. Therefore, HBASE-2010 reached the highest commission error among these impervious products, as seen in Table 2.
6.1 Reliability and sensitivity of the global training samples
In contrast to other classification-related studies that require manual efforts to collect training samples (Gao et al., 2012; Im et al., 2012; Zhang et al., 2016), we overcame the expensive cost of collecting accurate and sufficient training samples at a global scale. To ensure the accuracy and reliability of the training samples, a combination of the GlobeLand30-2010 land-cover product, which had been validated to have a producer's accuracy (which measures the commission error) of 94.7 % for impervious surfaces (see Sect. 5.4), and DMSP OLS NTL imagery was adopted to guarantee the reliability of each sample. As it was difficult and challenging to evaluate the accuracy of all the training samples, we randomly selected 1 % of the total training samples (in Sect. 3), including 34 990 nonimpervious and 9840 impervious points, to measure the reliability of the global training samples. After careful checking, we found that these training samples achieved accuracies of 91.9 % and 99.5 % for impervious and nonimpervious surfaces, respectively.
Meanwhile, even if the training samples still contained a small number of erroneous points, the random forest model has been demonstrated to be resistant to noise and the presence of erroneous samples (Belgiu and Drăguţ, 2016). In this study, we randomly changed the category of a certain percentage of the 34 990 samples and used the “noisy” samples to train the random forest classifier. Figure 10 illustrates the overall accuracy and impervious producer's accuracy decreased for the increased percentage of erroneous samples. It was found that the overall and impervious producer's accuracy remained stable when the percentage of erroneous samples increased from 1 % to 20 %, while it rapidly decreased when the percentage of erroneous samples was higher than 20 %. Similarly, Gong et al. (2019) also found that the decrease in overall accuracy was less than 1 % when the error in the training samples was less than 20 %.
Therefore, the reliability and sensitivity analysis indicated that (1) the random forest model is resistant to noisy training samples and performs well if the percentage of erroneous samples is lower than 20 % and (2) the training samples derived from the GlobeLand30 and DMSP OLS NTL imagery were accurate enough for use in global impervious surface mapping.
6.2 Limitations of the proposed method
Although the proposed MSMT_RF method has been demonstrated to have the ability to produce accurate impervious surface products, there are still some limitations to the method. First, as the training samples derived from the GlobeLand30-2010 are restricted to a 9 pixel × 9 pixel local window and further refined by the integration of MODIS EVI and VIIRS NTL imagery, low-density impervious samples might be omitted and cause further omission of low-density impervious surfaces (rural villages, small roads and so on). Although, in this study, spatially adjacent training samples from the surrounding 3×3 areas were imported to reduce the omission of low-density samples, according to the accuracy assessment, higher omission errors were found in low-density regions (Lhasa and Omdurman) than in high-density regions (New York and Moscow). Therefore, our future work will pay more attention to the omission of low-density impervious surfaces.
Table 3The detailed information of the datasets and processes in this study.

Secondly, as Weng (2012) pointed out, mixed pixels are common in medium-resolution imagery due to the limitations of the spatial resolution and spectral heterogeneity of the landscape. The effectiveness of “hard” classifiers is easily affected by these mixed pixels (low-density impervious pixels also constitute mixed pixels). Due to the proportion of impervious surfaces within a pixel, impervious surface areas are often overestimated in urban areas or underestimated in rural areas when using medium-resolution images (Lu and Weng, 2006). Therefore, our future work will focus on simultaneously producing the likelihood (“soft” probability) of each pixel being an impervious surface. At present, some scientists have produced continuous impervious fractions at a regional scale; for example, Okujeni et al. (2018) used the support vector regression method to estimate the fraction of impervious surfaces at the pixel scale.
The global impervious surface map dataset generated in this paper is available on Zenodo: https://doi.org/10.5281/zenodo.3505079 (Zhang and Liu, 2019).
To facilitate readers in reproducing this work, Table 3 gives the details of the data source and platform information of the datasets and processes in this study. The input remote sensing datasets and products came from three parts: the GEE platform, free-access websites and our group. Specifically, five kinds of basic datasets discussed in Sect. 2.1 were available at GEE platform. The five impervious surface products discussed in Sect. 2.2 were downloaded from the free-access websites of the National Geomatics Center of China, Tsinghua University, Sun Yat-sen University, National Aeronautics and Space Administration (NASA), and the Joint Research Centre (JRC). The validation samples were produced by our group using visual interpretation.
Further, the process of derivation of global training samples was implemented by using the multisource datasets at a localhost computation platform, and the random forest classification at each regional grid was developed by our group on the GEE platform using the JavaScript language. The importance of multisource and multitemporal features and the reliability and sensitivity of global training samples were analyzed in the localhost Python computation environment.
Due to the spectral heterogeneity and complicated makeup of impervious surfaces, large-area impervious mapping is challenging and difficult. In this study, a global 30 m impervious surface map was developed by using multisource, multitemporal remote sensing data based on the Google Earth Engine platform. First, the global training samples were automatically derived from the GlobeLand30-2010 land-cover product together with VIIRS NTL and MODIS EVI imagery. Then, a local adaptive random forest model was trained using the training samples and multisource and multitemporal datasets for each geographical grid. Following that, the global impervious map produced by mosaicking a large number of regional impervious surface maps was validated by comparing it with several existing products (GlobeLand30-2010, FROM-GLC-2015, NUACI-2015, HBASE-2010 and GHSL-2015) using approximately 11 942 interpretation samples. The results indicated that the MSMT_RF-based impervious surface map achieved the highest overall accuracy of 0.951 and kappa coefficient of 0.898 compared with 0.896 and 0.780 for FROM-GLC-2015, 0.856 and 0.695 for NUACI-2015, 0.903 and 0.794 for GHSL-2015, 0.884 and 0.753 for GlobeLand30-2010, and 0.880 and 0.754 for HBASE-2010 using all 15 regional validation data. Therefore, it can be concluded that the global 30 m impervious surface map produced by the proposed MSMT_RF method is accurate and reliable for use in global impervious surface mapping.
| Abbreviation | Definition |
| DEM | Digital elevation model |
| DMSP OLS | Defense Meteorological Satellite Program Operational Linescan System |
| EANTLI | EVI-adjusted nighttime light index |
| EVI | Enhanced vegetation index |
| FROM-GLC | Finer Resolution Observation and Monitoring of Global Land Cover |
| GEE | Google Earth Engine |
| GHSL | 30 m Global Human Settlement Layer |
| GlobeLand30 | 30 m Global Land Cover data product |
| HBASE | Human Built-up and Settlement Extent |
| MSMT_RF | Multisource, multitemporal random forest classification |
| NDBI | Normalized difference built-up index |
| NDVI | Normalized difference vegetation index |
| NDWI | Normalized difference water index |
| NLCD | National Land Cover Dataset |
| NTL | Nighttime light |
| NUACI | Normalized Urban Areas Composite Index |
| R2 | Coefficient of determination |
| RMSE | Root mean square error |
| RF | Random forest |
| SAR | Synthetic-aperture radar |
| VIIRS | Visible Infrared Imaging Radiometer Suite |
LL and XZ designed the method; XZ and XC programmed the software, while LL provided technical support. XZ, SX, XC and YG collected the validation database. XZ, LL and CW wrote the original draft, and BZ revised the draft.
The authors declare that they have no conflict of interest.
We gratefully acknowledge the free access to the GlobeLand30 land-cover products provided by the National Geomatics Center of China, the FROM-GLC land-cover products provided by Tsinghua University, the NUACI impervious surface products provided by Professor Xiaoping Liu at Sun Yat-sen University, the GHSL impervious surface products produced by the National Aeronautics and Space Administration, and HBASE produced by the Joint Research Centre.
This research has been supported by the Key Research Program of the Chinese Academy of Sciences (grant no. ZDRW-ZS-2019-1), the National Natural Science Foundation of China (grant no. 41825002) and the Strategic Priority Research Program of the Chinese Academy of Sciences (grant no. XDA19080304).
This paper was edited by David Carlson and reviewed by two anonymous referees.
Bai, Y., Feng, M., Jiang, H., Wang, J., and Liu, Y.: Validation of Land Cover Maps in China Using a Sampling-Based Labeling Approach, Remote Sens., 7, 10589–10606, https://doi.org/10.3390/rs70810589, 2015.
Ban, Y., Jacob, A., and Gamba, P.: Spaceborne SAR data for global urban mapping at 30 m resolution using a robust urban extractor, ISPRS J. Photogramm., 103, 28–37, https://doi.org/10.1016/j.isprsjprs.2014.08.004, 2015.
Belgiu, M. and Drăguţ, L.: Random forest in remote sensing: A review of applications and future directions, ISPRS J. Photogramm., 114, 24–31, https://doi.org/10.1016/j.isprsjprs.2016.01.011, 2016.
Bennett, M. M. and Smith, L. C.: Advances in using multitemporal night-time lights satellite imagery to detect, estimate, and monitor socioeconomic dynamics, Remote Sens. Environ., 192, 176–197, https://doi.org/10.1016/j.rse.2017.01.005, 2017.
Berger, M., Moreno, J., Johannessen, J. A., Levelt, P. F., and Hanssen, R. F.: ESA's sentinel missions in support of Earth system science, Remote Sens. Environ., 120, 84–90, https://doi.org/10.1016/j.rse.2011.07.023, 2012.
Bontemps, S., Defourny, P., Van Bogaert, E., Arino, O., Kalogirou, V., and Perez, J. R.: GLOBCOVER 2009-Products description and validation report, available at: http://due.esrin.esa.int/files/GLOBCOVER2009_Validation_Report_2.2.pdf (last access: 8 July 2020), 2011.
Brown de Colstoun, E. C., Huang, C., Wang, P., Tilton, J. C., Tan, B., Phillips, J., Niemczura, S., Ling, P.-Y., and Wolfe, R. E.: Global Man-made Impervious Surface (GMIS) Dataset From Landsat. NASA Socioeconomic Data and Applications Center (SEDAC), Palisades, NY, https://doi.org/10.7927/H4P55KKF, 2017.
Chen, J., Chen, J., Liao, A., Cao, X., Chen, L., Chen, X., He, C., Han, G., Peng, S., Lu, M., Zhang, W., Tong, X., and Mills, J.: Global land cover mapping at 30 m resolution: A POK-based operational approach, ISPRS J. Photogramm., 103, 7–27, https://doi.org/10.1016/j.isprsjprs.2014.09.002, 2015.
Chen, X., Cao, X., Liao, A., Chen, L., Peng, S., Lu, M., Chen, J., Zhang, W., Zhang, H., and Han, G.: Global mapping of artificial surfaces at 30 m resolution, Sci. China Earth Sci., 59, 2295–2306, https://doi.org/10.1007/s11430-016-5291-y, 2016.
Clarke, K. C., Hoppen, S., and Gaydos, L.: A self-modifying cellular automaton model of historical urbanization in the San Francisco Bay area, Environ. Plann. B, 24, 247–261, https://doi.org/10.1068/b240247, 1997.
Deng, C. and Wu, C.: BCI: A biophysical composition index for remote sensing of urban environments, Remote Sens. Environ., 127, 247–259, https://doi.org/10.1016/j.rse.2012.09.009, 2012.
Didan, K., Munoz, A. B., Solano, R., and Huete, A.: MODIS vegetation index user's guide (MOD13 series), Vegetation Index and Phenology Lab, The University of Arizona, 1–38, https://doi.org/10.5067/MODIS/MYD13Q1.006, 2015.
Du, P., Samat, A., Waske, B., Liu, S., and Li, Z.: Random Forest and Rotation Forest for fully polarized SAR image classification using polarimetric and spatial features, ISPRS J. Photogramm., 105, 38–53, https://doi.org/10.1016/j.isprsjprs.2015.03.002, 2015.
Elvidge, C. D., Tuttle, B. T., Sutton, P. C., Baugh, K. E., Howard, A. T., Milesi, C., Bhaduri, B. L., and Nemani, R.: Global Distribution and Density of Constructed Impervious Surfaces, Sensors, 7, 1962–1979, https://doi.org/10.3390/s7091962, 2007.
Elvidge, C. D., Baugh, K., Zhizhin, M., Feng, C. H., and Ghosh, T.: VIIRS night-time lights, Int. J. Remote Sens., 38, 5860–5879, https://doi.org/10.1080/01431161.2017.1342050, 2017.
ESA: Sentinel-1 SAR User Guide Introduction, availabe at: https://sentinel.esa.int/web/sentinel/user-guides/sentinel-1-sar (last access: 26 December 2019), 2016.
Farr, T. G., Rosen, P. A., Caro, E., Crippen, R., Duren, R., Hensley, S., Kobrick, M., Paller, M., Rodriguez, E., Roth, L., Seal, D., Shaffer, S., Shimada, J., Umland, J., Werner, M., Oskin, M., Burbank, D., and Alsdorf, D.: The Shuttle Radar Topography Mission, Rev. Geophys., 45, RG2004, https://doi.org/10.1029/2005rg000183, 2007.
Florczyk, A., Corbane, C., Ehrlich, D., Freire, S., Kemper, T., Maffenini, L., Melchiorri, M., Pesaresi, M., Politis, P., and Schiavina, M.: GHSL Data Package 2019, Luxembourg, EUR, 29788, https://doi.org/10.2760/290498, 2019.
Foody, G. M. and Mathur, A.: Toward intelligent training of supervised image classifications: directing training data acquisition for SVM classification, Remote Sens. Environ., 93, 107–117, https://doi.org/10.1016/j.rse.2004.06.017, 2004.
Fu, P. and Weng, Q.: A time series analysis of urbanization induced land use and land cover change and its impact on land surface temperature with Landsat imagery, Remote Sens. Environ., 175, 205–214, https://doi.org/10.1016/j.rse.2015.12.040, 2016.
Gao, F., Colstoun, E. B. d., Ma, R., Weng, Q., Masek, J. G., Chen, J., Pan, Y., and Song, C.: Mapping impervious surface expansion using medium-resolution satellite image time series: a case study in the Yangtze River Delta, China, Int. J. Remote Sens., 33, 7609–7628, https://doi.org/10.1080/01431161.2012.700424, 2012.
Gislason, P. O., Benediktsson, J. A., and Sveinsson, J. R.: Random Forests for land cover classification, Pattern Recogn. Lett., 27, 294–300, https://doi.org/10.1016/j.patrec.2005.08.011, 2006.
Goldblatt, R., Stuhlmacher, M. F., Tellman, B., Clinton, N., Hanson, G., Georgescu, M., Wang, C., Serrano-Candela, F., Khandelwal, A. K., Cheng, W.-H., and Balling, R. C.: Using Landsat and nighttime lights for supervised pixel-based image classification of urban land cover, Remote Sens. Environ., 205, 253–275, https://doi.org/10.1016/j.rse.2017.11.026, 2018.
Gong, P., Wang, J., Yu, L., Zhao, Y., Zhao, Y., Liang, L., Niu, Z., Huang, X., Fu, H., Liu, S., Li, C., Li, X., Fu, W., Liu, C., Xu, Y., Wang, X., Cheng, Q., Hu, L., Yao, W., Zhang, H., Zhu, P., Zhao, Z., Zhang, H., Zheng, Y., Ji, L., Zhang, Y., Chen, H., Yan, A., Guo, J., Yu, L., Wang, L., Liu, X., Shi, T., Zhu, M., Chen, Y., Yang, G., Tang, P., Xu, B., Giri, C., Clinton, N., Zhu, Z., Chen, J., and Chen, J.: Finer resolution observation and monitoring of global land cover: first mapping results with Landsat TM and ETM+ data, Int. J. Remote Sens., 34, 2607–2654, https://doi.org/10.1080/01431161.2012.748992, 2013.
Gong, P., Liu, H., Zhang, M., Li, C., Wang, J., Huang, H., Clinton, N., Ji, L., Li, W., Bai, Y., Chen, B., Xu, B., Zhu, Z., Yuan, C., Ping Suen, H., Guo, J., Xu, N., Li, W., Zhao, Y., Yang, J., Yu, C., Wang, X., Fu, H., Yu, L., Dronova, I., Hui, F., Cheng, X., Shi, X., Xiao, F., Liu, Q., and Song, L.: Stable classification with limited sample: transferring a 30 m resolution sample set collected in 2015 to mapping 10 m resolution global land cover in 2017, Sci. Bull., 64, 370–373, https://doi.org/10.1016/j.scib.2019.03.002, 2019.
Gorelick, N., Hancher, M., Dixon, M., Ilyushchenko, S., Thau, D., and Moore, R.: Google Earth Engine: Planetary-scale geospatial analysis for everyone, Remote Sens. Environ., 202, 18–27, https://doi.org/10.1016/j.rse.2017.06.031, 2017.
Hansen, M. C., Egorov, A., Potapov, P. V., Stehman, S. V., Tyukavina, A., Turubanova, S. A., Roy, D. P., Goetz, S. J., Loveland, T. R., Ju, J., Kommareddy, A., Kovalskyy, V., Forsyth, C., and Bents, T.: Monitoring conterminous United States (CONUS) land cover change with Web-Enabled Landsat Data (WELD), Remote Sens. Environ., 140, 466–484, https://doi.org/10.1016/j.rse.2013.08.014, 2014.
Homer, C., Huang, C., Yang, L., Wylie, B., and Coan, M.: Development of a 2001 national land-cover database for the United States, Photogramm. Eng. Rem. S., 70, 829–840, https://doi.org/10.14358/PERS.70.7.829, 2004.
Homer, C., Dewitz, J., Yang, L., Jin, S., Danielson, P., Xian, G., Coulston, J., Herold, N., Wickham, J., and Megown, K.: Completion of the 2011 National Land Cover Database for the conterminous United States–representing a decade of land cover change information, Photogramm. Eng. Rem. S., 81, 345–354, https://doi.org/10.1016/S0099-1112(15)30100-2, 2015.
Hu, Y., Liu, L., Liu, L., Peng, D., Jiao, Q., and Zhang, H.: A Landsat-5 atmospheric correction based on MODIS atmosphere products and 6S model, IEEE J. Sel. Top. Appl., 7, 1609–1615, https://doi.org/10.1109/JSTARS.2013.2290028, 2014.
Huang, X., Schneider, A., and Friedl, M. A.: Mapping sub-pixel urban expansion in China using MODIS and DMSP/OLS nighttime lights, Remote Sens. Environ., 175, 92–108, https://doi.org/10.1016/j.rse.2015.12.042, 2016.
Im, J., Lu, Z., Rhee, J., and Quackenbush, L. J.: Impervious surface quantification using a synthesis of artificial immune networks and decision/regression trees from multi-sensor data, Remote Sens. Environ., 117, 102–113, https://doi.org/10.1016/j.rse.2011.06.024, 2012.
Jokar Arsanjani, J., Tayyebi, A., and Vaz, E.: GlobeLand30 as an alternative fine-scale global land cover map: Challenges, possibilities, and implications for developing countries, Habitat Int., 55, 25–31, https://doi.org/10.1016/j.habitatint.2016.02.003, 2016.
Langanke, T., Moran, A., Dulleck, B., and Schleicher, C.: Copernicus Land Monitoring Service–High Resolution Layer Water and Wetness Product Specifications Document, Copernicus team at EEA, 2016.
Li, C., Peng, G., Wang, J., Zhu, Z., Biging, G. S., Yuan, C., Hu, T., Zhang, H., Wang, Q., and Li, X.: The first all-season sample set for mapping global land cover with Landsat-8 data, Sci. Bull., 62, 508–515, https://doi.org/10.1016/j.scib.2017.03.011, 2017.
Li, X. and Zhou, Y.: Urban mapping using DMSP/OLS stable night-time light: a review, Int. J. Remote Sens., 38, 6030–6046, https://doi.org/10.1080/01431161.2016.1274451, 2017.
Li, X., Gong, P., and Liang, L.: A 30-year (1984–2013) record of annual urban dynamics of Beijing City derived from Landsat data, Remote Sens. Environ., 166, 78–90, https://doi.org/10.1016/j.rse.2015.06.007, 2015.
Li, X., Zhou, Y., Zhu, Z., Liang, L., Yu, B., and Cao, W.: Mapping annual urban dynamics (1985–2015) using time series of Landsat data, Remote Sens. Environ., 216, 674–683, https://doi.org/10.1016/j.rse.2018.07.030, 2018.
Liu, X., Hu, G., Chen, Y., Li, X., Xu, X., Li, S., Pei, F., and Wang, S.: High-resolution multi-temporal mapping of global urban land using Landsat images based on the Google Earth Engine Platform, Remote Sens. Environ., 209, 227–239, https://doi.org/10.1016/j.rse.2018.02.055, 2018.
Lu, D. and Weng, Q.: Use of impervious surface in urban land-use classification, Remote Sens. Environ., 102, 146–160, https://doi.org/10.1016/j.rse.2006.02.010, 2006.
Massey, R., Sankey, T. T., Yadav, K., Congalton, R. G., and Tilton, J. C.: Integrating cloud-based workflows in continental-scale cropland extent classification, Remote Sens. Environ., 219, 162–179, https://doi.org/10.1016/j.rse.2018.10.013, 2018.
Okujeni, A., van der Linden, S., Tits, L., Somers, B., and Hostert, P.: Support vector regression and synthetically mixed training data for quantifying urban land cover, Remote Sens. Environ., 137, 184–197, https://doi.org/10.1016/j.rse.2013.06.007, 2013.
Okujeni, A., Canters, F., Cooper, S. D., Degerickx, J., Heiden, U., Hostert, P., Priem, F., Roberts, D. A., Somers, B., and van der Linden, S.: Generalizing machine learning regression models using multi-site spectral libraries for mapping vegetation-impervious-soil fractions across multiple cities, Remote Sens. Environ., 216, 482–496, https://doi.org/10.1016/j.rse.2018.07.011, 2018.
Olofsson, P., Foody, G. M., Herold, M., Stehman, S. V., Woodcock, C. E., and Wulder, M. A.: Good practices for estimating area and assessing accuracy of land change, Remote Sens. Environ., 148, 42–57, https://doi.org/10.1016/j.rse.2014.02.015, 2014.
Pekel, J. F., Cottam, A., Gorelick, N., and Belward, A. S.: High-resolution mapping of global surface water and its long-term changes, Nature, 540, 418–422, https://doi.org/10.1038/nature20584, 2016.
Pesaresi, M., Ehrlich, D., Ferri, S., Florczyk, A., Freire, S., Halkia, M., Julea, A., Kemper, T., Soille, P., and Syrris, V.: Operating procedure for the production of the Global Human Settlement Layer from Landsat data of the epochs 1975, 1990, 2000, and 2014, Publications Office of the European Union, 1–62, https://doi.org/10.2788/253582, 2016.
Pflugmacher, D., Cohen, W. B., Kennedy, R. E., and Yang, Z.: Using Landsat-derived disturbance and recovery history and lidar to map forest biomass dynamics, Remote Sens. Environ., 151, 124–137, https://doi.org/10.1016/j.rse.2013.05.033, 2014.
Radoux, J., Lamarche, C., Van Bogaert, E., Bontemps, S., Brockmann, C., and Defourny, P.: Automated training sample extraction for global land cover mapping, Remote Sens., 6, 3965–3987, https://doi.org/10.3390/rs6053965, 2014.
Ridd, M. K.: Exploring a V-I-S (vegetation-impervious surface-soil) model for urban ecosystem analysis through remote sensing: comparative anatomy for cities, Int. J. Remote Sens., 16, 2165–2185, https://doi.org/10.1080/01431169508954549, 1995.
Rodriguez-Galiano, V. F., Chica-Olmo, M., Abarca-Hernandez, F., Atkinson, P. M., and Jeganathan, C.: Random Forest classification of Mediterranean land cover using multi-seasonal imagery and multi-seasonal texture, Remote Sens. Environ., 121, 93–107, https://doi.org/10.1016/j.rse.2011.12.003, 2012.
Schneider, A., Friedl, M. A., and Potere, D.: A new map of global urban extent from MODIS satellite data, Environ. Res. Lett., 4, 044003, https://doi.org/10.1088/1748-9326/4/4/044003, 2009.
Schneider, A., Friedl, M. A., and Potere, D.: Mapping global urban areas using MODIS 500 m data: New methods and datasets based on “urban ecoregions”, Remote Sens. Environ., 114, 1733–1746, https://doi.org/10.1016/j.rse.2010.03.003, 2010.
Schug, F., Okujeni, A., Hauer, J., Hostert, P., Nielsen, J. Ø., and van der Linden, S.: Mapping patterns of urban development in Ouagadougou, Burkina Faso, using machine learning regression modeling with bi-seasonal Landsat time series, Remote Sens. Environ., 210, 217–228, https://doi.org/10.1016/j.rse.2018.03.022, 2018.
Shaban, M. and Dikshit, O.: Improvement of classification in urban areas by the use of textural features: the case study of Lucknow city, Uttar Pradesh, Int. J. Remote Sens., 22, 565–593, https://doi.org/10.1080/01431160050505865, 2001.
Shao, Z., Fu, H., Fu, P., and Yin, L.: Mapping Urban Impervious Surface by Fusing Optical and SAR Data at the Decision Level, Remote Sens., 8, 945, https://doi.org/10.3390/rs8110945, 2016.
Sun, G., Kong, Y., Jia, X., Zhang, A., Rong, J., and Ma, H.: Synergistic Use of Optical and Dual-Polarized SAR Data With Multiple Kernel Learning for Urban Impervious Surface Mapping, IEEE J. Sel. Top. Appl., 12, 223–236, https://doi.org/10.1109/jstars.2018.2883654, 2019.
Sun, Z., Wang, C., Guo, H., and Shang, R.: A Modified Normalized Difference Impervious Surface Index (MNDISI) for Automatic Urban Mapping from Landsat Imagery, Remote Sens., 9, 942, https://doi.org/10.3390/rs9090942, 2017.
Sun, Z., Xu, R., Du, W., Wang, L., and Lu, D.: High-Resolution Urban Land Mapping in China from Sentinel 1A/2 Imagery Based on Google Earth Engine, Remote Sens., 11, 752, https://doi.org/10.3390/rs11070752, 2019.
Tachikawa, T., Kaku, M., Iwasaki, A., Gesch, D. B., Oimoen, M. J., Zhang, Z., Danielson, J., Krieger, T., Curtis, B., Haase, J., Abrams, M., and Carabajal, C.: ASTER Global Digital Elevation Model Version 2 – Summary of validation results, available at: https://pubs.er.usgs.gov/publication/70005960 (last access: 8 July 2020), 2011.
Torres, R., Snoeij, P., Geudtner, D., Bibby, D., Davidson, M., Attema, E., Potin, P., Rommen, B., Floury, N., Brown, M., Traver, I. N., Deghaye, P., Duesmann, B., Rosich, B., Miranda, N., Bruno, C., L'Abbate, M., Croci, R., Pietropaolo, A., Huchler, M., and Rostan, F.: GMES Sentinel-1 mission, Remote Sens. Environ., 120, 9–24, https://doi.org/10.1016/j.rse.2011.05.028, 2012.
USGS: Landsat surface reflectance data, Reston, VA, Report 2015-3034, 2015.
USGS: Landsat 8 surface reflectance code (LaSRC) product, available at: https://www.usgs.gov/media/files/land-surface-reflectance-code-lasrc-product-guide (last access: 8 July 2020), 2018.
Vermote, E., Justice, C., Claverie, M., and Franch, B.: Preliminary analysis of the performance of the Landsat 8/OLI land surface reflectance product, Remote Sens. Environ., 185, 46–56, https://doi.org/10.1016/j.rse.2016.04.008, 2016.
Wang, P., Huang, C., Brown de Colstoun, E., Tilton, J., and Tan, B.: Global human built-up and settlement extent (HBASE) dataset from Landsat, NASA Socioeconomic Data and Applications Center (SEDAC): Palisades, NY, USA, https://doi.org/10.7927/H4DN434S, 2017a.
Wang, P., Huang, C., Tilton, J., Tan, B., and Brown de Colstoun, E.: HOTEX: An approach for global mapping of human built-up and settlement extent, 2017 IEEE International Geoscience and Remote Sensing Symposium (IGARSS), Fort Worth, TX, USA, 23–28 July 2017, 1562–1565, https://doi.org/10.1109/IGARSS.2017.8127268, 2017b.
Wang, Y., Liu, L., Hu, Y., Li, D., and Li, Z.: Development and validation of the Landsat-8 surface reflectance products using a MODIS-based per-pixel atmospheric correction method, Int. J. Remote Sens., 37, 1291–1314, https://doi.org/10.1080/01431161.2015.1104742, 2016.
Weng, Q.: A remote sensing-GIS evaluation of urban expansion and its impact on surface temperature in the Zhujiang Delta, China, Int. J. Remote Sens., 22, 1999–2014, https://doi.org/10.1080/713860788, 2001.
Weng, Q.: Remote sensing of impervious surfaces in the urban areas: Requirements, methods, and trends, Remote Sens. Environ., 117, 34–49, https://doi.org/10.1016/j.rse.2011.02.030, 2012.
Wetherley, E. B., Roberts, D. A., and McFadden, J. P.: Mapping spectrally similar urban materials at sub-pixel scales, Remote Sens. Environ., 195, 170–183, https://doi.org/10.1016/j.rse.2017.04.013, 2017.
Wu, C.: Normalized spectral mixture analysis for monitoring urban composition using ETM+ imagery, Remote Sens. Environ., 93, 480–492, https://doi.org/10.1016/j.rse.2004.08.003, 2004.
Wu, C. and Murray, A. T.: Estimating impervious surface distribution by spectral mixture analysis, Remote Sens. Environ., 84, 493–505, https://doi.org/10.1016/s0034-4257(02)00136-0, 2003.
Xie, Y. and Weng, Q.: Spatiotemporally enhancing time-series DMSP/OLS nighttime light imagery for assessing large-scale urban dynamics, ISPRS J. Photogramm., 128, 1–15, https://doi.org/10.1016/j.isprsjprs.2017.03.003, 2017.
Xu, H.: Analysis of Impervious Surface and its Impact on Urban Heat Environment using the Normalized Difference Impervious Surface Index (NDISI), Photogramm. Eng. Rem. S., 76, 557–565, https://doi.org/10.14358/pers.76.5.557, 2010.
Yang, J. and He, Y.: Automated mapping of impervious surfaces in urban and suburban areas: Linear spectral unmixing of high spatial resolution imagery, Int. J. Appl. Earth Obs., 54, 53–64, https://doi.org/10.1016/j.jag.2016.09.006, 2017.
Yang, Y., Xiao, P., Feng, X., and Li, H.: Accuracy assessment of seven global land cover datasets over China, ISPRS J. Photogramm., 125, 156–173, https://doi.org/10.1016/j.isprsjprs.2017.01.016, 2017.
Zhang, H., Zhang, Y., and Lin, H.: A comparison study of impervious surfaces estimation using optical and SAR remote sensing images, Int. J. Appl. Earth Obs., 18, 148–156, https://doi.org/10.1016/j.jag.2011.12.015, 2012.
Zhang, H., Zhang, Y., and Hui, L.: Seasonal effects of impervious surface estimation in subtropical monsoon regions, Int. J. Digit. Earth, 7, 746–760, https://doi.org/10.1080/17538947.2013.781241, 2014.
Zhang, H., Lin, H., Li, Y., Zhang, Y., and Fang, C.: Mapping urban impervious surface with dual-polarimetric SAR data: An improved method, Landscape Urban Plan., 151, 55–63, https://doi.org/10.1016/j.landurbplan.2016.03.009, 2016.
Zhang, H., Lin, H., and Wang, Y.: A new scheme for urban impervious surface classification from SAR images, ISPRS J. Photogramm., 139, 103–118, https://doi.org/10.1016/j.isprsjprs.2018.03.007, 2018.
Zhang, H. K. and Roy, D. P.: Using the 500 m MODIS land cover product to derive a consistent continental scale 3 m Landsat land cover classification, Remote Sens. Environ., 197, 15–34, https://doi.org/10.1016/j.rse.2017.05.024, 2017.
Zhang, L. and Weng, Q.: Annual dynamics of impervious surface in the Pearl River Delta, China, from 1988 to 2013, using time series Landsat imagery, ISPRS J. Photogramm., 113, 86–96, https://doi.org/10.1016/j.isprsjprs.2016.01.003, 2016.
Zhang, L., Zhang, M., and Yao, Y.: Mapping seasonal impervious surface dynamics in Wuhan urban agglomeration, China from 2000 to 2016, Int. J. Appl. Earth Obs., 70, 51–61, https://doi.org/10.1016/j.jag.2018.04.005, 2018.
Zhang, X. and Liu, L.: Development of a global 30 m impervious surface map using multi-source and multi-temporal remote sensing datasets with the Google Earth Engine platform, Zenodo, https://doi.org/10.5281/zenodo.3505079, 2019.
Zhang, X., Liu, L., Wang, Y., Hu, Y., and Zhang, B.: A SPECLib-based operational classification approach: A preliminary test on China land cover mapping at 30 m, Int. J. Appl. Earth Obs., 71, 83–94, https://doi.org/10.1016/j.jag.2018.05.006, 2018.
Zhang, X., Liu, L., Chen, X., Xie, S., and Gao, Y.: Fine Land-Cover Mapping in China Using Landsat Datacube and an Operational SPECLib-Based Approach, Remote Sens., 11, 1056, https://doi.org/10.3390/rs11091056, 2019.
Zhang, Y., Zhang, H., and Lin, H.: Improving the impervious surface estimation with combined use of optical and SAR remote sensing images, Remote Sens. Environ., 141, 155–167, https://doi.org/10.1016/j.rse.2013.10.028, 2014.
Zhu, Z., Gallant, A. L., Woodcock, C. E., Pengra, B., Olofsson, P., Loveland, T. R., Jin, S., Dahal, D., Yang, L., and Auch, R. F.: Optimizing selection of training and auxiliary data for operational land cover classification for the LCMAP initiative, ISPRS J. Photogramm., 122, 206–221, https://doi.org/10.1016/j.isprsjprs.2016.11.004, 2016.
Zhu, Z., Woodcock, C. E., Rogan, J., and Kellndorfer, J.: Assessment of spectral, polarimetric, temporal, and spatial dimensions for urban and peri-urban land cover classification using Landsat and SAR data, Remote Sens. Environ., 117, 72–82, https://doi.org/10.1016/j.rse.2011.07.020, 2012.
Zhuo, L., Shi, Q., Tao, H., Zheng, J., and Li, Q.: An improved temporal mixture analysis unmixing method for estimating impervious surface area based on MODIS and DMSP-OLS data, ISPRS J. Photogramm., 142, 64–77, https://doi.org/10.1016/j.isprsjprs.2018.05.016, 2018.
Zhou, T., Zhao, M., Sun, C., and Pan, J.: Exploring the Impact of Seasonality on Urban Land-Cover Mapping Using Multi-Season Sentinel-1A and GF-1 WFV Images in a Subtropical Monsoon-Climate Region, ISPRS Int. Geo-Inf., 7, 3, https://doi.org/10.3390/ijgi7010003, 2017.
- Abstract
- Introduction
- Datasets
- Collection of global training samples
- Multisource and multitemporal impervious classification method
- Results
- Discussion
- Data availability and user guidelines
- Conclusions
- Appendix A: List of abbreviations and acronyms
- Author contributions
- Competing interests
- Acknowledgements
- Financial support
- Review statement
- References