the Creative Commons Attribution 4.0 License.
the Creative Commons Attribution 4.0 License.
The PROFOUND Database for evaluating vegetation models and simulating climate impacts on European forests
Christopher P. O. Reyer
Ramiro Silveyra Gonzalez
Klara Dolos
Florian Hartig
Ylva Hauf
Matthias Noack
Petra Lasch-Born
Thomas Rötzer
Hans Pretzsch
Henning Meesenburg
Stefan Fleck
Markus Wagner
Andreas Bolte
Tanja G. M. Sanders
Pasi Kolari
Annikki Mäkelä
Timo Vesala
Ivan Mammarella
Jukka Pumpanen
Alessio Collalti
Carlo Trotta
Giorgio Matteucci
Ettore D'Andrea
Lenka Foltýnová
Jan Krejza
Andreas Ibrom
Kim Pilegaard
Denis Loustau
Jean-Marc Bonnefond
Paul Berbigier
Delphine Picart
Sébastien Lafont
Michael Dietze
David Cameron
Massimo Vieno
Hanqin Tian
Alicia Palacios-Orueta
Victor Cicuendez
Laura Recuero
Klaus Wiese
Matthias Büchner
Stefan Lange
Jan Volkholz
Hyungjun Kim
Joanna A. Horemans
Friedrich Bohn
Jörg Steinkamp
Alexander Chikalanov
Graham P. Weedon
Justin Sheffield
Flurin Babst
Iliusi Vega del Valle
Felicitas Suckow
Simon Martel
Mats Mahnken
Martin Gutsch
Katja Frieler
Process-based vegetation models are widely used to predict local and global ecosystem dynamics and climate change impacts. Due to their complexity, they require careful parameterization and evaluation to ensure that projections are accurate and reliable. The PROFOUND Database (PROFOUND DB) provides a wide range of empirical data on European forests to calibrate and evaluate vegetation models that simulate climate impacts at the forest stand scale. A particular advantage of this database is its wide coverage of multiple data sources at different hierarchical and temporal scales, together with environmental driving data as well as the latest climate scenarios. Specifically, the PROFOUND DB provides general site descriptions, soil, climate, CO2, nitrogen deposition, tree and forest stand level, and remote sensing data for nine contrasting forest stands distributed across Europe. Moreover, for a subset of five sites, time series of carbon fluxes, atmospheric heat conduction and soil water are also available. The climate and nitrogen deposition data contain several datasets for the historic period and a wide range of future climate change scenarios following the Representative Concentration Pathways (RCP2.6, RCP4.5, RCP6.0, RCP8.5). We also provide pre-industrial climate simulations that allow for model runs aimed at disentangling the contribution of climate change to observed forest productivity changes. The PROFOUND DB is available freely as a “SQLite” relational database or “ASCII” flat file version (at https://doi.org/10.5880/PIK.2020.006/; Reyer et al., 2020). The data policies of the individual contributing datasets are provided in the metadata of each data file. The PROFOUND DB can also be accessed via the ProfoundData R package (https://CRAN.R-project.org/package=ProfoundData; Silveyra Gonzalez et al., 2020), which provides basic functions to explore, plot and extract the data for model set-up, calibration and evaluation.
- Article
(4355 KB) - Full-text XML
-
Supplement
(1457 KB) - BibTeX
- EndNote
Process-based models are key tools for understanding systems and forecasting climate change impacts in ecology and Earth system science (Schellnhuber, 1999). Vegetation is a crucial component of the Earth system, and forests are particularly relevant through their influence on hydrological and biogeochemical cycles, biodiversity and ecosystem services. Process-based vegetation models are used as diagnostic tools to disentangle the influence of different environmental and human drivers on biogeochemical cycling as well as vegetation structure from local to plot-level (Eastaugh et al., 2011; Fontes et al., 2010; Pretzsch et al., 2015; Tiktak and van Grinsven, 1995) to global scales (Chang et al., 2017; Ito et al., 2017). At the same time these models are also the main tools to project climate change impacts on vegetation under changing environmental conditions, again from local (Reyer, 2015; Rötzer et al., 2013) to global levels (Zhu et al., 2016).
With increasing model complexity, the inclusion of more and more processes and models being increasingly used as tools for making quantitative projections for policy and management, there is a strong need to install some quality control on their performance. A basic requirement would be that models are actually able to match observed data. Moreover, while informal methods for calibration and model comparisons were often used in the past, the community has shifted in recent years towards more formal statistical methods for such tasks (Dietze et al., 2013; Hartig et al., 2012), which creates a need for systematic benchmarking data. For all these tasks, the availability of a wide range of data types crossing different spatial–temporal scales is generally viewed as beneficial (Grimm and Railsback, 2012).
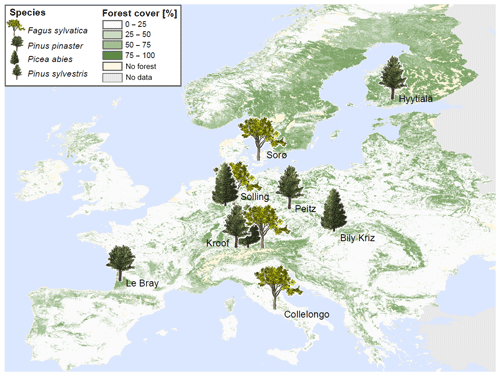
Figure 1Location of forest sites and main tree species. Background shows the European forest cover after Brus et al. (2012).
The process of formal calibration, comparison and evaluation of complex vegetation models is often hindered by the availability and the harmonization of suitable data. The data necessary to drive a vegetation model are often complex and need to be compiled from different data sources (e.g. Bagnara et al., 2019). In particular for model comparisons, besides data for the evaluation of individual models, common input and driving data for process-based vegetation models are needed to ensure fair comparisons between the participating models. Although model comparisons have a long tradition in vegetation modelling (Cramer et al., 1999, 2001; Bugmann et al., 1996; Morales et al., 2005), they have often been limited by overall data availability and comparability. Common databases that are ready to use for thorough model evaluation would allow the community to gain a better appreciation of model differences, explore structural uncertainties and provide a basis for more systematic ensemble projections of climate impacts.
Recently, several initiatives have started compiling model evaluation, input or driving data for a wide range of applications of process-based vegetation models (Huntzinger et al., 2013; Kelley et al., 2013; Warszawski et al., 2014; Sitch et al., 2015; Collier et al., 2018). Although these initiatives have leveraged important scientific progress, many of them have focussed on the global scale, mostly providing evaluation, input and driving data from global products. Such global products generally lack the breadth and depth of process-level detail required to rigorously assess model performance at smaller scales as for example they lack long-term and detailed measurements of forest stand structure. The database for the project “Towards robust projections of European forests under climate change” (hereafter PROFOUND DB) described here aims to bring together data from a wide range of data sources to evaluate vegetation models and simulate climate impacts at the forest stand scale. It has been designed to fulfil two objectives:
-
to allow for a thorough evaluation of complex, process-based vegetation models using multiple data streams covering a range of processes at different temporal scales and
-
to allow for climate impact assessments by providing the latest climate scenario data.
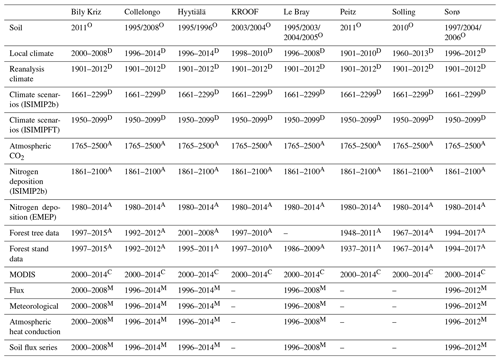
Table 1Overview of the data available in the PROFOUND DB. The years indicate the first and the last years for which data are available except for one-off measurements. The superscript letters indicate the temporal resolution of the data. O: one-off measurement(s); M = 30 min measurements; D: daily measurements; C: 8 d or 16 d composite; A: annual measurements.
The PROFOUND DB only provides data for individual forest stands but contains a number of elements that are designed to foster comparison of both global/regional models and local models. The climate data, for example, are provided locally (or bias-corrected using local data) in the same way that stand-scale vegetation models would need them and also extracted from global gridded datasets that global vegetation models would use. The PROFOUND DB is also designed to allow for disentangling of uncertainties that affect quantitative model predictions in ecology (see Lindner et al., 2014, and Dietze, 2017, for an explanation of different uncertainty types), for example by facilitating standardized evaluations of structural or process uncertainties via model comparisons. Model input and driver uncertainty are addressed through a wide range of climate data from different sources, covering the full range of Representative Concentration Pathways (RCPs). Collalti et al. (2018, 2019), for example, have used the PROFOUND DB to study the effects of thinning on carbon use efficiency across a combination of all four RCPs and five global climate models. Finally, parametric uncertainty can be assessed through the wide range of data that can be used for inverse calibration. In the following we describe the main components of the PROFOUND DB (Reyer et al., 2020) and an R Package (Silveyra Gonzalez et al., 2020) developed to explore the database and allow rapid and easy access for modellers.
2.1 Forest site selection and concept
The forest sites featured in the PROFOUND DB were selected to provide a wide array of data sources across a European gradient. We focussed in particular on providing long time series of tree- and stand-level growth and yield as well as carbon cycle data available from eddy-flux measurements because these variables are most commonly in calibrating and evaluating process-based vegetation models. The selected sites spread along a wide climatic gradient across Europe (Fig. 1, Table 3) and cover some of the most common European forest types, as well as the main central European forest management history of favouring monospecific, even-aged forests or mixtures of two tree species.
We compiled the data from existing data sources and collected the definitions of variables, their units and information about the main measurement methods from the site principal investigators (PIs) and from official descriptions of the data to harmonize the variables as much as possible. The overall guiding principle for the compilation of the data was to provide data that can be easily used by modellers for setting up and evaluating their models. In order to allow for data uncertainty to be reflected in model calibration studies, we also included uncertainty estimates for the measured data, such as those available for carbon flux measurements (see Sect. 3.2.9), wherever possible.
2.2 Data sources
The PROFOUND DB provides information on the site, soil and forest stand as well as data for climate, atmospheric CO2 concentration, nitrogen deposition, carbon fluxes, atmospheric heat conduction and remote sensing at a range of different temporal resolutions (i.e. from 30 min to decadal measurements). Table 1 provides an overview of the different data types and their temporal resolution available in the PROFOUND DB. All variables available are listed in Tables S1–S13 in the Supplement. In the following we describe how the individual sub-datasets of the PROFOUND DB have been brought together and describe the key variables and characteristics of each dataset.
2.2.1 Site information
For each forest site, the PROFOUND DB contains information on general site characteristics such as coordinates, elevation and forest type (Table 2). There is also information on the potential natural vegetation and main tree species belonging to the regional flora (not shown).
2.2.2 Soil data
The description of the soil profiles contains information about physical and chemical properties of each soil horizon including the organic layer. Unfortunately the soil data are very heterogeneous for the sites, and considerable amounts of data are missing. In order not to lose the data that are available for only a subset of sites, we did not harmonize the individual variables, but for each site we provide the soil data in a consistent format. Despite these limitations, for most sites important soil data such as the depth of horizons, soil texture, bulk density, field capacity, wilting point, carbon and nitrogen content, and pH of the soil solution are available (see Table S2).
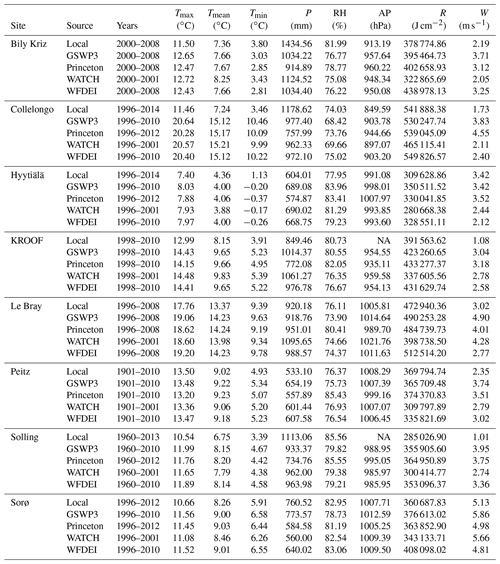
Table 3Averages of the daily maximum temperature (Tmax), daily minimum temperature (Tmin), daily mean temperature (Tmean), annual precipitation sum (P), daily mean relative humidity (RH), daily mean air pressure (AP), annual sum of global radiation (R, direct + diffuse shortwave radiation) and daily mean wind speed (W) for each of the sites in the PROFOUND DB from five different sources: a locally observed climate and four different global reanalysis/observational products (GSWP3, Princeton, WATCH, WFDEI). The column “Year” indicates the years for which the mean climates have been calculated for the different sources. Please note that the two Solling sites have the same climate. NA: not available.
2.2.3 Local climate
For every site we compiled the locally observed daily meteorological data, either from measurement towers or from nearby meteorological stations. These time series cover the main climatic variables required by vegetation models and different time periods for each site (Table 3). They represent the best possible climate information for each site and are most suitable for model simulations comparing simulation output to observations.
2.2.4 Reanalysis products
In order to cover longer historical time periods and to assess uncertainties due to the choice of different climate inputs, the PROFOUND DB also provides long historical daily climate time series for each of the sites extracted from four different global reanalysis/observational products:
-
Princeton's Global Meteorological Forcing Dataset (PGMFD v.2, hereafter Princeton) from 1901 to 2012 by Sheffield et al. (2006);
-
Global Soil Wetness Project Phase 3 (GSWP3) from 1901 to 2010 by Hjungjun Kim (personal communication, 2018, http://hydro.iis.u-tokyo.ac.jp/GSWP3/, last access: 5 June 2020);
-
Water and Global Change programme (WATCH) from 1901 to 2001 by Weedon et al. (2011);
-
WATCH-Forcing-Data-ERA-Interim (WFDEI) from 1901 to 2010 by Weedon et al. (2014).
Climate variables for the forest stands were extracted from the grid cell of the global reanalysis/observational product in which the forest stand is located. The data are then kept at the original resolution to allow for comparing the effects of choosing climate inputs for a vegetation model from a global reanalysis product as opposed to the local data presented in Sect. 3.2.3. The difference between the local data and the reanalysis data is most obvious for those sites located in complex, hilly terrain such as Collelongo or KROOF (Table 2). In these hilly locations the grid box average heights of the reanalysis products differ substantially from the heights of the site measurements.
2.2.5 Climate scenarios
The PROFOUND DB provides climate scenarios based on simulations performed for CMIP5 (https://www.wcrp-climate.org/wgcm-cmip/wgcm-cmip5; last accessed: 5 June 2020) that were bias-corrected and interpolated to a common grid resolution of according to Hempel et al. (2013). The climate variables for each site available were extracted from the grid cell of the downscaled climate forcing dataset in which the forest plot is located. The data can be used in very different ways by the vegetation modelling community.
-
The “ISIMIP Fast Track” scenarios (ISIMIPFT) consist of daily climate data available from five different global climate models (GCMs) (HadGEM2-ES, IPSL-CM5A-LR, MIROC-ESM-CHEM, GFDL-ESM2M and NorESM1-M.) for all four RCPs (Warszawski et al., 2014). The historical period lasts from 1950 to 2005 and then splits up into the four RCPs from 2006 to 2099 for each model. The RCPs cover future warming ranges of about 0–9 ∘C in the late 21st century compared to the 1980–2005 average (Fig. 2). These ISIMIPFT data are best suited for scenario studies that require a large ensemble of GCMs and RCPs.
-
The “ISIMIP2b” scenarios (ISIMIP2b) consist of daily climate data available from four different GCMs (IPSL-CM5A-LR, GFDL-ESM2M, MIROC5, HadGEM2-ES) for RCP2.6 and RCP6.0 (Frieler et al., 2017; Lange, 2018) as well as RCP4.5 and RCP8.5. The historical period lasts from 1861 to 2005 and then splits up into the four RCPs for each GCM from 2006 to 2099. The RCPs cover future warming ranges of about 1–9 ∘C in the late 21st century compared to the 1980–2005 average (Fig. S1). For RCP2.6, RCP4.5 and RCP8.5 from IPSL-CM5A-LR, HadGEM2-ES and MIROC5, additional data are also available for the period 2100–2299. These long-term climatic pathways stabilize at around 1–2 ∘C in the end of the 23rd century compared to 1980–2005 for RCP2.6, around 3–5 ∘C for RCP4.5 and up to 16 ∘C for RCP8.5. For all four GCMs, there are also time series of pre-industrial climatic conditions available from 1661 to 2299 (or 1661–2099 for GFDL-ESM2M), the so-called pre-industrial control run. The pre-industrial climates from each GCM for the time period 1661–1860 can be combined with the historical climates from 1861 to 2005 and any future time periods from the corresponding GCM to create a long-term time series of climate data from 1661 to 2299 (or 2099 depending on the GCM–RCP combinations) without almost any resampling (Frieler et al., 2017). The ISIMIP2b data are best suited to test the implications of long-term stabilization pathways and different degrees of warming relative to pre-industrial conditions in vegetation models.
-
The “ISIMIP2b locally bias-corrected” scenarios (ISIMIP2bLBC) have the same structure as the ISIMIP2b data but have been bias-corrected using an improvement of the method of Hempel et al. (2013) as described in Frieler et al. (2017) and Lange (2017) and the local observed climatologies presented in Sect. 3.2.3. The ISIMIP2bLBC data are hence best suited for scenario studies that require climatic data to be as consistent as possible with the observational data (Fig. 3).
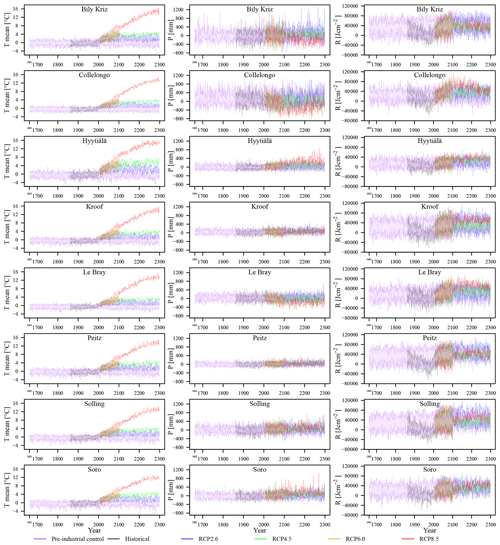
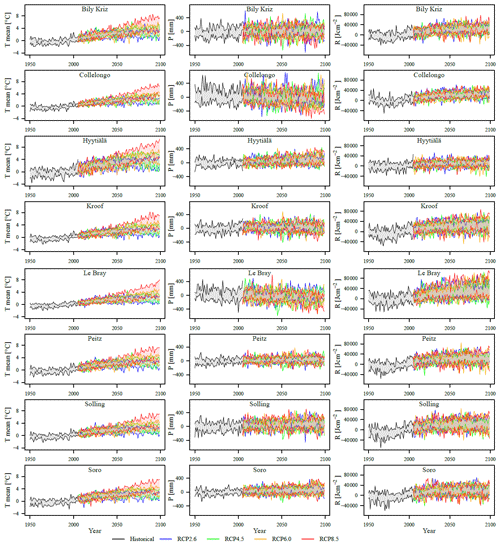
Figure 3Change in mean annual temperature (T mean), annual precipitation sum (P) and annual sum of global radiation (R) over the time period 1661–2299 relative to the 1980–2005 average for the ISIMIP2b locally bias-corrected (ISIMIP2bLBC) scenarios. Please note that the two Solling sites have the same climate.
2.2.6 Atmospheric CO2 concentrations
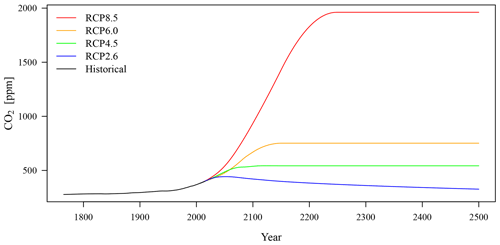
Time series of atmospheric CO2 concentrations are provided as annual, global data, hence as one time series for all sites of the PROFOUND DB assuming a well-mixed atmosphere. The historical time series of atmospheric CO2 are based on global atmospheric CO2 concentrations from Meinshausen et al. (2011) from 1765 to 2005 and have been extended for the period 2006–2015 with data from Dlugokencky and Tan (2014). The future annual atmospheric CO2 concentrations follow the four different Representative Concentration Pathways (RCPs, RCP2.6, RCP4.5, RCP6.0 and RCP8.5) from 2016 to 2500 from Meinshausen et al. (2011). Figure 4 shows the historical increase in CO2 concentrations since 1765 and the projected future emissions according to the different RCPs. From RCP2.6 till RCP8.5 the total level of CO2 increases strongly, and also the date of stabilizing emissions is reached much later in RCP8.5. RCP2.6 is the only RCP that projects declining CO2 levels in the long run.
2.2.7 Nitrogen deposition
The nitrogen deposition data, reported as total deposition of reduced and oxidized wet and dry nitrogen deposition, respectively, have been extracted for each site of the PROFOUND DB from two different datasets which serve different purposes.
-
EMEP data. For detailed model evaluation studies that require the best possible estimates of local nitrogen deposition, we extracted data from the “Co-operative programme for monitoring and evaluation of long-range transmission of air pollutants in Europe” (EMEP) for the time period 1980–2014 (EMEP/CEIP, 2014a, b). Sea-salt-corrected data are available from 1980 to 1995 in 5-year steps and from 1986 to 2014 at annual time step and are derived by atmospheric transport modelling (Simpson et al., 2012).
-
ISIMIP data. For model simulation studies, we also provide nitrogen deposition estimates based on atmospheric chemistry modelling for a historical time period (1861–2005) and four future scenarios, where nitrogen deposition follows the four RCPs. The data are further described in Lamarque et al. (2013a, b), sea-salt-corrected and consistent with the global nitrogen deposition data provided within ISIMIP (Frieler et al., 2017). The data are taken from the global dataset without further corrections and hence are not intended to represent realistic, local forecasts but rather rough estimates of future nitrogen projections.
For the 1980–2014 time period, the ISIMIP data are typically lower and less dynamic than the EMEP estimates (Fig. 5). However, while they do not seem suitable for historical model evaluations, they cover a much longer time period and are clearly interesting for scenario studies because they feature different nitrogen deposition pathways consistent with RCP climates and CO2 pathways. It is also important to note that measured throughfall of NO3 and NH4 is on average lower than modelled total deposition, due to canopy uptake (Marchetto et al., 2020). Moreover, for the two Solling sites the data presented here are identical while in reality total N deposition rates in the spruce stand should be higher because of higher dry depositions. Actually, the ratio between Solling spruce and Solling beech is 1.4 for NH4 throughfall fluxes, 1.6 for NO3 throughfall fluxes, 1.4 for NH4 total deposition and 1.4 for NO3 total deposition, both using a canopy budget model (Ulrich, 1994) for the period 1980–2014. However, these ratios are not constant and show an increasing trend over time.
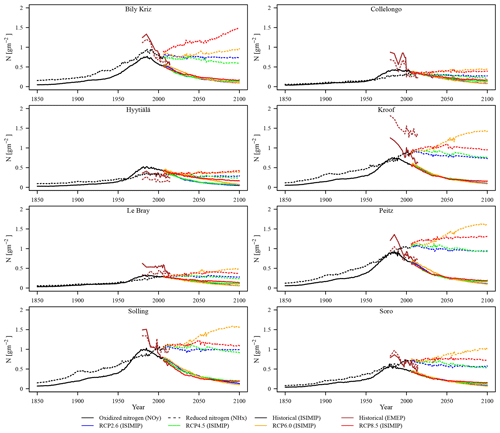
Figure 5Total deposition of reduced (NHx) and oxidized (NOy) nitrogen (N) at each of the sites of the PROFOUND DB. The historical period for the EMEP data extends from 1980 to 2014 and for the historical ISIMIP data from 1861–2005. The future scenarios are available from 2006 to 2100 and follow the RCP2.6 and RCP6.0 scenarios. Please note that the two Solling sites have the same N depositions (see text for further explanations).
2.2.8 Forest inventory data
For each site, the PROFOUND DB provides information about the forest stand at tree and stand level (Table 4). The data are available for different time periods and have different measurement intervals, but generally they cover mostly the second half of the 20th century and the first decade of the 21st century (Table 1). The data also cover a wide array of height–age and diameter at breast height (DBH)–age relationships (Figs. 6–7). For seven out of nine sites individual tree DBH and height measurements are available. The time series length ranges between 15 and 65 years within the time period 1948–2015. For the Sorø site, the DBH and heights have been reconstructed from tree-ring data (Babst et al., 2014), and the full stand reconstruction is available from 1996 to 2010 at annual resolution (see Sect. S1 in the Supplement). Individual tree data allow analysis and comparison of model simulations with data on single-tree growth. From the tree data, we calculated a range of widely used stand variables (see Table S8). Additional stand-level data are available for some of the sites, such as leaf litter production or leaf area index, and have been included (see Table S8).
Table 4Summary of the main stand variables for the forest stands in the PROFOUND DB. The first number in each cell indicates the value at the first measurement and the second number at the last measurement. The basal area-weighted mean height and DBH are shown for all stands with the exception of Le Bray for which the arithmetic mean height and DBH are shown (marked by asterisks). The numbers in brackets indicate different data availability for height than for the other variables.
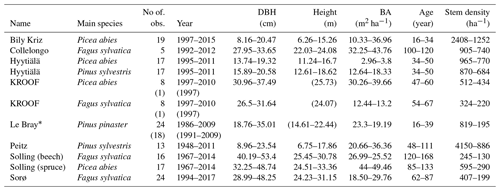
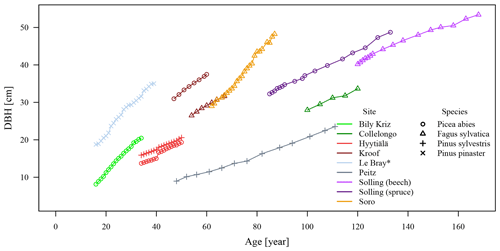
Figure 6Time series of tree diameter at breast height (DBH) versus age of the forest stands in the PROFOUND DB. The basal area-weighted mean DBH is shown for all stands with the exception of Le Bray for which the arithmetic mean DBH is shown (marked by asterisks). For Sorø, the DBHs have been reconstructed (see text in Sects. 4.9 and S1).
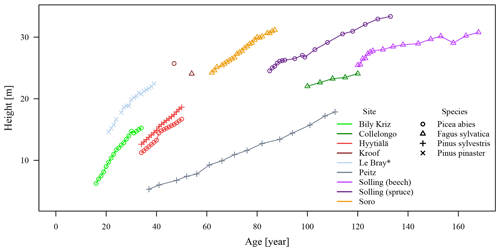
Figure 7Time series of tree height versus age of the forest stands in the PROFOUND DB. The basal area-weighted mean height is shown for all stands with the exception of Le Bray for which the arithmetic mean height is shown (marked by *). For Sorø, the heights have been reconstructed (see text in Sects. 4.9 and S1).
2.2.9 Flux data
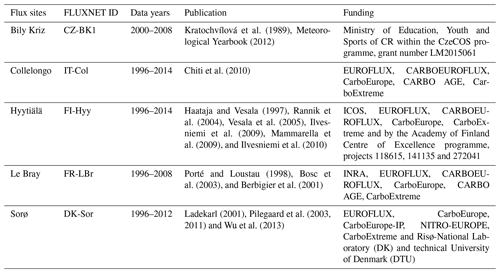
The carbon fluxes, i.e. net ecosystem exchange (NEE), ecosystem respiration (RECO) and gross primary production (GPP) are taken from the Tier One FLUXNET2015 dataset (http://fluxnet.fluxdata.org/, last access: 5 June 2020). We provide estimates of fluxes calculated using different estimates for gap-filled and partitioned fluxes to give a rough estimate of the uncertainty added to the long-term budgets in the process. NEE data are filtered using two different methods to calculate uStar thresholds (Barr et al., 2013, and a modified version of Papale et al., 2006; see also FLUXNET2015, 2017). Daytime (i.e. Lasslop et al., 2012) and night-time (i.e. Reichstein et al., 2005) refer to whether ecosystem respiration parameters were estimated from only night-time fluxes or also using daytime data (zero intercept of GPP light response curve). In many cases the number of accepted night-time fluxes is low and the temperature range is narrow, which leads to high uncertainty in the estimated respiration. This can be improved by also using daytime fluxes. On the other hand in the daytime method the uncertainties of photosynthetic light, temperature and possible vapour pressure deficit (VPD) responses may be attributed to respiration parameters. Further information about the daytime and night-time methods is available in Lasslop et al. (2010) and Reichstein et al. (2005) and also FLUXNET2015 (2017). We also extracted different uncertainty estimates for each variable. Additionally, we provide time series of the sensible and latent heat flux, soil (soil water and soil temperature) and meteorological variables at a 30 min time resolution from the FLUXNET2015 database including measurement uncertainty estimates. Table 5 provide an overview of the main carbon fluxes at each of the sites featured in the PROFOUND DB. Tables S9 and S11–S13 provides the full list of available variables.
Table 5Summary of the observed carbon fluxes at the sites in the PROFOUND DB. Shown is the range (min and max) and the average (in brackets) of the annual sums in the observational period. All data are estimates based on the CUTRef method with daytime data included for RECO and GPP. GPP is expressed with negative values because it is considered a downward flux from the atmosphere. Likewise, negative NEE values indicate a carbon sink and positive values a carbon source.

* The year 2007 is without data for Hyytiälä and the year 2002 for Le Bray.
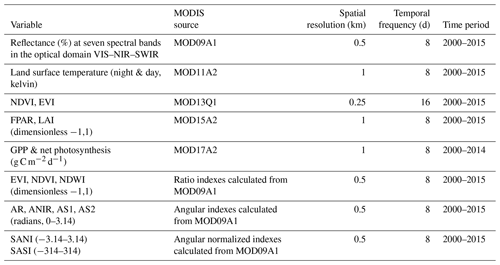
Table 6Summary of the remote sensing data included in the PROFOUND DB. VIS, NIR and SWIR are the visible, near-infrared and shortwave infrared regions of the electromagnetic spectrum. NDVI: normalized difference vegetation index; EVI: enhanced vegetation index; FPAR: fraction of photosynthetically absorbed radiation; LAI: leaf area index; GPP: gross primary productivity; NDWI: normalized difference water index; AR: angle at red; ANIR: angle at NIR; AS1: angle at shortwave infrared 1; AS2: angle at shortwave infrared 2; SANI: shortwave angle slope index; SASI: shortwave angle slope index.
2.2.10 Remote sensing data
The PROFOUND DB includes remote sensing information at different spatial scales and temporal frequencies, specific for each product. We included five MODIS products (ORNL DAAC, 2008a–e) and several vegetation indices calculated from the surface reflectance data for each of the forest sites. The original MODIS scenes are available at the NASA Land Processes Distributed Archive Center (LP DAAC) (https://lpdaac.usgs.gov/, last access: 5 June 2020). The specific time series included in the PROFOUND DB were downloaded from the Land Product Subset Web Service of the Oak Ridge National Laboratory Distributed Active Archive Center (ORNL DAAC) (https://daac.ornl.gov/MODIS/, last access: 5 June 2020). The ORNL DAAC MODIS subsetting web service is implemented to allow users access to massive amounts of remote sensing data (Santhana-Vannan et al., 2011). In addition, a second set of vegetation indexes was calculated from the reflectance values. A summary of this information is shown in Table 6. The full list of variables and how they were aggregated is provided in Table S10.
The main difference among the forest sites is the data quality, which is highly dependent on the presence of clouds. When possible, low-quality observations have been substituted by interpolated values, otherwise the cell was left blank. In any case the alteration of the original data was minimal. It is also important to note that the size of the pixel is large compared to the plot size of the forest stands, which means the pixel data also contain other vegetation types than the ones present at the sites.
Three general types of data are included: (1) geophysical variables as measured from the MODIS sensor, i.e. reflectance and temperature; (2) spectral indexes derived directly from reflectance values at different wavelengths; and (3) vegetation properties (i.e. FPAR, LAI, GPP and net photosynthesis) as estimated from physical variables through a range of models.
Although the MODIS sensor acquires daily information, the PROFOUND DB includes only composite data; that is, for each pixel the best value during a period of time (8 or 16 d) is selected as being representative of that specific period. Spatial resolution is also specific for each product and is dependent on the physical and technical limitations in the acquisition process of the variables involved in the product computation.
The NDVI and EVI at 250 m spatial resolution coming from the MOD13Q1 product were calculated from the visible and near-infrared spectral regions. A temporal frequency (16 d composite) was chosen to minimize the effect of clouds. The EVI index was developed to correct for atmospheric and background effects so that it shows a larger dynamic range in areas with high vegetation density (Didan et al., 2015).
The spectral profiles in the whole optical domain (i.e. 459–2155 nm) for each 8 d composite are represented by the surface spectral reflectance at seven wavelengths coming from the MOD09A1 product at 500 m spatial resolution. The criteria for the compositing process are low cloudiness, cloud shadows and low solar zenith angle; when several of these criteria are fulfilled the selection is based on the minimum value in the blue band (Vermote et al., 2015).
The second set of spectral indexes was computed from the MOD09A1 product. The indices based on the spectral shape have the advantage of combining information on three bands instead of two, and when the bands used are located in the SWIR region relevant information related to water is captured (Palacios-Orueta et al., 2005; Khanna et al., 2007; Palacios-Orueta et al., 2012).
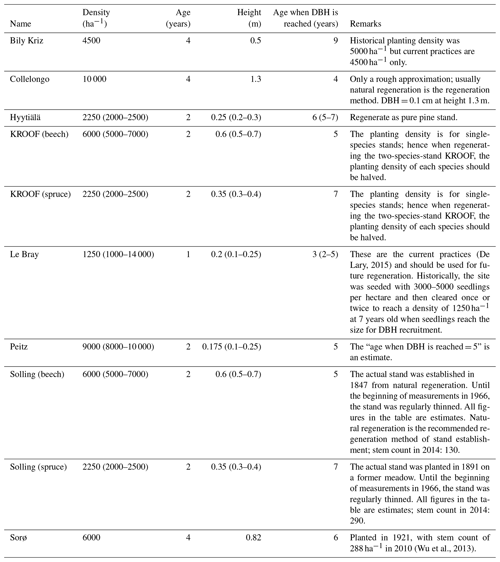
Table 8Planting information for the sites included in the PROFOUND DB. The numbers in brackets indicate plausible ranges (NA: not available).
LAI is defined as the one-sided green leaf area per unit ground area in broadleaf canopies and as one-half the total needle surface area per unit ground area in coniferous canopies. The FPAR is the fraction of photosynthetically active radiation (400–700 nm) that is absorbed by the canopy (Myneni, 2015). Gross primary productivity and net photosynthesis estimations are based on the light use efficiency (LUE) concept (Monteith, 1972) using satellite-derived FPAR (from MOD15) and independent estimates of PAR, besides other types of ancillary data. These are highly aggregated variables that have gone through several modelling steps already. Detailed information on the model and information sources used can be found in Running and Zhao (2015).
The most northern site is Hyytiälä in Finland with a boreal climate, while the most southern sites are Le Bray in France and Collelongo in Italy with an oceanic and Mediterranean montane climate, respectively. All other sites represent temperate climatic conditions ranging, however, from oceanic (Belgium, Denmark) to temperate (France, Germany) to sub-continental (Czech Republic). Unfortunately, sites representing more continental and (east) Mediterranean forests from southern and southeastern Europe are missing.
3.1 Bily Kriz (CZ)
The Bily Kriz site belongs to the ICP Forests Level II network and is a FLUXNET site located in the Moravian–Silesian Beskydy Mountains, Czech Republic, at an altitude of 875 m a.s.l. The climate is temperate with an annual mean temperature of 7.4 ∘C and an annual precipitation sum of 1434 mm over the 2000–2008 period. The soil is classified as a Haplic Podzol. The site is typical for mountain regions of temperate Europe such as the Black Forest, Bohemian Forest Šumava and forested Carpathians (Hercynian (spruce–)fir–beech forests) but also the higher mountain belts in the (sub-)Mediterranean. Stand-forming tree species for such sites are Fagus sylvatica, Abies alba and Picea abies. Currently, a large part of mixed mountain forests are strongly managed for timber production. The main tree species occurring in Bily Kriz are Picea abies, rarely with a small proportion of Fagus sylvatica. The stand data represent an (even-aged) Picea abies monoculture with a mean DBH of 19 cm (year 2015). The potential vegetation belongs to the geobiocoene-type groups: Abieti-fageta (5AB3) – Abies alba Mill. + Fagus sylvatica L. with understory: Calamagrostis arundinacea (L.) Roth, Oxalis acetosella L., Vaccinium myrtillus L., Deschampsia flexuosa (L.) Trin. More information about the site can be found in Kratochvilova et al. (1989) and Meteorological yearbook (2012).
3.2 Collelongo (IT)
The experimental site of Collelongo is located in Selva Piana, a pure Fagus sylvatica forest in Collelongo (AQ, central Italy) at 1560 m a.s.l. Located 100 km from Rome, it is one of the first Italian sites of the ICP network and also part of the ILTER international network. The climate is Mediterranean montane, with a mean annual temperature of 7.2 ∘C and a mean annual precipitation of 1179 mm in the period 1996–2014. Bedrock consists of Cretaceous limestone. Soil depth exhibits high spatial variability ranging from 40 to 100 cm and is classified as a Humic Alisol (Chiti et al., 2010) or Dystric Luvisol according to the FAO classification. The stand is a typical Apennine beech forest dominated by Fagus sylvatica with sporadic trees of Taxus baccata. The phytosociological association is Polysticho – Fagetum (Feoli and Lagonegro 1982). Currently, Collelongo constitutes a managed Fagus sylvatica stand with mean DBH of 25 cm in 2012. In the area around the eddy-flux tower there are only Fagus sylvatica trees. Moreover the footprint of the tower is totally included in the Fagus sylvatica forest. More information about the site can be found in Chiti et al. (2010), Collalti et al. (2016) and D'Andrea et al. (2019).
3.3 Hyytiälä (FI)
The most northern site included in the PROFOUND DB is the ICP Forests Level II site Hyytiälä, Finland. It is also a FLUXNET site and the coldest site with an annual temperature of 4.4 ∘C and 604 mm annual precipitation during the 1996–2014 period and lies at 185 m a.s.l. The soil is classified as a Haplic Podzol. Picea abies is the naturally dominant tree species building Fennoscandian moss-rich spruce forests with Pinus sylvestris. A Pinus sylvestris stand was sown in 1962, today with admixtures of Picea abies and hardwood species (Betula pendula, Betula pubescens and Populus tremula). Mean DBHs were 17 cm for P. sylvestris, 5 cm for P. abies and 7 cm for hardwood species in the year 2008. More information about the site can be found in Haataja and Vesala (1997), Rannik et al. (2004), Vesala et al. (2005), Ilvesniemi et al. (2009), Mammarella et al. (2009), and Ilvesniemi et al. (2010).
3.4 KROOF (DE)
The KROOF forest belongs to the “Kranzberg Forest Roof Experiment” of the Technical University of Munich (TUM) and the Helmholtz Zentrum München. The site is located close to Freising, Germany, in the Kranzberger Forst in 502 m a.s.l. (wc-alt.). Mean annual temperature is around 8.2 ∘C, and annual rainfall is around 849 mm during the period 1998–2010. The soil type, Luvisol, is typical for the region. The potential natural vegetation is (sessile oak–) beech forest (Fagus sylvatica, Quercus petraea, Quercus robur). The establishment of the research plot dates back to 1992. The mixed stand comprises large groups of Fagus sylvatica surrounded by Picea abies with mean DBHs of 26 and 33 cm in 2010, respectively. Other occurring species are Acer platanoides (20 cm), Pinus sylvestris (31 cm), Larix decidua (26 cm) and Quercus robur (29 cm). More information about the site can be found in Pretzsch et al. (1998, 2014) and Matyssek et al. (2014).
3.5 Le Bray (FR)
The ICP Forests site Le Bray is located 20 km southwest of Bordeaux, France, at an altitude of 61 m a.s.l. Mean annual temperature is about 13.4 ∘C, and precipitation is 920 mm during the 1996–2008 period, constituting a moderate oceanic climate. The soil type is Arenosol (sandy and hydromorphic podzol), which is one of the most common soils in the region. The natural vegetation is formed by deciduous broadleaf forests such as pedunculate oak forests (Quercus robur), partly with Quercus pyrenaica, Quercus suber and Pinus pinaster. The first measurements were made in 1986 in the monospecific planted Pinus pinaster stand. The site experienced a storm in 1999 and lost a large number of trees. In 2009, the mean DBH was 35 cm. The final clear cut of the site occurred at the beginning of 2009. More information about the site can be found in Porté and Loustau (1998), Bosc et al. (2003) and Berbigier et al. (2001).
3.6 Peitz (DE)
Peitz is a long-term research plot in eastern Brandenburg, Germany. The site lies at about 50 m a.s.l. The annual rainfall amounts to more than 608 mm, and annual mean temperature is around 9.2 ∘C during the 1901–2010 period. The soil type is a Dystric Cambisol. The potential natural vegetation is a south Scandinavian, east central European dwarf shrub and lichen-rich pine forest mix (Pinus sylvestris), partly with Quercus robur in the understorey, with Vaccinium vitis-idaea, Calluna vulgaris, Cladina spp. and Dicranum polysetum on sandy soils and siliceous rocks. The forest is a pine forest (Pinus sylvestris) with a mean DBH of around 23 cm and a stand height of 17 m in 2011. The understorey consists partly of Quercus robur. Measurements were started in 1948. More information about this site can be found in Riek and Stähr (2004) and Noack (2011, 2012) and about the climate data in Gerstengarbe et al. (2015).
3.7 Solling beech (DE)
Solling 304 is a long-term intensive forest monitoring plot (Level II) of the ICP Forests network in central Germany. The plot is also part of the LTER (site LTER_EU_DE_009) and of the permanent soil monitoring programme of the state of Lower Saxony. The site is situated in the centre of the Solling plateau at an elevation of about 500 m a.s.l. The mean temperature was around 6.8 ∘C and the mean annual rainfall amounted to 1113 mm during the period 1960–2013. The bedrock consist of Triassic sandstone covered with a 60 to 80 cm deep solifluction layer of loess material from which the soil, classified as an Haplic Cambisol, has developed. The humus type is a typical Moder. The tree layer consists only of European beech (Fagus sylvatica L.). Oxalis acetosella and Luzula luzuloides are the major species of the sparse ground vegetation. Actual vegetation was assigned to the Luzulo-Fagetum typicum and is close to the potential natural vegetation. The forest is a 168-year-old stand with a mean DBH of 50 cm and a mean height of 30.7 m in 2016. More information about the site can be found in Meiwes et al. (2009), Meesenburg et al. (2009, 2016), Panferov et al. (2009), Le Mellec et al. (2010), and Fleck et al. (2016).
3.8 Solling spruce (DE)
Solling 305 is also a long-term intensive forest monitoring plot of the ICP Forests Level II network in central Germany. As the Solling beech site it belongs to the LTER (site LTER_EU_DE_009) and is a permanent soil monitoring plot of the state of Lower Saxony. It is situated close to the Solling beech site at an elevation of about 508 m a.s.l. and has similar site conditions as the Solling beech stand. Potential natural vegetation is a Luzulo luzuloido Fagetum. Dominant species of the actual ground vegetation are Vaccinium myrtillus, Polytrichum formosum and Deschampsia flexuosa (Bolte et al., 2004). The forest is a 133-year-old Norway spruce (Picea abies) stand with a mean DBH of 46.6 cm and a mean height of 33.1 m in 2016. More information about the site can be found in Le Mellec et al. (2010), Bonten et al. (2011), Meesenburg et al. (2016), Fleck et al. (2016) and Wegehenkel et al. (2017).
3.9 Sorø (DK)
The ICOS site Sorø (DK-Sor in the FLUXNET and ICOS databases) is located in Denmark at an elevation of 40 m a.s.l. The climate is warm temperate and fully humid with a mean annual temperature of 9 ∘C and annual precipitation sum of 774 mm during the period 1996–2010. The soil has been classified as Alfisols and Mollisols. Potential natural vegetation is deciduous broadleaved forest dominated by Fagus sylvatica. Other species occurring in the area are Fraxinus excelsior, Larix decidua, Picea abies, Quercus spp. and Acer spp. However, the region is mostly used as cropland. Data on tree DBH are reconstructed from tree-ring measurement (Babst et al., 2014) and historical management information for the time period from 1994 to 2017. Stand data are derived from these data for the time period from 1994 to 2017 (see Sect. S1). The mean DBH of this Fagus sylvatica stand was 41 cm in the year 2017. More information about the site can be found in Ladekarl (2001), Pilegaard et al. (2003, 2011) and Wu et al. (2013). More information about the site can be found in Ladekarl (2001), Pilegaard et al. (2003, 2011) and Wu et al. (2013).
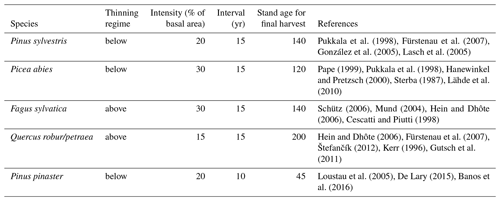
The sites available in the PROFOUND DB are managed forests, and the historic management can be derived from the tree and stand-level data (in terms of reduction of stem numbers). However, for future scenario studies, generic, simple management and planting guidelines are available (Tables 7–8). This future management corresponds best to “intensive even-aged forestry” as defined by Duncker et al. (2012).
The ProfoundData R package provides functions to access the PROFOUND DB (Figs. S2 and S3). The ProfoundData package plus a detailed vignette explaining the functionalities are available on CRAN (https://CRAN.R-project.org/package=ProfoundData, last access: 5 June 2020). The ProfoundData package serves as an interface for users that want to access the PROFOUND DB as a relational database via the R statistical software (R Core Team, 2016). The following main functions are included to achieve this goal:
-
“getData” to download data (data can be downloaded for one forest site and one underlying dataset at a time);
-
“browseData” to check the available forest sites, datasets, variables for a dataset, datasets for a forest site and the database version, metadata, data policy and original data source;
-
“plotData” to quickly inspect any variable of the datasets visually;
-
“summarizeData” to summarize data from the database;
-
“queryDB” to pass self-defined queries;
-
“writeSim2netCDF” to write netCDF files and can be used to convert data (and other files such as model simulation output) into netCDF files.
While the ProfoundData R package is meant to provide easy access to the PROFOUND DB, the database is also fully functional without the R package.
The PROFOUND Database (https://doi.org/10.5880/PIK.2020.006/, Reyer et al., 2020) is available under the Creative Commons Attribution-NonCommercial 4.0 International license (CC BY-NC 4.0). The PROFOUND R Package (ProfoundData, https://CRAN.R-project.org/package=ProfoundData, last access: 5 June 2020, Silveyra Gonzalez et al., 2020) is available via a GLP3 license. An earlier version of the database, including an outdated reconstruction of the Sorø tree data has been published as Reyer et al. (2019).
A wide range of data are needed to properly evaluate complex process-based vegetation models. The PROFOUND database compiles data from soil, climate, stand and flux measurements with data from remote sensing, atmospheric nitrogen modelling and climate modelling. Moreover, by providing data at grid level plus locally bias-corrected climate data, the datasets can be used to compare local forest models to global vegetation models. The PROFOUND database thus facilitates model evaluation, calibration, uncertainty analysis and model intercomparisons, highlighting the immense value of long-term environmental monitoring data for robust inferences about causal processes and future dynamics of forests.
The supplement related to this article is available online at: https://doi.org/10.5194/essd-12-1295-2020-supplement.
CPOR and RSG contributed equally to the paper. CPOR and FH initiated the research. CPOR RSG, KD and FH designed the PROFOUND database. CPOR, RSG, YH and KD harmonized and prepared data for the PROFOUND database. RSG programmed the PROFOUND database and R package together with FH, FB and JS. LK and JK provided data for Bily Kriz. AC, GM, CT and EA provided data for Collelongo. PK, AM, TV, IM and JP provided data for Hyyitälä. TR and HP provided data for KROOF. DL, LMB, PB, DP and SL provided data for Le Bray. MN and PLB provided data for Peitz. HM, SF and MW provided data for the Solling sites. AI, KP and FB provided data for Sorø. DC and MV prepared the EMEP nitrogen data. HT and MB prepared the ISIMIP nitrogen data. AP, VC and RSG prepared the MODIS data. MB, JV, SL and HK prepared the climate data. SL bias-corrected the climate data. MM and MG checked the data and R Package. All other authors provided expertise on individual datasets and how to prepare them. CPOR wrote the manuscript with the support of all authors.
The authors declare that they have no conflict of interest.
We are grateful for the support of all contributing data entities. The climate scenarios have been provided by ISIMIP (BMBF, grant no. 01L1201A1). The initial plot selection was supported with data from the International Co-operative Programme on Assessment and Monitoring of Air Pollution Effects on Forests (ICP Forests) operating under the UNECE Convention on Long-range Transboundary Air Pollution (CLRTAP). The data collection in Bily Kriz was supported by the Ministry of Education, Youth and Sports of CR within the CzeCOS programme, grant number LM2015061. Data collection at the Collelongo site was supported by the projects EUROFLUX, CANIF, CARBOEUROFLUX, FORCAST, CarboEurope and PRIN-MIUR. Activity and data analysis at the site are currently funded by resources available from the Ministry of University and Research (FOE-2019), under projects CNR DTA.AD003.474 and CNR DBA.AD003.139. The Hyytiälä data collection was supported by the projects EUROFLUX, CARBOEUROFLUX, CarboEurope and CarboExtreme and by the Academy of Finland Centre of Excellence programme, projects 118615, 141135 and 272041. The KROOF data were provided by TU Munich funded through the DFG – Sonderforschungsbereich SFB 607 and the DFG – KROOF project “Interactions between Norway spruce and European beech under drought” (PR 292/12-1, MA 1763/7-1, MU 831/23-1) as well as by the Bavarian State Ministry for Nutrition, Agriculture and Forestry and the Bavarian State Ministry for Environment and Health and BaySF (Bavarian State Forest Enterprise). The data for Le Bray were kindly provided by INRA funded through the projects EUROFLUX, CARBOEUROFLUX, CarboEurope, CARBO AGE and CarboExtreme. The Peitz data were kindly provided by Eberswalde Forestry Competence Centre. We are grateful to the Northwest German Forest Research Institute, Göttingen, for providing the Solling Data. Solling Data from January 2009 to June 2011 were co-funded by LIFE+ and the Regulation (EC) no. 614/2007 of the European Parliament and of the Council, project FutMon (Further Development and Implementation of an EU-level Forest Monitoring System). The Sorø data collection has been funded through the EU projects EUROFLUX, CarboEurope, CarboEurope-IP, NitroEurope, CarboExtreme and Risø-National Laboratory (DK) and the Technical University of Denmark (DTU). This work used eddy covariance data acquired and shared by the FLUXNET community, including these networks: CarboEurope-IP, CARBOITALY and ICOS. The FLUXNET eddy covariance data processing and harmonization were carried out by the ICOS Ecosystem Thematic Center, AmeriFlux Management Project and Fluxdata project of FLUXNET, with the support of CDIAC, and the OzFlux, ChinaFLUX and AsiaFLUX offices. Graham Weedon was supported by the Joint DECC and Defra Integrated Climate Programme – DECC/Defra (GA01101). CPOR and RSG acknowledge support from the German Federal Office for Agriculture and Food (BLE, grant no. 2816ERA06S). Friedrich Bohn acknowledges funding from the project “Inside out” (no. POIR.04.04.00-00-5F85/18-00) funded by the HOMING programme of the Foundation for Polish Science co-financed by the European Union under the European Regional Development Fund. Hyungjun Kim acknowledges the Grant-in-Aid for Specially promoted Research 16H06291 and Scientific Research (18KK0117) from the Japan Society for the Promotion of Science. We are also grateful to Kirsten Elger, Robert Gieseke, Katja Henning-Hofmann and Michael Flechsig for their support to make the database open access. We are grateful to the many unmentioned technicians and students for their substantial help to maintain the continuous long-term field observations.
The PROFOUND Database has been developed based on work from COST Action FP1304 PROFOUND (Towards Robust Projections of European Forests under Climate Change), supported by COST (European Cooperation in Science and Technology, https://www.cost.eu/, last access: 5 June 2020), the Inter-Sectoral Impact Model Intercomparison project (ISIMIP, grant no. 01L1201A1).) and the I-Maestro project (“Innovative forest MAnagEment STRategies for a resilient bioecOnomy under climate change and disturbances”, grant nos. 773324 and 22035418) funded by the ERA-NET Cofund Forest-Value and benefited from discussions in the IUFRO Task Force on Climate Change and Forest Health.
This paper was edited by David Carlson and reviewed by two anonymous referees.
Babst, F., Bouriaud, O., Papale, P., Gielen, B., Janssens, IA., Nikinmaa, E., Ibrom, A., Wu, J., Bernhofer, C., Köstner, B., Grünwald, T., Seufert, G., Ciais, P., and Frank, D.: Above-ground woody carbon sequestration measured from tree rings is coherent with net ecosystem productivity at five eddy-covariance sites, New Phytologist, 201, 1289–1303, https://doi.org/10.1111/nph.12589, 2014
Bagnara, M., Silveyra Gonzalez, R., Reifenberg, S., Steinkamp, J., Hickler, T., Werner, C., Dormann, C. F., and Hartig, F.: An R package facilitating sensitivity analysis, calibration and forward simulations with the LPJ-GUESS dynamic vegetation model, Environ. Model. Softw., 111, 55–60, https://doi.org/10.1016/j.envsoft.2018.09.004, 2019
Banos, V., Deuffic, P., Hautdidier, B., and Sergent, A.: A forward-looking approach to foster integrated forest development, A case study in the forests of the landes de gascogne, Rev. For. Française, 68, 231–243, https://doi.org/10.4267/2042/62005, 2016.
Barr, A. G., Richardson, A., Hollinger, D., Papale, D., Arain, M. A., Black, T. A., Bohrer, G., Dragoni, D., Fischer, M. L., Gu, L., Law, B., Margolis, H., McCaughey, H., Munger, J., Oechel, W., and Schaeffer, K.: Use of change-point detection for friction-velocity threshold evaluation in eddy-covariance studies, Agr. For. Meteorol., 171, 31–45, https://doi.org/10.1016/j.agrformet.2012.11.023, 2013.
Berbigier, P., Bonnefond, J. M., and Mellmann, P.: CO2 and water vapour fluxes for 2 years above Euroflux forest site, Agr. For. Meteorol., 108, 183–197, https://doi.org/10.1016/S0168-1923(01)00240-4, 2001.
Bolte, A., Lambertz, B., Steinmeyer, A., Kallweit, R., and Meesenburg, H.: Zur Funktion der Bodenvegetation im Stoffhaushalt von Wäldern – Studien auf Dauerbeobachtungsflächen des EU Level II-Programms in Norddeutschland, Forstarchiv, 75, 207–220, 2004.
Bonten, L. T. C., Groenenberg, J. E., Meesenburg, H., and de Vries, W.: Using advanced surface complexation models for modelling soil chemistry under forests: Solling forest, Germany, Environ. Pollut., 159, 2831–2839, https://doi.org/10.1016/j.envpol.2011.05.002, 2011.
Bosc, A., de Grandcourt, A., and Loustau, D.: Variability of stem and branch maintenance respiration in a Pinus pinaster tree, Tree Physiol., 23, 227–236, https://doi.org/10.1093/treephys/23.4.227, 2003.
Brus, D., Hengeveld, G., Walvoort, D. J. J., Goedhart, P. W., Heidema, A. H., Nabuurs, G.-J., and Gunia, K.: Statistical mapping of tree species over Europe, Eur. J. For. Res., 131, 145–157, https://doi.org/10.1007/s10342-011-0513-5, 2012.
Bugmann, H. M., Yan, X., Sykes, M., Martin, P., Lindner, M., Desanker, P., and Cumming, S.: A comparison of forest gap models: Model structure and behaviour, Clim. Change, 34, 289–313, https://doi.org/10.1007/BF00224640, 1996.
Cescatti, A. and Piutti, E.: Silvicultural alternatives, competition regime and sensitivity to climate in a European beech forest, For. Ecol. Manage., 102, 213–223, https://doi.org/10.1016/S0378-1127(97)00163-1, 1998.
Chang, J., Ciais, P., Wang, X., Piao, S., Asrar, G., Betts, R., Chevallier, F., Dury, M., François, L., Frieler, K., and Steinkamp, J.: Benchmarking carbon fluxes of the ISIMIP2a biome models, Environ. Res. Lett., 12, 45002, https://doi.org/10.1088/1748-9326/aa63fa, 2017.
Chiti, T., Papale, D., Smith, P., Dalmonech, D., Matteucci, G., Yeluripati, J., Rodeghiero, M., and Valentini, R.: Predicting changes in soil organic carbon in mediterranean and alpine forests during the Kyoto Protocol commitment periods using the CENTURY model, Soil Use Manag., 26, 475–484, https://doi.org/10.1111/j.1475-2743.2010.00300.x, 2010.
Collalti, A., Marconi, S., Ibrom, A., Trotta, C., Anav, A., D'Andrea, E., Matteucci, G., Montagnani, L., Gielen, B., Mammarella, I., Grünwald, T., Knohl, A., Berninger, F., Zhao, Y., Valentini, R., and Santini, M.: Validation of 3D-CMCC Forest Ecosystem Model (v.5.1) against eddy covariance data for 10 European forest sites, Geosci. Model Dev., 9, 479–504, https://doi.org/10.5194/gmd-9-479-2016, 2016.
Collalti, A., Trotta, C., Keenan, T., Ibrom, A., Bond-Lamberty, B., Grote, R., Vicca, S., Reyer, C.P.O., Migliavacca, M., Veroustraete, F., Anav, A., Campioli, M., Scoccimarro, E., Šigut, L., Grieco, E., Cescatti, A., and Matteucci G.: Thinning can reduce losses in carbon use efficiency and carbon stocks in managed forests under warmer climate, J. Adv. Model. Earth Sy., 10, 2427–2452, https://doi.org/10.1029/2018MS001275, 2018.
Collalti, A., Thornton, P. E., Cescatti, A., Rita, A., Nolè, A., Borghetti, M., Trotta, C., Ciais, P., and Matteucci, G.: The sensitivity of the forest carbon budget shifts between different parameters and processes along stand development and climate change, Ecol. Appl., 29, 1–18, https://doi.org/10.1002/eap.1837, 2019.
Collier, N., Hoffman,F.M., Lawrence, D. M., Keppel-Aleks, G., Koven, C. D., Riley, W. J., Mu, M., and Randerson, J. T.: The International Land Model Benchmarking (ILAMB) system: Design, theory, and implementation, J. Adv. Model. Earth Sy., 10, 2731–2754, https://doi.org/10.1029/2018MS001354, 2018.
Cramer, W., Kicklighter, D. W., Bondeau, A., Iii, B. M., Churkina, G., Nemry, B., Ruimy, A., Schloss, A. L., and the participants of the Potsdam NPP Model Intercomparison: Comparing global models of terrestrial net primary productivity (NPP): overview and key results, Glob. Chang. Biol., 5, 1–15, https://doi.org/10.1046/j.1365-2486.1999.00009.x, 1999.
Cramer, W., Bondeau, A., Woodward, F. I., Prentice, I. C., Betts, R. A., Brovkin, V., Cox, P. M., Fisher, V., Foley, J. A., Friend, A. D., Kucharik, C., Lomas, M. R., Ramankutty, N., Sitch, S., Smith, B., White, A., and Young-Molling, C.: Global response of terrestrial ecosystem structure and function to CO2 and climate change: Results from six dynamic global vegetation models, Glob. Chang. Biol., 7, 357–373, https://doi.org/10.1046/j.1365-2486.2001.00383.x, 2001.
D'Andrea, E., Rezaie, N., Battistelli, A., Gravichkova, O., Kuhlmann, I., Matteucci, G., Moscatello, S., Proietti, S., Scartazza, A., Trumbore, S., and Muhr, J.: Winter's bite: Beech trees survive complete defoliation due to spring late frost damage by mobilizing old C reserves, New Phyt., 224, 625–631, 2019.
De Lary, R.: Massif des Landes de Gascogne, II – ETAT DES CONNAISSANCES Tech. Bordeaux: CRPF Aquitaine, 2015.
Didan, K., Munoz, A. B., Solano, R., and Huete, A.: MODIS Vegetation Index User's Guide (MOD13 Series), available at: https://vip.arizona.edu/documents/MODIS/MODIS_VI_UsersGuide_June_2015_C6.pdf (last access: 5 June 2020), 2015.
Dietze, M. C.: Prediction in ecology: a first-principles framework, Ecol. Appl., 27, 2048–2060, https://doi.org/10.1002/eap.1589, 2017.
Dietze, M. C., Lebauer, D. S., and Kooper, R.: On improving the communication between models and data, Plant, Cell Environ., 36, 1575–1585, https://doi.org/10.1111/pce.12043, 2013.
Dlugokencky, E. and Tans, P.: Trends in Atmospheric Carbon Dioxide, Natl. Ocean. Atmos. Adm. Earth Syst. Res. Lab., available at: https://www.esrl.noaa.gov/gmd/ccgg/trends/ (last access: 5 June 2020), 2014.
Duncker, P. S., Barreiro, S. M., Hengeveld, G. M., Lind, T., Mason, W. L., and Ambrozy, S.: Classification of Forest Management Approaches?: A New Conceptual Framework and Its Applicability to European Forestry, Ecol. Soc., 17, 51, https://doi.org/10.5751/ES-05262-170451, 2012.
Eastaugh, C., Pötzelsberger, E., and Hasenauer, H.: Assessing the impacts of climate change and nitrogen deposition on Norway spruce (Picea abies L. Karst) growth in Austria with BIOME-BGC, Tree Physiol., 31, 262–274, https://doi.org/10.1093/treephys/tpr033, 2011.
EMEP/CEIP: Present state Emissision data, available at: http://www.ceip.at/webdab_emepdatabase/reported_emissiondata/ (last access: 5 June 2020), 2014a.
EMEP/CEIP: Present state Emissision data, available at: http://www.ceip.at/status_reporting/2014_submissions/ (last access: 5 June 2020), 2014b.
Feoli, E. and Lagonegro, M.: Syntaxonomical analysis of beech woods in the Apennines (Italy) using the program package IAHOPA, Plant Ecol., 50, 129–173, 1982.
Fleck, S., Cools, N., De Vos, B., Meesenburg, H., and Fischer, R.: The Level II aggregated forest soil condition database links soil physicochemical and hydraulic properties with long-term observations of forest condition in Europe, Ann. For. Sci., 73, 945–957, https://doi.org/10.1007/s13595-016-0571-4, 2016.
FLUXNET 2015: FLUXNET2015 Release – Processing Pipeline document – Last revision 20170512, available at: http://fluxnet.fluxdata.org/data/fluxnet2015-dataset/data-processing/ (last access: 5 June 2020), 2017.
Fontes, L., Bontemps, J. D., Bugmann, H., Oijen, M. V., Gracia, C., Kramer, K., Lindner, M., Rötzer, T., and Skovsgaard, J. P.: Models for supporting forest management in a changing environment, For. Syst., 3, 8–29, https://doi.org/10.5424/fs/201019S-9315, 2010.
Frieler, K., Lange, S., Piontek, F., Reyer, C. P. O., Schewe, J., Warszawski, L., Zhao, F., Chini, L., Denvil, S., Emanuel, K., Geiger, T., Halladay, K., Hurtt, G., Mengel, M., Murakami, D., Ostberg, S., Popp, A., Riva, R., Stevanovic, M., Suzuki, T., Volkholz, J., Burke, E., Ciais, P., Ebi, K., Eddy, T. D., Elliott, J., Galbraith, E., Gosling, S. N., Hattermann, F., Hickler, T., Hinkel, J., Hof, C., Huber, V., Jägermeyr, J., Krysanova, V., Marcé, R., Müller Schmied, H., Mouratiadou, I., Pierson, D., Tittensor, D. P., Vautard, R., van Vliet, M., Biber, M. F., Betts, R. A., Bodirsky, B. L., Deryng, D., Frolking, S., Jones, C. D., Lotze, H. K., Lotze-Campen, H., Sahajpal, R., Thonicke, K., Tian, H., and Yamagata, Y.: Assessing the impacts of 1.5 ∘C global warming – simulation protocol of the Inter-Sectoral Impact Model Intercomparison Project (ISIMIP2b), Geosci. Model Dev., 10, 4321–4345, https://doi.org/10.5194/gmd-10-4321-2017, 2017.
Fürstenau, C., Badeck, F. W., Lasch, P., Lexer, M. J., Lindner, M., Mohr, P., and Suckow, F.: Multiple-use forest management in consideration of climate change and the interests of stakeholder groups, Eur. J. For. Res., 126, 225–239, https://doi.org/10.1007/s10342-006-0114-x, 2007.
Gerstengarbe, F., Hoffmann, P., Österle, H., and Werner, C.: Ensemble simulations for the RCP8.5-Scenario, Meteorol. Z., 24, 147–156, https://doi.org/10.1127/metz/2014/0523, 2015.
González, J. R., Pukkala, T., and Palahí, M.: Optimising the management of Pinus sylvestris L. stand under risk of fire in Catalonia (north-east of Spain), Ann. For. Sci. Springer Verlag/EDP Sci., 62, 493–501, 2005.
Grimm, V. and Railsback, S. F.: Pattern-oriented modelling: a “multi-scope” for predictive systems ecology, Philos. T. Roy. Soc. B, 367, 298–310, https://doi.org/10.1098/rstb.2011.0180, 2012.
Gutsch, M., Lasch, P., Suckow, F., and Reyer, C.: Management of mixed oak-pine forests under climate scenario uncertainty, For. Syst., 20, 453–463, https://doi.org/10.5424/fs/20112003-11073, 2011.
Haataja, J. and Vesala, T.: SMEAR II. Station for Measuring Forest Ecosystem–Atmosphere Relation, Univ. Helsinki Dep. For. Ecol. Publ., Vol. 17, 1997.
Hanewinkel, M. and Pretzsch, H.: Modelling the conversion from even-aged to uneven-aged stands of Norway spruce (Picea abies L. Karst.) with a distance-dependent growth simulator, For. Ecol. Manage., 134, 55–70, https://doi.org/10.1016/S0378-1127(99)00245-5, 2000.
Hartig, F., Dyke, J., Hickler, T., Higgins, S. I., O'Hara, R. B., Scheiter, S., and Huth, A.: Connecting dynamic vegetation models to data – an inverse perspective, J. Biogeogr., 39, 2240–2252, https://doi.org/10.1111/j.1365-2699.2012.02745.x, 2012.
Hein, S. and Dhôte, J.-F.: Effect of species composition, stand density and site index on the basal area increment of oak trees (Quercus sp.) in mixed stands with beech (Fagus sylvatica L.) in northern France, Ann. For. Sci., 63, 457–467, https://doi.org/10.1051/forest:2006026, 2006.
Hempel, S., Frieler, K., Warszawski, L., Schewe, J., and Piontek, F.: A trend-preserving bias correction – the ISI-MIP approach, Earth Syst. Dynam., 4, 219–236, https://doi.org/10.5194/esd-4-219-2013, 2013.
Huntzinger, D. N., Schwalm, C., Michalak, A. M., Schaefer, K., King, A. W., Wei, Y., Jacobson, A., Liu, S., Cook, R. B., Post, W. M., Berthier, G., Hayes, D., Huang, M., Ito, A., Lei, H., Lu, C., Mao, J., Peng, C. H., Peng, S., Poulter, B., Riccuito, D., Shi, X., Tian, H., Wang, W., Zeng, N., Zhao, F., and Zhu, Q.: The North American Carbon Program Multi-Scale Synthesis and Terrestrial Model Intercomparison Project – Part 1: Overview and experimental design, Geosci. Model Dev., 6, 2121–2133, https://doi.org/10.5194/gmd-6-2121-2013, 2013.
Ilvesniemi, H., Levula, J., Ojansuu, R., Kolari, P., Kulmala, L., Pumpanen, J., Launiainen, S., Vesala, T., and Nikinmaa, E.: Long-term measurements of the carbon balance of a boreal Scots pine dominated forest ecosystem, Boreal Environ. Res., 14, 731–753, 2009.
Ilvesniemi, H., Pumpanen, J., and Duursma, R.: Water balance of a boreal Scots pine forest, Boreal Environ. Res., 15, 375–396, 2010.
ISSS-ISRIC-FAO: World Reference Base For Soil Resources World Soil Resource Reports 84, FAO, Rome, 1998.
Ito, A., Nishina, K., Reyer, C., François, L., Henrot, A.-J., Munhoven, G., Jacquemin, I., Tian, H., Yang, J., Pan, S., Morfopoulos, C., Betts, R., Hickler, T., Steinkamp, J., Ostberg, S., Schaphoff, S., Ciais, P., Chang, J., Rafique, R., and Zhao, F.: Photosynthetic productivity and its efficiencies in ISIMIP2a biome models: Benchmarking for impact assessment studies, Environ. Res. Lett., 12, 85001, https://doi.org/10.1088/1748-9326/aa7a19, 2017.
Kelley, D. I., Prentice, I. C., Harrison, S. P., Wang, H., Simard, M., Fisher, J. B., and Willis, K. O.: A comprehensive benchmarking system for evaluating global vegetation models, Biogeosciences, 10, 3313–3340, https://doi.org/10.5194/bg-10-3313-2013, 2013.
Kerr, G.: The effect of heavy or “free growth” thinning on oak (Quercus petraea and Q-robur), Forestry, 69, 303–317, https://doi.org/10.1093/forestry/69.4.303, 1996.
Khanna, S., Palacios-Orueta, A., Whiting, M., Ustin, S., Riaño, D., and Litago, J.: Development of Angle Indexes for Soil Moisture Estimation, Dry Matter Detection and Land-cover Discrimination, Remote Sens. Environ., 109, 154–165, https://doi.org/10.1016/j.rse.2006.12.018, 2007.
Kratochvilova, I., Janous, D., Marek, M., Bartak, M., and Riha, L.: Production activity of mountain cultivated Norway spruce stands under the impact of air pollution. I. General description of problems, Ekológia (CSSR), 8, 407–419, 1989.
Ladekarl, U. L.: Soil moisture, evapotranspiration and groundwater recharge in forest and heathland, University of Aarhus, Denmark, 2001.
Lähde, E., Laiho, O., and Lin, C. J.: Silvicultural alternatives in an uneven-sized forest dominated by Picea abies, J. For. Res., 15, 14–20, https://doi.org/10.1007/s10310-009-0154-4, 2010.
Lamarque, J.-F., Dentener, F., McConnell, J., Ro, C.-U., Shaw, M., Vet, R., Bergmann, D., Cameron-Smith, P., Dalsoren, S., Doherty, R., Faluvegi, G., Ghan, S. J., Josse, B., Lee, Y. H., MacKenzie, I. A., Plummer, D., Shindell, D. T., Skeie, R. B., Stevenson, D. S., Strode, S., Zeng, G., Curran, M., Dahl-Jensen, D., Das, S., Fritzsche, D., and Nolan, M.: Multi-model mean nitrogen and sulfur deposition from the Atmospheric Chemistry and Climate Model Intercomparison Project (ACCMIP): evaluation of historical and projected future changes, Atmos. Chem. Phys., 13, 7997–8018, https://doi.org/10.5194/acp-13-7997-2013, 2013a.
Lamarque, J.-F., Shindell, D. T., Josse, B., Young, P. J., Cionni, I., Eyring, V., Bergmann, D., Cameron-Smith, P., Collins, W. J., Doherty, R., Dalsoren, S., Faluvegi, G., Folberth, G., Ghan, S. J., Horowitz, L. W., Lee, Y. H., MacKenzie, I. A., Nagashima, T., Naik, V., Plummer, D., Righi, M., Rumbold, S. T., Schulz, M., Skeie, R. B., Stevenson, D. S., Strode, S., Sudo, K., Szopa, S., Voulgarakis, A., and Zeng, G.: The Atmospheric Chemistry and Climate Model Intercomparison Project (ACCMIP): overview and description of models, simulations and climate diagnostics, Geosci. Model Dev., 6, 179–206, https://doi.org/10.5194/gmd-6-179-2013, 2013b.
Lange, S.: Bias correction of surface downwelling longwave and shortwave radiation for the EWEMBI dataset, Earth Syst. Dynam., 9, 627–645, https://doi.org/10.5194/esd-9-627-2018, 2018.
Lasch, P., Badeck, F. W., Suckow, F., Lindner, M., and Mohr, P.: Model-based analysis of management alternatives at stand and regional level in Brandenburg (Germany), For. Ecol. Manage., 207, 59–74, https://doi.org/10.1016/j.foreco.2004.10.034, 2005.
Lasslop, G., Reichstein, M., Papale, D., Richardson, A., Arneth, A., Barr, A., Stoy, P., and Wohlfahrt, G.: Separation of net ecosystem exchange into assimilation and respiration using a light response curve approach: critical issues and global evaluation, Glob. Change Biol., 16, 187–208, https://doi.org/10.1111/j.1365-2486.2009.02041.x, 2010.
Lasslop, G., Migliavacca, M., Bohrer, G., Reichstein, M., Bahn, M., Ibrom, A., Jacobs, C., Kolari, P., Papale, D., Vesala, T., Wohlfahrt, G., and Cescatti, A.: On the choice of the driving temperature for eddy-covariance carbon dioxide flux partitioning, Biogeosciences, 9, 5243–5259, https://doi.org/10.5194/bg-9-5243-2012, 2012.
Le Mellec, A., Meesenburg, H., and Michalzik, B.: The importance of canopy-derived dissolved and particulate organic matter (DOM and POM) – comparing throughfall solution from broadleaved and coniferous forests, Ann. For. Sci., 67, 411, https://doi.org/10.1051/forest/2009130, 2010.
Lindner, M., Fitzgerald, J. B., Zimmermann, N. E., Reyer, C., Delzon, S., van der Maaten, E., Schelhaas, M. J., Lasch, P., Eggers, J., van der Maaten-Theunissen, M., Suckow, F., Psomas, A., Poulter, B., and Hanewinkel, M.: Climate change and European forests: What do we know, what are the uncertainties, and what are the implications for forest management?, J. Environ. Manage., 146, 69–83, https://doi.org/10.1016/j.jenvman.2014.07.030, 2014.
Loustau, D., Bosc, A., Colin, A., Ogée, J., Davi, H., François, C., Dufrêne, E., Déqué, M., Cloppet, E., Arrouays, D., Le Bas, C., Saby, N., Pignard, G., Hamza, N., Granier, A., Bréda, N., Ciais, P., Viovy, N., Delage, F., and Bas, C. L. E.: Modeling climate change effects on the potential production of French plains forests at the sub-regional level., Tree Physiol., 25, 813–23, https://doi.org/10.1093/treephys/25.7.813, 2005.
Mammarella, I., Launiainen, S., Gronholm, T., Keronen, P., Pumpanen, J., Rannik, Ü., and Vesala, T.: Relative humidity effect on the high-frequency attenuation of water vapor flux measured by a closed-path eddy covariance system, J. Atmos. Ocean. Tech., 26, 1856–1866, https://doi.org/10.1175/2009JTECHA1179.1, 2009.
Marchetto, A., Rogora, M., Waldner, P., Thimonier, A., Hansen, K., Karlsson, G. P., Simpson,D., Fagerli, H., Sanders, T. G. M., Schmitz, A., and de Vries, W.: How close are model estimates and field measurements of sulphur and nitrogen deposition to the European forests?, in preparation, 2020.
Matyssek, R., Schnyder, H., Oßwald, W., Ernst, D., Munch, J., and Pretzsch, H.: Growth and Defence in Plants Resource Allocation at Multiple Scales, Ecological, Springer, https://doi.org/10.1007/978-3-642-30645-7, 2012.
Meesenburg, H., Brumme, R., Jacobsen, C., Meiwes, K. J., and Eichhorn, J.: Soil properties, in: Functioning and Management of European Beech Ecosystems, edited by: Brumme, R. and Khanna, P. K., Ecol. Studies, Springer, Berlin, Germany, 208, 49–63, 2009.
Meesenburg, H., Ahrends, B., Fleck, S., Wagner, M., Fortmann, H., Scheler, B., Klinck, U., Dammann, I., Eichhorn, J., Mindrup, M., and Meiwes, K. J.: Long-term changes of ecosystem services at Solling, Germany: Recovery from acidification, but increasing nitrogen saturation?, Ecol. Indic., 65, 103–112, https://doi.org/10.1016/j.ecolind.2015.12.013, 2016.
Meinshausen, M., Smith, S. J., Calvin, K., Daniel, J. S., Kainuma, M. L. T., Lamarque, J.-F., Matsumoto, K., Montzka, S. A., Raper, S. C. B., Riahi, K., Thomson, A., Velders, G. J. M., and van Vuuren, D. P. P.: The RCP greenhouse gas concentrations and their extensions from 1765 to 2300, Clim. Change, 109, 213, https://doi.org/10.1007/s10584-011-0156-z, 2011.
Meiwes, K. J., Meesenburg, H., Eichhorn, J., Jacobsen, C., and Khanna, P. K.: Changes in C and N contents of soil under beech forests over a period of 35 years, Functioning and Management of European Beech Ecosystems, edited by: Brumme, R. and Khanna, P. K., Ecol. Studies, Springer, Berlin, Germany, 208, 49–63, 2009.
Meteorological Yearbook 2012: experimentální ekologické pracoviště Bílý Kříž (Moravskoslezské Beskydy), Ekosystémová stanice Štítná nad Vláří (Bíle Karpaty), Ekosystémová stanice Rájec (Drahanská vrchovina), Brno: Centrum výzkumu globální změny AV ČR, 2015.
Monteith, J. L.: Solar Radiation and Productivity in Tropical Ecosystems, J. Appl. Ecol., 9, 747–766, https://doi.org/10.2307/2401901, 1972.
Morales, P., Sykes, M. T., Prentice, I. C., Smith, P., Smith, B., Bugmann, H., Zierl, B., Friedlingstein, P., Viovy, N., Sabaté, S., Sánchez, A., Pla, E., Gracia, C. A., Sitch, S., Arneth, A., and Ogee, J.: Comparing and evaluating process-based ecosystem model predictions of carbon and water fluxes in major European forest biomes, Glob. Chang. Biol., 11, 2211–2233, https://doi.org/10.1111/j.1365-2486.2005.01036.x, 2005.
Mund, M.: Carbon pools of European beech forests (Fagus sylvatica) under different silvicultural management, Georg-August-Universität Göttingen, 2004.
Myneni, R.: MODIS Collection 6 (C6) LAI/FPAR Product User's Guide, available at: https://lpdaac.usgs.gov/documents/2/mod15_user_guide.pdf (last access: 5 June 2020), 2015.
Noack, M.: Forstliche Langfristforschung für den Zukunftswald – welche Entwicklung vollzogen WIEDEMANN's schlechteste Kiefernbestände Ostdeutschlands, 2011.
Noack, M.: Der langfristige Durchforstungsversuch “PEITZ 150”: Forschungsbeitrag zum Wachstum der Gemeinen Kiefer auf nährkraftschwachen Böden im Land Brandenburg unter dem Einfluss von Standortswandel und Durchforstung, Eberswalder Forstl. Schriftenr., 49, 56–72, 2012.
ORNL DAAC: MODIS Collection 5 Land Products Global Subsetting and Visualization Tool, ORNL DAAC, Oak Ridge, Tennessee, USA, Subset obtained for MOD09A1 product at various sites in Spatial Range: N = 70.00N, S = 35.00N, E = 50.00E, W = 10.00W, time period: 2000-02-18 to 2015-12-27, and subset size: 0.5 × 0.5 km, https://doi.org/10.3334/ORNLDAAC/1241, 2008a.
ORNL DAAC: MODIS Collection 5 Land Products Global Subsetting and Visualization Tool, ORNL DAAC, Oak Ridge, Tennessee, USA, Subset obtained for MOD11A2 product at various sites in Spatial Range: N = 70.00N, S = 35.00N, E = 50.00E, W = 10.00W, time period: 2000-03-05 to 2015-12-27, and subset size: 1 × 1 km, https://doi.org/10.3334/ORNLDAAC/1241, 2008b.
ORNL DAAC: MODIS Collection 5 Land Products Global Subsetting and Visualization Tool, ORNL DAAC, Oak Ridge, Tennessee, USA, Subset obtained for MOD13Q1 product at various sites in Spatial Range: N = 70.00N, S = 35.00N, E = 50.00E, W = 10.00W, time period: 2000-02-18 to 2015-12-19, and subset size: 0.25 × 0.25 km, https://doi.org/10.3334/ORNLDAAC/1241, 2008c.
ORNL DAAC: MODIS Collection 5 Land Products Global Subsetting and Visualization Tool, ORNL DAAC, Oak Ridge, Tennessee, USA, Subset obtained for MOD15A2 product at various sites in Spatial Range: N = 70.00N, S = 35.00N, E = 50.00E, W = 10.00W, time period: 2000-02-18 to 2015-12-27, and subset size: 1 × 1 km, https://doi.org/10.3334/ORNLDAAC/1241, 2008d.
ORNL DAAC: MODIS Collection 5 Land Products Global Subsetting and Visualization Tool, ORNL DAAC, Oak Ridge, Tennessee, USA, Subset obtained for MOD17A2 product at various sites in Spatial Range: N = 70.00N, S = 35.00N, E = 50.00E, W = 10.00W, time period: 2000-01-01 to 2014-12-27, and subset size: 1 × 1 km, https://doi.org/10.3334/ORNLDAAC/1241, 2008e.
Palacios-Orueta, A., Khanna, S., Litago, J., Whiting, M., and Ustin, S.: Assessment of NDVI and NDWI spectral indices using MODIS time series analysis and development of a new spectral index based on MODIS shortwave infrared bands, in: 1st International Conference on Remote sensing and geoinformation processing in the assessment and monitoring of land degradation and desertification, Trier, 7–9 September, 2005.
Palacios-Orueta, A., Huesca, M., Whiting, M., Litago, J., Khanna, S., Garcia, M., and Ustin, S.: Derivation of phenological metrics by function fitting to time-series of Spectral Shape Indexes AS1 and AS2: Mapping cotton phenological stages using MODIS time series, Remote Sens. Environ., 126, 148–159, https://doi.org/10.1016/j.rse.2012.08.002, 2012.
Panferov, O., Kreilein, H., Meesenburg, H., Eichhorn, J., and Gravenhorst, G.: Climatic condition at the three beech forest sites in Central Germany, in: Functioning and Management of European Beech Ecosystems, edited by: Brumme, R. and Khanna, P. K., Ecol. Studies, 208, 13–32, https://doi.org/10.1007/b82392_3, 2009.
Papale, D., Reichstein, M., Aubinet, M., Canfora, E., Bernhofer, C., Kutsch, W., Longdoz, B., Rambal, S., Valentini, R., Vesala, T., and Yakir, D.: Towards a standardized processing of Net Ecosystem Exchange measured with eddy covariance technique: algorithms and uncertainty estimation, Biogeosciences, 3, 571–583, https://doi.org/10.5194/bg-3-571-2006, 2006.
Pape, R.: Influence of Thinning and Tree Diameter Class on the Development of Basic Density and Annual Ring Width in Picea abies, Scand. J. For. Res., 14, 27–37, https://doi.org/10.1080/02827589950152269, 1999.
Pilegaard, K., Mikkelsen, T. N., Beier, C., Jensen, N. O., Ambus, P., and Ro-Poulsen, H.: Field measurements of atmosphere – biosphere interactions in a Danish beech forest, Boreal Environ. Res., 8, 315–333 available at: http://www.borenv.net/BER/pdfs/ber8/ber8-315.pdf (last access: 5 June 2020), 2003.
Pilegaard, K., Ibrom, A., Courtney, M. S., Hummelshøj, P., and Jensen, N. O.: Increasing net CO2 uptake by a Danish beech forest during the period from 1996 to 2009, Agr. For. Meteorol., 151, 934–946, https://doi.org/10.1016/j.agrformet.2011.02.013, 2011.
Porté, A. and Loustau, D.: Variability of the photosynthetic characteristics of mature needles within the crown of a 25-year-old Pinus pinaster, Tree Physiol., 18, 223–232, https://doi.org/10.1093/treephys/18.4.223, 1998.
Pretzsch, H., Kahn, M., and Grote, R.: The mixed spruce-beech forest stands of the “Sonderforschungsbereich” “Growth or Parasite Defence?” in the forest district Kranzberger Forst, Forstwissenschaftliches Cent. Ver. Tharandter Forstl. Jahrb., 117, 241–257, https://doi.org/10.1007/bf02832979, 1998.
Pretzsch, H., Rötzer, T., Matyssek, R., Grams, T. E. E., Häberle, K. H., Pritsch, K., Kerner, R., and Munch, J. C.: Mixed Norway spruce (Picea abies [L.] Karst) and European beech (Fagus sylvatica [L.]) stands under drought: from reaction pattern to mechanism, Trees – Struct. Funct., 28, 1305–1321, https://doi.org/10.1007/s00468-014-1035-9, 2014.
Pretzsch, H., Forrester, D., and Rötzer, T.: Representation of species mixing in forest growth models, A review and perspective, Ecol. Modelling, 313, 276–292, https://doi.org/10.1016/j.ecolmodel.2015.06.044, 2015.
Pukkala, T., Miina, J., Kurttila, M., and Kolstrom, T.: A spatial yield model for optimizing the thinning regime of mixed stands of Pinus sylvestris and Picea abies, Scand. J. For. Res., 13, 31–42, https://doi.org/10.1080/02827589809382959, 1998.
R Core Team: R: A language and environment for statistical computing. R Foundation for Statistical Computing, Vienna, Austria, available at: https://www.R-project.org/ (last access: 5 June 2020), 2016.
Rannik, Ü., Keronen, P., Hari, P., and Vesala, T.: Estimation of forest-atmosphere CO2 exchange by eddy covariance and profile techniques, Agr. For. Meteorol., 126, 141–155, https://doi.org/10.1016/j.agrformet.2004.06.010, 2004.
Reichstein, M., Falge, E., Baldocchi, D., Papale, D., Aubinet, M., Berbigier, P., Bernhofer, C., Buchmann, N., Gilmanov, T., Granier, A., Grünwald, T., Havránková, K., Ilvesniemi, H., Janous, D., Knohl, A., Laurila, T., Lohila, A., Loustau, D., Matteucci, G., and Valentini, R.: On the Separation of Net Ecosystem Exchange into Assimilation and Ecosystem Respiration: Review and Improved Algorithm, Glob. Chang. Biol., 11, 1424–1439, https://doi.org/10.1111/j.1365-2486.2005.001002.x, 2005.
Reyer, C. P. O., Silveyra Gonzalez, R., Dolos, K., Hartig, F., Hauf, Y., Noack, M., Lasch-Born, P., Rötzer, T., Pretzsch, H., Meesenburg, H., Fleck, S., Wagner, M., Bolte, A., Sanders, T., Kolari, P., Mäkelä, A., Vesala, T., Mammarella, I., Pumpanen, J., Matteucci, G., Collalti, A., D'Andrea, E., Foltýnová, L., Krejza, J., Ibrom, A., Pilegaard, K., Loustau, D., Bonnefond, J.-M., Berbigier, P., Picart, D., Lafont, S., Dietze, M., Cameron, D., Vieno, M., Tian, H., Palacios, A., Cicuendez, V., Recuero, L., Wieze, K., Büchner, M., Lange, S., Volkholz, J., Kim, H., Weedon, G. P., Sheffield, J., Vega del Valle, I., Suckow, F., Horemans, J., Martel, S., Bohn, F., Steinkamp, J., Chikalanov A., and Frieler, K.: The PROFOUND database for evaluating vegetation models and simulating climate impacts on forests, V.0.1.12, GFZ Data Services, https://doi.org/10.5880/PIK.2019.008, 2019.
Reyer, C. P. O., Silveyra Gonzalez, R., Dolos, K., Hartig, F., Hauf, Y., Noack, M., Lasch-Born, P., Rötzer, T., Pretzsch, H., Meesenburg, H., Fleck, S., Wagner, M., Bolte, A., Sanders, T., Kolari, P., Mäkelä, A., Vesala, T., Mammarella, I., Pumpanen, J., Matteucci, G., Collalti, A., D'Andrea, E., Foltýnová, L., Krejza, J., Ibrom, A., Pilegaard, K., Loustau, D., Bonnefond, J.-M., Berbigier, P., Picart, D., Lafont, S., Dietze, M., Cameron, D., Vieno, M., Tian, H., Palacios, A., Cicuendez, V., Recuero, L., Wieze, K., Büchner, M., Lange, S., Volkholz, J., Kim, H., Weedon, G. P., Sheffield, J., Babst F., Vega del Valle, I., Suckow, F., Horemans, J., Martel, S., Bohn, F., Steinkamp, J., Chikalanov A., Mahnken M., Gutsch M., and Frieler, K.: The PROFOUND database for evaluating vegetation models and simulating climate impacts on forests, V.0.3.0, GFZ Data Services, https://doi.org/10.5880/PIK.2020.006/, 2020.
Reyer, C.: Forest Productivity under Environmental Change – a Review of Stand-Scale Modeling Studies, Curr. For. Reports, 53–68, https://doi.org/10.1007/s40725-015-0009-5, 2015.
Riek, W. and Stähr, F.: Eigenschaften typischer Waldböden im Nordostdeutschen Tiefland unter besonderer Berücksichtigung des Landes Brandenburg: Hinweise für die Waldbewirtschaftung, Eberswalder Forstl. Schriftenr., 19, 180 pp., 2004.
Rötzer, T. and Goergen, K.: Modelling the impact of climate change on the productivity and water-use efficiency of a central European beech forest, Clim. Res., 58, 81–95, https://doi.org/10.3354/cr01179, 2013.
Running, S. W. and Zhao, M.: Daily GPP and Annual NPP (MOD17A2/A3) products NASA Earth Observing System MODIS Land Algorithm – User's guide V3, available at: https://www.ntsg.umt.edu/files/modis/MOD17UsersGuide2015_v3.pdf (last access: 5 June 2020), 2015.
Santhana-Vannan, S.-K., Cook, B., Pan, J. Y., and Wilson, B. E.: A SOAP Web Service for accessing MODIS land product subsets, Earth Sci. Informatics, 4, 97–106, https://doi.org/10.1007/s12145-011-0079-2, 2011.
Schellnhuber, H.: “Earth system” analysis and the second Copernican revolution, Nature, 402, C19–C23, https://doi.org/10.1038/35011515, 1999.
Schütz, J.-P.: Modelling the demographic sustainability of pure beech plenter forests in Eastern Germany, Ann. For. Sci., 63, 93–100, https://doi.org/10.1051/forest:2005101, 2006.
Sheffield, J., Goteti, G., and Wood, E. F.: Development of a 50-year high-resolution global dataset of meteorological forcings for land surface modeling, J. Clim., 19, 3088–3111, https://doi.org/10.1175/JCLI3790.1, 2006.
Silveyra Gonzalez, R., Reyer, C. P. O., Bohn, F., Mahnken, M., Hartig, F.: ProfoundData: Downloading and Exploring Data from the PROFOUND Database, available at: https://CRAN.R-project.org/package=ProfoundData, last access: 5 June 2020.
Simpson, D., Benedictow, A., Berge, H., Bergström, R., Emberson, L. D., Fagerli, H., Flechard, C. R., Hayman, G. D., Gauss, M., Jonson, J. E., Jenkin, M. E., Nyíri, A., Richter, C., Semeena, V. S., Tsyro, S., Tuovinen, J.-P., Valdebenito, Á., and Wind, P.: The EMEP MSC-W chemical transport model – technical description, Atmos. Chem. Phys., 12, 7825–7865, https://doi.org/10.5194/acp-12-7825-2012, 2012.
Sitch, S., Friedlingstein, P., Gruber, N., Jones, S. D., Murray-Tortarolo, G., Ahlström, A., Doney, S. C., Graven, H., Heinze, C., Huntingford, C., Levis, S., Levy, P. E., Lomas, M., Poulter, B., Viovy, N., Zaehle, S., Zeng, N., Arneth, A., Bonan, G., Bopp, L., Canadell, J. G., Chevallier, F., Ciais, P., Ellis, R., Gloor, M., Peylin, P., Piao, S. L., Le Quéré, C., Smith, B., Zhu, Z., and Myneni, R.: Recent trends and drivers of regional sources and sinks of carbon dioxide, Biogeosciences, 12, 653–679, https://doi.org/10.5194/bg-12-653-2015, 2015.
Štefančík, I.: Growth characteristics of oak (Quercus petraea [Mattusch.] liebl.) stand under diferent thinning regimes, J. For. Sci., 58, 67–78, 2012.
Sterba, H.: Estimating Potential Density from Thinning Experiments and Inventory Data, For. Sci., 33, 1022–1034, 1987.
Tiktak, A. and Grinsven, H.: Review of Sixteen Forest-Soil-Atmosphere Models, Ecol. Model., 83, 35–53, https://doi.org/10.1016/0304-3800(95)00081-6, 1995.
Ulrich, B.: Nutrient and acid-base budget of central European forest ecosystems, in: Effects of Acid Rain on Forest Processes, edited by: Godbold, D. L. and Hüttermann, A., Wiley-Liss New York, USA, 1–50, 1994.
Vermote, E. F., Roger, J. C., and Ray, J. P.: MODIS Surface Reflectance User's Guide, Collection 6, available at: http://modis-sr.ltdri.org/guide/MOD09_UserGuide_v1.4.pdf (last access: 5 June 2020), 2015.
Vesala, T., Suni, T., Rannik, Ü., Keronen, P., Markkanen, T., Sevanto., S., Grönholm, T., Smolander, S., Kulmala, M., Ilvesniemi, H., Ojansuu, R., Uotila, A., Levula, J., Mäkelä, A., Pumpanen, J., Kolari, P., Kulmala, L., Altimir, N., Berninger, F., Nikinmaa, E., and Hari, P.: Effect of thinning on surface fluxes in a boreal forest, Global Biogeochem. Cy., 19, 1–11, https://doi.org/10.1029/2004GB002316, 2005.
Warszawski, L., Frieler, K., Huber, V., Piontek, F., Serdeczny, O., and Schewe, J.: The Inter-Sectoral Impact Model Intercomparison Project (ISI–MIP): Project framework, P. Natl. Acad. Sci. USA, 111, 3228–3232, https://doi.org/10.1073/pnas.1312330110, 2014.
Weedon, G. P., Gomes, S., Viterbo, P., Shuttleworth, W. J., Blyth, E., Österle, H., Adam, J. C., Bellouin, N., Boucher, O., and Best, M.: Creation of the WATCH Forcing Data and Its Use to Assess Global and Regional Reference Crop Evaporation over Land during the Twentieth Century, J. Hydrometeorol., 12, 823–848, https://doi.org/10.1175/2011JHM1369.1, 2011.
Weedon, G. P., Balsamo, G., Bellouin, N., Gomes, S., Best, M. J., and Viterbo, P.: The WFDEI meteorological forcing data set: WATCH Forcing Data methodology applied to ERA-Interim reanalysis data, Water Resour. Res., 50, 7505–7514, https://doi.org/10.1002/2014WR015638, 2014.
Wegehenkel, M., Wagner, A., Tiziana, A., Fleck, S., Meesenburg, H., and Raspe, S.: Impact of stoniness correction of soil hydraulic parameters on water balance simulations of forest plots, J. Plant Nutr. Soil Sci., 180, 71–86, https://doi.org/10.1002/jpln.201600244, 2016.
Wu, J., Larsen, K. S., van der Linden, L., Beier, C., Pilegaard, K., and Ibrom, A.: Synthesis on the carbon budget and cycling in a Danish, temperate deciduous forest, Agr. For. Meteorol., 181, 94–107, https://doi.org/10.1016/j.agrformet.2013.07.012, 2013.
Zhu, Z., Piao, S., Myneni, R. B., Huang, M., Zeng, Z., Canadell, J. G., Ciais, P., Sitch, S., Friedlingstein, P., Arneth, A., Cao, C., Cheng, L., Kato, E., Koven, C., Li, Y., Lian, X., Liu, Y., Liu, R., Mao, J., and Zeng, N.: Greening of the Earth and its drivers, Nat. Clim. Chang., 6, 791–795, https://doi.org/10.1038/nclimate3004, 2016.
- Abstract
- Introduction
- The PROFOUND Database
- Description of the forest sites
- Forest management of the sites
- The PROFOUND R package (ProfoundData)
- Data availability
- Conclusions
- Appendix A: List of FLUXNET sites
- Author contributions
- Competing interests
- Acknowledgements
- Financial support
- Review statement
- References
- Supplement


