the Creative Commons Attribution 4.0 License.
the Creative Commons Attribution 4.0 License.
 | 19 May 2020
A global compilation of in situ aquatic high spectral resolution inherent and apparent optical property data for remote sensing applications
Kimberly A. Casey
Cecile S. Rousseaux
Watson W. Gregg
Emmanuel Boss
Alison P. Chase
Susanne E. Craig
Colleen B. Mouw
Rick A. Reynolds
Dariusz Stramski
Steven G. Ackleson
Annick Bricaud
Blake Schaeffer
Marlon R. Lewis
Stéphane Maritorena
Light emerging from natural water bodies and measured by radiometers contains information about the local type and concentrations of phytoplankton, non-algal particles and colored dissolved organic matter in the underlying waters. An increase in spectral resolution in forthcoming satellite and airborne remote sensing missions is expected to lead to new or improved capabilities for characterizing aquatic ecosystems. Such upcoming missions include NASA's Plankton, Aerosol, Cloud, ocean Ecosystem (PACE) mission; the NASA Surface Biology and Geology designated observable mission; and NASA Airborne Visible/Infrared Imaging Spectrometer – Next Generation (AVIRIS-NG) airborne missions. In anticipation of these missions, we present an organized dataset of geographically diverse, quality-controlled, high spectral resolution inherent and apparent optical property (IOP–AOP) aquatic data. The data are intended to be of use to increase our understanding of aquatic optical properties, to develop aquatic remote sensing data product algorithms, and to perform calibration and validation activities for forthcoming aquatic-focused imaging spectrometry missions. The dataset is comprised of contributions from several investigators and investigating teams collected over a range of geographic areas and water types, including inland waters, estuaries, and oceans. Specific in situ measurements include remote-sensing reflectance, irradiance reflectance, and coefficients describing particulate absorption, particulate attenuation, non-algal particulate absorption, colored dissolved organic matter absorption, phytoplankton absorption, total absorption, total attenuation, particulate backscattering, and total backscattering. The dataset can be downloaded from https://doi.org/10.1594/PANGAEA.902230 (Casey et al., 2019).
- Article
(2866 KB) - Full-text XML
- BibTeX
- EndNote


Remote sensing of Earth's aquatic areas is a powerful means to understand water quality, aquatic, and ecological dynamics and the concentrations and types of phytoplankton, colored dissolved organic matter, and non-algal particles present over time. Aquatic remote sensing initially focused on chlorophyll a concentration ([Chl]) (NASA GSFC, Ocean Biology Processing Group, 2014), which serves as a proxy for understanding the distribution of phytoplankton biomass. The most widely used approach to estimate [Chl] has been empirical relationships between band ratios or band differences of remotely sensed reflectance and [Chl] (O'Reilly et al., 1998; Hu et al. 2012). Chlorophyll a concentration estimated from aquatic color has been studied for many decades and remote sensing retrievals are well validated (McClain, 2009). Chlorophyll algorithm improvements continue in response to enhanced spectral resolution and sensor capabilities of upcoming Earth Observation missions (O'Reilly and Werdell, 2019). Aquatic remote sensing is now being further used to aid the understanding of more complex dynamics including atmosphere–ocean heat exchange and the role and feedback effects of aquatic constituents, as well as alteration of phytoplankton community structure in a changing climate (Kim et al., 2018; Dutkiewicz et al., 2019; Del Castillo et al., 2019). These analysis approaches involve numerical modeling and analyzing radiometric variability of many spectral bands.
In situ data are a key requirement for aquatic remote sensing algorithm development, validation and calibration activities, and for advancing our aquatic remote sensing data capabilities. The in situ data provided in this paper include inherent optical properties (IOPs) and apparent optical properties (AOPs) from a wide distribution of aquatic environments and geographic locations. Briefly, inherent optical properties are the light absorption and scattering properties of natural waters, which are dependent solely on the concentrations and composition of water constituents irrespective of the illumination field within a water body. An apparent optical property is an optical property that can be used as a descriptor of a water body and is primarily dependent on the IOPs of the aquatic medium and, to a lesser degree, on the directional structure of the ambient radiance distribution within a water body. In this article, we provide data for the AOPs of irradiance reflectance (R) and radiance reflectance or remote-sensing reflectance (Rrs) just above the water surface and for the IOPs representing absorption and backscattering coefficients of natural waters. The spectral IOPs (where λ is light wavelength in a vacuum) can be partitioned into the absorption due to water (aw(λ), m−1), phytoplankton (aph(λ), m−1), non-algal particles (anap(λ), m−1), colored dissolved organic matter (acdom(λ), m−1), and backscattering due to water (bbw(λ), m−1) and particles (bbp(λ), m−1), where we note that bbw differs according to the salinity of the water.
With coincident high spectral resolution in situ IOP and AOP data, scientists can better develop and validate aquatic remote sensing algorithms to derive IOPs from measured AOPs (e.g., Werdell et al., 2018, and references therein). Torrecilla et al. (2011) demonstrated that hyperspectral data of phytoplankton absorption and remote-sensing reflectance provide improved discrimination of dominant phytoplankton groups in open-ocean environments compared with multispectral data. High spectral resolution aquatic remote sensing significantly improves retrievals of optical constituents in inland, coastal, and polar aquatic environments, where these environments exhibit significant smaller-scale temporal and spatial variability, increased decoupling between in-water constituents, and a greater dynamic range in parameter values compared to the open ocean (Mouw et al., 2015; Bell et al., 2015; Dierssen et al., 2015; Hu et al., 2015; Vandermeulen et al., 2017). In inland, coastal, and polar aquatic areas, dissolved organic matter (DOM) and non-algal particles (NAP) play a more important role in affecting the color of water, as well as its biogeochemistry, sediment transport, and primary productivity (Devred et al., 2013; Mouw et al., 2017). Thus, greater measurement precision is desirable. Carbon pools are also varied in inland and coastal environments due to riverine inputs, terrestrial influence, resuspension, and mixing requiring greater spectral resolution and broader spectral range to differentiate the spectral slope of CDOM sources. Further, there are increased instances of harmful algal bloom formation in many aquatic environments. Some harmful algal blooms can be discriminated based on their unique optical signatures, and therefore additional spectral bands beyond the current multispectral capabilities would be highly beneficial (Wang et al., 2016; Pahlevan et al., 2019). In the Arctic, Neukermans et al. (2016) demonstrated improved discrimination of planktonic communities by using hyperspectral instead of multispectral data. In short, remote sensing capabilities in all aquatic environments are expected to improve considerably in precision and accuracy with high radiometric quality and high spectral resolution measurements from forthcoming missions.
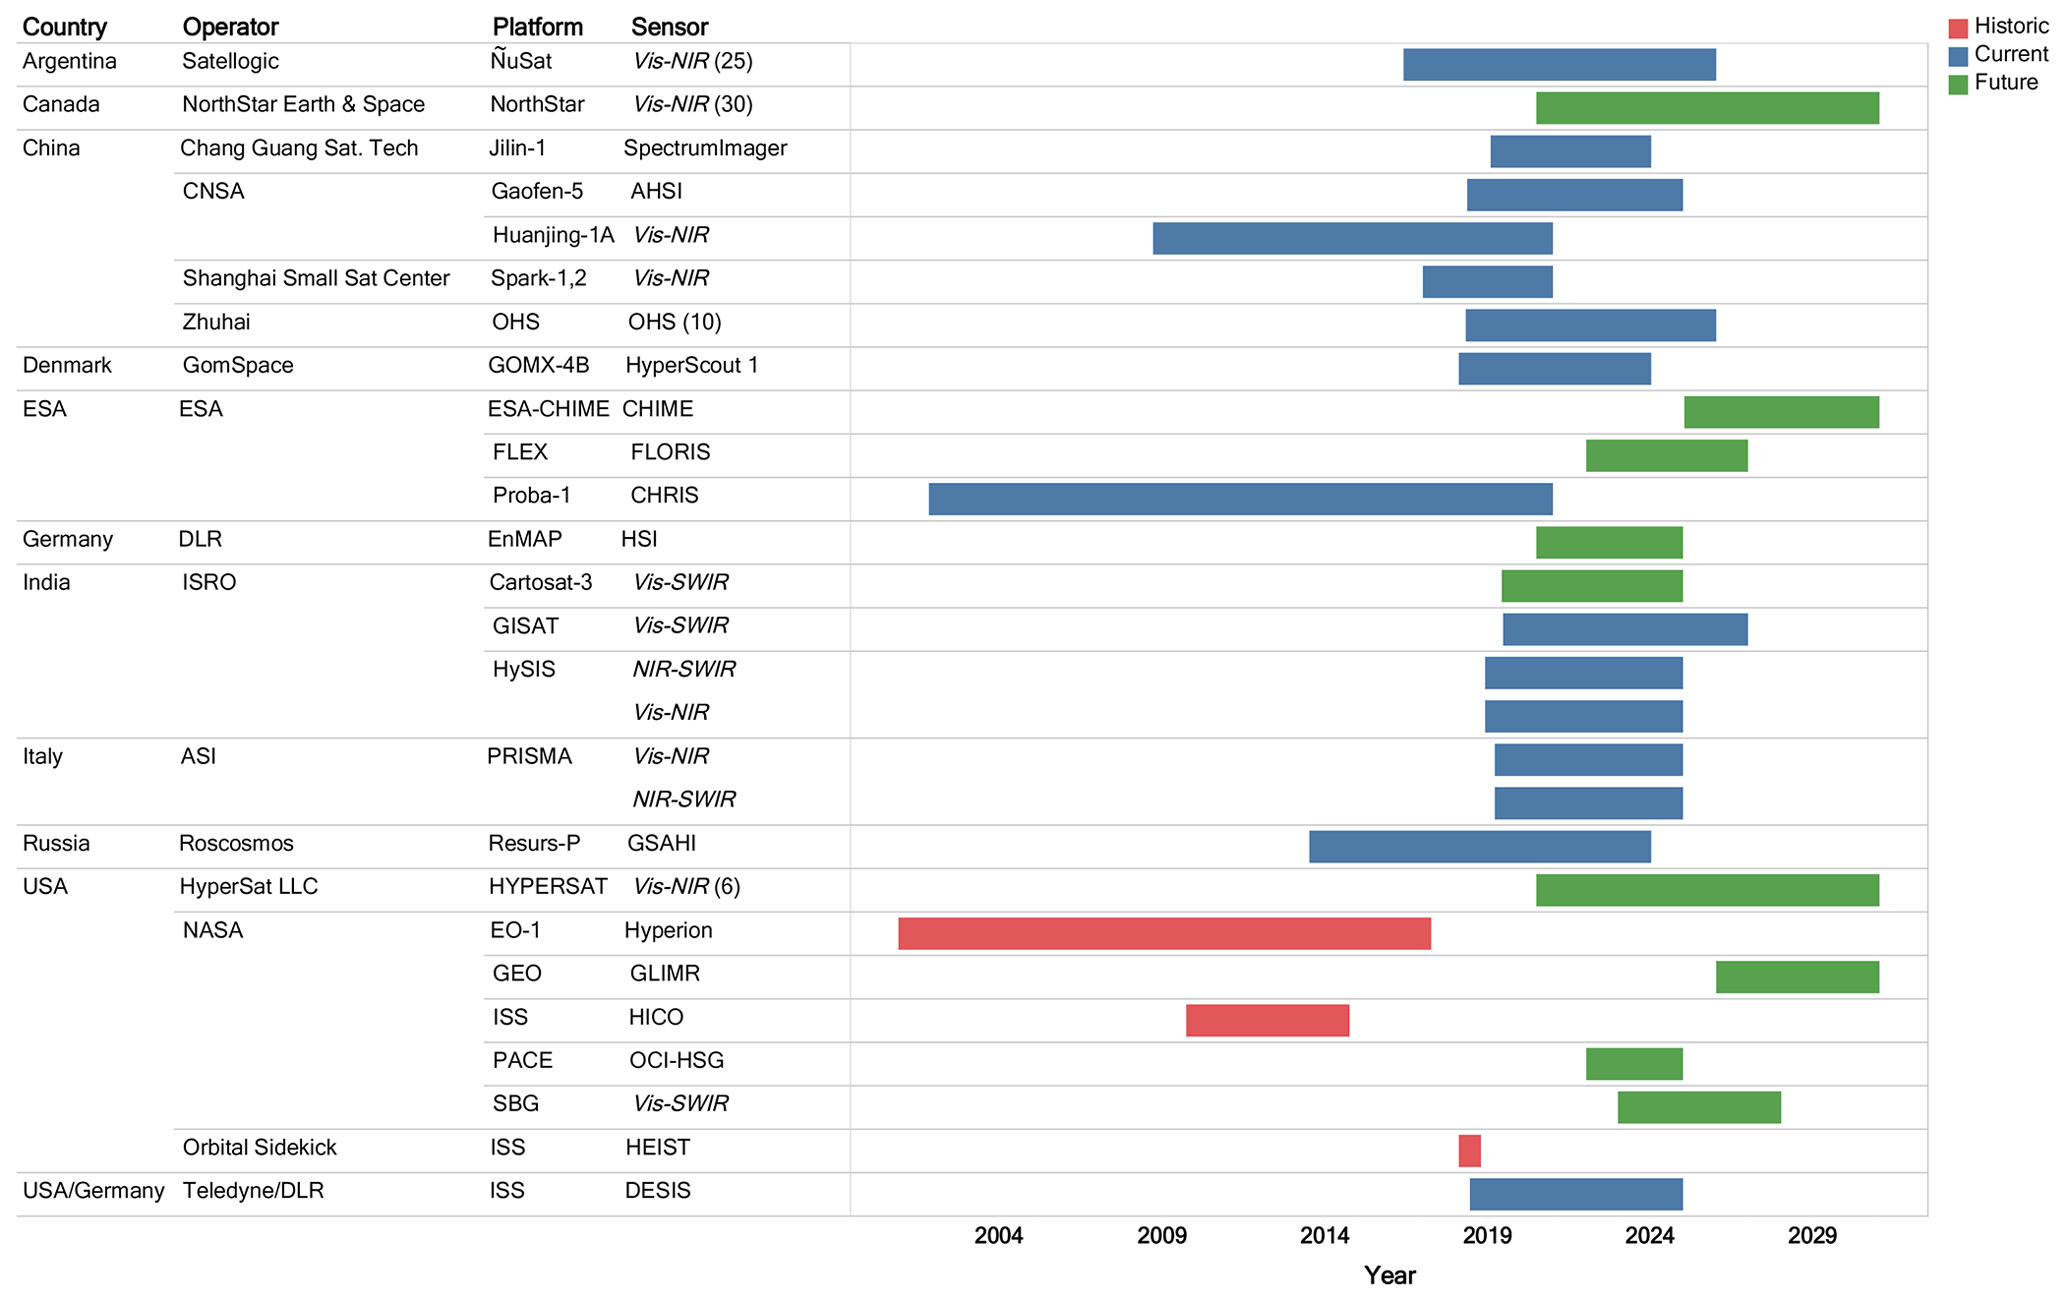
Figure 1The chart depicts the timeline of historic, existing, and planned high spectral resolution remote sensing missions by country or agency, operator, platform, and sensor name or type (general sensor type is conveyed in italics). Note that where there is a constellation or multiple sensors for the mission, the number of sensors is given in parentheses at the end of the sensor column.
We summarize several of the historic, current and forthcoming high spectral resolution missions of greatest applicability to aquatic remote sensing goals in Figs. 1 and 2. High spectral resolution technological demonstration satellite missions that have flown or are currently in operation or late planning stages are detailed as follows. One of the longest spaceborne hyperspectral data records is provided by NASA's EO-1 Hyperion sensor (220 spectral bands from 400 to 2500 nm), which was launched on 21 November 2000 and decommissioned on 22 February 2017. Another lengthy high spectral resolution temporal record (2001 to present; note that the satellite is operational at the time of publication in 2020) is provided by the European Space Agency's Compact High Resolution Imaging Spectrometer (CHRIS), which is able to acquire up to 63 spectral bands from 400 to 1050 nm. The Naval Research Laboratory had the first water-focused hyperspectral sensor, the Hyperspectral Imager for the Coastal Ocean (HICO) on the International Space Station (ISS), with more than 80 bands and providing 5 years of data (September 2009–September 2014) (Corson and Davis, 2011). The jointly operated Teledyne Brown Engineering (TBE) German Aerospace Center (DLR) Earth Sensing Imaging Spectrometer (DESIS), which contains 235 spectral bands from 400 to 1000 nm, was installed on the ISS in August 2018 and is expected to operate for several years (Krutz et al., 2019). The Italian Space Agency (ASI) launched the Hyperspectral Precursor of the Application Mission (PRISMA) mission in March 2019. Germany plans to launch the Environmental Mapping and Analysis Program (EnMAP) upon completion of Phase D, notionally in 2020. Ongoing airborne missions of high spectral resolution capabilities include instruments such as NASA's Airborne Visible-Infrared Imaging Spectrometer-Next Generation (AVIRIS-NG) and an airborne hyperspectral sensor (HyMap). Many other high spectral resolution satellite and airborne missions are in recent operation or development stages, and such details can be gleaned, for example, from the Committee on Earth Observation Satellites (CEOS) database (http://database.eohandbook.com, last access: 3 March 2020).
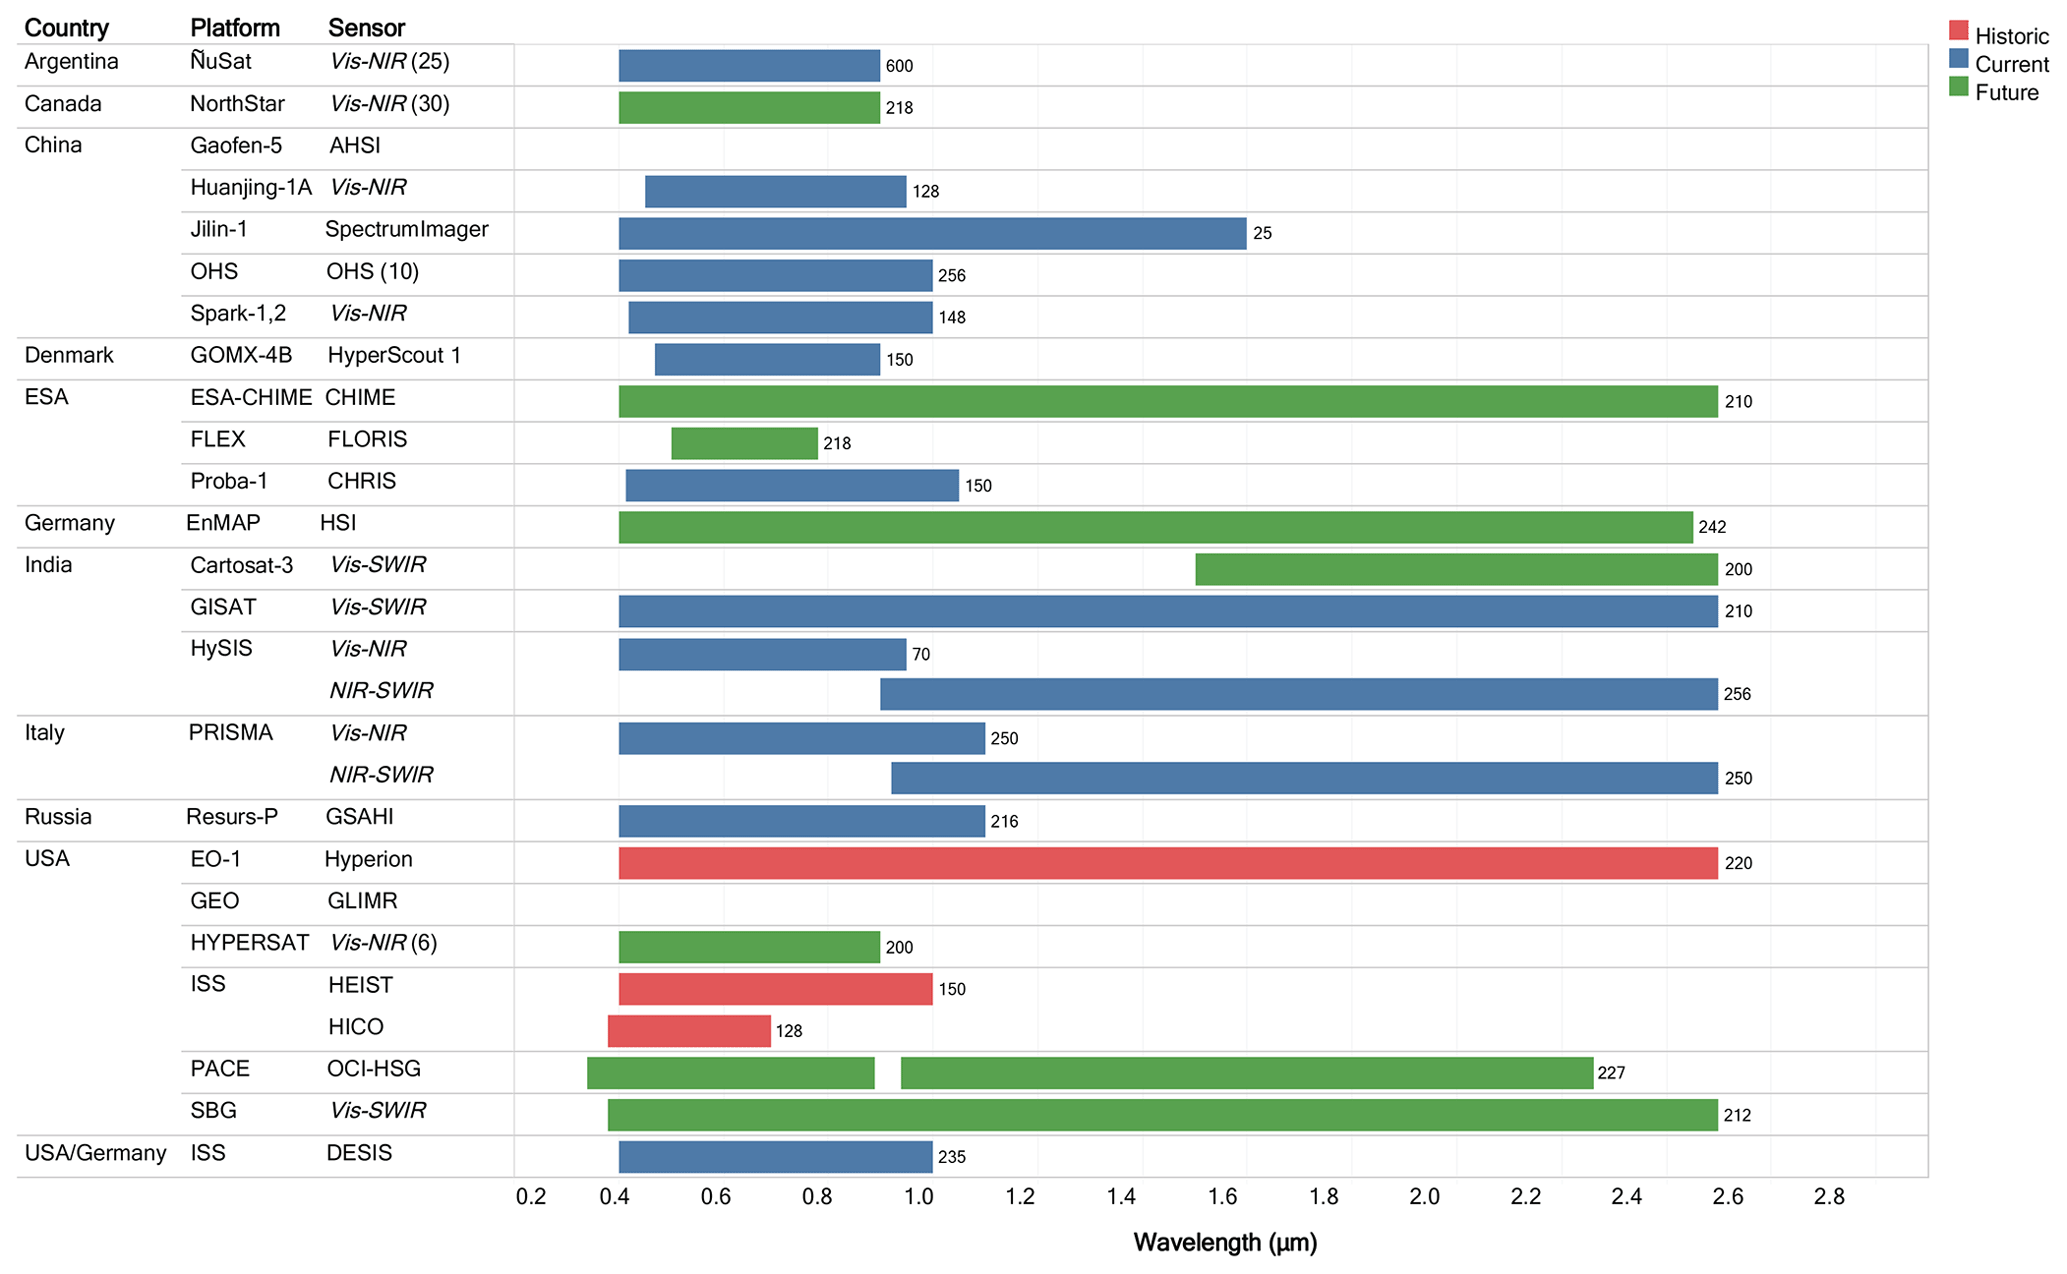
Figure 2The chart lists the spectral wavelength range and total number or sensor bands (in parentheses to the right of each bar) as presently known for each of the high spectral resolution remote sensing historic, current, and upcoming missions. Note that the general sensor types are conveyed in italics in the sensor column. Additionally, where there is a constellation or multiple sensors for the mission, the number of sensors is given in parentheses at the end of the sensor column.
NASA's Plankton, Aerosol, Cloud, ocean Ecosystem (PACE) satellite mission is intended to be a hyperspectral atmospheric and ocean color mission currently scheduled to launch in 2022–2023 and provide data to further the understanding of a myriad of Earth system processes, including those involving ocean ecology, biogeochemistry, and atmospheric composition and dynamics (for more details, see Werdell et al., 2019). One of the central objectives of the PACE mission is to improve our understanding and quantification of the aquatic biogeochemical cycling and ecosystem function in response to anthropogenic and natural environment variability and change. High spectral resolution coincident IOP–AOP data are required to aid in development and refinement of algorithms to characterize and quantify aquatic conditions and for the calibration and validation of satellite measurements. The NASA Surface Biology and Geology designated observable mission is an additional likely upcoming U.S. space agency hyperspectral mission. It has been recommended as the first Earth Observation mission to come following the currently scheduled remote sensing missions. This mission is targeted at collecting hyperspectral visible–shortwave infrared imagery and multispectral or hyperspectral thermal imagery at 30–60 m spatial resolution and will include measurements of inland and coastal environments (National Academies of Sciences, Engineering, and Medicine, 2018).
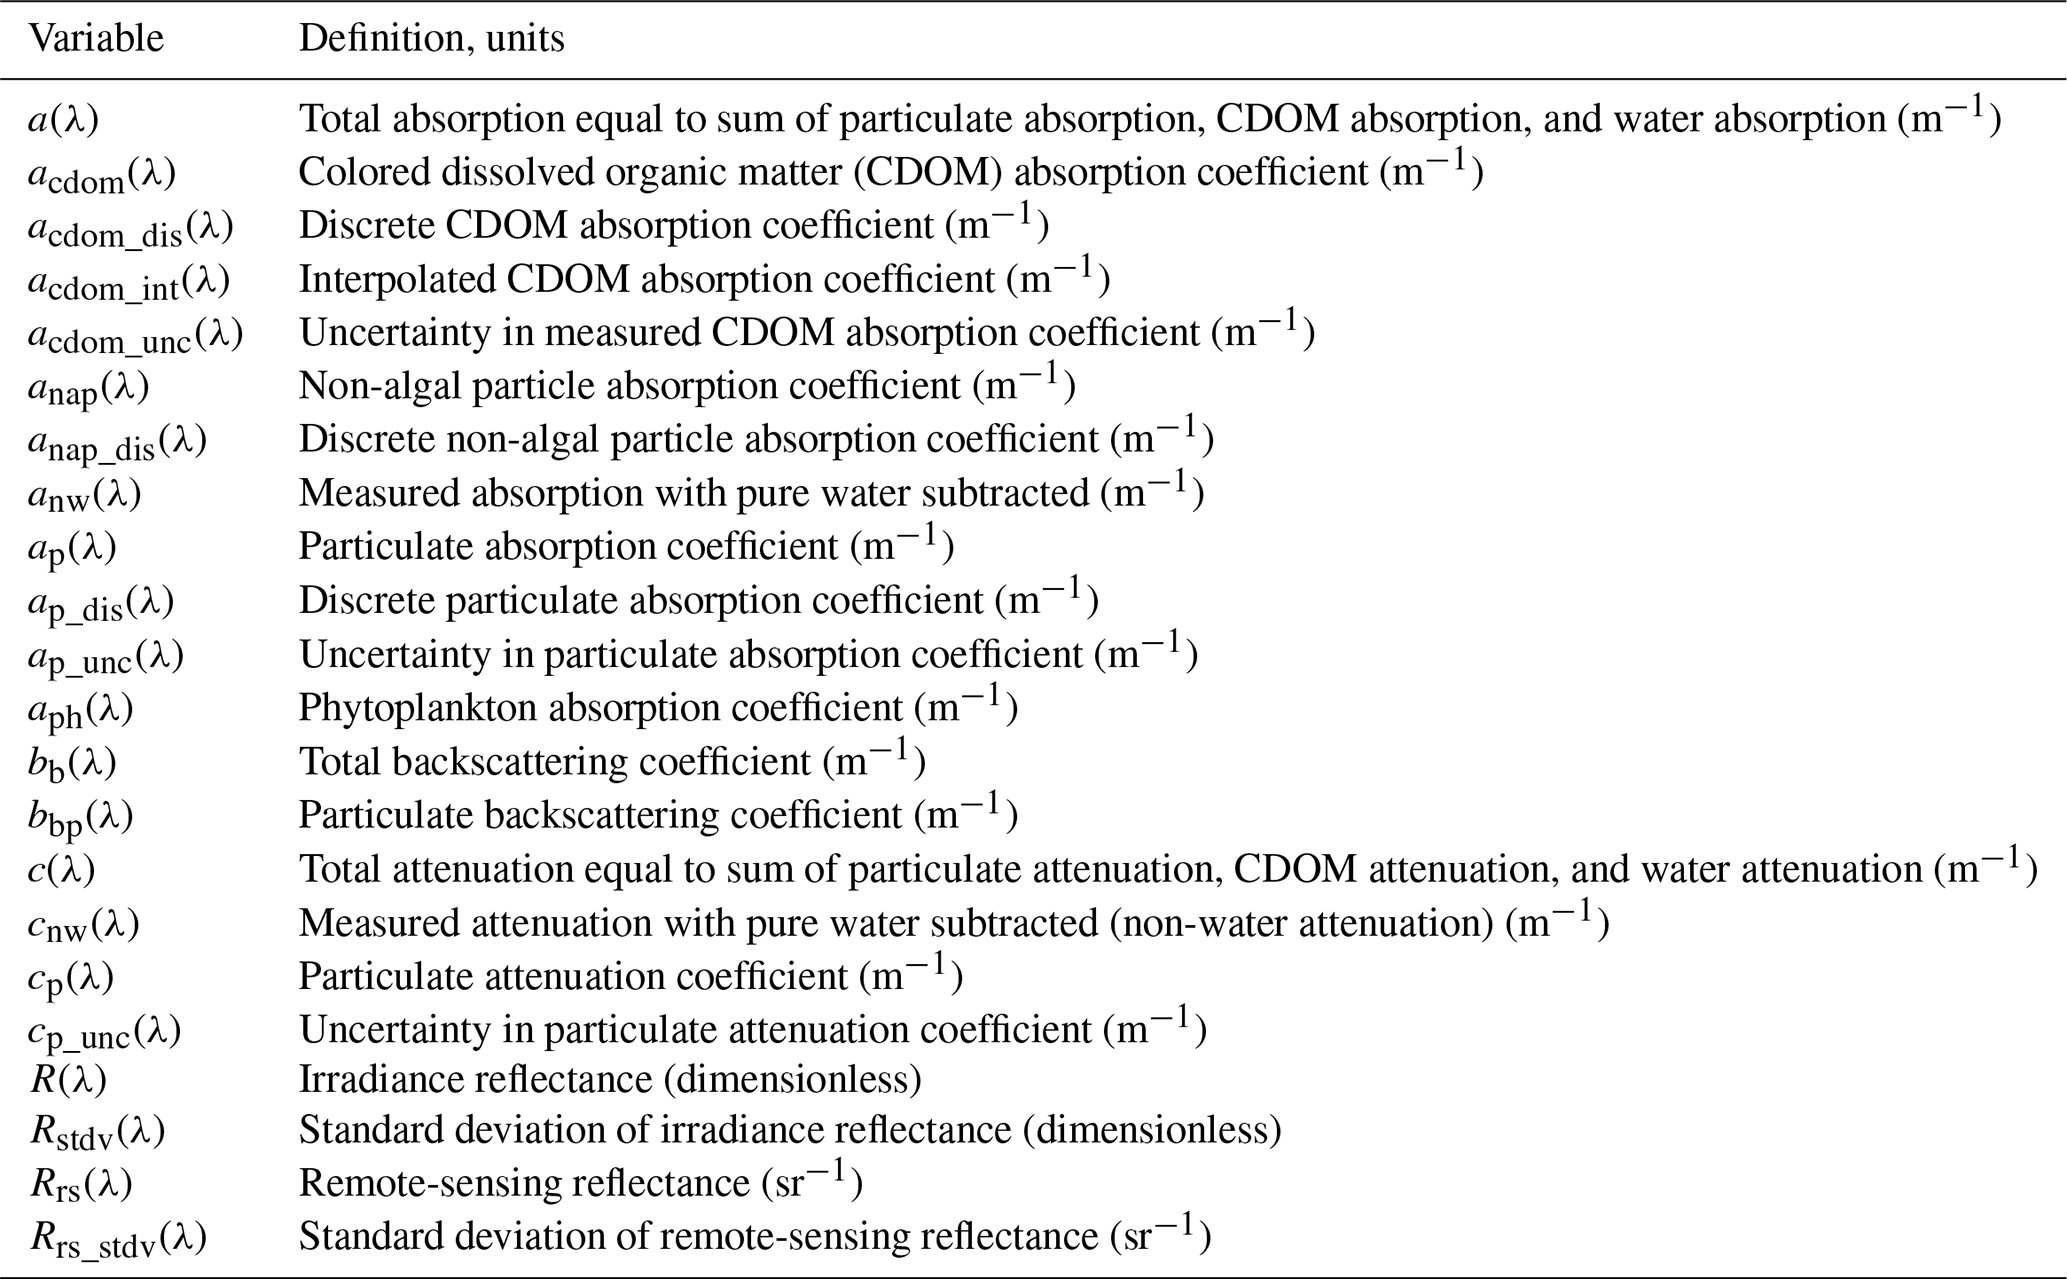
Table 1List of variables included in the database. Variables are provided as defined by contributor. The symbol “λ” represents light wavelength in a vacuum in nanometers (nm). The term “discrete” is used to indicate a water sample removed from the aquatic environment.
At present, there is a paucity of coincident in situ optical aquatic measurements of high spectral resolution. There are databases providing multispectral resolution IOPs and AOPs, with varying degrees of updates in recent years (e.g., Werdell and Bailey, 2002, 2005; Lin et al., 2018; Valente et al., 2019). We present the first organization of existing quality-controlled hyperspectral IOP and AOP data from polar, open-ocean, estuary, coastal, and inland water. The dataset is intended for remote sensing algorithm development activities associated with upcoming high spectral resolution satellite and airborne missions.
In 2015, in the early development of the PACE Mission, there was an open call to the aquatic remote sensing community to contribute well-documented, quality-controlled datasets consisting of near-synchronous depth profiles of IOPs and AOPs within the water column and near-surface reflectance and optical properties as part of an international effort to build a dataset for algorithm development and testing. All contributors to the database have actively taken part in the quality assessment of the data. Variable assignments, accuracy estimates, and measurement details were given and confirmed by the data providers. Data that have either IOP or AOP at high spectral resolution were included in the dataset. To arrange data in an organized, uniform structure, data were edited as follows. Data were filtered by considering depths from the surface to no greater than 50 m depth. We rounded data provided at fractional wavelengths to the nearest integer. Missing data are represented in the data files by placeholder values of −999. Metadata are provided at the top of each data file, detailing the contact information for the data provider, the file source, data publication reference(s), and native data collection range and resolution. The spectral range of the database is 300–900 nm, provided at a 1 nm interval. Variables included in the database are listed in Table 1. Data collection characteristics are presented in Table 2. Figure 3 and Table 3 detail the global distribution of coincident IOP–AOP data. In general terms, AOPs were measured using commercially available radiometer systems that either float at the surface or vertically profile the water column. IOPs were measured using in-water instrumentation and spectrophotometric analysis of discrete water samples (i.e., water sample removed from the aquatic environment). Brief descriptions of provider- and cruise-specific protocols and methodology are given in the following paragraphs.
Table 2In situ data collection instrument, logistical details and related references.

2.1 Methods by data contributor and expedition
In this section, the data providers describe their specific data collection methods used in acquiring and processing the provided data. Methods not previously published in peer-reviewed literature are detailed fully here.
2.1.1 Ackleson – RIO-SFE-1 and RIO-SFE-3
Ackleson provides in situ data from the Remote and In Situ Observations – San Francisco Bay and Delta Ecosystem (RIO-SFE) data collection efforts over nine stations in the bay area of San Francisco, CA, USA. In-water spectral absorption and attenuation were measured using a WETLabs AC-S and AC-9. The AC-9 intake was passed through a 0.7 µm cartridge filter to remove particulates; therefore, these measurements represent only very small particles and dissolved impurities (acdom and ccdom). The particulate absorption coefficient, ap(λ), was calculated from the difference between AC-S measurements of whole water, a(λ), and AC-9, acdom(λ). Backscattering, bb(λ), was measured by a WETLabs ECO-VSF 3.
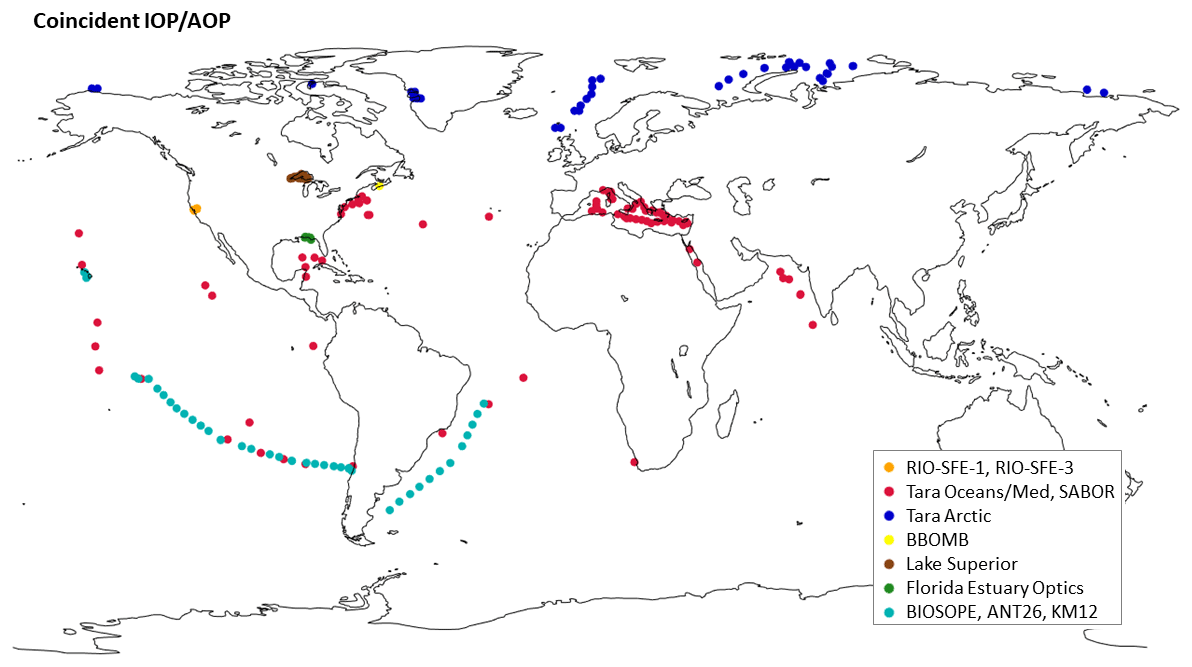
Figure 3Global geographic distribution of coincident IOP–AOP data by contributor.
Above-water Rrs(λ) was measured between 400 and 900 nm using an Analytical Spectral Devices (ASD; Boulder, CO, USA) handheld spectrometer. The procedure for measuring reflectance is a modified version of Carder and Steward (1985). At each station, 10 sets of measurements were made consisting of (1) reflected radiance from a Spectralon 10 % reflectance plaque (Labsphere, Inc., North Sutton, NH), (2) radiance reflected from the sea surface, and (3) radiance from the section of the sky that would be reflected off the sea surface at the measurement angle. These repetitions were completed as rapidly as possible in order to minimize the impact of changing light or water conditions. Measurements were made between 90 and 135∘ azimuthal angle relative to the position of the sun and at a 30∘ angle relative to the vertical to minimize sun glint (Mobley and Stramski, 1997; Mobley, 1999).
2.1.2 Boss and Chase – Tara expeditions and SABOR
The Tara Oceans expedition was a 2.5-year-long ocean cruise, intended to provide a sampling of the world's diverse ocean environments. The Tara Oceans Polar Circle Expedition (Tara Arctic) took place from May to December 2013 and allowed collection of data in the Arctic Ocean. The Tara Mediterranean expedition (Tara Med) took place from June to September 2014 in the Mediterranean Sea. The Ship-Aircraft Bio-Optical Research (SABOR) collaborative research campaign allowed scientists to gather data from the Gulf of Maine, North Atlantic and mid-Atlantic coasts from July to August 2014. A full description of the Boss and Chase Tara and SABOR expeditions and provided data can be found in Boss et al. (2013), Chase et al. (2017), and Matsuoka et al. (2017). Briefly, IOPs were measured by an inline system that included a WET-Labs AC-S, a CDOM fluorometer, and a thermosalinograph. Particulate properties were computed from the difference between measurements of the total and dissolved fraction (Dall'Olmo et al., 2009; Slade et al., 2010). Absorption by the dissolved fraction was computed by interpolating between daily discrete samples collected with a 2 m long UltraPath capillary wave guide using the filtered AC-S measurements (Matsuoka et al., 2017). During the Tara Oceans, Tara Mediterranean, and SABOR campaigns, reflectance was measured using a Satlantic hyperspectral radiometer buoy (a.k.a. HyperPro in buoy mode), with radiance measured by the upwelling radiometer and propagated to the surface using a bio-optical model and then used together with downwelling irradiance to calculate remote-sensing reflectance (Rrs(λ)) (see Chase et al., 2017, for details on data processing). During the Tara Arctic campaign, a C-OPS profiling radiometer system was used to measure upwelling radiance and downwelling irradiance and subsequently calculate Rrs(λ) at 19 wavelengths between 320 and 880 nm. Note that data that were negative within the uncertainty of the derived products were left in the data. Removing such data will bias aggregated statistics.
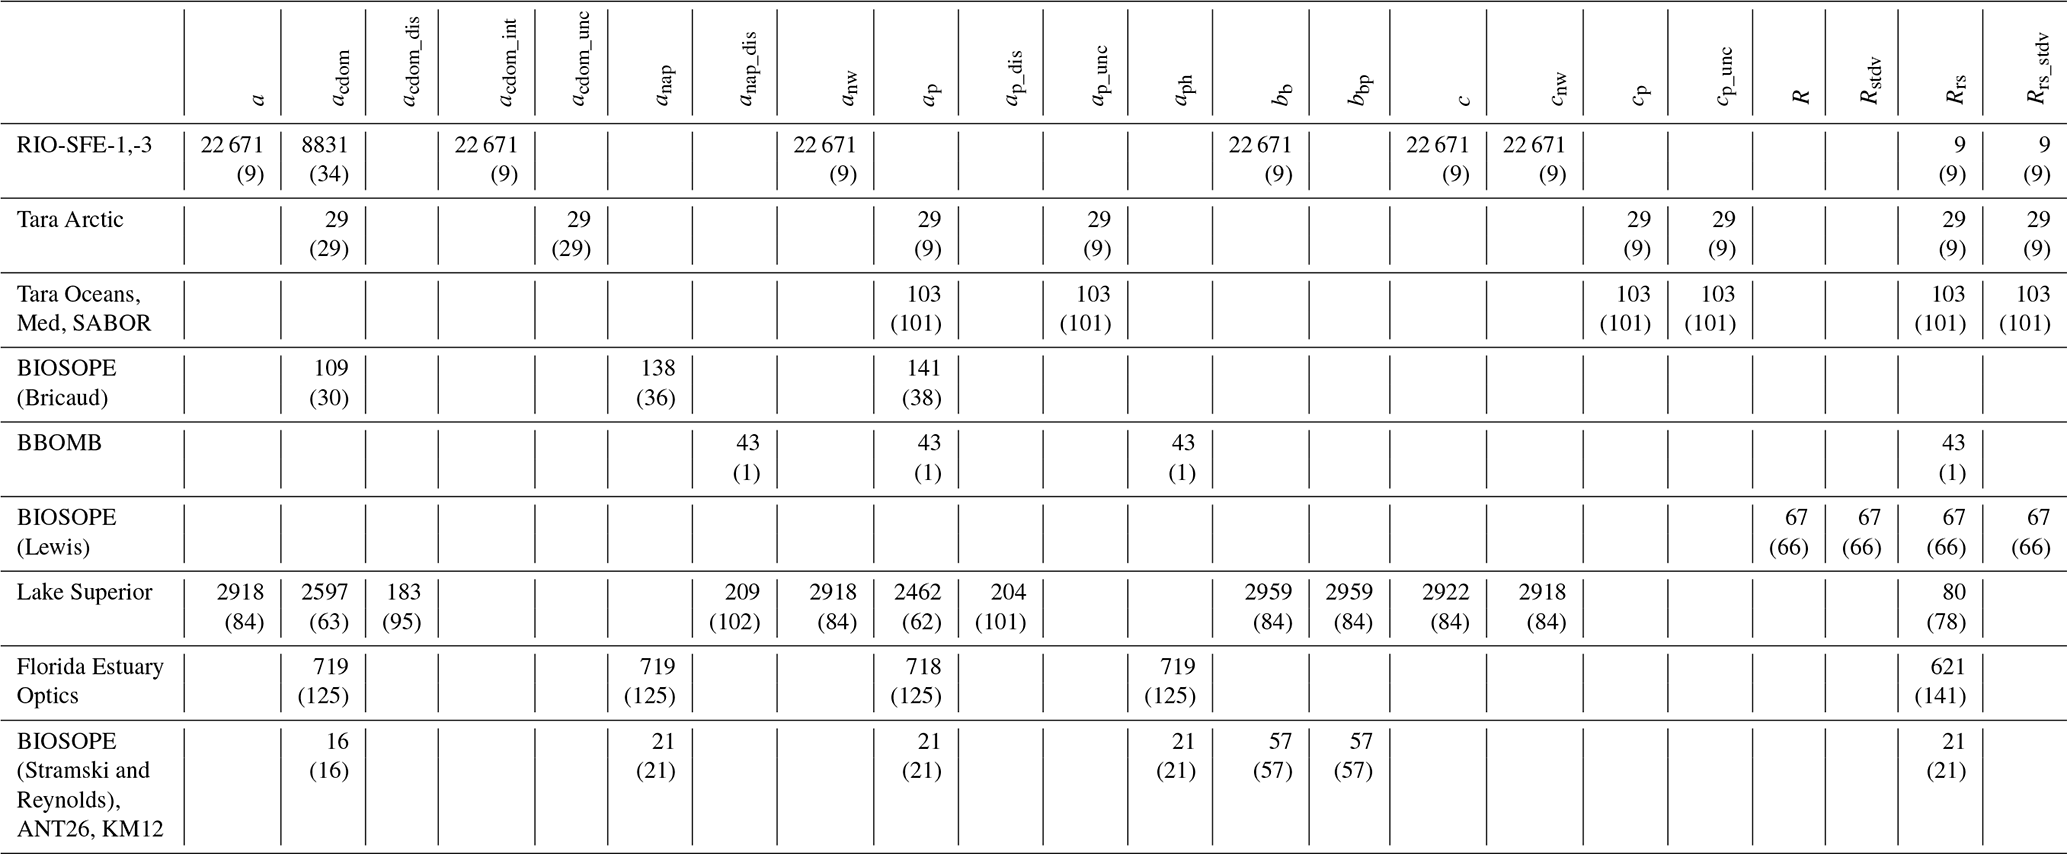
Table 3Data provided by each investigator and cruise. The number in the cells indicates the number of data points available. The number in parentheses is the number of stations in the dataset.
2.1.3 Bricaud – BIOSOPE
The BIogeochemistry and Optics SOuth Pacific Experiment (BIOSOPE) cruise on R/V l'Atalante, from October to December 2004, followed an 8000 km transect from the mesotrophic waters around the Marquesas Islands to the hyperoligotrophic waters of the South Pacific Gyre and, following this, the eutrophic waters of the upwelling area off Chile. BIOSOPE was a collaborative cruise where participating investigators were responsible for making subsets of optical measurements. With the combined data of the contributing BIOSOPE investigators, nearly all BIOSOPE campaign stations contain complete sets of AOP and IOP data. This section summarizes Bricaud's methodologies in BIOSOPE campaign data collection. A detailed description of the dataset and methods can be found in Bricaud et al. (2010).
Particulate and CDOM absorption measurements were made on board. For particulate absorption measurements, seawater samples were collected on Whatman GF/F filters and absorption spectra, ap(λ), were measured using the filter pad technique (with a soaked blank filter as a reference) using a PerkinElmer Lambda-19 spectrophotometer equipped with an integrating sphere. Non-algal absorption spectra, anap(λ), were measured on the same filters after pigment extraction in methanol (Kishino et al. 1985). When necessary, the residual absorption due to incompletely extracted pigments was corrected by applying an exponential fit (over the wavelength ranges where pigment absorption is negligible) to actual spectra.
All spectra were shifted to zero in the near infrared (750–800 nm average) to minimize possible differences between sample and reference filters. Measured optical densities were corrected for the pathlength amplification effect (according to Allali et al., 1997, for clear waters, and Bricaud and Stramski, 1990, for eutrophic waters) and then converted into absorption coefficients (in m−1). Finally, phytoplankton absorption spectra, aph(λ), were obtained by subtracting anap(λ) from ap(λ).
CDOM absorption measurements were performed using a WPI Ultrapath capillary waveguide with a 2 m pathlength. Samples were filtered under dim light into glass bottles, using pre-rinsed 0.2 µm Sartorius filters, and then analyzed immediately. High-performance liquid chromatography quality water, artificially salted (35 g L−1) with precombusted NaCl, was used as reference water. Between each measurement, the sample cell was cleaned according to the WPI, Inc. recommendations. Replicate measurements (including all handling steps) showed that the reproducibility was approximately ±0.005 m−1 at 375 nm.
2.1.4 Craig – BBOMB
All measurements provided by Craig were derived from the collection of data at the Bedford Basin Ocean Monitoring Buoy (BBOMB), a coastal ocean monitoring buoy located in the Bedford Basin near Halifax, NS, Canada. A full description of the Craig dataset and acquisition protocols can be found in Craig et al. (2012). Water samples were collected by Niskin bottle at a depth of 1 m for the determination of various water column parameters, which included spectral particulate absorption coefficient, ap(λ) and acdom(λ). Wherever possible, NASA Ocean Optics Protocols (Pegau et al., 2003) were followed for all sample acquisition, handling, storage, and analysis. Briefly, ap(λ) and aph(λ) spectra were determined from water samples that were filtered under low pressure through a 25 mm GF/F (Whatman) filter. The particulate absorption coefficient, ap(λ), in the range 350–800 nm was determined in a Cary UV–VIS spectrophotometer with the filter pad mounted on a quartz glass slide and placed at the entrance to an integrating sphere in a modification (Craig, 1999) of the Shibata (1959) opal glass technique. Samples were de-pigmented by soaking the filters in a 0.1 % active chlorine solution of NaClO (Kishino et al., 1985; Tassan and Ferrari, 1995). The absorption spectra of the de-pigmented particles, anap(λ), were then measured as described above, and aph(λ) was calculated from ap(λ)−anap(λ).
Depth profiles of hyperspectral downwelling irradiance, Ed(λ, z) (µW cm−2 nm−1) and upwelling radiance, Lu(λ, z) (µW cm−2 nm−1 sr−1) (where z is depth in the water column) were made with a HyperPro (Satlantic Inc.) profiling radiometer. Multiple casts (usually three) were made in quick succession and ∼ 100 m away from the boat to avoid the influence of ship shadow (Mueller et al., 2003). A deck unit mounted to the superstructure of the boat also provided contemporaneous measurements of above-water surface incident irradiance, Es(λ), during profile acquisition.
2.1.5 Lewis – BIOSOPE
Lewis was another participating science investigator on the BIOSOPE campaign (detailed in Sect. 2.1.3). This section details his collection of BIOSOPE cruise data. Remote-sensing spectral reflectance (Rrs(λ), sr−1, specifically, the ratio of water-leaving radiance to downwelling irradiance above sea surface) in the South Pacific gyre was computed from direct measurements of downwelling irradiance above the sea surface (Es(λ), W m−2 nm−1) taken aboard ship, and measurements of upwelling radiance (Lu(λ), W m−2 nm−1 sr−1) made at a depth of 20 cm below the ocean surface, using a modified hyperspectral profiling radiometer adapted to float at the sea surface and tethered such that the instrument operated at a distance of ∼ 100 m from the vessel (HyperPro, Satlantic; Claustre et al., 2008; Stramski et al., 2008; Lee et al., 2010). Instrument tilt was measured directly; measurements were rejected if tilts exceeded 5∘. Measurements were made over the spectral region 380–800 nm via an instrument resolution of 10 nm and a sampling interval of 3.3 nm. Dark values were taken every five samples by use of an internal shutter. These were linearly interpolated for each light value, and then subtracted from the observations. Calibration coefficients and corrections for immersion effects were obtained following standard protocols (Mueller et al., 2003) and applied to the measurements; demonstrated absolute accuracies are < 2.8 % for radiance and < 2.1 % for irradiance (see Gordon et al., 2009). Irradiance and radiance data were taken for 3 min at each deployment, with each observation within the deployment time series representing integration times of 0.03 to 0.5 s, depending on the intensity of the incident radiance. These measurements were then interpolated to a common time frame at a frequency of 2 s and 2 nm spectral interval.
Upwelling radiance measurements were then propagated to the sea surface using an iterative approach that estimates the spectral diffuse attenuation coefficient from spectral ratios of measured radiance, and the water-leaving radiance above the sea surface, LW(λ), is then computed based on Fresnel reflectance at the water–air boundary and the real relative index of refraction of water (Mueller et al., 2003). A 3 min time series of Rrs was made by dividing the computed water-leaving radiance by the downward irradiance for each time interval, and an average value and standard deviation was computed for each deployment.
2.1.6 Mouw – Lake Superior studies
Mouw contributed data from measurements made in Lake Superior, the largest of the Great Lakes of North America. A detailed description of the methods used for inland IOP and AOP observations can be found in Mouw et al. (2017). Optical and biogeochemical data were collected in Lake Superior during the ice-free months (May–October) of 2013 to 2016. The dataset consists of a full suite of coincident IOPs and AOPs, including a, acdom, acdom_dis, anap_dis, anw, ap, ap_dis, bb, bbp, c, cnw, and Rrs(λ). The variables used to retrieve Rrs are available by request from the data contributor. The contributor also notes that aph can be calculated from the provided variables.
AOP radiometric measurements were made with three HyperOCR spectral radiometers (Satlantic Inc.) that measure between 350 and 800 nm, with an approximately 3 nm sampling interval (137 total wavelengths). In-water Ed(λ) and Lu(λ) HyperOCR sensors were attached to a free-falling Profiler II frame (Satlantic Inc.), while the Es(λ) sensor was mounted on top of the ship to allow for correction of the other measurements due to changing sky conditions. At each station, the system was deployed for three cast types: surface, multi-profile, and full profile. To characterize the air–water interface, a floatation collar on the profiler frame enabled continuous measurement of Lu(λ) approximately 20 cm below the water surface for 5 min (surface profile). The flotation collar was removed, and the profiler then deployed in free fall mode, measuring five consecutive profiles from the surface to 10 m to characterize the near-surface light field (multi-profile). Finally, the profiler was allowed to free fall to the 1 % light level or to within 10 m of the bottom, whichever was shallower (full profile). All methods and analysis follow the NASA ocean optics protocols for satellite ocean color sensor validation (Mueller et al., 2003).
IOPs were collected via a vertically profiled bio-optical package that measures absorption, attenuation (WET Labs AC-S), and backscattering (WET Labs ECO-BB9), along with concurrent temperature, salinity (SeaBird CTD 37SI), and fluorometric chlorophyll a (WET Labs ECO-FL3). All methods and analysis followed the NASA ocean optics protocols for satellite ocean color sensor validation (Mueller et al., 2003). Total absorption and attenuation (a(λ) and c(λ), m−1, respectively) were resolved at 81 wavelengths between 400 and 750 nm.
For laboratory analysis of discrete water samples, spectral CDOM, particulate, non-algal, and phytoplankton absorption were measured spectrophotometrically (PerkinElmer Lambda 35 UV/VIS dual-beam) for wavelengths between 300 and 800 nm. Absorption of CDOM filtrate was measured in a 10 cm cuvette following NASA's Ocean Optics Protocols (Mueller et al., 2003) using a slit width of 2 nm and a scan rate of 240 nm min−1. For particulate and non-algal absorption, we followed the transmission–reflectance (T–R) method (Tassan and Ferrari, 1995; Lohrenz, 2000; Lohrenz et al., 2003) that utilizes an integrating sphere to correct measurements for the contribution of scattering.
2.1.7 Schaeffer – Florida Estuary Optics
Schaeffer collected in situ measurements and water samples during boat-based surveys in Florida estuaries between September 2009 and November 2011. Hydrographic profiling measurements were collected using a Seabird CTD package. A free-falling hyperspectral profiling system (HyperPRO, Satlantic, Halifax, NS, Canada) provided in-water hyperspectral (400–735 nm, interpolated every 1 nm) measures of downwelling irradiance (Ed(z,λ)), upwelling radiance (Lu(z,λ)), and depth (z). Water samples were collected 0.5 m below the air–water surface for absorption (phytoplankton pigment, non-algal particles, CDOM) and extracted chlorophyll analyses. CDOM absorption was measured in a 10 cm cuvette using a Shimadzu UV1700 dual-beam spectrophotometer at 1 nm intervals between 200–700 nm with Milli-Q deionized water as a reference. The samples were the filtrate from 0.7 µm nominal pore size GF/F filters to avoid a size fraction gap between the traditional 0.2 µm pore size for ocean CDOM measures and 0.7 µm pore size for particulate absorption measures. Reported CDOM absorption values will be higher than the range traditionally reported for oceans because of the larger size fraction and sample station locations, including estuary river systems. Total particulates were collected on Whatman 25 mm GF/F filters and analyzed with a Shimadzu UV1700 dual-beam spectrophotometer at 1 nm intervals between 400 and 800 nm with 0.2 µm filtered seawater as the reference standard (Pegau et al., 2003). Pigments were extracted from filters with warm methanol and re-scanned to measure the detrital absorption (Kishino et al., 1985).
Remote-sensing reflectance (Rrs) was derived from both a profiling radiometer (HyperPro, Satlantic) and a hyperspectral surface acquisition system (HyperSAS, Satlantic Inc., Halifax, NS, Canada). The HyperSAS logged spectral measurements of above-water radiance (Lt(λ)), sky radiance (Li(λ)), and downwelling sky irradiance (Es(λ)) from 350 to 800 nm (interpolated at 1 nm intervals). The above-water remote-sensing reflectance (Rt) spectra were corrected for reflected sky light, sunlight, sun glint, and reflected cloud light, following the second path surface correction algorithm of Gould et al. (2001) to derive the final corrected remote-sensing reflectance (Rrs). Specifically, in Gould et al. (2001), , where Rsky is the corrected sky spectra, A is the sea surface reflectance factor, and B is a residual offset. Rt was coupled with in-water measurements of absorption at 412 nm, scattering at 412 nm, and scattering shape to correct for surface reflection. Florida estuaries archived data are available at https://doi.org/10.23719/1424031.
2.1.8 Stramski and Reynolds – BIOSOPE, ANT26, and KM12
Stramski and Reynolds provide data for three cruises, BIOSOPE (described previously), ANT26, and KM12. ANT26 was a German cruise onboard the R/V Polarstern, covering a south-to-north segment of the Atlantic Ocean from Punta Arenas, Chile (beginning in April 2010), to Bremerhaven, Germany (finishing in May 2010). The KM12 cruise collected data in the Pacific Ocean off the Hawaiian Islands in June 2012. For all three cruises, the spectral backscattering coefficient of seawater, bb(λ), was measured in situ from vertical profiles obtained with a combination of HOBI Labs Hydroscat-6 and a-Beta sensors. The determination of bb(λ), and the particulate contribution bbp(λ) from these measurements is described in Stramski et al. (2008) and Zheng et al. (2014). On BIOSOPE, a Hydroscat-6 providing measurements at six wavelengths (442, 470, 550, 589, 620, and 671 nm) was paired with two single wavelength a-Beta sensors (420 and 510 nm). For the ANT26 and KM12 cruises, a combination of two Hydroscat-6 instruments was used to provide measurements in 11 spectral bands (394, 420, 442, 470, 510, 532, 550, 589, 640, 730, and 852 nm; 550 nm common to both instruments).
For the ANT26 and KM12 cruises, discrete water samples within the upper 5 m were collected from a CTD-Rosette equipped with Niskin bottles. The spectral absorption coefficient of particulate material, ap(λ), was determined spectrophotometrically with a filter pad technique for particles retained on a 25 mm glass fiber filter (GF/F, Whatman). Measurements were made at 1 nm sampling interval over the spectral region 300–850 nm using a PerkinElmer Lambda 18 spectrophotometer equipped with a 15 cm diameter integrating sphere. The filters were placed inside the sphere to minimize potential scattering error, and the correction for pathlength amplification factor determined for this configuration of measurement was used (Stramski et al., 2015). The partitioning of ap(λ) into phytoplankton, aph(λ), and non-algal particle, anap(λ), contributions was accomplished through the chemical extraction of pigments using methanol (Kishino et al., 1985). The absorption coefficient of CDOM, acdom(λ), on ANT26 was determined on discrete water samples using a PSICAM instrument (Röttgers and Doerffer, 2007). For KM12, acdom was measured in situ using a WET Labs AC-S.
The spectral remote-sensing reflectance, Rrs(λ), for the ANT26 and KM12 cruises was determined by averaging a time series of radiometric measurements from a Satlantic HyperPro II radiometer attached to a surface float and deployed at a large distance from the vessel. Measurements were obtained over the spectral range 350–800 nm approximately every 3 nm and subsequently interpolated to 1 nm intervals. Subsurface measurements of the upwelling zenith radiance (i.e., light propagating towards zenith) made at 0.2 m depth were propagated to and across the sea surface and combined with above-surface measurements of downwelling planar irradiance to estimate Rrs(λ) (Uitz et al., 2015).
Overall, the collection of datasets provides mostly coincident IOP–AOP data from a wide range of latitudes and water types, including polar, open-ocean, estuary, coastal, and inland water environments. We detailed the specific cruise, instrument, and methodology approaches taken by each data provider. The majority of the data have been published as referenced. The few contributed datasets that are not yet published in peer-reviewed literature are fully described in this article. Thus, the data provide a robust means to evaluate aquatic remote sensing observations toward further remote sensing science research and development goals.
Hereafter, we describe the spatial and temporal resolution covered by the dataset for coincident IOP and AOP, where coincident data describes data that have Rrs and at least one IOP variable available. IOP and AOP data are provided from 12 cruises, from 2004 to 2016, covering Arctic, midlatitude, and equatorial open ocean, as well as estuary, coastal, and inland aquatic sites (see Table 2, Fig. 3). A summary of the number of data points available for every cruise for each of the variables is provided in Table 3. Table 3 shows that IOPs are generally collected at more stations than AOPs. The amount of data available for IOPs is also much larger than AOPs because we count every depth as a data point. The three datasets with the largest amount of data (where each station, depth, and variable count as a data point) were those provided by Ackleson, Mouw, and Stramski and Reynolds. The Ackleson dataset contains data for seven IOPs and Rrs, Mouw provides data for nine IOPs and Rrs, and the Stramski and Reynolds dataset has data for six IOPs plus Rrs. Data from the largest datasets are also geographically diverse. Specifically, the Stramski and Reynolds dataset includes between 21 and 57 different geographic stations depending on the IOP data variable, the Mouw dataset includes between 63 and 102 different geographic stations, and the Ackleson dataset provides between nine and 33 different geographic stations. As described previously, from the BIOSOPE collaborative cruise, coincident BIOSOPE AOP and IOP data are provided by a suite of contributors. In this article, BIOSOPE data contributors and variables include Bricaud (acdom, anap, ap), Lewis (Rrs), and Stramski and Reynolds (bb).
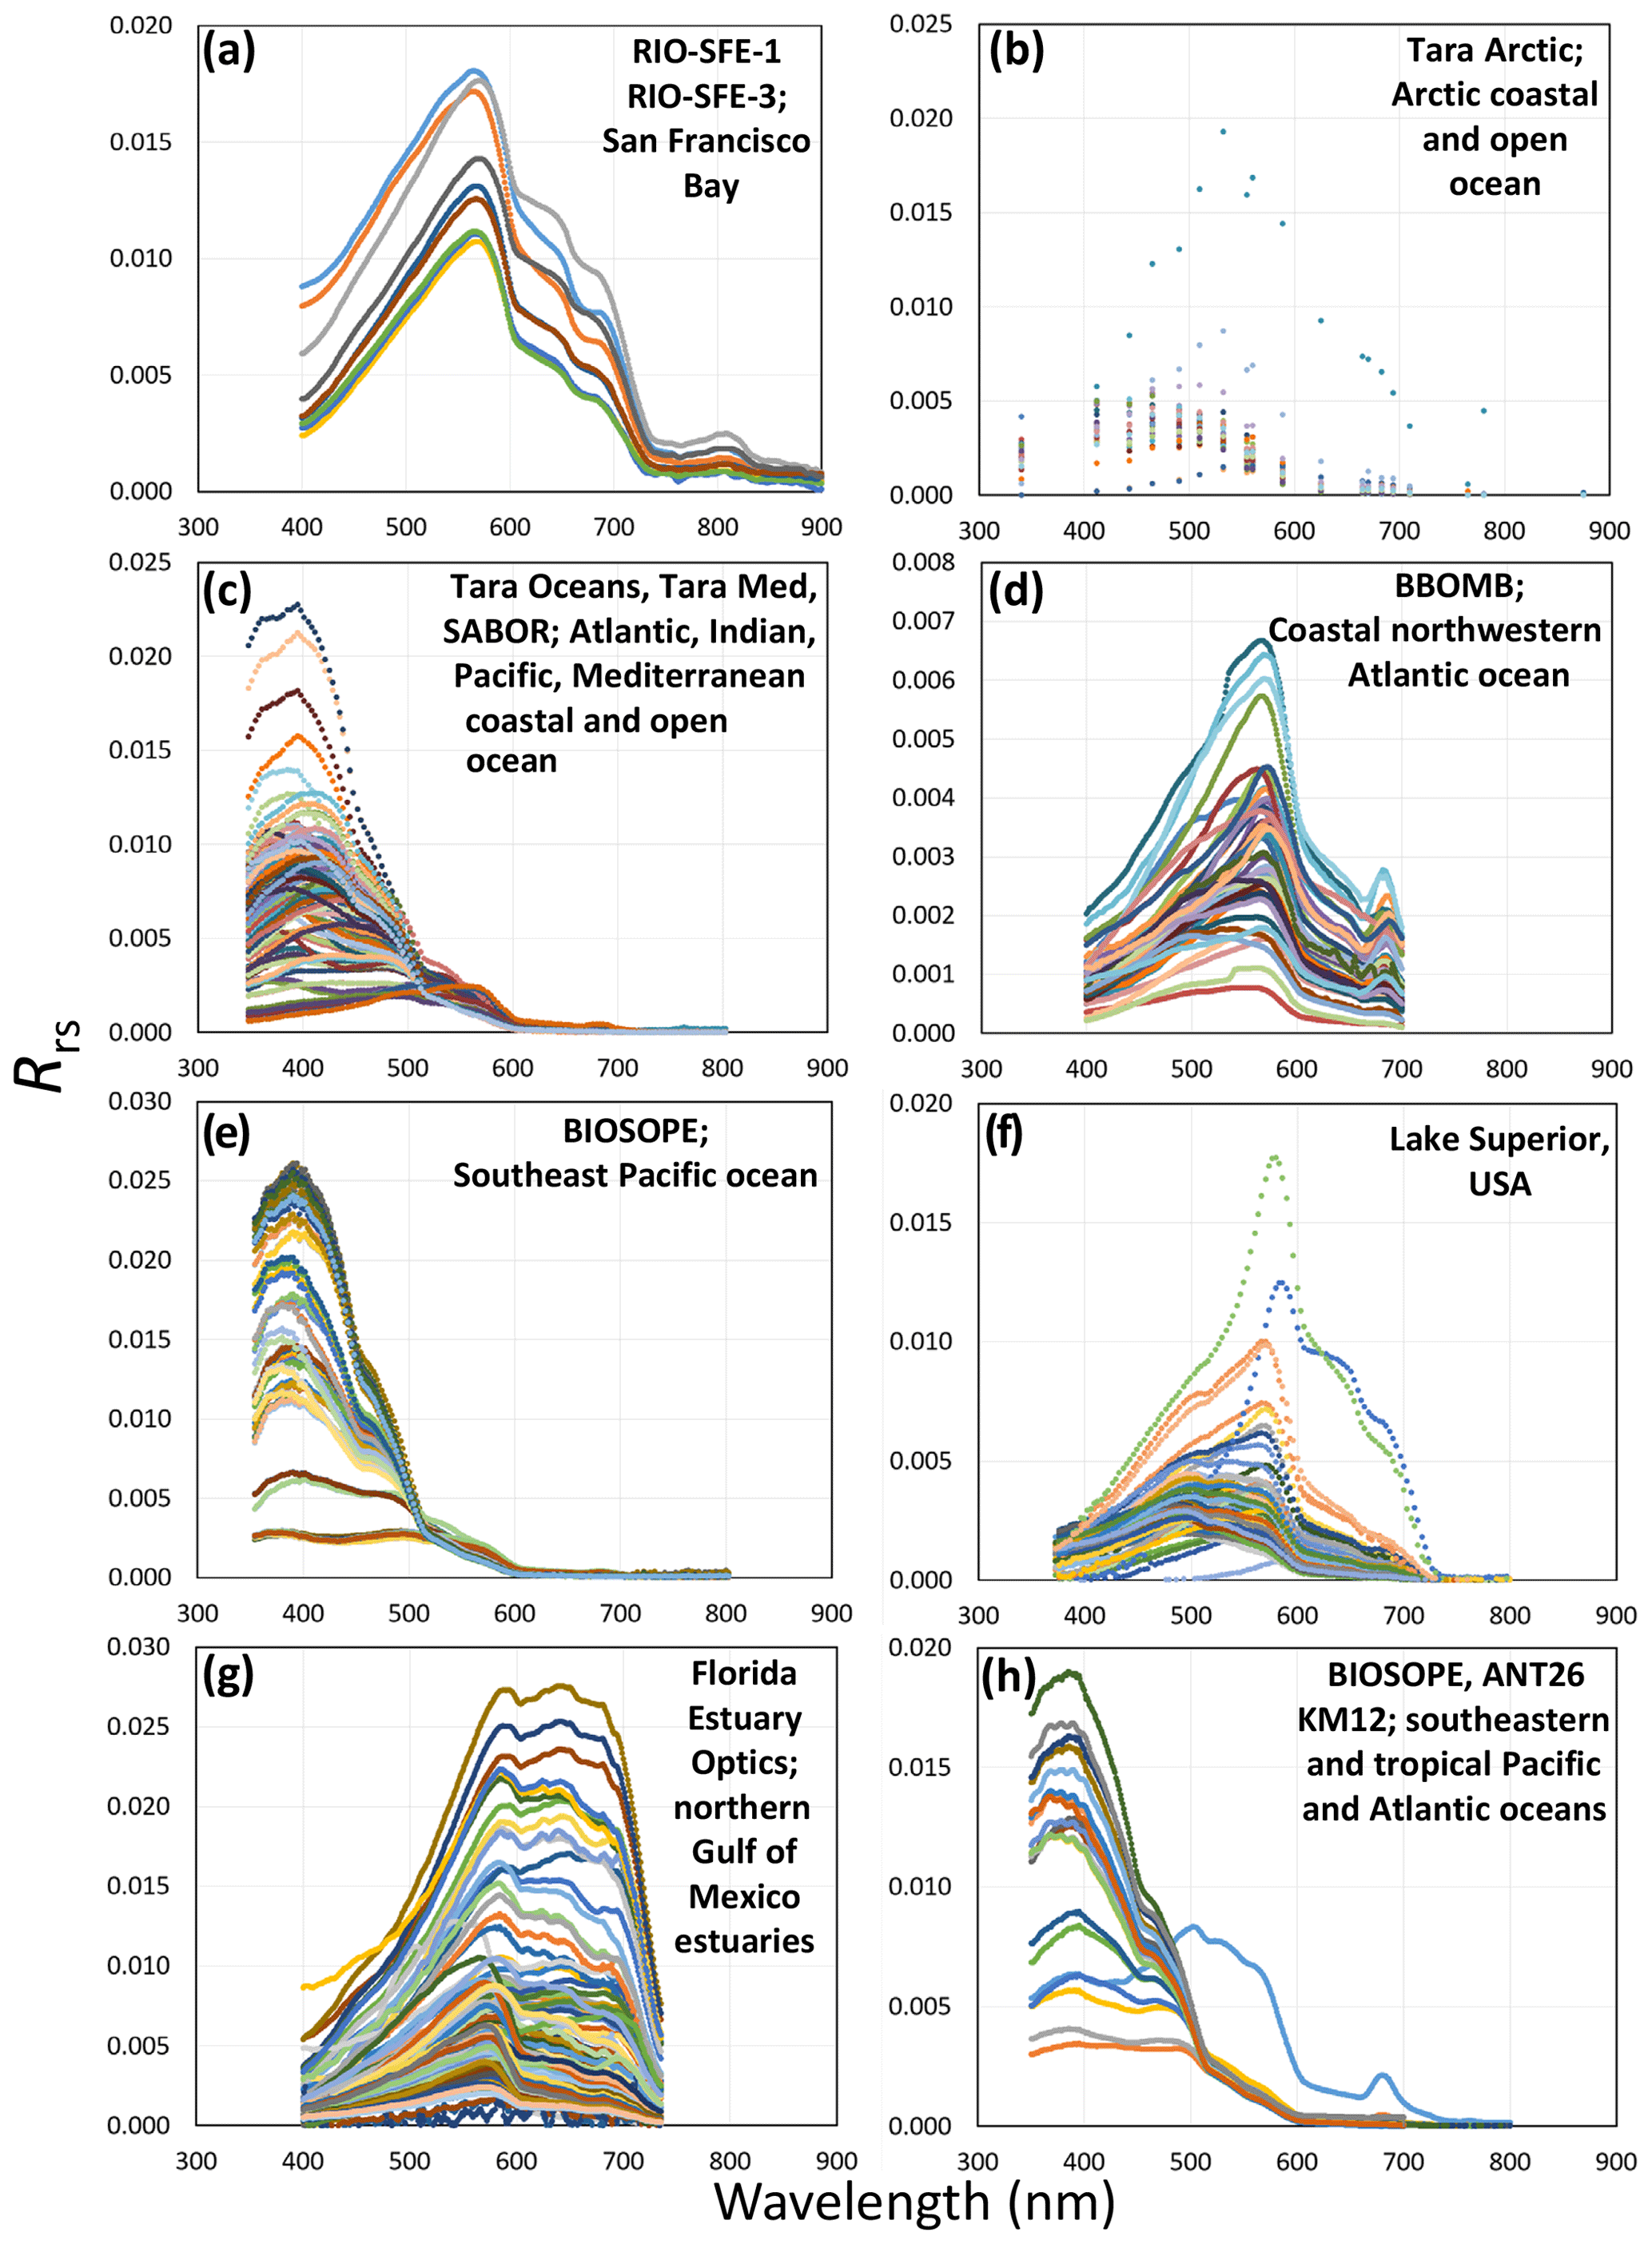
Figure 4Plots demonstrating the spectral reflectance diversity of inland, estuary, and ocean environments (location information is provided in Fig. 3). Reflectance distribution plots display Rrs data from (a) San Francisco Bay waters (Ackleson); (b) Arctic coastal and open-ocean waters (Boss and Chase Arctic); (c) Atlantic Ocean, Indian Ocean, Pacific Ocean, and Mediterranean Sea coastal and open-ocean waters (Boss and Chase); (d) coastal northwestern Atlantic ocean waters (Craig); (e) southeastern Pacific ocean waters (Lewis); (f) Lake Superior, USA, inland water (Mouw); (g) northern Gulf of Mexico estuaries (Schaeffer); and (h) southeastern and tropical Pacific and Atlantic ocean waters (Stramski and Reynolds). Note that subplots demonstrate the spectral sampling interval provided; where high spectral sampling interval data are available, subplots appear more “linear” (a, d, g, h), and where there is lower spectral sampling interval data, subplots appear more “point” and less continuous (b, c, e, f). Each color in the subplot represents a separate data collection.
Similar to the synergies of the BIOSOPE campaign with multiple investigators, dataset users are encouraged to consider harnessing provided data to derive additional desired variables. For example, many stations contain a complete set of both an AOP measurement (R or Rrs) and the two main IOPs (a and bb). Note that total absorption can be calculated if all constituent absorption coefficients are measured in conjunction with published IOPs of pure water; this applies to most of our stations. Derivation and combinations of provided data ultimately depend on the intent and goals of the user.
We show the range in reflectance values (Rrs) provided from diverse geographic locations of inland, estuary, coastal, open-ocean, and polar waters in Fig. 4. The diversity in the signal from inland water (Fig. 4f) to coastal (Fig. 4a, d, g), Arctic (Fig. 4b), and open-ocean waters (Fig. 4c, e, h) shows a range of the various particulate, biogeochemical, and other water conditions characteristic of different aquatic environments. The reflectance graphs also show the level of detail that can be extracted by varying spectral resolutions. Lower spectral resolution is shown in the Boss and Chase Arctic data (from 5 nm to tens of nm of separation), and higher resolution is found in the Boss and Chase (Tara Oceans); Lewis and Mouw (2–3 nm spectral resolution); and Ackleson, Craig, Schaeffer, and Stramski and Reynolds (1 nm spectral resolution) datasets.
When assessing the geographic distribution of the coincident IOP and AOP data, we found data were more frequent for latitudes between 30 and 40∘ N and longitudes between 50 and 100∘ W (Fig. 5). The Ackleson (San Francisco Bay), Schaeffer (northern Gulf of Mexico), and Mouw (Lake Superior) data were acquired at those latitudes and longitudes. These results also highlight the lack of data for the area between 100 and 180∘ E and latitudes south of 50∘.
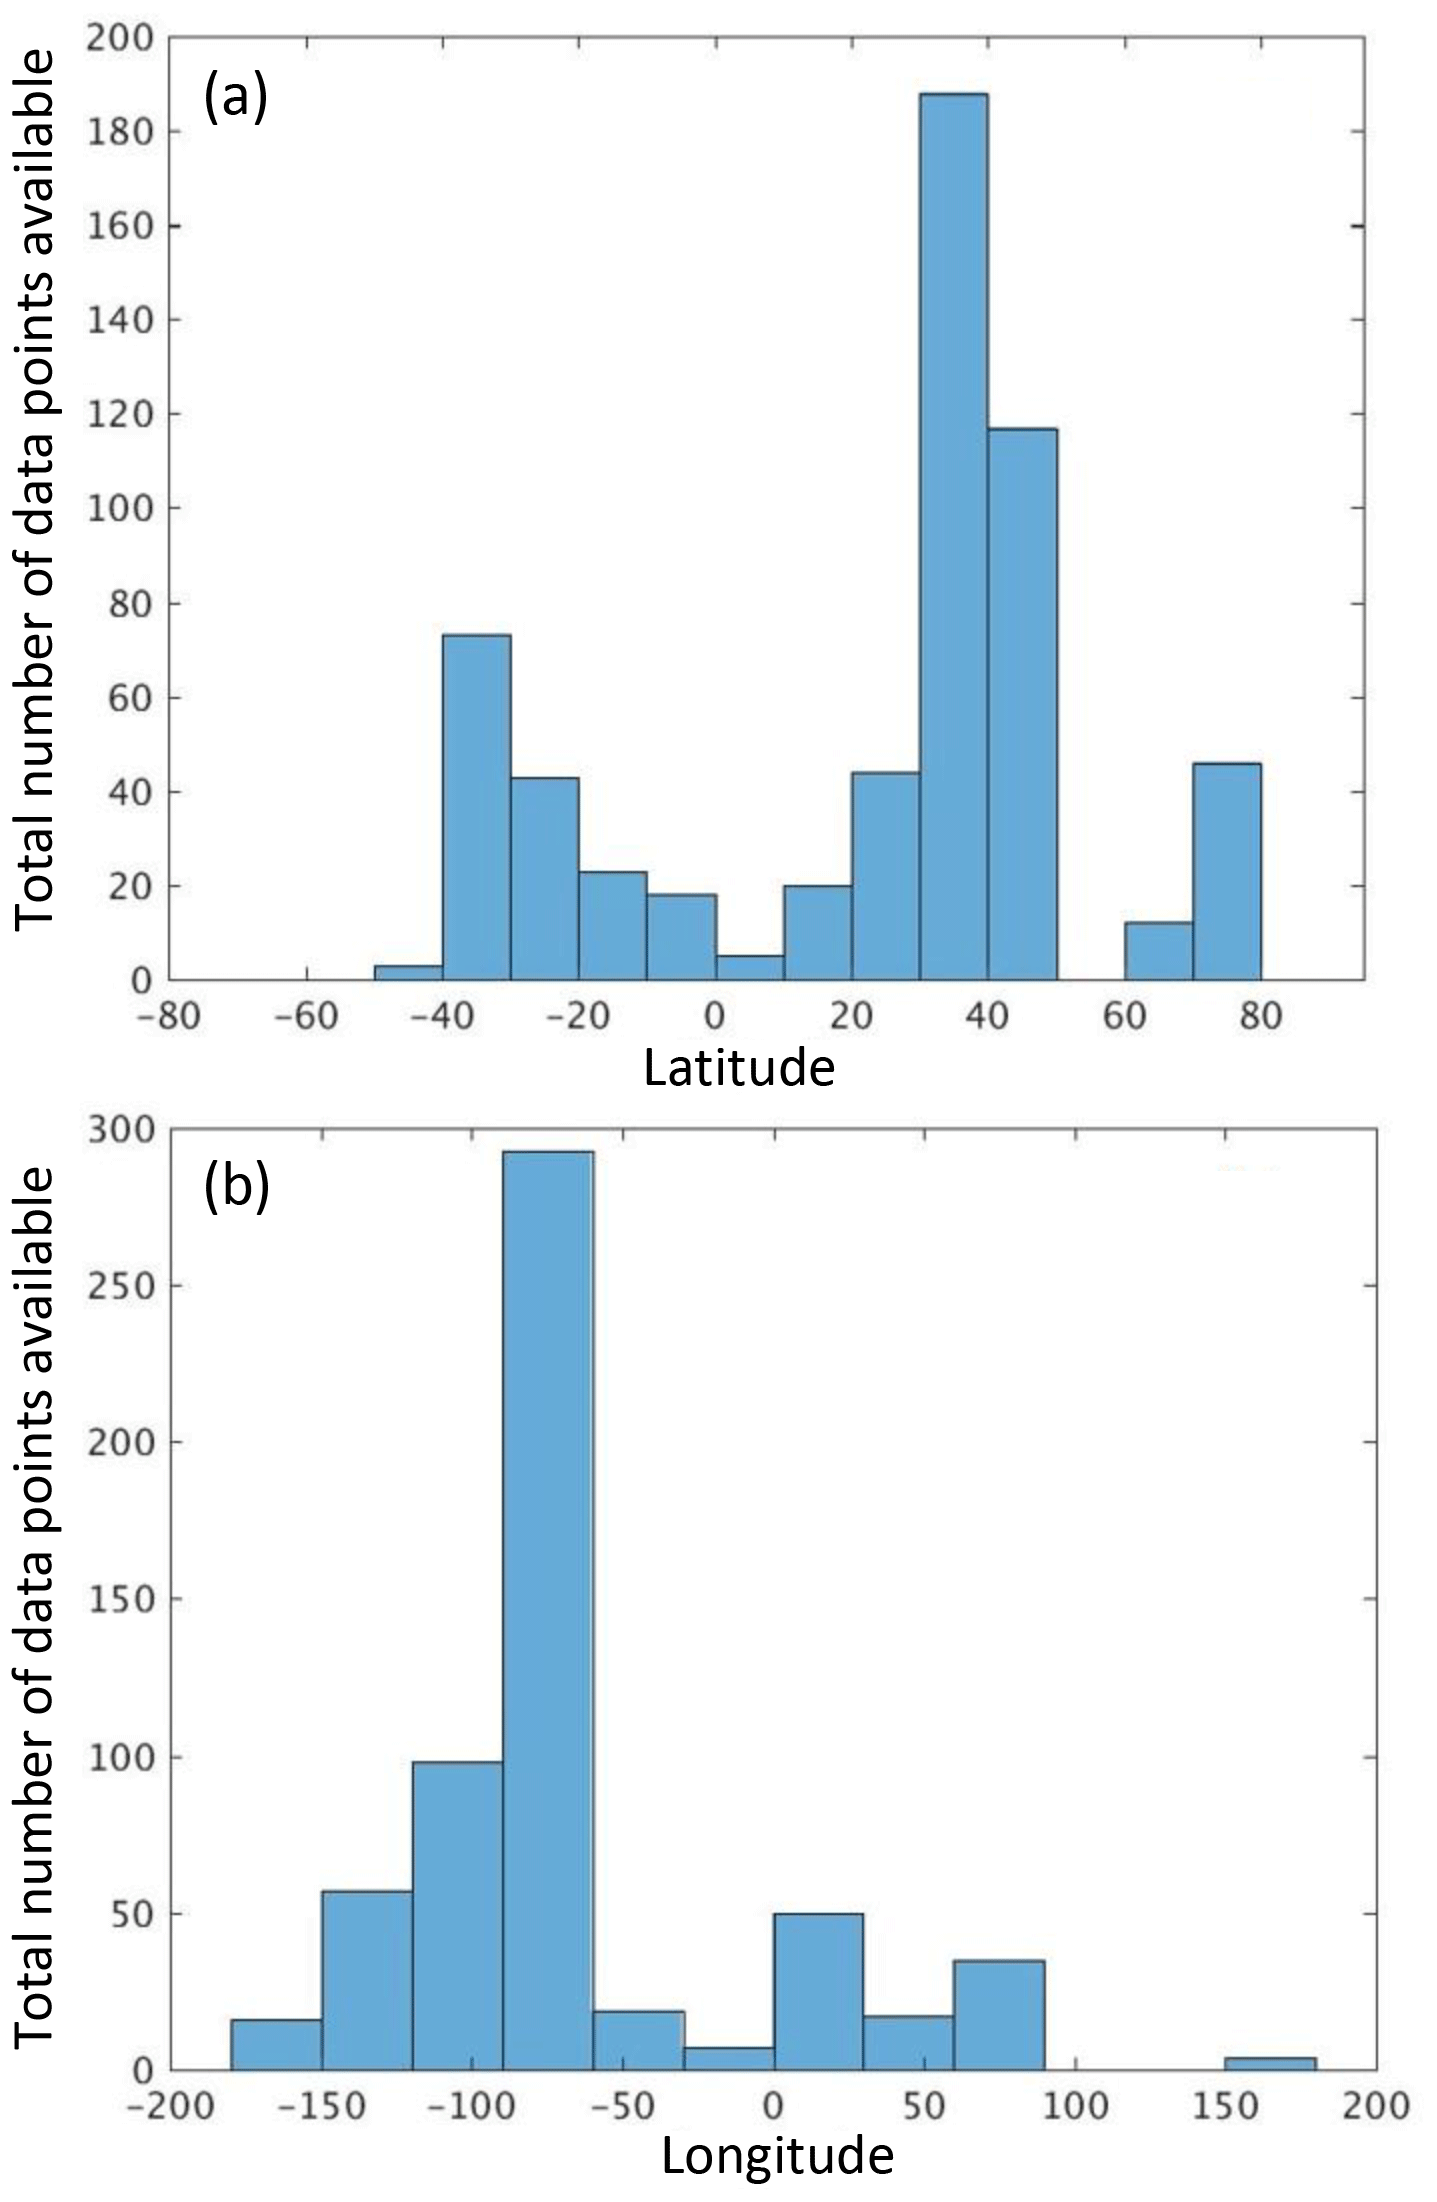
Figure 5Geographic frequency distribution of stations with coincident IOP and AOP data. Panel (a) shows data point distribution by latitude, and panel (b) shows data point distribution by longitude.
We caution users of the datasets to consider inherent uniqueness, variable aquatic environments, and limitations to data collections. For example, estuary water and resulting data differs greatly from open ocean data. Some data, collected in turbid waters were found to contain less signal compared to noise. Specifically, the AC-S dataset of Boss and Chase has significant uncertainties in ap in the blue part of the spectrum due to uncertainty in the scattering correction of this measurement, particularly in turbid waters (e.g., Stockley et al., 2017). Additionally, as previously detailed, not all data collected is coincident. We have indicated several details that include the geographic and variable distribution concerning coincident data in Fig. 3 and Table 3. Overall, because most data have already been published in peer-reviewed literature with study collection, processing, and analysis details, readers are able to determine the utility and applicability of the datasets provided for further use of the data. Data users are urged to contact the data provider if further clarification is needed.
The diverse set of in situ apparent and inherent optical property data are stored and provided free of charge at the PANGAEA data archive and publisher for Earth and Environmental Science. Data are available as Microsoft Excel (.xlsx) files. The primary link for accessing the data is https://doi.org/10.1594/PANGAEA.902230 (Casey et al., 2019). Individual variable files are stored and available via interactive HTML download as well as tab-delimited download.
We have compiled aquatic data from a variety of inland, coastal, estuary, and open-ocean equatorial, midlatitude and high-latitude locations. This compilation of aquatic data is a first step in achieving a global distribution of high spectral resolution IOP and AOP data, which we encourage the community to use for aquatic remote sensing algorithm development and related activities. We recommend further in situ campaigns be commissioned to collect coincident high spectral resolution IOP and AOP data over regions with limited current coverage, for example, high-latitude, inland, and polar waters. Such data could also be collected via and in conjunction with upcoming airborne high spectral resolution remote sensing campaigns. Additional in situ data collection over gap areas would be helpful in development, calibration, and validation of global algorithms.
As additional high spectral resolution IOP–AOP data become available, this dataset can be expanded accordingly. A comprehensive collection of hyperspectral IOP–AOP datasets would be extremely useful for both development of aquatic remote sensing algorithms and for the planning of future field sampling missions to address identified gaps. Future expansion of this collection of datasets, beyond addition of optical data, could be the inclusion of biogeochemical information (e.g., phytoplankton pigments, carbon stocks, turbidity, particulate size distribution, and phytoplankton composition) to further assist in development of algorithms relating to biogeochemical parameters. It is crucial to collect coincident high spectral resolution IOP and AOP remote sensing data for the development of robust algorithms. These data, algorithms, and scientific investigations can improve our understanding of Earth system biogeochemical, ecological, and physical processes on local to global scales.
The initial concept for this effort originated in NASA PACE mission early science project discussions with a goal of providing the community with diverse aquatic high spectral resolution datasets. CR and EB sent initial community requests for in situ aquatic data contributions. KC gathered and stewarded the data organization effort. KC led preparation, writing of the manuscript, and generation of figures and tables. All data providers assisted in writing the methods of their data collection. All co-authors contributed to the scientific discussion, review, and editing of the manuscript.
The authors declare that they have no conflict of interest.
This article has been subjected to review by the ORD National Exposure Research Laboratory and approved for publication. Mention of trade names or commercial products does not constitute endorsement or recommendation for use. The views expressed in this article are those of the authors and do not necessarily reflect the views or policies of the US Government.
Collection of in situ aquatic data is a significant time- and cost-intensive effort. We gratefully acknowledge all data contributors, personnel, and agencies involved in support of data collection, processing, and provision. Emmanuel Boss and Alison P. Chase specifically acknowledge assistance by the Tara Oceans Consortium coordinators, crew, and expedition participants. We also specifically acknowledge the BIOSOPE project, led by Hervé Claustre and funded by the Centre National de la Recherche Scientifique (CNRS), the Institut des Sciences de l'Univers (INSU), the Centre National d'Etudes Spatiales (CNES), the European Space Agency (ESA), the National Aeronautics and Space Administration (NASA), and the Natural Sciences and Engineering Research Council of Canada (NSERC) for the successful cooperative campaign efforts. We thank Shankar N. Ramaseri Chandra of KBR, contractor to the U.S. Geological Survey Earth Resources Observation and Science Center for assistance with Figs. 1 and 2.
Kimberly A. Casey and Cecile S. Rousseaux were supported by the NASA PACE Project NNX15AE81G. Emmanuel Boss and Alison P. Chase's data collection, processing, and analysis was supported by NASA grants NNX11AQ14G, NNX09AU43G, NNX15AC08G, NNX13AC42G, and NNX13AE58G. Susanne E. Craig's data collection was supported by the U.S. Office of Naval Research, the NSERC Research Partnerships with Satlantic Inc., the Discovery Grants programme, the Government Related Initiatives Program of the Canadian Space Agency, and Fisheries and Oceans Canada. Colleen B. Mouw's data collection was supported by NASA grant NNX14AB80G. The collection, processing, and analysis of data submitted by Dariusz Stramski and Rick A. Reynolds was supported by NASA grants NNG04GO02G, NNX09AK17G, NNX15AC55G, and NNX15AQ53G and ONR grant N000014-09-1-1053. Blake Schaeffer, involved in the Florida Estuaries project, was funded by NASA grant NNH08ZDA001-DECISIONS to the U.S. EPA Gulf Ecology Division, the USEPA Office of Research and Development, and an EPA Pathfinder Innovation Grant.
This paper was edited by Jens Klump and reviewed by two anonymous referees.
Allali, K., Bricaud, A., and Claustre, H.: Spatial variations in the chlorophyll-specific absorption coefficients of phytoplankton and photosynthetically active pigments in the equatorial Pacific, J. Geophys. Res., 102, 12413–12423, https://doi.org/10.1029/97JC00380, 1997.
Astuti, I. S., Mishra, D. R., Mishra, S., and Schaeffer, B.: Spatio-temporal dynamics of inherent optical properties in oligotrophic northern Gulf of Mexico estuaries, Cont. Shelf Res., 166, 92–107, https://doi.org/10.1016/j.csr.2018.06.016, 2018.
Bell, T. W., Cavanaugh, K. C., and Siegel, D. A.: Remote monitoring of giant kelp biomass and physiological condition: An evaluation of the potential for the Hyperspectral Infrared Imager (HyspIRI) mission, Remote Sens. Environ., 167, 218–228, https://doi.org/10.1016/j.rse.2015.05.003, 2015.
Bricaud, A. and Stramski, D.: Spectral absorption coefficients of living phytoplankton and nonalgal biogenous matter: A comparison between the Peru upwelling area and the Sargasso Sea, Limnol. Oceanogr., 35, 562–582, https://doi.org/10.4319/lo.1990.35.3.0562, 1990.
Bricaud, A., Babin, M., Claustre, H., Ras, J., and Tièche, F.: Light absorption properties and absorption budget of Southeast Pacific waters, J. Geophys. Res., 115, C08009, https://doi.org/10.1029/2009JC005517, 2010.
Boss, E., Picheral, M., Leeuw, T., Chase, A., Karsenti, E., Gorsky, G., Taylor, L., Slade, W., Ras, J., and Claustre, H.: The characteristics of particulate absorption, scattering and attenuation coefficients in the surface ocean; Contribution of the Tara Oceans expedition, Methods Oceanogr., 7, 52–62, https://doi.org/10.1016/j.mio.2013.11.002, 2013.
Carder, K. L. and Steward, R. G.: A remote-sensing reflectance model of a red-tide dinoflagellate off west Florida, Limnol. Oceanogr., 30, 286–298, 1985.
Casey, K. A., Rousseaux, C. S., Gregg, W. W., Boss, E., Chase, A. P., Craig, S. E., Mouw, C. B., Reynolds, R. A., Stramski, D., Ackleson, S. G., Bricaud, A., Schaeffer, B., Lewis, M. R., and Maritorena, S.: In situ high spectral resolution inherent and apparent optical property data from diverse aquatic environments, PANGAEA, https://doi.org/10.1594/PANGAEA.902230, 2019.
Chase, A. P., Boss, E., Cetinić, I., and Slade, W.: Estimation of phytoplankton accessory pigments from hyperspectral reflectance spectra: toward a global algorithm, J. Geophys. Res.-Oceans, 122, 9725–9743, https://doi.org/10.1002/2017JC012859, 2017.
Claustre, H., Sciandra, A., and Vaulot, D.: Introduction to the special section bio-optical and biogeochemical conditions in the South East Pacific in late 2004: the BIOSOPE program, Biogeosciences, 5, 679–691, https://doi.org/10.5194/bg-5-679-2008, 2008.
Conmy, R. N., Schaeffer, B. A., Schubauer-Berigan, J., Aukamp, J., Duffy, A., Lehrter, J. C., and Greene, R. M.: Characterizing light attenuation within northwest Florida estuaries: Implications for RESTORE Act water quality monitoring, Mar. Pollut. Bull., 114, 995–1006, https://doi.org/10.1016/j.marpolbul.2016.11.030, 2017.
Corson, M. R. and Davis, C. O.: A new view of coastal oceans from the space station, Eos, 92, 161–162, https://doi.org/10.1029/2011EO190001, 2011.
Craig, S. E.: Spectral measurements of absorption, scattering and in vivofluorescence from phytoplankton cultures, Department of Physics and Applied Physics, University of Strathclyde, Glasgow, 228 pp., 1999.
Craig, S. E., Jones, C. T., Li, W. K. W., Lazin, G., Horne, E., Caverhill, C., and Cullen, J. J.: Deriving optical metrics of coastal phytoplankton biomass from ocean colour, Remote Sens. Environ., 119, 72–83, https://doi.org/10.1016/j.rse.2011.12.007, 2012.
Dall'Olmo, G., Westberry, T. K., Behrenfeld, M. J., Boss, E., and Slade, W. H.: Significant contribution of large particles to optical backscattering in the open ocean, Biogeosciences, 6, 947–967, https://doi.org/10.5194/bg-6-947-2009, 2009.
Del Castillo, C. E., Signorini, S. R., Karaköylü, E. M., and Rivero-Calle, S.: Is the Southern Ocean Getting Greener?, Geophys. Res. Lett., 46, 6034–6040, https://doi.org/10.1029/2019GL083163, 2019.
Devred, E., Turpie, K. R., Moses, W., Klemas, V. V., Moisan, T., Babin, M., Toro-Farmer, G., Forget, M.-H., and Jo, Y.-H.: Future retrievals of water column bio-optical properties using the Hyperspectral Infrared Imager (HyspIRI), Remote Sens.-Basel, 5, 6812–6837, https://doi.org/10.3390/rs5126812, 2013.
Dierssen, H. M., Chlus, A., and Russell, B.: Hyperspectral discrimination of floating mats of seagrass wrack and the macroalgae Sargassum in coastal waters of Greater Florida Bay using airborne remote sensing, Remote Sens. Environ., 167, 247–258, https://doi.org/10.1016/j.rse.2015.01.027, 2015.
Dutkiewicz, S., Hickman, A. E., Jahn, O., Henson, S., Beaulieu, C., and Monier, E.: Ocean colour signature of climate change, Nat. Commun., 10, 578, https://doi.org/10.1038/s41467-019-08457-x, 2019.
Freeman, L. A., Ackleson, S. G., and Rhea, W. J.: Comparison of remote sensing algorithms for retrieval of suspended particulate matter concentration from reflectance in coastal waters, J. Appl. Remote Sens., 11, 4, 046028, https://doi.org/10.1117/1.JRS.11.046028, 2017.
Gould Jr., R. W., Arnone, R. A., and Sydor, M.: Absorption, scattering, and remote-sensing reflectance relationships in coastal waters: Testing a new inversion algorithm, J. Coastal Res., 17, 328–341, 2001.
Gordon, H. R., Lewis, M. R., McLean, S. D., Twardowski, M. S., Freeman, S. A., Voss, K. J., and Boynton, G. C.: Spectra of particulate backscattering in natural waters, Opt. Express, 17, 16192–16208, 2009.
Hu, C., Feng, L., Hardy, R. F., and Hochberg, E. J.: Spectral and spatial requirements of remote sensing measurements of pelagic Sargassum macroalgae, Remote Sens. Environ., 167, 229–246, https://doi.org/10.1016/j.rse.2015.05.022, 2015.
Hu, C., Lee, Z., and Franz, B.: Chlorophyll a algorithms for oligotrophic oceans: A novel approach based on three-band reflectance difference, J. Geophys. Res., 117, C01011, https://doi.org/10.1029/2011JC007395, 2012.
Keith, D. J., Schaeffer, B. A., Lunetta, R. S., Gould, R. W., Rocha, K., and Cobb, D. J.: Remote sensing of selected water-quality indicators with the hyperspectral imager for the coastal ocean (HICO) sensor, Int. J. Remote Sens., 35, 2927–2962, https://doi.org/10.1080/01431161.2014.894663, 2014.
Keith, D. J., Lunetta, R. S., and Schaeffer, B. A.: Optical models for remote sensing of colored dissolved organic matter absorption and salinity in New England, Middle Atlantic and Gulf Coast Estuaries USA, Remote Sens.-Basel, 8, 283, https://doi.org/10.3390/rs8040283, 2016.
Kim, G. E., Gnanadesikan, A., Del Castillo, C. E., and Pradal, M.-A.: Upper ocean cooling in a coupled climate model due to light attenuation by yellowing materials, Geophys. Res. Lett., 45, 6134–6140, https://doi.org/10.1029/2018GL077297, 2018.
Kishino, M., Takahashi, M., Okami, N., and Ichimura, S.: Estimation of the spectral absorption coefficients of phytoplankton in the sea, B. Mar. Sci., 37, 634–642, 1985.
Krutz, D., Müller, R., Knodt, U., Günther, B., Walter, I., Sebastian, I., Säuberlich, T., Reulke, R., Carmona, E., Eckardt, A., Venus, H., Fischer, C., Zender, B., Arloth, S., Lieder, M., Neidhardt, M., Grote, U., Schrandt, F., Gelmi, S., and Wojtkowiak, A.: The Instrument Design of the DLR Earth Sensing Imaging Spectrometer (DESIS), Sensors, 19, 1622, https://doi.org/10.3390/s19071622, 2019.
Le, C., Lehrter, J. C., Hu, C., Schaeffer, B. A., MacIntyre, H., Hagy, J. D., and Beddick, D. L.: Relation between inherent optical properties and land use and land cover across Gulf Coast estuaries, Limnol. Oceanogr., 60, 920–933, https://doi.org/10.1002/lno.10065, 2015.
Le, C., Lehrter, J. C., Schaeffer, B. A., Hu, C., Murrell, M. C., Hagy, J. D., Greene, R. M., and Beck, M.: Bio-optical water quality dynamics observed from MERIS in Pensacola Bay, Florida, Estuar. Coast. Shelf S., 173, 26–38, https://doi.org/10.1016/j.ecss.2016.02.003, 2016.
Lee, Z., Shang, S., Hu, C., Lewis, M., Arnone, R., Li, Y., and Lubac, B.: Time series of bio-optical properties in a subtropical gyre: Implications for the evaluation of interannual trends of biogeochemical properties, J. Geophys. Res.-Oceans, 115, C09012, https://doi.org/10.1029/2009JC005865, 2010.
Lin, J., Lee, Z., Ondrusek, M., and Liu, X.: Hyperspectral absorption and backscattering coefficients of bulk water retrieved from a combination of remote-sensing reflectance and attenuation coefficient, Opt. Express, 26, A157–A177, https://doi.org/10.1364/OE.26.00A157, 2018.
Lohrenz, S. E.: A novel theoretical approach to correct for pathlength amplification and variable sampling loading in measurements of particulate spectral absorption by the quantitative filter technique, J. Plankton Res., 22, 639–657, https://doi.org/10.1093/plankt/22.4.639, 2000.
Lohrenz, S. E., Weidemann, A. D., and Tuel, M.: Phytoplankton spectral absorption as influenced by community size structure and pigment composition, J. Plankton Res., 25, 35–61, https://doi.org/10.1093/plankt/25.1.35, 2003.
Loisel, H., Stramski, D., Dessaily, D., Jamet, C., Li, L., and Reynolds, R. A.: An inverse model for estimating the optical absorption and backscattering coefficients of seawater from remote-sensing reflectance over a broad range of oceanic and coastal marine environments, J. Geophys. Res.-Oceans, 123, 2141–2171, https://doi.org/10.1002/2017JC013632, 2018.
Matsuoka, A., Boss, E., Babin, M., Karp-Boss, L., Hafez, M., Chekalyuk, A., Proctor, C. W., Werdell, P. J., and Bricaud, A.: Pan-Arctic optical characteristics of colored dissolved organic matter: Tracing dissolved organic carbon in changing Arctic waters using satellite ocean color data, Remote Sens. Environ., 200, 89–101, 2017.
McClain, C. R.: A decade of satellite ocean color observations, Annu. Rev. Mar. Sci., 1, 19–42, https://doi.org/10.1146/annurev.marine.010908.163650, 2009.
Mishra, D., Schaeffer, B. A., and Keith, D.: Performance evaluation of normalized difference chlorophyll index in northern Gulf of Mexico estuaries using the Hyperspectral Imager for the Coastal Ocean, GISci Remote Sens., 51, 175–198, https://doi.org/10.1080/15481603.2014.895581, 2014.
Mobley, C. D.: Estimation of the remote-sensing reflectance from above-surface measurements, Appl. Optics, 38, 7442–7455, https://doi.org/10.1364/AO.38.007442, 1999.
Mobley, C. D. and Stramski, D.: Origins of variability in remote-sensing reflectance. Final Report, Sequoia Scientific, Redmond, WA, 1997.
Mouw, C. B., Greb, S., Aurin, D., DiGiacomo, P. M., Lee, Z., Twardowski, M., Binding, C., Hu, C., Ma, R., Moore, T., Moses, W., and Craig, S. E.: Aquatic color radiometry remote sensing of coastal and inland waters: Challenges and recommendations for future satellite missions, Remote Sens. Environ., 160, 15–30, https://doi.org/10.1016/j.rse.2015.02.001, 2015.
Mouw, C. B., Ciochetto, A. B., Grunert, B., and Yu, A.: Expanding understanding of optical variability in Lake Superior with a 4-year dataset, Earth Syst. Sci. Data, 9, 497–509, https://doi.org/10.5194/essd-9-497-2017, 2017.
Mueller, J. L., Morel, A., Frouin, R., Davis, C., Arnone, R., Carder, K., Lee, Z. P., Steward, R. G., Hooker, S. B., Mobley, C. D., McLean, S., Holben, B., Miller, M., Pietras, C., Knobelspiesse, K. D., Fargion, G. S., Porter, J., and Voss, K. J.: Radiometric measurements and data analysis protocols, in: Ocean optics protocols for satellite ocean colour sensor validation, edited by: Mueller, J. L., Fargion, G. S., and McClain, C. R., Revision 4, Volume IV, Greenbelt, MD: NASA, Goddard Space Flight Center, NASA/TM-2003-211621, 84 pp., 2003.
NASA Goddard Space Flight Center, Ocean Biology Processing Group, Sea-viewing Wide Field-of-view Sensor (SeaWiFS) Ocean Color Data, NASA OB.DAAC, https://doi.org/10.5067/ORBVIEW-2/SEAWIFS_OC.2014.0, 2014.
National Academies of Sciences, Engineering, and Medicine, Thriving on Our Changing Planet: A Decadal Strategy for Earth Observation from Space, Washington, DC, The National Academies Press, https://doi.org/10.17226/24938, 2018.
Neukermans, G., Reynolds, R. A., and Stramski, D.: Optical classification and characterization of marine particle assemblages within the western Arctic Ocean, Limnol. Oceanogr., 61, 1472–1494, https://doi.org/10.1002/lno.10316, 2016.
O'Reilly, J. E. and Werdell, P. J.: Chlorophyll algorithms for ocean color sensors – OC4, OC5 & OC6, Remote Sens. Environ., 229, 32–47, https://doi.org/10.1016/j.rse.2019.04.021, 2019.
O'Reilly, J. E., Maritorena, S., Mitchell, B. G., Siegel, D. A., Carder, K. L., Garver, S. A., Kahru, M., and McClain, C.: Ocean color chlorophyll algorithms for SeaWiFS, J. Geophys. Res., 103, C11, 24937–24953, https://doi.org/10.1029/98JC02160, 1998.
Pahlevan, N., Chittimalli, S. K., Balasubramanian, S. V., and Vellucci, V.: Sentinel-2/Landsat-8 product consistency and implications for monitoring aquatic systems, Remote Sens. Environ., 220, 19–29, https://doi.org/10.1016/j.rse.2018.10.027, 2019.
Pegau, S., Zaneveld, J. R. V., Mitchell, B. G., Mueller, J. L., Kahru, M., Wieland, J., and Stramska, M.: Inherent Optical Properties: Instruments, Characterizations, Field Measurements and Data Analysis Protocols, in: Ocean optics protocols for satellite ocean colour sensor validation, edited by: Mueller, J. L., Fargion, G. S., and McClain, C. R., Revision 4, Volume IV, Greenbelt, MD: NASA, Goddard Space Flight Center, NASA/TM-2003-211621, 84 pp., 2003.
Röttgers, R. and Doerffer, R.: Measurements of optical absorption by chromophoric dissolved organic matter using a point-source integrating cavity absorption meter, Limnol. Oceanogr.-Meth., 5, 126–135, 2007.
Schaeffer, B. A., Conmy, R. N., Duffy, A., Aukamp, J., Yates, D., and Craven, G., Northern Gulf of Mexico estuarine colored dissolved organic matter derived from MODIS data, Int. J. Remote Sens., 36, 2219–2237, 2015.
Shibata, K.: Spectrophotometry of translucent biological materials – opal glass transmission method, in: Methods of Biochemical Analysis, edited by: Glick, D., Interscience Publishers Inc., New York, 1959.
Slade, W. H., Boss, E., Dall'olmo, G., Langner, M. R., Loftin, J., Behrenfeld, M. J., Roesler, C., and Westberry, T. K.: Underway and moored methods for improving accuracy in measurement of spectral particulate absorption and attenuation, J. Atmos. Ocean. Tech., 27, 1733–1746, https://doi.org/10.1175/2010JTECHO755.1, 2010.
Stockley, N. D., Röttgers, R., McKee, D., Lefering, I., Sullivan, J. M., and Twardowski, M. S.: Assessing uncertainties in scattering correction algorithms for reflective tube absorption measurements made with a WET Labs ac-9, Opt. Express, 25, A1139–A1153, https://doi.org/10.1364/OE.25.0A1139, 2017.
Stramski, D., Reynolds, R. A., Babin, M., Kaczmarek, S., Lewis, M. R., Röttgers, R., Sciandra, A., Stramska, M., Twardowski, M. S., Franz, B. A., and Claustre, H.: Relationships between the surface concentration of particulate organic carbon and optical properties in the eastern South Pacific and eastern Atlantic Oceans, Biogeosciences, 5, 171–201, https://doi.org/10.5194/bg-5-171-2008, 2008.
Stramski, D., Reynolds, R. A., Kaczmarek, S., Uitz, J., and Zheng, G.: Correction of pathlength amplification in the filter-pad technique for measurements of particulate absorption coefficient in the visible spectral region, Appl. Optics, 54, 6763–6782, https://doi.org/10.1364/AO.54.006763, 2015.
Tassan, S. and Ferrari, G. M.: An alternative approach to absorption measurements of aquatic particles retained on filters, Limnol. Oceanogr., 40, 8, 1358–1368, 1995.
Torrecilla, E., Stramski, D., Reynolds, R. A., Millan-Núñez, E., and Pierra, J.: Cluster analysis of hyperspectral optical data for discriminating phytoplankton pigment assemblages in the open ocean, Remote Sens. Environ., 115, 2578–2593, https://doi.org/10.1016/j.rse.2011.05.014, 2011.
Uitz, J., Stramski, D., Reynolds, R. A., and Dubranna, J.: Assessing phytoplankton community composition from hyperspectral measurements of phytoplankton absorption coefficient and remote-sensing reflectance in open-ocean environments, Remote Sens. Environ., 171, 58–74, https://doi.org/10.1016/j.rse.2015.09.027, 2015.
Valente, A., Sathyendranath, S., Brotas, V., Groom, S., Grant, M., Taberner, M., Antoine, D., Arnone, R., Balch, W. M., Barker, K., Barlow, R., Bélanger, S., Berthon, J.-F., Beşiktepe, Ş., Borsheim, Y., Bracher, A., Brando, V., Canuti, E., Chavez, F., Cianca, A., Claustre, H., Clementson, L., Crout, R., Frouin, R., García-Soto, C., Gibb, S. W., Gould, R., Hooker, S. B., Kahru, M., Kampel, M., Klein, H., Kratzer, S., Kudela, R., Ledesma, J., Loisel, H., Matrai, P., McKee, D., Mitchell, B. G., Moisan, T., Muller-Karger, F., O'Dowd, L., Ondrusek, M., Platt, T., Poulton, A. J., Repecaud, M., Schroeder, T., Smyth, T., Smythe-Wright, D., Sosik, H. M., Twardowski, M., Vellucci, V., Voss, K., Werdell, J., Wernand, M., Wright, S., and Zibordi, G.: A compilation of global bio-optical in situ data for ocean-colour satellite applications – version two, Earth Syst. Sci. Data, 11, 1037–1068, https://doi.org/10.5194/essd-11-1037-2019, 2019.
Vandermeulen, R.A., Mannino, A., Neeley, A., Werdell, J., and Arnone, R.: Determining the optimal spectral sampling frequency and uncertainty thresholds for hyperspectral remote sensing of ocean color, Opt. Express, 25, A785–A797, https://doi.org/10.1364/OE.25.00A785, 2017.
Wang, G., Lee, Z., Mishra, D. R., and Ma, R.: Retrieving absorption coefficients of multiple phytoplankton pigments from hyperspectral remote sensing reflectance measured over cyanobacteria bloom waters, Limnol. Oceanogr.-Meth., 14, 432–447, https://doi.org/10.1002/lom3.10102, 2016.
Werdell, P. J. and Bailey, S. W.: The SeaWiFS Bio-optical Archive and Storage System (SeaBASS): Current architecture and implementation, NASA Tech. Memo. 2002-211617, edited by: Fargion, G. S. and McClain, C. R., NASA Goddard Space Flight Center, Greenbelt, Maryland, 45 pp., 2002.
Werdell, P. J. and Bailey, S. W.: An improved in-situ bio-optical data set for ocean color algorithm development and satellite data product validation, Remote Sens. Environ., 98, 122–140, https://doi.org/10.1016/j.rse.2005.07.001, 2005.
Werdell, P. J., McKinna, L. I. W., Boss, E., Ackleson, S. G., Craig, S. E., Gregg, W. W., Lee, Z., Maritorena, S., Roesler, C. S., Rousseaux, C. S., Stramski, D., Sullivan, J. M., Twardowski, M. S., Tzortziou, M., and Zhang, X.: An overview of approaches and challenges for retrieving marine inherent optical properties from ocean color remote sensing, Prog. Oceanogr., 160, 186–212, https://doi.org/10.1016/j.pocean.2018.01.001, 2018.
Werdell, P. J., Behrenfeld, M. J., Bontempi, P. S., Boss, E., Cairns, B., Davis, G. T., Franz, B. A., Gliese, U. B., Gorman, E. T., Hasekamp, O., Knobelspiesse, K. D., Mannino, A., Martins, J. V., McClain, C. R., Meister, G., and Remer, L. A.: The Plankton, Aerosol, Cloud, Ocean Ecosystem Mission: Status, Science, Advances, B. Am. Meteorol. Soc., 100, 1775–1794, https://doi.org/10.1175/BAMS-D-18-0056.1, 2019.
Zheng, G., Stramski, D., and Reynolds, R. A.: Evaluation of the Quasi-Analytical Algorithm for estimating the inherent optical properties of seawater from ocean color: Comparison of Arctic and lower-latitude waters, Remote Sens. Environ., 155, 194–209, https://doi.org/10.1016/j.rse.2014.08.020, 2014.