the Creative Commons Attribution 4.0 License.
the Creative Commons Attribution 4.0 License.
Data for wetlandscapes and their changes around the world
Navid Ghajarnia
Georgia Destouni
Josefin Thorslund
Zahra Kalantari
Imenne Åhlén
Jesús A. Anaya-Acevedo
Juan F. Blanco-Libreros
Sonia Borja
Sergey Chalov
Aleksandra Chalova
Kwok P. Chun
Nicola Clerici
Amanda Desormeaux
Bethany B. Garfield
Pierre Girard
Olga Gorelits
Amy Hansen
Fernando Jaramillo
Jerker Jarsjö
Adnane Labbaci
John Livsey
Giorgos Maneas
Kathryn McCurley Pisarello
Sebastián Palomino-Ángel
Jan Pietroń
René M. Price
Victor H. Rivera-Monroy
Jorge Salgado
A. Britta K. Sannel
Samaneh Seifollahi-Aghmiuni
Ylva Sjöberg
Pavel Terskii
Guillaume Vigouroux
Lucia Licero-Villanueva
David Zamora
Geography and associated hydrological, hydroclimate and land-use conditions and their changes determine the states and dynamics of wetlands and their ecosystem services. The influences of these controls are not limited to just the local scale of each individual wetland but extend over larger landscape areas that integrate multiple wetlands and their total hydrological catchment – the wetlandscape. However, the data and knowledge of conditions and changes over entire wetlandscapes are still scarce, limiting the capacity to accurately understand and manage critical wetland ecosystems and their services under global change. We present a new Wetlandscape Change Information Database (WetCID), consisting of geographic, hydrological, hydroclimate and land-use information and data for 27 wetlandscapes around the world. This combines survey-based local information with geographic shapefiles and gridded datasets of large-scale hydroclimate and land-use conditions and their changes over whole wetlandscapes. Temporally, WetCID contains 30-year time series of data for mean monthly precipitation and temperature and annual land-use conditions. The survey-based site information includes local knowledge on the wetlands, hydrology, hydroclimate and land uses within each wetlandscape and on the availability and accessibility of associated local data. This novel database (available through PANGAEA https://doi.org/10.1594/PANGAEA.907398; Ghajarnia et al., 2019) can support site assessments; cross-regional comparisons; and scenario analyses of the roles and impacts of land use, hydroclimatic and wetland conditions, and changes in whole-wetlandscape functions and ecosystem services.
- Article
(4536 KB) - Full-text XML
- BibTeX
- EndNote
Wetlands contribute more than 20 % of the total value of global ecosystem services (Costanza et al., 2014), while covering only a small percentage (4 %–9 %) of global land surface (Morganti et al., 2019; Zedler and Kercher, 2005; Mitsch and Gosselink, 2000). Wetlands are associated with a diverse range of functions, such as water quality remediation (e.g., Chalov et al., 2017; Quin et al., 2015), regulation of soil moisture and groundwater replenishment (e.g., Ameli and Creed, 2019; Golden et al., 2017), flood control (e.g., Quin and Destouni, 2018; Acreman and Holden, 2013), and biodiversity conservation (e.g., Cohen et al., 2016; Mitchell et al., 2008). Through these functions, wetlands can support regional sustainability (Seifollahi-Aghmiuni et al., 2019) but are also one of the most vulnerable ecosystems globally (Golden et al., 2017). For instance, human land and/or water use developments (Destouni et al., 2013; Jaramillo and Destouni, 2015; Maneas et al., 2019) in combination with climate variability and change (Orth and Destouni, 2018; Seneviratne et al., 2006) affect large-scale water fluxes, with impacts on wetland functions and ecosystem services. These impacts extend over coupled systems of multiple wetlands and the associated total hydrological catchment that integrates these, referred to as a wetlandscape (Thorslund et al., 2017), with even well-intended actions towards various sustainable development goals potentially affecting wetland functions and services in different directions (Jaramillo et al., 2019). As a consequence of various change impacts, wetland areas are now suffering rapid and continued decline in different regions worldwide (Davidson et al., 2018; Davidson, 2014).
The scale mismatch between the existing large-scale studies of various landscape changes and the still mostly local wetland impact studies (Thorslund et al., 2017) creates an urgent need for comprehensive, science-based assessment of the interactions between large-scale drivers of change and large-scale wetland systems (Ameli and Creed, 2019; Creed et al., 2017). Adopting a wetlandscape perspective involves moving away from the individual wetland scale to consider the large-scale functioning of the hydrologically coupled system of multiple wetlands and their surrounding landscape. Assessments at these larger scales are needed to enable the formulation of scientific evidence-based guidance and strategies to protect wetlands under global change (Thorslund et al., 2018; Ameli and Creed, 2019). The conceptual framework on wetlandscapes was developed over 30 years ago, by Preston and Bedford (1988), but the dynamics and impacts of many large-scale drivers or functions at wetlandscape scales remain still largely uninvestigated and unknown, with the interactions between large-scale hydroclimatic variability and change and wetland dynamics still being largely underexplored at the wetlandscape scale (Thorslund et al., 2017). The combination of high wetland vulnerability and rapid large-scale changes subject to major knowledge and data gaps highlights the need to synthesize and create datasets available for evaluating change effects and feedbacks at the scales of whole wetlandscapes.
To address this need and support large-scale studies of whole wetlandscapes in and across different parts of the world, we have created a novel database, named the Wetlandscape Change Information Database (WetCID), for 27 wetlandscapes around the world and their associated geographical, wetland, hydrology, hydroclimate and land-use conditions. WetCID consists of a survey-based collection of local information and data, combined with compilation and synthesis of gridded large-scale datasets for a range of relevant hydroclimatic and land-use variables.
The remainder of this paper is structured as follows: in Sect. 2, we describe the methodology used in collecting, processing and summarizing different datasets. In Sect. 3, we present WetCID summaries and sample figures and maps from different components of the underlying datasets in order to exemplify and highlight the potential of new insights that can be gained from using this database as well as its limitations. In Sect. 4, we discuss data availability and the format and structure of different files in WetCID. Based on the findings, we present some conclusions in Sect. 5.
2.1 Data acquisition
In compilation of WetCID for the 27 wetlandscapes, we employed three sources of primary data. These were (1) local site survey data, depicting general characteristics of each wetlandscape (catchment) and its geographical characteristics (including shapefiles for its spatial extent) and associated hydrological, climate and land-use conditions and their observed or perceived changes; (2) gridded historical data time series of monthly precipitation and temperature from Climate Research Unit Time-Series version 4.02 (CRU_TS4.02; Harris et al., 2014); and (3) historical data of annual land cover and its changes from the NOAA-HYDE dataset provided by the NOAA's National Climate Data Center (Jain et al., 2013; Meiyappan and Jain, 2012).
The survey for local site data was given to researchers within the Global Wetland Ecohydrological Network (GWEN) (http://www.gwennetwork.se/, last access: 9 May 2020). The GWEN researchers responding to the survey specified the relevant wetlandscape extent (total hydrological catchment with wetlands) and provided boundaries in GIS format for the 27 wetlandscapes, located as shown in Fig. 1. Information and data of all three types (local survey-based, hydroclimate, land use) were collected and synthesized for each of these wetlandscapes from all three sources (1–3). In addition to the local survey information, data on hydroclimate and land-use variables were thus also compiled from the global datasets in both gridded and aggregated form for each wetlandscape, as described further in the following.
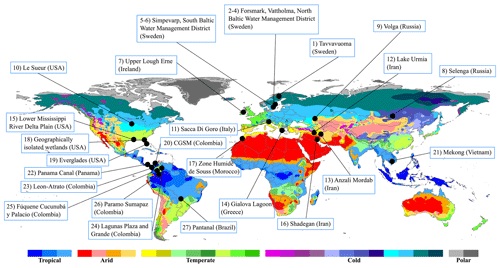
Figure 1Geographical distribution of the 27 wetlandscape sites included in WetCID. The background map shows the Köppen–Geiger climate classification system (updated by Peel et al., 2007), with the number of wetlandscapes extended from those included in similar GWEN-site mapping by Thorslund et al. (2017). The site numbering is in order of latitude from north to south, covering a latitude range from 70∘ N to 25∘ S.
2.2 Site information surveys
A questionnaire for collecting local site knowledge and information on the availability and accessibility of local data was developed during a GWEN workshop held in Santa Marta, Colombia, on 24–28 April 2018. The questionnaire was sent out by email after the workshop to all participating GWEN researchers. The researchers responding to it related their answers to a specific wetlandscape in which they had active research.
The questionnaire comprised two main parts. Part 1 contained general questions about the geography, climate, hydrology, and wetland-relevant human activities and changes in the wetlandscapes. Part 2 focused on the availability and accessibility of local site data, structured into “Hydroclimate”, “Land use” and “Other” data (see templates in the database files for a full outline of the questionnaire). The collective knowledge obtained on conditions and changes in the 27 wetlandscapes and on data availability–accessibility is summarized in Sect. 3.1.
To complement this local knowledge and information basis, we further extracted and synthesized data for the 27 wetlandscapes from relevant global hydroclimate and land-use datasets as described below.
2.3 Hydroclimate data
The temperature and precipitation data taken from the CRU_TS4.02 global datasets (Harris et al., 2014) covered a 30-year period (1981–2010), to be consistent with the time span of existing global land-use change data. CRU_TS4.02 provides hydroclimate data with spatial resolution of and at a monthly temporal scale. In preparing temperature and precipitation datasets for each wetlandscape, the gridded data within the area of the wetlandscape were extracted from the global datasets and also spatially aggregated over that area, based on area-weighted averaging over the grid cells covered by the shapefile of each wetlandscape (catchment). This provided wetlandscape-specific data time series for each variable at each grid cell and aggregated over the whole wetlandscape. To facilitate analyses at different spatial resolutions, both the gridded and the aggregated time series were included in WetCID for each of the 27 wetlandscapes.
In addition to the gridded and aggregated data time series, period-specific temperature and precipitation changes were also calculated for each wetlandscape by dividing the total 30-year time span of the collected data into the two 15-year periods, 1981–1995 (Per1) and 1996–2010 (Per2). Such period-specific change quantification can facilitate relatively simple and straightforward analysis of how these hydroclimatic changes correlate with and may have driven other wetlandscape changes (e.g., in runoff, evapotranspiration, wetland area) between the same time periods (Destouni et al., 2013; Jaramillo and Destouni, 2014, 2015). Absolute and relative (%) changes between these periods (AbsChng and RelChng, respectively) were calculated from the mean annual values of temperature and precipitation during Per1 and Per2 as
where and are average temperature (in C∘) or precipitation (in mm yr−1) over Per1 (1981–1995) and Per2 (1996–2010), respectively. Equation (1) was applied to both temperature and precipitation data to calculate their absolute changes in each wetlandscape, while Eq. (2) was only applied to precipitation data to calculate the corresponding percentage change in precipitation.
2.4 Land-use data
The NOAA-HYDE dataset was used to estimate land uses and their changes in each wetlandscape. NOAA-HYDE estimates annual changes in land-cover area over the global land mass, starting from a base map for the year 1765. The estimations follow a predefined pathway, determined by relevant land-use and management datasets (cropland, pastureland, urbanization, timber harvesting), to obtain forest area distributions close to satellite-based estimates of forests in recent years (Meiyappan and Jain, 2012). NOAA-HYDE data cover the period 1770–2010 with yearly temporal resolution and spatial resolution of , from which data for the period 1981–2010 were used for the development of this database, consistent with the hydroclimate data period described above.
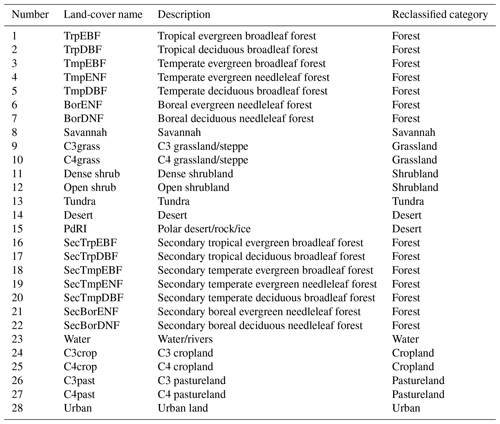
The NOAA-HYDE land-cover maps show the percentage of grid cell area containing 28 different land-cover types (see Table A1 in Appendix A). In this study, we reclassified these 28 land-cover types into 10 distinct land-cover types, namely urban, shrubland, grassland, pastureland, cropland, forest, water, desert, tundra and savannah, by combining similar land-cover classes (see Table A1). As done for the hydroclimate data, the gridded land-use data were also spatially aggregated over each wetlandscape based on the area-weighted averaging method (with weights of specific land-cover area in each grid cell relative to total wetlandscape area). This provided a wetlandscape-specific data time series of annual land use and land cover for each of the reclassified 10 land-cover types. The final WetCID files comprised gridded time series data on absolute grid cell area (in km2) covered by each land-cover type, time series data in percentage of grid cell area covered by each land-cover type, and aggregated absolute and percentage time series data for each wetlandscape area.
Analogous to the hydroclimatic changes, period-specific change quantification can facilitate relatively simple and straightforward analysis of how different types of land-use changes between time periods correlate with and may have driven associated wetlandscape changes (Destouni et al., 2013; Jaramillo and Destouni, 2015). Equation (1) was therefore also used to calculate absolute change in the area of each land-cover type (km2) within each wetlandscape between Per1 (1981–1995) and Per2 (1996–2010). In the land-use case, and represent annual average area covered by a land-cover type within each wetlandscape during Per1 and Per2, respectively. Furthermore, the corresponding change in relative land-cover area (ChngRel in % of total wetlandscape area) was calculated as
where AreaC is the total wetlandscape (catchment) area (in km2) and and are the annual average areas covered by each land-cover type in the wetlandscape during Per1 and Per2, respectively.
3.1 Site information surveys
Table 1 summarizes some general geographical, climate and wetland type information provided by GWEN researchers in the survey information forms. Each site represents either an individual wetland or a wetlandscape (e.g., a catchment) including multiple wetlands. The country, main climate zone and wetland area relative to total wetlandscape (catchment) area are also given for each site in Table 1. Moreover, a summary of the availability–accessibility of local data on the wetlands, hydrology, climate and land uses as well as the wetlandscape (catchment) area in each of the 27 wetlandscapes is also shown in Fig. 2. The variables of evapotranspiration and soil moisture were revealed as having large data gaps (red color in Fig. 2), indicating an overall need to use other data sources (e.g., gridded global data products) for quantifying these variables and associated processes. Figure 2 also highlights the variability in data availability and open accessibility among the sites. For instance, no open-access data sources have been reported for the considered variables in the arid subtropical sites 13, 16 and 17, whereas open-access data sources have been reported for most variables in the cold Swedish sites 4 and 6 and the American subtropical sites 15 and 19.
The synthesized survey dataset also contains information about different types of wetland, hydroclimatic and/or land-use changes observed or perceived to have occurred in the 27 investigated wetlandscapes (Fig. 3). Substantial changes are reported for most of these wetlandscapes, but a few sites have no known changes (e.g., in the arid Moroccan site 17) or have important knowledge gaps regarding changes (e.g., in the cold Swedish sites 2 and 5, even though availability to at least some data is relatively good there). The information on local data availability–accessibility (Fig. 2) and observed or perceived change occurrence (Fig. 3) summarized and structured in WetCID can guide further study directions and support identification of key needs for complementary new local data and/or use of additional large-scale (regional-global) gridded data. Furthermore, the wetlandscapes of WetCID are located in different regions of the world, with seven sites in northern Europe (sites 1–7), seven in the Amazon and Caribbean region (sites 20 and 23–27), four in North America (sites 10, 15, 18 and 19), three in the Middle East (sites 12, 13 and 16), two in the Mediterranean region (sites 11 and 14), two in Siberia (sites 8 and 9), and two more in other parts of the world (northern Africa and eastern Asia). As such, regional patterns and characteristics can be identified and regional strategies developed, e.g., to enhance availability of data and information and determine further research needed to bridge region-specific knowledge gaps and decide on relevant management plans for each region's wetland ecosystems. Such regional characterizations and assessments can be initialized with the current version of WetCID and further updated as more data for already-included and possible additional regional wetlandscapes become available in future database versions.
Table 1General geographic, climate and wetland type information for the 27 investigated wetlandscapes in WetCID. The data and information are based on survey responses by researchers with active research (on various topics) at each wetlandscape site.
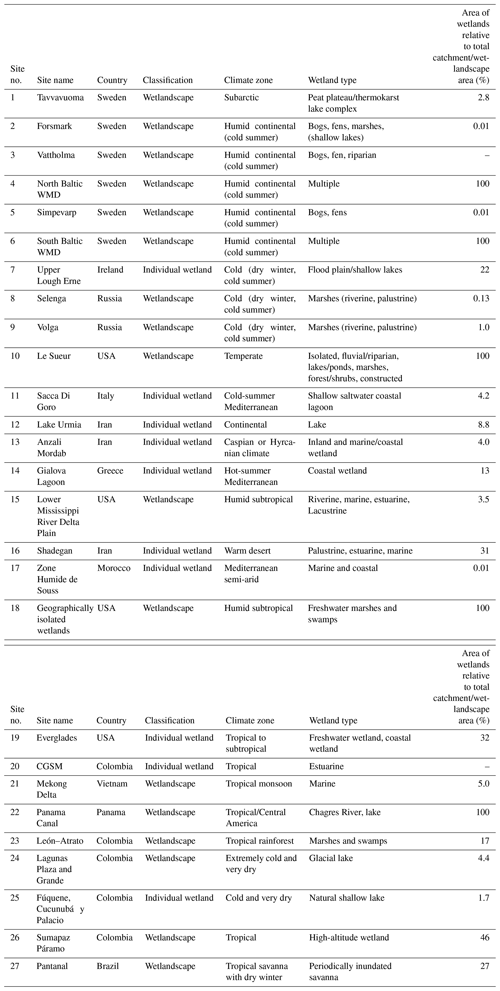
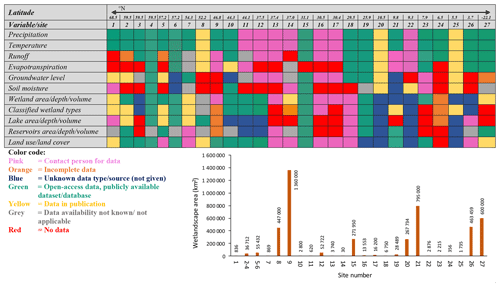
Figure 2Availability–accessibility (color-coded) of site-specific climate and land-use data for the 27 investigated wetlandscapes in WetCID and associated wetlandscape area for each site (lower right diagram). The data availability–accessibility classification (color codes) is based on the survey responses by researchers with active research (on various topics) at each wetlandscape site.
3.2 Hydroclimatic data
Data for long-term average temperature and precipitation conditions, and changes in these between Per1 (1981–1995) and Per2 (1996–2010) at the 27 wetlandscape sites, are presented in Fig. 4. The horizontal axis in the diagrams shows the wetlandscape site numbers in order of their latitude from north to south, covering the latitude range from 70∘ N to 25∘ S. The increase in average temperature and precipitation with decreasing latitude (Fig. 4a–b) illustrates that the wetlandscapes also cover a wide range of hydroclimate conditions, from low to high temperature and precipitation values (see also Fig. 1). Temperature has increased over almost all wetlandscapes and considerably more so in the more northern and colder areas than in the warmer areas around and south of the Equator (Fig. 4a–b). In contrast, precipitation changes are relatively small, varying around zero, in the more northern, colder and drier areas, while precipitation has mostly increased in the warmer and also wetter areas around and south of the Equator (Fig. 4c–e). Overall, the changes in mean annual temperature range from zero to +1 ∘C, while the changes in precipitation range from −70 to +170 mm yr−1, with the Iranian site (12) (Lake Urmia catchment) exhibiting the greatest increase in temperature (+1 ∘C) and the greatest relative decrease in precipitation (−17 %).

Figure 4Overview of hydroclimate conditions and their changes in the 27 wetlandscapes. Long-term average (1981–2010) (a) temperature (T) and (b) precipitation (Pr). Absolute change between Per1 (1981–1995) and Per2 (1996–2010) in (c) mean annual temperature and (d) mean annual precipitation. (e) Relative change in precipitation. The horizontal axis shows the numbering of the 27 wetlandscapes, sorted in order of their latitude from north to south.
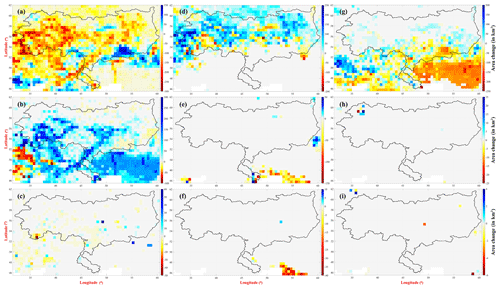
Figures 5 and 6 exemplify gridded variability and change data for temperature and precipitation over the Volga (no. 9) and the León–Atrato (no. 23) wetlandscapes. The data time series of wetlandscape-aggregated annual average temperature and precipitation in these wetlandscapes (Fig. 5) exemplify such data prepared and included in WetCID for all 27 wetlandscapes. These two wetlandscapes were chosen for data exemplification because they represent different hydroclimatic conditions, with Volga being cold and dry while León–Atrato is warm and wet (Fig. 5), as well as having different sizes, with Volga being the largest (1 360 000 km2) and León–Atrato (2344 km2) one of the smallest studied wetlandscapes. The data for these examples (Fig. 5) are consistent with corresponding data implications across the different wetlandscapes over the world (Fig. 4) in indicating an overall positive (warmer–wetter) spatial correlation between long-term average temperature and precipitation. Temporally, however, the recent changes in these variables imply a negative correlation (towards warmer and mostly drier conditions) for the Volga wetlandscape (Fig. 6a and c) as for several other northern wetlandscapes in WetCID (Fig. 4). In contrast, a positive correlation (towards mostly warmer and wetter conditions) is implied by the recent temporal changes in the León–Atrato wetlandscape (Fig. 6b, d), as one of the most southern wetlandscapes in WetCID (Fig. 4). Such spatiotemporal sign shifts and dipole emergence in temperature–precipitation correlations have been noted in other recent studies of long-term variations and short-term changes of hydroclimate over Europe (Charpentier Ljungqvist et al., 2019). WetCID can facilitate further studies of these correlation conditions for and across the different wetlandscapes around the world.

Figure 5Variability in wetlandscape-aggregated annual average temperature and precipitation for the examples of the (a) Volga and (b) León–Atrato wetlandscapes.
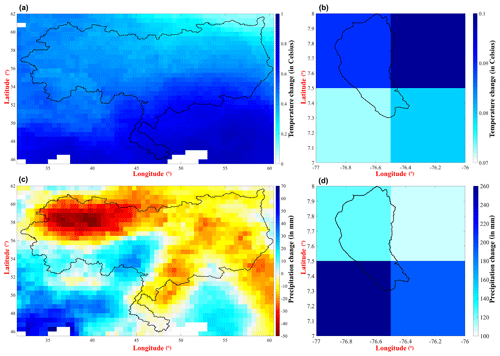
Figure 6Maps showing gridded absolute change in (a, b) temperature and (c, d) precipitation for the examples of the (a, c) Volga and (b, d) León–Atrato wetlandscapes. Absolute change values have been calculated by applying Eq. (1) to each grid cell within a wetlandscape.
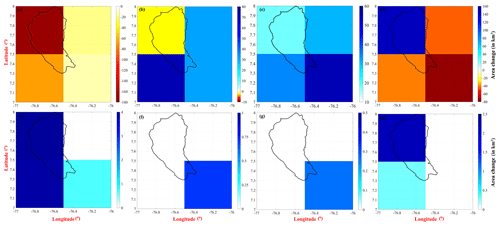
The data for the Volga and León–Atrato examples also emphasize that wetlandscapes can have very different area extents (spatial scales), with potentially important implications for the spatial resolution (Fig. 6) and related usefulness of data provided in WetCID. For example, the Volga wetlandscape includes 982 grid cells with complete or partial coverage in the hydroclimate datasets, while the León–Atrato wetlandscape only includes four of such grid cells. Most of the available global datasets from climate and earth system models have coarser spatial resolution than the size of most individual wetlands. Thus, model data for individual wetlands are subject to high uncertainty, whereas data aggregated over whole wetlandscapes have greater potential for accuracy (Bring et al., 2015), highlighting the need for considering the whole-wetlandscape scales in assessments of how wetland systems interact with hydroclimate and land-use changes.
3.3 Land-use data
The aggregated and gridded land-use data in WetCID can also be used for different types of whole-wetlandscape analyses. Figure 7 summarizes the data for the long-term average relative area of each land-cover type (% of total wetlandscape area), and associated absolute area changes (km2) and changes in relative area coverage (% of total wetlandscape area), for different land-cover types across the 27 wetlandscapes. The data reveal, for example, the high percentage of forest area in wetlandscapes at high latitudes and in the tropics, while relative cropland area increases towards the temperate regions (Fig. 7a). Figure 7 also summarizes the different types of land-cover transformations, for example from “forest” into “cropland and pastureland” in the tropical Mekong wetlandscape (21), “pastureland” into “grassland” in the temperate Irish wetlandscape (7) and into “cropland” in the borderline cold–dry Iranian wetlandscape of the dramatically shrinking Lake Urmia (12) (Khazaei et al., 2019), “shrubland” into “cropland” in the borderline temperate Iranian wetlandscape (13), and “cropland” into “shrubland” in the warm temperate Greek wetlandscape (14).

Figure 7(a) Long-term average relative area of each land-cover type (percentage of total wetlandscape area). (b) Absolute change in area of each land-cover type (km2). (c) Change in relative land-cover area (% in relation to total catchment area). The summarized and illustrated data are for the 27 wetlandscapes included in WetCID.

Figure 8Data time series for wetlandscape-aggregated annual average area (relative to total wetlandscape area, in %) for different land-cover types in the (a) Volga and (b) León–Atrato wetlandscapes.
The data time series of different land-cover types and their changes between Per1 (1981–1995) and Per2 (1996–2010) show, for example, forest and (decreasing) cropland, followed by pastureland and grassland, to be dominant in the large Volga wetlandscape, while forest, pastureland and (decreasing) cropland areas dominate the small León–Atrato wetlandscape (Fig. 8). Gridded maps of land-cover area changes in these wetlandscape examples (Figs. 9–10) again demonstrate large spatial-resolution differences, with potentially important implications for the usefulness of land-use datasets for wetlandscapes of smaller scales. For example, in the most northern Swedish–Arctic wetlandscape (1), grassland is obtained as the second most dominant land-cover type after tundra (Fig. 7a), which is not normally seen in this northern Arctic region.
The complete WetCID database includes five file categories (https://doi.org/10.1594/PANGAEA.907398; Ghajarnia et al., 2019).
-
Folder 1: survey results (summary documents A, B, C). These three summary documents (all in Excel) were created from responses obtained in the main survey of GWEN researchers (see survey template and structure in WetCID files). Summary document A contains summarized site-specific information on the wetlands, hydrology, climate and land uses in each of for the 27 wetlandscapes. Summary documents B and C contain local knowledge relating to the availability–accessibility (or lack) of land-use and hydroclimatic data, respectively, for each of the 27 wetlandscapes.
-
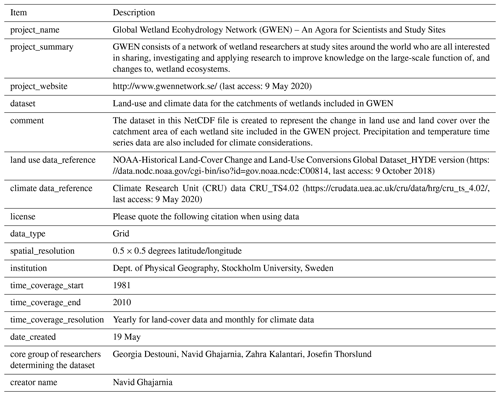
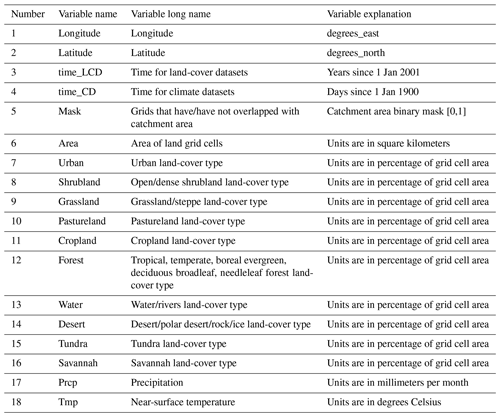
Folder 2: gridded land-use and hydroclimatic datasets (NetCDF database files). In WetCID, there is a separate NetCDF file for each wetlandscape that contains a complete set of gridded hydroclimate and land-use data time series for the closest rectangular window around the catchment polygon of the wetlandscape. The gridded hydroclimate datasets were created by subsetting the CRU_TS4.02 original global datasets over the area of each wetlandscape (catchment). The gridded land-use dataset for each wetlandscape (catchment) was created by first reclassifying the land-cover types and then subsetting the global gridded data. All these gridded data time series are saved in separate NetCDF files for each wetlandscape, which is an appropriate file type for storing gridded data. Each NetCDF file contains 18 variables, including hydroclimate, land-cover and some auxiliary variables. Appendix B presents the table of general attributes (Table B1) and information and explanations of all 18 variables included in the NetCDF database files (Table B2). Sample MATLAB and R codes for reading and extracting data from the NetCDF files are also provided in Appendix C.
-
Folder 3: aggregated land-use and hydroclimate data (Excel databases). The time series of land-use and hydroclimatic data aggregated over each wetlandscape (catchment) were created from the gridded datasets (NetCDF files) and stored as Excel files for each wetlandscape. The Excel file for each wetlandscape contains three sheets: (1) annual time series of covered area by each land-cover type (in km2), (2) time series of annual relative area (%) occupied by each land-cover type, and (3) time series of monthly temperature (∘C) and precipitation (mm per month) data.
-
Folder 4: geographical dataset in a ZIP file (shapefiles). To perform any spatial analysis of the wetlandscapes, one needs to have access to the shapefile and polygons of the wetlandscape (catchment) and wetlands within it. These shapefiles were provided by the GWEN researchers and can be downloaded from WetCID files.
-
Folder 5: summary tables of changes in hydroclimatic and land-use variables. Absolute and relative changes in all considered hydroclimate and land-use variables between Per1 (1981–1995) and Per2 (1996–2010) were calculated using Eqs. (1), (2) and (3) for each wetlandscape. The results are summarized in an Excel file with two sheets for each wetlandscape: (1) absolute changes in temperature, precipitation and land-cover area and (2) relative changes in precipitation and land-cover area. The data for land-cover changes are provided for all considered land-use variables.
The presented new database (WetCID) combines survey-based local information and knowledge with gridded large-scale hydroclimate and land-use datasets for 27 wetlandscapes around the world. The gridded datasets contain 30-year time series of mean monthly precipitation and temperature along with annual average land uses and their changes over this time period for each wetlandscape. WetCID can support site assessments; cross-regional comparisons; and scenario analyses of the roles and impacts of various land-use, hydroclimatic and wetland conditions and their changes on whole-wetlandscape functions and associated ecosystem services. The information on local data availability–accessibility and observed or perceived change occurrence summarized and structured in WetCID can guide further study directions and support identification of key needs for complementary new local data and/or use of additional regional–global gridded datasets.
The gridded large-scale hydroclimatic and land-use data included in WetCID have been derived using open-access data sources and processed with open-source tools, while WetCID has been designed so that more data can readily be added to it. The site-specific usefulness of different included data varies for wetlandscapes of different scales, but WetCID can be updated with small time investment as new datasets become available or current datasets are expanded or refined.
C1 MATLAB sample code
info = ncinfo('File_Name.nc'); % replace
File_Name with the name of NetCDF file for each wetlandscape.
This command gets the complete description for all the general attributes as
well as detailed information of all existing variables in the NetCDf file.
Var = ncread('File_Name.nc', 'Variable_Name'); % replace Variable_Name with the “Variable name”
column in Table B2 for extracting different variable data from each
wetlandscape NetCDF file.
C2 R sample code
install.packages("ncdf4")
library(ncdf4)
ncf < -- nc_open("File_Name.nc") #
replace File_Name with the name of NetCDF file for each
wetlandscape. This command opens the NetCDF file in RStudio environment.
names(ncf$var) # extracting the name of existing variables in the
NetCDF file.
Var < -- ncvar_get(ncf, "Variable_Name") # replace Variable_Name with the “Variable name” column
in Table B2 for extracting different variable data from each wetlandscape
NetCDF file.
NG compiled the climate and land-use database, contributed to the communication with other co-authors for the wetlandscape data collection, and was mainly responsible for analyzing the data and writing the paper. GD conceived and led the study and the development of WetCID and analysis approach, led the communication with other co-authors, and contributed to the result analysis and writing of the paper. JT conceived the idea of the data paper type; was mainly responsible for collecting and compiling the local survey information and its summary and analysis in the paper; and contributed to communication with co-authors, the result analysis and the writing. ZK contributed to the communication with co-authors, the database development, and the result analysis and writing. All other co-authors contributed by providing local site information in the survey forms and/or taking part in discussions for planning and outlining the study.
The authors declare that they have no conflict of interest.
The Historical Land-Cover Change and Land-Use Conversions Global Dataset used in this study was acquired from NOAA's National Climatic Data Center (http://www.ncdc.noaa.gov/, last access: 9 October 2018). The temperature and precipitation data were also retrieved from the CRU_TS4.02 global database (https://crudata.uea.ac.uk/cru/data/hrg/, last access: 9 May 2019).
This research has been supported by funding from the Swedish Research Council Formas (grant no. 2016-2045), the Russian RFBR project (grant nos. 17-29-05027 and 18-05-60219), the Russian Science Foundation project 14-17-00155 and the United States National Science Foundation (grant no. DEB-1237517, contribution number 958 from the Southeast Environmental Research Center at Florida International University).
This paper was edited by Alexander Gelfan and reviewed by two anonymous referees.
Acreman, M. and Holden, J.: How wetlands affect floods, Wetlands, 33, 773–786, 2013.
Ameli, A. A. and Creed, I. F.: Groundwaters at Risk: Wetland Loss Changes Sources, Lengthens Pathways, and Decelerates Rejuvenation of Groundwater Resources, J. Am. Water Resour. Assoc., 55, 294–306, https://doi.org/10.1111/1752-1688.12690, 2019.
Bring, A., Asokan, S. M., Jaramillo, F., and Jarsj, J.: Implications of freshwater fluxdata from the CMIP5 multimodel output across a set of Northern Hemispheredrainage basins, Earth’s Future, 3, 206–217, 2015.
Chalov, S., Thorslund, J., Kasimov, N., Aybullatov, D., Ilyicheva, E., Karthe, D., Kositsky, A., Lychagin, M., Nittrouer, J., Pavlov, M., Pietron, J., Shinkareva, G., Tarasov, M., Garmaev, E., Akhtman, Y., and Jarsjö, J.: The Selenga River delta: A geochemical barrier protecting Lake Baikal waters, Reg. Environ. Chang., 17, 2039–2053, 2017.
Charpentier Ljungqvist, F., Seim, A., Krusic, P. J., González-Rouco, J. F., Werner, J. P., Cook, E. R., Zorita, E., Luterbacher, J., Xoplaki, E., Destouni, G., García-Bustamante, E., Melo Aguilar, C. A., Seftigen, K., Wang, J., Gagen, M. H., Esper, J., Solomina, O., Fleitmann, D., and Büntgen, U.: European warm-season temperature and hydroclimate since 850 CE, Environ. Res. Lett., 14, 084015, https://doi.org/10.1088/1748-9326/ab2c7e, 2019.
Cohen, M. J., Creed, I. F., Alexander, L., Basu, N. B., Calhoun, A. J., Craft, C., D’Amico, E., DeKeyser, E., Fowler, L., Golden, H. E., Jawitz, J. W., Kalla, P., Kirkman, L. K., Lane, C. R., Lang, M., Leibowitz, S. G., Lewis, D. B., Marton, J., McLaughlin, D. L., Mushet, D. M., Raanan-Kiperwas, H., Rains, M. C., Smith, L., and Walls, S. C.: Do Geographically Isolated Wet-lands Influence Landscape Functions?, P. Natl. Acad. Sci. USA, 113, 1978–1986, https://doi.org/10.1073/pnas.1512650113, 2016.
Costanza, R., de Groot, R., Sutton, P., van der Ploeg, S., Anderson, S. J., Kubiszewski,I., Farber, S., and Turner, R. K.: Changes in the global value of ecosystemservices, Global Environ. Change, 26, 152–158, 2014.
Creed, I. F., Lane, C. R., Serran, J. N., Alexander, L. C., Basu, N. B.,Calhoun, A., Christensen, J., Cohen, M. J., Craft, C., D'Amico, E., DeKeyser, E., Fowler, L., Golden, H., Jawitz, J. W., and Kalla, P.: Enhancing Protection for Vulnerable Waters, Nat. Geosci., 10, 809–815, 2017.
Davidson, N. C.: How much wetland has the world lost? Long-term and recent trends in global wetland area, Mar. Freshw. Res., 65, 934–941, https://doi.org/10.1071/MF14173, 2014.
Davidson, N. C., Fluet-Chouinard, E., and Finlayson, C. M.: Global extent and distribution of wetlands: Trends and issues, Mar. Freshw. Res., 69, 620–627, https://doi.org/10.1071/MF17019, 2018.
Destouni, G., Jaramillo, F., and Prieto, C.: Hydroclimatic shifts driven by human water use for food and energy production, Nat. Clim. Change, 3, 213–217, 2013.
Ghajarnia, N., Destouni, G., Thorslund, J., Kalantari, Z., Acevedo, J. A. A., Blanco, J. F., Borja, S., Chalov, S., Chalova, A., Chun, K. P., Clerici, N., Desormeaux, A., Garfield, B., Girard, P., Gorelits, O., Hansen, A., Jaramillo, F., Jarsjö, J., Livsey, J., Maneas, G., McCurley, K., Palomino-Ángel, S., Pietron, J., Price, R. M., Rivera Monroy, V. H., Salgado, J., Sannel, A. B. K., Seifollahi-Aghmiuni, S., Sjöberg, Y., Tersky, P., Vigouroux, G., Villanueva, L. L., and Zamora, D.: Wetlandscape Change Information Database (WetCID), Pangaea, https://doi.org/10.1594/PANGAEA.907398, 2019.
Golden, H., Creed, I. F., Ali, G., Basu, N. B., Neff, B., Rains, M., McLaughlin, D., Alexander, L., Ameli, A. A., Christensen, J., Even-son, G., Jones, C., Lane, C., and Lang, M.: Integrating Geo-graphically Isolated Wetlands Into Land Management Decisions, Front. Ecol. Environ., 15, 319–327, 2017.
Harris, I., Jones, P. D., Osborn, T. J., and Lister, D. H.: Updated high-resolution grids of monthly climatic observations – the CRU TS3.10 Dataset, Int. J. Climatol., 34, 623–642, https://doi.org/10.1002/joc.3711, 2014.
Jain, A. K., Meiyappan, P., Song, Y., and House, J. I.: CO2 emissions from land-use change affected more by nitrogen cycle, than by the choice of land-cover data, Global Change Biol., 19, 2893–2906, https://doi.org/10.1111/gcb.12207, 2013.
Jaramillo, F. and Destouni, G.: Developing water change spectra and distinguishing change drivers worldwide, Geophys. Res. Lett., 41, 8377–8386, https://doi.org/10.1002/2014GL061848, 2014.
Jaramillo, F. and Destouni, G.: Local flow regulation and irrigation raise global human water consumption and footprint, Science, 350, 1248–1251, https://doi.org/10.1126/science.aad1010, 2015.
Jaramillo, F., Desormeaux, A., Hedlund, J., et al.: Priorities and Interactions of Sustainable Development Goals (SDGs) with Focus on Wetlands, Water, 11, 619, https://doi.org/10.3390/w11030619, 2019.
Khazaei, B., Khatami, S., Alemohammad, S. H., Rashidi, L., Wu, C., Madani, K., Kalantari, Z., Destouni, G., and Aghakouchak, A.: Climatic or regionally induced by humans? Tracing hydro-climatic and land-use changes to better understand the Lake Urmia tragedy, J. Hydrol., 569, 203–217, 2019.
Maneas, G., Makopoulou, E., Boubouras, D., and Manzoni, S.: Anthropogenic Changes in a Mediterranean Coastal Wetland during the Last Century – The Case of Gialova Lagoon, Messinia, Greece, Water, 11, 350, https://doi.org/10.3390/w11020350, 2019.
Meiyappan, P. and Jain, A. K.: Three distinct global estimates of historical land cover change and land use conversions for over 200 years, Front. Earth Sci., 6, 122–139, https://doi.org/10.1007/s11707-012-0314-2, 2012.
Mitchell, J. C., Paton, P. W. C., and Raithel, C. J.: The importance of vernal pools to reptiles, birds, and mammals. Science and Conservation of Vernal Pools in Mortheastern North America, edited by: Calhoun, A. J. K. and de Maynadier, P. G., (CRC, Boca Raton, FL), 169–193, 2008.
Mitsch, W. J. and Gosselink, J. G.: Wetlands, New York, Wiley, 2000.
Morganti, M., Manica, M., Bogliani, G., Gustin, M., Luoni, F., Trotti, P., Perin, V., and Brambilla, M.: Multi-species habitat models highlight the key importance of flooded reedbeds for inland wetland birds: implications for management and conservation, Avian Res., 10, 15, https://doi.org/10.1186/s40657-019-0154-9, 2019.
Orth, R. and Destouni, G.: Drought reduces blue-water fluxes more strongly than greenwater fluxes in Europe, Nat. Commun. 9, 3602, https://doi.org/10.1038/s41467-018-06013-7, 2018.
Peel, M. C., Finlayson, B. L., and McMahon, T. A.: Updated world map of the Köppen-Geiger climate classification, Hydrol. Earth Syst. Sci., 11, 1633–1644, https://doi.org/10.5194/hess-11-1633-2007, 2007.
Preston, E. M. and Bedford, B. L.: Evaluating cumulative effects on wetlandfunctions: a conceptual overview and generic framework, Environ. Manag., 12, 565–583, 1988.
Quin, A. and Destouni, G.: Large-scale comparison of flow-variability dampening by lakes and wetlands in the landscape, Land Degrad Dev., 29, 3617–3627, https://doi.org/10.1002/ldr.3101, 2018.
Quin, A., Jaramillo, F., and Destouni, G.: Dissecting the ecosystem service of large-scale pollutant retention: The role of wetlands and other landscape features, AMBIO, 44, 127–137, 2015.
Seifollahi-Aghmiuni, S., Kalantari, Z., Land, M., and Destouni, G.: Change Drivers and Impacts in Arctic Wetland Landscapes – Literature Review and Gap Analysis, Water, 11, 722, https://doi.org/10.3390/w11040722, 2019.
Seneviratne, S. I., Lüthi, D., Litschi, M., and Schär, C.: Land–atmosphere coupling and climate change in Europe, Nature, 443, 205–209, 2006.
Thorslund, J., Jarsjö, J., Jaramillo, F., Jawitz, J. W., Manzoni, S., Basu, N. B., Chalov, S. R., Cohen, M. J., Creed, I. F., Goldenberg, R., Hylin, A., Kalantari, Z., Koussis, A. D., Lyon, S., Mazi, K., Mård, J., Persson, K., Pietroń, J., Prieto, C., Quin, A., Van Meter, K., and Destouni, G.: Wetlands as large-scale nature-based solutions: status and challenges for research, engineering and management, Ecol. Eng., 108, 489–497, 2017.
Thorslund, J., Cohen, M. J., Jawitz, J. W., Destouni, G., Creed, I. F., Rains, M. C., Badiou, P., and Jarsjö, J.: Solute evidence for hydrological connectivity of geographically isolated wetlands, Land Degrad. Develop., 29, 3954–3962, 2018.
Zedler, J. B. and Kercher, S.: Wetland resources: status, trends, ecosystem services, and restorability, Annu. Rev. Environ. Resour., 30, 39–74, 2005.
- Abstract
- Introduction
- Methods
- Results
- Data availability
- Conclusions
- Appendix A: Summary of land-cover type parameters
- Appendix B: Description of parameters included in the NetCDF database files of WetCID
- Appendix C: Sample codes to read NetCDF database files included in WetCID
- Author contributions
- Competing interests
- Acknowledgements
- Financial support
- Review statement
- References


