the Creative Commons Attribution 4.0 License.
the Creative Commons Attribution 4.0 License.
 | 11 Jan 2019
A meteorological and blowing snow data set (2000–2016) from a high-elevation alpine site (Col du Lac Blanc, France, 2720 m a.s.l.)
Gilbert Guyomarc'h
Hervé Bellot
Vincent Vionnet
Florence Naaim-Bouvet
Yannick Déliot
Firmin Fontaine
Philippe Puglièse
Kouichi Nishimura
Yves Durand
Mohamed Naaim
A meteorological and blowing snow data set from the high-elevation experimental site of Col du Lac Blanc (2720 m a.s.l., Grandes Rousses mountain range, French Alps) is presented and detailed in this paper. Emphasis is placed on data relevant to the observations and modelling of wind-induced snow transport in alpine terrain. This process strongly influences the spatial distribution of snow cover in mountainous terrain with consequences for snowpack, hydrological and avalanche hazard forecasting. In situ data consist of wind (speed and direction), snow depth and air temperature measurements (recorded at four automatic weather stations), a database of blowing snow occurrence and measurements of blowing snow fluxes obtained from a vertical profile of snow particle counters (2010–2016). Observations span the period from 1 December to 31 March for each winter season from 2000–2001 to 2015–2016. The time resolution has varied from 15 min until 2014 to 10 min for the last years. Atmospheric data from the meteorological reanalysis are also provided from 1 August 2000 to 1 August 2016. A digital elevation model (DEM) of the study area (1.5 km2) at 1 m resolution is also provided in RGF 93 Lambert 93 coordinates. This data set has been used in the past to develop and evaluate physical parameterizations and numerical models of blowing and drifting snow in alpine terrain. Col du Lac Blanc is also a target site to evaluate meteorological and climate models in alpine terrain. It belongs to the CRYOBS-CLIM observatory (the CRYosphere, an OBServatory of the CLIMate), which is a part of the national research infrastructure OZCAR (Critical Zone Observatories – Application and Research) and have been a Global Cryospheric Watch Cryonet site since 2017. The data are available from the repository of the OSUG data centre https://doi.org/10.17178/CRYOBSCLIM.CLB.all.
- Article
(4862 KB) - Full-text XML
-
Supplement
(7781 KB) - BibTeX
- EndNote


Wind-induced snow transport strongly influences the temporal and spatial distributions of the snow cover in mountainous areas (e.g. Mott et al., 2010; Vionnet et al., 2014). It occurs throughout the winter in a succession of blowing snow events with and without concurrent atmospheric snowfall. The redistribution of snow through saltation and turbulent suspension results from complex interactions between the local topography, the near-surface meteorological conditions and the surface of the snowpack (e.g. Pomeroy and Gray, 1995; Naaim-Bouvet et al., 2010). Snow deposition is affected by wind-induced snow transport at the slope scale in a wide-scale range of a few metres to hundreds of metres (e.g. Mott et al., 2010). Snow tends to be deposited in the lee of ridges or local depressions leading to the formation of snow dunes and drifts and the smoothing of the land-surface roughness (Schirmer et al., 2011). Blowing snow also affects the surface roughness of the snow cover at sub-metre-scale, creating a large variety of aeolian snow forms such as ripples or sastrugi (e.g. Filhol and Sturm, 2015). This spatial variability has consequences on the snowpack stability and influences the danger of avalanches as cornices and wind slabs are formed during blowing snow events (Schweizer et al., 2003). It also has hydrological consequences since the melt response of alpine catchment depends on the snow spatial distribution at peak accumulation (Egli et al., 2012; Revuelto et al., 2016). Observations of blowing snow and associated meteorological and snowpack parameters are therefore crucial to better understand the complex snowpack–atmosphere interactions during blowing snow events and to develop and evaluate numerical models used in support of avalanche hazard and hydrological forecasting in alpine terrain.
Since 1988, the Snow Research Centre (Centre d'Etudes de la Neige, Centre National de Recherches Météorologiques, Météo-France – CNRS) and the ETNA unit (IRSTEA, Univ. Grenoble Alpes) have joined their efforts to investigate the effects of wind-induced snow transport on snowpack evolution. A high-elevation experimental site was set up at the Col du Lac Blanc, a north–south-oriented pass, located at 2720 m a.s.l. (45.13∘ N, 6.12∘ E) in the Grandes Rousses mountain range, France. The study area covers an altitudinal range of approximately 100 m between 2700 and 2800 m a.s.l. Wind-induced snow transport strongly modifies the spatial variability of the snow cover around the site for scales, ranging approximately from 1 to 50 m (Vionnet et al., 2014; Schön et al., 2015, 2018). The roughness of the snow surface is also continuously evolving throughout the winter as a function of the occurrence of snowfall and blowing snow events (Naaim-Bouvet et al., 2016). Recent studies have focused on fine-scale processes during blowing snow events (Naaim-Bouvet et al., 2010, 2011, 2014; Nishimura et al., 2014; Schön et al., 2015, 2018), intercomparison of blowing snow sensors (Cierco et al., 2007; Trouvilliez et al., 2015) and the development and evaluation of blowing snow models (Durand et al., 2005; Vionnet et al., 2013, 2014, 2017, 2018). Col du Lac Blanc, as well as Col de Porte, another experimental site located in the French Alps and dedicated to observation and modelling of the seasonal snowpack (Morin et al., 2012; Lejeune et al., 2019), belongs to the CRYOBS-CLIM observatory (the CRYosphere, an OBServatory of the CLIMate), which is a part of the national research infrastructure OZCAR (Critical Zone Observatories – Application and Research) (Gaillardet et al., 2018). It has also been a Global Cryosphere Watch Cryonet site since 2017 and belongs to the International Network for Alpine Research Catchment Hydrology (INARCH). In this paper, we present a unique meteorological and blowing snow data set for each winter of the period 2000–2016. Meteorological data are available from four automatic weather stations (AWSs) surrounding the experimental site. Blowing snow data stem from two sources: (i) a database of blowing snow occurrence and (ii) blowing snow fluxes derived from snow particles counters from winter 2010–2011 to 2015–2016. It should also be underlined that data collection continues and new measurements will follow. The paper is organized as follows. Section 2 describes the experimental site and the sensors used at each automatic weather station. Section 3 deals specifically with blowing snow data, which are introduced and discussed. Then, Sect. 4 presents an overview of the meteorological and blowing snow data set over the last seasons. Finally, Sect. 5 details the data availability.
2.1 Site description
The Col du Lac Blanc (CLB) experimental site is located at 2720 m a.s.l. in the Grandes Rousses mountain range (45.13∘ N, 6.12∘ E, Fig. 1) in the central French Alps. The mean winter temperature (December–March from 2000 to 2016) at AWS Lac Blanc (Fig. 1) was −6.1 ∘C. The study site covers an altitudinal range between 2700 and 2800 m a.s.l. and can be viewed as a natural wind tunnel due to its orientation and the specific configuration of the surrounding summits. Indeed, the Grandes Rousses range on the eastern side and the Dôme des Petites Rousses summit on the western side channel the atmospheric flow according to a north–south axis (Fig. 1). This characteristic of the site is particularly useful for studies on the effects of wind on snow redistribution. Over the winter period (December–March) from 2000 to 2016, the mean wind speed at AWS Lac Blanc was 4.9 m s−1 reaching a maximum wind of 38.3 m s−1 on 28 January 2006. Wind speeds larger than 10 m s−1 were recorded on average 10.2 % of the time in wintertime. Snow is typically present on the ground around the site (Fig. 2) from late October to early June. The mean winter snow depth (December–March) from 2000 to 2016 at AWS Lac Blanc was 1.88 m and presents a large interannual variability with a minimal value of 1.28 m in 2001–2002 and a maximal value of 2.83 m for winter 2003–2004. The underlying ground is covered by bare and rocky soil, typical of high-elevation alpine regions. Patches of low alpine grass are also present around the site. In wintertime, the site is characterized by a strong spatial variability of the snowpack due to intense snow redistribution during blowing snow events. In particular, two 10 m slope breaks on the northern and southern sides of the pass accumulate a large amount of snow during these events depending on the main wind direction (Vionnet et al., 2014; Schön et al., 2015, 2018).
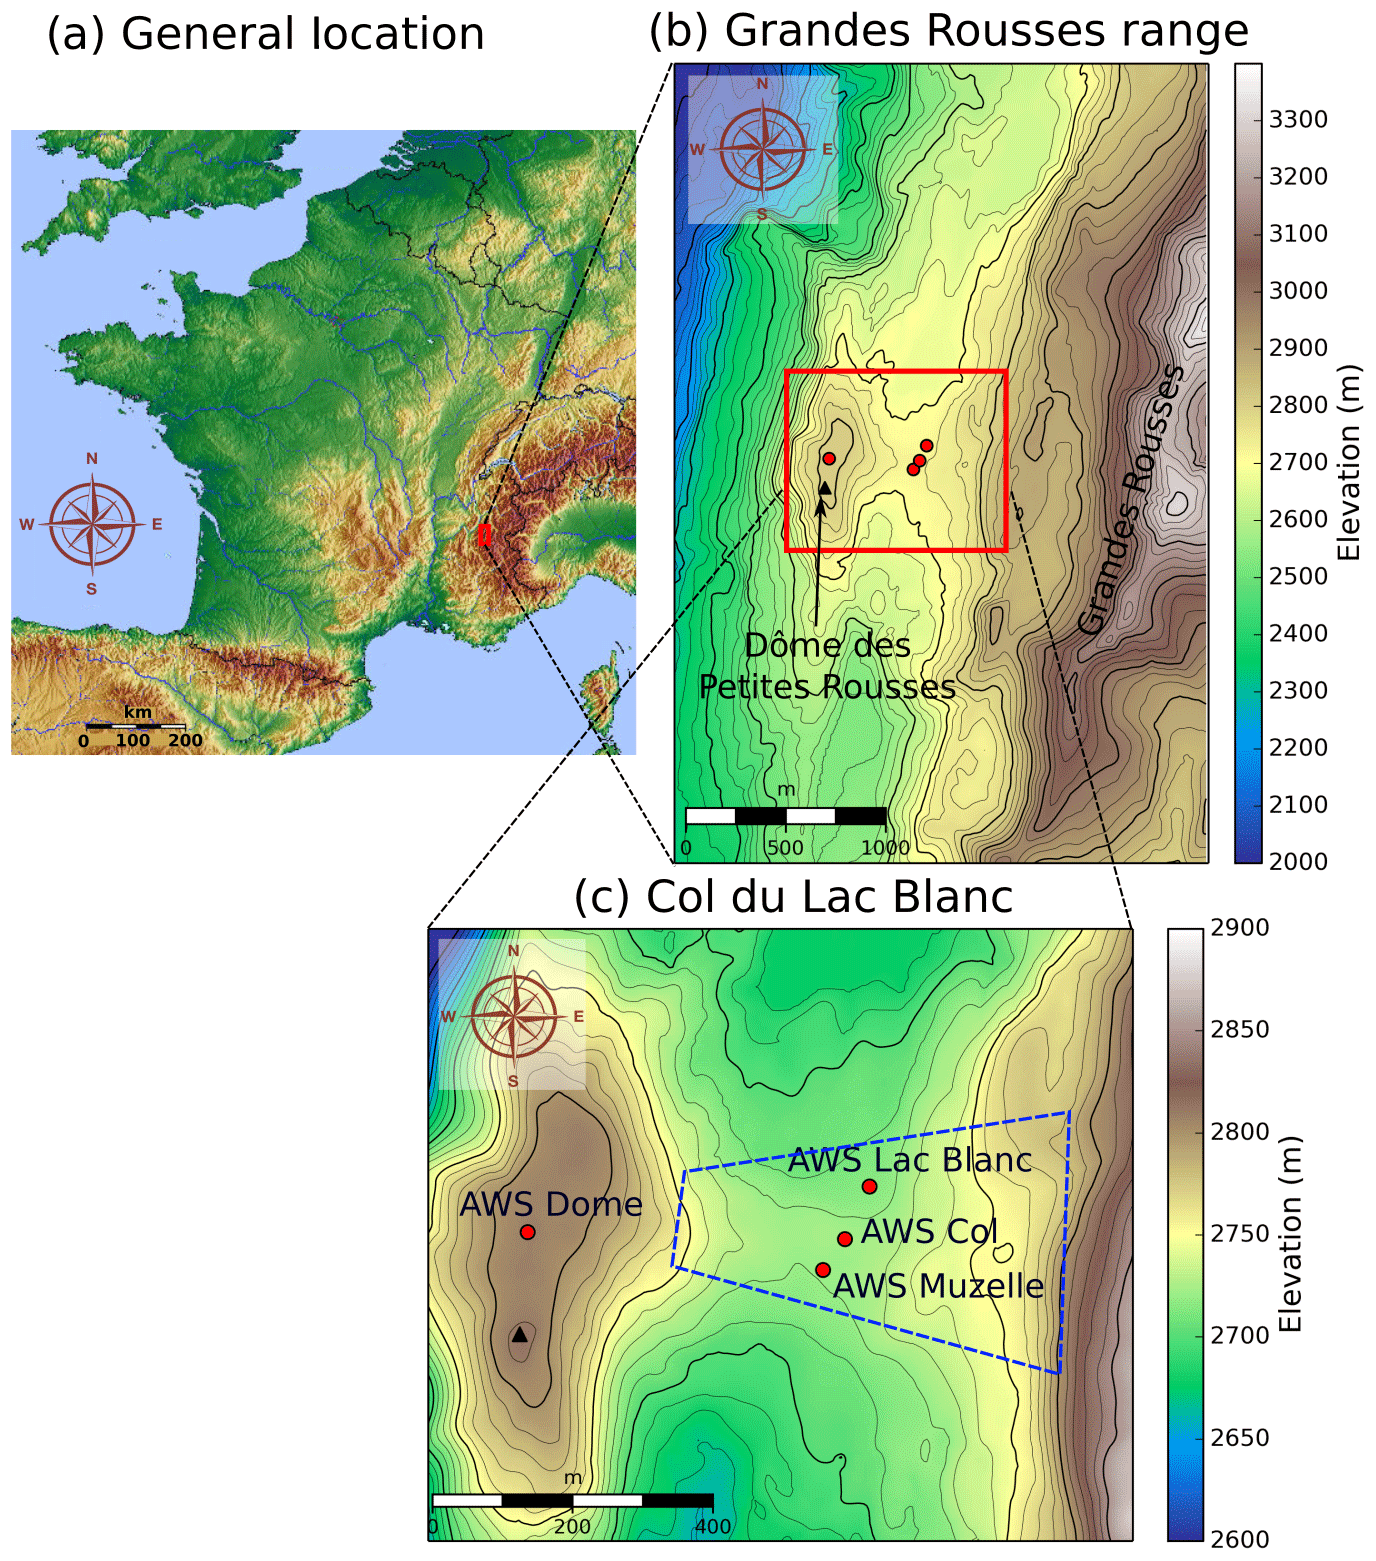
Figure 1Location of the Col du Lac Blanc experimental site seen at different scales: (a) general location in France, (b) location within the Grandes Rousses mountain range, (c) details of the study area showing the location of the four AWSs surrounding the site and described in Table 1. The blue dashed area on map (c) shows the approximate area covered by the picture in Fig. 2. Contour line spacing is 100 m for the major lines and 25 m for the minor lines in map (b) and 50 and 10 m in map (c).
The CLB experimental site consists of four automatic weather stations located around the pass (Figs. 1 and 2). The exact position and elevation of the stations is given in Table 1. AWS Lac Blanc, Col and Muzelle are located at approximately the same elevation next to the pass where the atmospheric flow is strongly channelled by the surrounding topography. The AWS Dome lies at a higher elevation on the top of the Dôme des Petites Rousses. At this station, atmospheric conditions are less influenced by the topography of the pass and closer to the synoptic conditions. Two wooden shelters are also installed at the pass (Fig. 2). They host the data acquisition system, the equipment storage and the living facilities. They are located on the eastern side of the pass, aside from the main wind direction, so that they have a minimal impact on measured snow and meteorological conditions at AWS Lac Blanc, Col and Muzelle. The meteorological, snow depth and blowing snow data collected at these stations are presented in the next two sections.
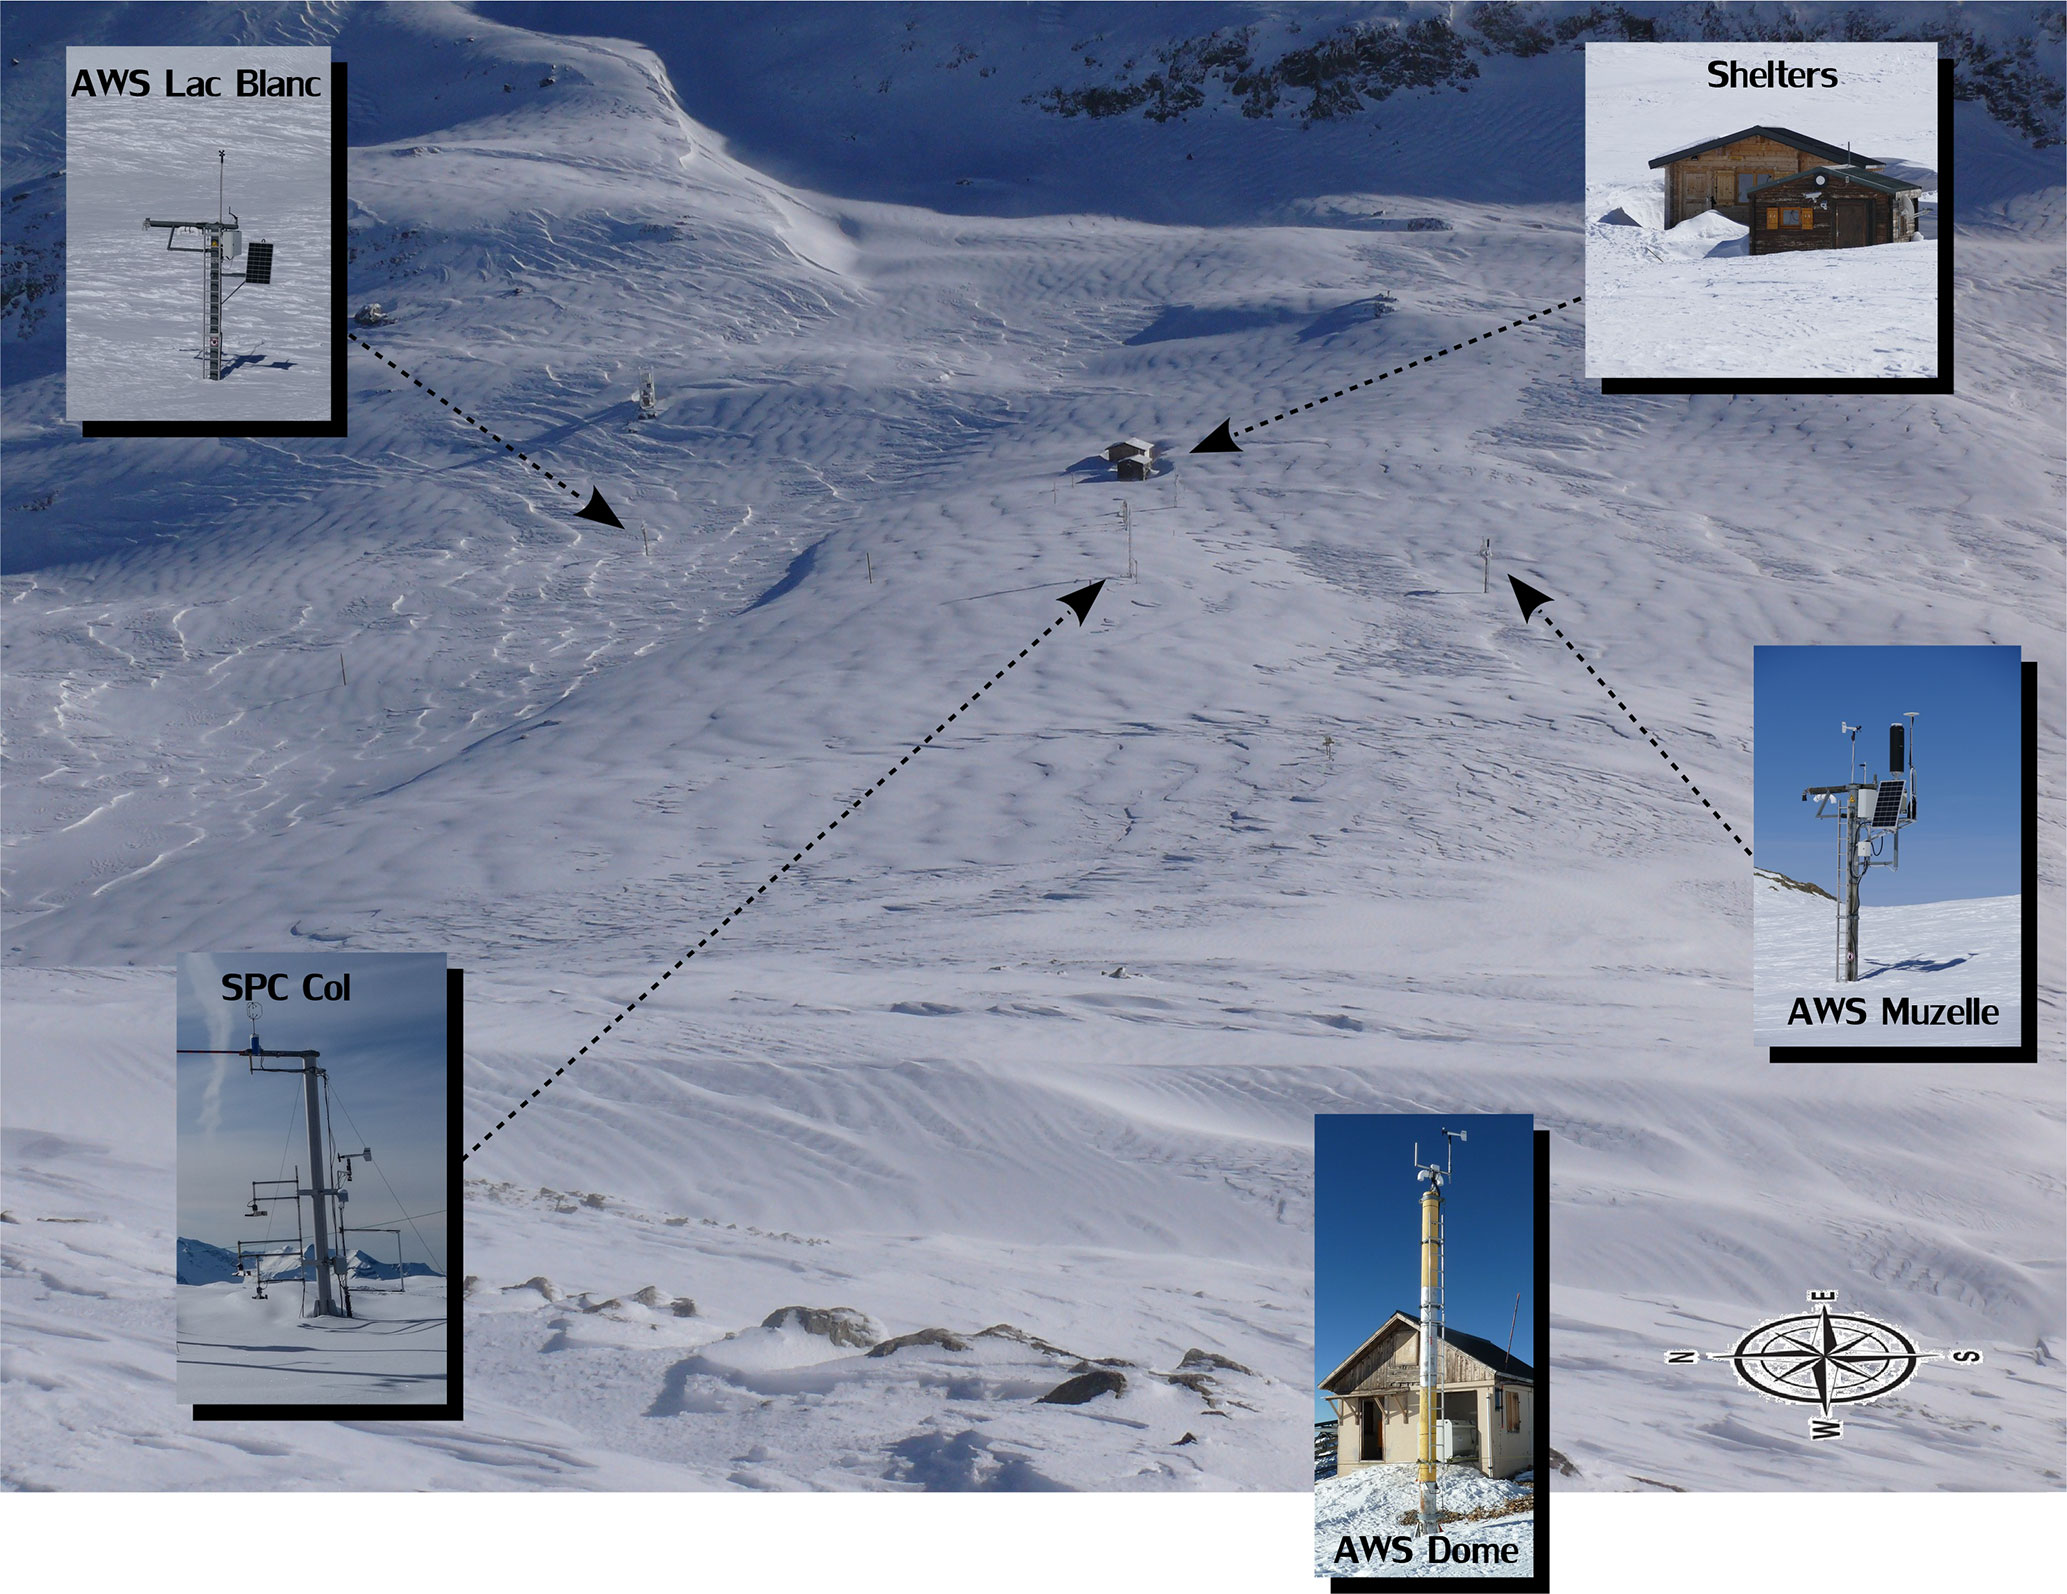
Figure 2Overview of the experimental site at Col du Lac Blanc (2720 m a.s.l., Grandes Rousses mountain range, France). Insets show a detailed view of each AWS. AWS Dome lies outside the picture. See text for further details on each AWS. The approximate area covered by the picture is shown on Fig. 1c.
Table 1Overview of the sensors used at each station between 2000 and 2016 at Col du Lac Blanc, France.

*Height above snow-free ground. X and Y are provided in RGF 93 Lambert 93 coordinates.
2.2 Meteorological and snow depth data
Table 1 provides an overview of the meteorological and snow parameters measured around CLB, with the corresponding instrument type, models and height. Each AWS located around CLB measures wind speed and direction at a time step of 15 or 10 min depending on the station and/or the period. Additionally, measurements of air temperature are available at three AWSs. Finally, three AWSs situated around the pass measure snow depth using ultrasonic sensors (at AWSs Lac Blanc and Muzelle) and a laser sensor (at AWS Col). They are available between 1 December and 31 March of each winter. This period has been selected since it corresponds to the main period during which most of blowing snow events occur at CLB (Vionnet et al., 2013). Data from AWSs Lac Blanc and Dome are available from winter 2000–2001 to 2015–2016, whereas data from AWSs Muzelle and Col are available from winter 2002–2003 and 2010–2011, respectively. In complement to in situ meteorological observations, atmospheric data from the SAFRAN meteorological reanalysis (Durand et al., 1993, 2009) are provided for Col du Lac Blanc from 1 August 2000 to 31 July 2016.
2.2.1 Wind speed and direction
Wind speed and direction are measured using non-heated anemometers at AWSs Lac Blanc, Muzelle and Dome. The starting threshold of the wind velocity is 1 m s−1. The maximum, minimum and mean wind velocity of the time period are recorded. At AWS Col, wind speed and direction are measured using a heated ultrasonic anemometer. For high blowing snow fluxes, particles hitting the transmission/reception cell can disturb the measurement process. The recorded wind direction is the most frequent for the time period. Due to snow accumulation at the bottom of the stations, the measurement height is changing during the course of the winter. Table 1 gives the height of the wind sensors over snow-free ground for each station. Snow depth measurements at AWSs Lac Blanc, Muzelle and Col (see Sect. 2.2.3) can be used to estimate the height of the wind sensor above the snow surface as in Vionnet et al. (2013). The temporal consistency of the wind speed data from the different AWS was controlled. Wind data (speed and direction) were removed from the data sets during periods of icing of the sensors. Such periods can be identified with a visual inspection of webcam images for the period 2004–2016, in the reports from the operators visiting CLB on weekly basis and thanks to a comparison between heated and non-heated anemometer data.
2.2.2 Air temperature
The air temperature sensors are placed in ventilated shelters at AWSs Lac Blanc, Muzelle and Dome and the uncertainty in the measurements lies within 0.1 K. Table 1 gives the height of the temperature sensors over snow-free ground for each station. Times series of air temperature were visually inspected and outliers removed from the final data set, in particular when suspicious heating of the temperature sensors was identified during springtime periods with low wind and high solar radiation.
2.2.3 Snow depth
Snow depth is measured using ultra-sound depth sensors at AWSs Lac Blanc and Muzelle. These sensors determine the distance to the snow surface by sending out ultrasonic pulses and listening for the returning echoes that are reflected from the surface. The time from transmissions to the return of an echo and the speed of sound in the air are then used for obtaining the distance measurement. Since the speed of sound in the air varies with air temperature, a correction of the distance calculation is carried out using the air temperature measurements previously described. Time series of snow depth measurements were visually inspected and outliers removed from the data set, most often occurring during snowfall. Ultra-sound depth sensors provide measurements accurate within 1 cm. The beam angle is 30∘, which gives an observed surface area of 8 m2 for a sensor mounted at 6 m above a snow-free ground (the average sensor height at AWSs Muzelle and Lac Blanc, Table 1). This area decreases to 0.9 m2 when the snow depth reaches 4 m.
Snow depth is measured using a laser sensor at AWS Col. The sensor uses an optoelectronic distance measurement principle to achieve a specified measurement uncertainty of better than 5 mm. Divergence of the laser beam amounts to 0.6 mrad, which implies that the beam diameter is up 11 mm in size at the measurement point. This sensor is mainly used to accurately determine the position of the snow particle counters above the snow layer during a blowing snow event. Moreover, this technology has the advantage of being less disturbed by blowing snow particles than the sonic sensor.
2.2.4 Atmospheric parameters from a meteorological reanalysis
Atmospheric data from the SAFRAN (Système d'Analyse Fournissant des Renseignements Atmosphériques à la Neige; Analysis System Providing Atmospheric Information to Snow) meteorological reanalysis (Durand et al., 1993, 2009) at the elevation of Col du Lac Blanc in the Grandes Rousses range are provided from 1 August 2000 to 31 July 2016. SAFRAN combines meteorological fields from a global numerical weather prediction system with neighbouring in situ and remotely sensed observations to estimate meteorological variables in the French mountains. They are available per 300 m elevation bands for areas known as massifs (23 in the French Alps), which were defined for their climatological homogeneity (Durand et al., 1993). To obtain SAFRAN data at the elevation of CLB (2720 m a.s.l.), we used a weighted average of the data from the Grandes Rousses massif for the elevation bands 2700 and 3000 m.
SAFRAN data at CLB contain all the meteorological variables required to continuously run a land surface model at CLB without a data gap for the entire time period. SAFRAN data include 2 m wind speed, 2 m air temperature and humidity, incoming longwave and shortwave radiation and snowfall and rainfall amount at an hourly time step. Using SAFRAN data for driving a land surface model at CLB requires accounting for several limitations of this data set, in the interpretation of the results, especially for solid precipitation and wind speed and direction. Directly measuring solid precipitation at CLB has been abandoned for several years because of the strong undercatch under windy conditions (e.g. Kochendorfer et al., 2017) which could not be addressed adequately in situ (Naaim-Bouvet et al., 2014). Instead, SAFRAN data are used for solid precipitation, which uses observations at neighbouring sites.
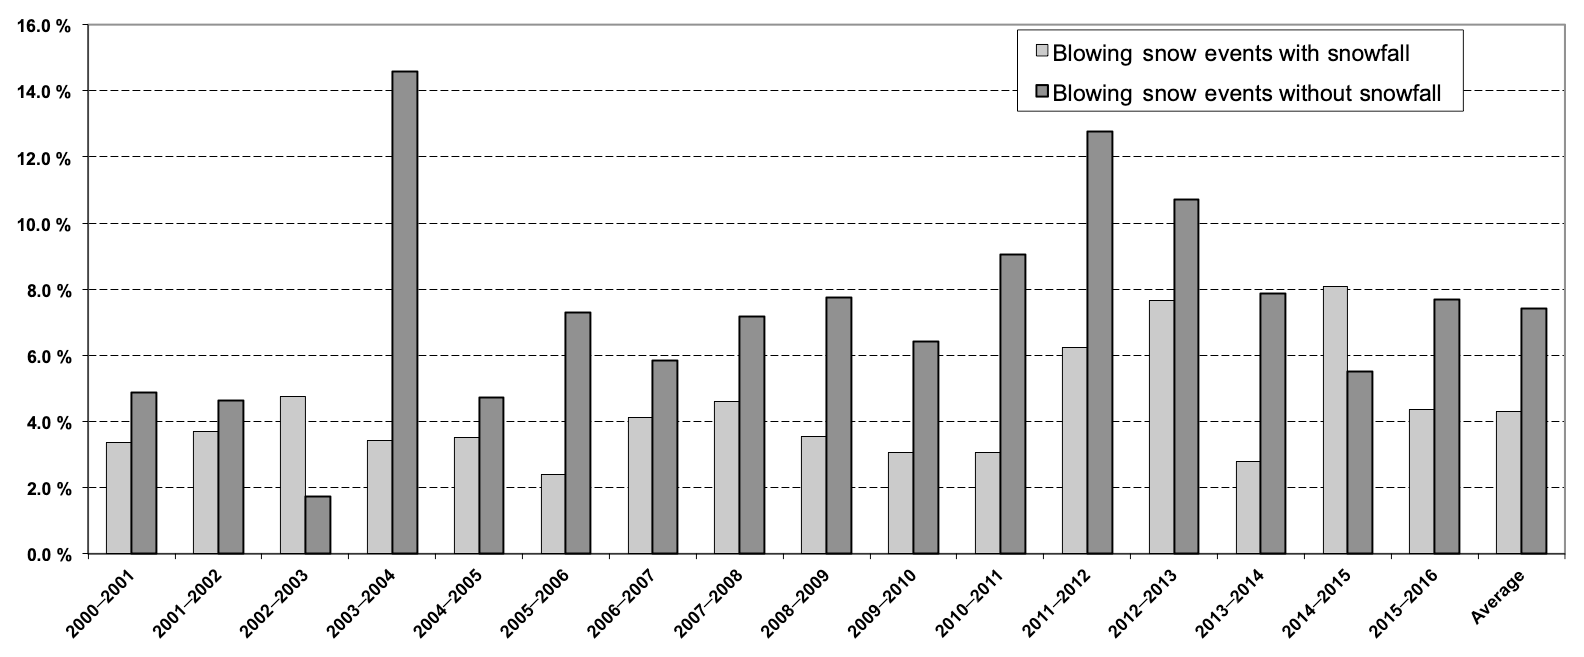
Figure 3Percentage of time when blowing snow events (with and without snowfall) are recorded for each winter (1 December to 31 March) over the period 2000–2016 at the Col du Lac Blanc experimental site.
Note, however, that the accuracy of the SAFRAN precipitation data is known to be limited at high elevation such as CLB, because of the restricted number of stations incorporated into the analysis above 2000 m (only 2 in the Grandes Rousses range) and the potential influence of wind undercatch at these stations. Gerbaux et al. (2005), Dumont et al. (2012) and Réveillet et al. (2018) compared SAFRAN total solid precipitation amounts on an annual scale and observed a winter mass balance of the Saint-Sorlin glacier (2650–3400 m) located in the Grandes Rousses 5 km away from CLB. They found an underestimation of SAFRAN winter precipitation ranging between 33 % and 42 %. At CLB, the underestimation is expected to be less since glaciers are generally preferential accumulation areas for a given elevation.
Wind speed is generally underestimated by SAFRAN at CLB due to the influence of the surrounding topography, which is not included in the conceptual representation of the topography in SAFRAN. It is recommended to replace SAFRAN wind speed and direction by the observations collected at CLB when running a land surface scheme at CLB, as described in Vionnet et al. (2013).
Blowing snow data stem from two sources: (i) a database of blowing snow occurrence from winter 2000–2001 to winter 2015–2016 and (ii) blowing snow fluxes derived from SPC-S7 from winter 2010–2011 to winter 2015–2016. These two data sets are described below as well as a comparison of the occurrence of blowing snow with the two methods.
3.1 Empirical database of blowing snow occurrence
A database of blowing snow events at CLB was established for each winter in the period 2000–2016. It consists of an extension of the database presented in Vionnet et al. (2013). This database was initially developed to provide a full record of blowing snow occurrence that can be compared with the avalanche activity in the Grandes Rousses massif (Guyomarc'h et al., 2014). Blowing snow events are defined as a time period in which snow on the ground is transported in the atmosphere in saltation and in turbulent suspension. Such events may occur with concurrent snowfall. Therefore, the database makes a distinction between blowing snow events with and without concurrent snowfall. The identification of a blowing snow event in the database relies on an empirical method that requires the combination of several data sets (wind, precipitation and snow depth) and their detailed analysis by an expert. This method is extensively described in Vionnet et al. (2013) and its main characteristics are summarized here.
Periods of concurrent snowfall and ground snow transport are identified first. They are defined as periods with precipitating snow (total snowfall from SAFRAN reanalysis greater than 5 mmSWE over the period) with a 5 m wind speed above the snow surface, U5, at AWS Lac Blanc higher than U5t=6 m s−1. This threshold wind speed followed the observations of Sato et al. (2008) collected during their wind-tunnel experiments on the processes of fracture and accumulation of snowflakes. U5 is obtained from wind speed and snow depth measured at AWS Lac Blanc using a standard logarithmic law for the vertical profile of wind speed near the surface, as in Vionnet et al. (2013). Periods of ground snow transport were then identified at an hourly time step from an analysis of the recordings from the snow depth sensor. This indirect method was developed and tested over 15 years of observations at Col du Lac Blanc and has been previously used in Guyomarc'h and Mérindol (1998) and Vionnet et al. (2013) to identify periods of snow transport. Positive values of the difference between the maximum and minimum snow depth recorded over an hour and associated large values of its standard deviation are characteristic of the presence of snow particles between the sensor and the surface of the snowpack. Snow particles in motion above the snowpack surface create interference in the ultrasonic signal. The results obtained for the period 2004–2016 were evaluated with a visual inspection of webcam images, in particular to improve the identification of blowing snow events with and without concurrent snowfall. This empirical method provides the start and end dates of each blowing snow event. Only events of longer than 4 h were recorded in the database to only include the main blowing events. Overall, the database contains information on the occurrence of blowing snow and the type of event (with or without snowfall) at an hourly time step.
Figure 3 shows an overview of the interannual variability of blowing snow occurrence reported in the database with a winter average ranging from 6.4 % in 2002–2003 to 19.0 % in 2011–2012. These values correspond to the sum of blowing occurrence with and without concurrent snowfall reported on Fig. 3. Using this method, blowing snow were identified during 11.7 % of time at Col du Lac Blanc over the period 2000–2016 and 36.7 % of time blowing snow were classified with concurrent snowfall. These estimations are similar to those reported in Vionnet et al. (2013) for the period 2001–2011.
3.2 Blowing snow sensors
The snow particle counter SPC-S7 (Niigata Electric) is an optical device (Sugiura et al., 1998) detecting snow particles between 40 and 500 µm in mean diameter by their shadows on a photodiode. The SPC-S7 has a self-steering wind vane. Its sampling area, perpendicular to horizontal wind vector, is 50 mm2 (2 mm × 25 mm). Assuming spherical blowing snow particles, the horizontal snow mass flux can be calculated as follows:
where qd is the horizontal snow mass (kg m−2 s−1) flux for the diameter d (m), nd is the number of drifting snow particles, S the sample area (m2), t the sample period (s) and ρp the density of the blowing snow particles (kg m−3). They blow as rounded grains, not snowflakes: the saltation process will quickly round the edges of original snowflakes and the grains become well rounded and are assumed to be spherical. The accuracy of mass flux measurement depends on blowing snow characteristics. Thus the particle density is set to the ice density and is equal to 917 kg m−3.
Time series of drifting snow fluxes were inspected and outliers were removed. The size distribution of blowing snow particles at a given height is represented by a gamma density function (Nishimura and Nemoto, 2005). That is why the size distribution recorded by SPC-7 is used to assess the temporal consistency of the blowing snow fluxes. Moreover, SPC calibration is performed prior to use at the beginning of the winter season.
Depending on the winter season, up to four SPC-S7s were installed on a mast (Bellot et al., 2016) at AWS Col (Table 1). The SPC-S7s could be raised manually when the snow depth increased. Horizontal snow flux is highly dependent on height above the snow surface. Because of snowfall and blowing snow events the elevation of the SPC-S7 above the snow varied substantially during the winter season preventing any direct comparison over time. That is why, in the present database, the snow fluxes near the surface (that means the snow flux provided by the SPC-S7 closest to the snow surface) and the corresponding height of the sensor are provided. When available, snow fluxes at higher positions are used to derive two standardize values of the horizontal snow mass flux: (i) the flux at 1 m above the snow surface and (ii) the flux vertically integrated over 1 m (between 0.2 and 1.2 m over the snow surface). The computation of these fluxes is described below.
According to the diffusion theory of snowdrift, it is possible to approximate the averaged drift density (kg m−3) as a function of height and wind velocity (Radok, 1977; Gordon and Taylor, 2009). If the average wind profile is approximated by a power law, the vertical distribution function for the snow flux q(z) (kg m−2 s−1) is expressed as follows:
where A is a calibration parameter and m the exponent which is independent of z; both are derived by regression from measured data (Trouvilliez et al., 2015; Bellot et al., 2016) and are calculated at each 10 min time step. From this, the mean horizontal snow flux at 1 m and vertically integrated over 1 m can be estimated.
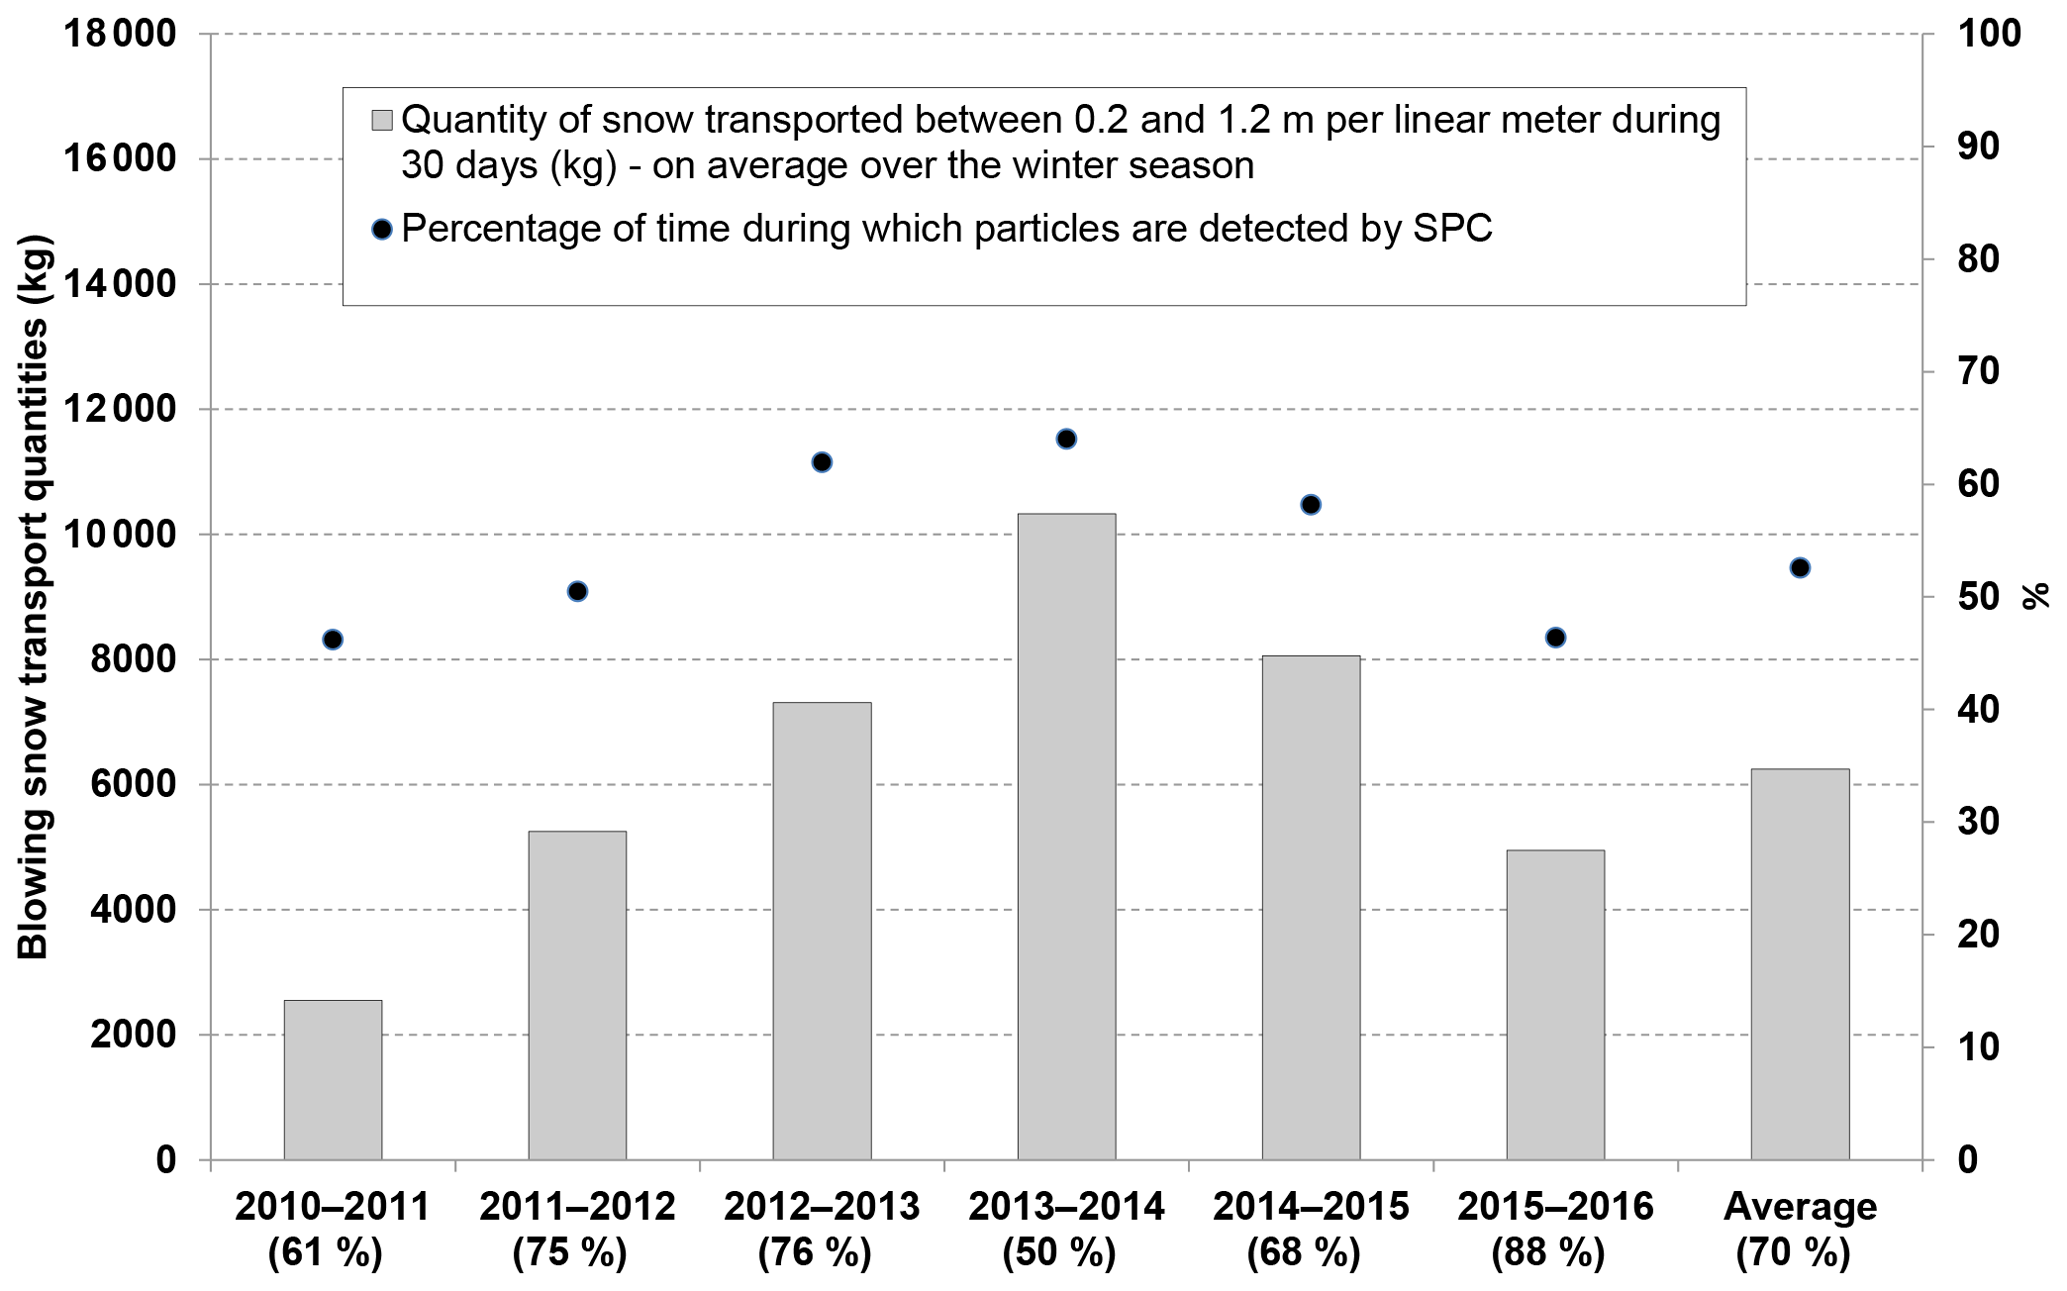
Figure 4Percentage of time when snow particles are detected by SPC-S7 for each winter (1 December to 31 March) during the period 2010–2016 at the Col du Lac Blanc experimental site and the corresponding quantity of snow transported between 0.2 and 1.2 m per linear metre. Due to missing or invalid SPC-S7 data, the length of the time series varies from a winter season to another winter season, making it difficult to study the interannual variability of blowing snow intensity. To overcome this, an average quantity of snow transported between 0.2 and 1.2 m per linear metre during 30 days has been calculated. Numbers in brackets indicate the percentage of valid data delivered by the SPC-S7 during the considered winter season: it provides a confidence index for the data.
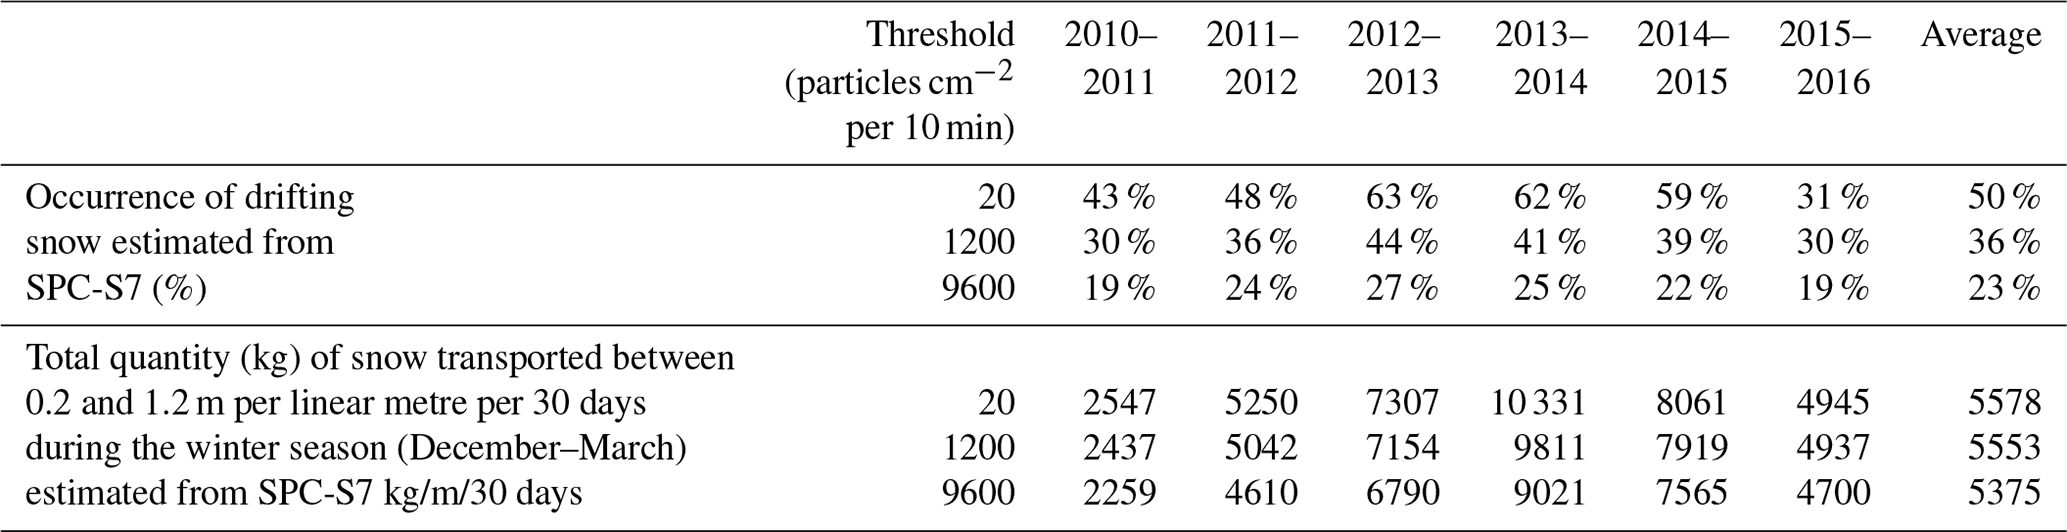
Table 2Occurrence of drifting snow and total quantity of snow transported between 0.2 and 1.2 m per linear metre per 30 days for different threshold values.
Nevertheless, this typical profile is not always observed or cannot be determined in situations when
-
only one sensor provides data,
-
snow flux at different heights are not significantly different (e.g. falling snow with low wind speed),
-
data are physically inconsistent (flux at the higher position is much greater than near the surface, for example due to icing of the self-steering wind vane of the lowest SPC-S7).
Therefore the SPC-S7 data were processed as follows. First, a filter was applied to the raw data to suppress possible electronic noise: events with a particle flux smaller than 20 particle cm−2 during 10 min were discarded and set to zero. Then, an algorithm was designed and used to categorize each 10 min profile of SPC-S7 data set into six different groups (specified in the database):
-
undetermined: only one sensor provides data making it impossible to do the vertical interpolation;
-
power_law: the vertical distribution function can be expressed as a power law (Eq. 2);
-
inconsistent: data are physically inconsistent;
-
mean: snow fluxes at different heights are not significantly different, so that the mean horizontal snow flux at 1 m is estimated by the average of the measured flux;
-
no_flux: in this case, no sensor among the SPC-S7 in the vertical profile detects more than 20 particles per cm2 in 10 min;
-
maintenance: during sensor maintenance, data acquisition is stopped.
When possible (power law and mean), the mean horizontal snow fluxes are determined at 1 m and vertically integrated over 1 m (between 0.2 and 1.2 m).
Table 3Ratio between the quantity of snow transported between 0.2 and 1.2 m per linear metre during the periods identified as blowing snow periods in the empirical database and the total quantity of snow observed during the same winter season.
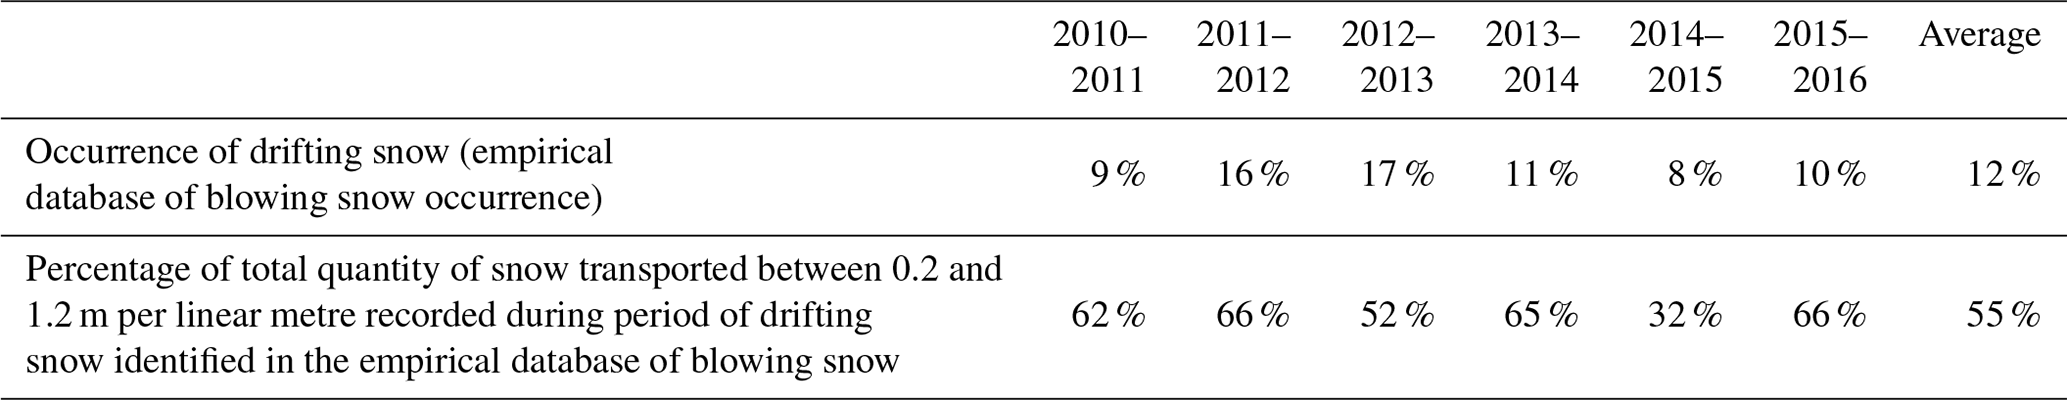
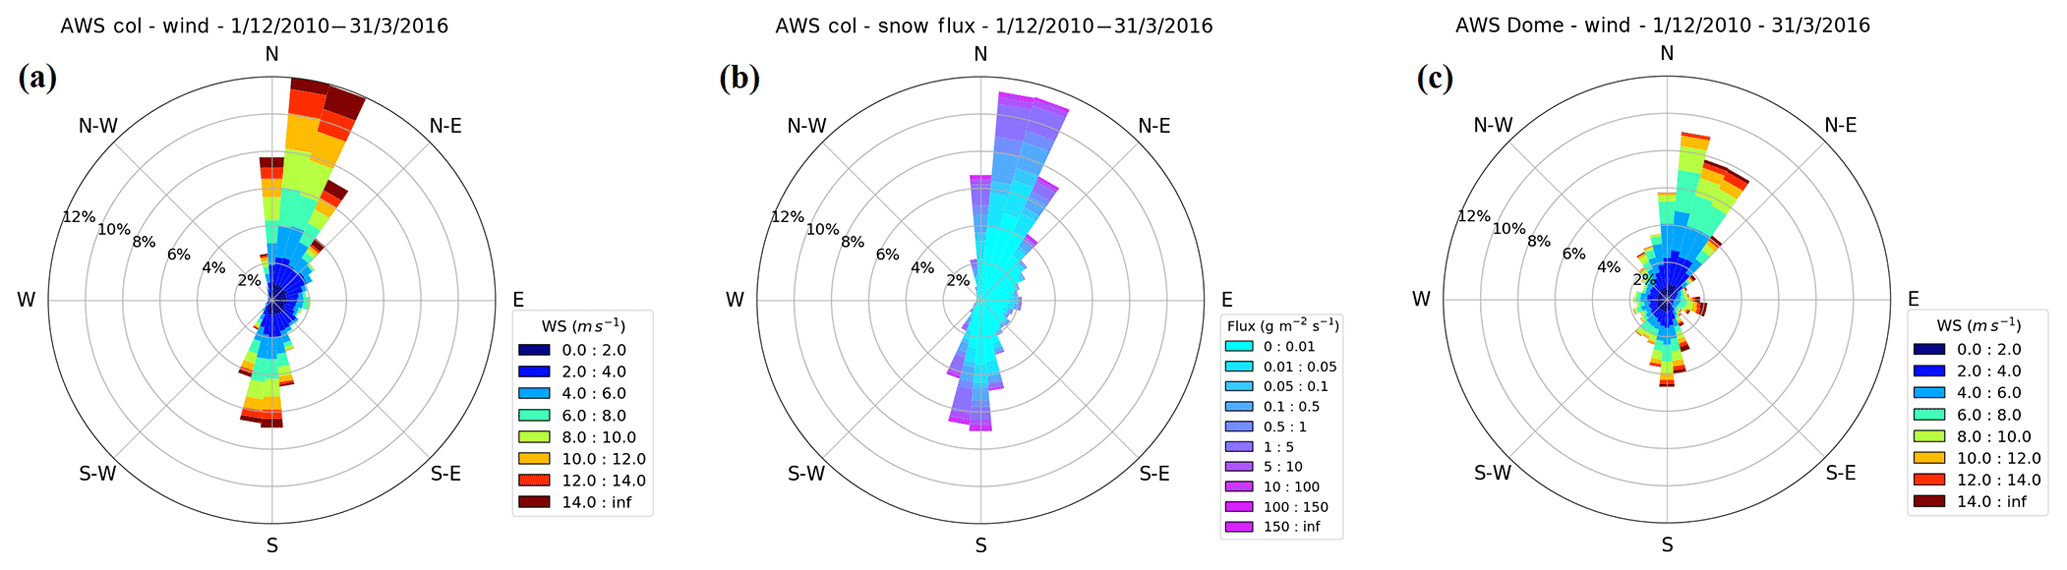
Figure 5Overview of the period 2010–2016: (a) wind rose for the AWS Col, (b) rose of blowing snow fluxes at AWS Col with snow flux vertically integrated over 1 m between 0.2 and 1.2 m and (c) wind rose for the AWS Dome. Yearly wind roses and roses of blowing snow fluxes are provided as a supplement.
Figure 4 shows an overview of the interannual variability of blowing snow occurrence and intensity derived from the SPC-S7. They measured non-zero snow flux during a percentage of time ranging from 43 % in 2010–2011 to 63 % in 2013–2014 corresponding to an average blowing snow transport quantities between 0.2 and 1.2 m per linear metre during 30 days, ranging from 2547 kg in 2010–2011 to 10 331 kg in 2013–2014. Overall, for the period 2010–2016, SPC-S7 provided a non-zero value during 50 % of time and an average quantity of snow transported between 0.2 and 1.2 m per linear metre and per 30 days of 6245 kg. However, SPC-S7 can detect individual snow particles and can report a positive signal (particle number larger than 20 particles cm−2 during 10 min) even during very light snowfall events with low wind. This period is considered as a blowing snow period, even if it does not significantly contribute to the total amount of transported snow. For this reason, we quantified the sensitivity of the estimations of blowing snow occurrence and amount to the threshold value used to set flux to zero. Results are presented on Table 2. Three threshold values were tested: (i) the initial value of 20 particles per cm2 per 10 min used to remove to electronic noise, (ii) a threshold value 1200 particles cm−2 per 10 min as in Naaim-Bouvet et al. (2014) and (ii) a value of 9600 particles cm−2 per 10 min. Table 2 shows that the estimation of blowing snow occurrence is highly dependent on the threshold values, whereas blowing snow quantities remain quite stable in the chosen range. It is therefore essential to provide the chosen threshold value to end users when determining blowing snow occurrence from SPC-S7. In general, it might be better to use blowing snow fluxes to characterize blowing snow events.
3.3 Comparison between empirical database of blowing snow occurrence and data from SPC-S7 devices
The estimation of blowing snow occurrence determined with the SPC-S7 reported on Table 2 differs from the results obtained with the empirical database (Fig. 3). To gain more understanding of these differences, we determined the quantity of snow transported between 0.2 and 1.2 m per linear metre during the periods identified as blowing snow periods in the empirical database and we compared this value with the total quantity of snow transported between 0.2 and 1.2 m per linear metre derived with the SPC-S7 for the same winter season. The result is expressed as a percentage in Table 3. It shows that the empirical database of blowing snow occurrence detects 55 % of the total transported snow mass measured by the SPC-S7. This results from the non-detection of blowing snow events of low to moderate intensity with the empirical method as discussed in Vionnet et al. (2013). This method only reports the main blowing snow events. This mainly results from assumptions made in the method: the minimal event duration is set to 4 h and only periods with wind speed greater than 6 m s−1 are included during snowfall. Therefore, the estimation of blowing snow occurrence with the empirical method (12.0 % of the time for the period 2010–2016; Table 3) constitutes a lower bound for the estimation of blowing snow occurrence at CLB. SPC-S7 provides estimations ranging between 23 and 50 % of the time, depending on the threshold value used when filtering the SPC-S7 data as discussed in the previous section.
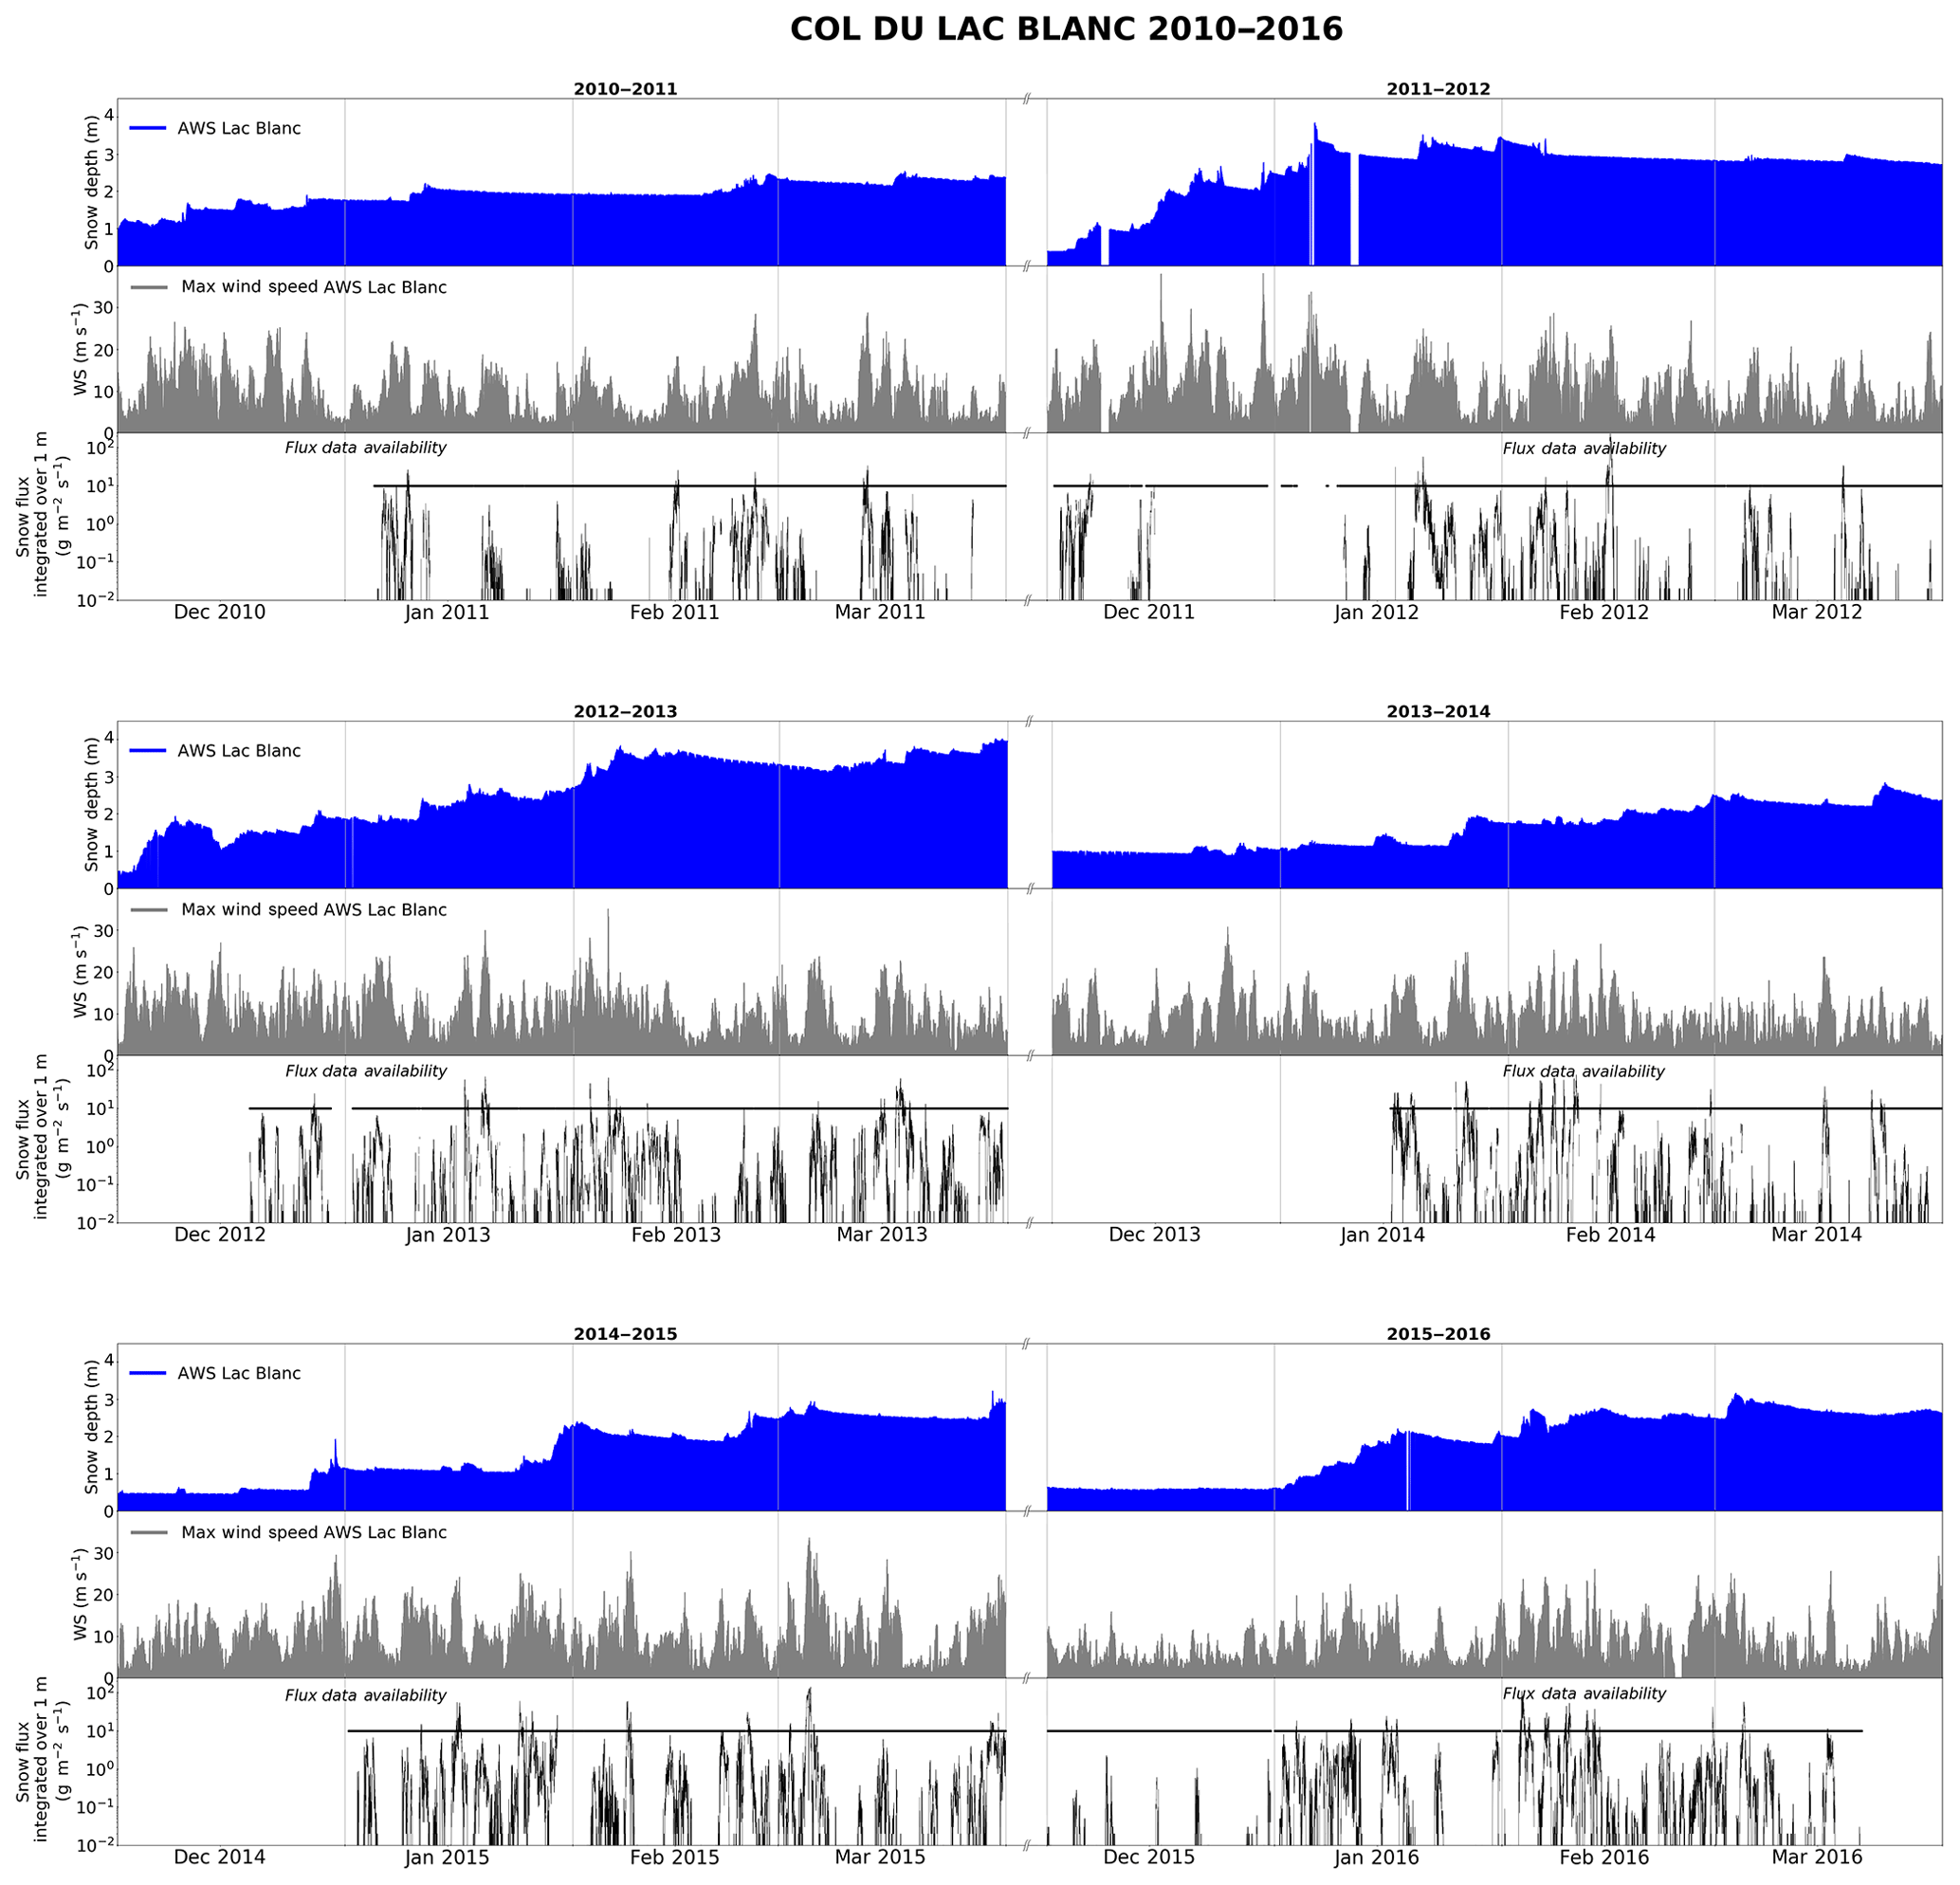
Figure 6Overview of snow depth (AWS Lac Blanc), maximum wind speed (AWS Lac Blanc) and blowing snow fluxes measured by SPC-S7 vertically integrated between 0.2 and 1.2 m (AWS Col) from 2010 to 2016. More detailed yearly graphs are provided as a supplement for each snow season from 2000–2001 to 2015–2016.
Table 4Overview of the available data with the corresponding DOIs.

The empirical database of blowing snow events and the SPC-S7 data are two sources of information on blowing snow occurrence and intensity at CLB. We recommend the use of SPC-S7 data for the study of blowing snow processes and the evaluation of models at fine temporal scales, whereas the empirical database of blowing snow events can be used to evaluate reanalysis or output of regional climate models on a longer term. Compared to the SPC-S7 data, the empirical database covers a longer time period (11 additional years: 2000–2010). It also provides continuous hourly estimations of blowing snow occurrence, whereas about 25 % of the SPC-S7 data can be considered as invalid or missing over the period 2010–2016 (Fig. 4).
Figures 5 and 6 illustrate the meteorological and blowing snow conditions at the site for the last six snow seasons (2010–2016). In particular, Fig. 5 shows the strong control exerted by the local topography on the atmospheric flow at the pass. Indeed, the wind field at AWS Lac Blanc (Fig. 5a) was characterized by a channelling along a north–south axis and an increase in wind speed compared to AWS Dome (Fig. 5c), located on the top of the Dôme des Petites Rousses and less influenced by the local topography (Fig. 1). The distribution of blowing snow fluxes (Fig. 5b) was quite consistent with the distribution of wind speed at the site (Fig. 5a). Figure 6 shows an overview of snow depth, maximum wind speed and blowing snow fluxes measured at the site over the last six seasons. A strong interannual variability was found in terms of snow depth, with a maximum snow depth reaching 4.01 m in 2012–2013 and only 2.84 m for winter 2013–2014. The mean snow depth value during the 2010–2016 period was 1.99 m. Events with a maximum wind speed above 15 m s−1 were frequently measured at the site. These windy events were generally associated with blowing snow events if erodible snow was present at the snow surface. The intensity of these events varied greatly (note the logarithmic scale on the graphs showing blowing snow fluxes). Additional and more detailed summary plots for each year of the present data set are provided as a supplement to this article.
The database (https://doi.org/10.17178/CRYOBSCLIM) presented and described in this article is available for download at http://doi.osug.fr/public/CRYOBSCLIM_CLB/index.html (last access: 3 December 2018). The digital elevation model of the study area (1.5 km2 – see Supplement) at 1 m resolution is also provided in RGF 93 Lambert 93 coordinates. Available data and the corresponding DOIs are introduced in Table 4. The data of the winters 2016–2017 and 2017–2018 and of the upcoming years will be added to the database on a yearly basis and made available to the community through the CRYOBSCLIM data portal (available at: http://data.cryobsclim.fr, last access: 3 December 2018).
The Col du Lac Blanc is a unique high-elevation experimental site in the French Alps where meteorological and blowing snow data are automatically acquired. This site is dedicated to studies of snow–atmosphere interactions and wind-induced snow transport. Sixteen years of quality controlled data have been combined and made freely accessible for the scientific community. They are composed of meteorological data from four automatic stations and a reanalysis product, a database of the main blowing snow events that occurred at the site over 16 years and 6 years of automatic measurements of blowing snow fluxes with snow particles counters SPC-S7. These high-quality data have been already used to evaluate snow redistribution models for specific blowing snow events or years (Schön et al., 2015; Vionnet et al., 2014, 2017, 2018) and to carry out detailed analysis of the physics of snow transport (Naaim-Bouvet et al., 2010, 2011; Nishimura et al., 2014). We anticipate that these data will be used in the future in modelling studies of snow accumulation over multiple snow seasons to better understand the links between the occurrence and intensity of blowing snow events and meteorological and snow conditions. We hope that further instrumental developments will allow us to improve the monitoring of snow–atmosphere interactions at this site for the benefit of the snow, avalanche, mountain hydrology and weather forecasting communities.
The supplement related to this article is available online at: https://doi.org/10.5194/essd-11-57-2019-supplement.
FN, MN, VV and YvD endorse or endorsed the scientific responsibility of the experimental site. GG, HB, YaD, PP and FF endorse or endorsed the technical responsibility of the experimental site and the instruments. HB, YaD and GG prepared and treated the data set. KN provided expertise on the treatment of SPC-S7 data. VV and FN wrote the manuscript together with all co-authors.
The authors declare that they have no conflict of interest.
This article is part of the special issue “Hydrometeorological data from mountain and alpine research catchments”. It is not associated with a conference.
The authors would like to thank Fred Ousset and Xavier Ravanat for their
valuable help in the field, Isabelle Gouttevin, Fatima Karbou and Hugo
Merzisen for past and future involvment. We also would like to acknowledge
SATA (Socièté d'Aménagement Touristique de l'Alpe d'Huez et des
Grandes Rousses), who provided logistical support and OSUG-DC for hosting the
data. Col du Lac Blanc is a part of IR OZCAR and receives financial support
from OSUG, LabEx OSUG@2020, Météo-France and Irstea. CNRM/CEN and
Irstea are part of LabEx OSUG@2020 (ANR10 LABX56).
Edited by: John Pomeroy
Reviewed by: three anonymous referees
Bellot, H., Guyomarc'h, G., Naaim-Bouvet, F., Vionnet, V., Fontaine, F., and Deliot, Y.: Available data from the French experimental site Col du Lac Blanc dedicated to studies on drifting snow: a 15-year database, in: Proceeding of International Snow Science Workshop, Breckenridge, Colorado, 3–7 October 2016, 613–620, 2016.
Cierco, F. X., Naaim-Bouvet, F., and Bellot, H.: Acoustic sensors for snowdrift measurements: How should they be used for research purposes?, Cold Reg. Sci. Technol., 49, 74–87, https://doi.org/10.1016/j.coldregions.2007.01.002, 2007.
Dumont, M., Durand, Y., Arnaud, Y., and Six, D.: Variational assimilation of albedo in a snowpack model and reconstruction of the spatial mass-balance distribution of an alpine glacier, J. Glaciol., 58, 151–164, https://doi.org/10.3189/2012JoG11J163, 2012.
Durand, Y., Brun, E., Merindol, L., Guyomarch, G., Lesaffre, B., and Martin, E.: A meteorological estimation of relevant parameters for snow models, Ann. Glaciol., 18, 65–71, https://doi.org/10.3189/S0260305500011277, 1993.
Durand, Y., Guyomarc'h, G., Mérindol, L., and Corripio, J. G.: Improvement of a numerical snow drift model and field validation, Cold Reg. Sci. Technol., 43, 93–103, https://doi.org/10.1016/j.coldregions.2005.05.008, 2005.
Durand, Y., Laternser, M., Giraud, G., Etchevers, P., Lesaffre, B., and Mérindol, L.: Reanalysis of 44 yr of climate in the french alps (1958–2002): Methodology, model validation, climatology, and trends for air temperature and precipitation, J. Appl. Meteorol. Clim., 48, 429–449, https://doi.org/10.1175/2008JAMC1808.1, 2009.
Egli, L., Jonas, T., Grünewald, T., Schirmer, M., and Burlando, P.: Dynamics of snow ablation in a small Alpine catchment observed by repeated terrestrial laser scans, Hydrol. Process., 26, 1574–1585, https://doi.org/10.1002/hyp.8244, 2012.
Filhol, S. and Sturm, M.: Snow bedforms: A review, new data, and a formation model, J. Geophy. Res.-Earth, 120, 1645–1669, https://doi.org/10.1002/2015JF003529, 2015.
Gaillardet, J., Braud, I., Hankard, F., et al.: OZCAR: the French network of critical zone observatories, Vadose Zone J., 17, 180067, https://doi.org/10.2136/vzj2018.04.0067, 2018.
Gerbaux, M., Genthon, C., Etchevers, P., Vincent, C., and Dedieu, J. P.: Surface mass balance of glaciers in the French Alps: distributed modeling and sensitivity to climate change, J. Glaciol., 51, 561–572, https://doi.org/10.3189/172756505781829133, 2005.
Gordon, M. and Taylor, P. A.: Measurements of blowing snow, Part 1: Particle shape, size distribution, velocity, and number flux at Churchill, Manitoba, Canada, Cold Reg. Sci. Technol., 55, 63–74, https://doi.org/10.1016/j.coldregions.2008.05.001, 2009.
Guyomarc'h, G. and Merindol, L.: Validation of an application for forecasting blowing snow, Ann. Glaciol., 26, 138–143, https://doi.org/10.3189/1998AoG26-1-138-143, 1998.
Guyomarc'h, G., Goetz, D., Vionnet, V., Naaim-Bouvet, F., and Deschâtres, M.: Observation of Blowing Snow Events and Associated Avalanche Occurrences, in: Proceeding of International Snow Science Workshop, Banff, Canada, 29 September–3 October 2014, 445–452, 2014.
Guyomarc'h, G., Bellot, H., Vionnet, V., Naaim Bouvet, F., Déliot, Y., Fontaine, F., Puglièse, P., Durand, Y., Nishimura, K., and Naaim, M.: Lac Blanc, Automatic Weather Station, CNRS – OSUG – Meteo France – Irstea, https://doi.org/10.17178/CRYOBSCLIM.CLB.LACBLANC, 2018a.
Guyomarc'h, G., Bellot, H., Vionnet, V., Naaim Bouvet, F., Déliot, Y., Fontaine, F., Puglièse, P., Durand, Y., Nishimura, K., and Naaim, M.: Muzelle, Automatic Weather Station, CNRS – OSUG – Meteo France – Irstea, https://doi.org/10.17178/CRYOBSCLIM.CLB.MUZELLE, 2018b.
Guyomarc'h, G., Bellot, H., Vionnet, V., Naaim Bouvet, F., Déliot, Y., Fontaine, F., Puglièse, P., Durand, Y., Nishimura, K., and Naaim, M.: Dome, Automatic Weather Station, CNRS – OSUG – Meteo France – Irstea, https://doi.org/10.17178/CRYOBSCLIM.CLB.DOME, 2018c.
Guyomarc'h, G., Bellot, H., Vionnet, V., Naaim Bouvet, F., Déliot, Y., Fontaine, F., Puglièse, P., Durand, Y., Nishimura, K., and Naaim, M.: Col, Automatic Weather Station, CNRS – OSUG – Meteo France – Irstea, https://doi.org/10.17178/CRYOBSCLIM.CLB.COL, 2018d.
Guyomarc'h, G., Bellot, H., Vionnet, V., Naaim Bouvet, F., Déliot, Y., Fontaine, F., Puglièse, P., Durand, Y., Nishimura, K., and Naaim, M.: Col du Lac Blanc, Hourly blowing snow occurrence, CNRS – OSUG – Meteo France – Irstea, https://doi.org/10.17178/CRYOBSCLIM.CLB.BSO, 2018e.
Guyomarc'h, G., Bellot, H., Vionnet, V., Naaim Bouvet, F., Déliot, Y., Fontaine, F., Puglièse, P., Durand, Y., Nishimura, K., and Naaim, M.: Col du Lac Blanc, SAFRAN meteorological data, CNRS – OSUG – Meteo France – Irstea, https://doi.org/10.17178/CRYOBSCLIM.CLB.SAFRAN, 2018f.
Guyomarc'h, G., Bellot, H., Vionnet, V., Naaim Bouvet, F., Déliot, Y., Fontaine, F., Puglièse, P., Durand, Y., Nishimura, K., and Naaim, M.: Col du Lac Blanc, Digital Elevation Model, CNRS – OSUG – Meteo France – Irstea, https://doi.org/10.17178/CRYOBSCLIM.CLB.DEM, 2018g.
Kochendorfer, J., Rasmussen, R., Wolff, M., Baker, B., Hall, M. E., Meyers, T., Landolt, S., Jachcik, A., Isaksen, K., Brækkan, R., and Leeper, R.: The quantification and correction of wind-induced precipitation measurement errors, Hydrol. Earth Syst. Sci., 21, 1973–1989, https://doi.org/10.5194/hess-21-1973-2017, 2017.
Lejeune, Y., Dumont, M., Panel, J.-M., Lafaysse, M., Lapalus, P., Le Gac, E., Lesaffre, B., and Morin, S.: 57 years (1960–2017) of snow and meteorological observations from a mid-altitude mountain site (Col de Porte, France, 1325 m of altitude), Earth Syst. Sci. Data, 11, 71–88, https://doi.org/10.5194/essd-11-71-2019, 2019.
Lun, F., Liu, J., Ciais, P., Nesme, T., Chang, J., Wang, R., Goll, D., Sardans, J., Peñuelas, J., and Obersteiner, M.: Global and regional phosphorus budgets in agricultural systems and their implications for phosphorus-use efficiency, Earth Syst. Sci. Data, 10, 1–18, https://doi.org/10.5194/essd-10-1-2018, 2018.
Morin, S., Lejeune, Y., Lesaffre, B., Panel, J.-M., Poncet, D., David, P., and Sudul, M.: An 18-yr long (1993–2011) snow and meteorological dataset from a mid-altitude mountain site (Col de Porte, France, 1325 m alt.) for driving and evaluating snowpack models, Earth Syst. Sci. Data, 4, 13–21, https://doi.org/10.5194/essd-4-13-2012, 2012.
Mott, R., Schirmer, M., Bavay, M., Grünewald, T., and Lehning, M.: Understanding snow-transport processes shaping the mountain snow-cover, The Cryosphere, 4, 545–559, https://doi.org/10.5194/tc-4-545-2010, 2010.
Naaim-Bouvet, F., Bellot, H., and Naaim, M.: Back analysis of drifting-snow measurements over an instrumented mountainous site, Ann. Glaciol., 51, 207–217, https://doi.org/10.3189/172756410791386661, 2010.
Naaim-Bouvet, F., Naaim, M., Bellot, H., and Nishimura, K.: Wind and drifting-snow gust factor in an Alpine context, Ann. Glaciol., 52, 223–230, https://doi.org/10.3189/172756411797252112, 2011.
Naaim-Bouvet, F., Bellot, H., Nishimura, K., Genthon, C., Palerme, C., Guyomarc'h, G., and Vionnet, V.: Detection of snowfall occurrence during blowing snow events using photoelectric sensors, Cold Reg. Sci. Technol., 106, 11–21, https://doi.org/10.1016/j.coldregions.2014.05.005, 2014.
Naaim-Bouvet, F., Picard, G., Bellot, H., Arnaud, L., and Vionnet, V. : Snow surface roughness monitoring using time-lapse terrestrial laserscan in: Proceeding of International Snow Science Workshop, Breckenridge, Colorado, 3–7 October 2016, 649–654, 2016.
Nishimura, K. and Nemoto, M.: Blowing snow at Mizuho station, Antarctica, Philos. Trans. A, 363, 1647–1662, https://doi.org/10.1098/rsta.2005.1599, 2005.
Nishimura, K., Yokoyama, C., Ito, Y., Nemoto, M., Naaim-Bouvet, F., Bellot, H., and Fujita, K.: Snow particle speeds in drifting snow, J. Geophys. Res.-Atmos., 119, 9901–9913, https://doi.org/10.1002/2014JD021686, 2014.
Pomeroy, J. W. and Gray, D. M.: Snowcover accumulation, relocation and management'. National Hydrology Research Institute Science Report No. 7, NHRI, Environment Canada, Saskatoon, 144 pp., 1995.
Radok, U.: Snow drift, J. Glaciol., 19, 123–139, 1977.
Réveillet, M., Six, D., Vincent, C., Rabatel, A., Dumont, M., Lafaysse, M., Morin, S., Vionnet, V., and Litt, M.: Relative performance of empirical and physical models in assessing the seasonal and annual glacier surface mass balance of Saint-Sorlin Glacier (French Alps), The Cryosphere, 12, 1367–1386, https://doi.org/10.5194/tc-12-1367-2018, 2018.
Revuelto, J., Vionnet, V., López-Moreno, J. I., Lafaysse, M., and Morin, S.: Combining snowpack modeling and terrestrial laser scanner observations improves the simulation of small scale snow dynamics, J. Hydrol., 533, 291–307, https://doi.org/10.1016/j.jhydrol.2015.12.015, 2016.
Sato, T., Kosugi, K., Mochizuki, S., and Nemoto, M.: Wind speed dependences of fracture and accumulation of snowflakes on snow surface, Cold Reg. Sci. Technol., 51, 229–239, https://doi.org/10.1016/j.coldregions.2007.05.004, 2008.
Schön, P., Naaim-Bouvet, F., Vionnet, V., and Prokop, A.: Merging a terrain-based parameter with blowing snow fluxes for assessing snow distribution in alpine terrain, Cold Reg. Sci. Technol., 155, 162–173, https://doi.org/10.1016/j.coldregions.2018.08.002, 2018.
Schön, P., Prokop, A., Vionnet, V., Guyomarc'h, G., Naaim-Bouvet, F., and Heiser, M.: Improving a terrain-based parameter for the assessment of snow depths with TLS data in the Col du Lac Blanc area, Cold Reg. Sci. Technol., 114, 15–26, https://doi.org/10.1016/j.coldregions.2015.02.005, 2015.
Schirmer, M., Wirz, V., Clifton, A., and Lehning, M.: Persistence in intra–annual snow depth distribution: 1. Measurements and topographic control, Water Resour. Res., 47, W09516, https://doi.org/10.1029/2010WR009426, 2011.
Schweizer, J., Jamieson, J. B., and Schneebeli, M.: Snow avalanche formation. Rev. Geophys., 41, 1016, https://doi.org/10.1029/2002RG000123, 2003.
Sugiura, K., Nishimura, K., Maeno, N., and Kimura, T.: Measurements of snow mass flux and transport rate at different particle diameters in drifting snow, Cold Reg. Sci. Technol., 27, 83–89, https://doi.org/10.1016/S0165-232X(98)00002-0,1998.
Trouvilliez, A., Naaim-Bouvet, F., Bellot, H., Genthon, C., and Gallée, H.: Evaluation of the FlowCapt Acoustic Sensor for the Aeolian Transport of Snow. J. of Atmos. Ocean. Tech., 32, 1630–1641, https://doi.org/10.1175/JTECH-D-14-00104.1, 2015.
Vionnet, V., Guyomarc'h, G., Naaim-Bouvet, F., Martin, E., Durand, Y., Bellot, H., Bel C., and Puglièse, P.: Occurrence of blowing snow events at an alpine site over a 10-year period: observations and modelling, Adv. Water Resour., 55, 53–63, https://doi.org/10.1016/j.advwatres.2012.05.004, 2013.
Vionnet, V., Martin, E., Masson, V., Guyomarc'h, G., Naaim-Bouvet, F., Prokop, A., Durand, Y., and Lac, C.: Simulation of wind-induced snow transport and sublimation in alpine terrain using a fully coupled snowpack/atmosphere model, The Cryosphere, 8, 395–415, https://doi.org/10.5194/tc-8-395-2014, 2014.
Vionnet, V., Martin, E., Masson, V., Lac, C., Naaim Bouvet, F., and Guyomarc'h, G.: High-Resolution Large Eddy Simulation of Snow Accumulation in Alpine Terrain, J. Geophys. Res.-Atmos., 122, 11005–11021, https://doi.org/10.1002/2017JD026947 , 2017.
Vionnet, V., Guyomarc'h, G., Lafaysse, M., Naaim-Bouvet, F., Giraud, G., and Deliot, Y., Operational implementation and evaluation of a blowing snow scheme for avalanche hazard forecasting, Cold Reg. Sci. Technol., 147, 1–10, https://doi.org/10.1016/j.coldregions.2017.12.006, 2018.