the Creative Commons Attribution 4.0 License.
the Creative Commons Attribution 4.0 License.
 | 26 Feb 2019
Field investigations of coastal sea surface temperature drop after typhoon passages
Jen-Ping Peng
Alexander V. Babanin
Sea surface temperature (SST) variability affects marine ecosystems, fisheries, ocean primary productivity and human activities and is the primary influence on typhoon intensity. SST drops of a few degrees in the open ocean after typhoon passages have been widely documented; however, few studies have focused on coastal SST variability. The purpose of this study is to determine typhoon-induced SST drops in the near-coastal area (within 1 km of the coast) and understand the possible mechanism. The results of this study were based on extensive field data analysis. Significant SST drop phenomena were observed at the Longdong Buoy in northeastern Taiwan during 43 typhoons over the past 20 years (1998–2017). The mean SST drop (ΔSST) after a typhoon passage was 6.1 ∘C, and the maximum drop was 12.5 ∘C (Typhoon Fungwong in 2008). The magnitude of the SST drop was larger than most of the observations in the open ocean. The mean duration of the SST drop was 24 h, and on average, 26.1 h were required for the SST to recover to the original temperature. The coastal SST drops at Longdong were correlated with the moving tracks of typhoons. When a typhoon passes south of Longdong, the strong and persistent longshore winds induce coastal upwelling and pump cold water up to the surface, which is the dominant cause of the SST drops along the coast. In this study, it was determined that cold water mainly intruded from the Kuroshio subsurface into the Okinawa Trough, which is approximately 50 km from the observation site. The magnitude of coastal SST drops depends on the area of overlap between typhoons generating strong winds and the Kuroshio. The dataset used in this study can be accessed from https://doi.org/10.1594/PANGAEA.895002.
- Article
(7613 KB) - Full-text XML
- BibTeX
- EndNote


Sea surface temperature (SST) drops after typhoon (hurricane) passages have been widely known and reported in the world's oceans, including the northwestern Pacific (Sakaida et al., 1998; Tsai et al., 2008a, b, 2013; Chen et al., 2003; Wada, 2005; Wada et al., 2009; Chang et al., 2008; Wu et al., 2008; Morimoto et al., 2009; Hung et al., 2010; Park and Kim, 2010; Kuo et al., 2011; Sun et al., 2015; Subrahmanyam, 2015), northeastern Pacific (Bingham, 2007), Indian Ocean (Rao et al., 2004; Gopalakrishna et al., 1993) and South China Sea (Shang et al., 2008; Jiang et al., 2009; Tseng et al., 2010; Chiang et al., 2011). Upwelling, entrainment (vertical mixing) and the intrusion of cold water are the possible mechanisms of the SST drop. Upwelling is the process that the cold water in the subsurface rises toward the surface due to wind or bathymetry effects. The entrainment is a vertical turbulent mixing (VTM) process that causes ocean mixed layer (OML) deepening and results in a cooler OML temperature. The intrusion of cold water may come from the surface in another sea area or subsurface locally. SST drops are larger in scale following a typhoon passage than under regular temperature variability and may affect marine ecosystems and the primary productivity of the ocean (Lin et al., 2003b; Siswanto et al., 2007). Cold water increases nutrients for marine life. Several studies (Babin et al., 2004; Hanshaw et al., 2008; Liu et al., 2009; Kawai and Wada, 2011; Cheung et al., 2013; Xu et al., 2017) have reported that chlorophyll a increases when SST drops after the passages of tropical cyclones. In contrast, fish species that cannot tolerate cold may die if the water temperature drops dramatically over a short period of time. In addition, the water temperature has a major impact on human comfort and safety in leisure activities.
The SST drop caused by typhoons rarely exceeds 6 ∘C (Wentz et al., 2000). Price (1981) presented SST drops of 3 and 1 ∘C in US waters during Hurricane Eloise in 1975 and Hurricane Belle in 1976, respectively. He noted that the SST decrease beneath a moving hurricane was mainly caused by entrainment. Stronger wind stress and the associated curl surface wind trigger more substantial ocean mixing and induce the mixing of sea surface water with colder and deeper waters. Wada et al. (2009) studied the role of VTM in sea surface cooling during typhoon Rex in 1998 in the northwestern Pacific Ocean near Japan, during which the SST dropped by nearly 3 ∘C. They concluded that sea surface cooling was caused by shear-induced VTM during the fast-moving phase of the typhoon; in contrast, sea surface cooling was caused by Ekman pumping during the slow phase of the typhoon. Notably, unless the waters are very shallow, the wind-mixing mechanism usually occurs through the action of wind-generated waves. Such wave-induced mixing has been studied in tropical cyclone conditions (Ghantous and Babanin, 2014) and through measurements obtained during tropical cyclones (Toffoli et al., 2012), and this mixing was shown to cool the surface on a scale of a few hours of cyclone forcing. Turbulence plays an important role in the heat, momentum and energy balances of the ocean. Huang et al. (2012) measured the upper ocean turbulence dissipation associated with wave–turbulence interactions in the South China Sea. Their results contribute to understanding the SST drop induced by wave mixing.
The South China Sea (SCS) is one of the largest semienclosed marginal seas subject to frequent typhoons. Chiang et al. (2011) reported that the average SST cooling in the northern SCS during the passage of a typhoon was approximately 4.3±2 ∘C in 1958–2008. Tseng et al. (2010) and Lin et al. (2003b) observed an SST drop of more than 9 ∘C in the northern SCS during Typhoon Kai-tak in 2000. They concluded that this drastic SST drop could mainly be ascribed to continual wind-forced upwelling, a preexisting, relatively shallow thermocline, local bathymetry and a slow propagation speed of typhoons. Furthermore, Chiang et al. (2011) estimated that the upwelling contribution to SST drop is twice that of entrainment for the case of Typhoon Kai-tak in 2000. A larger SST drop in the central SCS was observed by Shang et al. (2008) during Typhoon Lingling in 2001. Prior to Typhoon Lingling, the SST was approximately 27–30 ∘C; however, the SST was reduced by 11 ∘C after the typhoon passed. This extreme SST drop was mainly attributed to preexisting eddies that were driven by the northeastern monsoon. Zheng et al. (2010) also considered that the preexisting eddy is a favored condition for intensive cooling after a typhoon passage.
SST drops also frequently occur in the waters off northeastern Taiwan. Kuroshio flows through this region, which is the most important current that transports warm water from the tropical ocean. The SST drop off northeastern Taiwan mainly occurs during the winter monsoon rather than the summer season (Tsai et al., 2008a; Jan et al., 2013). Bathymetry-induced upwelling, rather than entrainment mixing, is considered to be the primary cause of the SST drops in this region (Tsai et al., 2008a). The numerical modeling results of Tsai et al. (2008b, 2013) suggest that the Taiwan Strait outflow is blocked by northerly winds, facilitating Kuroshio intrusion and thus leading to SST drops during the first half of a typhoon passage. This mechanism is similar to that involved in the winter monsoon. In contrast, Morimoto et al. (2009) demonstrated that the northward flow of the Kuroshio is mainly because of the continuous, strong southerly winds, which accelerate the Kuroshio and force its axis shoreward, resulting in the intrusion of the Kuroshio towards the shelf and SST drops offshore. Furthermore, Wu et al. (2008) indicated that internal waves were generated after Typhoon Nari's departure in 2001 and that this was a minor cause of the SST drops. SST drops that occur after a typhoon passage are rapid and occur within a short period of time (Tsai et al., 2013). According to previous studies, these temperature decreases in the waters off northeastern Taiwan are approximately 4–8 ∘C after a typhoon passage (Chang et al., 2008; Wu et al., 2008; Tsai et al., 2008a).
Table 1 summarizes the records of the SST drops after typhoon passages reported in the literature. Most studies on drops in SST have been conducted in the open ocean. There have been comparatively few studies conducted on near-coastal waters (i.e., less than 1 km from the coastline). In addition, most previous studies on SST drops have been conducted based on numerical modeling or satellite images because long-term field observations of the SSTs are relatively rare in typhoon-prone areas. Thus, the purpose of this research is to study SST drops following typhoon passages in coastal areas. Unlike previous studies, this study was conducted based on an analysis of field data. Coastal SST variability substantially affects both coastal environmental ecosystems and human activities, and therefore, typhoon-induced coastal SST variability requires a dedicated study.
Table 1Records of the SST drops due to typhoon passages in the literature.

2.1 Study area
This research was conducted on the Longdong coast in northeastern Taiwan, as shown in Fig. 1. The Longdong coast is characterized by its irregular coastline and rapidly changing bathymetry. The Longdong coastline is oriented northwest–southeast at approximately 160 degrees from the north. The average sea bottom slope at Longdong is ∼1/50. An important North Pacific warm western boundary current, known as Kuroshio, flows along the eastern waters of Taiwan. The observed maximum flow velocity of Kuroshio varies between 0.7 and 1.4 m s−1 and is located at depths, ranging from 20 to 100 m (Jan et al., 2011). The distance between Taiwan's coast and the main stream of Kuroshio is varied. Morimoto et al. (2009) demonstrated that the western edge of the Kuroshio streamflows approaches Taiwan during the typhoon period. In this study, the shift in Kuroshio during typhoon Haitang in 2005 is estimated and plotted in Fig. 1, according to Morimoto et al. (2009).
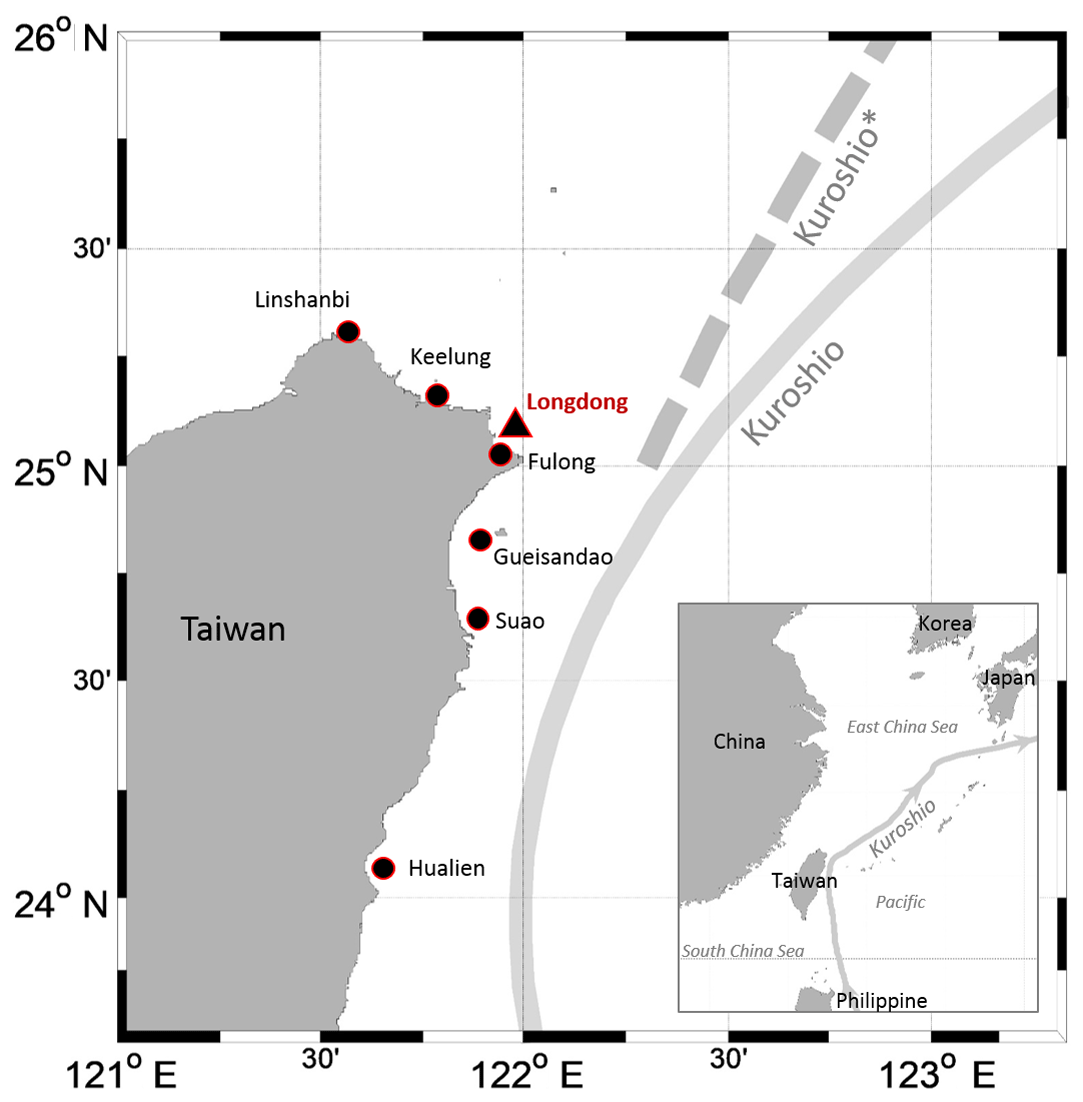
Figure 1Locations of the study area and field stations. The gray belt is the main stream of Kuroshio; however, the dashed gray belt is the shift of the Kuroshio during Typhoon Haitang in 2005 according to measurements by Morimoto et al. (2009).
2.2 Data
2.2.1 SST measured by moored buoys
SST can be measured by satellite technology, ships and floating or moored buoys (Matthews, 2013). Satellite observations provide the spatial distribution of the SST; however, moored buoys record the time series of the SST. In this study, the main data are the SST recorded by a 2.5 m discus-shaped buoy deployed in the water along the Longdong coast. The Longdong Buoy was deployed by the Coastal Ocean Monitoring Center of National Cheng Kung University, as assigned by the Taiwan Central Weather Bureau (CWB) in 1998. This buoy is approximately 0.6 km off the Longdong coast and is situated in the water at 23 m depth. The buoy is anchored to the sea bottom. The buoy was equipped with sensors of water and air temperatures, wind, pressure and wave, as well as power unit, data transmission unit and control unit. Every hour, the buoy automatically switches on to collect the oceanographic and atmospheric data. The sampling rates for all sensors are 2 Hz. The sampling duration for wind and wave data is 10 min to the hour and it is 1 min to the hour for pressure and temperature data. The water temperature sensor is installed at 0.6 m below the sea surface. The procedures of sensor calibration, system integration, operation and maintenance have been qualified by ISO 9001:1994 since 2000.
The SST is measured by a platinum resistance temperature detector (RTD), which is capable of covering the range from −10 to 70 ∘C. The sensor provides ±0.1 % F.S. accuracy for critical temperature monitoring applications. Before integrating the temperature sensor with the buoy, the sensor is submitted to the National Meteorological Instruments Center in CWB for calibration to confirm the sensor accuracy. All new or retrieved sensors from the field were submitted for calibration. After integrating the water temperature sensor into the buoy, the temperature measurements are compared with those of another sensor to confirm the system's accuracy before sea deployment. The buoy SST data used in this study can be accessed from https://doi.org/10.1594/PANGAEA.895002.
2.2.2 Water temperature measured by tide station
In addition to the Longdong Buoy, SST data were collected from buoys at the Gueishandao, Suao and Hualien and tide stations at Linshanbi, Keelung and Fulong, respectively. The locations of these stations are shown in Fig. 1. The buoys at Gueishandao, Suao and Hualien are 10.0, 1.0 and 0.6 km from the coast and are situated in the water at depths of 38, 20 and 21 m, respectively. All tide stations are located inside the harbors and are equipped with water temperature sensors installed at the bottom (depth varies from 2 to 5 m) of the stations. Water temperature measured by bottom-mounted ADCP near Linshanbi tide station was also collected in this study for data quality check use. The SST data from tide stations and used in this study can be accessed from https://doi.org/10.1594/PANGAEA.895002.
2.2.3 Current data
Current data observed by acoustic Doppler current profilers (ADCPs) deployed at Longdong and Linshanbi were also collected and used for validation. The ADCPs were bottom-mounted and upward-looking and measured the current profile of the sea column. Current profile data from the Longdong ADCP were collected from June 2008 to June 2009 and the data from four typhoons (Kalmaegi, Fungwong, Sinlaku and Jangmi) were recorded. The Linshanbi ADCP only obtained recordings in September 2013, which included data from the passage of Typhoon Usagi. The ADCPs measured the current profile in the range −4 to −23 m water depth. The current data used in this study can be accessed from https://doi.org/10.1594/PANGAEA.895002.
2.2.4 Satellite images
Except for the field data, multiscale ultra-high-resolution (MUR) SST analyzed satellite images (downloaded from the NOAA website: http://coastwatch.pfeg.noaa.gov/erddap/griddap/jplMURSST.graph?analyzed_sst, last access: 14 April 2017) were also collected for cross analysis. In an optimal way, this dataset combines data from the advanced very high-resolution radiometer, moderate imaging spectroradiometer's Terra and Aqua, and advanced microwave spectroradiometer-EOS instruments to produce 1 km global SST maps. Data have been released since 2003, and one image is produced per day. The SST images during Typhoon Jangmi in 2008 were collected in this study.
2.2.5 Spatial wind field
To discuss the possible mechanism of the SST drop, the cross-calibrated multiplatform (CCMP) gridded surface vector winds for the East Asia area (115–130∘ E, 18–30∘ N) were collected. CCMP is one of the productions provided by the scientific research company, remote-sensing systems (RSS), located in California, USA. The CCMP version 2.0 dataset integrates observations from satellites, moored buoys and model results and provides a long-term and high-resolution record of global ocean surface (10 m) winds (Wentz et al., 2015). The spatial and temporal resolutions of CCMP wind are 0.25 degree and 6 h, respectively. CCMP has a wide-ranging appeal to users in educational, operational and research environments. In this study, data obtained during Typhoon Bilis in 2000, Fungwong in 2008, Morakot in 2009 and Fanapi in 2010 were downloaded from http://www.remss.com/measurements/ccmp (last access: 19 September 2018).
2.3 Data quality check
Checking data quality is necessary and crucial to field data analysis. Incorrect data may yield misleading results, and inaccurate observations may have a greater negative impact than a lack of observations. In addition to the satellite image and wind field data that were downloaded from qualified websites, all field data were strictly verified. The list of field data used in this study are shown in Table 2. The field measurements are equipped with a solid data-quality-checking (QC) system (Doong et al., 2007), including both automatic and manual verifications of raw data and statistical data, respectively. The automatic machine verification is used to cull the suspicious data according to the rationality, continuity and correlation of data. The core work for automatic data quality check is to filter the outliers. The data outlier can be divided into a system outlier and general outlier. The system outlier is its measurement value clearly exceeding the limitations of the measurements systems or environmental conditions such as breaking wave height. These system outliers with such obviously unreasonable extreme values can be detected easily. The general outliers are measurements within the limitations but still look suspicious due to their rather larger deviations from the rest of measurements. The outliers can be detected when its deviations exceed the pre-determined range in the ranked deviation series. Doong et al. (2007) proposed that the multiple of standard deviation has a correlation with sample sizes and the confidence level of this statistical test. When the measured data are located outside of the upper and lower limits, they have to be filtered.
Table 2List of field data used in this study.
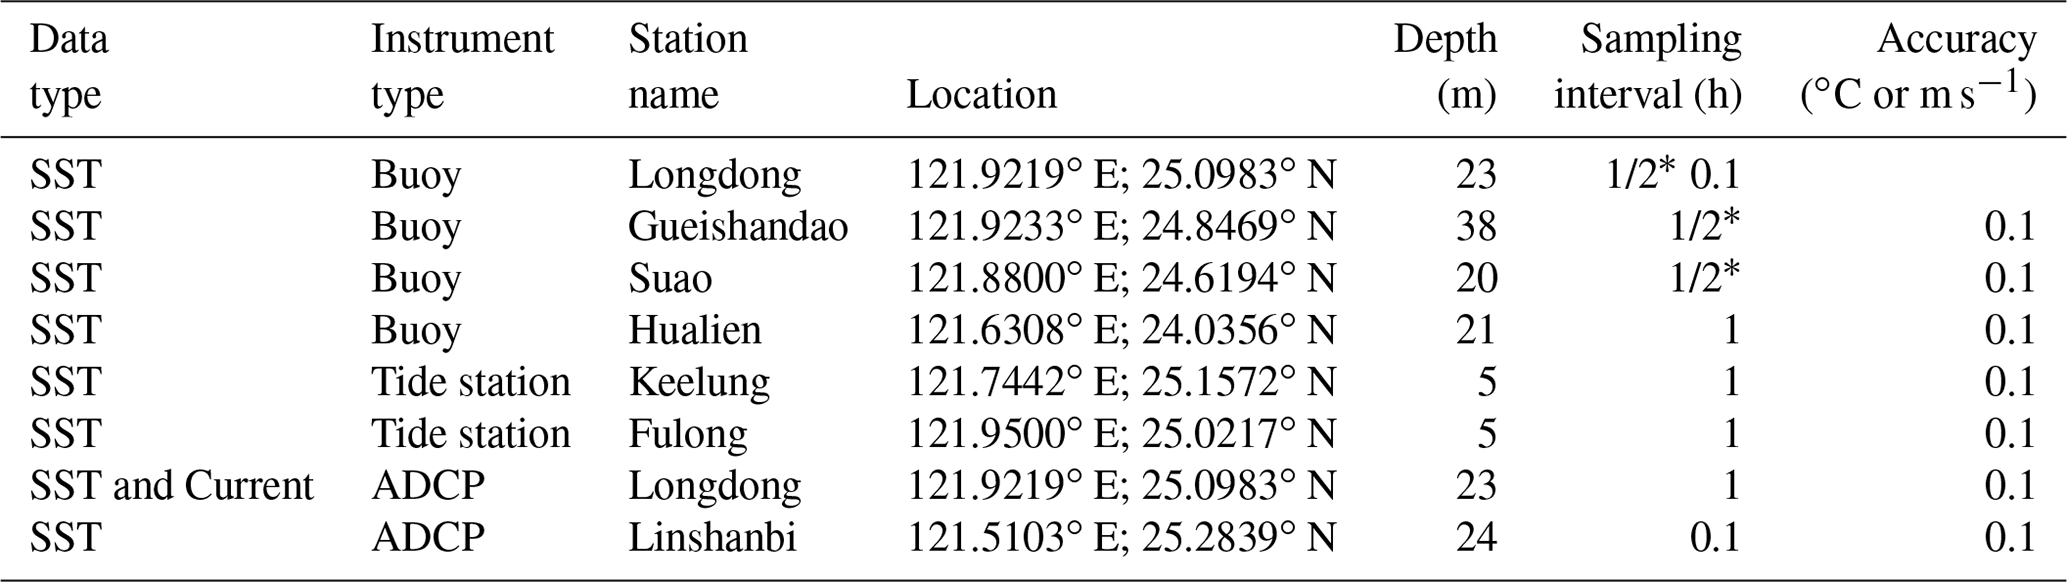
∗ All buoys have sampling interval 2 h from 1998 to 2003 and 1 h from 2004 to 2017.
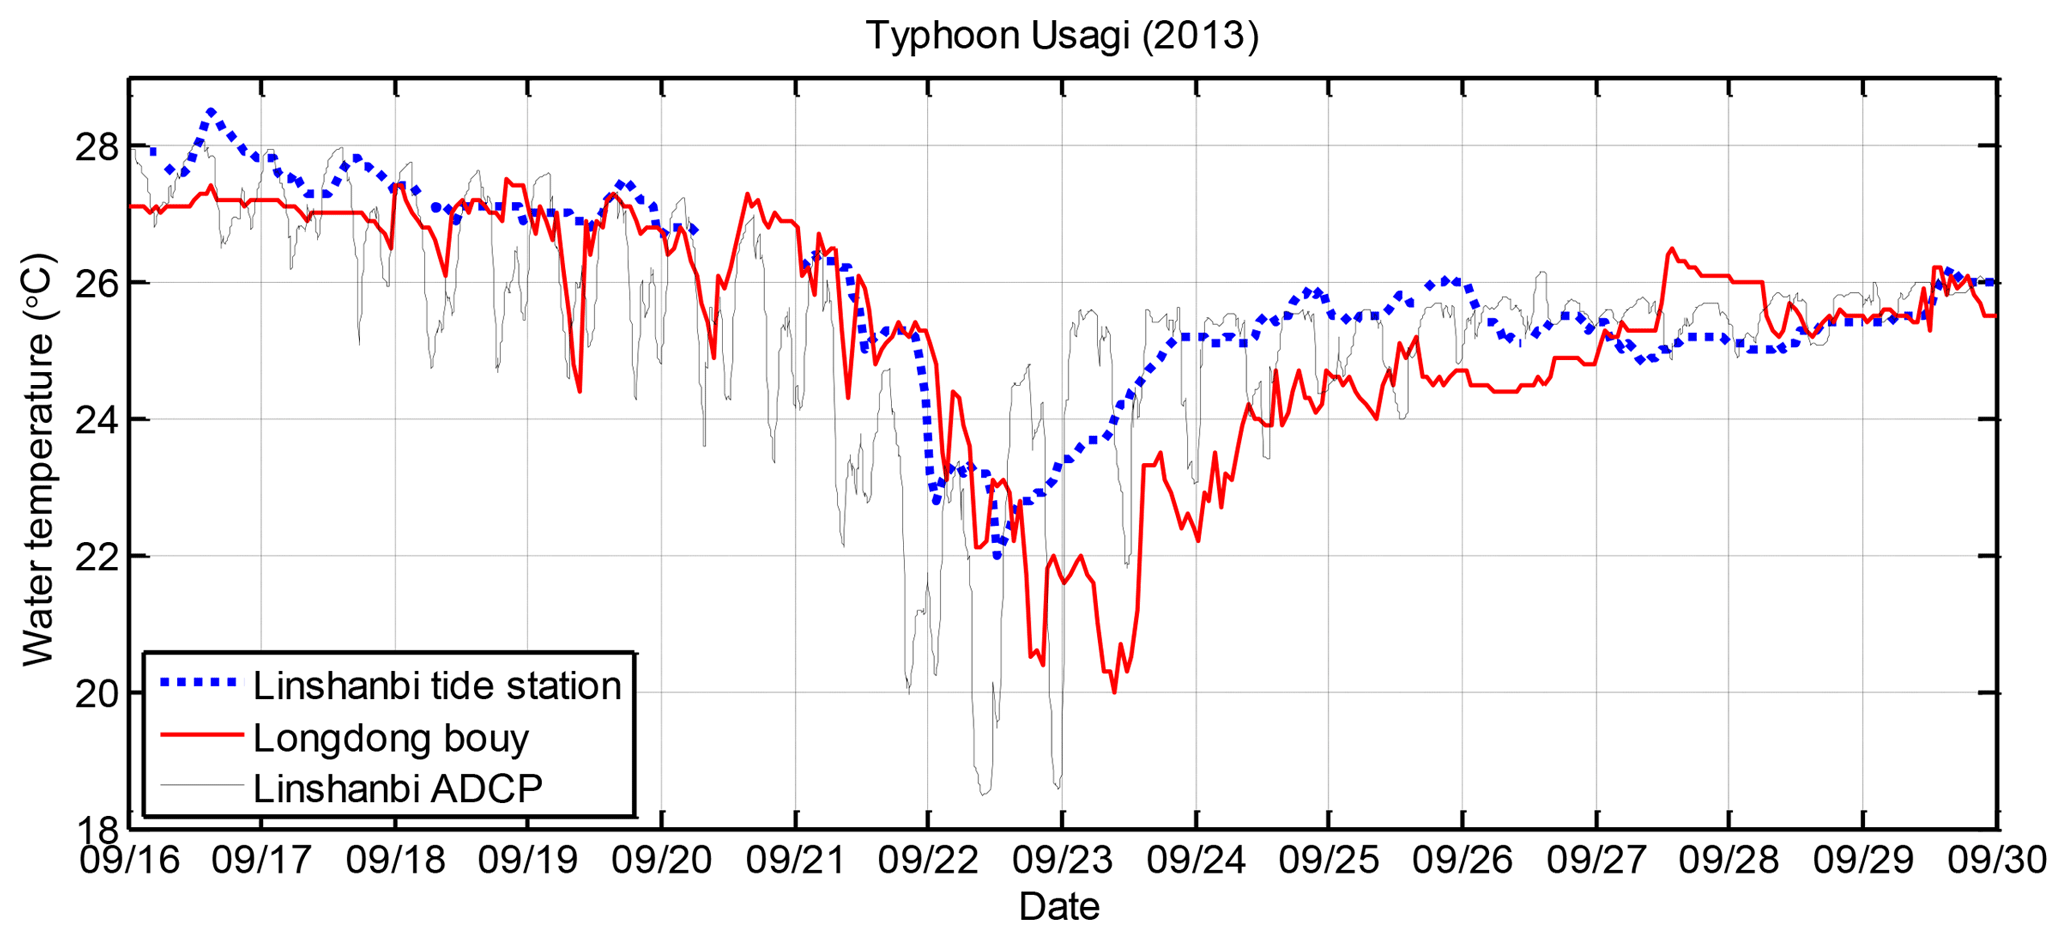
The manual verification is used to double-check the suspicious data according to spectrum, nearby observations and the QC engineers' knowledge and experience. Except for QC procedures, data are correlated with nearby measurements every month, season and year to develop quality accuracy (QA) and increase confidence in the data use. Figure 2 shows one SST drop event in 2013 during Typhoon Usagi as an example. The SST drops were measured by the Longdong Buoy, Linshanbi ADCP and Linshanbi tide station. The simultaneous observations of the SST drops using different instruments proves that the phenomenon cannot be ascribed to instrumental error.
2.4 Typhoons
There were 108 typhoon datasets observed by the Longdong Buoy from 1998 to 2017. Typhoons are complex atmospheric phenomena and have high variability in intensity, moving track and speed; therefore, not all typhoons induced SST drops. For 43 typhoons, SST drops significantly along the coast of Longdong. Table 3 shows the list of the cases. The intensity of the typhoons is categorized according to the Saffir–Simpson classification method. The maximum significant wave height of each typhoon is shown in the table. Typhoon parameters are highly time dependent. The values of typhoon intensity and maximum sustained wind shown in Table 3 are the numbers obtained when the typhoons were closest to Taiwan.
Table 3Significant SST drops observed at the Longdong Buoy (NE Taiwan coast) during 43 typhoon passages from 1998 to 2017.

The asterisk indicates that the values were obtained when typhoons were close to Taiwan.
3.1 SST drop determination
To estimate the scale and rate of each SST drop event, the starting and ending times and temperatures of an SST drop process were determined. The background SST, which is defined as the mean SST over the 7 days before the SST drop occurrence, is first obtained to determine the starting point of the event. The starting time of each SST drop event was defined based on the point at which the water temperature rapidly dropped to a value lower than the background SST. The lowest SST was the minimum water temperature value during the typhoon. The sea surface temperature drop (ΔSST) was the difference between the background SST and the lowest SST. The duration and further cooling rate of an SST drop event are then estimated. The cooling rate represents how rapidly a typhoon exerted its effects on the ocean.
3.2 The significant coastal SST drop event
Typhoon Fungwong occurred in 2008 and was a Category 2 typhoon when it was close to Taiwan. The typhoon exhibited a maximum wind speed of 43 m s−1 and a minimum central air pressure of 948 hpa. Fungwong occupied an area at 22∘ N and 136∘ E and traveled approximately along the latitude of 22∘ N at an average speed of 4.7 m s−1. The intensity of the typhoon increased to that of a medium typhoon during the second half of 26 July and subsequently changed direction to the northwest. Figure 3 shows the track of the typhoon and the time series of the SST, wind speed, wind direction and significant wave height observed at the Longdong Buoy during Fungwong. Before the typhoon approached, the background SST was 29.1 ∘C. The mean wind speed was lower than 10 m s−1, and the wind directions were irregular. On 28 July, Fungwong landed on the eastern coast of Taiwan, and the mean wind speed at Longdong rapidly increased and reached a maximum value of 21.4 m s−1. The wind direction shifted northward and continued for approximately 1 day. The significant wave height increased to 7.9 m on 28 July from less than 0.5 m on 26 July. Approximately 7 h later, the SST began to drop. Cold water at a temperature of 16.6 ∘C was observed on 29 July. The total SST drop was 12.5 ∘C within 17 h. Then, the SST took 35 h to recover to its background temperature level. Typhoon Fungwong in 2008 induced the maximum SST drop in Longdong.
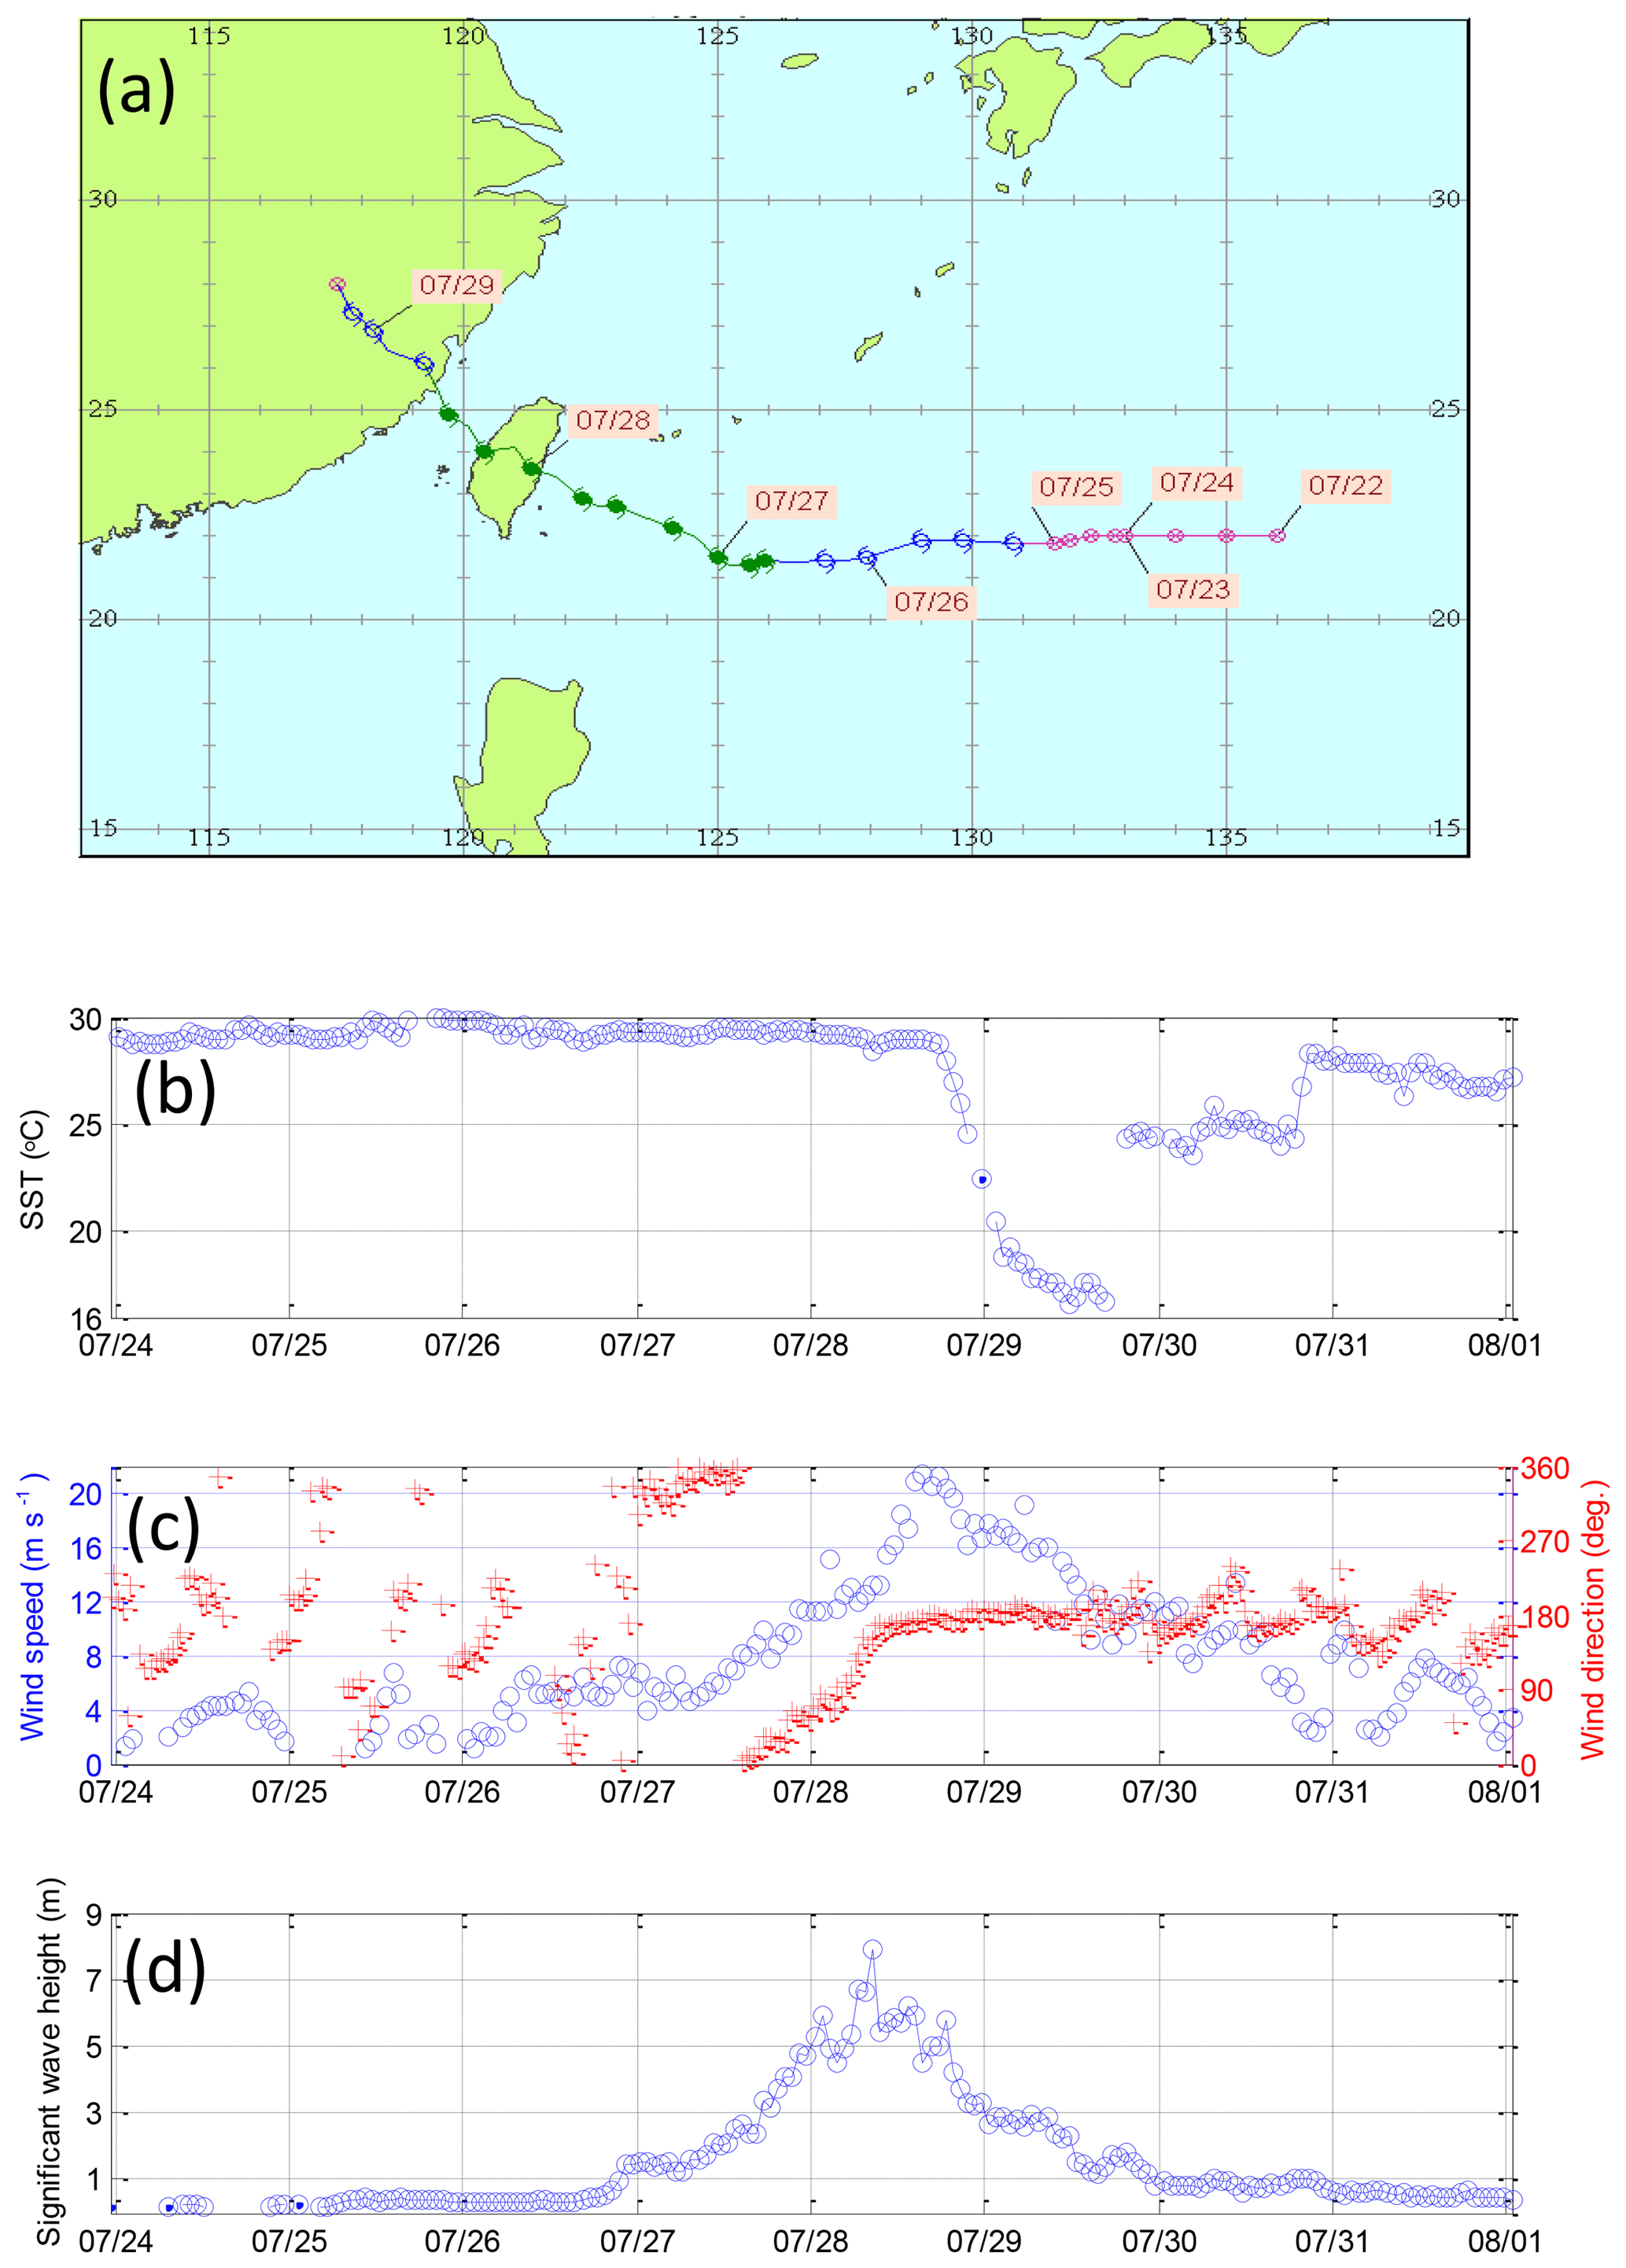
Figure 3The significant SST drop event after the passage of Typhoon Fungwong in 2008. (a) The typhoon track, (b) SST, (c) wind speed and direction, and (d) significant wave height. The data were observed by a data buoy in the Longdong coastal waters of northeastern Taiwan.
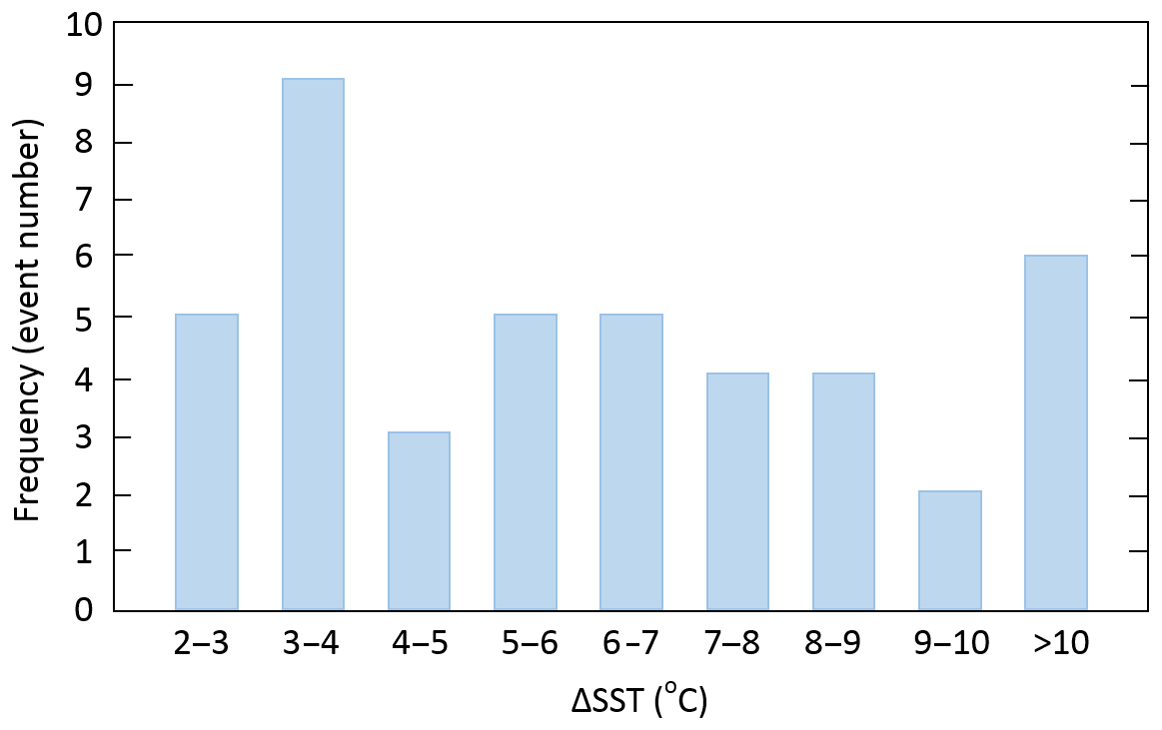
3.3 Statistical results
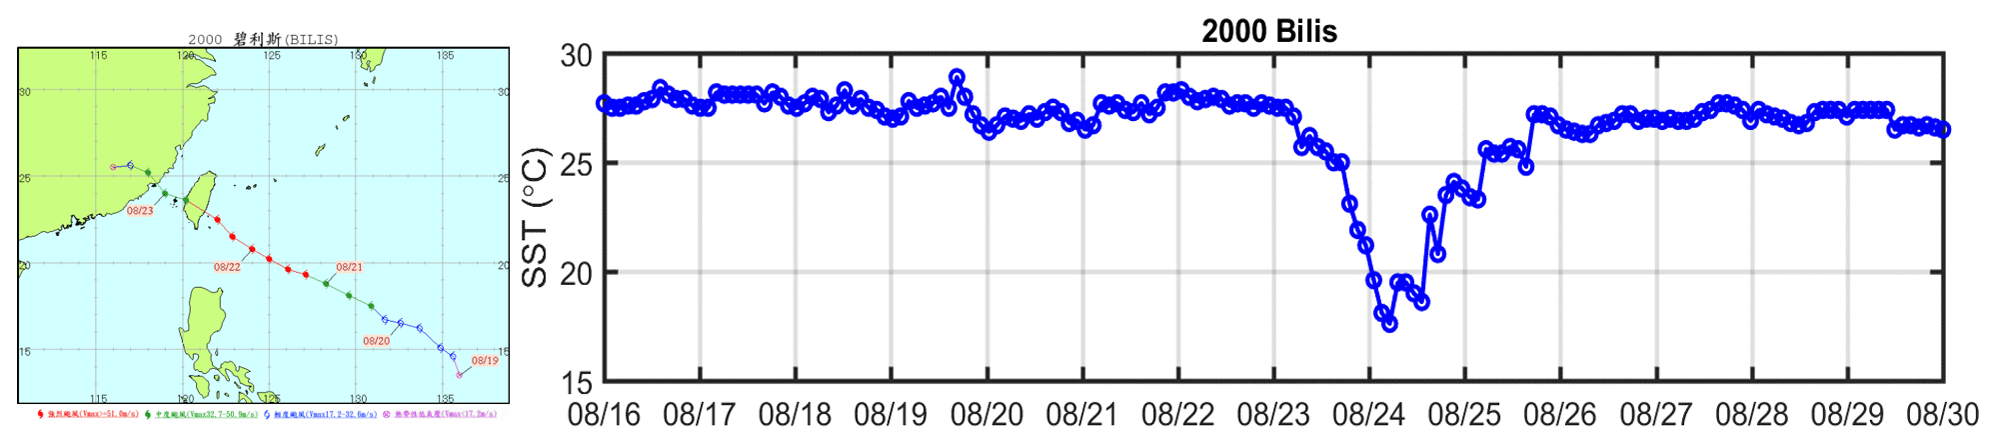
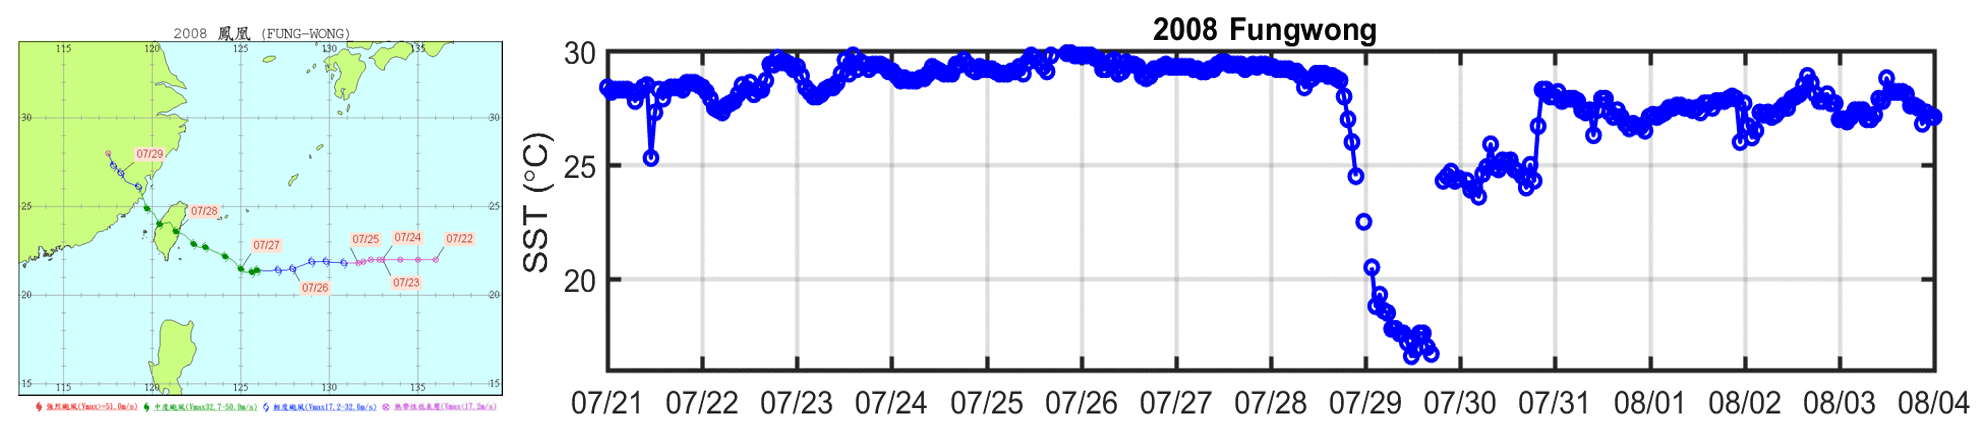
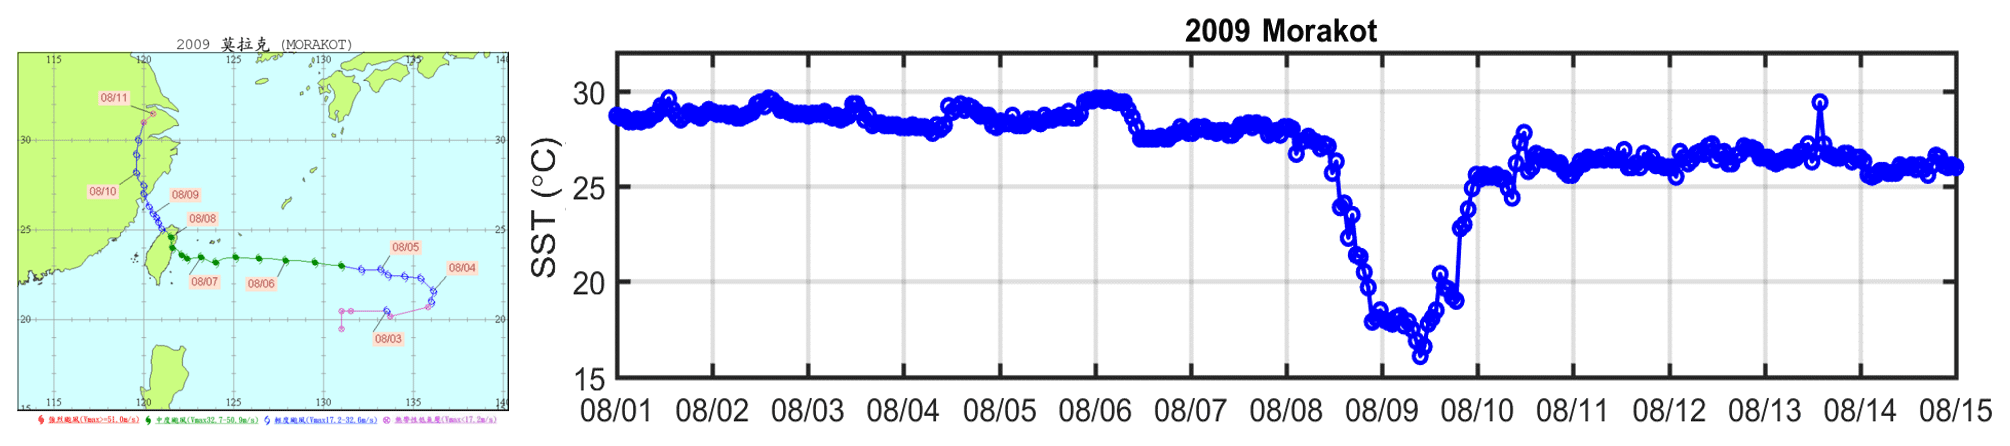
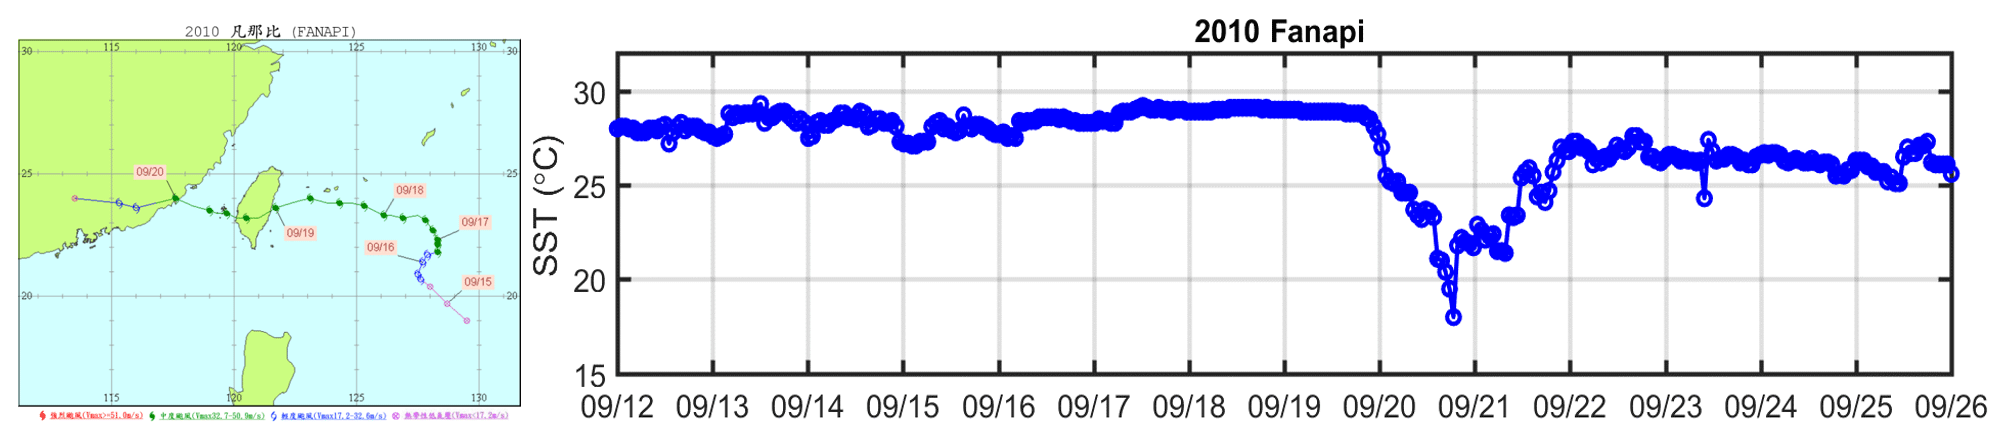
To reduce the measurement uncertainty, only SST drops larger than 2 ∘C were considered in this study. Forty percent (43 of 108) of typhoons triggered a significant SST drop in Longdong in the past 20 years (1998–2017). Among these 43 typhoons, the mean SST drop was 6.1 ∘C, and the maximum drop was 12.5 ∘C (Typhoon Fungwong in 2008). The mean drop duration was 24 h, and the mean recovery duration was 26.1 h. The mean cooling rate was 0.32 ∘C h−1; however, the maximum cooling rate reached 0.83 ∘C h−1, which occurred during Typhoon Bilis in 2000. The entire statistic of coastal SST drops is shown in Table 3. Figure 4 shows the distribution of the SST drop magnitude. Typhoon passages that caused SSTs to drop by 3–4 ∘C occurred most frequently. Six typhoons caused coastal SSTs to drop by more than 10 ∘C. These include Typhoon Bilis in 2000, Fungwong in 2008, Morakot in 2009, Fanapi in 2010, Matmo in 2014 and Megi in 2016. The typhoon tracks and time series of the SSTs are shown in the Appendix. The intensities of Typhoon Fungwong (Category 2) and Morakot (Category 1) were relatively weak, but these typhoons induced the largest and second-largest SST drops on the Longdong coast.
4.1 Typhoon dependence
4.1.1 Typhoon intensity
The scale of the typhoon-induced SST drop depends on the typhoon's characteristics, such as the intensity measured by the maximum surface wind speed, moving speed and size. Zhu and Zhang (2006) quantified the influence of SST variability on typhoon intensity using a numerical model. However, this is not the case for the coastal ocean at Longdong. Of the 43 typhoons that triggered significant coastal SST drops, eight were categorized as Category 1 typhoons, seven as Category 2 typhoons, eight as Category 3 typhoons, eight Category 4 typhoons and eight Category 5 typhoons. Another four typhoons were categorized as tropical storms (TS). The uniform intensity distribution of all typhoons causing SST drops demonstrates that intensity may not be a significant factor triggering the coastal SST drop. This can also be validated according to weak typhoons (for example, Typhoon Hagibis in 2014) that triggered larger coastal SST drops than stronger typhoons (for example, Category IV Typhoon Tembin in 2012). We used both the minimum central air pressure and central maximum wind speed as typhoon intensity indicators to understand their influences on SST drops. The regression results show that the determination coefficients of the typhoon intensity indicators (min central pressure or max wind speed) with the SST drop scale (ΔSST) were smaller than 0.15 as shown in Fig. 5a, b. Again, it was suggested that typhoon intensity is not the dominant factor that influences coastal SST drops.
4.1.2 Typhoon track and moving speed
We classify typhoon moving tracks into five paths, as shown in Fig. 6. Tracks A, B and C represented typhoons that traveled from southeast to northwest. Track A was north of waters off Longdong, whereas tracks B and C were south of Longdong. Typhoons on track B made landfall, whereas track C typhoons traveled along southern Taiwan. The typhoon numbers (of a total of 43 cases) and their corresponding mean temperature decreases for each track are listed in Fig. 6. Typhoons that traveled along tracks B and C occupied 70 % of those typhoons that triggered SST drops, and the mean decrease in temperature for the sea surface at Longdong is greater than 6 ∘C (7.6 ∘C for track B; 6.4 ∘C for track C). This indicates that the mean distance between track C typhoons and Longdong is more than 500 km. Typhoons that traveled along track A were closer to the waters off Longdong, but of the typhoons that induced an SST decrease along this track, the scale of SST decrease was relatively small. Typhoons that passed along the southern side of Longdong had greater induced SST drops than other typhoons. These results were consistent with those of previous studies conducted in the open ocean (Price, 1981; Wada, 2005; Wada et al., 2009), which have proposed that the SST response is larger on the right side of a typhoon.
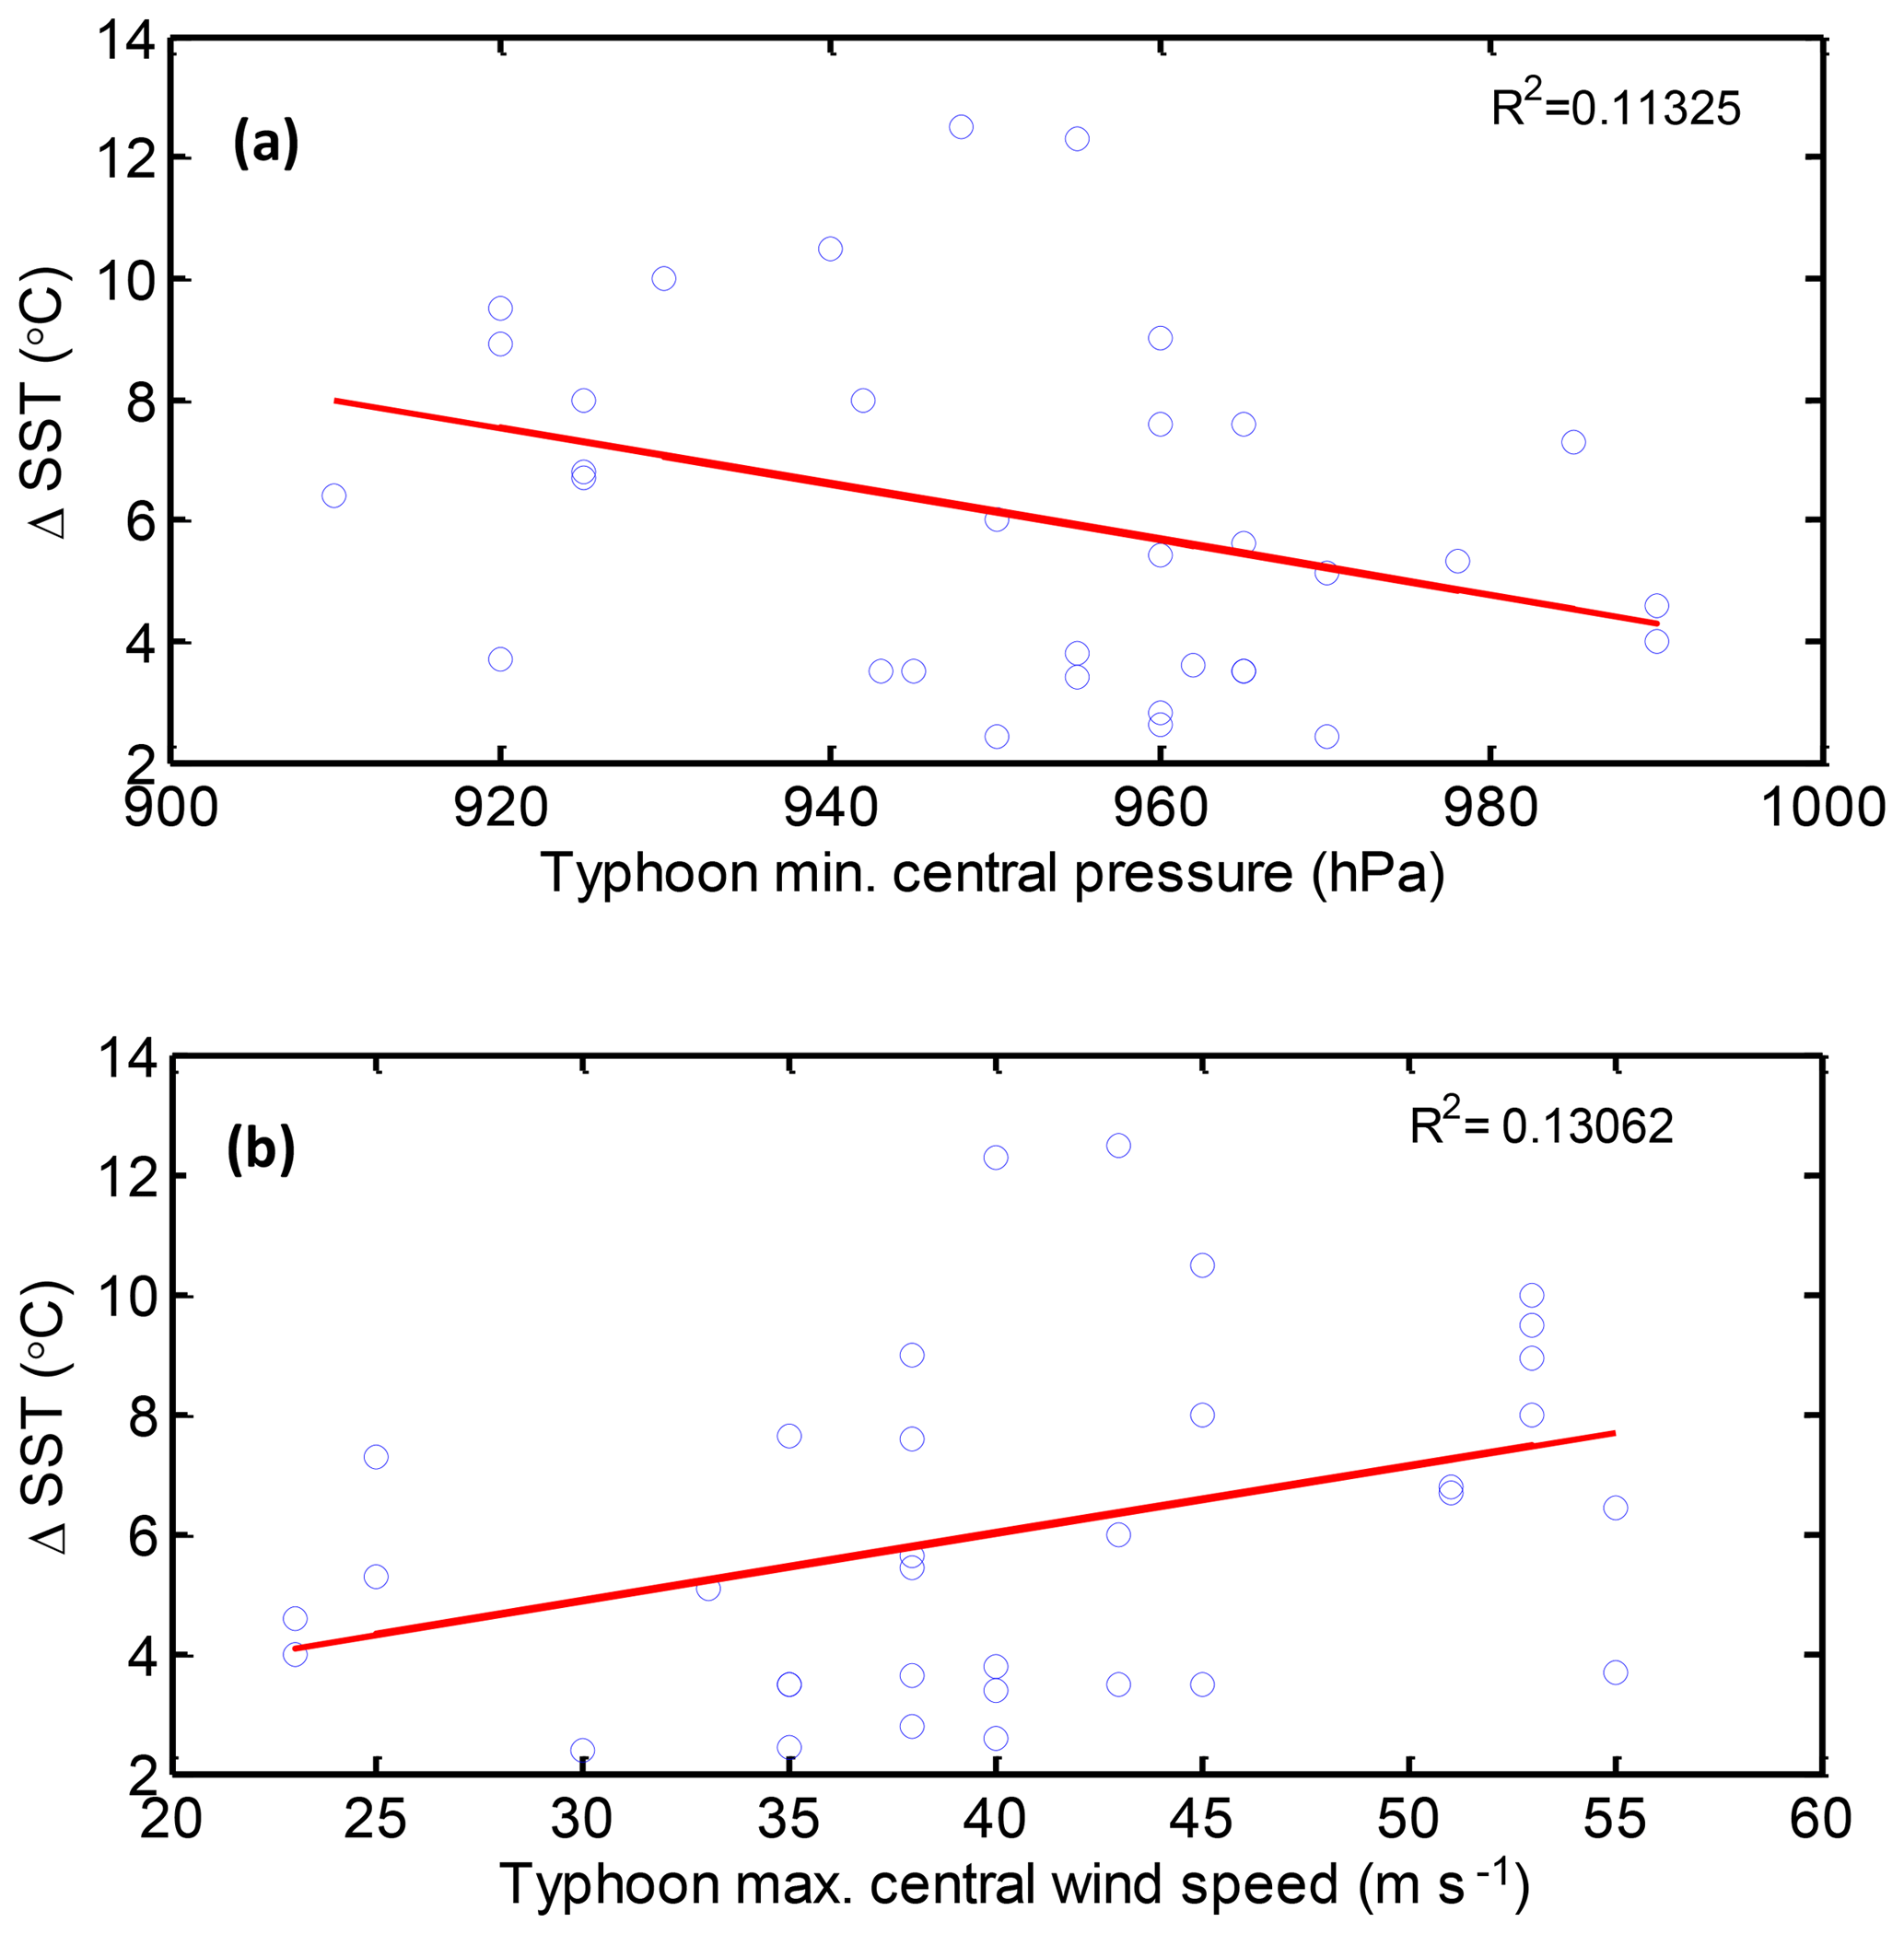
Figure 5The correlation of ΔSST with two typhoon intensity indicators, (a) min central pressure and (b) max wind speed.
Slow-moving typhoons induced larger SST drops in the open sea because they facilitate more substantial air–sea interactions (Tsai et al., 2008b; Wada et al., 2009; Tseng et al., 2010; Kuo et al., 2011). This study correlated the typhoon moving speeds with the magnitude of coastal SST drops and found no correlation. The regression result is shown in Fig. 7. The coefficient of determination is 0.018.
4.1.3 Typhoon wind distribution
The above results show that the coastal SST drop at Longdong is correlated with the typhoon track. Therefore, it is interesting to look directly at the wind distribution during typhoons. Figure 8 shows the CCMP wind patterns for the four significant cases (Typhoon Bilis in 2000; Fungwong in 2008; Morakot in 2009; and Fanapi in 2010). Because of the output time limitation for the operational model, the CCMP wind fields are not exactly at the starting time of the SST drop, but the maximum values are different within 2 h. All 4 cases show strong winds off the northeastern Taiwan waters, and the wind directions are parallel with the Kuroshio direction. The coverage of the Kuroshio region with large wind speeds is a significant factor. We found that when the area of strong wind overlapping with Kuroshio is large (for example, Typhoons Fungwong and Morakot in Fig. 8b and c), there was a very large SST drop along the Longdong coast. We suggest that the interaction between typhoon wind and Kuroshio plays an important role in triggering coastal SST drops in the northeastern corner of Taiwan.
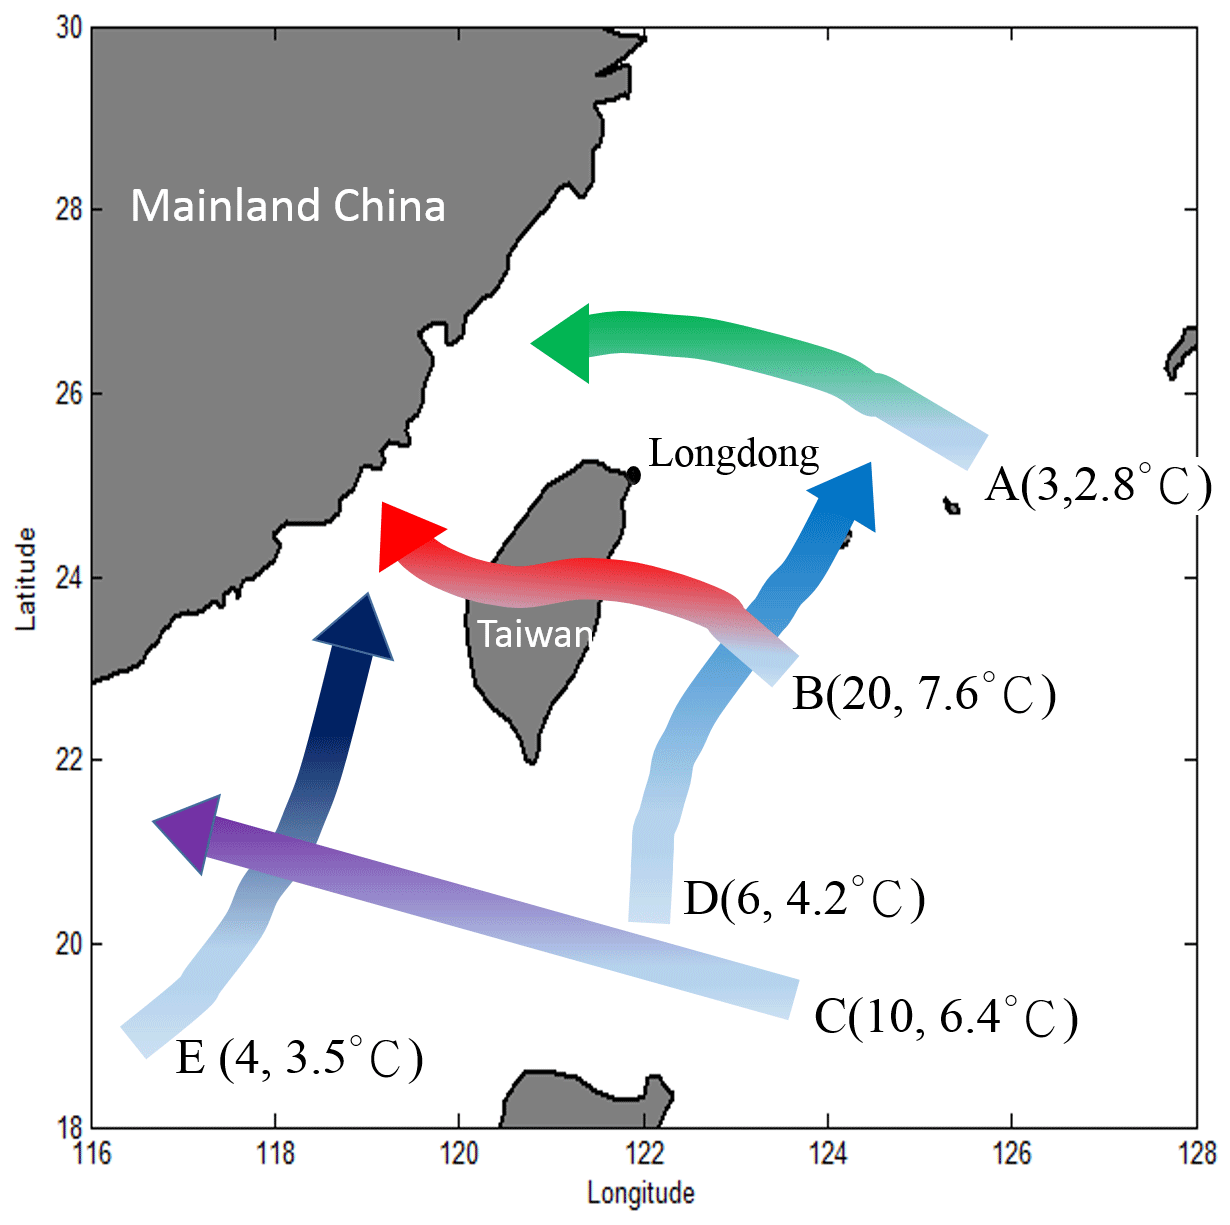
Figure 6The SST drops for various typhoon tracks. The two numbers in parentheses show the typhoon number and the mean SST drop magnitude in the corresponding typhoon track.
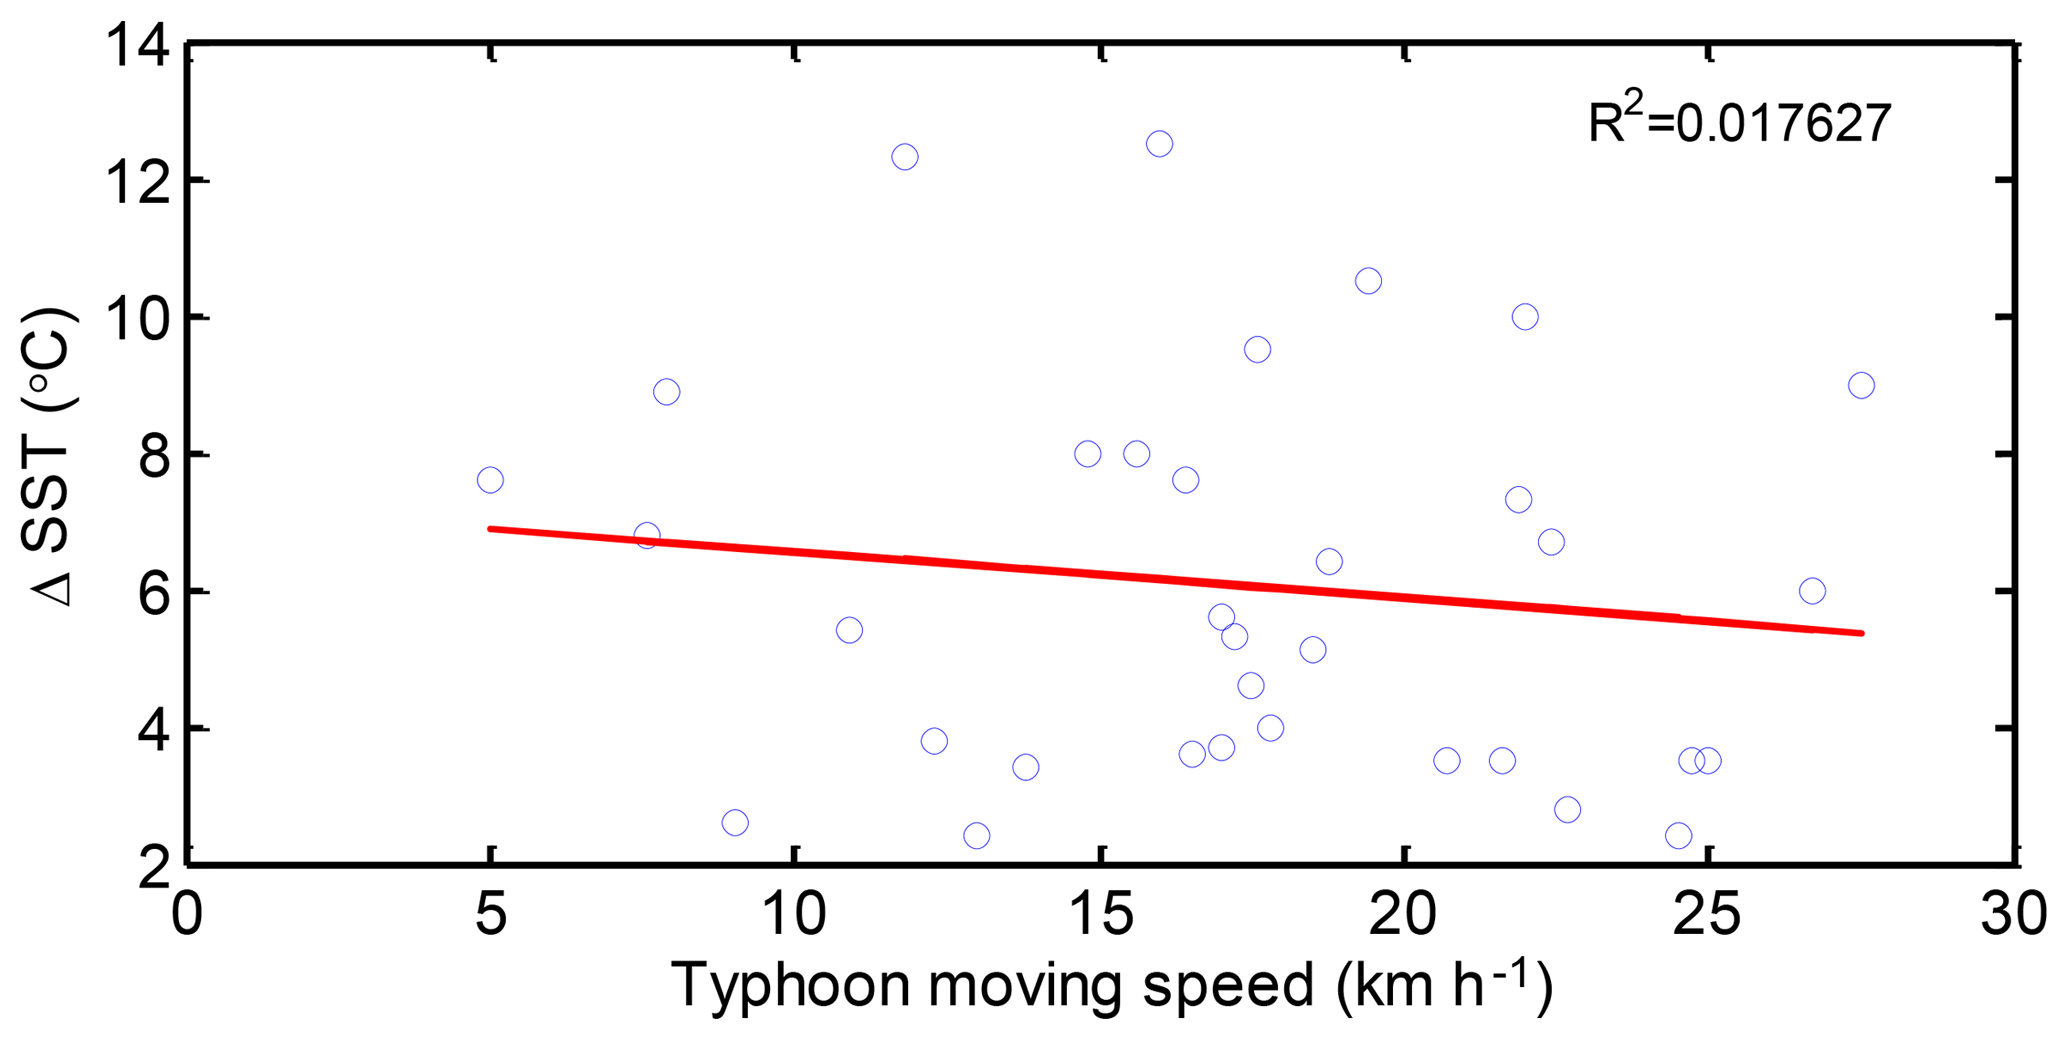
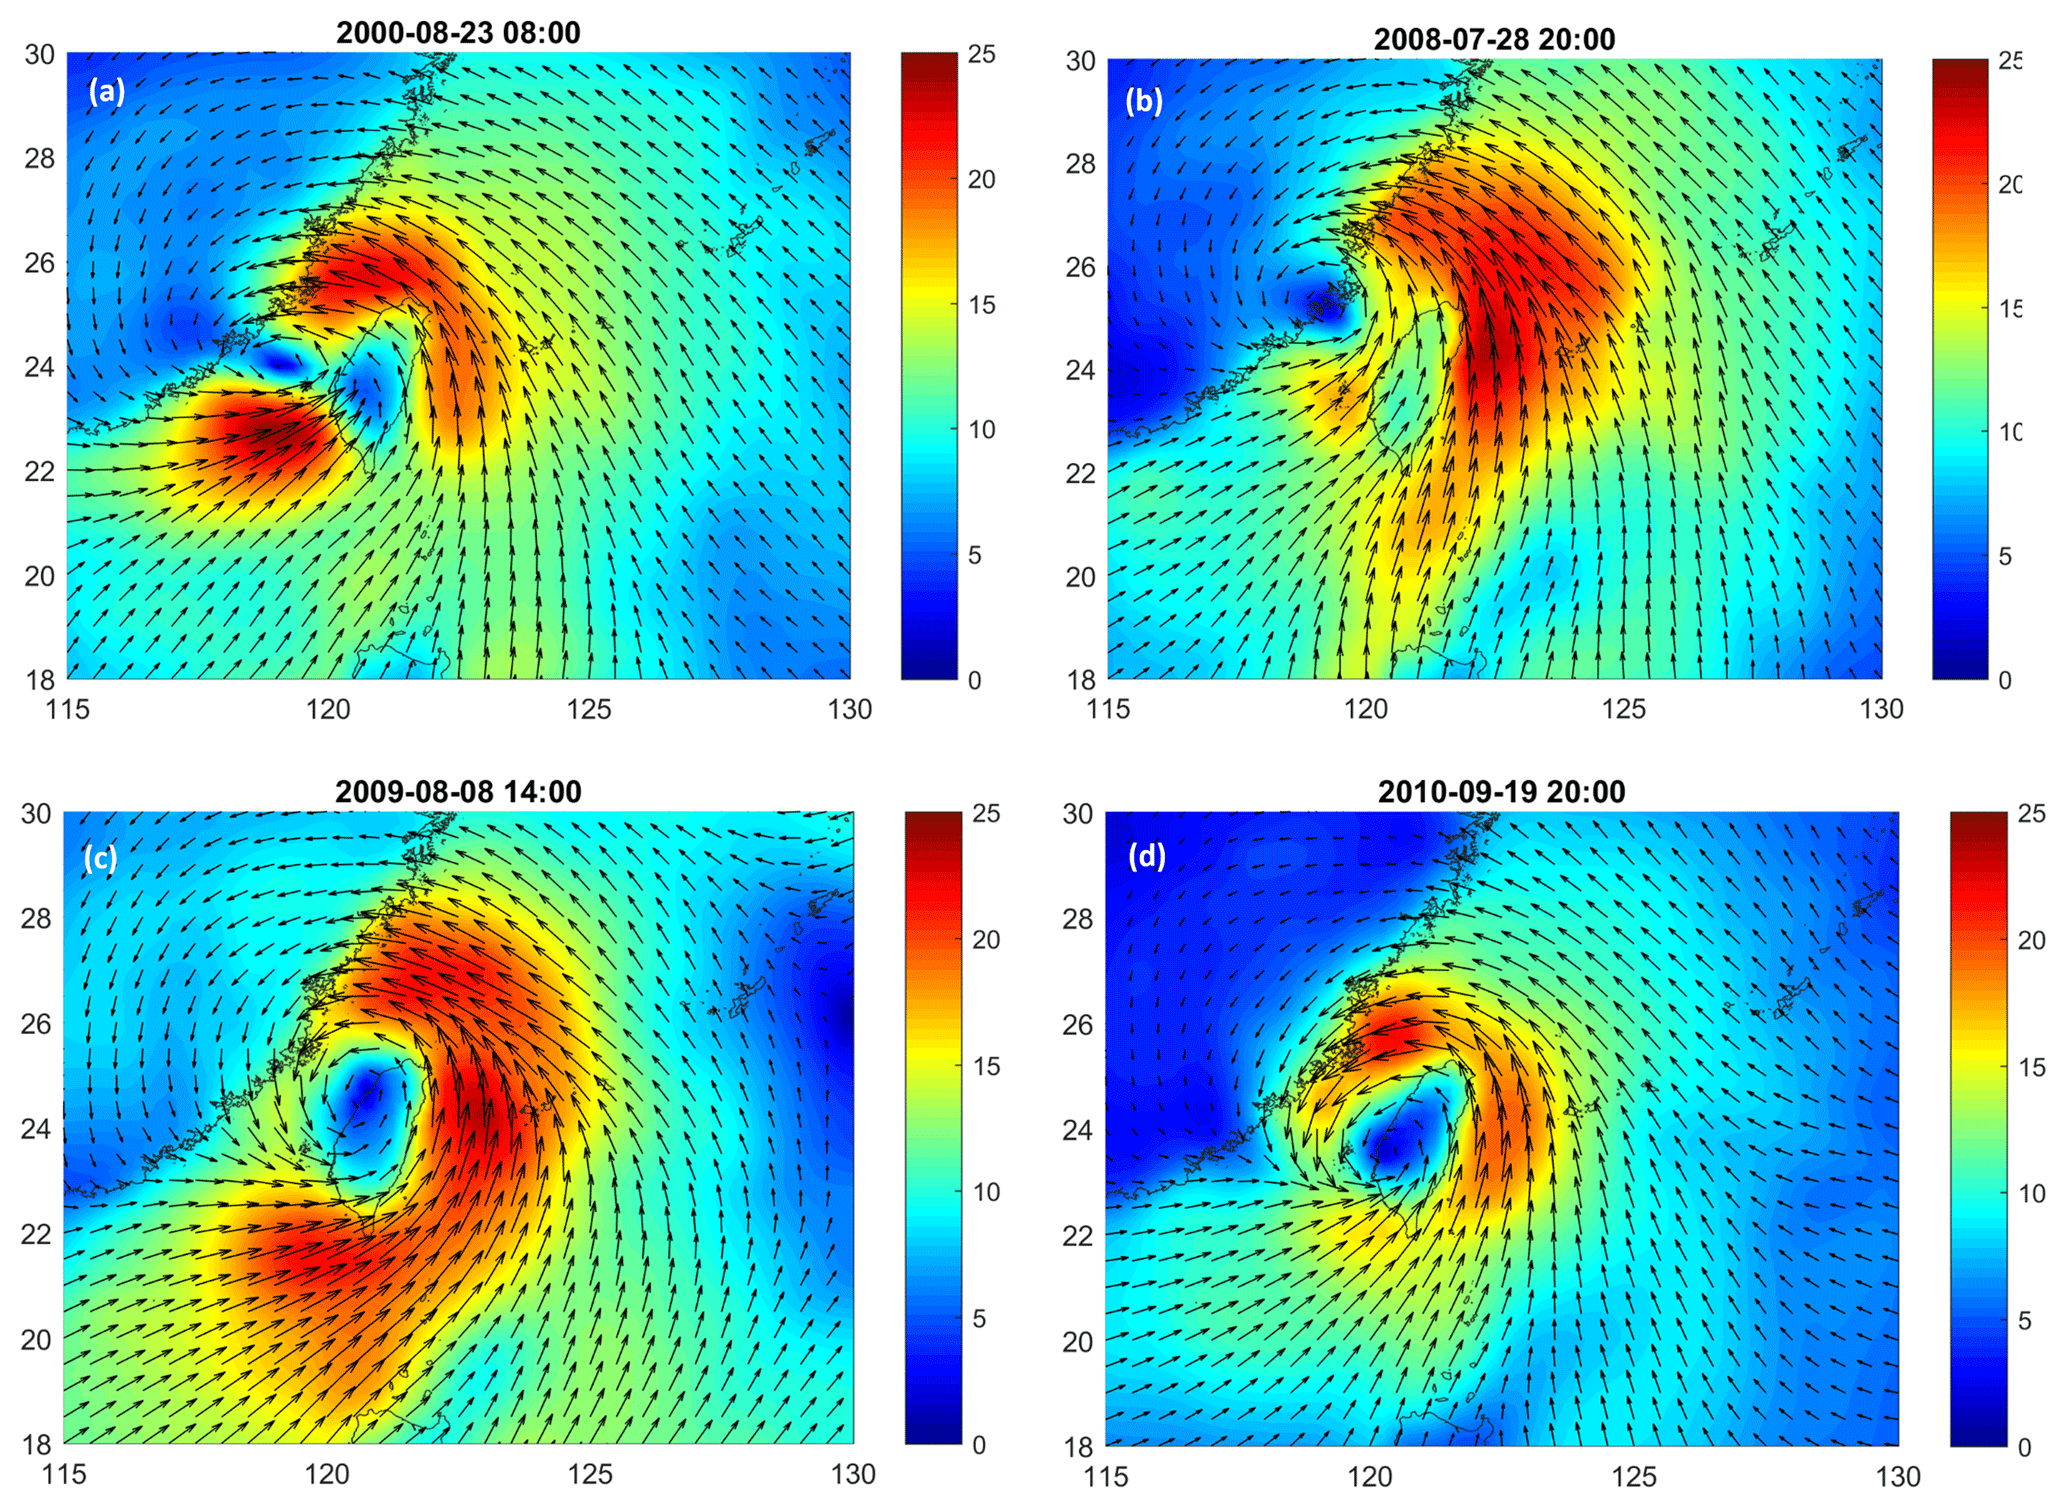
Figure 8Wind patterns at the time close to the start of the SST drop. (a) Typhoon Bilis in 2000. The SST started to decrease on 23 August 2000 at 10:00 UTC+8. The wind pattern was observed on 23 August 2000 at 08:00 UTC+8. (b) Typhoon Fungwong in 2008. The SST started to decrease on 28 July 2008 at 18:00 UTC+8. The wind pattern was observed on 28 July 2008 at 20:00 UTC+8. (c) Typhoon Morakot in 2009. The SST started to decrease on 8 August 2009 at 13:00 UTC+8. The wind pattern was observed on 8 August 2009 at 14:00 UTC+8. (d) Typhoon Fanapi in 2010. The SST started to decrease on 19 September 2010 at 22:00 UTC+8. The wind pattern was observed on 19 September 2010 at 20:00 UTC+8.
4.2 Vertical Kuroshio intrusion
Seeking the source of the cold water is the most interesting issue in this study. Because the Longdong Buoy observation site is located in near-coastal water (0.6 km from the coastline at 23 m water depth), the cold water may originate from three sources: river discharge from the land, adjacent surface water, or subsurface water.
The Shuangsi River is the only stream near Longdong. However, the discharge of the river is small, and the river water temperature ranges between 26 and 30 ∘C during the summer typhoon season, although the mean low SST in the waters off Longdong was 21.5 ∘C. This fact allows for rejection of the hypothesis that cold water was supported by land.
We assume that the cold water was pumped from the subsurface of Longdong. According to the simultaneous measurement of wind, we observed southerly winds during the SST drop periods (Figs. 3 and 8, as examples). The prevailing wind directions during these typhoons were between 164 and 189∘. The Longdong coastline lies at an angle of 160∘ from the north. Thus, typhoons created winds parallel to the Longdong coastline and induced coastal upwelling. The subsurface water is usually cooler than the surface water it replaces. To prove this assumption, the current profile data were analyzed.
The current profile data were measured very close to the Longdong Buoy by an ADCP from 2008 to 2009. There were four typhoon-induced surface cooling cases observed during the ADCP measurement period: Typhoon Kalmaegi (ΔSST = 5.1 ∘C), Typhoon Fungwong (ΔSST = 12.5 ∘C), Typhoon Sinlaku (ΔSST = 6.8 ∘C) and Typhoon Jangmi (ΔSST = 8.0 ∘C). The current profiles obtained during Typhoon Fungwong are shown in Fig. 9. In the waters off Longdong, currents flowed offshore, while the alongshore winds blew during typhoons. The sea current in the area generally flows shoreward, but instead, the current flowed seaward. The data demonstrated that typhoons generate an alongshore wind and pump cold water from the subsurface of Longdong to cool the surface.
The mean SST drop in the waters off Longdong was estimated to be 6.1 ∘C; however, the Longdong Buoy is situated in water that is 23 m deep. The difference in water temperature between the sea surface and sea bottom is only approximately 2–3 ∘C. It was assumed that the observed cold water was not from the subsurface water at the Longdong Buoy location but may be transferred from offshore deep seawaters. In this study, we referred to the data of the mean water temperature profile from the Ocean Data Bank (ODB) of the Ministry of Science and Technology of Taiwan. The data have been collected by research vessels since 1985. At a deep-sea location (122.5∘ E, 25.25∘ N) in waters off Longdong, the temperature is 22.9 ∘C at a depth of 50 m, 18.8 ∘C at 100 m and 14.5 ∘C at 200 m. The mean lowest SST for those 43 events was 21.5 ∘C and was 16.1 ∘C for the extreme case. Therefore, we determined that the cold water was being pumped from a maximum depth of 155 m and then intruded into the coastal area. This finding reaches the maximum value that Narayan et al. (2010) proposed in which cooler waters from 100 to 150 m depths are able to be pumped via coastal upwelling.
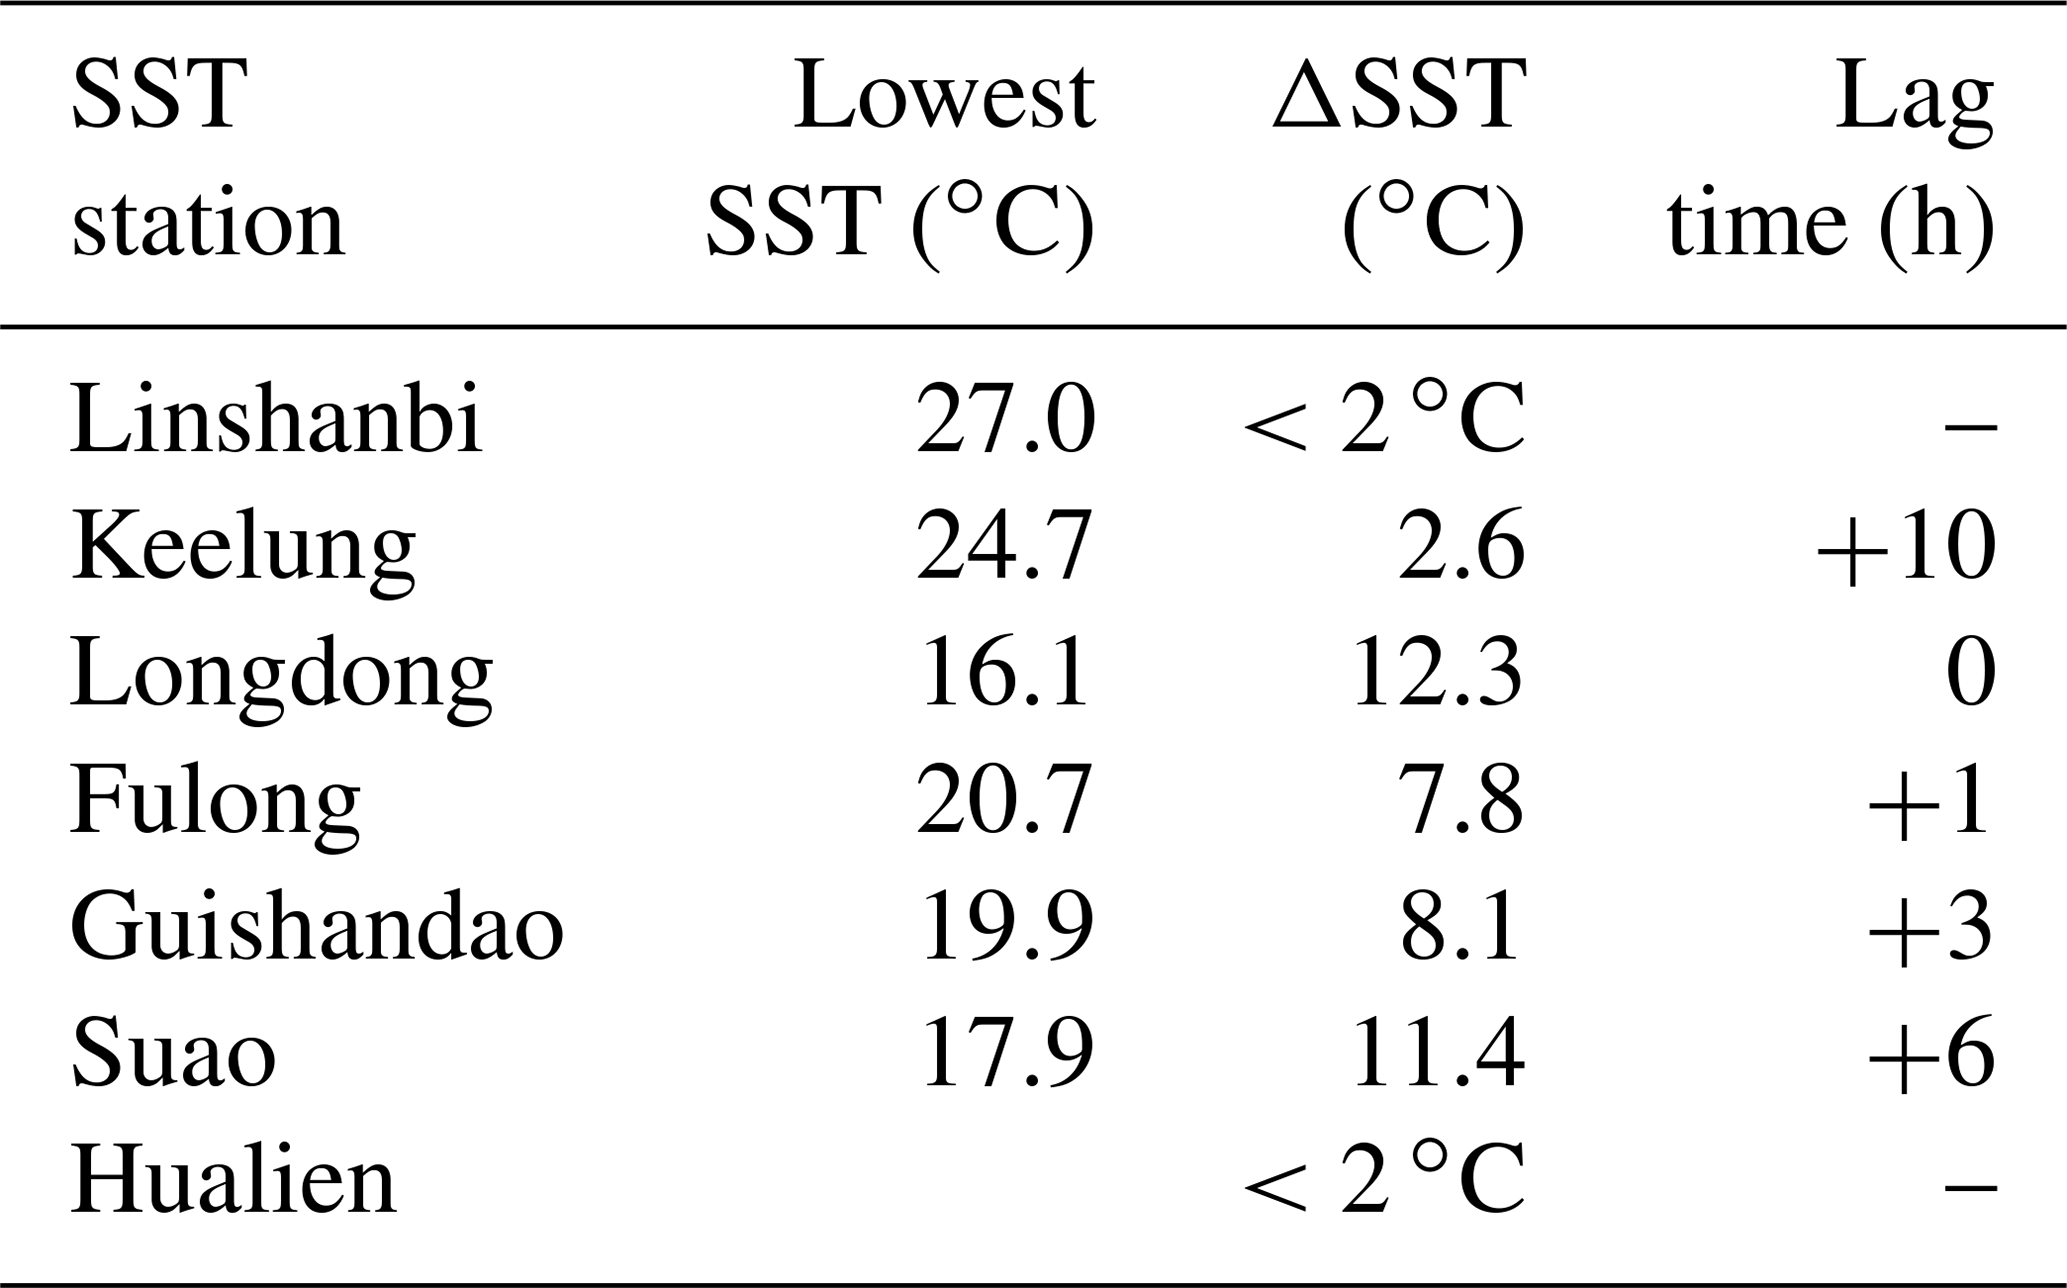
To identify the movement path of cold water being pumped from the deep ocean, the starting time of the SST drop was assessed at several stations in the research area, as shown in Fig. 1. The analysis results of Typhoon Morakot (ΔSST = 12.3 ∘C) are shown in Table 4 as an example. The lag time shown in the table is the start time differences in the SST drops between the stations for the Longdong Buoy; in the table, a positive number indicates that the SST drop observed at the station occurred later than that observed at the Longdong Buoy. As Table 4 shows, we found that coastal SST drops occurred earliest in Longdong waters. We suggest, according to the bathymetry off northeastern Taiwan, that the cold water was pumped from the Kuroshio subsurface (∼155 m depth) in the Okinawa Trough and reached the Longdong area first, and then the cold water was transported north to Keelung and south to Suao. Figure 10 shows a sketch of the cold-water movement path. This assumption can partially prove that no significant SST drop occurred at the Hualien Buoy.
Table 4Quantities of the SST drop, the lowest SST and their lag time corresponding to the Longdong Buoy during Typhoon Morakot in 2009. A positive lag time value indicates that the SST drop observed at the station occurred later than that observed at the Longdong Buoy. A dash means no significant SST drop was observed.
The exchange of water masses off northeastern Taiwan is complex. Chen et al. (1995) showed that at least six water masses take part in the mixing processes in this region, including the Kuroshio Surface Water (SW), Kuroshio Tropical Water (TW), Kuroshio Intermediate Water (IW), East China Sea Water (ECSW), Coastal Water (CW) and the Taiwan Strait Water (TSW). According to extensive investigations, the intrusion of the Kuroshio into the East China Sea (ECS) occurs northeast of Taiwan (Hsueh et al., 1992; Tang et al., 1999; Guo et al., 2006; Yang et al., 2011, 2018; Wu et al., 2017). The mechanism leading to the Kuroshio intrusion into the ECS is still being researched. Recently, Zhou et al. (2018) indicated that the Kuroshio subsurface water could intrude into the ECS shelf from northeastern Taiwan and reach north of 29∘ N. Yang et al. (2018) explained that a topographic beta spiral occurs when the Kuroshio encounters the shelf break and induces strong upwelling. These researchers suggested that the topographic beta spiral provides a dynamic channel through which to bring the cold deepwater from Kuroshio to the continental shelf. Our findings in this study provide direct evidence from long-term buoy measurements.
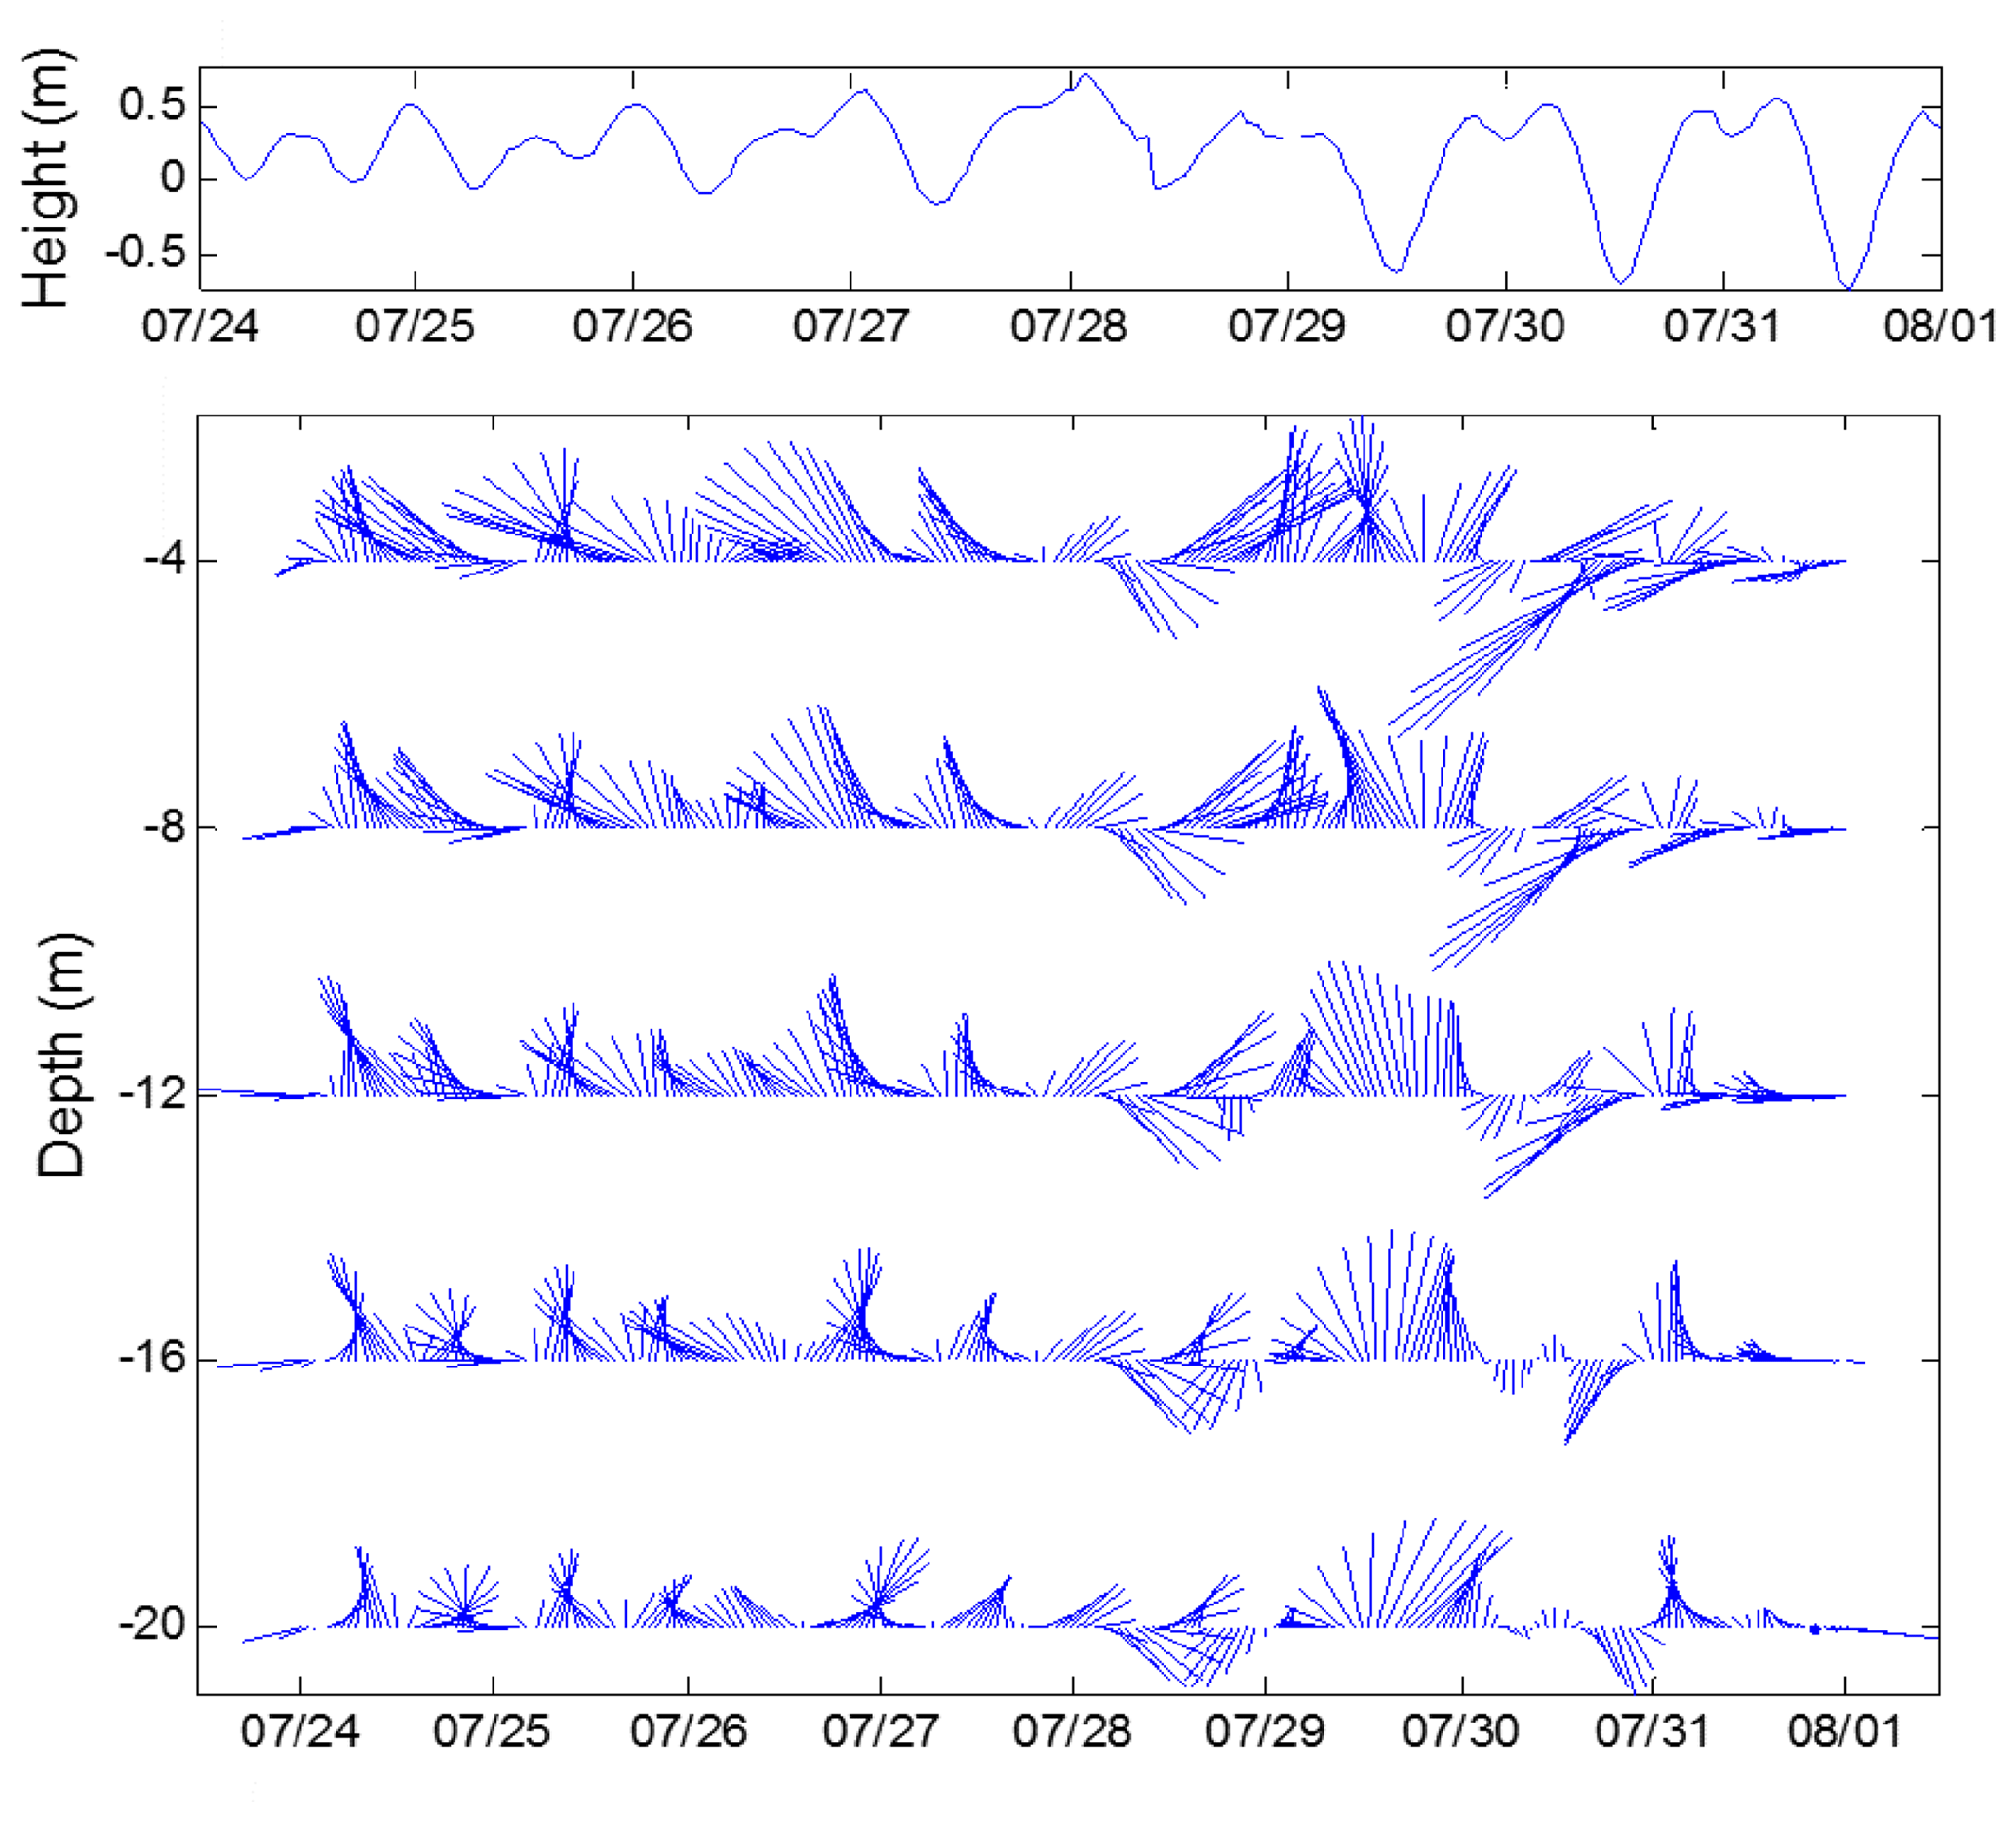
Figure 9Current profile and corresponding tide level observed in Longdong during Typhoon Fungwong in 2008.

Figure 10The suggested movement path of cold water. The cold water was pumped from the Kuroshio subsurface in the Okinawa Trough and reached the Longdong coastal waters first. Then, the cold water was transported north to Keelung and south to Suao.
4.3 Spatial cold-water intrusion
In addition to coastal upwelling, the cold water in the coastal area of Longdong may also come from offshore surfaces, as many studies have confirmed that a cold dome exists in the waters off northeastern Taiwan. Numerous observational and modeling studies have reported occurrences of cold water and isotherm doming in northeastern Taiwan, which is known as the cold dome (Tang et al., 1999; Yang et al., 2011; Shen et al., 2011; Jan et al., 2011; Gopalakrishnan et al., 2013; Cheng et al., 2018). When the Kuroshio flows near the northeastern Taiwan shelf, a weaker northwestward branch intrudes into the ECS shelf (Tang et al., 1999; Lee and Matsuno, 2007). Recently, Cheng et al. (2018) demonstrated a 4–6 year interannual variability in the cold dome. Then, the cold dome forms because of the on-shelf intrusion of the Kuroshio subsurface water. Gopalakrishnan et al. (2013) established a numerical model and found that the cold dome occurrences appeared to be connected with seasonal variability in the Kuroshio. Jan et al. (2011) used field observation data and satellite images to better understand that the center of the cold dome is located at approximately 25.625∘ N, 122.125∘ E. The diameter of the cold dome is approximately 100 km, and it has a weak counterclockwise circulation. The SST of the cold dome is ∼3 ∘C below the temperature of the ambient shelf waters.
Daily satellite images (Fig. 11) show the spatial distribution of SSTs during Typhoon Jangmi in 2008. The cold dome moved shoreward along the movement of the typhoons. The temperature difference between the coastal area of Longdong and the center of the cold water is generally less than 3 ∘C. However, the scale of the SST drop in the Longdong area was much higher. Although the contributions from the north (cold dome) and deep sea were not decomposed, it was suggested that cold water coming from the deep sea dominates the coastal SST drops in the Longdong area.
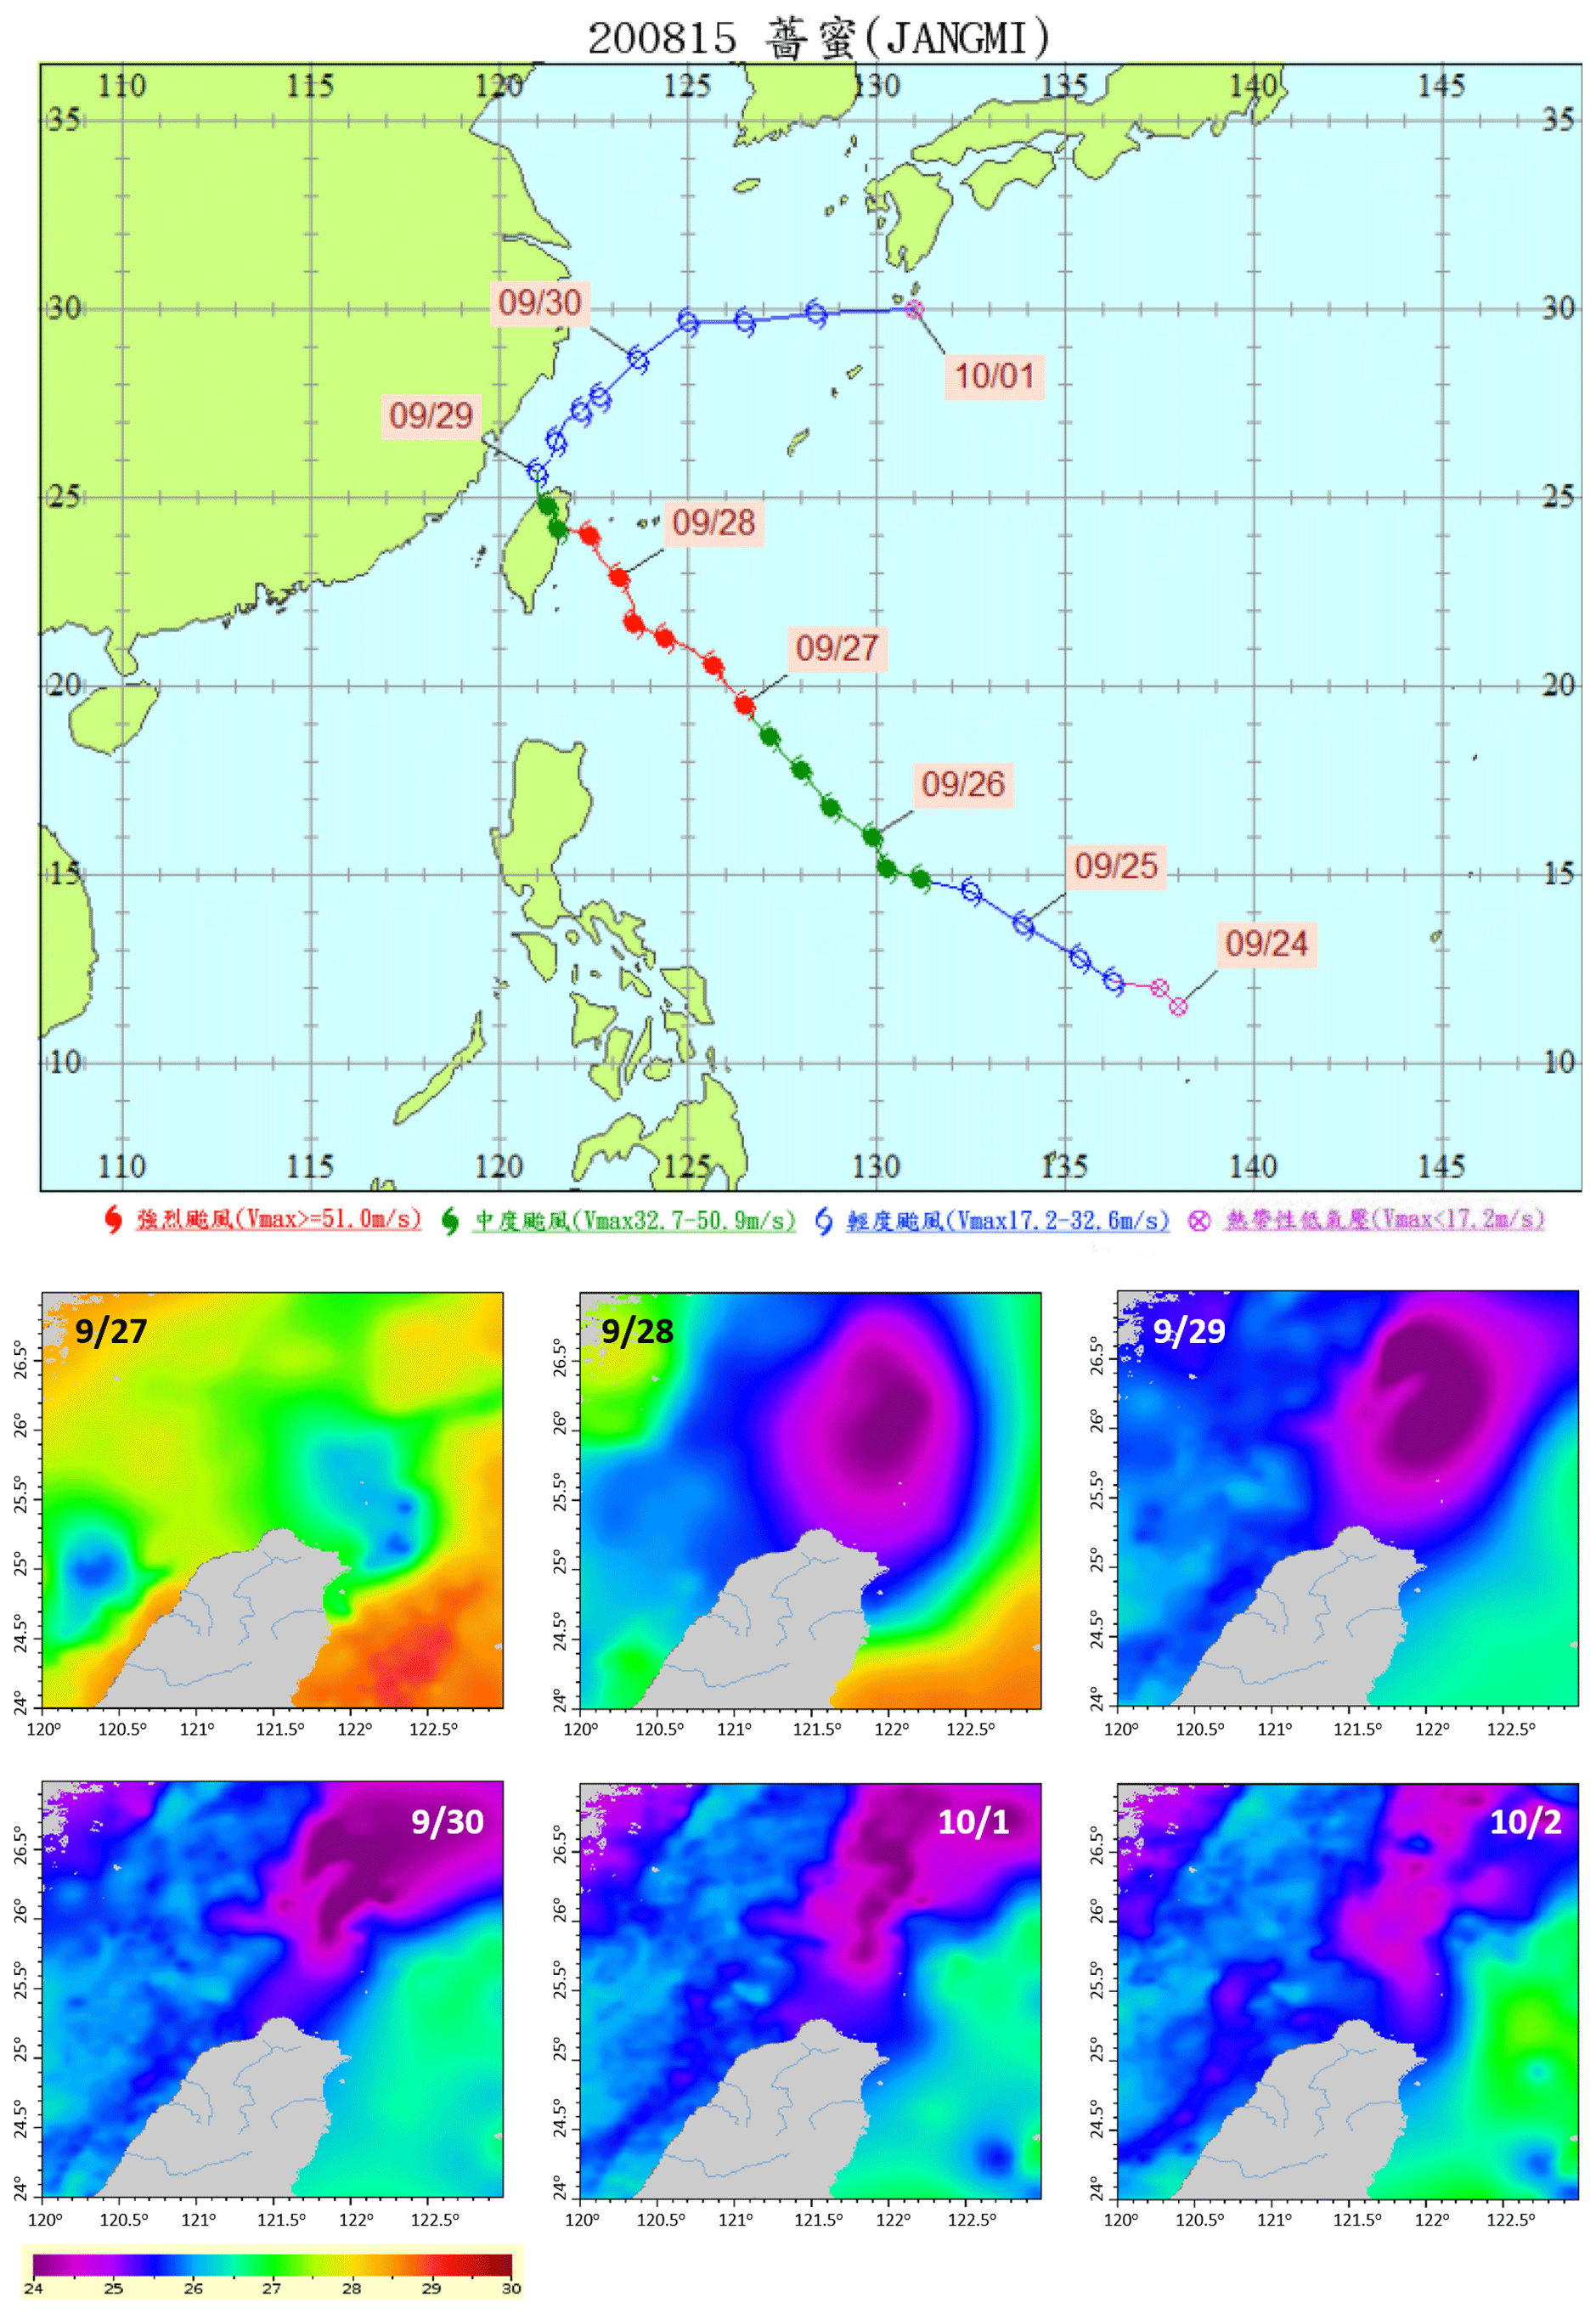
Figure 11Movement of the cold dome off northeastern Taiwan during Typhoon Jangmi in 2008. The typhoon track is shown in the upper panel. The lower panel shows the satellite images of the SST.
The dataset used in this study was deposited in the World Data Center PANGAEA (https://doi.org/10.1594/PANGAEA.895002, Doong, 2018). The contents and format of the data are included in the “readme” file provided with the data.
Seawater temperature affects marine environmental ecosystems and human activities. The variability in seawater temperature also influences typhoon intensity. It is widely known that the SST may drop a few degrees after the passage of a typhoon. However, in this study, we found that following summer typhoon passages in the coastal waters off Longdong in Taiwan, the SST may decrease to values lower than the annual minimum temperature (which always occurs in winter).
Long-term SST field data from the Longdong Buoy (which is located 0.6 km offshore at a water depth of 23 m) over the past 20 years (1998 to 2017) were analyzed to study coastal SST drops. These decreases were observed after the passage of 43 typhoons. The mean SST drop during the 43 events was 6.1 ∘C. The lowest SST was 16.1 ∘C, which was observed during Typhoon Morakot in 2009; however, the maximum SST drop was 12.5 ∘C, observed during Typhoon Fungwong in 2008. This scale of decrease is much larger than that in the open ocean. The mean duration of the SST drop was 24 h, and on average, 26.1 h were required for the SST to recover to the background temperature.
Previous studies on the open ocean have proposed that the scale of the SST drop is related to typhoon intensity and speed. However, we found that the scale of typhoon-induced coastal SST drops in the northeastern Taiwan area were mainly correlated with the typhoon track. Typhoon intensity and moving speed do not appear to be significant factors driving coastal SST drops in this location. Typhoons that moved south of Longdong (i.e., Longdong is to the right of the typhoon) accounted for more than 70 % of coastal SST drops and exhibited reduction on extremely large scales, irrespective of whether these typhoons traveled near or far from Longdong.
Wind-driven coastal upwelling was confirmed as the main mechanism involved in substantial coastal SST drops after a typhoon passage at Longdong. The measurements indicated that many typhoons were accompanied by alongshore winds blowing in a constant direction. Such winds induce coastal upwelling and pump bottom seawater up to the surface. This was verified through measurements of the current profile collected at Longdong. This discovery explains the conclusion that SST drops are mainly influenced by typhoon tracks. However, the cold water was not directly supplied from the subsurface of Longdong. We suggest that the coldest water may originate from depths of 155 m in the Okinawa Trough, which is ∼50 km from Longdong. These waters are the subsurface waters of Kuroshio. We found that the coverage of a large wind speed region by the Kuroshio is a significant factor that triggers the coastal SST drop. When the strong wind area largely overlapped with Kuroshio, there was a very large SST drop on the Longdong coast. By analyzing SST drop processes and the lag times between field stations, we suggest that the cold water intrudes first at Longdong and is then transported along the coast. Except for the vertical source of cold water, the cold water from the known cold dome off northeastern Taiwan may also penetrate and cool the coastal area. An analysis of satellite images indicated that the cold dome moves towards the northern coast of Taiwan after a typhoon passage and contributes to coastal SST drops. In this study, the contributions of the offshore surface cold water and Kuroshio subsurface cold water were not decomposed, but we suggest that the Kuroshio subsurface cold water is the main source of the Longdong coastal SST drop. The presentation of the coastal SST dataset with a significant drop may help to understand the interaction between Kuroshio and typhoons, and can be used to calibrate and validate the numerical models of such interactions.
Six cases of coastal SST drops larger greater than 10 ∘C observed by the Longdong Buoy after a typhoon passage. (Left figure shows the typhoon tracks, and the time series of SSTs are shown on the right.)


DJD was the main contributor to this paper. He initiated the idea, collected the data, designed the experiment and wrote the manuscript. JPP checked the data quality, worked on the analysis and plotted the figures. AVB joined the discussions and provided constructive suggestions on writing the manuscript.
The authors declare that they have no conflict of interest.
This research was performed with support from the Ministry of Science and
Technology (MOST) of Taiwan under grant no. MOST 106-2628-E-006-008-MY3. The
buoys that measure SST data are operated by the Coastal Ocean Monitoring
Center of National Cheng Kung University in Tainan, Taiwan. The authors
would like to thank all their colleagues at the center. In addition, the
authors acknowledge the Industrial Technology Research Institute (ITRI) for
providing the ADCP current data.
Edited by: Giuseppe M. R. Manzella
Reviewed by: two anonymous referees
Babin, S. M., Carton, J. A., Dickey, T. D., and Wiggert, J. D.: Satellite evidence of hurricane-induced phytoplankton blooms in an oceanic desert, J. Geophys. Res., 109, C03043, https://doi.org/10.1029/2003JC001938, 2004.
Bender, M. A., Ginis, I., and Kurihara, Y.: Numerical simulations of tropical cyclone-ocean interaction with a high-resolution coupled model, J. Geophys. Res., 98, 23245–23263, https://doi.org/10.1029/93JD02370, 1993.
Bingham, F. M.: Physical response of the coastal ocean to typhoon Isabel near landfall, Ocean Sci., 3, 159–171, https://doi.org/10.5194/os-3-159-2007, 2007.
Chang, Y., Liao, H. T., Lee, M. A., Chan, J. W., Shieh, W. J., Lee, K. T., Wang, G. H., and Lan, Y. C.: Multisatellite observation on upwelling after the passage of typhoon Hai-Tang in the southern East China Sea, Geophys. Res. Lett., 35, L03612, https://doi.org/10.1029/2007GL032858, 2008.
Chen, C. T. A., Ruo, R., Pai, S. C., Liu, C. T., and Wong, G. T. F.: Exchange of water masses between the East China Sea and the Kuroshio off northeastern Taiwan, Cont. Shelf Res., 15, 19–39, https://doi.org/10.1016/0278-4343(93)E0001-O, 1995.
Chen, C. T. A., Liu, C. T., Chuang, W. S., Yang, Y. J., Shiah, F. K., Tang, T. Y., and Chung, S. W.: Enhanced buoyancy and hence upwelling of subsurface Kuroshio waters after a typhoon in the southern East China Sea, J. Marine Syst., 42, 65–79, https://doi.org/10.1016/S0924-7963(03)00065-4, 2003.
Cheng, Y. H., Hu, J., Zheng, Q., and Su, F. C.: Interannual variability of cold domes northeast of Taiwan, Int. J. Remote Sens., 39, 4293–4303, https://doi.org/10.1080/01431161.2017.1395972, 2018.
Cheung, H. F., Pan, J., Gu, Y., and Wang, Z.: Remote sensing observation of ocean responses to typhoon Lupit in the northwest Pacific, Int. J. Remote Sens., 34, 1478–1491, https://doi.org/10.1080/01431161.2012.721940, 2013.
Chiang, T. L., Wu, C. R., and Oey, L. Y.: Typhoon Kai-Tak: an ocean's perfect storm, J. Phys. Oceanogr., 41, 221–233, https://doi.org/10.1175/2010JPO4518.1, 2011.
Chu, P. C., Veneziano, J. M., Fan, C., Carron, M. J., and Liu, W. T.: Response of the South China Sea to tropical cyclone Ernie 1996, J. Geophys. Res., 105, 13991–14009, https://doi.org/10.1029/2000JC900035, 2000.
Doong, D. J.: SST observed during 43 typhoons by marine buoy in the coastal area from 1998 to 2017, Data set, https://doi.org/10.1594/PANGAEA.895002, 2018.
Doong, D. J., Chen, S. H., Kao, C. C., and Lee, B. C.: Data quality check procedures of an operational coastal ocean monitoring network, Ocean Eng., 34, 234–246, https://doi.org/10.1016/j.oceaneng.2006.01.011, 2007.
Ghantous, M. and Babanin, A. V.: One-dimensional modelling of upper ocean mixing by turbulence due to wave orbital motion, Nonlin. Processes Geophys., 21, 325–338, https://doi.org/10.5194/npg-21-325-2014, 2014.
Gopalakrishnan, G., Cornuelle, B. D., Gawarkiewicz, G., and McClean, J. L.: Structure and evolution of the cold dome off northeastern Taiwan: a numerical study, Oceanography, 26, 66–79, https://doi.org/10.5670/oceanog.2013.06, 2013.
Gopalakrishna, V. V., Murty, V. S. N., Sarma, M. S. S., and Sastry, J. S.: Thermal response of upper layers of bay of Bengal to forcing of a severe cyclonic storm: a case study, Indian, J. Mar. Sci., 22, 8–11, 1993.
Guan, S., Zhao, W., Huthnance, J., Tian, J., and Wang, J.: Observed upper ocean response to typhoon Megi (2010) in the northern South China Sea, J. Geophys. Res.-Oceans, 119, 3134–3157, https://doi.org/10.1002/2013JC009661, 2014.
Guo, X. Y., Miyazawa, Y., and Yamagata, T.: The Kuroshio onshore intrusion along the shelf break of the East China Sea: The origin of the Tsushima warm current, J. Phys. Oceanogr., 36, 2205–2231, https://doi.org/10.1175/JPO2976.1, 2006.
Hanshaw, M. N., Lozier, M. S., and Palter, J. B.: Integrated impact of tropical cyclones on sea surface chlorophyll in the North Atlantic, Geophys. Res. Lett., 35, L01601, https://doi.org/10.1029/2007GL031862, 2008.
Hsueh, Y., Wang, J., and Chern, C. S.: The intrusion of the Kuroshio across the continental shelf northeast of Taiwan, J. Geophys. Res., 97, 14323–14330, https://doi.org/10.1029/92JC01401, 1992.
Huang, C. J., Qiao, F., Dai, D., Ma, H., and Guo, J.: Field measurement of upper ocean turbulence dissipation associated with wave turbulence interaction in the South China Sea, J. Geophys. Res., 117, C00J09, https://doi.org/10.1029/2011JC007806, 2012.
Hung, C.-C., Gong, G.-C., Chou, W.-C., Chung, C.-C., Lee, M.-A., Chang, Y., Chen, H.-Y., Huang, S.-J., Yang, Y., Yang, W.-R., Chung, W.-C., Li, S.-L., and Laws, E.: The effect of typhoon on particulate organic carbon flux in the southern East China Sea, Biogeosciences, 7, 3007–3018, https://doi.org/10.5194/bg-7-3007-2010, 2010.
Jan, S., Chen, C. C., Tsai, Y. L., Yang, Y. J., Wang, J., Chern, C. S., Gawarkiewicz, G., Lien, R. C., Centurioni, L., and Kuo, J. Y.: Mean structure and variability of the cold dome northeast of Taiwan, Oceanography, 24, 100–109, https://doi.org/10.5670/oceanog.2011.98, 2011.
Jan, S., Wang, J., Yang, Y. J., Hung, C. C., Chern, C. S., Gawarkiewicz, G., Lien, R. C., Centurion, L., Kuo, J. Y., and Wang, B.: Observation of a freshwater pulse induced by typhoon Morakot off the northern coast of Taiwan in August 2009, J. Mar. Res., 71, 19–46, https://doi.org/10.1357/002224013807343452, 2013.
Jiang, X. P., Zhong, Z., and Jiang, J.: Upper ocean response of the South China Sea to typhoon Krovanh (2003), Dynam. Atmos. Oceans, 47, 165–175, https://doi.org/10.1016/j.dynatmoce.2008.09.005, 2009.
Kawai, Y. and Wada, A.: Detection of cyclone-induced rapid increases in chlorophyll-a with sea surface cooling in the northwestern Pacific Ocean from a MODIS/SeaWiFS merged satellite chlorophyll product, Int. J. Remote Sens., 32, 9455–9471, https://doi.org/10.1080/01431161.2011.562252, 2011.
Ko, D. S., Chao, S. Y., Wu, C. C., and Lin, I. I.: Impacts of typhoon Megi (2010) on the South China Sea, J. Geophys. Res.-Oceans, 119, 4474–4489, https://doi.org/10.1002/2013JC009785, 2014.
Kuo, Y. C., Chern, C. S., Wang, J., and Tsai, Y. L.: Numerical study of upper ocean response to a typhoon moving zonally across the Luzon Strait, Ocean Dynam., 61, 1783–1795, https://doi.org/10.1007/s10236-011-0459-7, 2011.
Lee, J. S. and Matsuno, T.: Intrusion of Kuroshio water onto the continental shelf of the East China Sea, J. Oceanogr., 63, 309–325, https://doi.org/10.1007/s10872-007-0030-9, 2007.
Lin, I. I., Liu, W. T., Wu, C. C., Chiang, J. C. H., and Sui, C. H.: Satellite observations of modulation of surface winds by typhoon-induce upper ocean cooling, Geophys. Res. Lett., 30, 1131, https://doi.org/10.1029/2002GL015674, 2003a.
Lin, I. I., Liu, W. T., Wu, C. C., Wong, G. T. F., Hu, C., Chen, Z., Liang, W. D., Yang, Y., and Liu, K. K.: New evidence for enhanced ocean primary production triggered by tropical cyclone, Geophys. Res. Lett., 30, 1718, https://doi.org/10.1029/2003GL017141, 2003b.
Liu, X. and Wei, J.: Understanding surface and subsurface temperature changes induced by tropical cyclones in the Kuroshio, Ocean Dynam., 65, 1017–1027, https://doi.org/10.1007/s10236-015-0851-9, 2015.
Liu, X., Wang, M., and Shi, W.: A study of a hurricane Katrina-induced phytoplankton bloom using satellite observations and model simulations, J. Geophys. Res., 114, C03023, https://doi.org/10.1029/2008JC004934, 2009.
Matthews, J. B. R.: Comparing historical and modern methods of sea surface temperature measurement – part 1: review of methods, field comparisons and dataset adjustments, Ocean Sci., 9, 683–694, https://doi.org/10.5194/os-9-683-2013, 2013.
Morimoto, A., Kojima, S., Jan, S., and Takahashi, D.: Movement of the Kuroshio axis to the northeast shelf of Taiwan during typhoon events, Estuar. Coast. Shelf S., 82, 547–552, https://doi.org/10.1016/j.ecss.2009.02.022, 2009.
Narayan, N., Paul, A., Mulitza, S., and Schulz, M.: Trends in coastal upwelling intensity during the late 20th century, Ocean Sci., 6, 815–823, https://doi.org/10.5194/os-6-815-2010, 2010.
Park, K. A. and Kim, K. R.: Unprecedented coastal upwelling in the East/Japan Sea and linkage to long-term large variations, Geophys. Res. Lett., 37, L09603, https://doi.org/10.1029/2009GL042231, 2010.
Price, J. F.: Upper ocean response to a typhoon, J. Phys. Oceanogr., 11, 153–175, https://doi.org/10.1175/1520-0485(1981)011<0153:UORTAH>2.0.CO;2, 1981.
Rao, A. D., Babu, S. V., and Dube, S. K.: Impact of a tropical cyclone on coastal upwelling processes, Nat. Hazards, 31, 415–435, https://doi.org/10.1023/B:NHAZ.0000023360.37260.5b, 2004.
Sakaida, F., Kawamura, H., and Toba, Y.: Sea surface cooling caused by typhoons in the Tohoku area in August 1989, J. Geophys. Res., 103, 1053–1065, https://doi.org/10.1029/97JC01859, 1998.
Shang, S. L., Li, L., Sun, F. Q., Wu, J. U., Hu, C. M., Chen, D. W., Ning, X. R. Qiu, U., and Shang, S. P.: Changes of temperature and bio-optical properties in the South China Sea in response to typhoon Lingling, 2001, Geophys. Res. Lett., 35, L10602, https://doi.org/10.1029/2008GL033502, 2008.
Shen, M. L., Tseng, Y. H., and Jan, S.: The formation and dynamics of the cold-dome off northeastern Taiwan, J. Marine Syst., 86, 10–27, https://doi.org/10.1016/j.jmarsys.2011.01.002, 2011.
Siswanto, E., Ishizaka, J., Yokouchi, K., Tanaka, K., and Tan, C. K.: Estimation of interannual and interdecadal variations of typhoon-induced primary production: a case study for the outer shelf of the East China Sea, Geophys. Res. Lett., 34, L03604, https://doi.org/10.1029/2006GL028368, 2007.
Subrahmanyam, M. V.: Impact of typhoon on the north-west Pacific sea surface temperature: a case study of typhoon Kaemi (2006), Nat. Hazards, 78, 569–582, https://doi.org/10.1007/s11069-015-1733-7, 2015.
Sun, J., Oey, L. Y., Chang, R., Xu, F., and Huang, S. M.: Ocean response to typhoon Nuri (2008) in western Pacific and South China Sea, Ocean Dynam., 65, 735–749, https://doi.org/10.1007/s10236-015-0823-0, 2015.
Tang, T., Hsueh, Y., Yang, Y., and Ma, J.: Continental slope flow northeast of Taiwan, J. Phys. Oceanogr., 29, 1353–1362, https://doi.org/10.1175/1520-0485(1999)029<1353:CSFNOT>2.0.CO;2, 1999.
Toffoli, A., McConochie, J., Ghantous, M., Loffredo, L., and Babanin, A. V.: The effect of turbulence induced by non-breaking waves on the ocean mixed layer: field observations on the Australian north-west shelf, J. Geophys. Res., 117, C00J24, https://doi.org/10.1029/2011JC007780, 2012.
Tsai, Y. L., Chern, C. S., and Wang, J.: Typhoon induce upper ocean cooling off northeastern Taiwan, Geophys. Res. Lett., 35, L14605, https://doi.org/10.1029/2008GL034368, 2008a.
Tsai, Y. L., Chern, C. S., and Wang, J.: The upper ocean response to a moving typhoon, J. Oceanogr., 64, 115–130, https://doi.org/10.1007/s10872-008-0009-1, 2008b.
Tsai, Y. L., Chern, C. S., Jan, S., and Wang, J.: Numerical study of cold dome variability induced by typhoon Morakot (2009) off northeastern Taiwan, J. Mar. Res., 71, 109–132, https://doi.org/10.1357/002224013807343434, 2013.
Tseng, Y. H., Jan, S., Dietrich, D. E., Lin, I. I., Chang, Y. T., and Tang, T. Y.: Modeled oceanic response and sea surface cooling to typhoon Kai-Tak, Terr. Atmos. Ocean Sci., 21, 85–98, https://doi.org/10.3319/TAO.2009.06.08.02(IWNOP), 2010.
Wada, A.: Numerical simulations of sea surface cooling by a mixed layer model during the passage of typhoon Rex, J. Oceanogr., 61, 41–57, https://doi.org/10.1007/s10872-005-0018-2, 2005.
Wada, A., Niino, H., and Nakano, H.: Roles of vertical turbulent mixing in the ocean response to typhoon Rex (1998), J. Oceanogr., 65, 373–396, https://doi.org/10.1007/s10872-009-0034-8, 2009.
Wei, J., Liu, X., and Wang, D. X.: Dynamic and thermal responses of the Kuroshio to typhoon Megi (2004), Geophys. Res. Lett., 41, 8495–8502, https://doi.org/10.1002/2014GL061706, 2014.
Wentz, F. J., Scott, J., Hoffman, R., Leidner, M., Atlas, R., and Ardizzone, J.: Remote sensing systems cross-calibrated multi-platform (CCMP) 6-hourly ocean vector wind analysis product on 0.25 deg grid, version 2.0, remote sensing system, Santa Rosa, California, available at: http://www.remss.com/measurements/ccmp/ (last access: August 2018), 2015.
Wentz, F. J., Gentemann, C., Smith, D., and Chelton, D.: Satellite measurements of sea surface temperature through clouds, Science, 288, 847–850, https://doi.org/10.1126/science.288.5467.847, 2000.
Wu, C. R., Chang, Y. L., Oey, L. Y., Chang, C. W. and Hsin, Y. C.: Air-sea interaction between tropical cyclone Nari and Kuroshio, Geophys. Res. Lett., 35, L12605, https://doi.org/10.1029/2008GL033942, 2008.
Wu, C. R., Wang, Y. L., Lin, Y. F., and Chao, S. Y.: Intrusion of the Kuroshio into the South and East China Seas, Sci. Rep., 7, 7895, https://doi.org/10.1038/s41598-017-08206-4, 2017.
Xu, F., Yao, Y., Oey, L., and Lin, Y.: Impacts of pre-existing ocean cyclonic circulation on sea surface chlorophyll-a concentrations off northeastern Taiwan following episodic typhoon passages, J. Geophys. Res.-Oceans, 122, 6482–6497, https://doi.org/10.1002/2016JC012625, 2017.
Yang, D. Z., Yin, B. S., Liu, Z. L., and Feng, X. R.: Numerical study of the ocean circulation on the East China Sea shelf and a Kuroshio bottom branch northeast of Taiwan in summer, J. Geophys. Res., 116, C05015, https://doi.org/10.1029/2010JC006777, 2011.
Yang, D. Z., Huang, R. X., Yin, B. S., Feng, X. R., Chen, H. Y., Qi, J. F., Xu, L. J., Shi, Y. L., Cui, X., Gao, G. D., and Benthuysen, J. A.: Topographic beta spiral and onshore intrusion of the Kuroshio current, Geophys. Res. Lett., 45, 287–296, https://doi.org/10.1002/2017GL076614, 2018.
Zheng, Z. W., Ho, C. R., Zheng, Q., Lo, Y. T., Kuo, N. J., and Gopalakrishnan, G.: Effects of preexisting cyclonic eddies on upper ocean responses to Category 5 typhoons in the western North Pacific, J. Geophys. Res., 115, C09013, https://doi.org/10.1029/2009JC005562, 2010.
Zheng, Z. W., Zheng, Q., Lee, C. Y., and Gopalakrishnan, G.: Transient modulation of Kuroshio upper layer flow by directly impinging typhoon Morakot in east of Taiwan in 2009, J. Geophys. Res.-Oceans, 119, 4462–4473, https://doi.org/10.1002/2014JC010090, 2014.
Zhou, P., Song, X. X., Yuan, Y. Q., Cao, X. H., Wang, W. T., Chi, L. B., and Yu, Z. M.: Water mass analysis of the East China Sea and interannual variation of Kuroshio subsurface water intrusion through an optimum multiparameter method, J. Geophys. Res.-Oceans, 123, 3723–3738, https://doi.org/10.1029/2018JC013882, 2018.
Zhu, T. and Zhang, D. L.: The impact of the storm-induced SST cooling on typhoon intensity, Adv. Atmos. Sci., 23, 14–22, https://doi.org/10.1007/s00376-006-0002-9, 2006.