the Creative Commons Attribution 4.0 License.
the Creative Commons Attribution 4.0 License.
 | 30 Aug 2019
Atmospheric observations made at Oliktok Point, Alaska, as part of the Profiling at Oliktok Point to Enhance YOPP Experiments (POPEYE) campaign
Darielle Dexheimer
John Hubbe
Casey Longbottom
Peter J. Carroll
Monty Apple
Lexie Goldberger
David Oaks
Justin Lapierre
Michael Crume
Nathan Bernard
Matthew D. Shupe
Amy Solomon
Janet Intrieri
Dale Lawrence
Abhiram Doddi
Donna J. Holdridge
Michael Hubbell
Mark D. Ivey
Beat Schmid
Between 1 July and 30 September 2018, small unmanned aircraft systems (sUAS), tethered balloon systems (TBSs), and additional radiosondes were deployed at Oliktok Point, Alaska, to measure the atmosphere in support of the second special observing period for the Year of Polar Prediction (YOPP). These measurements, collected as part of the Profiling at Oliktok Point to Enhance YOPP Experiments (POPEYE) campaign, targeted quantities related to enhancing our understanding of boundary layer structure, cloud and aerosol properties and surface–atmosphere exchange and providing extra information for model evaluation and improvement work. Over the 3-month campaign, a total of 59 DataHawk2 sUAS flights, 52 TBS flights, and 238 radiosonde launches were completed as part of POPEYE. The data from these coordinated activities provide a comprehensive three-dimensional data set of the atmospheric state (air temperature, humidity, pressure, and wind), surface skin temperature, aerosol properties, and cloud microphysical information over Oliktok Point. These data sets have been checked for quality and submitted to the US Department of Energy (DOE) Atmospheric Radiation Measurement (ARM) program data archive (http://www.archive.arm.gov/discovery/, last access: July 2019) and are accessible at no cost by all registered users. The primary dataset DOIs are https://doi.org/10.5439/1418259 (DataHawk2 measurements; Atmospheric Radiation Measurement Program, 2016), https://doi.org/10.5439/1426242 (TBS measurements; Atmospheric Radiation Measurement Program, 2017) and https://doi.org/10.5439/1021460 (radiosonde measurements; Atmospheric Radiation Measurement Program, 2013a).
- Article
(11575 KB) - Full-text XML
- BibTeX
- EndNote


Recent decades have seen notable shifts in Arctic climate (Serreze et al., 2007; Screen and Simmonds, 2010). Reductions in sea ice (Maslanik et al., 2011; Comiso et al., 2008), evident as an integrator of a warming Arctic atmosphere (Dobricic et al., 2016; Graversen et al., 2008), and an evolving surface energy budget (Mayer et al., 2016; Hudson et al., 2013) act to enhance absorption of solar radiation at the surface due to a dramatic shift in surface albedo (REFS), potentially enhancing Arctic warming. Sea ice reductions also present opportunities for commerce, including natural resource extraction, shipping, and fishing (Smith and Stephenson, 2013; Ho, 2010). Finally, these changes have direct implications for border security due to reduced difficulties with navigation in Arctic waters.
In recognition of the importance of these changes and our need to be able to predict and understand them, several nations have established Arctic atmospheric observatories. These observatories measure atmospheric state, cloud properties, aerosols, winds, and surface meteorology, providing critically needed data sets for assimilation into numerical weather prediction models and to advance the physical understanding of the Arctic atmosphere. In northern Alaska, the US Department of Energy (DOE) Atmospheric Radiation Measurement (ARM) Program currently operates two such observatories. The first is the long-term North Slope of Alaska (NSA) site located in Utqiagvik, which has operated since the late 1990s. Additionally, since 2013, the DOE ARM program has operated its third ARM mobile facility (AMF-3) at Oliktok Point, Alaska. Consortia such as the International Arctic Systems for Observing the Atmosphere (IASOA, Uttal et al., 2016) have formed to support the efficient synthesis of measurements from these and other observatories around the Arctic.
These observatories only represent a fraction of the work to improve our ability to predict the Arctic environment. Groups such as the World Weather Research Programme (WWRP) Polar Prediction Project (PPP) have developed concentrated efforts to support such work. An example of such an effort is the Year Of Polar Prediction (YOPP), taking place from mid-2017 through mid-2019, which directly targets the improvement of prediction capabilities across a wide variety of timescales, from hours to seasons, through coordinated and intensive observations and focused modeling activities. During the “core phase” of the YOPP, two “special observing periods” (SOPs) were conducted in 2018. This includes one SOP in spring (1 February 2018 to 31 March 2018) and one in late summer (1 July 2018 to 30 September 2018). The “core phase” will be followed by a 3-year “consolidation phase”, during which a variety of experiments and analysis projects will leverage the data sets collected during the core phase to evaluate and improve models, conduct data denial experiments, and evaluate the state of polar prediction.
Based on the input of the global weather and climate modeling communities, YOPP has established a set of detailed modeling priorities, including the following.
-
Boundary layer including mixed phase clouds
-
Sea ice modeling
-
Physics of coupling, including snow on sea ice
-
High-resolution modeling including ensembles
-
Model validation and intercomparison
-
Upper ocean processes
-
The stratosphere
-
Chemistry, including aerosols and ozone
As part of the second SOP, the DOE ARM program supported efforts to enhance observational coverage of the atmosphere at the AMF-3 in Oliktok Point, Alaska (Fig. 1). This project, titled Profiling at Oliktok Point to Enhance YOPP Experiments (POPEYE), included deployment of the DataHawk2 unmanned aircraft system, tethered balloon systems, and one additional radiosonde per day (three launches daily versus the standard twice-daily launch schedule followed at the observatory) to provide measurements needed to help meet the objectives above. The lower-atmospheric thermodynamic observations offer a detailed look into the Arctic summertime boundary layer, providing insight into its structure and evolution and a means of validating retrieval algorithms from remote sensors. Such measurements support the stated YOPP goal of pursuing an integrated modeling framework to connect cloud, boundary layer and surface energy exchange schemes through large eddy simulation (LES)-based development. Additionally, POPEYE provides a detailed data set that can be used for evaluation of model performance across a variety of model products (e.g., reanalyses, weather forecast models, coupled regional forecast models, global climate models), and more frequent radiosondes can help assess the impact of data assimilation on operational models. This facilitates studies on the impact of enhanced Arctic observations on predictions of lower-latitude weather (e.g., Jung, 2014; Inoue et al., 2015). The measurements collected can also provide constraints on the initial and boundary conditions for intercomparisons of single-column and large eddy simulation models. The increased frequency of radiosonde launches provides an enhanced look into the Arctic stratosphere, further supported by the launch of additional radiosondes at other observatories during this SOP. Finally, POPEYE aerosol measurements provide information on the vertical structure of key particle properties.
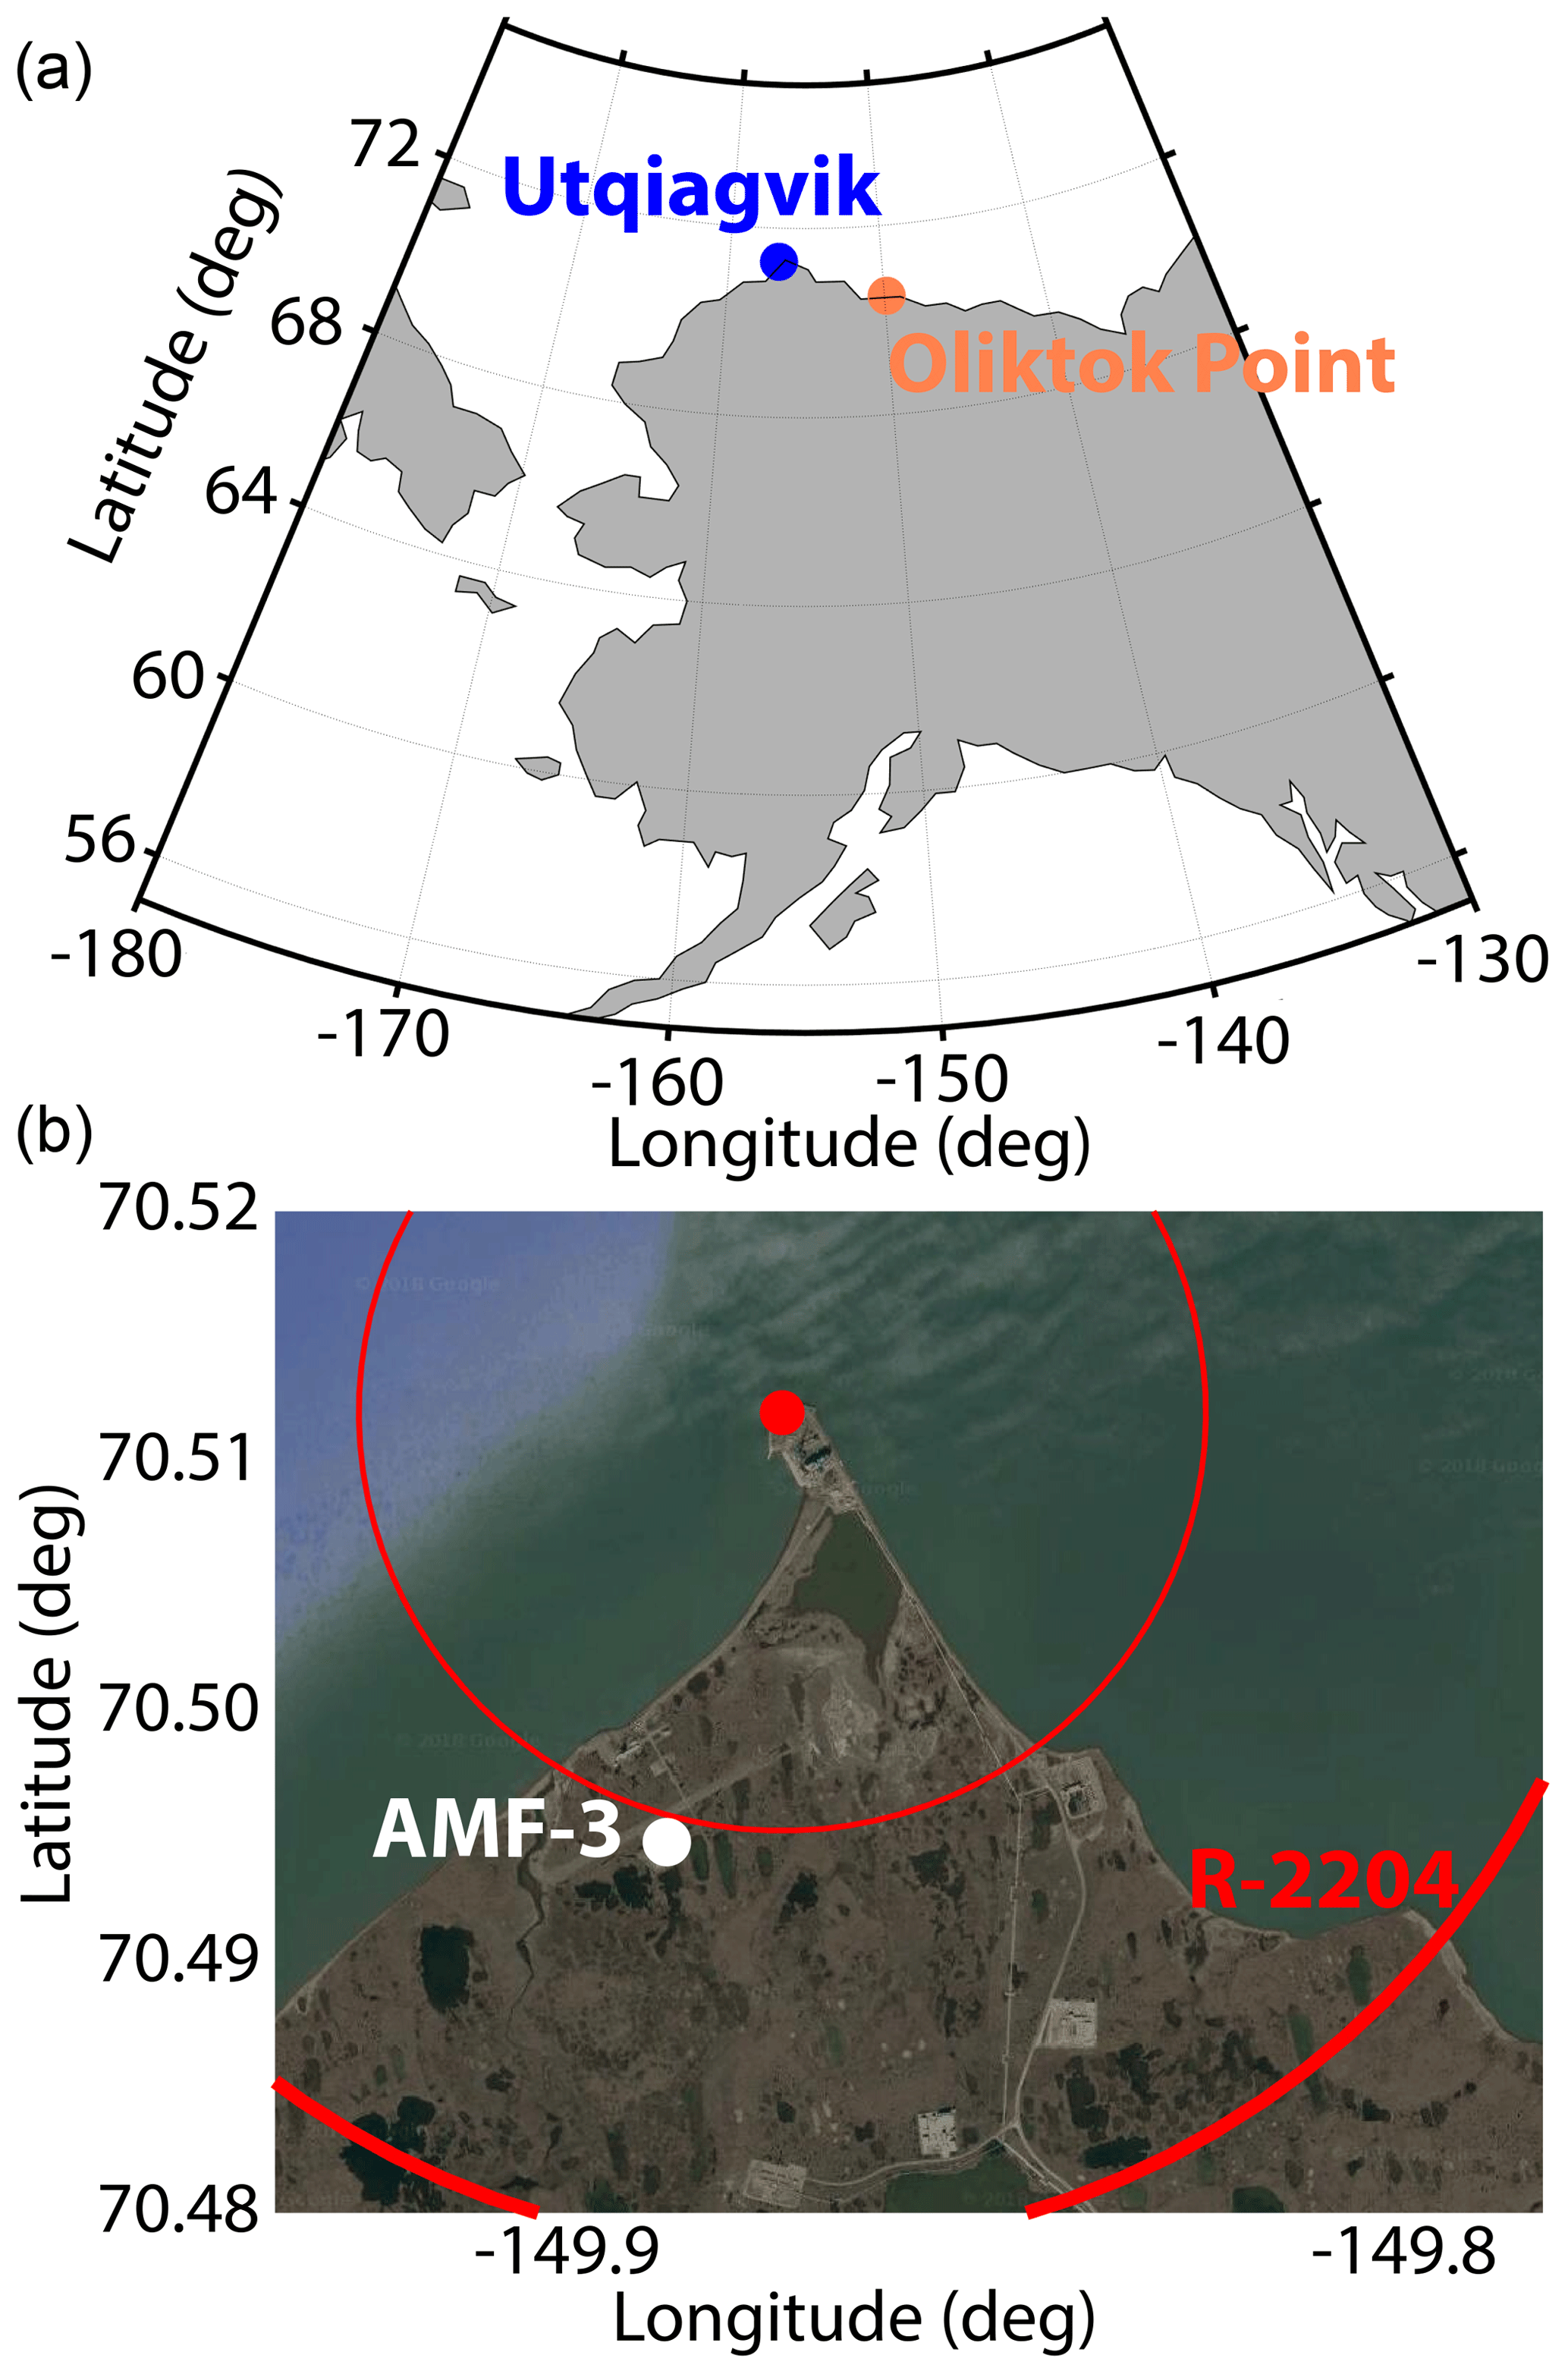
Figure 1A map illustrating the location of Oliktok Point, Alaska (a). Panel (b) is a satellite image of the Oliktok Point area, including information on the boundaries of the R-2204 restricted airspace (bold red line) and the location of the DOE AMF-3 (white dot). Satellite imagery was “Built with ©Google Maps”, using their Application Programming Interface (API).
This paper describes the data set collected during POPEYE. Section 2 includes information on the systems and sensors used, sampling strategies employed, limitations related to weather and other factors, and a general overview of the data set as collected. Section 3 provides background on the data processing and quality control measures applied to the data sets collected during POPEYE and information on the different levels of data resulting from this effort. Section 4 provides information on the availability of the data, including a link for where the data sets can be downloaded. Finally, Sect. 5 provides a summary of the POPEYE campaign.
POPEYE featured a focused deployment of three observational tools during the second Northern Hemisphere YOPP SOP. These measurements were designed to complement measurements from the instruments integrated into the AMF-3, which run continuously and are therefore not described in detail in this paper. The reader is referred to comprehensive information available through the ARM web page (https://www.arm.gov/, last access: July 2019). The three data sets described here are those that were specifically deployed as a part of POPEYE, including the DataHawk2 small unmanned aircraft system (sUAS), two tethered balloon systems (TBSs) and extra radiosondes. All systems were deployed by DOE ARM operators, and the Datahawk2 and TBS systems have been deployed regularly at Oliktok Point over the past few years (de Boer et al., 2018). Here we provide information on these systems and the sensors operated on each.
2.1 Tethered balloon systems
TBSs mainly consisted of two different balloons, a 35 m3 helikite constructed by Allsopp Helikites and a 79 m3 aerostat constructed by SkyDoc™. The helikite is a balloon–kite hybrid that uses lighter-than-air principles to obtain its initial lift and a kite to achieve stability and dynamic lift, while the larger aerostat uses a skirt instead of a kite to achieve stability in flight. Lifts of both a helikite and an aerostat increase with increasing wind speed, so a relatively stable float altitude can be achieved even at elevated wind speeds. For POPEYE operations, both systems were operated using an electric winch integrated into a dedicated balloon trailer by Sandia National Laboratories. The payload and operating guidelines for the TBSs vary significantly with location and environmental conditions. Generally, the aerostat is operated for total payload weights of 8–27 kg, and the helikite is operated for total payload weights <27 kg. The helikite is not typically operated above 600 m a.g.l., because beyond this altitude the weight of the tether and payload exceed the maximum lifting force of the helikite. The aerostat can be operated at higher altitudes, but due to its larger size is not launched in sustained surface wind speeds >7 m s−1. The helikite is not launched in sustained surface wind speeds >11 m s−1. Operation of either platform is suspended, and the balloon is immediately retrieved if sustained wind speeds at the altitude of the balloon exceed 15 m s−1. In general, the strength of the wind is the main limiting factor governing the launch and final altitude of the TBSs, with rime accretion on the tether, instruments and balloon also contributing to altitude limitations.
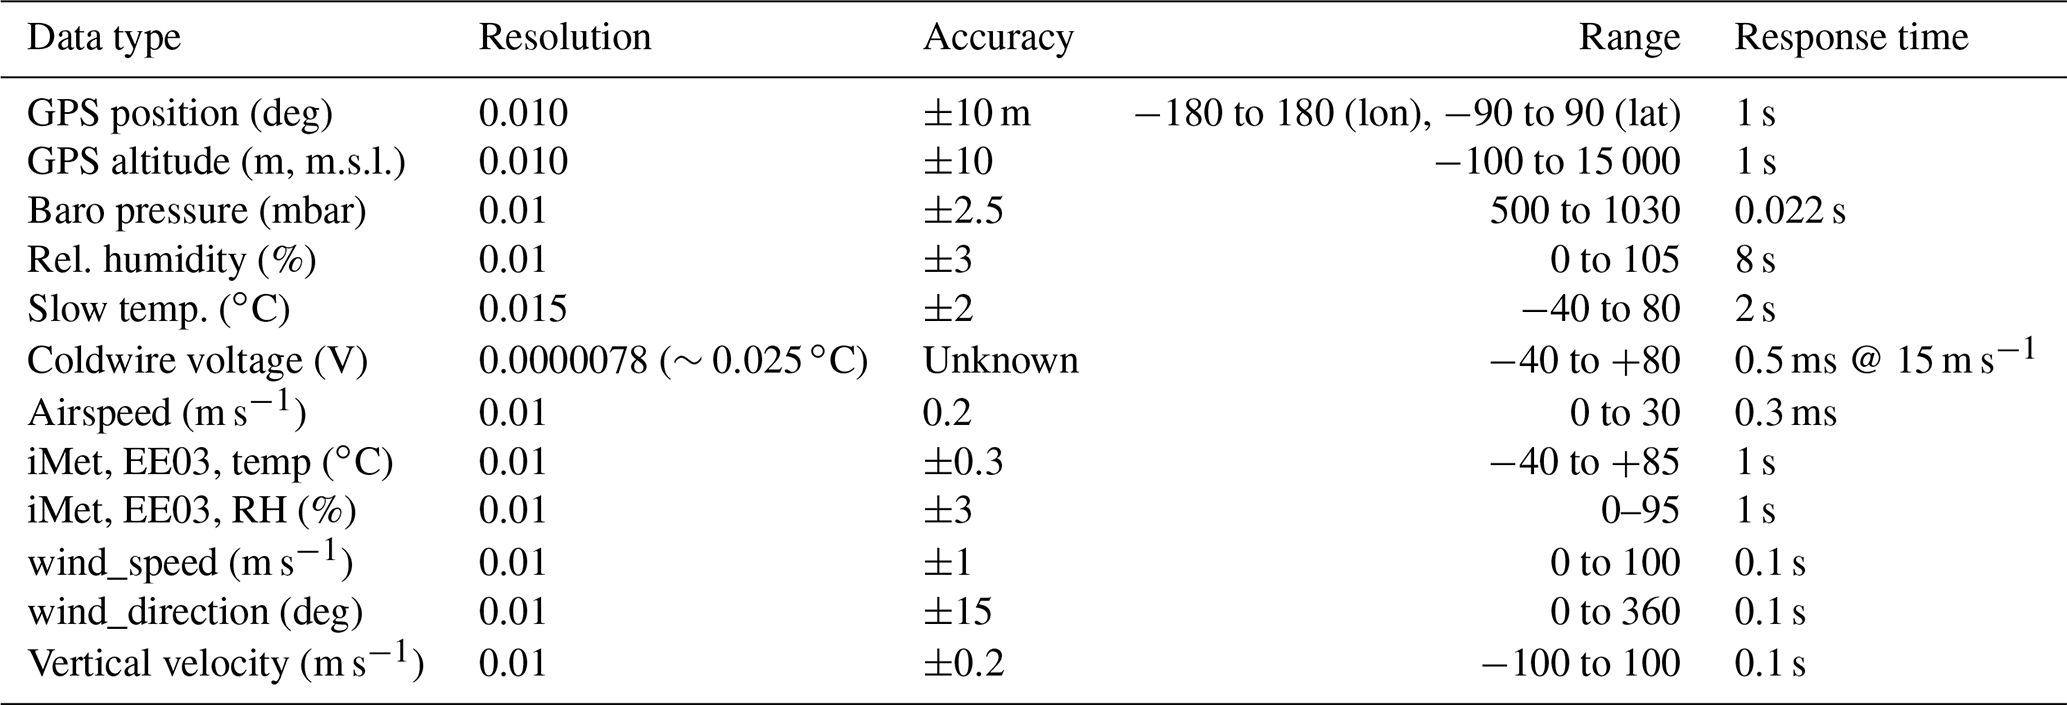
POPEYE TBS operations involved a variety of sensors and payloads. To measure the thermodynamic properties of the atmosphere, the TBS team operated multiple different sensor packages from interMet. This includes the interMet iMet-1-RSB radiosonde package as well as the interMet XQ2 sensor packages developed for use on UAS. Additionally, a Silixa XT distributed temperature sensing (DTS) system was flown. This system, which includes a long fiberoptic cable suspended along the tether, provides a high-resolution, continuous measurement of air temperature based on Raman scattering (Keller et al., 2011; de Jong et al., 2015). Using this system, the temperature is typically measured along the length of the optical fiber every 30 to 60 s at 0.65 cm spatial resolution. To provide information on the winds aloft, vaned cup anemometers from APRS World were operated at specified intervals along the tether. It is important to note that while wind speed from these sensors appears to be relatively accurate when compared with Doppler lidar measurements, a variety of factors, including the high-latitude location, make the directional measurement inaccurate. Information on the aerosol particle population was provided using a combination of two Handix Scientific Printed Optical Particle Spectrometers (POPS) and a TSI Condensation Particle Counter (CPC) 3007. The two POPS provide information on the aerosol size distribution for particles between 140 and 3000 nm, while the CPC provides information on the total number of particles between 10 and 1000 nm. Additionally, vibrating wire sensors from Anasphere and the University of Reading provide information on the amount of supercooled liquid water in cloud. These sensors were collectively referred to as “Supercooled Liquid Water Content” (SLWC) sensors. Further details on all of these sensors and the expected level of accuracy (where available) are included in Table 1.
Table 1Known performance characteristics for TBS instruments. The asterisk with wind direction denotes that these stated specifications have not been met in the Arctic environment at Oliktok Point.

The main role of the TBS in POPEYE was to collect detailed information on the vertical structure of the lower atmosphere over the AMF-3. This provides information on stratification and the temporal evolution of the lower atmospheric structure. Additionally, the TBS is unique in that it is able to fly in and above cloud for extended time periods, providing an opportunity to collect in situ measurements of thermodynamic, aerosol and cloud microphysical properties on low-altitude Arctic clouds. To accomplish this, the TBS was flown as high as weather conditions would permit, conducting repeated profiles with sensors distributed along the tether. While the exact placement of the sensors would change from flight to flight to adapt to the present conditions, in general the system was operated with a cluster of sensors, including a POPS, CPC, iMet and SLWC near the top of the tether under the balloon, a DTS fiber along the entire length of the tether, and subsequent iMet sensors and anemometers below the main package as most desirable based on the meteorological conditions. When flying the aerostat, a second POPS would also be flown to get more detailed measurements of evolution of the aerosol profile in time. A schematic outlining this strategy is included in Fig. 2.

Figure 2An illustration of the proposed TBS flight pattern for clear or cloudy conditions. The black lines are the proposed flight pattern, with time on the horizontal axis.
2.2 DataHawk2 sUAS
Another instrument platform used during POPEYE was the Datahawk2 sUAS, developed at the University of Colorado Boulder (description of the first version of the DataHawk can be found in Lawrence and Balsley, 2013). The DataHawk2 sUAS is a small (1.2 m wingspan, <1 kg take-off weight), robotic, pusher-prop aircraft designed to operate in a variety of conditions as a flexible and inexpensive measurement platform (see Table 2 for the specifications of the DataHawk2 UAS). The DataHawk2 has been used for a variety of purposes, including the study of turbulence (e.g., Kantha et al., 2017; Balsley et al., 2018) and high-latitude (e.g., de Boer et al., 2016, 2018) deployments. The relatively slow flight speed (14 m s−1, burst up to 22 m s−1) allows the platform to obtain measurements at high spatial resolution when compared to other aerial vehicles. Despite this relatively slow speed, the DataHawk2 has been operated in winds of up to 12 m s−1, making it a robust research platform for the harsh Arctic environment. DataHawk2 flights completed under POPEYE were generally autopilot guided except for during take-off and landing, when they were under the control of a local pilot through real-time telemetry. All flights were completed within radio communication range and within sight of the ground operators and were conducted within restricted airspace (R-2204; see Fig. 1, de Boer et al., 2016) controlled by the US DOE. This allowed operators to adjust the flight plan in real time to meet the needs of the science objectives and adapt to the changing environment. The ground controller and UAS communicate via 2.4 GHz radio with a range of approximately 10 km. Regulations limit DataHawk2 flight to within visual line of sight, meaning that it is not allowed to fly into clouds and must follow VFR weather minimums for operation (14 CFR 91.155). Additionally, winds hamper the operation of the DataHawk2, with DOE ARM guidelines restricting flight when winds top 7 m s−1.
Table 2Known performance characteristics for DataHawk2 instruments. Note that accuracy estimates of wind values are estimated based on recent intercomparison with surface-based instrumentation and apply to a higher-order derived product.
The DataHawk2 carries a variety of sensors to make measurements of the atmospheric and surface states. Custom-built instrumentation includes a fine-wire sensor employing two cold wires and one hot wire. These provide high-frequency (800 Hz) information on temperature and fine-scale turbulence. High bandwidth is enabled by small surface-area-to-volume ratios of very thin (5 µm diameter) wires. In addition, the DataHawk2 carries a custom configuration that includes integrated-circuit slow response sensors (Sensiron SHT-31) for measurement of temperature through a calibrated semiconductor and relative humidity using a capacitive sensor. For POPEYE specifically, the DataHawk2 also carried an E+E EE03 digital temperature and humidity (capacitive) sensor that was externally mounted on the airframe. For information on surface and sky temperatures, DataHawk2s are equipped with up- and downward-looking thermopile sensors (Semitec 10TP583T with custom electronics). These sensors undergo a calibration using targets of a known temperature. Finally, DataHawk2s have also carried the commercially available iMet1 radiosonde package, providing comparative information on position (GPS), temperature (bead thermistor), pressure (piezoresistive) and relative humidity (capacitive), though these sensors were not installed during POPEYE.
The main objective for the DataHawk2 was to obtain as many profiles as possible of the lower atmosphere during daytime hours. To do this, the aircraft was programmed to climb from the surface to the maximum obtainable altitude. This maximum altitude was constrained by the pilot's ability to maintain visual contact with the aircraft (1000 m a.g.l.) or by the cloud ceiling. Because the endurance of the aircraft is approximately 50 min in Arctic operating conditions, the aircraft could generally complete between one and two full profiles before needing to land to change batteries. The turnaround time between flights can be as short as 10 min, but is generally on the order of 15–30 min. Because of the substantial interest in the interplay between thermodynamic and dynamic properties near cloud base, during cloudy conditions, the operators were requested to hold altitude around the cloud base height, as determined from the observatory ceilometer and visual tracking of the aircraft, for 10–15 min to collect statistics of that environment before descending back towards the surface. While the cloud base height is variable, ideally the altitude held by the aircraft would be within 25 m of the mean cloudbase level. Figure 3 provides an illustration outlining this flight pattern.
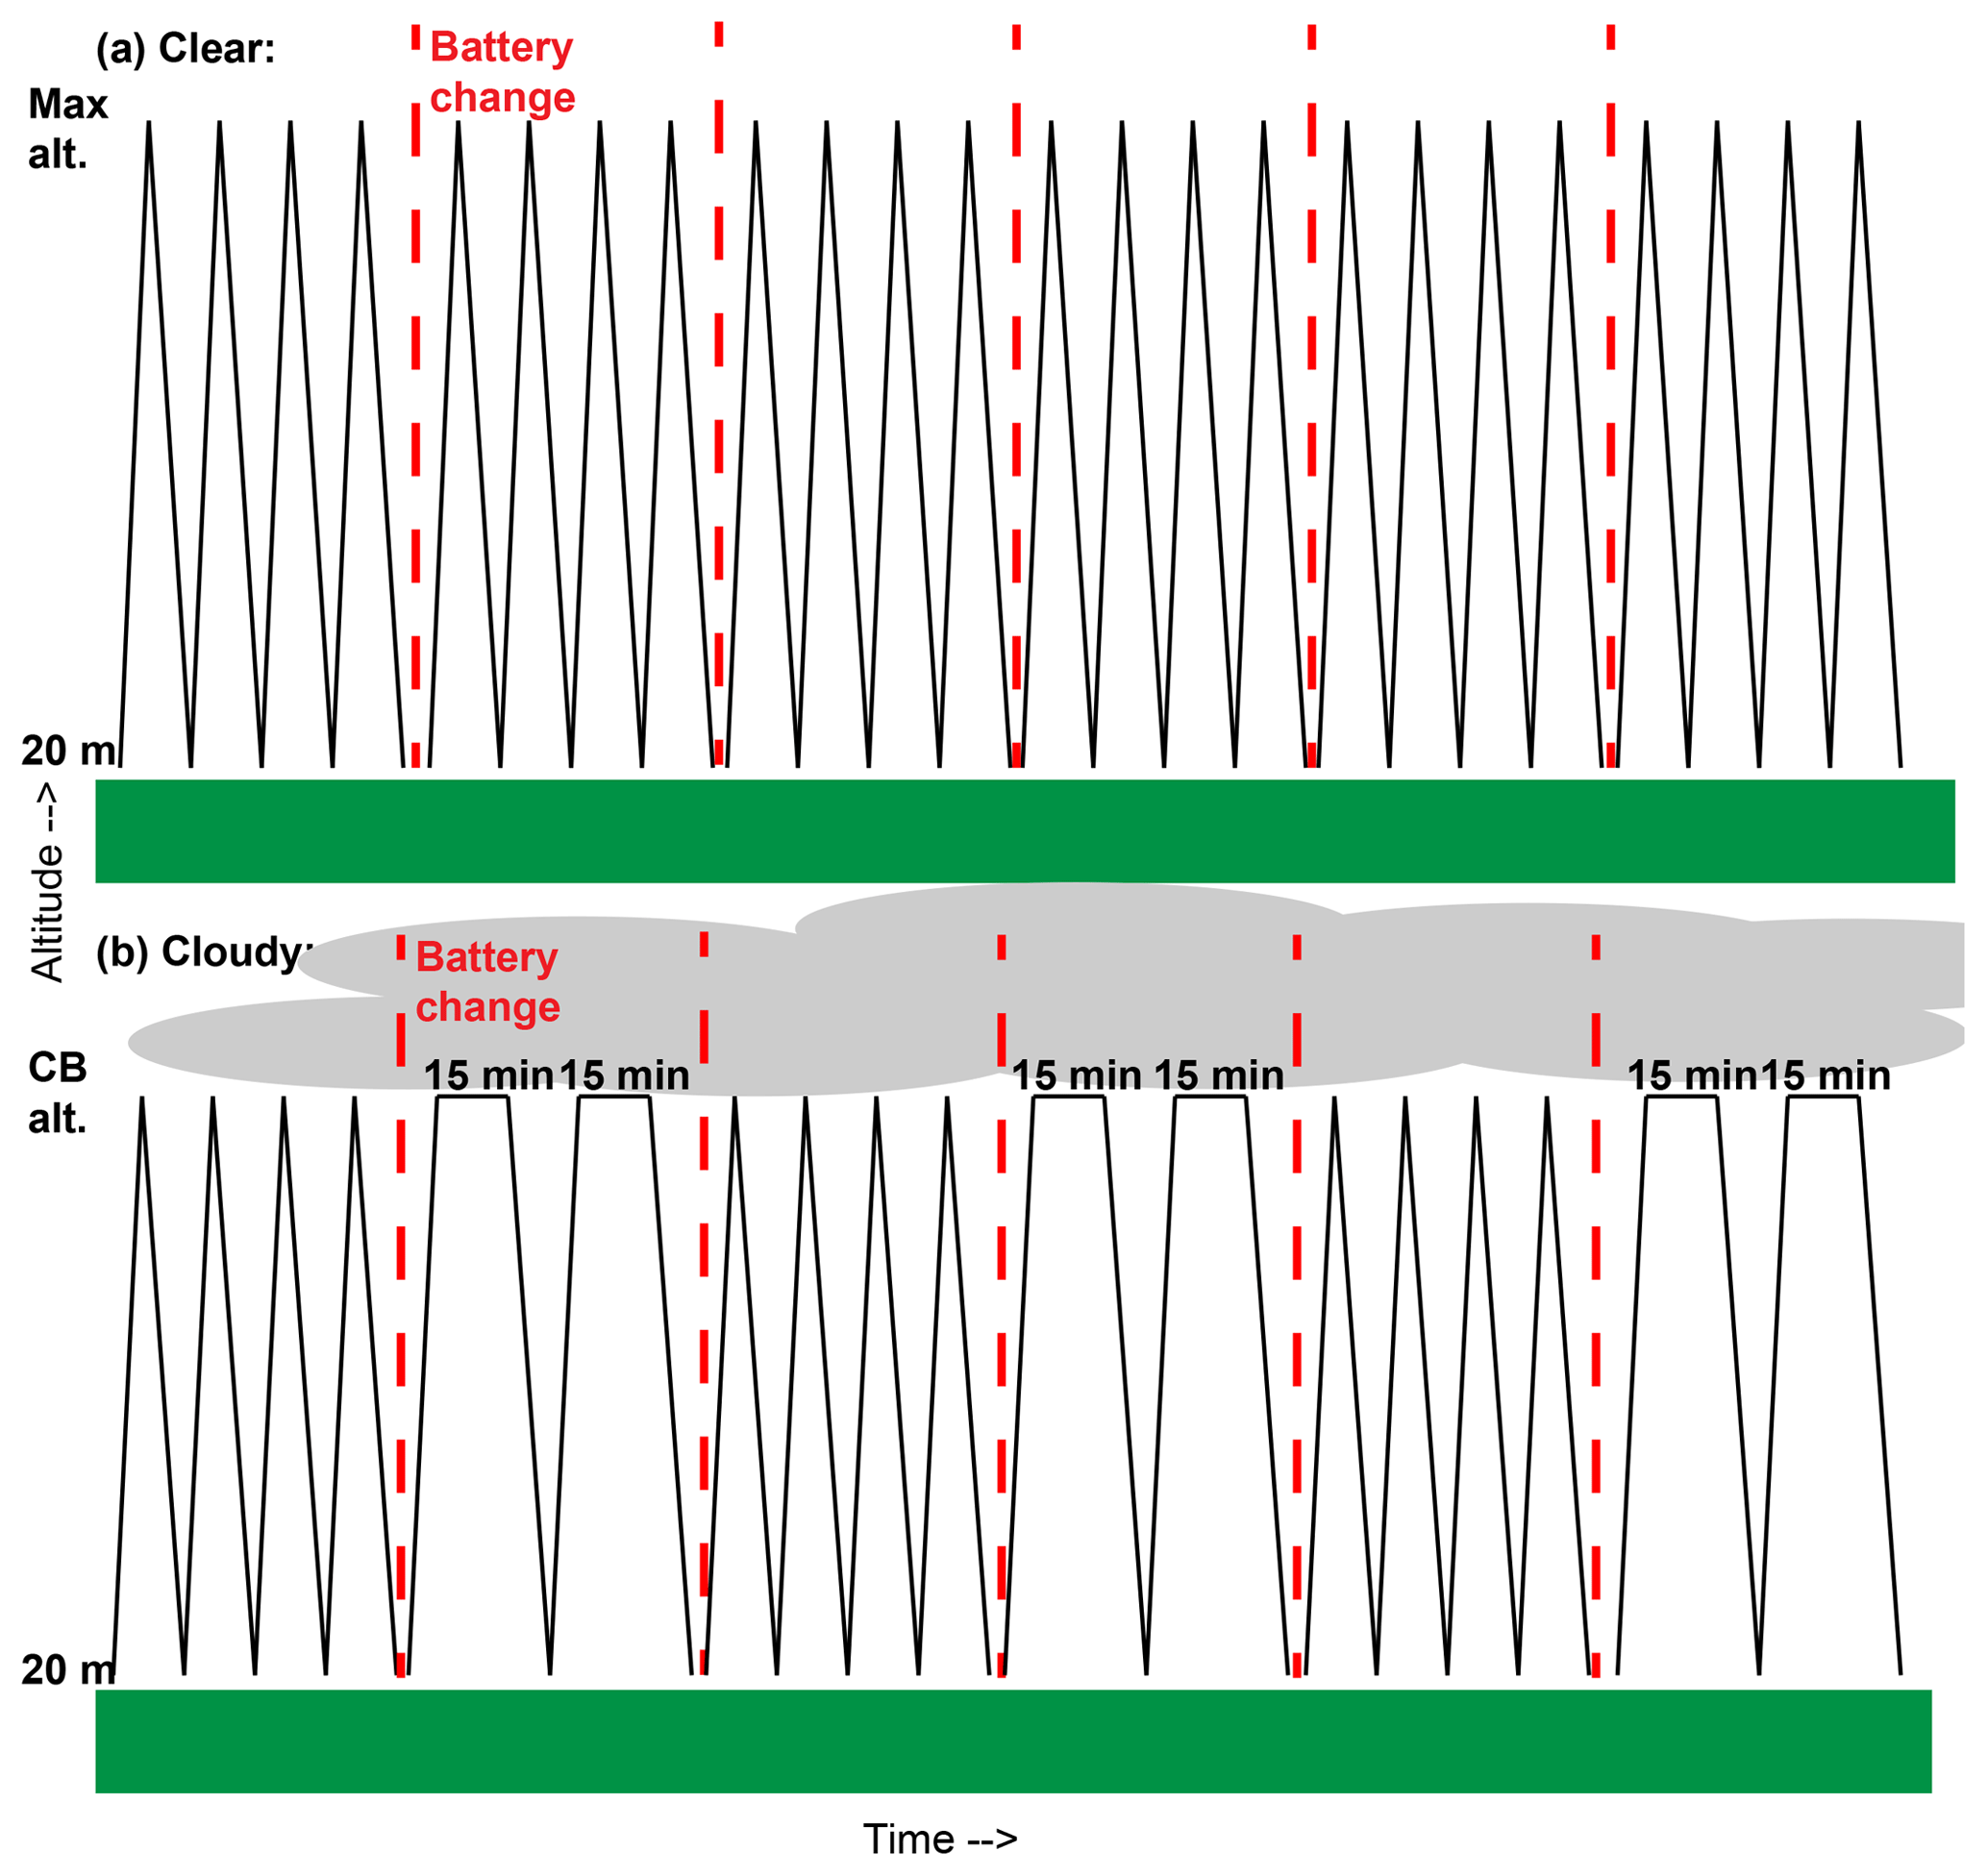
Figure 3An illustration of the proposed DataHawk2 flight pattern for clear (a) and cloudy (b) conditions. The black lines are the proposed flight pattern on a time axis, while the red lines indicate battery changes in between flights.
2.3 Radiosondes
The DOE ARM program launched Vaisala RS-92 radiosondes on a regular schedule under POPEYE. Due to concerns about operator safety and fatigue, the number of radiosondes launched was scheduled at three per day, with requested launch times of 05:30, 17:30 and 23:30 UTC (21:30, 09:30, 15:30 AKDT) to match the 06:00, 18:00 and 00:00 UTC synoptic times. Radiosonde launches were at times suspended due to dangerous conditions, including the presence of bears on site, or high winds (>13.5 m s−1 sustained and gusting >18 m s−1) which could result in damage to the sensor package if the balloon does not achieve enough vertical lift due to the strong cross wind. Radiosondes are lifted using 350 g balloons with an average ascent rate target of 5.5 m s−1. Radiosonde data from the campaign are available through the ARM data archive (Atmospheric Radiation Measurement program, 2013a).
2.4 Overview of meteorological conditions sampled
The presence of the ARM AMF-3, allows us to put the measurements from the radiosondes, TBS and UAS in a broader context. Figure 4 shows measurements from the AMF-3 surface meteorological instrumentation (Atmospheric Radiation Measurement Program, 2013b) over the 3-month POPEYE period. Synoptically, this period featured several driving features. For much of the campaign, there was a stationary area of high pressure positioned over the Gulf of Alaska, and Oliktok Point sat on the gradient between this area of high pressure and transient low pressure systems moving through the Chukchi and Beaufort seas. This generally resulted in west–northwesterly winds during this time period. Some of these cyclones passed closer to shore, thereby directly impacting the Oliktok Point area and creating precipitation events and shifting wind regimes (e.g., 7–10 July; 13 August; 16–17 August; 29–31 August). In late August there was a general shift in the pattern with high pressure beginning to set up over northern Alaska and eventually over the Beaufort Sea to the north. This resulted in a general shift towards easterly winds at the surface. The end of the POPEYE campaign featured a dominant area of high pressure over the area, resulting in weak easterly winds.
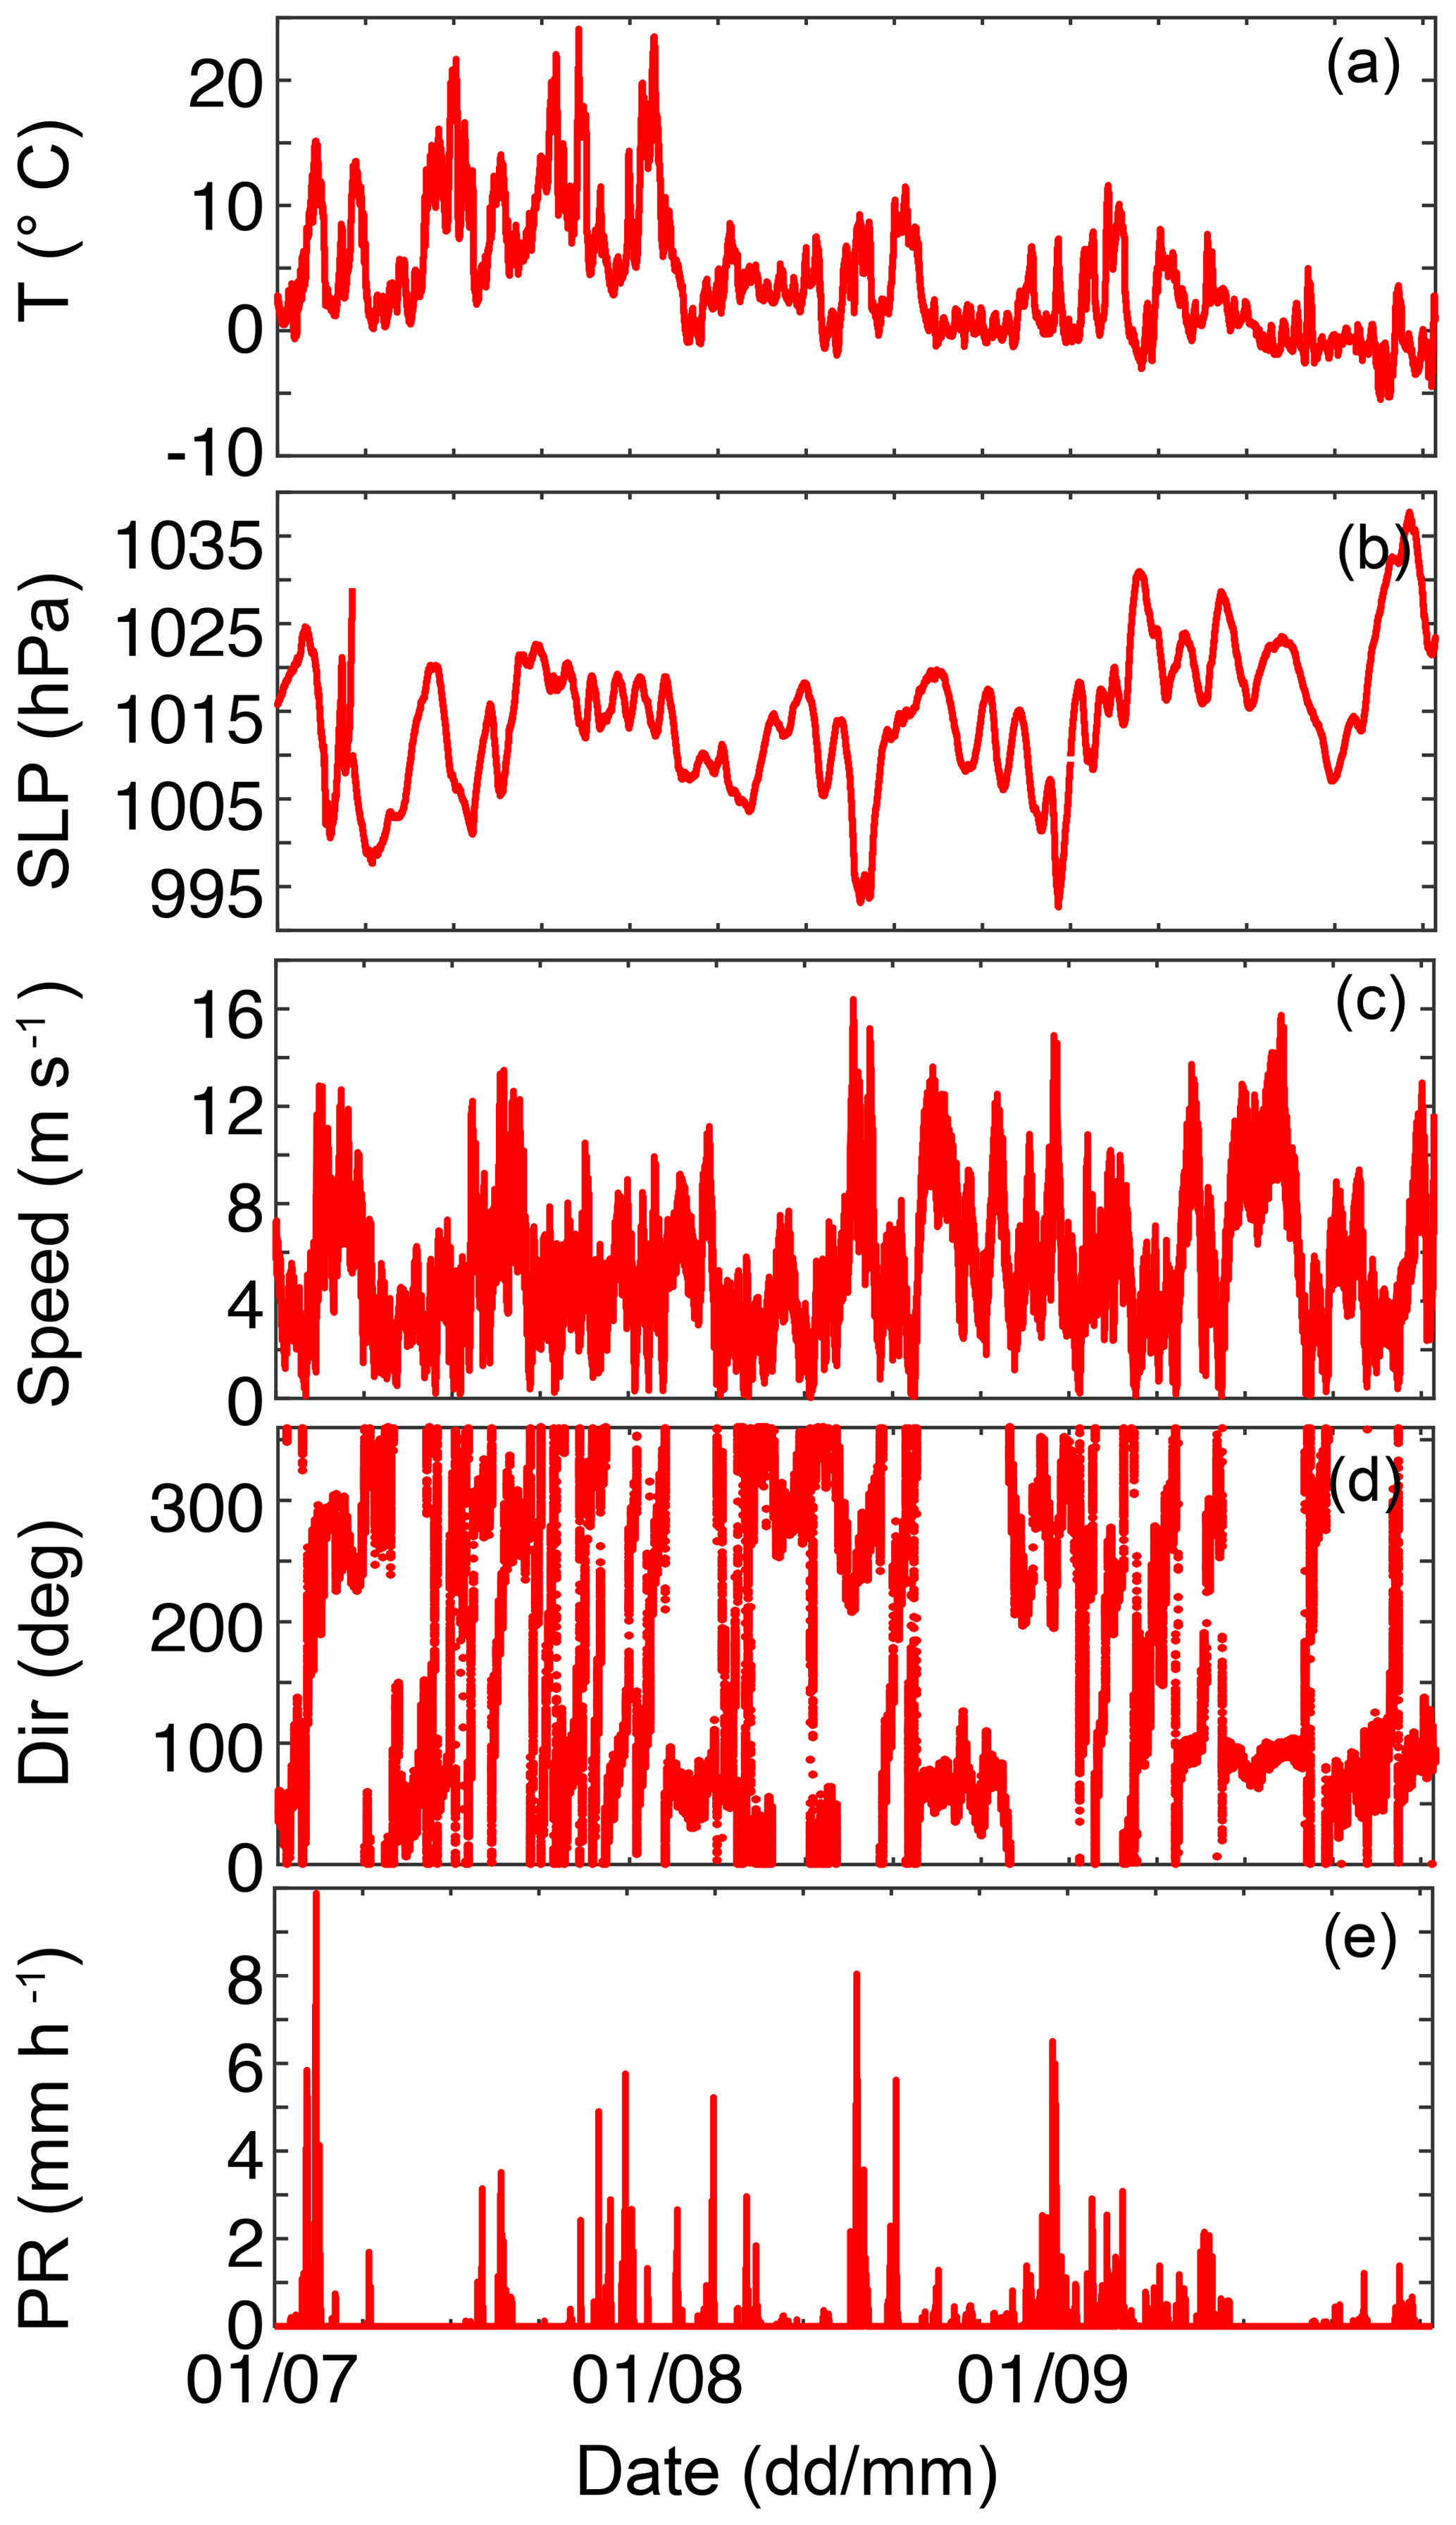
Figure 4Surface meteorological conditions (1 min resolution), as measured by instrumentation associated with the Oliktok Point AMF3 during POPEYE. From top to bottom are 2 m air temperature, sea level pressure, 10 m wind speed, 10 m wind direction and surface precipitation rate.
Considering the vertical structure of the lower atmosphere, the observations included measurements from a variety of stability regimes. While the presence of the sun in summer months generally results in more adiabatic lower atmospheric states than during other times of year in the Arctic, the data collected indicate sampling of both well-mixed and stratified conditions. This includes several stable boundary layer cases. Additionally, many of the completed flights were flown with some level of cloud cover in place. While the UAS did not sample through the cloud, the TBS was able to do so, providing insight into the thermodynamic and microphysical structure in and around these clouds. Based on ceilometer data from the AMF-3 (Atmospheric Radiation Measurement Program, 2013c), a cloud base was detected during 76 % of the campaign period. Of the times when clouds were detected, 73 % of the cloud bases occurred below 1 km altitude, 21 % occurred between 1 and 4 km altitude, and 6 % were found above 4 km.
In general, it is relevant and important to note that to some extent all of the POPEYE platforms were weather-limited in terms of their operations. Therefore, there is an element of selective sampling to consider when using the collected data sets. Most directly, the TBS and UAS systems were generally not operated during high winds. The UAS additionally had limitations related to visibility. The radiosondes were least impacted, though high winds did also prevent some launches.
2.5 Overview of completed flights and radiosonde launches
Over the 3-month period, there were limited data outages and challenges related to the issues discussed in the previous sections. Figure 5 illustrates the operations completed under POPEYE. The most significant challenge to continuous operations was the electromagnetic interference (EMI) caused by a US Air Force radar station at Oliktok Point, located approximately 150–300 m from the DataHawk2 flight areas. Modifications made to this radar during the POPEYE time window unfortunately resulted in the grounding of the DataHawk2s for their planned second and third deployments. Additionally, this EMI resulted in some resets of the TBS instrumentation, and errors in the TBS GPS readings. In addition, there were some challenges associated with the Arctic weather. Despite it being summer, winds were a challenge to both TBS and UAS flights at times, and also resulted in the cancellation of some radiosonde launches. Wildlife also posed challenges, as the site is visited by both brown and polar bears during the summer months. The local presence of these large creatures generally required that operators ceased outdoor operations, impacting all three measurement platforms. Despite these challenges, the campaign totaled 238 radiosondes launched, 52 TBS flights (134.3 flight hours), and 59 DataHawk2 flights (64.6 flight hours). Figure 6 illustrates the completed flights in time–height space.
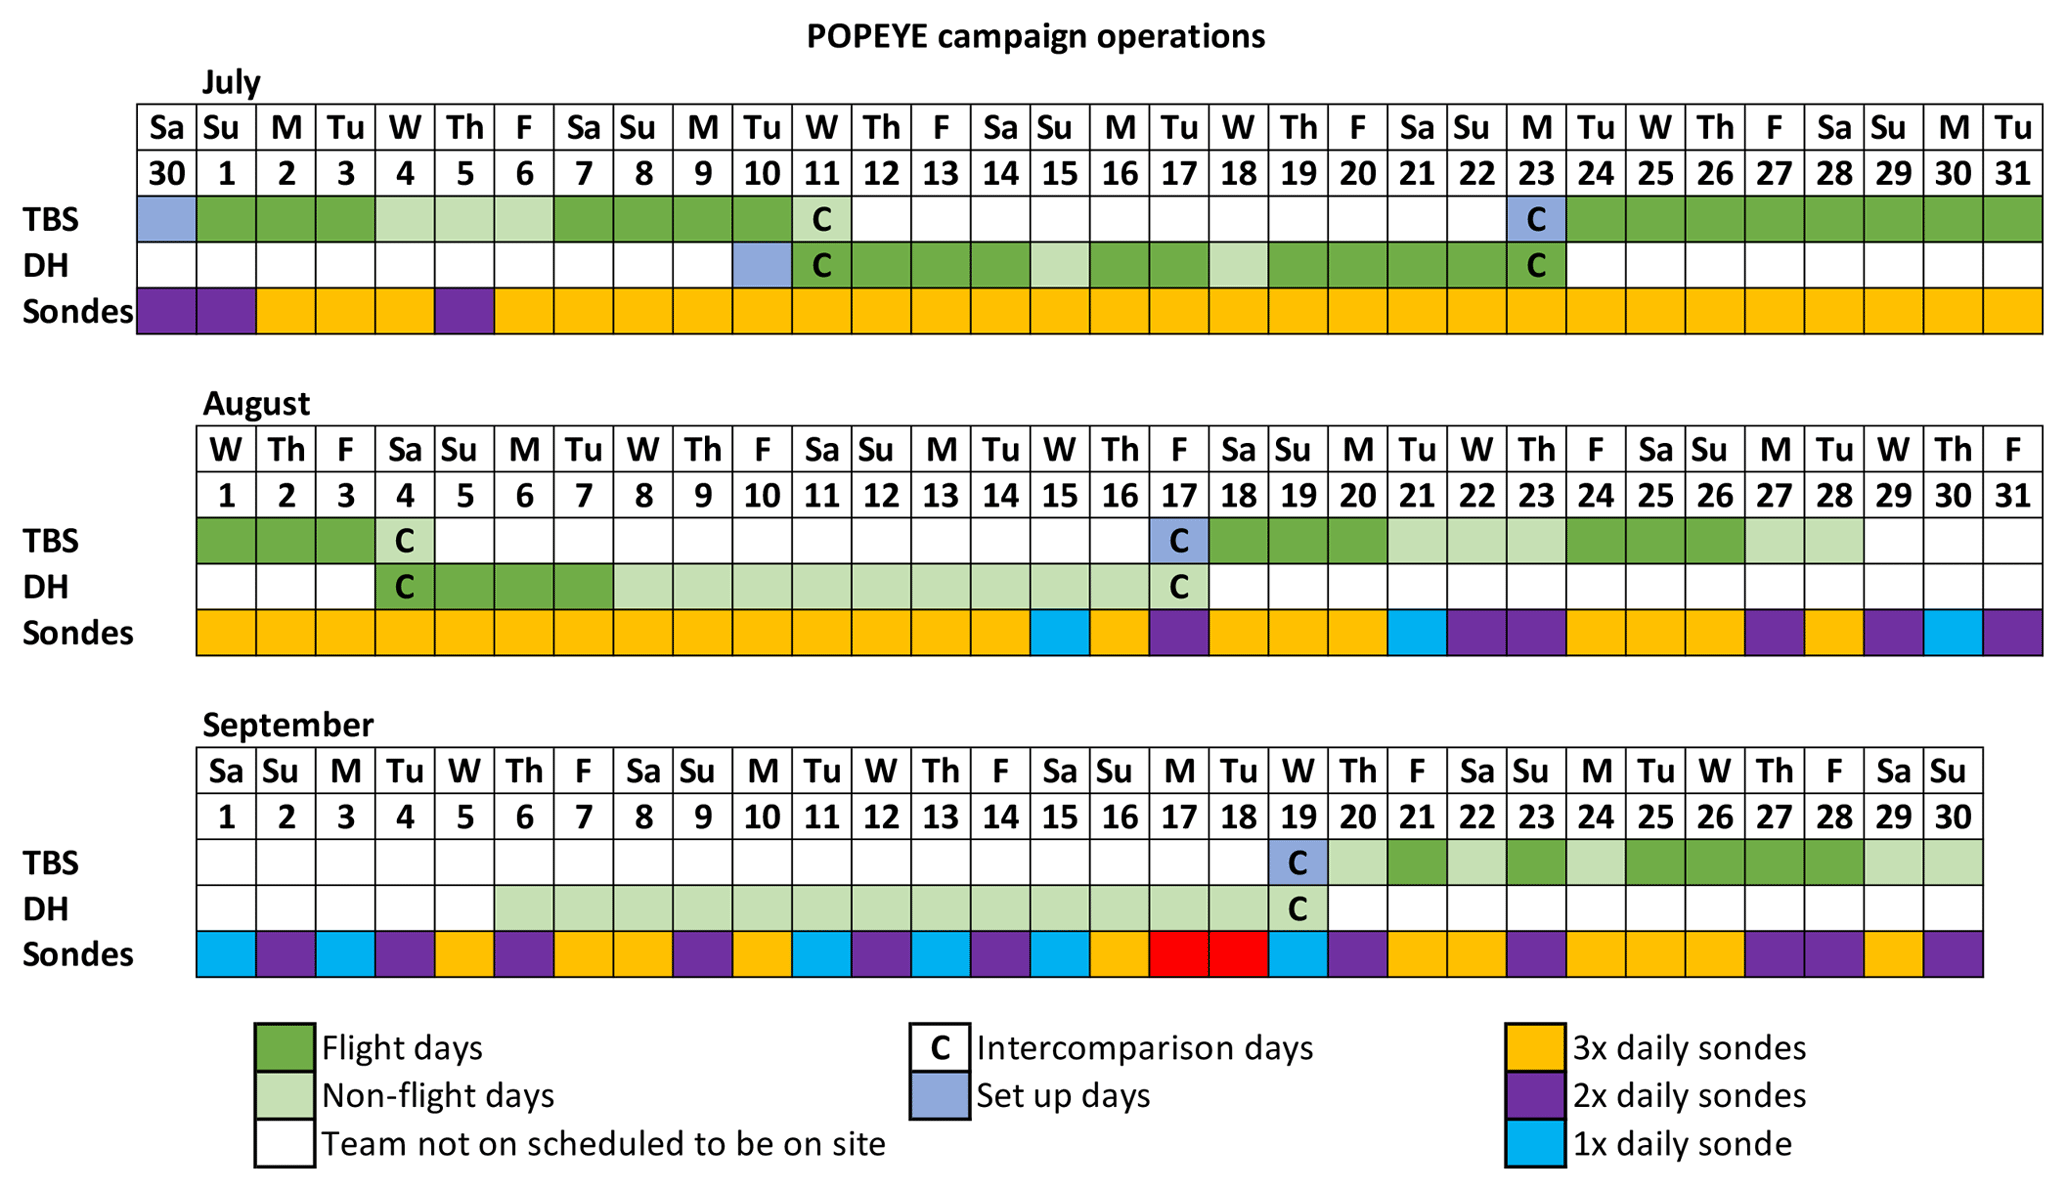
Figure 5A graphical representation of actual UAS, TBS and radiosonde operations during POPEYE.
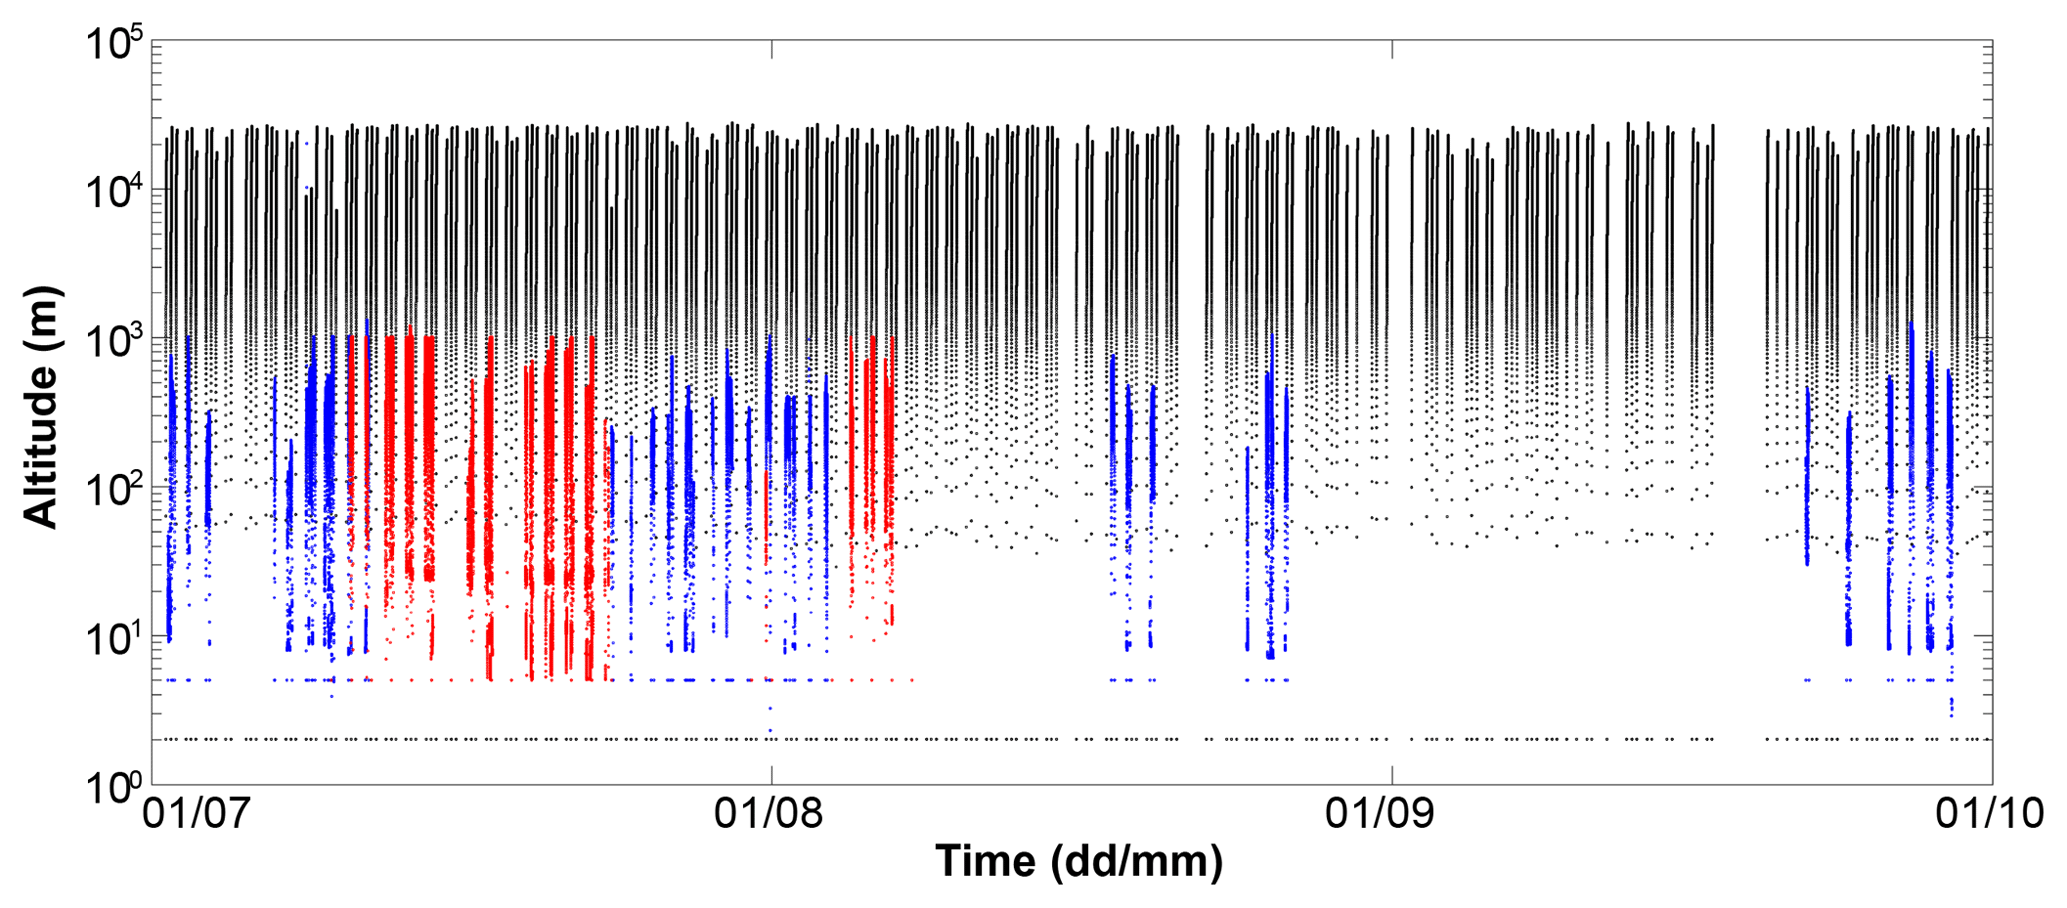
Figure 6A time–height cross section illustrating all of the POPEYE radiosonde launches (black dots), DataHawk2 flights (red dots) and tethered balloon flights (blue dots).
A map indicating the horizontal extent of the TBS flights is shown in Fig. 7 (top). The horizontal distances covered are governed by the positioning of the winch trailer for the system, the wind speed, and the amount of tether extended. The points drifting over the ocean surface are the result of erroneous GPS data, likely linked to EMI from the USAF radar system. The distribution balloon altitudes (the highest sampling height for any given TBS operation) is shown in Fig. 7 (bottom) and demonstrates that the balloon typically sampled the lowest 1 km of the atmosphere. Because the balloon can hover at a given altitude for extended time periods, there are multiple peaks in the altitude distribution, notably at around 150, 300, 700 and 1000 m. These altitudes correspond to altitudes chosen for extended sampling during the campaign. Also, a comparison of TBS altitudes with ceilometer-based cloud base measurements indicates that the TBS was operating at or above the lowest detected cloud base altitude 32 % of the time.
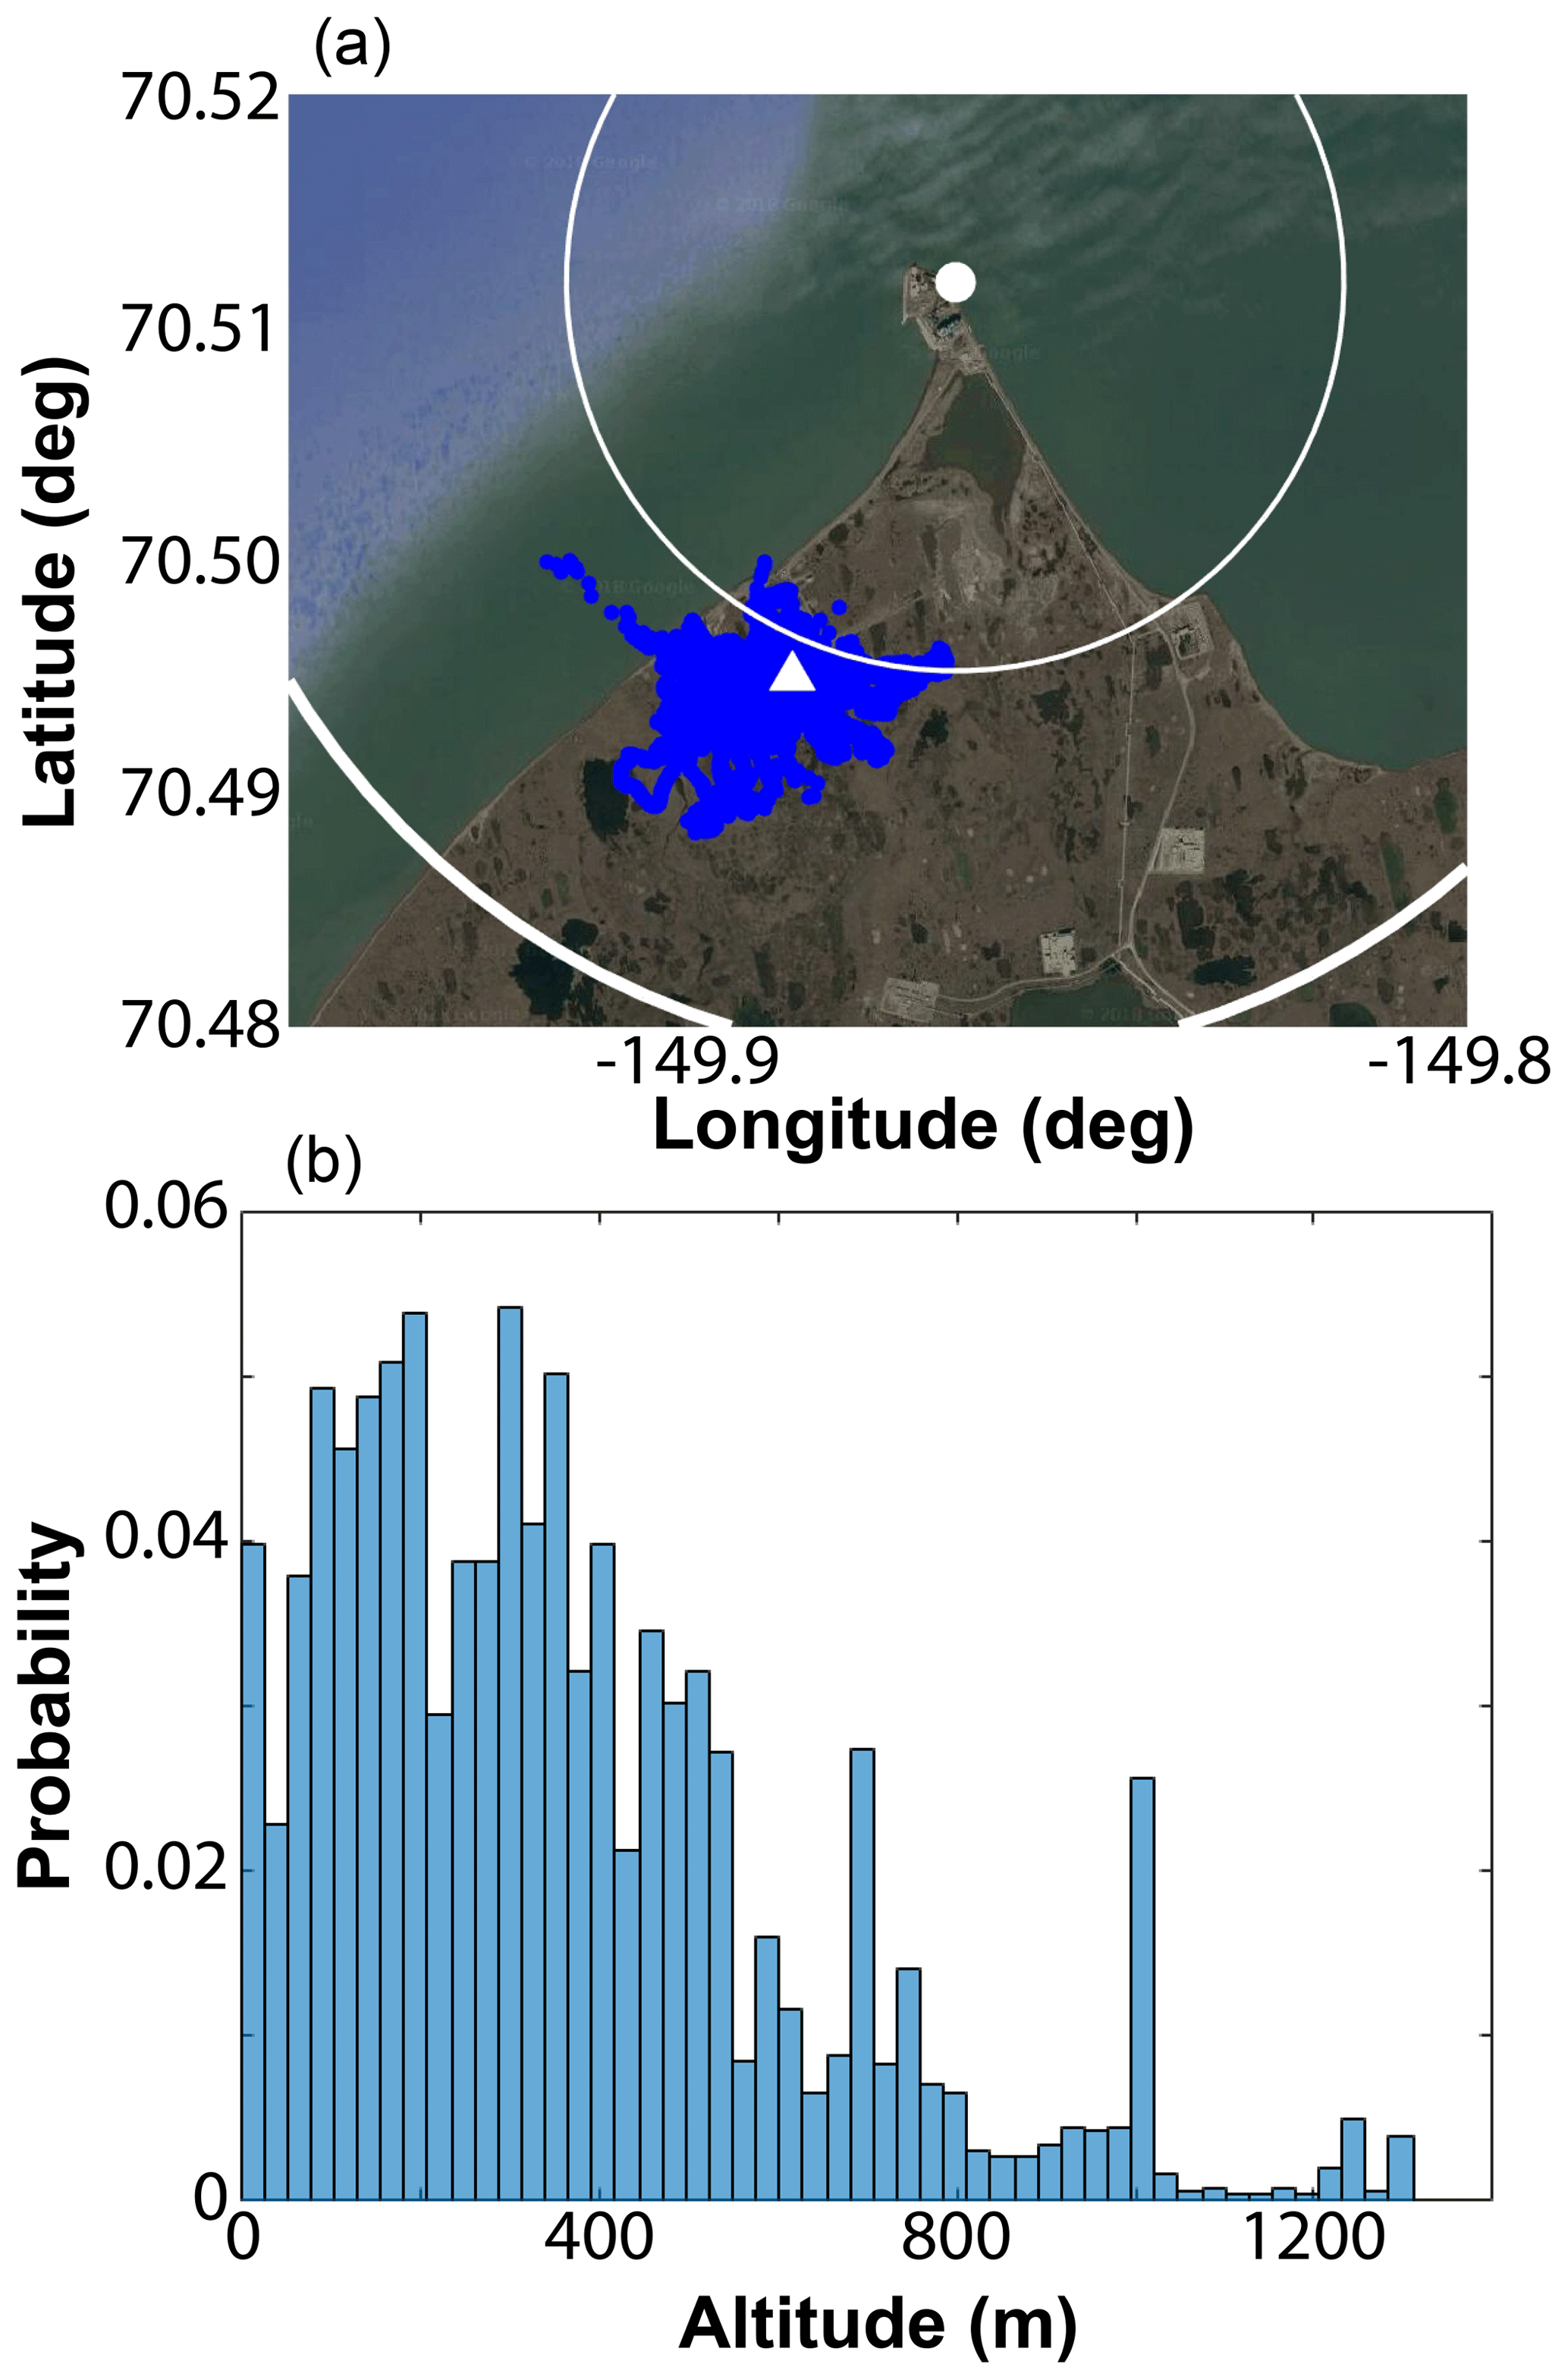
Figure 7A spatial map of the POPEYE tethered balloon flight locations (a, blue dots), including white range rings at 1 and 2 nautical miles demonstrating the extent of R-2204 and the location of the AMF-3 (white triangle). Panel (b) is a relative frequency distribution of the altitudes sampled by the TBS during POPEYE. Satellite imagery was “Built with ©Google Maps”, using their Application Programming Interface (API).
A map of the horizontal extent of the DataHawk2 flights is shown in Fig. 8 (top). All flights were conducted in close proximity to the AMF-3 instrumentation, within the restricted airspace outlined under R-2204. The flight patterns consisted of profiling of the lowest 1 km of the atmosphere, as indicated by the probability distribution of altitudes sampled in the lower panel. This distribution is binned by 20 m increments and based on this it becomes clear that most common altitude was between 20 and 40 m above ground level (a.g.l.). From this altitude, the frequency of visiting higher altitudes generally decreases slowly, resulting from limitations imparted by visibility and winds.
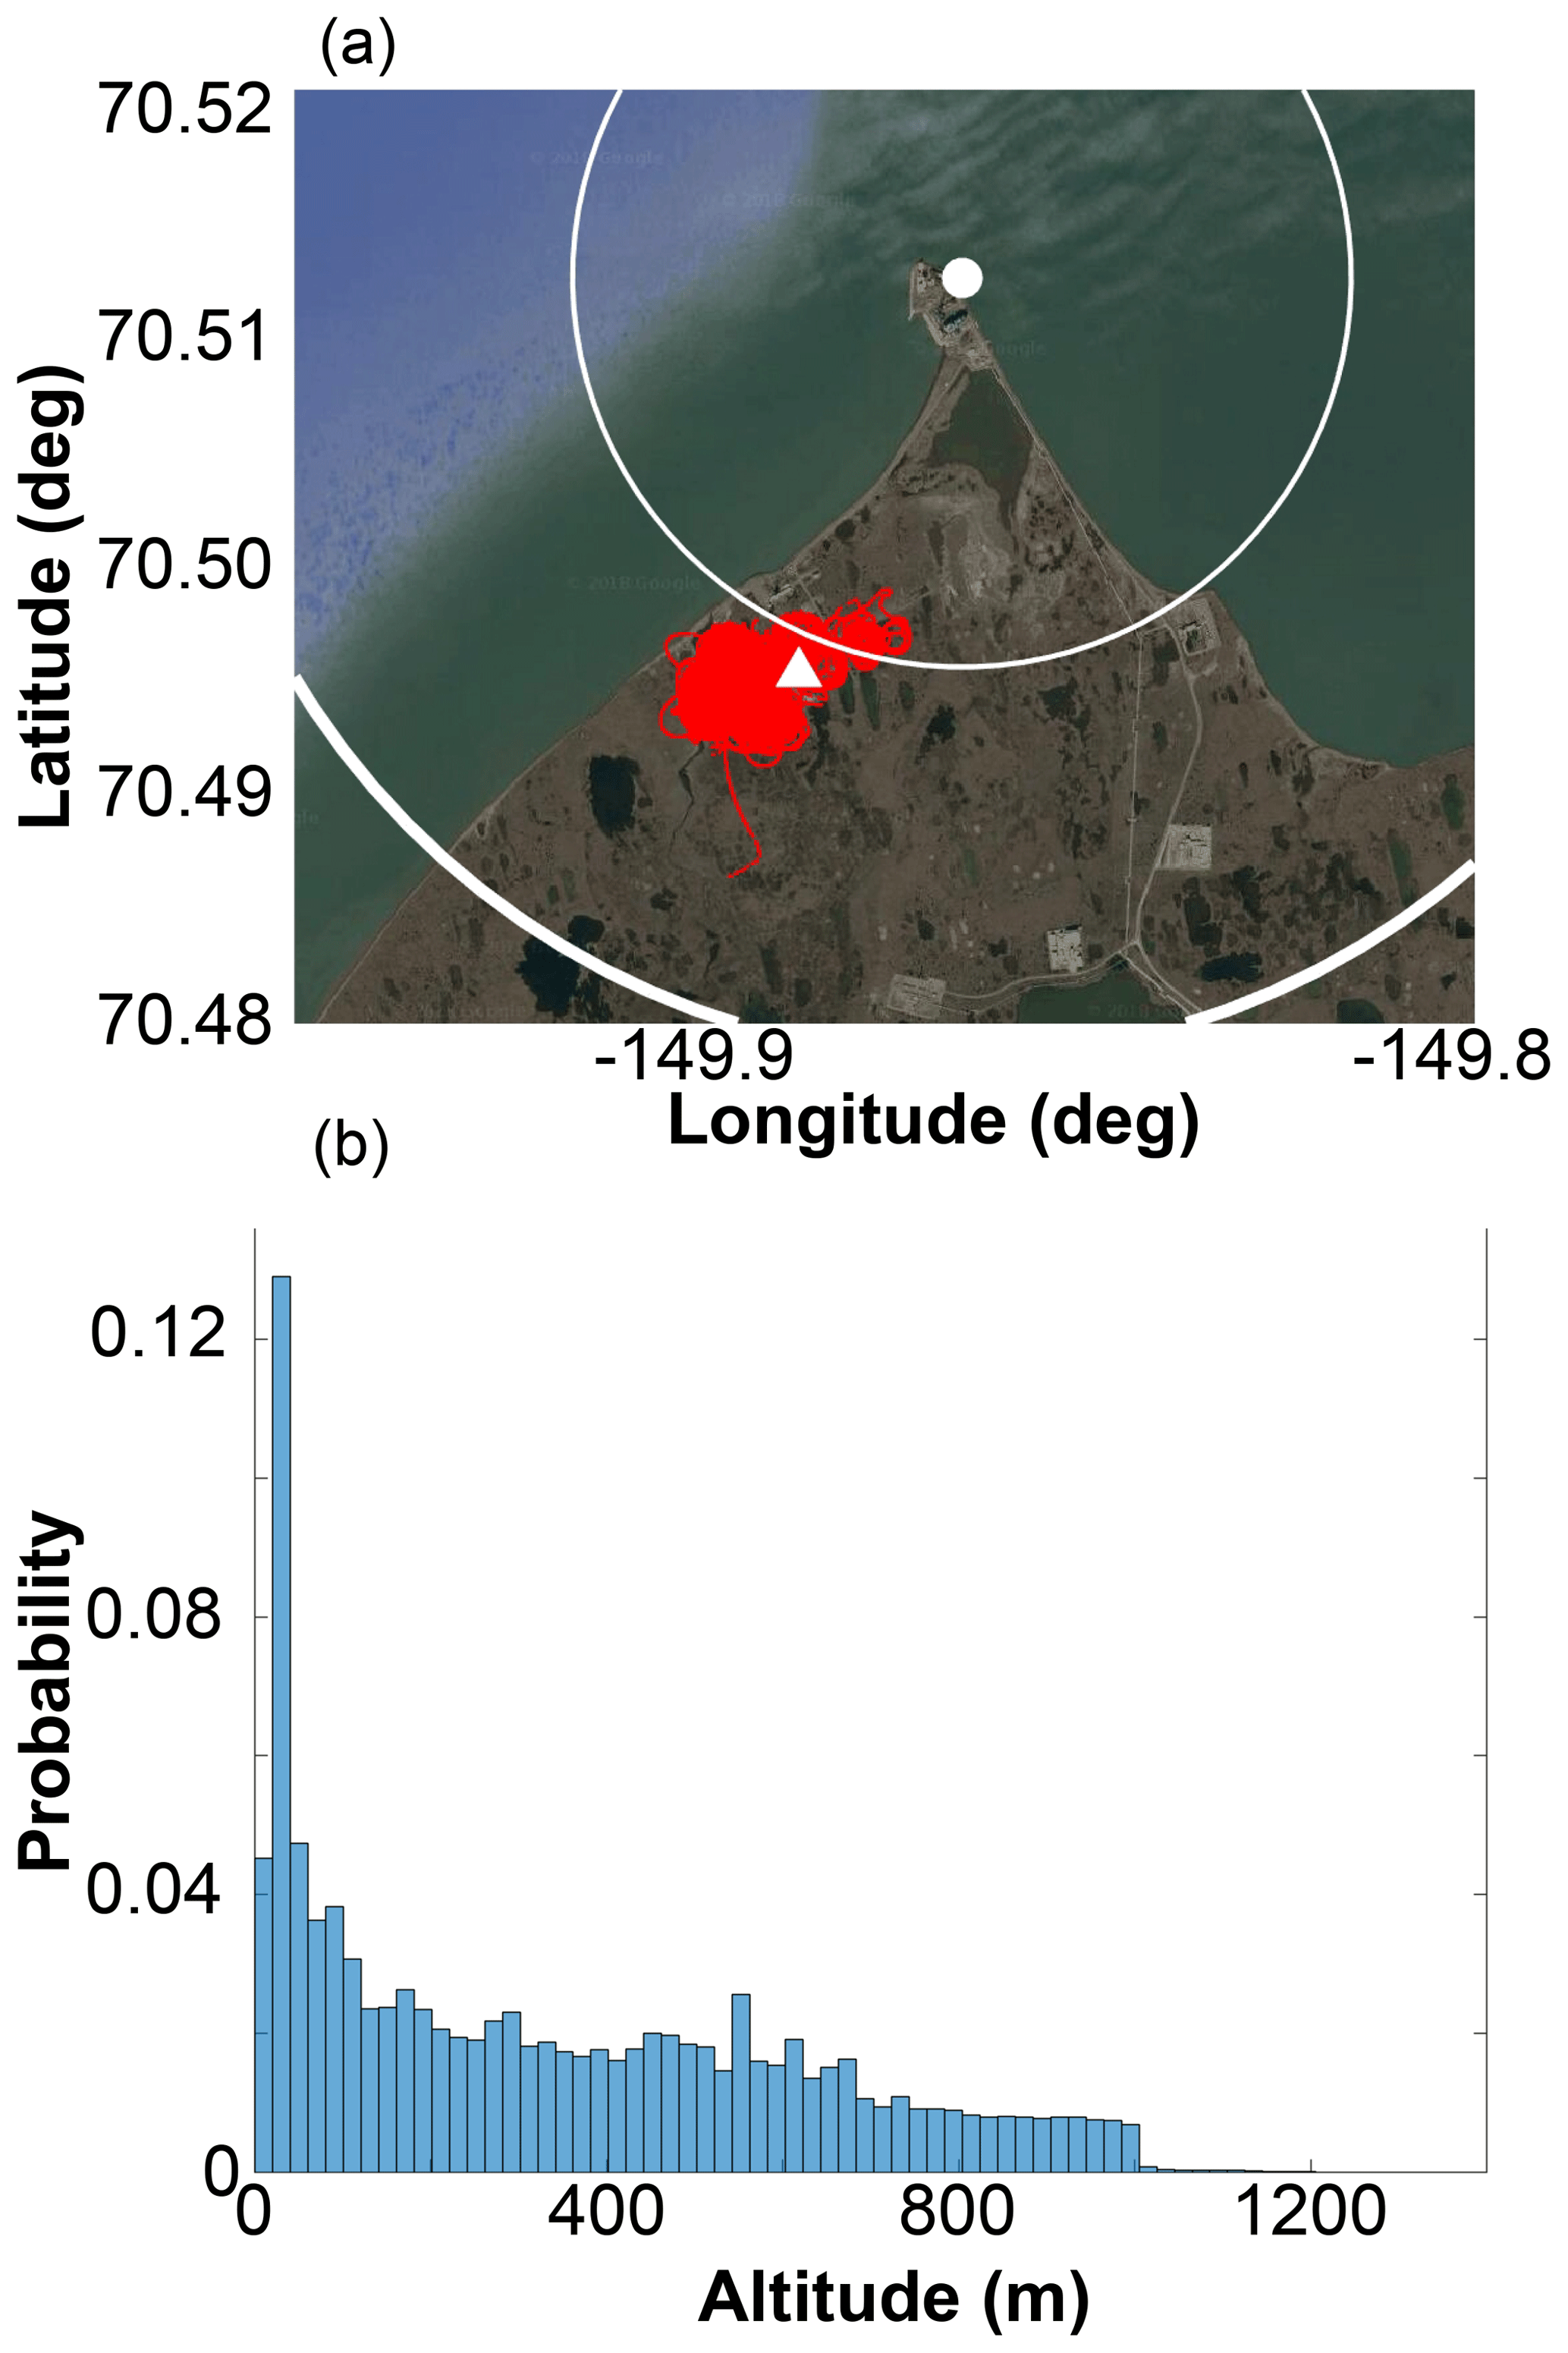
Figure 8A spatial map of the POPEYE DataHawk2 flight locations (a, red dots), including white range rings at 1 and 2 nautical miles demonstrating the extent of R-2204 and the location of the AMF-3 (white triangle). Panel (b) is a relative frequency distribution of the altitudes sampled by the DataHawks during POPEYE. Satellite imagery was “Built with ©Google Maps”, using their Application Programming Interface (API).
Figure 9 provides insight into the statistics of the radiosonde measurements. The right panel indicates the distance away from Oliktok Point that radiosondes traveled over the length of the POPEYE campaign. Within the troposphere (<10 km altitude), radiosondes generally remained within 20 km of the Oliktok Point facility. However, a few balloons traveled as far as 100 km away once in the stratosphere, with most staying within 50 km of the site all the way to the top of the profile. The temperature–height histogram (Fig. 9b) reveals a general cooling of the air with height through the depth of the troposphere, with most profiles cooling from temperatures of 0–10 ∘C near the surface to around −50 ∘C at the tropopause. Additionally, there are indicators of frequent low-level inversions in the lowest 1–2 km. There appear to be two modes of temperatures observed in the stratosphere, with a dominant mode between −40 and −50 ∘C, and a secondary mode at around −55 ∘C. Finally, a two-dimensional histogram of the winds with height (Fig. 6, middle panel) illustrates a broad range of measurements near the surface (0–20 m s−1), with winds generally increasing with height through the troposphere to values ranging between 5 and 50 m s−1. Winds in the stratosphere again decrease to less than 10 m s−1. Figure 10 illustrates time–height cross sections of radiosonde measurements of temperature, relative humidity and wind speed for the duration of POPEYE.
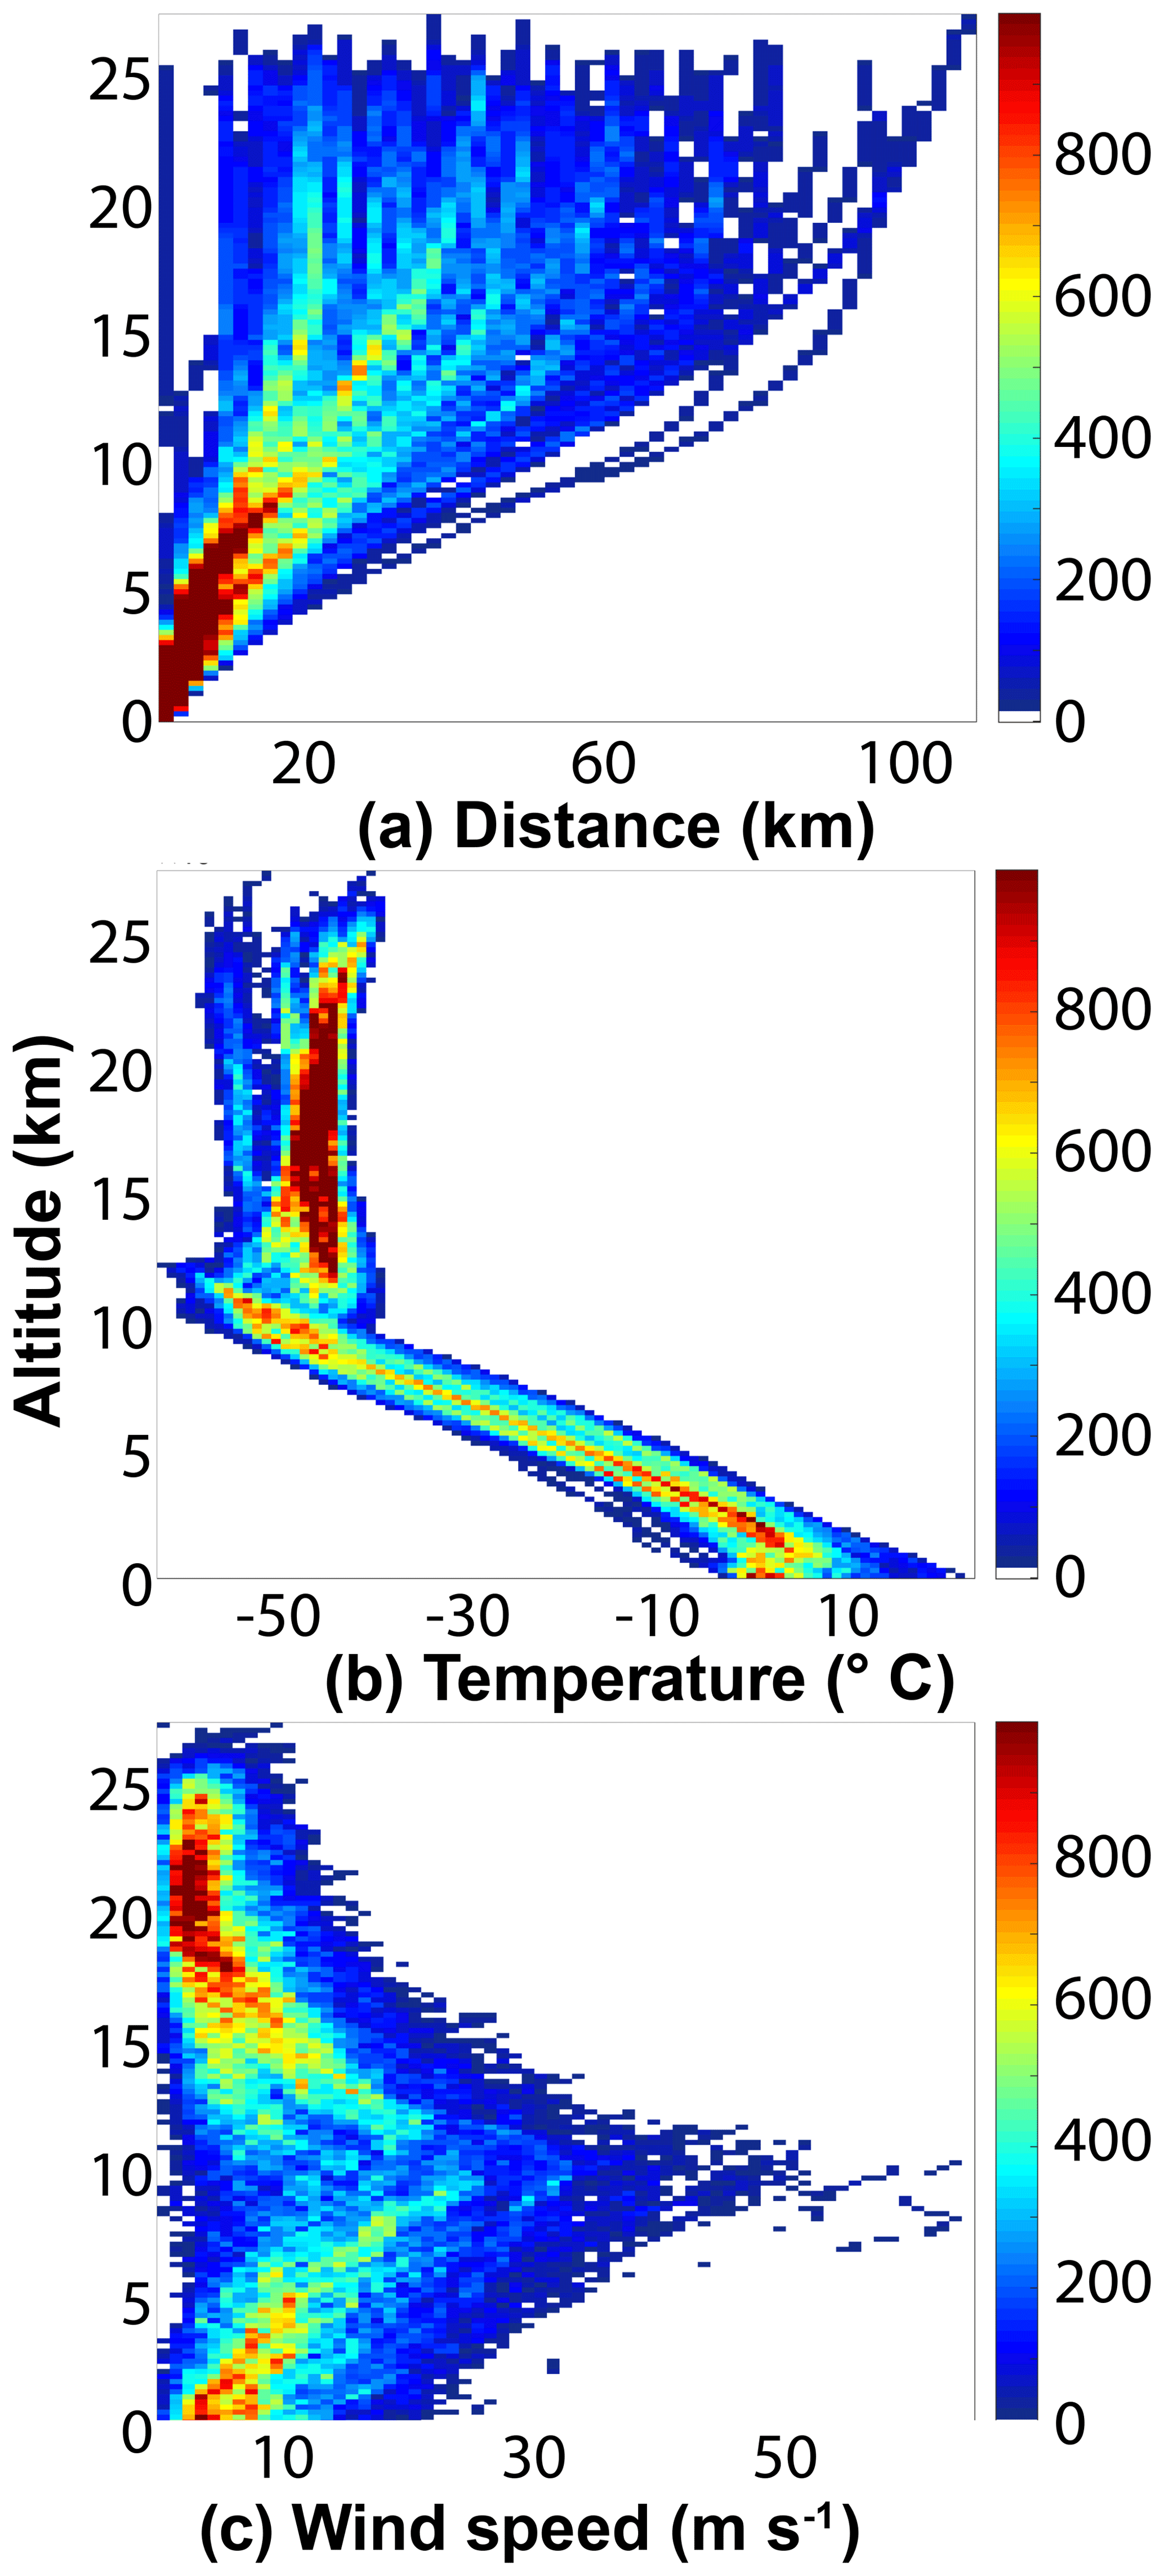
Figure 9Two-dimensional histograms of radiosonde temperature (a), wind speed (b), and distance from Oliktok Point (c), with altitude during POPEYE.
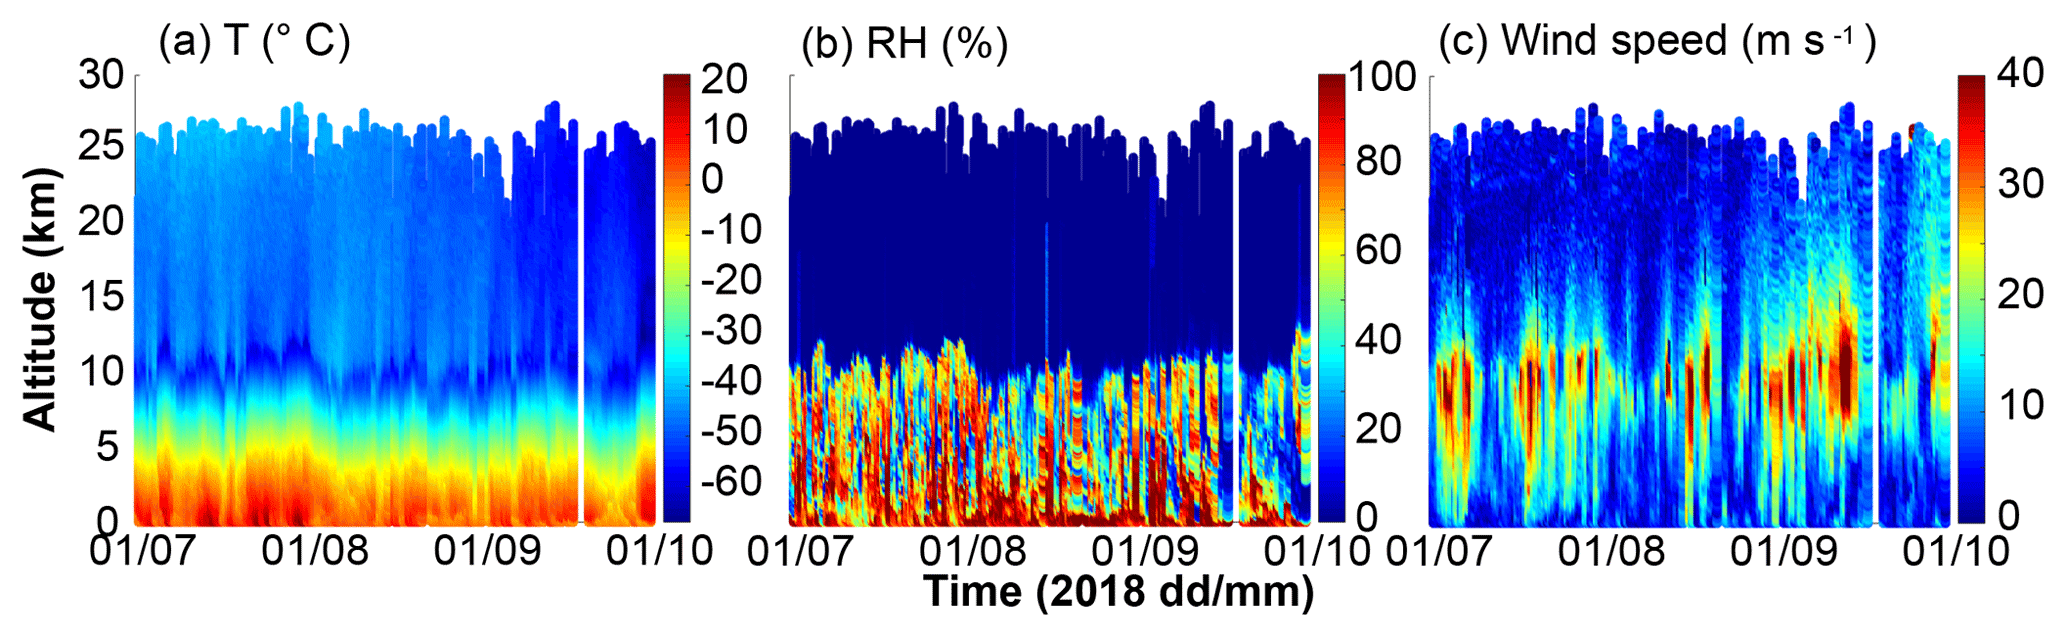
Figure 10POPEYE radiosonde data, including time–height cross sections of (a–c) temperature, relative humidity and wind speed as observed during the second YOPP Special Observing Period.
Finally, Fig. 11 provides an initial glimpse into measurements from the POPS sensor on the TBS. The top panel illustrates the cumulative number concentrations sampled, showing that the range of particle numbers measured tended to decrease with height, and that higher concentrations were typically sampled in the lowest parts of the atmosphere. This is likely a result of the numerous near-surface sources associated with oil production facilities in the vicinity of Oliktok Point. Additionally, there is some level of contamination very close to the surface from the diesel generator used to run the TBS winch system. The extent of this contamination is a function of wind speed and atmospheric mixing state and cannot be generally quantified. The second panel shows a similar two-dimensional histogram for particle sizes. This figure illustrates that most particles sampled were around 200 nm and that the balloon typically operated below 500 m. Again. The spread of diameters measured appears to increase with decreasing height. For both of the top panels it is important to keep in mind that white areas do not necessarily mean that zero samples were observed in that bin, as the lowest colorbar bin has some finite edges. The bottom panel shows the relationship between particle size and concentration as a function of altitude as observed over the campaign. There are numerous near-surface (dark blue) points where high concentrations of smaller particles were observed. These observations are complemented by measurements from the CPC for the majority of campaign flights (not shown).
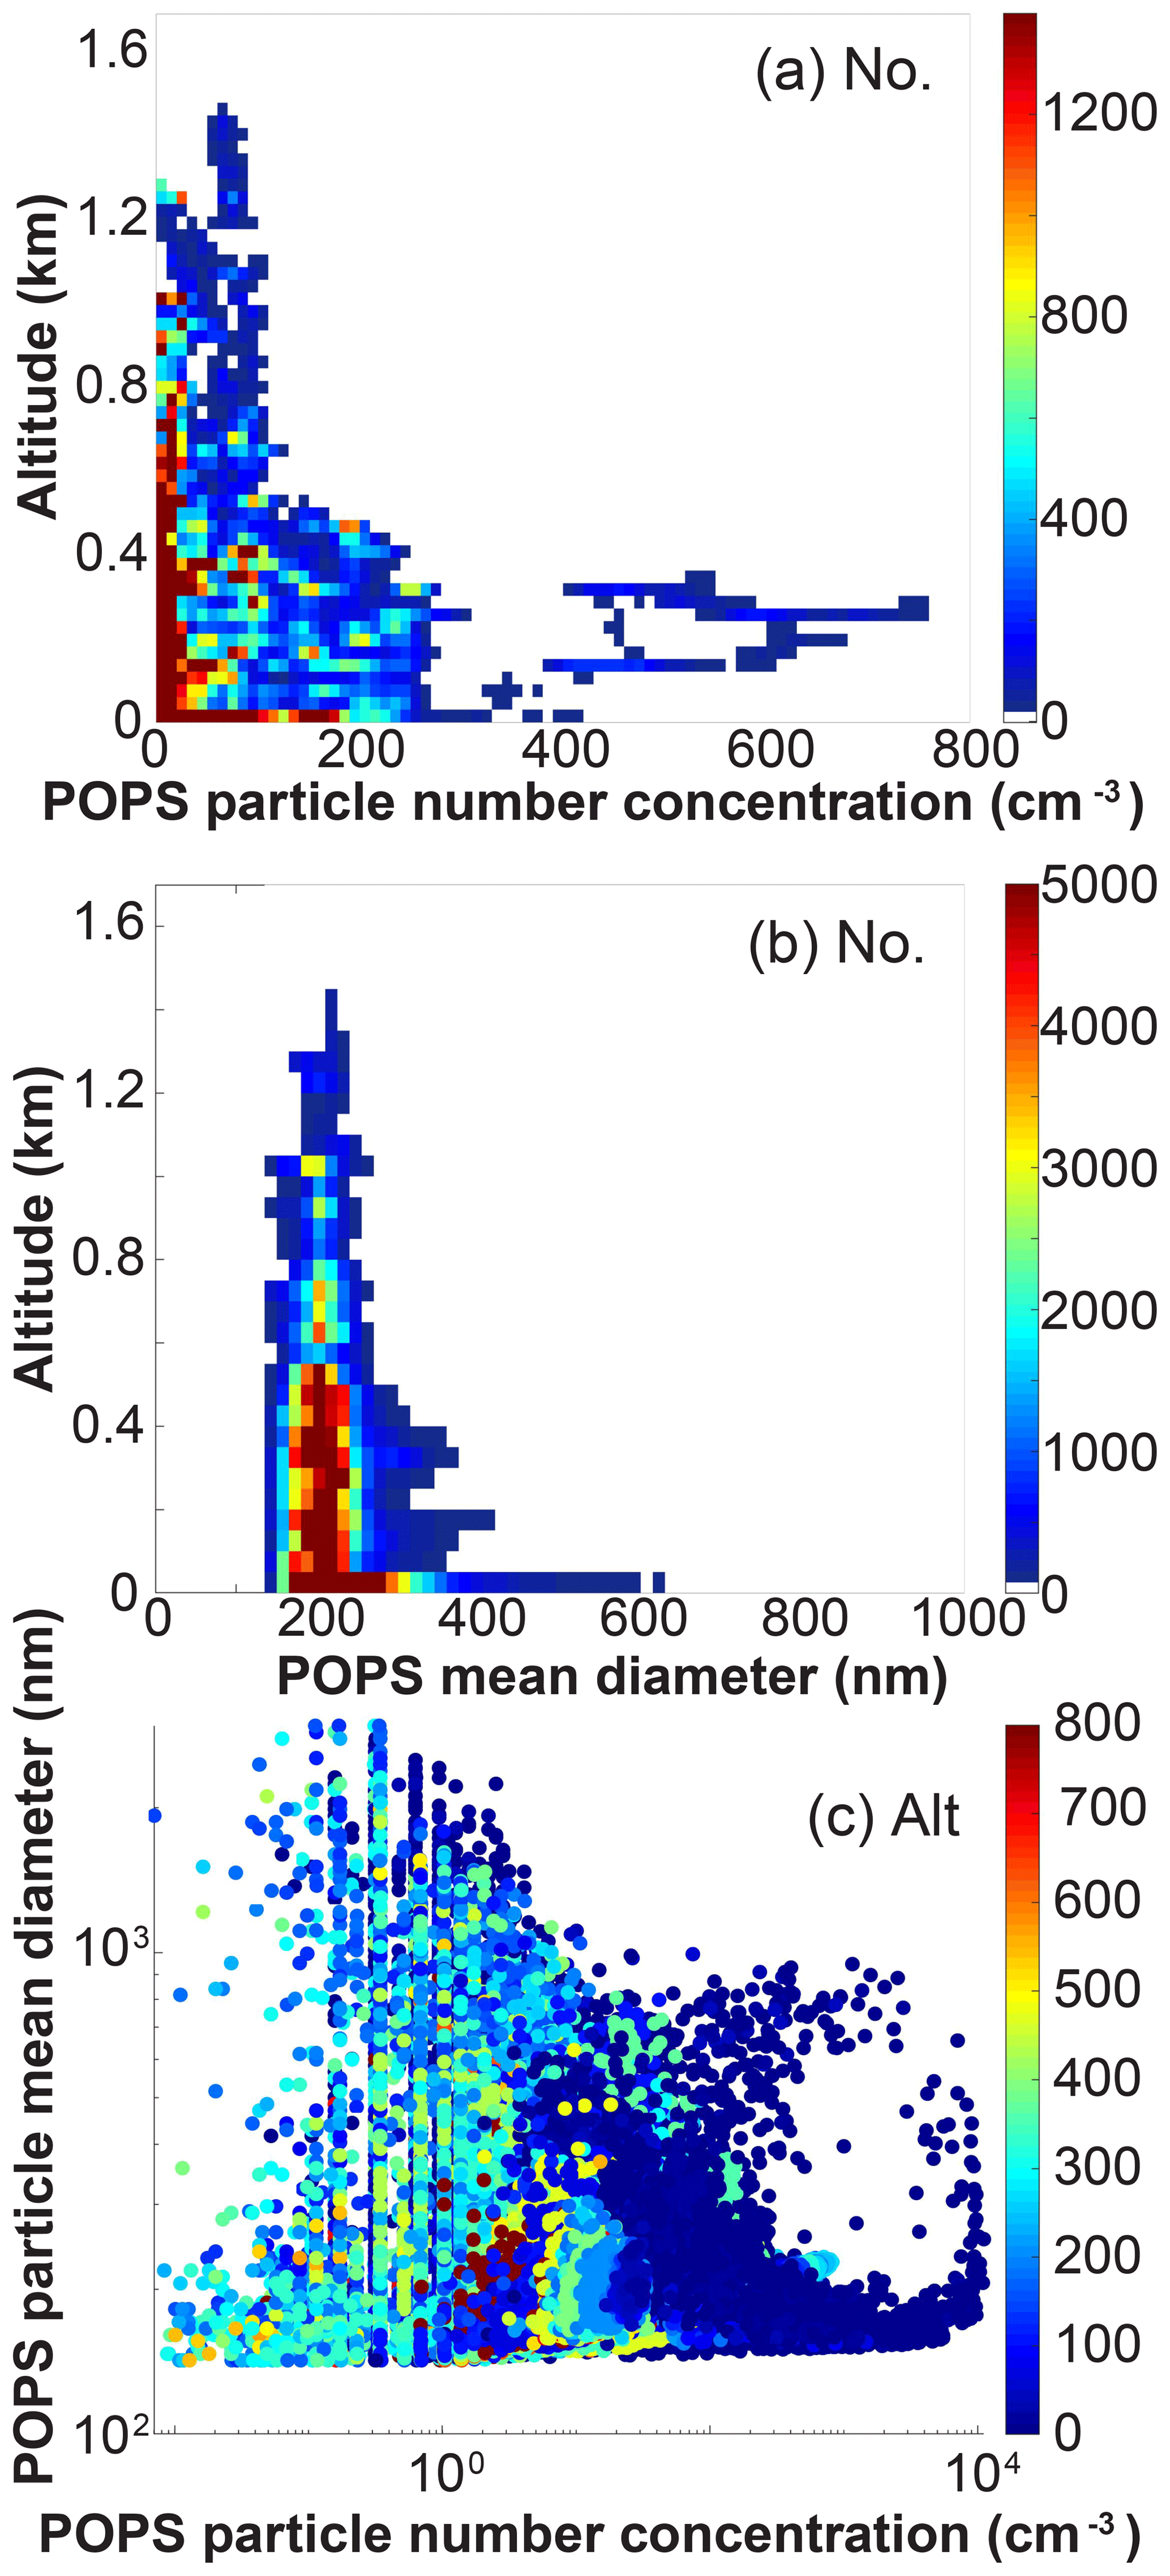
Figure 11POPEYE aerosol statistics from the POPS sensor. Included are (a–c) a two-dimensional histogram of particle number concentrations sampled as a function of height; a two-dimensional histogram of the particle sized detected as a function of height; and a scatter plot showing the relationship between size and number, with colors representing altitude.
The US DOE ARM program handles all data collection, quality control, and processing for field campaigns. In general, several different levels of ARM data are made available, ranging from raw data as recorded by the sensors (a level), to quality-controlled data (b level) and data products (c level). This section provides an overview of the processing and quality control applied to the data streams coming from the platforms deployed during POPEYE.
For the DataHawk, current processing techniques provide both raw and processed data files. Aircraft performance and sensor data are gathered and stored in a binary format on the onboard SD card. These binary format data are the raw data that are archived by ARM (a0 level). Typically, these raw data are invisible to the community user, but can be requested through the ARM data discovery tool if desired. In addition, the data on the SD card are unpacked, downsampled to 10 Hz, and assigned to a relevant array of variable names, and then exported to NetCDF format as a processed raw data file (a1 level). This data file includes data gathered by onboard sensors during flight, aircraft performance data, telemetry data and GPS data. The next file that is produced is a 10 Hz quality-controlled file that includes some initial conversions (b1 level). For example, raw sensor data from the cold wire sensor and onboard temperature sensors are used to convert the voltage reported by the cold wire into a temperature value. Additionally, relative humidity and infrared temperature values measured are calibrated and converted from the engineering to relevant physical units. Wind components are reconstructed using corrected pitot airspeed data, GPS data, and the aircraft principle axis data to produce wind speed and direction and the three wind components. Finally, a quality control step is applied to remove any significant spikes in the data set. This quality-controlled data set is the current final ARM data product for DataHawk2. An additional higher frequency data product is under development for future release, which will provide the turbulence parameters as a value added product (VAP).
Most of the TBS measurements undergo a similar processing and quality control procedure. In particular, several quality control measures are implemented on the POPS instrument. Included in this processing is a size correction that is determined through routine size checks and calibration. For the size check, 500 nm polystyrene latex (PSL) particles are generated to evaluate the signal response from the POPS instrument and confirm that the instrument performance is steady over the course of the campaign. For the calibration, eight different PSL particle sizes are used to determine the relationship between the optical response signal and particle size. In addition, a flow correction is applied, which is based on routine checks using a flow meter. For the CPC, routine calibrations are conducted to ensure that the flow rate is correct. Additionally, ground-based comparisons are conducted with other butanol CPCs to ensure that measured particle concentrations are within 15 % of one another. Also, daily zero count checks are completed, and the alcohol wick is recharged and replaced as needed while the instrument is deployed to the field. Finally, CPC data are flagged as “questionable” when particle concentrations are higher than 105 cm−3, because of a lack of correction for coincident sampling at high concentrations.
Radiosonde data are processed as quality-controlled measurements, with quality control being completed proprietary Vaisala software that corrects for sensor response time and solar radiation exposure.
The data files from POPEYE observations are available for public download through the US DOE ARM Program Data Archive (http://www.archive.arm.gov/discovery/, last access: July 2019). ARM uses NetCDF as the standard data file format, with self-describing metadata provided to the user inside the NetCDF file. The data are posted as individual data streams on the archive, which is searchable by site (in this case OLI for Oliktok Point) and instrument (in this case “TBS” for the tethered balloons, “aafdatahawk” for the DataHawk2, and “sonde” for the radiosondes). Each instrument may have several different levels of data available.
The main TBS data stream for measurements from the iMet instruments and basic information on aerosol instrumentation is olitbsimetM1.a1 (https://doi.org/10.5439/1426242, Atmospheric Radiation Measurement Program, 2017). ARM is currently working to produce a quality-controlled b1 product. Data from the DTS system have been collected by the ARM Data Management Facility (DMF), and can be requested by email to armarchive@ornl.gov, with the appropriate DTS data streams for POPEYE being tbsdtssxforjch1, tbsdtssxforjch2, tbsdtssxch1, and tbsdtssxch2. SLW sensor data are available through the ARM archive under the tbsslwc.b0 data stream, while the TBS aerosol instrumentation can also be downloaded through the archive as tbscpcM1.00, tbspopdryM1.00, and tbspopwetM1.00. All of these data sets are currently provided at 1 Hz. TBS ground station data, including temperature, humidity, pressure and winds at the surface, are available as b-level files on the archive under the file prefix “olitbsgroundM1” as 10 min average values.
Quality-controlled DataHawk data can be downloaded as oliaafdatahawkmetU1.b1 (https://doi.org/10.5439/1418259, Atmospheric Radiation Measurement Program, 2016). Finally, the POPEYE radisonde data set is available as a QC'd b1 data set, with the filenames being of the general form olisondewnpnM1.b1 (https://doi.org/10.5439/1021460, Atmospheric Radiation Measurement Program, 2013a), where wnpn” refers to the mode of the sonde data collection. Here, “w”=winds, “p”=PTU (pressure, temperature, humidity), and “n”=nominal indicates a normal flight with data collection during ascent only.
To make it possible for scientists to cite DOE ARM program data in their publications, ARM recognizes the value of digital object identifiers (DOIs). Such DOIs are generally being generated at the ARM data product level. Data products produced from the a-level data may have their own DOI – for example, separate DOIs are assigned to each of the available output data streams and any value-added products (VAPs) from the radiosonde measurements obtained by ARM. This means that it is possible that POPEYE measurements could be spread across a variety of DOIs, and that additional DOIs could be created that include POPEYE data as additional data products are developed.
Between 1 July and 30 September 2018, the POPEYE measurement team collected detailed measurements of the lower Arctic atmosphere at Oliktok Point, Alaska, using tethered balloons, unmanned aircraft and radiosondes. This activity resulted in the completion of 134.3 TBS flight hours, 64.6 sUAS flight hours, and 238 radiosonde launches. The primary focus of POPEYE was to provide detailed measurements of the lower atmosphere, including thermodynamic state, aerosol properties, cloud microphysical properties, winds, and surface temperature. UAS flights covered the atmosphere between the surface and 1 km altitude but were unfortunately called off early due to EMI from the nearby long-range surveillance radar system operated by the US Air Force. Tethered balloon measurements went as high as 1396 m using two different balloons. Radiosondes were launched at a frequency of three times daily, except when environmental conditions (winds >13.1 m s−1, bears) prevented balloon launches. These data sets provide a detailed look at processes in the lower atmosphere and set the stage for detailed evaluation of numerical models and, together with ongoing, continuous measurements from the AMF-3, support the development of modeling case studies for process understanding and evaluation of parameterization performance.
Quality-controlled versions of the data collected as a part of POPEYE are available on the US DOE ARM data archive. This archive is publicly accessible and allows users to download data from these platforms and all other ARM-operated instrumentation, including measurements from the AMF-3 deployment at Oliktok Point.
GdB designed the field campaign, acted as principal investigator for POPEYE, conducted field work as part of POPEYE, and led the development of the manuscript. DD, CL and MA were the primary TBS operators during POPEYE, contributed to the processing of TBS data, and contributed to the writing and review of the manuscript. JH, PJC, and LG were the primary DataHawk2 operators during POPEYE and contributed to the processing of DataHawk2 data and the writing and review of the manuscript. DO, JL, MC and NB are site operators at Oliktok Point and conducted the radiosonde launches, contributed to site operations during POPEYE and assisted the DataHawk2 and TBS teams while in the field. FM is the instrument mentor for TBS aerosol instrumentation as well as for the DataHawk2 and contributed to data preparation and processing for POPEYE as well as manuscript writing and review. MS, AS, and JI are POPEYE Co-PIs and contributed to campaign planning, field work, and oversight as well as the writing and review of this paper. DL is the primary DataHawk2 developer and contributed to the development and review of the DataHawk2 data set. AD helped with the development of wind estimation techniques using the DataHawk2. DH is the ARM instrument mentor for the radiosondes and contributed to the processing of the radiosonde data set as well as the writing and review of this paper. Finally, MDI and BS manage the teams responsible for operation of the TBS and DataHawk2. Additionally, MI is the primary site manager at the AMF-3. They both oversaw and supported campaign activities and additionally contributed to the review of this paper.
The authors declare that they have no conflict of interest.
This work was supported by the US Department of Energy Atmospheric Radiation Measurement Program. Support for campaign planning and execution was provided by the US DOE Atmospheric System Research Program under project DE-SC0013306. Finally, additional support was provided by the NOAA Physical Sciences Division. We would like to thank the US Air Force for providing access to the Oliktok Point facility, ENI Petroleum who supported our teams at their Nikaitchuq Operations Center, and ConocoPhillips who housed team members at the Kuparuk camp. Finally, POPEYE is an officially endorsed contribution to the Year of Polar Prediction (YOPP), a flagship activity of the Polar Prediction Project (PPP), initiated by the World Weather Research Programme (WWRP) of the World Meteorological Organisation (WMO). We acknowledge the WMO WWRP for its role in coordinating this international research activity.
This research has been supported by the US Department of Energy (grant no. DE-SC0013306).
This paper was edited by Alexander Kokhanovsky and reviewed by three anonymous referees.
Atmospheric Radiation Measurement (ARM) user facility: updated hourly, Balloon-Borne Sounding System (SONDEWNPN), 2018-07-01 to 2018-10-01, ARM Mobile Facility (OLI) Oliktok Point, Alaska; AMF3 (M1), compiled by: Holdridge, D., Kyrouac, J., and Coulter, R., ARM Data Center, https://doi.org/10.5439/1021460 (accessed: 8 November 2018), 2013a.
Atmospheric Radiation Measurement (ARM) user facility: updated hourly, Surface Meteorological Instrumentation (MET), 2018-07-01 to 2018-10-01, ARM Mobile Facility (OLI) Oliktok Point, Alaska; AMF3 (M1), compiled by Holdridge, D. and Kyrouac, J., ARM Data Center, Data set accessed 2018-11-08 at https://doi.org/10.5439/1025220 (accessed: 8 November 2018), 2013b.
Atmospheric Radiation Measurement (ARM) user facility: updated hourly, Ceilometer (CEIL), 2018-07-01 to 2018-10-01, ARM Mobile Facility (OLI) Oliktok Point, Alaska; AMF3 (M1), compiled by: Ermold, B. and Morris, V., ARM Data Center, https://doi.org/10.5439/1181954 (accessed: 8 November 2018), 2013c.
Atmospheric Radiation Measurement (ARM) user facility: updated hourly, Meteorological Instrumentation aboard Aircraft (AAFDATAHAWKMET), 2016-06-06 to 2018-08-07, ARM Mobile Facility (OLI) DataHawk Unmanned Aerial System (U1), compiled by: Mei, F. and Hubbe, J., ARM Data Center, https://doi.org/10.5439/1418259 (accessed: 11 March 2019), 2016.
Atmospheric Radiation Measurement (ARM) user facility, updated hourly, Tethered Balloon System (TBSIMET), 2017-04-09 to 2018-09-28, ARM Mobile Facility (OLI) Oliktok Point, Alaska; AMF3 (M1), compiled by: Dexheimer, D. and Shi, Y., ARM Data Center, https://doi.org/10.5439/1426242 (accessed: 11 March 2019), 2017.
Balsley, B. B., Lawrence, D. A., Fritts, D. C., Wang, L., Wan, K., and Werne, J.: Fine Structure, Instabilities, and Turbulence in the Lower Atmosphere: High-Resolution In Situ Slant-Path Measurements with the DataHawk UAV and Comparisons with Numerical Modeling, J. Atmos. Oceanic Technol., 35, 619–642, https://doi.org/10.1175/JTECH-D-16-0037.1, 2018.
Comiso, J. C., Parkinson, C. L., Gersten, R., and Stock, L.: Accelerated decline in the Arctic sea ice cover, Geophys. Res. Lett., 35, L01703, https://doi.org/10.1029/2007GL031972, 2008.
de Boer, G., Ivey, M. D., Schmid, B., McFarlane, S., and Petty, R.: Unmanned platforms monitor the Arctic atmosphere, EOS, 97, https://doi.org/10.1029/2016EO046441, 2016.
de Boer, G., Ivey, M. D., Schmid, B., Lawrence, D., Dexheimer, D., Mei, F., Hubbe, J., Hardesty, J. O. E., Bendure, A., Shupe, M. D., McComiskey, A., Telg, H., Schmitt, C., Matrosov, S., Brooks, I., Creamean, J. M., Solomon, A., Turner, D. D., Williams, C., Maahn, M., Argrow, B., Palo, S., Long, C. N., Gao, R.-S., and Mather, J.: A Bird's Eye View: Development of an Operational ARM Unmanned Aerial Systems Capability for Atmospheric Research in Arctic Alaska, B. Am. Meteor. Soc., 99, 1197–1212, https://doi.org/10.1175/BAMS-D-17-0156.1, 2018.
de Jong, S. A. P., Slingerland, J. D., and van de Giesen, N. C.: Fiber optic distributed temperature sensing for the determination of air temperature, Atmos. Meas. Tech., 8, 335–339, https://doi.org/10.5194/amt-8-335-2015, 2015.
Dobricic, S., Vignati, E., and Russo, S.: Large-scale atmospheric warming in winter and the Arctic sea ice retreat, J. Clim., 29, 2869–2888, 2016.
Graversen, R. G., Mauritsen, T., Tjernström, M., Källén, E., and Svensson, G.: Vertical structure of recent Arctic warming, Nature, 451, 53–56, 2008.
Ho, J.: The implications of Arctic sea ice decline on shipping, Marine Pol., 34, 713–715, 2010.
Hudson, S. R., Granskog, M. A., Sundfjord, A., Randelhoff, A., Renner, A. H. H., and Divine, D. V.: Energy budget of first-year Arctic sea ice in advanced stages of melt, Geophys. Res. Lett., 40, 2679–2683, 2013.
Inoue, J., Yamazaki, A., Ono, J., Dethloff, K., Maturilli, M., Neuber, R., Edwards, P., and Yamaguchi, H.: Additional Arctic observations improve weather and sea-ice forecasts for the Northern Sea Route, Sci. Report., 5, 16868, https://doi.org/10.1038/srep16868, 2015.
Jung, T., Kasper, M. A., Semmler, T., and Serrar, S.: Arctic influence on sub-seasonal midlatitude prediction, Geophys. Res. Lett., 41, 3676–3680, 2014.
Kantha, L., Lawrence, D., Luce, H., Hashiguchi, H., Tsuda, T., Wilson, R., Mixa, T., and Yabuki, M.: Shigaraki UAV-Radar Experiment (ShUREX): overview of the campaign with some preliminary results, Prog. Earth. Planet. Sci., 4, 19, https://doi.org/10.1186/s40645-017-0133-x, 2017.
Keller, C. A., Huwald, H., Vollmer, M. K., Wenger, A., Hill, M., Parlange, M. B., and Reimann, S.: Fiber optic distributed temperature sensing for the determination of the nocturnal atmospheric boundary layer height, Atmos. Meas. Tech., 4, 143–149, https://doi.org/10.5194/amt-4-143-2011, 2011.
Lawrence, D. A. and Balsley, B. B.: High-Resolution Atmospheric Sensing of Multiple Atmospheric Variables Using the DataHawk Small Airborne Measurement System, J. Atmos. Oceanic Technol., 30, 2352–2366, https://doi.org/10.1175/JTECH-D-12-00089.1, 2013.
Maslanik, J., Stroeve, J., Fowler, C., and Emery, W.: Distribution and trends in Arctic sea ice age through spring 2011, Geophys. Res. Lett., 38, L13502, https://doi.org/10.1029/2011GL047735, 2011.
Mayer, M., Haimberger, L., Pietschnig, M., and Storto, A.: Facets of Arctic energy accumulation based on observations and reanalyses 2000–2015, Geophys. Res. Lett., 43, 10420–10429, 2016.
Screen, J. A. and Simmonds, I.: The central role of diminishing sea ice in recent Arctic temperature amplification, Nature, 464, 1334–1337, 2010.
Serreze, M. C., Holland, M. M., and Stroeve, J.: Perspectives on the Arctic's shrinking sea ice cover, Science, 315, 1533–1536, 2007.
Smith, L. C. and Stephenson, S. R.: New Trans-Arctic shipping routes navigable by midcentury, P. Natl. Acad. Sci., 110, E1191–E1195, 2013.
Uttal, T., Starkweather, S., Drummond, J. R., Vihma, T., Makshtas, A. P., Darby, L. S., Burkhart, J. F., Cox, C. J., Schmeisser, L. N., Haiden, T., Maturilli, M., Shupe, M. D., de Boer, G., Saha, A., Grachev, A. A., Crepinsek, S. M., Bruhwiler, L., Goodison, B., McArthur, B., Walden, V. P., Dlugokencky, E. J., Persson, P. O. G., Lesins, G., Laurila, T., Ogren, J. A., Stone, R., Long, C. N., Sharma, S., Massling, A., Turner, D. D., Stanitski, D. M., Asmi, E., Aurela, M., Skov, H., Eleftheriadis, K., Virkkula, A., Platt, A., Førland, E. J., Iijima, Y., Nielsen, I. E., Bergin, M. H., Candlish, L., Zimov, N. S., Zimov, S. A., O'Neill, N. T., Fogal, P. F., Kivi, R., Konopleva-Akish, E. A., Verlinde, J., Kustov, V. Y., Vasel, B., Ivakhov, V. M., Viisanen, Y., and Intrieri, J. M.: International Arctic Systems for Observing the Atmosphere: An International Polar Year Legacy Consortium, B. Am. Meteor. Soc., 97, 1033–1056, https://doi.org/10.1175/BAMS-D-14-00145.1, 2016.