the Creative Commons Attribution 4.0 License.
the Creative Commons Attribution 4.0 License.
GRACILE: a comprehensive climatology of atmospheric gravity wave parameters based on satellite limb soundings
Quang Thai Trinh
Peter Preusse
John C. Gille
Martin G. Mlynczak
James M. Russell III
Martin Riese
Gravity waves are one of the main drivers of atmospheric dynamics. The spatial resolution of most global atmospheric models, however, is too coarse to properly resolve the small scales of gravity waves, which range from tens to a few thousand kilometers horizontally, and from below 1 km to tens of kilometers vertically. Gravity wave source processes involve even smaller scales. Therefore, general circulation models (GCMs) and chemistry climate models (CCMs) usually parametrize the effect of gravity waves on the global circulation. These parametrizations are very simplified. For this reason, comparisons with global observations of gravity waves are needed for an improvement of parametrizations and an alleviation of model biases.
We present a gravity wave climatology based on atmospheric infrared limb emissions observed by satellite (GRACILE). GRACILE is a global data set of gravity wave distributions observed in the stratosphere and the mesosphere by the infrared limb sounding satellite instruments High Resolution Dynamics Limb Sounder (HIRDLS) and Sounding of the Atmosphere using Broadband Emission Radiometry (SABER). Typical distributions (zonal averages and global maps) of gravity wave vertical wavelengths and along-track horizontal wavenumbers are provided, as well as gravity wave temperature variances, potential energies and absolute momentum fluxes. This global data set captures the typical seasonal variations of these parameters, as well as their spatial variations. The GRACILE data set is suitable for scientific studies, and it can serve for comparison with other instruments (ground-based, airborne, or other satellite instruments) and for comparison with gravity wave distributions, both resolved and parametrized, in GCMs and CCMs. The GRACILE data set is available as supplementary data at https://doi.org/10.1594/PANGAEA.879658.
- Article
(10942 KB) - Full-text XML
- BibTeX
- EndNote
Our work is focused mainly on the stratosphere and mesosphere, i.e., on the middle atmosphere in the approximate altitude range from 20 to 90 km. In this altitude range typical scales of atmospheric gravity waves are from tens to a few thousand kilometers horizontally and from a few kilometers to several tens of kilometers vertically (e.g., Preusse et al., 2008, and references therein). Most gravity wave sources are located in the troposphere and lower stratosphere. The gravity waves seen higher up in the stratosphere and mesosphere have therefore mostly propagated upward from these sources. Some relevant sources are gravity waves excited by flow over topography (mountain waves) (e.g., McFarlane, 1987; Lott and Miller, 1997), gravity waves excited by convection (e.g., Fovell et al., 1992; Pfister et al., 1993; Piani et al., 2000; Song and Chun, 2005), and gravity waves generated by source processes related to strong wind jets, for example the subtropical jets or the polar jets (e.g., Plougonven and Zhang, 2014, and references therein).
Gravity waves propagate away from their sources. Thereby they redistribute momentum and energy in the atmosphere, and where they dissipate they can affect (accelerate or decelerate) the background flow by deposition of momentum and energy. Dissipation processes include radiative damping (e.g., Zhu, 1993), turbulent damping (e.g., Marks and Eckermann, 1995, and references therein), and wave saturation and breaking (e.g., Fritts, 1984; Fritts and Rastogi, 1985).
If a gravity wave propagates conservatively upward in a background atmosphere with constant background wind and temperature, its amplitude will grow exponentially due to the exponential decrease in atmospheric density with altitude. At some point, however, the amplitude reaches its saturation limit, and the wave will start to break. For an overview of the theory of wave saturation see, for example, Fritts (1984) or Fritts and Alexander (2003). Critical level filtering occurs when during wave propagation the background wind is not constant and approaches the ground-relative phase speed cφ of the wave. In this case, due to Doppler shifting, the intrinsic frequency and thus the vertical wavelength λz of the wave approach zero. Thereby the saturation amplitude of the wave also tends to zero, and the wave will dissipate completely. For a more detailed discussion see also Ern et al. (2015) and references therein.
One characteristic parameter of atmospheric gravity waves is E0, the total gravity wave energy per unit mass:
with Ekin the kinetic and Epot the potential energy per unit mass. The kinetic energy is given by
and the potential energy Epot by
Here, is the atmospheric background temperature, g the gravitational acceleration of the Earth, and N the buoyancy frequency. Further, u′, v′, w′, and T′ are the perturbation components due to the gravity wave of the zonal, meridional and vertical wind, as well as the temperature, respectively. The overbar denotes averaging over one wave period or multiples of it.
Based on observed spectral characteristics, it is often assumed that the energy spectrum of wind velocity or temperature perturbations due to gravity waves takes the form of a separable product of independent functions (e.g., Fritts and VanZandt, 1993; Fritts and Alexander, 2003):
with the ratio of gravity wave vertical wavenumber and the characteristic wavenumber m* that separates the saturated from the unsaturated part of the vertical wavenumber spectrum. Often, the function A(μ) is approximated as follows:
and is often found to be proportional to :
A0 and B0 are normalization constants. The function Φ(ϕ) accounts for the anisotropy of the gravity wave distribution depending on the horizontal propagation direction ϕ. The parameters s, t, and p are logarithmic spectral slopes. The spectral slope s describes the unsaturated part of the vertical wavenumber spectrum (at small m), and t the saturated part (at large m). While t=3 is usually a very good approximation, s is not well constrained and is often set to 1. The spectral slope p describes the shape of the intrinsic frequency spectrum . Often, p is found in the range of approximately 5∕3 to 2. It is predicted by linear wave theory, and it is also often observed, that in the atmosphere the ratio Ekin∕Epot is approximately equal to the spectral slope p, i.e., approximately 5∕3 to 2 (e.g., van Zandt, 1985). This means that with the knowledge of Epot values of Ekin and E0 can be estimated. For more details see, for example, Fritts and VanZandt (1993), Tsuda et al. (2000), Warner and McIntyre (2001), or Ern et al. (2006) and references therein. Experimental tests of this relationship were carried out in the lower stratosphere, for example, by Hertzog et al. (2002) (superpressure balloons), and by Nastrom et al. (2000) and Tsuda et al. (2000) (a combination of Global Positioning System Radio Occultations (GPS-RO) and radar observations). Another test was carried out in the mesosphere by Placke et al. (2013) (a combination of lidar and radar observations).
For a conservatively propagating gravity wave, however, the wave energy is not a conserved quantity. A parameter that is more relevant for the interaction of gravity waves with the background flow is the vertical flux of horizontal wave pseudomomentum. In the following, for simplification, we will call this parameter momentum flux. The momentum flux vector is given by
(e.g., Fritts and Alexander, 2003). Fpx and Fpy are the zonal and meridional momentum flux components, respectively, is the atmospheric background density, and f is the Coriolis parameter. This equation can be rewritten in terms of gravity wave wavenumbers and temperature amplitude (cf. Ern et al., 2004):
Here, is the temperature amplitude of the gravity wave, is the wavenumber vector, consisting of zonal, meridional, and vertical components, respectively, with λx and λy the apparent horizontal wavelength in the zonal (x) and meridional (y) directions, respectively, of a gravity wave with the “true” horizontal wavelength λh in the direction of wave propagation. This equation was derived using the linear polarization relations for gravity waves (e.g., Fritts and Alexander, 2003; Ern et al., 2004). In Eq. (8) several terms were omitted for simplification. For the gravity waves seen by infrared (IR) limb sounders, however, neglecting these terms introduces errors of only a few percent. For details see the discussion in the supporting information of Ern et al. (2017). Equation (8) can be rewritten for absolute momentum fluxes Fph by introducing the absolute horizontal wavenumber :
Similarly, the potential energy can be rewritten in terms of the gravity wave temperature amplitude with Epot, max the maximum potential energy during one wave cycle,
and Epot the potential energy of the wave averaged over one or more wave cycles:
which corresponds to Eq. (3).
The acceleration or deceleration (X,Y) of the background flow, in the following for simplification called gravity wave drag, is given by the vertical gradient of momentum flux:
with X and Y the drag in the zonal and meridional directions, respectively, and z the vertical coordinate. For more details see the review paper by Fritts and Alexander (2003).
Gravity wave drag plays an important role in the whole middle atmosphere. It significantly contributes to the wind reversals at the top of the mesospheric wind jets (e.g., Lindzen, 1981; Holton, 1982, 1983). Further, gravity wave dissipation drives the meridional circulation in the mesosphere, which leads to the cold summer mesopause, the coldest region in Earth's atmosphere, as well as to the relatively warm winter stratopause. In the stratosphere, gravity wave drag plays an important role, for example for the driving of the quasi-biennial oscillation (QBO) and semiannual oscillation (SAO) of the zonal wind in the tropics (e.g., Lindzen and Holton, 1968; Dunkerton, 1997; Delisi and Dunkerton, 1988; Ern et al., 2014, 2015). In addition, gravity waves contribute to the Brewer–Dobson circulation in the stratosphere, particularly to the summertime branch (e.g., Alexander and Rosenlof, 2003). A tutorial that addresses several effects of the interaction between gravity waves and the mean background flow is given in McLandress (1998).
Consequently, general circulation models (GCMs) and chemistry climate models (CCMs) need a realistic representation of gravity wave drag in order to produce realistic global circulation patterns in the middle atmosphere. The spatial resolution of these models, however, is usually too coarse to resolve more than a small fraction of the whole spectrum of gravity waves. Therefore most global models need gravity wave parametrization schemes (gravity wave drag schemes); see also McLandress (1998) or Kim et al. (2003) and references therein. At the time of writing, gravity wave parametrization schemes are still needed even for state-of-the-art high-resolution numerical weather prediction models (e.g., Orr et al., 2010), and also in the foreseeable future gravity wave parametrization schemes will still be required.
Usually, gravity wave parametrization schemes launch gravity wave momentum flux from a source level and make assumptions about the propagation and dissipation of gravity waves, and thereby the effect (drag) that gravity waves exert on the background flow is simulated.
Traditionally, many global models employ at least two different gravity wave drag schemes: a nonorographic, and an orographic gravity wave drag scheme. Nonorographic gravity wave drag schemes usually do not represent specific gravity wave sources. Often, they assume a fixed source level and a homogeneous and isotropic launch distribution; i.e., they launch the same amount of momentum flux in different directions (for example, the four cardinal directions) at each model grid point. Some examples of such schemes are the schemes introduced by Lindzen (1981), Hines (1997), Alexander and Dunkerton (1999), Warner and McIntyre (2001), Scinocca (2003), or Yigit et al. (2008). Different from this, orographic gravity wave parametrizations are dedicated to mountain waves that are excited by flow over topography, i.e., to a specific source process. Some examples are McFarlane (1987), Lott and Miller (1997), or Scinocca and McFarlane (2000).
There are also attempts to address other specific sources by dedicated gravity wave parametrizations, for example, gravity waves excited by jets and fronts (Charron and Manzini, 2002; de la Cámara and Lott, 2015), or gravity waves excited by convective sources (e.g., Chun and Baik, 1998, 2002; Beres et al., 2004; Song and Chun, 2005; Bushell et al., 2015). These schemes were successfully used in GCMs (e.g., Richter et al., 2010; Kim et al., 2013). Another recent development is so-called stochastic schemes (e.g., Eckermann, 2011; Lott et al., 2012; de la Cámara and Lott, 2015) which mimic the observed intermittent nature of gravity wave sources (e.g., Hertzog et al., 2008, 2012; Wright et al., 2013) in a simplified fashion.
Still, all these schemes are very simplified. They contain tunable parameters and make simplifying assumptions about the launch distributions, and most gravity wave drag schemes propagate gravity waves only in the vertical direction, while in a real atmosphere gravity waves can also propagate horizontally (e.g., Marks and Eckermann, 1995; Sato et al., 2009, 2012; Preusse et al., 2009b; Ern et al., 2013; Kalisch et al., 2014; Hindley et al., 2015; Ribstein and Achatz, 2016). Therefore comparison with observed global distributions of gravity waves is important for improving and tuning gravity wave drag schemes. In particular, observed momentum fluxes allow for a direct comparison with gravity wave drag schemes.
There are already first attempts to improve gravity wave parametrizations by comparison with satellite observations. Some comparisons are based on gravity wave variances or amplitudes (e.g., Choi et al., 2009, 2012; Stephan and Alexander, 2015), while others use momentum fluxes (e.g., Ern et al., 2006; Fröhlich et al., 2007; Orr et al., 2010; Trinh et al., 2016; Kalisch et al., 2016).
Because these first comparisons have already led to promising results, the aim of our work is to provide a climatological data set, GRACILE (GRAvity wave Climatology based on Infrared Limb Emissions observed by satellite), of gravity wave temperature variances, squared temperature amplitudes, potential energies, horizontal wavenumbers, vertical wavelengths, and momentum fluxes based on 3 years (March 2005 until February 2008) of High Resolution Dynamics Limb Sounder (HIRDLS) observations, and on 13 years (February 2002 until January 2015) of Sounding of the Atmosphere using Broadband Emission Radiometry (SABER) observations. Both these instruments are infrared limb sounders operating on satellites in low Earth orbits. This measurement technique has the advantage that a comparably large range of the gravity wave spectrum is covered (see also Preusse et al., 2002, 2008; Alexander et al., 2010).
Of course, this climatological data set can also be used for comparison with distributions of gravity waves that are resolved in global models, in order to find out how realistic these distributions are. It has been shown that even for high-resolution models gravity wave amplitudes may be underestimated, and distributions of resolved gravity waves may not be fully realistic (e.g., Schroeder et al., 2009; Preusse et al., 2014; Gong et al., 2015; Jewtoukoff et al., 2015). This means even distributions of resolved gravity waves need to be validated against observations. In addition, this climatological data set can be used for comparison with other observations, for example other satellite data, superpressure balloons, radiosondes, or ground-based instrumentation. For a meaningful comparison, however, the respective observational filters of the different observation techniques have to be taken into account. In particular, every observation method has its own coverage in gravity wave wavenumber and frequency space (see also Alexander et al., 2010). A detailed discussion of the observational filter of infrared limb sounders has been given, for example, by Trinh et al. (2015).
The paper is organized as follows: in Sect. 2 the HIRDLS and SABER instruments are briefly introduced. Then, in Sect. 3, we describe how gravity wave temperature variances, potential energies and momentum fluxes are derived from temperature altitude profiles observed by HIRDLS and SABER. In addition, we address the observational limitations of the instruments, and potential error sources are discussed. In Sect. 4, we describe how the data are gridded in preparation of the GRACILE climatological data set, and what data products are available. In particular, we present examples of global distributions, a measure of the natural variability, as well as time series of zonal averages. Finally, Sect. 1 gives a summary of the paper.
Our work is based mainly on data of the satellite instruments HIRDLS and SABER. Both instruments are infrared (IR) limb sounders operating on satellites in low Earth orbits. From atmospheric IR limb emissions of CO2 around 15 µm, temperature–pressure profiles of the atmosphere are derived. In addition, both instruments observe several trace species. In our study, we use HIRDLS version V006 (see also Gille et al., 2011) and SABER version v2.0 data. Detailed information about the HIRDLS instrument, temperature retrieval and vertical resolution is given, for example, in Gille et al. (2003, 2008), Barnett et al. (2008), or Wright et al. (2011). For SABER, details about the instrument are given, for example, in Mlynczak (1997) or Russell III et al. (1999). The SABER temperature retrieval is described in Remsberg et al. (2004, 2008).
Table 1Characteristics of the HIRDLS and SABER instruments and data sets. Also given is the coverage used for the GRACILE gravity wave (GW) climatology.
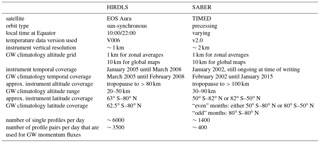
“odd” months: January, March, May, July, September, or November. “even” months: February, April, June, August, October, or December.
HIRDLS observations are available from 22 January 2005 until 17 March 2008, while SABER observations started on 25 January 2002 and are still ongoing at the time of writing. However, in order to avoid biases in the GRACILE gravity wave climatology, we use only full years of data. For HIRDLS, the GRACILE climatology covers March 2005 until February 2008, and for SABER February 2002 until January 2015. For an overview, Table 1 summarizes some characteristics of both instruments. Also given is the approximate temporal, latitudinal and altitude coverage of the observations, as well as the temporal and global coverage provided in our gravity wave climatology.
While HIRDLS continuously observes the latitude range of about 63∘ S–80∘ N, this is different for SABER: every ∼ 60 days for about 60 days SABER switches between a northward and southward viewing mode with latitude coverages of 50∘ S–82∘ N and 82∘ S–50∘ N, respectively. This means that only the latitude range 50∘ S–50∘ N is observed continuously. For the range of years considered here (2002 until 2015), in February, June, and October the latitude coverage is always 50∘ S–82∘ N (northward view), and in April, August and December it is always 82∘ S–50∘ N (southward view). In the “odd” months (January, March, May, July, September, and November) SABER switches between northward and southward view. Consequently, monthly averages of these months have a latitude coverage of 82∘ S–82∘ N. However, latitudes poleward of 50∘ are only observed during part of the month, which may introduce biases into the gravity wave climatology poleward of 50∘ for those “odd” months.
Over the whole period of the SABER mission, the date when SABER switches between northward and southward view has gradually shifted from the middle of the odd months to the beginning of the odd months. The first northward viewing phase of 2017 started even as early as 31 December 2016, i.e., not in January 2017.
Satellite instruments that observe Earth's atmosphere in limb geometry view toward the Earth's horizon. A schematic of this viewing geometry is given in Fig. 1. Altitude profiles of the incoming limb radiances can be measured, for example, by changing the elevation angle of the line of sight (LOS) of the instrument such that vertical scans through the atmosphere are performed. The point of the LOS that is closest to the Earth's surface is the so-called tangent point. In the case of optically thin emissions, most of the observed radiances have their origin in the vicinity of the tangent point, both in terms of altitude and in terms of horizontal position along the LOS. This is due to the exponential decrease in atmospheric density and, thus, the number of emitting molecules with altitude. Therefore, temperatures or trace gas mixing ratios that are usually derived from observed altitude profiles can be attributed to the locations and altitudes (the “tangent altitudes”) of the tangent points.
3.1 Sensitivity function and observational filter
Limb sounding of optically thin atmospheric emissions is a measurement technique that is capable of observing small-scale atmospheric fluctuations, such as gravity waves. This was first reported by Fetzer and Gille (1994) and Eckermann and Preusse (1999). Later, Preusse et al. (2000) pointed out the importance of differences in the sensitivity of different measurement techniques for detecting gravity waves, and an analytic expression for the sensitivity function of limb sounders was derived (Preusse et al., 2002).
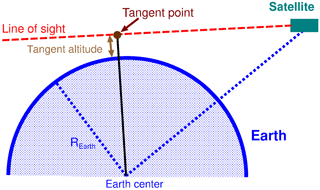
Figure 1Schematic of the geometry of satellite limb observations. The satellite instrument views toward the Earth's horizon. The point of the instruments' line of sight closest to the Earth's surface is called the tangent point, and the corresponding altitude is the tangent altitude.
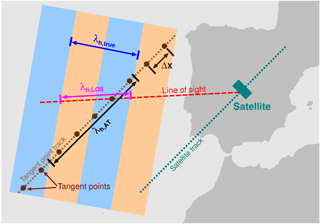
Figure 2Illustration of an example how the apparent horizontal wavelength λh, AT parallel to the satellite tangent point track (measurement track) and the apparent horizontal wavelength λh, LOS parallel to the satellite line of sight (LOS) could differ from the true horizontal wavelength λh, true of an observed gravity wave. These differences strongly depend on the relative orientations of the observed gravity wave, of the LOS, and of the direction of the tangent point track; however, λh, LOS and λh, AT will always overestimate λh, true. Light blue and light orange shaded areas indicate areas of negative and positive phases, respectively, that would be obtained by a horizontal section through an idealized plane gravity wave. Bold brown dots indicate the discrete sampling of this wave by single altitude profiles observed by the satellite instrument. The horizontal sampling step is denoted as Δx.
Sensitivity function
The amplitude response S(kLOS, m) of an altitude profile of observed limb radiances to an observed sine-shaped gravity wave due to effects of radiative transfer in the Earth's atmosphere can be written as follows (Preusse et al., 2002):
Here, m is the vertical wavenumber, and the apparent horizontal wavenumber of the gravity wave in the direction parallel to the LOS of the instrument. In Fig. 2 an illustration is given showing that the apparent horizontal wavelength λh, LOS parallel to the LOS, and the apparent horizontal wavelength λh, AT parallel to the measurement track, can be quite different from the true horizontal wavelength λh, true of an observed gravity wave. See also Preusse et al. (2009a) and Trinh et al. (2015). The term in Eq. (13) is the linear expansion in temperature T of the blackbody source function B. The further parameters in Eq. (13) are , , with REarth the Earth's radius and H the pressure scale height. See also Preusse et al. (2002, 2008).
An ideal temperature retrieval (infinitesimal vertical field of view and infinitesimal retrieval step-width with, at the same time, an infinite signal-to-noise ratio of the instrument) can compensate for effects of the vertical wavelength, but has to assume that an observed wave has infinite horizontal extent (kLOS=0). The resulting temperature amplitude response of an ideal retrieval can be obtained by calculating the following ratio (Preusse et al., 2002, 2008):
For a real retrieval, however, there will be a reduction of sensitivity at short gravity wave vertical wavelengths due to an additional smoothing effect over an altitude interval Δz, caused by the vertical field of view of the instrument and the retrieval step-width. This smoothing effect can be accounted for by an additional contribution R(λz) (Preusse et al., 2002):
Usually, the vertical field of view of the instrument will dominate over the effect of the retrieval step, and can be set equal to Δz.
The sensitivity of a “real” temperature retrieval to an observed gravity wave is then given by the product of R(λz) and such that
See also Trinh et al. (2015), their Eq. (1).
Relevant for our study is the sensitivity that is expected for gravity wave squared temperature amplitudes. This sensitivity also applies for gravity wave temperature variances, potential energies, or momentum fluxes. An analytic expression for is obtained by taking the square of :
In our study, we consider the satellite instruments HIRDLS and SABER that observe infrared limb emissions of atmospheric trace gases. For these instruments the analytic sensitivity function is given as function of gravity wave horizontal and vertical wavelengths in Fig. 3a for HIRDLS, and in Fig. 3b for SABER by assuming vertical resolutions (vertical fields of view of the instruments) of 1 km for HIRDLS and 2 km for SABER, respectively. It should be pointed out that the horizontal wavelength relevant for the sensitivity function is the apparent horizontal wavelength of a gravity wave parallel to the line-of-sight direction of the satellite instrument (e.g., Preusse et al., 2009a). Compared to other global gravity wave observation techniques, limb sounding covers a quite large range of the gravity wave spectrum. See also Preusse et al. (2008) or Alexander et al. (2010).
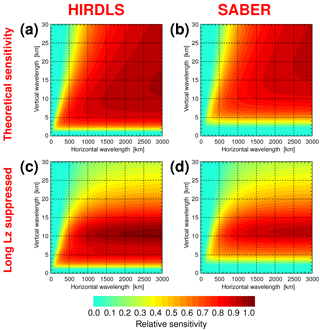
Figure 3Sensitivity of limb sounding instruments to gravity waves as a function of horizontal and vertical wavelength. Values apply for gravity wave temperature variances, squared amplitudes, potential energies, or momentum fluxes and were calculated for (a) HIRDLS and (b) SABER using the analytical approximation derived by Preusse et al. (2002) for the effects of radiative transfer and an idealized retrieval including the sensitivity reduction at short vertical wavelengths due to the vertical field of view of the instruments. (c) and (d) are the same as (a) and (b), but with the additional suppression of long vertical wavelengths used for our gravity wave climatology.
We choose the parameters for the gravity wave analysis in a way that wave parameters for wavelengths shorter than 25 km are determined. In order to avoid observed altitude profiles of temperature fluctuations being contaminated by gravity waves of longer vertical wavelengths, or with planetary waves, these altitude profiles are high-pass filtered in terms of vertical wavenumbers (see also Ern et al., 2011; Meyer et al., 2018). The resulting sensitivity is given in Fig. 3c for HIRDLS, and in Fig. 3d for SABER. The sensitivities shown in Fig. 3c and d are also provided in the GRACILE climatology together with the distributions of gravity wave parameters. It should however be pointed out that these sensitivities are just an approximation. The “true” sensitivity will be similar, but also depends on the details of the retrieval of temperatures from measured altitude profiles of atmospheric radiances. These retrieval details can lead to deviations from the idealized function (Preusse et al., 2002).
It should also be pointed out that due to the limitations by the sensitivity function limb scanning satellite instruments are able to observe only part of the whole spectrum of gravity waves that is present in the atmosphere. Due to this limitation a large fraction, if not most, of the overall gravity wave momentum fluxes is therefore not visible for limb scanning satellite instruments. A strategy to overcome the limitations of a single measurement technique would be, for example, a combination of complimentary measurement techniques as proposed by Alexander et al. (2010) or by Meyer et al. (2018).
Observational filter
The analytic expression for the sensitivity that combines the effects of radiative transfer, temperature retrieval and vertical field of view of the instrument (cf. Figs. 3a and b) already accounts for a major part of the overall observational filter of a limb sounding instrument. However, for the overall observational filter also other effects have to be taken into account. In particular, details of the wave extraction and wave analysis will have effect on the wave spectrum contained in the temperature fluctuations that are attributed to gravity waves. For example, in our case an additional vertical filter was applied which modifies the sensitivity for gravity waves (cf. Fig. 3c and d).
Further, if multiple altitude profiles are combined for the wave analysis, for example for deriving gravity wave momentum fluxes, limitations of the spatial sampling of an instrument that lead to an undersampling of the horizontal structure of an observed gravity wave (aliasing) also have to be considered (e.g., Ern et al., 2004; Trinh et al., 2015): to derive momentum fluxes, the horizontal wavelength of an observed wave has to be determined. However, as indicated in Fig. 2, the horizontal sampling of a wave pattern by different altitude profiles is limited by the horizontal sampling step Δx. If the sampling step is too coarse, some waves passing the sensitivity function (cf. Fig. 3) may be undersampled.
According to the Nyquist limit, the shortest horizontal wavelength parallel to the measurement track that can be resolved by the sampling is . Waves that are undersampled will undergo spatial aliasing, and their horizontal wavelength will be overestimated. Accordingly, the gravity wave momentum flux of those waves will be underestimated as discussed in detail in Ern et al. (2004); see also Eq. (9). In Ern et al. (2004) a correction for these horizontal aliasing effects was suggested. For this correction, however, assumptions about the shape of the gravity wave spectrum in a given region have to be made, and the correction was not applied to the data presented here. We also did not correct for effects of the sensitivity function.
Aliasing effects and a sensitivity function can be accounted for at a later stage: as has been shown by Trinh et al. (2015, 2016), comparisons between observations and model data can be much improved if all effects of the observational filter (including aliasing) are taken into account by simulating the effect of the measurement and applying the simulated observational filter to the model data.
Another effect of the observational filter that has recently been discussed is that observed altitude profiles usually are not perfectly vertical and will therefore partly sample the horizontal structure of an observed gravity wave while performing an altitude scan. This can lead to biases in the observed vertical wavelength for gravity waves of short horizontal wavelengths (e.g., Trinh et al., 2015; de la Torre et al., 2018).
There are several reasons why this effect is very likely not important for our results. First, Trinh et al. (2015) included this effect in their simulation of the overall observational filter of limb sounders, and the effect was found to be small for SABER. Second, HIRDLS and SABER momentum fluxes agree well with CRISTA momentum fluxes. CRISTA momentum fluxes, however, are unaffected by this effect because CRISTA altitude profiles were measured almost vertically (cf. Riese et al., 1999). Third, for limb sounders most of the waves that pass the sensitivity function (cf. Fig. 3) without being attenuated too much should have an aspect ratio λz∕λh of smaller than about 0.1, resulting in a bias of the vertical wavelength of less than ∼ 20 % for SABER; see also de la Torre et al. (2018), their Fig. 7. Of course, for single wave events biases in the observed vertical wavelengths could still occur. For averaged data, however, these effects should be small.
3.2 Background removal
The first step in any analysis of gravity waves from observations is the separation of the measured quantity into an atmospheric background and the fluctuations due to gravity waves. Particularly, temperature altitude profiles observed from satellites will contain contributions of both planetary waves with large horizontal scales and of gravity waves with much smaller horizontal scales. One of the major challenges of methods for removing the atmospheric background state from observed temperature altitude profiles is therefore to effectively separate the fluctuations due to planetary waves (which are usually much larger in amplitude) from those of gravity waves. Usually, this separation is done via a separation of scales, either vertically or horizontally. In the case of time series observed by ground-based stations, temporal filtering of time series is also frequently applied to extract the gravity wave signal.
Scale separation in vertical direction is usually performed by filtering observed altitude profiles vertically. One method is to use polynomial fits in the vertical direction as an estimate for the atmospheric background and subtract this background from an altitude profile to obtain the fluctuations that are attributed to gravity waves. Another method is vertical filtering of single altitude profiles by introducing a low-pass filter for vertical wavelengths and attributing only fluctuations with vertical wavelengths shorter than about 10 km to gravity waves (e.g., Tsuda et al., 2000; de la Torre et al., 2006; Gavrilov, 2007). Scale separation in vertical direction works well in the wintertime polar lower stratosphere where vertical wavelengths of planetary waves are quite long, while those of gravity waves are usually much shorter. However, this approach has its shortcomings in the tropics where planetary-scale equatorial wave modes and gravity waves generally have similar vertical wavelengths (e.g., Ern et al., 2008; Ern et al., 2014). Another general problem is that, by introducing a strong low-pass for vertical wavelengths, the remaining spectral range of gravity waves is considerably narrowed down.
Different from this, much of the vertical wavelength spectrum of gravity waves can be preserved if scale separation in the horizontal direction is utilized. Our approach of horizontal scale separation was introduced in Ern et al. (2011) and (2013). This approach aims at explicitly describing even day-to-day variations of the atmospheric background due to short-period traveling planetary waves, which is particularly important for investigating the gravity wave distribution in the tropics or in the mesosphere, but could also be relevant in the wintertime polar vortex because of its rapid temporal variations (e.g., Ern et al., 2016).
The procedure utilized in our study for extracting small-scale temperature fluctuations due to gravity waves from observed altitude profiles requires several steps. First, the zonal-average background temperature is subtracted from each altitude profile of observed temperature. To estimate the contribution of planetary waves we calculate 2-D spectra in longitude and time for overlapping time windows of 31-day length and a set of fixed latitudes and altitudes (Ern et al., 2011). Based on these spectra, the temperature perturbation due to planetary waves with zonal wavenumbers 1–6 and periods longer than about 1–2 days is calculated for the exact location and time of each observation in each altitude profile, and also subtracted. In this way, we even account for short-period planetary waves that can have periods as short as a few days, such as fast Kelvin waves in the tropics (e.g., Ern et al., 2008, 2009), quasi 2-day waves in the mesosphere (see also Ern et al., 2013), or short-period planetary waves in the wintertime polar regions (e.g., Ern et al., 2009; Ern et al., 2016). To remove tides, we utilize the fact that for satellites in slowly precessing low Earth orbits the ascending and descending nodes, respectively, are at about fixed local times. For HIRDLS, the local time does not change much during the mission, while for SABER the orbital plane slowly precesses (a full cycle is about 120 days). Consequently, tides will appear as stationary zonal wave patterns if data from ascending and descending nodes are taken separately. By removing these stationary wave patterns separately for ascending and descending nodes, tides can easily be removed from the observed temperature fluctuations (e.g., Preusse et al., 2001; Ern et al., 2013). In each altitude profile, we additionally remove the strongest oscillation with a vertical wavelength of 40 km or longer in order to further suppress planetary waves, as well as long vertical wavelength gravity waves that are not covered by our method of determining gravity wave amplitudes. In addition, at altitudes above 60 km very short vertical wavelength oscillations in SABER altitude profiles are removed by a low pass with a cutoff vertical wavelength of 5 km in order to remove oscillations that are presumably caused by minor retrieval artifacts in the mesopause region. On average, gravity wave vertical wavelengths are relatively long at these altitudes. Therefore, the effect of this additional filtering on the overall distribution of gravity waves should be small.
3.3 Method for determining gravity wave amplitudes, phases, and vertical wavelengths
The resulting altitude profiles of temperature residuals are analyzed with a two-step method introduced by Preusse et al. (2002). First, the whole altitude profile is analyzed by the maximum entropy method (MEM; Press et al., 1992) for identifying all vertical wavelengths present in the profile. In the second step, in a sliding 10 km vertical window amplitudes and phases are fitted by a sinusoidal fit for all vertical wavelengths found by the MEM. For each altitude, the results are sorted according to the largest (second largest, and so on) amplitude. In the current paper, we further consider the strongest component only. This assumption is also often used for other methods of analyzing temperature altitude profiles with the aim of deriving gravity wave momentum fluxes (e.g., Alexander et al., 2008). As discussed in the next subsection (Sect. 3.3.1), this assumption is a good approximation because higher-order gravity waves do not contribute much to the overall gravity wave temperature variance.
Since the MEM is performed on the whole profile, we trust also wavelengths larger than the sliding window but not larger than approximately 25 km; therefore the filtering of removing all waves of 40 km and longer is applied. The resulting sensitivity functions combining both radiative transfer and retrieval effect as well as the vertical wavelength filtering are presented in Fig. 3c and d. The combination of MEM and sinusoidal fits, in short MEM/HA (HA for harmonic analysis), combines the advantages of addressing a relatively wide part of the vertical wavelength range and a fixed analysis window length. The latter is important, for instance, when investigating regions of wind shear where the vertical wavelength is refracted and strong gradients in wave amplitude are expected.
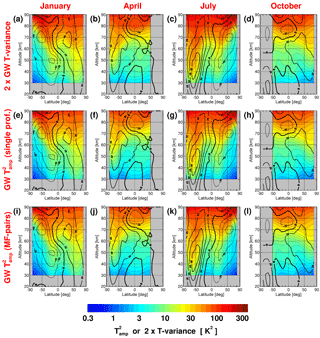
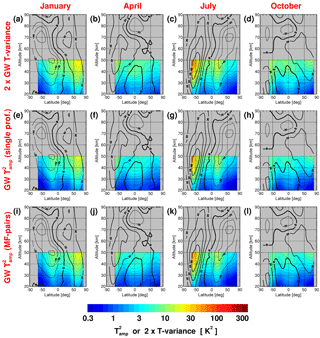
Figure 4Latitude–altitude cross sections of SABER zonal-average gravity wave temperature variances times 2 (a–d), gravity wave squared amplitudes of single altitude profiles (e–h), and gravity wave squared amplitudes of pairs of altitude profiles utilized for determination of absolute momentum fluxes (i–l). Values are for average January (a ,e, i), April (b, f, j), July (c, g, k), and October (d, h, l). Overplotted winds are from the SPARC climatology (Swinbank and Ortland, 2003; Randel et al., 2002, 2004). Westward (eastward) winds are indicated by dashed (solid) contour lines. The zero wind line is bold solid. The contour line increment is 20 m s−1.
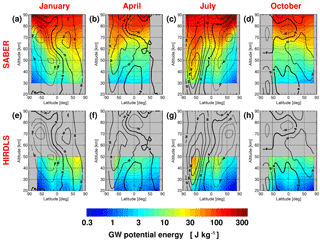
Figure 6Latitude–altitude cross sections of gravity wave potential energies calculated following Eq. (3) from gravity wave temperature variances obtained directly after background removal. SABER variances are shown in the upper row, and HIRDLS variances in the lower row. Values are for average January (a, e), April (b, f), July (c, g), and October (d, h). Overplotted winds are from the SPARC climatology (Swinbank and Ortland, 2003; Randel et al., 2002, 2004). Westward (eastward) winds are indicated by dashed (solid) contour lines. The zero wind line is bold solid. The contour line increment is 20 m s−1.
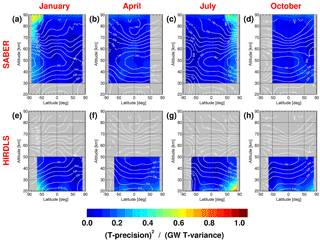
Figure 7Zonal-average cross sections of the ratio of SABER (upper) and HIRDLS (lower) temperature precision squared (random error variances) to gravity wave temperature variances after background removal. Values are for average January (a, e), April (b, f), July (c, g), and October (d, h). Overplotted temperatures are from the SPARC climatology (Randel et al., 2002, 2004). The contour line increment is 10 K.
3.3.1 Latitude–altitude cross sections of gravity wave temperature variances, squared amplitudes and potential energies
The upper row of Fig. 4 shows latitude–altitude cross sections of zonal-average gravity wave temperature variances for average January, April, July, and October determined from 13 years of SABER data (February 2002 until January 2015). This time interval was used for all SABER latitude–altitude cross sections shown in our study. Temperature variances were multiplied by a factor of 2 to make them directly comparable to zonally averaged squared amplitudes that are also shown in Fig. 4. (Averaged over one wave period, the variance due to a perfect sine wave is 0.5 times its amplitude squared.) The climatological cross sections shown in the first row of Fig. 4 represent the gravity wave temperature variances obtained directly after the removal of the atmospheric background state as described in Sect. 3.2, i.e., before the MEM/HA and the 10 km vertical windowing are applied. Overplotted contour lines represent the zonal-average zonal wind of the Stratosphere-troposphere Processes And their Role in Climate (SPARC, A core project of the World Climate Research Programme) climatology for the respective month (see also Swinbank and Ortland, 2003; Randel et al., 2002, 2004).
The dominant climatological features are an overall increase in gravity wave temperature variances with altitude, which is expected due to the decrease in atmospheric density with altitude. Further, temperature variances are particularly enhanced in the polar region during wintertime, which is caused by strong activity of orographic and polar-jet-related gravity wave sources. In addition, the strong background wind offers favorable propagation conditions (increased saturation amplitudes) for gravity waves propagating opposite to the background winds. Another enhancement of temperature variances is seen in the summertime subtropics, which is mainly caused by gravity waves excited by convective sources and favorable propagation conditions in the subtropical jets. These features are qualitatively in good agreement with several previous studies (e.g., Fetzer and Gille, 1994; Wu and Waters, 1996; Jiang et al., 2004; Alexander et al., 2008; Ern et al., 2011).
The second row in Fig. 4 shows the corresponding squared amplitudes for the strongest wave component obtained by applying the MEM/HA and 10 km vertical windowing. The distributions are almost the same as for gravity wave temperature variances times a factor of 2; only absolute values are somewhat reduced for squared amplitudes. This reduction is caused by the fact that we consider only the strongest wave component at each altitude and neglect smaller amplitude waves that will also exist (e.g., Wright and Gille, 2013). However, the contribution of those higher-order small-amplitude waves to both squared amplitudes and momentum fluxes is usually small, and their distribution is easily biased by instrument noise and other instrument effects.
As detailed in Sect. 3.4, gravity wave horizontal wavelengths and thus absolute momentum fluxes can only be determined from pairs of altitude profiles that have a short enough sampling distance and at the same time match in their gravity wave vertical wavelength (i.e., presumably observe the same gravity wave). As discussed in Geller et al. (2013), there are currently two different approaches of treating those altitude profiles that do not match in their vertical wavelength. The first method uses a cospectral analysis for determining squared temperature amplitudes (see, for example, Alexander et al., 2008). In the case of non-matching vertical wavelengths, this method returns small values of squared amplitudes and, correspondingly, small gravity wave momentum fluxes, even for cases when gravity waves in both altitude profiles of a pair have considerable amplitudes. In our work, we follow the second method mentioned in Geller et al. (2013) (see also, for example, Ern et al., 2004, 2011): in the case of matching vertical wavelengths, it is assumed that meaningful values of horizontal wavelengths can be deduced, and the average gravity wave amplitude of both profiles is used. If, however, the vertical wavelengths do not match, it is assumed that no horizontal wavelength information can be derived, and this pair of altitude profiles is just not considered for calculating gravity wave momentum fluxes.
Regarding average momentum fluxes calculated in a certain region, the first method will result in much lower average values than the second method. The second method inherently assumes that the matching pairs are representative for the average momentum flux in this region. Figs. 4 and 5 provide evidence supporting this assumption: the third row in Fig. 4 shows gravity wave squared amplitudes of those pairs of altitude profiles that are considered suitable for the determination of momentum fluxes (i.e., those pairs of altitude profiles with matching gravity wave vertical wavelength and at the same time short enough horizontal sampling distance; see also Sect. 3.4 below). As can be seen from Fig. 4, squared amplitudes considering all altitude profiles are almost exactly the same as the squared amplitudes of the pairs of altitude profiles used for momentum flux determination. This indicates that these “suitable” pairs should be still representative for the global distribution of gravity waves, because the whole number of single profiles and the reduced number of matching pairs of altitude profiles, and thus also the non-selected pairs, have almost the same distribution and magnitude of gravity wave squared amplitudes.
Figure 5 shows the same as Fig. 4 but for the HIRDLS instrument and the corresponding 3-year time period (March 2005 until February 2008). This time interval was used for all HIRDLS latitude–altitude cross sections shown in our study. SABER and HIRDLS distributions are very similar. Even the absolute values are in good agreement. Minor differences may arise from differences in the viewing geometries (different line-of-sight directions and different vertical fields of view), or from (minor) differences in the “real” instrument sensitivity functions caused by differences in the temperature retrieval.
Once gravity wave temperature variances or squared amplitudes are available, the determination of potential energies is straightforward by applying Eq. (3) for gravity wave temperature variances, or Eq. (11) for squared amplitudes. Similar to Fig. 4a–d, Fig. 6a–d show zonal-average cross sections of gravity wave potential energies calculated from SABER temperature variances for the average months of January, April, July, and October. Figure 6e–h show the same but for the HIRDLS instrument. As must be the case, the basic features of the distributions displayed in Fig. 6 are the same as in Figs. 4 and 5. Also available as part of the GRACILE gravity wave climatology are zonal-average distributions for the other average calendar months. All gravity wave potential energy values given in the climatology are calculated directly from temperature variances using Eq. (3). This means that no 10 km vertical window is applied, and values represent averages over a full wave cycle.
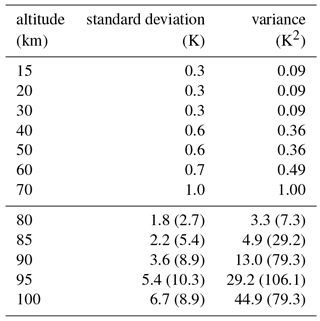
Table 2SABER temperature precision (random error) for different altitudes. Values in the upper part of the table are for local thermal equilibrium (LTE) conditions and are taken from Table 2 at http://saber.gats-inc.com/temp_errors.php. Similar values are also found in Remsberg et al. (2008), their Table 1. For higher altitudes (lower part of the table) errors are increased because the retrieval has to account for non-LTE effects, involving additional uncertainties. Values in the lower part of the table are taken from Table 2 in Remsberg et al. (2008). Values in parentheses apply for cold summer mesopause conditions.
3.3.2 Error considerations
Gravity waves appear as temperature fluctuations in observed altitude profiles. Accordingly, systematic errors of the temperature retrieval are removed by the separation into gravity wave fluctuation and background. This holds both for constant offsets as well as for offsets slowly varying with geolocation (e.g., offsets dependent on altitude or latitude). Different from this, measurement noise leads to random temperature fluctuations that will affect the estimation of gravity wave temperature variances and squared amplitudes. Estimates of the temperature precision are given, for example, by Gille et al. (2011) for HIRDLS and are also provided for each HIRDLS altitude profile together with the temperature data. Therefore, it is possible to compare HIRDLS random errors directly with the estimated gravity wave temperature variances. For SABER, the temperature precision was estimated by Remsberg et al. (2008), and values are also given on the SABER website at http://saber.gats-inc.com/temp_errors.php, last access: 18 April 2018. In Table 2 we have summarized these SABER precision estimates. In Table 2, temperature standard deviations, as well as variances (standard deviations squared), are given for “normal” midlatitude conditions, as well as for conditions of a cold summer mesopause.
In order to find out whether random errors may affect the determination of gravity wave temperature variances or amplitudes, Fig. 7 shows zonal-average cross sections of the ratio of temperature precision squared (random error variances) to gravity wave temperature variances after background removal for the average months of January (left column), April (second column), July (third column), and October (right column). The upper row is for SABER, and the lower row for HIRDLS. Overplotted contour lines in Fig. 7 represent temperatures for the respective month taken from the SPARC climatology (Randel et al., 2002, 2004).
Cross sections for each average calendar month are provided as part of the GRACILE gravity wave climatology. For the climatology, SABER random error variances for cold mesopause conditions are adopted for those latitudes and months when these conditions are approximately expected, i.e., south of 50∘ S for the months of November until February (around austral summer), and north of 50∘ N for the months of May until August (around boreal summer). For the respective winter hemisphere and latitudes equatorward of 40∘, “normal” random error variances are assumed. In order to avoid jumps in the random error variances, a smooth transition is introduced between cold summer mesopause values poleward of 50∘ in the respective summer hemisphere and “normal” values starting at 40∘. For all other months “normal” random error variances are assumed for SABER.
For HIRDLS the precision (random error) predicted by the retrieval algorithm is provided together with each retrieved temperature profile. As stated in Gille et al. (2011), these theoretical values should be an upper estimate because the temperature precision estimated directly from retrieved HIRDLS temperature profiles in regions of low atmospheric variability (“measured precision”) is better than the theoretical estimate by about a factor of 2 over a larger altitude range (Gille et al., 2011, their Fig. 5.1.3). Determining the “measured precision” is possible only in regions where little atmospheric variability, in particular little activity of gravity waves, is expected. Therefore, for the HIRDLS values shown in Fig. 7, as well as for the values provided together with the gravity wave climatology, we used values of the predicted HIRDLS precision (standard deviation) divided by 2 in order to approximately match the measured precision in Gille et al. (2011).
Error estimates are, of course, uncertain to some degree and we here compare zonal mean values of gravity wave temperature variances, which are averages over strong and weak gravity wave events. Therefore even in regions where on average the fraction of noise is very small, noise may still influence the results via the weak events to some degree. On the other hand, we are using the strongest component only, which suppresses noise in the presence of a real wave.
As can be seen from Fig. 7, gravity wave temperature variances usually are well above the noise level. There are only two exceptions: the summertime high latitudes in the lower and middle stratosphere, and the cold summer mesopause region. In particular, in the summer mesopause region considerable biases should be expected. In this region, the temperature precision is about 7 K, which corresponds to about 50 % of the estimated variances in Fig. 4a and c. Therefore, gravity wave temperature variances and squared amplitudes, potential energies, and momentum fluxes will be high-biased. This has already been pointed out by Ern et al. (2011): in this region their wave analysis showed phase differences between pairs of altitude profiles that were indicative of an enhanced noise level.
The results shown in the lower row of Fig. 7 confirm the results of Gille et al. (2011). By assuming that the HIRDLS precision is better by a factor of 2 than the predicted precision, it is avoided that the ratio shown in Fig. 7, lower row, exceeds the value of 1. This should not be possible because our values of “gravity wave temperature variances” should contain the contributions of both gravity waves (i.e., true atmospheric variability) and measurement noise. Further, it is unlikely that the HIRDLS precision should be much worse than the SABER precision, which would be the case if we would assume the predicted precision without division by 2.
3.4 Estimation of gravity wave absolute momentum fluxes
3.4.1 Method
As mentioned in Sect. 3.3, the results of the MEM/HA method are altitude profiles of gravity wave amplitudes, vertical wavelengths and phases. To estimate gravity wave momentum fluxes, the horizontal wavelength λh of an observed gravity wave has to be estimated (see Eq. 9).
From limb sounding instruments with only one single measurement track, the horizontal wavelength along the orbital track can be estimated from the phase differences dϕ between subsequent altitude profiles at fixed altitude levels (Ern et al., 2004), provided that the same wave event is observed in both altitude profiles:
with Δx the along-track sampling step.
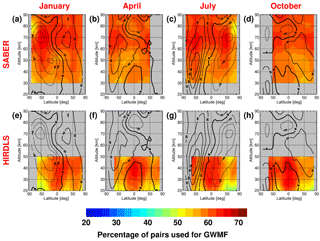
Figure 8Latitude–altitude cross sections of zonal-average percentages of short-distance pairs of altitude profiles used for determining absolute momentum fluxes (i.e., with matching vertical wavelengths) with respect to the total number of short-distance pairs of altitude profiles. Shown are multi-year averages for SABER and HIRDLS for the months of January (a, e), April (b, f), July (c, g), and October (d, h). Overplotted winds are from the SPARC climatology (Swinbank and Ortland, 2003; Randel et al., 2002, 2004). Westward (eastward) winds are indicated by dashed (solid) contour lines. The zero wind line is bold solid. The contour line increment is 20 m s−1.
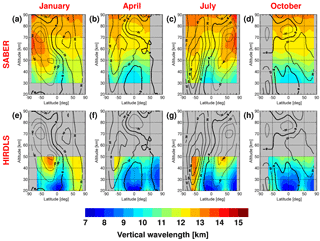
Figure 9Latitude–altitude cross sections of zonal-average gravity wave vertical wavelengths from single altitude profiles. Values are in kilometers. Shown are multi-year averages for SABER (a–d) and HIRDLS (e–h) for the months of January (a, e), April (b, f), July (c, g), and October (d, h). Overplotted winds are from the SPARC climatology (Swinbank and Ortland, 2003; Randel et al., 2002, 2004). Westward (eastward) winds are indicated by dashed (solid) contour lines. The zero wind line is bold solid. The contour line increment is 20 m s−1.
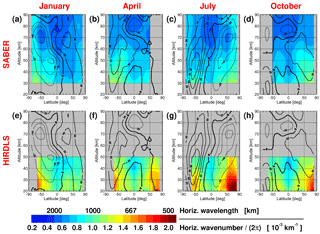
Figure 10Latitude–altitude cross sections of zonal-average gravity wave horizontal wavenumbers kh∕(2π) (i.e., average reciprocal horizontal wavelengths) from those pairs of altitude profiles that are also used to calculate momentum fluxes. Values are in 10−3 km−1. Shown are multi-year averages for SABER (a–d) and HIRDLS (e–h) for the months of January (a, e), April (b, f), July (c, g), and October (d, h). Overplotted winds are from the SPARC climatology (Swinbank and Ortland, 2003; Randel et al., 2002, 2004). Westward (eastward) winds are indicated by dashed (solid) contour lines. The zero wind line is bold solid. The contour line increment is 20 m s−1.
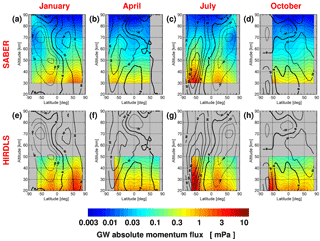
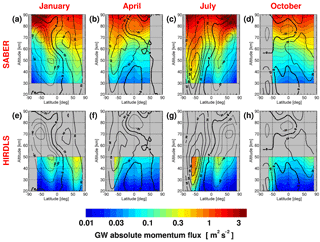
Figure 11Latitude–altitude cross sections of zonal-average gravity wave absolute momentum fluxes in mPa. Shown are multi-year averages for SABER (a–d) and HIRDLS (e–h) for the months of January (a, e), April (b, f), July (c, g), and October (d, h). Overplotted winds are from the SPARC climatology (Swinbank and Ortland, 2003; Randel et al., 2002, 2004). Westward (eastward) winds are indicated by dashed (solid) contour lines. The zero wind line is bold solid. The contour line increment is 20 m s−1.
Current-day limb sounders can observe waves which have shorter horizontal wavelengths than properly resolved by the sampling distance along the orbit track. In spite of this undersampling of short horizontal wavelength waves, average values of horizontal wavelengths are still meaningful if the sampling distance for such pairs of altitude profiles is shorter than about 300 km (e.g., Ern et al., 2011; McDonald, 2012). Both HIRDLS and SABER perform altitude scans of the atmosphere, first top–down, then bottom–up, and so on. For SABER this leads to a roughly triangular scan and varying distance for different altitudes: in the stratosphere and mesosphere the distance between two consecutive scans is less than 300 km for a pair of top–down/bottom–up scans and larger than 600 km for a pair of bottom–up/top–down scans. Only the shorter distance is used. For HIRDLS the distance between two consecutive scans is about 90 km in both cases.
Apart from horizontal sampling considerations, a gravity wave has to be observed quasi-instantaneously in order to avoid phase progression due to the wave frequency ω. However, this is not a limiting factor because for HIRDLS and SABER the time needed to observe a short-distance pair of altitude profiles is 1 min or less, i.e., much shorter than the the period given by the buoyancy frequency N.
We assume that the same wave is observed in both profiles of a short-distance pair, if the vertical wavelengths of the strongest gravity wave observed at a given altitude in these two profiles agree within 40 %, i.e., about the error margin of the vertical wavelength determination by the MEM/HA method (see also Preusse et al., 2002; Ern et al., 2011). This is the case for about 60 % of all short-distance pairs. Latitude–altitude cross sections of zonal-average percentages of “used pairs” (i.e., those short-distance pairs with matching vertical wavelengths) relative to the number of “potentially useful pairs” (i.e., the total number of short-distance pairs) are given in Fig. 8 for SABER (upper) and HIRDLS (lower) for the climatological average months of January, April, July, and October.
Pairs of altitude profiles with non-matching vertical wavelengths are disregarded. In this way, about 40 % of all pairs that are potentially useful for determining momentum fluxes are omitted. Nevertheless, the distributions of gravity wave squared amplitudes are almost the same for single profiles and the pairs suitable for calculating momentum fluxes (cf. Sect. 3.3.1 and Figs. 4 and 5). This strongly indicates that the “suitable” pairs are still representative for the global distribution of gravity waves.
From pairs of altitude profiles, however, only 2-D information is provided. In particular, the propagation direction of an observed gravity wave remains unknown, and only absolute gravity wave momentum fluxes can be determined from single-track limb sounders like HIRDLS and SABER.
3.4.2 Latitude–altitude cross sections of vertical wavelengths and horizontal wavenumbers
Vertical wavelengths and horizontal wavenumbers are needed to determine gravity wave momentum fluxes. Therefore, next we will investigate zonal-average cross sections of these parameters. Further, these distributions can be useful for comparison with the distributions that are obtained for gravity waves that are resolved by high-resolution atmospheric models.
Vertical wavelengths
Figure 9 shows latitude–altitude cross sections of zonal-average gravity wave vertical wavelengths determined from all single altitude profiles. The different columns in Fig. 9 represent the different average calendar months of (from left to right) January, April, July, and October. For SABER (upper), averages are determined from the period February 2002 until January 2015, and for HIRDLS (lower) from the period March 2005 until February 2008.
There are two main features that shape the zonal-average distribution of vertical wavelengths. (See also the discussion in Ern et al., 2011.) First, there is a general increase in vertical wavelengths with altitude. This is as expected, because for mid-frequency gravity waves the gravity wave saturation amplitude is proportional to the vertical wavelength λz of the wave (e.g., Preusse et al., 2006):
As mentioned earlier, the amplitude of a conservatively propagating gravity wave will increase with altitude because of the decrease in atmospheric density with altitude. Due to their smaller saturation amplitude, short vertical wavelength gravity waves will therefore saturate at lower altitudes, such that, with increasing altitude, long vertical wavelength gravity waves will more and more dominate the global distribution (e.g., Fritts and VanZandt, 1993; Gardner, 1994).
At low altitudes, it is therefore expected that vertical wavelengths will be shorter on average. This is also seen in Fig. 9 for both HIRDLS and SABER. However, at low altitudes vertical wavelengths for HIRDLS are usually even shorter than for SABER, except inside the jet streams. This effect is caused by the narrower HIRDLS vertical field of view that allows HIRDLS to detect also somewhat shorter vertical wavelength gravity waves than SABER (for the HIRDLS and SABER sensitivity functions see also Fig. 3).
The second effect that shapes the zonal-average distribution of vertical wavelengths is that vertical wavelengths are particularly increased when the background wind is strong. Gravity waves propagating in the direction opposite to the background wind will be Doppler-shifted toward longer vertical wavelengths. These waves can attain larger saturation amplitudes, and will therefore dominate the gravity wave spectrum in these regions. See also the discussion in Ern et al. (2015) and references therein.
As expected, this effect is seen in Fig 9 for both instruments. In regions where vertical wavelengths are quite long, we find that HIRDLS vertical wavelengths can be even somewhat longer than SABER values. This could be an effect of the characteristics of the “real” HIRDLS and SABER sensitivity functions including radiative transfer and temperature retrieval which will deviate from the theoretical sensitivity functions shown in Fig. 3 (cf. Sect. 3.1). These deviations can be quite substantial, as has been shown, for example, by Preusse et al. (2002). Apart from these systematic differences, the uncertainty of our vertical wavelength determination by the MEM/HA method is about 20 % as has been estimated by Preusse et al. (2002).
Horizontal wavenumbers
Different from vertical wavelengths, horizontal wavelengths can attain quite large values of a few thousand kilometers. Showing average horizontal wavelengths would therefore overemphasize those values that do not contribute much to average momentum fluxes and that therefore are not representative for the average distribution of gravity wave momentum fluxes. This is why in the following we choose to present average horizontal wavenumbers in terms of reciprocal horizontal wavelengths, similar to in Ern et al. (2011).
Similarly to Fig. 9, Fig. 10 shows zonal-average distributions of kh∕(2π), i.e., reciprocal horizontal wavelengths, for SABER (upper) and HIRDLS (lower). Again, the different columns represent different calendar months. Please note that horizontal wavenumbers derived from HIRDLS and SABER will be low biased because only the apparent horizontal wavelength λh,%AT in the direction parallel to the satellite measurement track can be estimated (see also Fig. 2).
The most salient feature of the zonal-average distribution of kh∕(2π) is reduced values at low latitudes. This effect is caused by the fact that in the tropics the Coriolis parameter is smaller; i.e., there is more space between the two limitations of the Coriolis parameter and the buoyancy frequency and longer horizontal wavelength gravity waves can exist. For a more detailed discussion see also Preusse et al. (2006), their Sect. 3.3. Similar reductions of horizontal wavenumbers at low latitudes have been found, for example, by Wang et al. (2005) using radiosonde data, i.e., a different measurement technique.
The main difference between the horizontal wavenumber distributions of HIRDLS and SABER is that, on average, SABER horizontal wavenumbers are generally lower than those estimated for HIRDLS. Likely reason is the coarser SABER horizontal sampling along-track, which will lead to stronger aliasing of horizontal wavelengths that is caused by an undersampling of the short horizontal wavelength part of the gravity wave spectrum. For a further discussion of aliasing effects see Sect. 3.1 and the discussion in Ern et al. (2004, 2011).
There is also a decrease in horizontal wavenumbers with altitude. This is most obvious for the SABER instrument that covers a larger altitude range. Partly, this decrease may be caused by the SABER sampling distance that increases with increasing altitude for the short-distance pairs of altitude profiles that are only considered here (see also Ern et al., 2011). Partly, however, this reduction in horizontal wavenumbers may also be caused by physical reasons.
If observed temperature variances are dominated by noise, it is expected that the corresponding horizontal wavenumber kh, noise in a region is given by
with Δx the horizontal sampling step-width of the instrument along the measurement track (Ern et al., 2004). For HIRDLS, the sampling step is approximately 90 km. Accordingly, we expect km−1. For SABER, Δx is in the range of about 180 to 300 km, depending on altitude. Accordingly, we expect in the range between km−1 at 30 km altitude and km−1 at 90 km altitude.
As we can see in Fig. 10, for SABER these values are approximately reached in the summer mesopause region, and at high latitudes of the summer hemisphere in the middle stratosphere. Similarly, for HIRDLS values close to are reached also at high latitudes of the summer hemisphere in the lower and middle stratosphere. As can be seen from Fig. 7, in the same regions we find an enhanced ratio of measurement noise estimates to gravity wave temperature variances. This finding indicates that, indeed, in these regions gravity wave distributions will be generally affected by measurement noise. Consequently, also horizontal wavenumbers and vertical wavelengths, as well as absolute momentum fluxes, in these regions will not be very reliable.
Apart from this, horizontal wavenumbers of limb sounders with only a single measurement track are generally low-biased, which is one of the main error sources when calculating absolute gravity wave momentum fluxes. Only the apparent horizontal wavelength λh, AT of a gravity wave in the direction parallel to the measurement track can be determined, which will usually overestimate the true horizontal wavelength of the wave (see also Fig. 2). More discussion of this effect is given, for example, in Preusse et al. (2009a), Alexander (2015), or Ern et al. (2017). Estimates by Ern et al. (2017) that are based on 3-D temperature data of the nadir scanning Atmospheric Infrared Sounder (AIRS) satellite instrument indicate a low bias of along-track horizontal wavenumbers by a factor between 1.5 and around 2, which is qualitatively in good agreement with values estimated by Alexander (2015). Generally, however, it is difficult to provide more reliable estimates of this uncertainty.
3.4.3 Latitude–altitude cross sections of absolute momentum fluxes
Latitude–altitude cross sections of SABER and HIRDLS zonal-average gravity wave absolute momentum fluxes are shown in Fig. 11. Distributions represent the average calendar months of January, April, July, and October. Averages for SABER (upper) are over 13 years (February 2002 until January 2015), and for HIRDLS (lower) over 3 years (March 2005 until February 2008). It should be noted that, in our work, gravity wave momentum fluxes are generally calculated as averages over values obtained point by point from pairs of altitude profiles with their individual values of gravity wave amplitudes, vertical wavelengths, and horizontal wavenumbers. Consequently, these average momentum fluxes will be different from values that would be obtained by just combining average values of gravity wave amplitudes, vertical wavelengths, and horizontal wavenumbers like those previously shown, for example, in Figs. 4, 5, 9, and 10.
Like for gravity wave temperature variances or squared amplitudes (see Sect. 3.3.1), enhancements of momentum fluxes are seen in the wintertime polar regions, and in the summertime subtropics. In contrast to temperature variances and squared amplitudes, however, there is a general decrease in momentum fluxes with altitude, which indicates that there is an overall dissipation of gravity waves with altitude. This observed decrease, however, is stronger than that usually found in GCMs/CCMs (Geller et al., 2013), which is an issue that is still not fully understood.
Sometimes observed vertical gradients of absolute momentum fluxes can provide useful information about the effect of gravity waves on the background winds. This is the case when gravity waves encounter critical levels in regions of strong vertical gradients of the background wind, or when those strong vertical gradients lead to enhanced breaking of gravity waves (e.g., Ern et al., 2011; Ern et al., 2013, 2014, 2015, 2016).
Figure 12 shows the same as Fig. 11 but in units of m2 s−2, i.e., following Eq. (9) but without the factor . These values are also shown because they are useful for comparison with, for example, radars that determine gravity wave momentum fluxes from observed wind fluctuations. Without the density factor, momentum fluxes gradually increase with altitude, similar to gravity wave potential energies, temperature variances, or temperature squared amplitudes.
Generally, HIRDLS values of gravity wave momentum flux are somewhat higher in the polar vortices. One possible reason is that in these regions average horizontal wavelengths are relatively short (cf. Fig. 10). Accordingly, the better HIRDLS along-track sampling will lead to reduced aliasing effects compared to SABER and result in higher momentum fluxes.
3.4.4 Error considerations
As already indicated by the uncertainty of the horizontal wavelengths entering Eq. (9) (cf. Sect. 3.4.1), the uncertainty of HIRDLS and SABER absolute momentum fluxes is large, at least a factor of 2. A more detailed error discussion is given in Ern et al. (2004). However, due to the large uncertainties involved, it does not make much sense to provide a more sophisticated discussion of errors, here.
From the 2-D information available from single-track limb sounders like HIRDLS or SABER it is only possible to provide estimates of absolute gravity wave momentum fluxes. Directional information can only be obtained from multiple (i.e., three or more) soundings of the same wave providing 3-D information (e.g., Wang and Alexander, 2010; Lehmann et al., 2012; Faber et al., 2013; Riese et al., 2005, 2014; Preusse et al., 2009a, 2014; Alexander, 2015; Ern et al., 2017; Krisch et al., 2017; Song et al., 2017a, b).
Generally, uncertainties in gravity wave parametrizations and in our understanding of the effect of gravity waves in the atmosphere are still quite large. Therefore, in spite of their large uncertainties, absolute momentum fluxes have been used and will continue to be very useful for improving global models by providing a better understanding of gravity wave effects, as well as by providing better constraints for gravity wave parametrizations (see also Sect. 1). In particular, uncertainties can be considerably reduced if effects of the observational filter are simulated and included in comparisons with model data (e.g., Trinh et al., 2015, 2016).
As pointed out by Trinh et al. (2015, 2016), the following main effects have to be taken into account for comparisons between measurements and models: (a) sensitivity of the instrument for an observed gravity wave in dependence of the vertical wavelength and the apparent horizontal wavelength λh, LOS along the instrument line of sight, (b) projection of the horizontal wavelength on the tangent point track, (c) the effect of aliasing due to horizontal undersampling of waves, (d) the vertically slanted sampling path for calculating the observed vertical wavelength, (e) selection criteria for pairs of altitude profiles for the calculation of momentum fluxes.
In the previous sections latitude–altitude cross sections of gravity wave temperature variances, squared amplitudes, potential energies, vertical wavelengths, horizontal wavenumbers, and momentum fluxes were already presented. In this section, we describe how the data were gridded from observed altitude profiles into global maps and zonal-average cross sections, and which data sets are available in the GRACILE gravity wave climatology.
4.1 Parameters available
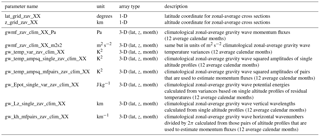
Based on single altitude profiles, the data available are gravity wave temperature variances, gravity wave squared amplitudes and potential energies, as well as vertical wavelengths. For the “suitable” pairs of altitude profiles that are used for calculating momentum fluxes (cf. Sect. 3.4), gravity wave squared amplitudes, horizontal wavenumbers divided by 2π, and absolute momentum fluxes are provided. Temperature variances and squared amplitudes are given in K2, and momentum fluxes are given in Pa, as well as in m2 s−2, i.e., without the density factor. Vertical wavelengths and horizontal wavenumbers divided by 2π are given in km and km−1, respectively. To obtain climatological data sets, we interpolate the data of the single altitude profiles and of the “suitable” pairs on regular grids, resulting in climatological global distributions, as well as climatological latitude–altitude cross sections. Further, time series of monthly zonal averages are provided for some parameters. More details and some examples are given in the following subsections. A full list of parameters available in the GRACILE gravity wave climatology, as well as a short description, are given in Tables 3 and 6. The data are provided in Network Common Data Format (NetCDF) in the climatology data file available at the PANGAEA open-access world data center under https://doi.org/10.1594/PANGAEA.879658.
Table 3Zonal-average cross sections of gravity wave parameters provided in the GRACILE gravity wave climatology data file. In the parameter names “XX” is to be replaced by either “SABER” or “HIRDLS”. Grid points not covered by data are flagged with −999. In addition to the climatological distributions listed in the table, also distributions of maximum and minimum monthly values are given. These distributions are named “_clim_max” and “_clim_min” (instead of just “_clim”).
4.2 Gridding of climatological global distributions
In order to obtain global distributions, for a fixed altitude the data of the single months are distributed into a set of longitude latitude bins, and averaged. For HIRDLS, the extent of these bins is 15∘ longitude × 5∘ latitude, and average values are attributed to the center longitude and latitude of each bin. The longitude and latitude steps used for the bin centers are 5 and 2.5∘, respectively, i.e., the bins are overlapping. According to the fewer data available, for SABER larger bins of 30∘ longitude times 20∘ latitude, and longitude and latitude steps of 10 and 5∘, respectively, were chosen.
A monthly mean value assigned to a gridbox equals the total of all values within this gridbox divided by the number of all data points within the gridbox. Each “paired observation” is treated as a new data point, and the center coordinates between the two single observations that contribute to this paired observation are taken as the new coordinates for the pair, i.e., we assign new coordinates in latitude, longitude and time to the pair. In this way, ambiguities are avoided at the cost of creating a new set of coordinates.
In this way, we obtain monthly global maps. To obtain the “typical” global distribution for each calendar month, these global maps are averaged separately for each calendar month. For SABER, 13 years of data are averaged (February 2002 until January 2015), and for HIRDLS, 3 years (March 2005 until February 2008). In the GRACILE gravity wave climatology, average global maps are provided from 30 to 90 km in steps of 10 km for SABER, and from 30 to 50 km in steps of 10 km for HIRDLS.
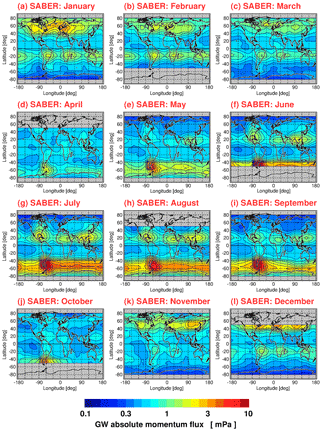
Figure 13Global distributions of gravity wave absolute momentum fluxes at 30 km altitude. Shown are 13-year averages for SABER for each calendar month.
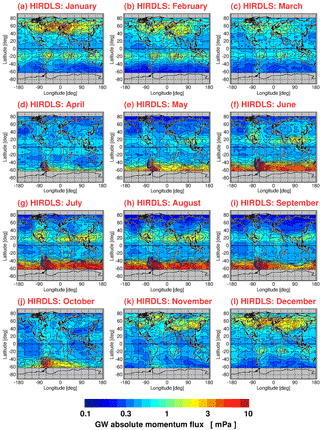
Figure 14Same as Fig. 13 but for 3-year averages of the HIRDLS instrument at 30 km altitude.
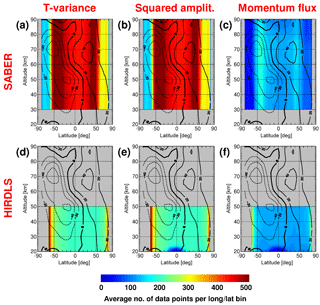
Figure 15Latitude–altitude cross sections of the number of values per long/lat bin used for global maps, zonally averaged for the average month of January. Shown are multi-year averages for SABER (a, b, c) and HIRDLS (d, e, f) for average global maps of gravity wave temperature variances (a, d), squared amplitudes (b, e), and absolute momentum fluxes (c, f). Overplotted winds are from the SPARC climatology (Swinbank and Ortland, 2003; Randel et al., 2002, 2004). Westward (eastward) winds are indicated by dashed (solid) contour lines. The zero wind line is bold solid. The contour line increment is 20 m s−1.
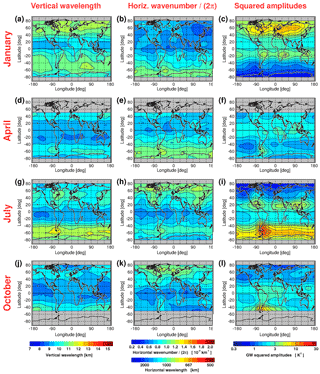
Figure 16Global distributions of SABER 13-year average gravity wave vertical wavelengths (a, d, g, j), horizontal wavenumbers kh∕(2π) (b, e, h, k), and squared amplitudes (c, f, i, l) for different calendar months at 30 km altitude.
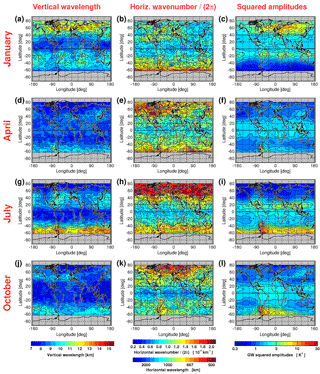
Figure 17Global distributions of HIRDLS 3-year average gravity wave vertical wavelengths (a, d, g, j), horizontal wavenumbers kh∕(2π) (b, e, h, k), and squared amplitudes (c, f, i, l) for different calendar months at 30 km altitude.
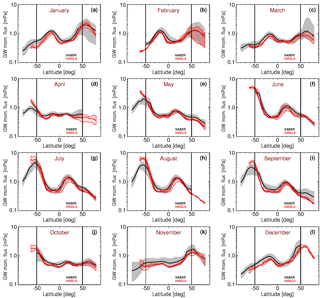
Figure 18Zonal-average gravity wave momentum fluxes at 30 km altitude. Shown are climatological averages for each calendar month (solid lines), as well as shaded envelopes that indicate the range of natural variability during the respective time period considered. SABER values are in black, and HIRDLS values are in red. The climatological averages are 13-year averages for SABER, and 3-year averages for HIRDLS, separately for each calendar month. Vertical lines at 50∘ S and 50∘ N indicate that only latitudes equatorward of 50∘ are continuously covered by SABER.
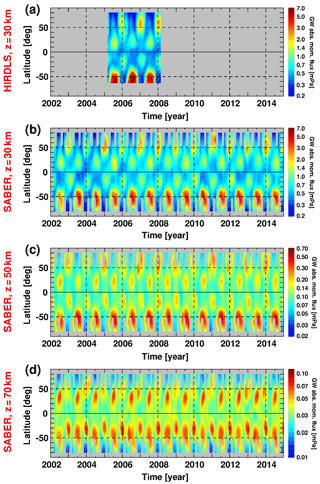
Figure 19Time series of monthly zonal-average gravity wave absolute momentum fluxes at 30 km altitude for (a) HIRDLS and (b) SABER, as well as for SABER at (c) 50 km and (d) 70 km altitude. Values are in mPa on logarithmic scales.
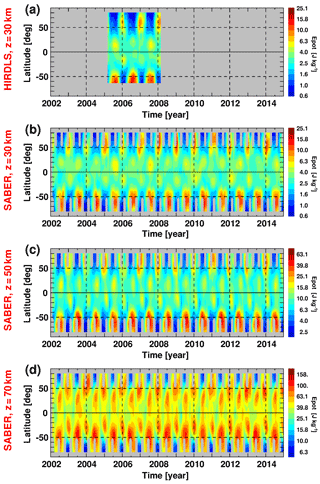
Figure 20Same as Fig. 19 but for gravity wave potential energy in J kg−1 on logarithmic scales.
Absolute gravity wave momentum fluxes
As an example, climatological distributions of gravity wave absolute momentum fluxes are shown in Figs. 13 and 14 for SABER and HIRDLS, respectively, at an altitude of 30 km for each average calendar month.
Although the averages for SABER and HIRDLS are based on a different number of years for averaging, the distributions shown in Figs. 13 and 14, respectively, are very similar with enhanced values in the wintertime polar vortex and with the characteristic longitudinal structure in the summertime subtropics that is caused by the characteristic distribution of convective gravity wave sources. In the Southern Hemisphere, during the months of April to October the region of the Southern Andes and the Antarctic Peninsula stands out. This region is known as a pronounced source of mountain waves (e.g., Eckermann and Preusse, 1999). Of course, due to the better sampling of the HIRDLS instrument, for HIRDLS a finer longitude/latitude binning of the data is possible, allowing for a better horizontal resolution of the global distribution.
Next, we discuss the statistics of data points that are used for creating global maps of different gravity wave parameters. The number of data points available for the longitude/latitude bins depends on the bin size, the temporal coverage, as well as on the process of pair selection for calculating momentum fluxes.
As an example, Fig. 15 shows zonal-average cross sections of the average number of data points that enter the longitude/latitude bins used for gridding the global distributions for the typical month of January. The upper row is for SABER, and the lower row for HIRDLS. The left column displays the number of data points obtained for gravity wave temperature variances (i.e., before applying the 10 km vertical window of the MEM/HA method). As can be seen, the number of data points is generally still quite high. Please note that SABER uses larger long/lat bins, resulting in a quite high number of data points per bin at mid and low latitudes. During January, however, SABER covers high latitudes only during part of the month, and the number of data points per long/lat bin is strongly reduced.
The middle column of Fig. 15 shows the average number of data points per long/lat bin obtained for gravity wave amplitudes of single altitude profiles. This number is basically the same as in the left column, with the exception that for HIRDLS the numbers are strongly reduced at low latitudes and low altitudes. This is the case because at these altitudes a number of altitude profiles have to be omitted in the tropics because limb radiances are cloud contaminated. Please note that for vertical profiles of gravity wave amplitudes the 10 km vertical window is used. This means, for example, that for values displayed at an altitude of 20 km HIRDLS observations of altitudes as low as 15 km are utilized. Consequently, global distributions at 20 km will be less reliable and contain data gaps. Therefore, in the GRACILE climatology global distributions are only provided at 30 km and above. Zonal averages for HIRDLS are considered more robust and are provided starting from 20 km as the lowest altitude. Still, at altitudes close to 20 km zonal averages could be biased. For SABER, in order to avoid effects of cloud-contaminated radiances, we generally provide only values at altitudes of 30 km and above.
In the right column of Fig. 15 the average number of data points per long/lat bin used for obtaining gravity wave absolute momentum fluxes is shown, i.e., the number of “suitable” pairs. As mentioned in Sect. 3.4.1, the number of data points is strongly reduced for momentum fluxes. First, because only around 60 % of pairs match in their vertical wavelengths, and, second, for SABER only every second pair has a short enough along-track sampling distance to be used for the determination of momentum fluxes. Particularly at high latitudes the SABER average distributions in the “odd” months, i.e., when the SABER viewing geometry changes between northward view and southward view, will therefore not be very robust.
It should be noted that the satellite sampling geometry leads to local enhancements of the measurement density at the northernmost and southernmost latitudes of the global coverage. For HIRDLS, this leads to an enhanced measurement density at around 63∘ S and 80∘ N. For SABER those enhancements are located around 50∘ S and 80∘ N for northward viewing periods, and around 80∘ S and 50∘ N for southward viewing periods. During January, SABER switches between northward and southward view. Therefore, in Fig. 15 for SABER enhancements of the measurement density occur at 80∘ S, 50∘ S, 50∘ N, and 80∘ N. However, because SABER observes high latitudes only during part of the month, the measurement density at high latitudes is generally reduced and the enhancements at 80∘ S and 80∘ N are not well visible in Fig. 15.
Gravity wave vertical wavelengths and horizontal wavenumbers
As another example, Fig. 16 shows, at an altitude of 30 km, average horizontal distributions of gravity wave vertical wavelengths (left column), gravity wave horizontal wavenumbers kh∕(2π) (middle column), and gravity wave squared amplitudes for the SABER instrument. The different rows in Fig. 16 represent the different calendar months (from top to bottom) of January, April, July, and October. Again, horizontal wavenumbers represent those pairs of altitude profiles that are also used to calculate gravity wave momentum fluxes. Vertical wavelengths and squared amplitudes were derived from all single altitude profiles. Figure 17 shows the same as Fig. 16 but for the HIRDLS instrument.
As expected, vertical wavelengths are longest at mid and high latitudes where the background wind is strongest, particularly in January at high northern latitudes, and in July at high southern latitudes.
Similarly, low horizontal wavenumbers are generally found at low latitudes but for different physical reasons (see the discussion in Sect. 3.4.2). In addition, the horizontal wavenumber distribution displays several enhancements of high wavenumbers that are related to specific gravity wave source regions.
For example, horizontal wavenumbers are enhanced over the Southern Andes and the Antarctic Peninsula, a region that is known for strong activity of mountain waves. Further, in the summer hemisphere subtropics enhanced horizontal wavenumbers are found in those regions that are known for deep convection as a strong source of gravity waves (see also Ern and Preusse, 2012).
As was already indicated in the zonal averages displayed in Fig. 10, horizontal wavenumbers are close to the value kh, noise in regions of the respective summer hemisphere where gravity wave squared amplitudes (right column) are quite low. Again, this indicates that gravity wave parameters in these regions will not be very reliable.
4.3 Natural variability: minimum and maximum distributions
In order to provide an envelope of the natural variability, we also calculate for each grid point the maximum and minimum values that are attained on monthly average. These values are also given as global maps for each calendar month for all parameters supplied, i.e., gravity wave temperature variances, squared amplitudes, potential energies, and momentum fluxes, as well as vertical wavelengths and horizontal wavenumbers divided by 2π. These maximum and minimum global maps are also part of the GRACILE climatology, but are not shown. They are provided for the same altitudes as the average global maps. It should however be pointed out that these maximum and minimum distributions should not be interpreted as “characteristic” global distributions because features may just shift from year to year in the monthly global distributions, thereby producing patterns in the climatological maximum and minimum distributions that are not seen in single years. Such shifts are more likely to occur in the longitudinal direction, for example by shifts in the position of stationary planetary waves that modulate gravity wave activity at high latitudes during wintertime.
In our work, zonal averages for each month are obtained by zonally averaging the values of the grid points in the monthly global maps. Climatological latitude–altitude cross sections for different parameters, i.e., averages over multiple years, were already shown in Sects. 3.3.1 and 3.4.5. The meridional resolution and latitude step of those cross sections is according to the grid used for the global maps: a resolution of 20∘ and a step-width of 5∘ for SABER, and a resolution of 5∘ and a step-width of 2.5∘ for HIRDLS. As a measure of natural variability, also for zonal averages maximum and minimum values are provided together with the “climatological average”.
An example of this variability is shown in Fig. 18 for absolute momentum fluxes and each climatological calendar month at 30 km altitude. The black solid and red solid lines are for SABER and HIRDLS, respectively, and represent the “climatological average”, while the corresponding shaded envelopes indicate the range of natural variability of the monthly zonal-average values for the respective calendar month. The borders of these envelopes represent the maximum or minimum monthly zonal-average value, respectively, that is attained in the multi-year data sets of HIRDLS and SABER, respectively, for a given calendar month.
The latitude range between the two vertical lines at 50∘ S and 50∘ N indicates the latitude range that is continuously observed by SABER. Consequently, SABER values poleward of these lines will be less robust and less representative of typical conditions during the respective month.
As expected, the zonal averages display a maximum at wintertime high latitudes, related to the polar vortex, and another maximum in the summertime subtropics that is caused by convectively generated gravity waves. These distributions are similar to those shown in Geller et al. (2013). However, the distributions in Geller et al. (2013) represent a fewer number of years and just the months of January and July.
Considering an overall error of momentum fluxes of a factor of 2 or more (cf. Sect. 3.4.6), in Fig. 18 there is an overall agreement between the SABER and HIRDLS distributions, even though HIRDLS covers a shorter time period of only 3 years. There are still some offsets between SABER and HIRDLS that are mostly in the range 20 to 30 %. These offsets may be related to differences in the viewing geometries of the instruments, differences in the sampling, as well as differences in the “real” sensitivity functions of the instruments, or the different numbers of years covered.
Other differences are related to different temporal coverages at high latitudes. For example, SABER samples high northern latitudes only in late September. Therefore SABER momentum fluxes poleward of 50∘ N are closer to October conditions, i.e., somewhat enhanced with respect to average September conditions (cf. Fig 18i and j). Average September conditions at high northern latitudes will be better represented by HIRDLS because HIRDLS covers high northern latitudes during the whole month.
The largest variability, as seen by the widened envelopes, is seen at high northern latitudes during winter and early spring. This variability is related to sudden stratospheric warmings that introduce a strong variability of the polar vortex, and thus of zonal-average gravity wave activity (e.g., Wright et al., 2010). This effect is mainly seen in January and February poleward of about 40∘ N (see Fig. 18a and b).
There is also a large range of variability in March for SABER, but not for HIRDLS (see Fig. 18c). This effect is caused by the single year of 2011. In this year, there was an exceptionally strong and stable polar vortex with far above-average activity of gravity waves for this month (e.g., Manney et al., 2011; Ern et al., 2016).
Table 4Additional diagnostics for climatological zonal-average gravity wave parameters provided in the GRACILE gravity wave climatology data file. In the parameter names “XX” is to be replaced by either “SABER” or “HIRDLS”. Grid points not covered by data are flagged with −999. Also provided are approximate sensitivity functions. The latitude–altitude grid is the same as for the parameters listed in Table 3.
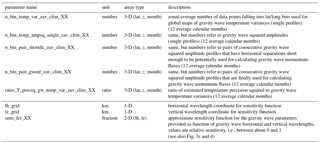
Table 5Time series of gravity wave parameter zonal-average cross sections provided in the GRACILE gravity wave climatology data file. In the parameter names “XX” is to be replaced by either “SABER” or “HIRDLS”. Grid points not covered by data are flagged with −999. The latitude–altitude grid is the same as for the parameters listed in Table 3.
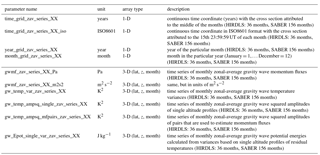
Table 6Global maps of parameters provided in the GRACILE gravity wave climatology data file. In the parameter names “XX” is to be replaced by either “SABER” or “HIRDLS”. Grid points not covered by data are flagged with −999. In addition to the climatological distributions listed in the table, also distributions of maximum and minimum monthly values are given. These distributions are named “_clim_max” and “_clim_min” (instead of just “_clim”).
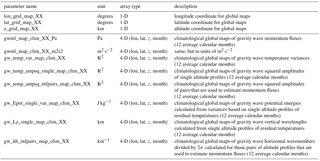
4.4 Time series of monthly zonal averages
In addition to the climatological multi-year average months that were discussed before, in the GRACILE climatology we also provide time series of monthly zonal averages for several gravity wave parameters. These time series span 13 years for SABER and 3 years for HIRDLS. An example is shown in Fig. 19 for absolute gravity wave momentum fluxes. Figure 19a and b show absolute gravity wave momentum fluxes for HIRDLS and SABER, respectively, at 30 km altitude.
As already indicated in the climatological (multi-year average) zonal-average cross sections and the climatological global distributions, HIRDLS momentum fluxes are somewhat higher than SABER values in austral winter at high southern latitudes, and somewhat lower at lower latitudes. These systematic offsets are usually on the order of ∼ 20 % and have been discussed before in Sects. 3.4.5 and 4.3. These differences, however, cannot be taken as a measure of the overall uncertainty of the values shown. As has been pointed out by Ern et al. (2004), the uncertainty of momentum flux estimates is much larger (about a factor of 2, or even more). The largest uncertainties are expected in the summertime lowermost stratosphere, and in the cold summer mesopause region (see also Sect. 3.3.2).
In addition to the time series at 30 km, Fig. 19c and d show SABER absolute gravity wave momentum fluxes at 50 km (Fig. 19c) and 70 km altitude (Fig. 19d). At altitudes of 30 and 50 km the seasonal variations are dominated by a winter maximum at high latitudes and a summer maximum in the subtropics. The wintertime maximum is related to the polar vortex, and the summertime maximum is caused by gravity waves that are excited by deep convection in the subtropics. For comparison, Fig. 20 shows the same as Fig. 19 but for gravity wave potential energies. Also in Fig. 20 the alternating pattern of maxima at wintertime high latitudes and in the summertime subtropics is evident.
This alternating pattern changes between 50 and 70 km. The subtropical maximum is shifted poleward, likely an effect of meridional propagation of gravity waves (e.g., Preusse et al., 2009b; Ern et al., 2011; Kalisch et al., 2014). In addition, the wintertime maximum that is related to the polar vortex weakens considerably. This leads to a semiannual rather than an annual variation of gravity wave absolute momentum fluxes at mid and high latitudes. These effects have been reported before by Ern et al. (2011), or Ern et al. (2013).
Weaker variations are related to the QBO and the SAO (e.g., Krebsbach and Preusse, 2007; Ern et al., 2011; Ern et al., 2014, 2015). In addition, there is a weak quasi-decadal variation (see also Ern et al., 2011). Similar quasi-decadal variations are also found in gravity wave energy densities observed by radiosondes (Li et al., 2016). These variations might be correlated with the 11-year solar cycle, however, much longer data sets would be needed for an in-depth investigation of this effect.
The GRACILE gravity wave data set is publicly available and can be downloaded from the PANGAEA open-access world data center at https://doi.org/10.1594/PANGAEA.879658. For more information on the different parameters that are provided in the GRACILE climatology see also Tables 3–6.
The satellite data used in our study are open access. HIRDLS data are freely available from the NASA Goddard Earth Sciences Data and Information Services Center (GES DISC) at http://disc.sci.gsfc.nasa.gov/Aura. SABER data are freely available from GATS Inc. at http://saber.gats-inc.com. Precision estimates for SABER temperatures are given on the SABER website at http://saber.gats-inc.com/temp_errors.php, in Remsberg et al. (2008), and they are also reproduced in our Table 2.
The SPARC temperature and zonal wind climatology is freely available at http://www.sparc-climate.org/data-center/data-access/reference-climatologies/randels-climatologies/temperature-wind-climatology/.
In this paper the global climatology GRACILE (= GRAvity wave Climatology based on atmospheric Infrared Limb Emissions observed by satellite) of gravity wave parameters in the middle atmosphere is presented. Gravity wave temperature variances, squared amplitudes, potential energies, vertical wavelengths, horizontal wavenumbers, as well as absolute momentum fluxes are derived from infrared limb soundings of the satellite instruments HIRDLS and SABER.
The GRACILE climatology consists of global maps and zonal averages for average calendar months. For HIRDLS, these averages were calculated over the 3-year period March 2005 until February 2008. For SABER, averages were calculated over the 13-year period February 2002 until January 2015. For these distributions also an envelope of minimum and maximum distributions is provided, which represents the natural variability during the time periods used for averaging. In particular, at high northern latitudes this variability can be quite strong, depending on the occurrence of sudden stratospheric warmings during boreal winters. Since it is desirable for global models not only to simulate reasonable average distributions, but also a reasonable range of natural variability, these max/min envelopes are useful for comparison with the ranges simulated by global models. To further illustrate the natural variability during the time periods considered, we also provide time series of monthly zonal averages for all parameters.
In the paper several examples of the provided data sets are given, and the main features of the distributions are briefly discussed. In addition, an error discussion is performed that gives information where the derived parameters may be less reliable. Further, some statistics are provided for the selection of pairs of altitude profiles that are used for the estimation of absolute gravity wave momentum fluxes.
Also given are approximate HIRDLS and SABER sensitivity functions for the observed gravity wave parameters. As has been pointed out in several previous studies, this sensitivity function has to be taken into account for meaningful comparisons with other observations (e.g., Preusse et al., 2000), or with global models (e.g., Ern et al., 2006; Trinh et al., 2015, 2016).
One of the main limitations of the GRACILE climatology is that only absolute momentum fluxes are available because the HIRDLS and SABER measurement tracks provide only 2-D information. For estimating the direction of momentum fluxes or net momentum fluxes real 3-D information from multiple soundings of the same wave either by different instruments (e.g., Wang and Alexander, 2010; Faber et al., 2013; Alexander, 2015; Schmidt et al., 2016), or by multiple tracks measured simultaneously by the same instrument (e.g., Riese et al., 2005, 2014; Preusse et al., 2014; Ern et al., 2017; Wright et al., 2017), would be required. Currently, however, climatological data sets of this kind are still not available from limb sounding satellite instruments.
The authors declare that they have no conflict of interest.
This work was partly supported by the Deutsche Forschungsgemeinschaft (DFG, German Research Foundation) project PR 919/4–1 (MS–GWaves/SV) which is part of the DFG researchers group FOR 1898 (MS–GWaves), as well as by the DFG project ER 474/3–1 (TigerUC) which is part of the DFG priority program SPP–1788 “Dynamic Earth”.
We thank NASA for making HIRDLS level 2 data freely available via the NASA
Goddard Earth Sciences Data and Information Services Center (GES DISC) at
http://disc.sci.gsfc.nasa.gov/Aura. SABER data were provided by GATS
Inc. and are freely available at http://saber.gats-inc.com/. The SPARC
temperature and zonal wind climatology is freely available from the
SPARC data center at
http://www.sparc-climate.org/data-center/data-access/reference-climatologies/randels-climatologies/temperature-wind-climatology/.
We would like to thank the teams of the HIRDLS and SABER instruments,
as well as the SPARC data center for creating and maintaining
the excellent data sets used in our study.
Edited by: David Carlson
Reviewed by: two anonymous referees
Alexander, M. J.: Global and seasonal variations in three-dimensional gravity wave momentum flux from satellite limb-sounding temperatures, Geophys. Res. Lett., 42, 6860–6867, https://doi.org/10.1002/2015GL065234, 2015. a, b, c, d
Alexander, M. J. and Dunkerton, T. J.: A spectral parameterization of mean-flow forcing due to breaking gravity waves, J. Atmos. Sci., 56, 4167–4182, 1999. a
Alexander, M. J. and Rosenlof, K. H.: Gravity-wave forcing in the stratosphere: Observational constraints from Upper Atmosphere Research Satellite and implications for parameterization in global models, J. Geophys. Res., 108, 4597, https://doi.org/10.1029/2003JD003373, 2003. a
Alexander, M. J., Gille, J., Cavanaugh, C., Coffey, M., Craig, C., Eden, T., Francis, G., Halvorson, C., Hannigan, J., Khosravi, R., Kinnison, D., Lee, H., Massie, S., Nardi, B., Barnett, J., Hepplewhite, C., Lambert, A., and Dean, V.: Global estimates of gravity wave momentum flux from High Resolution Dynamics Limb Sounder Observations, J. Geophys. Res., 113, D15S18, https://doi.org/10.1029/2007JD008807, 2008. a, b, c
Alexander, M. J., Geller, M., McLandress, C., Polavarapu, S., Preusse, P., Sassi, F., Sato, K., Eckermann, S. D., Ern, M., Hertzog, A., Kawatani, Y., Pulido, M., Shaw, T., Sigmond, M., Vincent, R., and Watanabe, S.: Recent developments in gravity-wave effects in climate models and the global distribution of gravity-wave momentum flux from observations and models, Q. J. Roy. Meteor. Soc., 136, 1103–1124, https://doi.org/10.1002/qj.637, 2010. a, b, c, d
Barnett, J. J., Hepplewhite, C. L., Osprey, S., Gille, J. C., and Khosravi, R.: Cross-validation of HIRDLS and COSMIC radio-occultation retrievals, particularly in relation to fine vertical structure, Proc. SPIE, 7082, 708216, https://doi.org/10.1117/12.800702, 2008. a
Beres, J. H., Alexander, M. J., and Holton, J. R.: A method of specifying the gravity wave spectrum above convection based on latent heating properties and background wind, J. Atmos. Sci., 61, 324–337, 2004. a
Bushell, A. C., Butchart, N., Derbyshire, S. H., Jackson, D. R., Shutts, G. J., Vosper, S. B., and Webster, S.: Parameterized gravity wave momentum fluxes from sources related to convection and large-scale precipitation processes in a global atmosphere model, J. Atmos. Sci., 72, 4349–4371, 2015. a
Charron, M. and Manzini, E.: Gravity waves from fronts: Parameterization and middle atmosphere response in a general circulation model, J. Atmos. Sci., 59, 923–941, 2002. a
Choi, H.-J., Chun, H.-Y., and Song, I.-S.: Gravity wave temperature variance calculated using the ray-based spectral parameterization of convective gravity waves and its comparison with Microwave Limb Sounder observations, J. Geophys. Res., 114, D08111, https://doi.org/10.1029/2008JD011330, 2009. a
Choi, H.-J., Chun, H.-Y., Gong, J., and Wu, D. L.: Comparison of gravity wave temperature variances from ray-based spectral parameterization of convective gravity wave drag with AIRS observations, J. Geophys. Res., 117, D05115, https://doi.org/10.1029/2011JD016900, 2012. a
Chun, H.-Y. and Baik, J.-J.: Momentum flux by thermally induced internal gravity waves and its approximation for large-scale models, J. Atmos. Sci., 55, 3299–3310, 1998. a
Chun, H.-Y. and Baik, J.-J.: An updated parameterization of convectively forced gravity wave drag for use in large-scale models, J. Atmos. Sci., 59, 1006–1017, 2002. a
Delisi, D. P. and Dunkerton, T. J.: Seasonal variation of the semiannual oscillation, J. Atmos. Sci., 45, 2772–2787, 1988. a
de la Cámara, A. and Lott, F.: A parameterization of gravity waves emitted by fronts and jets, Geophys. Res. Lett., 42, 2071–2078, https://doi.org/10.1002/2015GL063298, 2015. a, b
de la Torre, A., Schmidt, T., and Wickert, J.: A global analysis of wave potential energy in the lower stratosphere derived from 5 years of GPS radio occultation data with CHAMP, Geophys. Res. Lett., 33, L24809, https://doi.org/10.1029/2006GL027696, 2006. a
de la Torre, A., Alexander, P., Schmidt, T., Llamedo, P., and Hierro, R.: On the distortions in calculated GW parameters during slanted atmospheric soundings, Atmos. Meas. Tech., 11, 1363–1375, https://doi.org/10.5194/amt-11-1363-2018, 2018. a, b
Dunkerton, T. J.: The role of gravity waves in the quasi-biennial oscillation, J. Geophys. Res., 102, 26053–26076, 1997. a
Eckermann, S. D.: Explicitly stochastic parameterization of nonorographic gravity wave drag, J. Atmos. Sci., 68, 1749–1765, 2011. a
Eckermann, S. D. and Preusse, P.: Global measurements of stratospheric mountain waves from space, Science, 286, 1534–1537, https://doi.org/10.1126/science.286.5444.1534, 1999. a, b
Ern, M. and Preusse, P.: Wave fluxes of equatorial Kelvin waves and QBO zonal wind forcing derived from SABER and ECMWF temperature space-time spectra, Atmos. Chem. Phys., 9, 3957–3986, https://doi.org/10.5194/acp-9-3957-2009, 2009.
Ern, M. and Preusse, P.: Gravity wave momentum flux spectra observed from satellite in the summertime subtropics: Implications for global modeling, Geophys. Res. Lett., 39, L15810, https://doi.org/10.1029/2012GL052659, 2012. a
Ern, M., Preusse, P., Alexander, M. J., and Warner, C. D.: Absolute values of gravity wave momentum flux derived from satellite data, J. Geophys. Res., 109, D20103, https://doi.org/10.1029/2004JD004752, 2004. a, b, c, d, e, f, g, h, i, j, k
Ern, M., Preusse, P., and Warner, C. D.: Some experimental constraints for spectral parameters used in the Warner and McIntyre gravity wave parameterization scheme, Atmos. Chem. Phys., 6, 4361–4381, https://doi.org/10.5194/acp-6-4361-2006, 2006. a, b, c
Ern, M., Preusse, P., Krebsbach, M., Mlynczak, M. G., and Russell III, J. M.: Equatorial wave analysis from SABER and ECMWF temperatures, Atmos. Chem. Phys., 8, 845–869, https://doi.org/10.5194/acp-8-845-2008, 2008. a, b
Ern, M., Lehmann, C., Kaufmann, M., and Riese, M.: Spectral wave analysis at the mesopause from SCIAMACHY airglow data compared to SABER temperature spectra, Ann. Geophys., 27, 407–416, https://doi.org/10.5194/angeo-27-407-2009, 2009. a, b
Ern, M., Preusse, P., Gille, J. C., Hepplewhite, C. L., Mlynczak, M. G., Russell III, J. M., and Riese, M.: Implications for atmospheric dynamics derived from global observations of gravity wave momentum flux in stratosphere and mesosphere, J. Geophys. Res., 116, D19107, https://doi.org/10.1029/2011JD015821, 2011. a, b, c, d, e, f, g, h, i, j, k, l, m, n, o, p, q
Ern, M., Preusse, P., Kalisch, S., Kaufmann, M., and Riese, M.: Role of gravity waves in the forcing of quasi two-day waves in the mesosphere: An observational study, J. Geophys. Res.-Atmos., 118, 3467–3485, https://doi.org/10.1029/2012JD018208, 2013. a, b, c, d, e, f
Ern, M., Ploeger, F., Preusse, P., Gille, J. C., Gray, L. J., Kalisch, S., Mlynczak, M. G., Russell III, J. M., and Riese, M.: Interaction of gravity waves with the QBO: A satellite perspective, J. Geophys. Res.-Atmos., 119, 2329–2355, https://doi.org/10.1002/2013JD020731, 2014. a, b, c, d
Ern, M., Preusse, P., and Riese, M.: Driving of the SAO by gravity waves as observed from satellite, Ann. Geophys., 33, 483–504, https://doi.org/10.5194/angeo-33-483-2015, 2015. a, b, c, d, e
Ern, M., Trinh, Q. T., Kaufmann, M., Krisch, I., Preusse, P., Ungermann, J., Zhu, Y., Gille, J. C., Mlynczak, M. G., Russell III, J. M., Schwartz, M. J., and Riese, M.: Satellite observations of middle atmosphere gravity wave absolute momentum flux and of its vertical gradient during recent stratospheric warmings, Atmos. Chem. Phys., 16, 9983–10019, https://doi.org/10.5194/acp-16-9983-2016, 2016. a, b, c, d
Ern, M., Hoffmann, L., and Preusse, P.: Directional gravity wave momentum fluxes in the stratosphere derived from high-resolution AIRS temperature data, Geophys. Res. Lett., 44, 475–485, https://doi.org/10.1002/2016GL072007, 2017. a, b, c, d, e
Faber, A., Llamedo, P., Schmidt, T., de la Torre, A., and Wickert, J.: On the determination of gravity wave momentum flux from GPS radio occultation data, Atmos. Meas. Tech., 6, 3169–3180, https://doi.org/10.5194/amt-6-3169-2013, 2013. a, b
Fetzer, E. J. and Gille, J. C.: Gravity wave variance in LIMS temperatures Part I: Variability and comparison with background winds, J. Atmos. Sci., 51, 2461–2483, 1994. a, b
Fovell, R., Durran, D., and Holton, J. R.: Numerical simulations of convectively generated stratospheric gravity waves, J. Atmos. Sci., 49, 1427–1442, 1992. a
Fritts, D. C.: Gravity wave saturation in the middle atmosphere: A review of theory and observations, Rev. Geophys., 22, 275–308, 1984. a, b
Fritts, D. C. and Rastogi, P. K.: Convective and dynamical instabilities due to gravity wave motions in the lower and middle atmosphere: Theory and observations, Radio Sci., 20, 1247–1277, 1985. a
Fritts, D. C. and VanZandt, T. E.: Spectral estimates of gravity wave energy and momentum fluxes. Part I: Energy dissipation, acceleration, and constraints, J. Atmos. Sci., 50, 3685–3694, 1993. a, b, c
Fritts, D. C. and Alexander, M. J.: Gravity wave dynamics and effects in the middle atmosphere, Rev. Geophys., 41, 1003, https://doi.org/10.1029/2001RG000106, 2003. a, b, c, d, e
Fröhlich, K., Schmidt, T., Ern, M., Preusse, P., de la Torre, A., Wickert, J., and Jacobi, Ch.: The global distribution of gravity wave energy in the lower stratosphere derived from GPS data and gravity wave modelling: Attempt and challenges, J. Atmos. Sol.-Terr. Phy., 69, 2238–2248, 2007. a
Gardner, C. S.: Diffusive filtering theory of gravity wave spectra in the atmosphere, J. Geophys. Res., 99, 20601–20622, 1994. a
Gavrilov, N. M.: Structure of the mesoscale variability of the troposphere and stratosphere found from radio refraction measurements via CHAMP satellites, Izv. Atmos. Ocean. Phys., 47, 451–460, https://doi.org/10.1134/S000143380704007X, 2007. a
Geller, M. A., Alexander, M. J., Love, P. T., Bacmeister, J., Ern, M., Hertzog, A., Manzini, E., Preusse, P., Sato, K., Scaife, A. A., and Zhou, T.: A comparison between gravity wave momentum fluxes in observations and climate models, J. Climate, 26, 6383–6405, https://doi.org/10.1175/JCLI-D-12-00545.1, 2013. a, b, c, d, e
Gille, J. C., Barnett, J. J., Whitney, J., Dials, M., Woodard, D., Rudolf, W., Lambert, A., and Mankin, W.: The High Resolution Dynamics Limb Sounder (HIRDLS) experiment on Aura, Proc. SPIE, 5152, 162–171, 2003. a
Gille, J. C., Barnett, J., Arter, P., Barker, M., Bernath, P., Boone, C., Cavanaugh, C., Chow, J., Coffey, M., Craft, J., Craig, C., Dials, M., Dean, V., Eden, T., Edwards, D. P., Francis, G., Halvorson, C., Harvey, L., Hepplewhite, C., Khosravi, R., Kinnison, D., Krinsky, C., Lambert, A., Lee, H., Lyjak, L., Loh, J., Mankin, W., Massie, S., McInerney, J., Moorhouse, J., Nardi, B., Packman, D., Randall, C., Reburn, J., Rudolf, W., Schwartz, M., Serafin, J., Stone, K., Torpy, B., Walker, K., Waterfall, A., Watkins, R., Whitney, J., Woodard, D., and Young, G.: High Resolution Dynamics Limb Sounder: Experiment overview, recovery, and validation of initial temperature data, J. Geophys. Res., 113, D16S43, https://doi.org/10.1029/2007JD008824, 2008. a
Gille, J. C., Gray, L. J., Cavanaugh, C., Choi, K. Y., Coffey, M., Craig, C., Karol, S., Hepplewhite, C., Khosravi, R., Kinnison, D., Massie, S., Nardi, B., Belmonte Rivas, M., Smith, L., Waterfall, A., and Wright, C.: High Resolution Dynamics Limb Sounder Earth Observing System (EOS): Data description and quality, Version 6, available at: http://archive-eos.acom.ucar.edu/hirdls/data/products/HIRDLS-DQD_V6-1.pdf (last access: 14 September 2017), 2011. a, b, c, d, e, f
Gong, J., Yue, J., and Wu, D. L.: Global survey of concentric gravity waves in AIRS images and ECMWF analysis, J. Geophys. Res.-Atmos., 120, 2210–2228, https://doi.org/10.1002/2014JD022527, 2015. a
Hertzog, A., Vial, F., Mechoso, C. R., Basdevant, C., and Coquerez, Ph.: Quasi-Lagrangian measurements in the lower stratosphere reveal an energy peak associated with near-inertial waves, Geophys. Res. Lett., 29, 1229, https://doi.org/10.1029/2001GL014083, 2002. a
Hertzog, A., Boccara, G., Vincent, R. A., Vial, F., and Coquerez, Ph.: Estimation of gravity-wave momentum flux and phase speeds from long-duration stratospheric balloon flights: 2. Results from the Vorcore campaign in Antarctica, J. Atmos. Sci., 65, 3056–3070, 2008. a
Hertzog, A., Alexander, M. J., and Plougonven, R.: On the intermittency of gravity wave momentum flux in the stratosphere, J. Atmos. Sci., 69, 3433–3448, 2012. a
Hindley, N. P., Wright, C. J., Smith, N. D., and Mitchell, N. J.: The southern stratospheric gravity wave hot spot: individual waves and their momentum fluxes measured by COSMIC GPS-RO, Atmos. Chem. Phys., 15, 7797–7818, https://doi.org/10.5194/acp-15-7797-2015, 2015. a
Hines, C. O.: Doppler-spread parameterization of gravity-wave momentum deposition in the middle atmosphere. Part 1: Basic formulation, J. Atmos. Sol.-Terr. Phy., 54, 371–386, 1997. a
Holton, J. R.: The role of gravity wave induced drag and diffusion in the momentum budget of the mesosphere, J. Atmos. Sci., 39, 791–799, 1982. a
Holton, J. R.: The influence of gravity wave breaking on the general circulation of the middle atmosphere, J. Atmos. Sci., 40, 2497–2507, 1983. a
Jewtoukoff, V., Hertzog, A., Plougonven, R., de la Camara, A., and Lott, F.: Comparison of gravity waves in the southern hemisphere derived from balloon observations and the ECMWF analyses, J. Atmos. Sci., 72, 3449–3468, https://doi.org/10.1175/JAS-D-14-0324.1, 2015. a
Jiang, J. H., Wang, B., Goya, K., Hocke, K., Eckermann, S. D., Ma, J., Wu, D. L., and Read, W. G.: Geographical distribution and interseasonal variability of tropical deep convection: UARS MLS observations and analyses, J. Geophys. Res., 109, D03111, https://doi.org/10.1029/2003JD003756, 2004. a
Kalisch, S., Preusse, P., Ern, M., Eckermann, S. D., and Riese, M.: Differences in gravity wave drag between realistic oblique and assumed vertical propagation, J. Geophys. Res.-Atmos., 119, 10,081–10,099, https://doi.org/10.1002/2014JD021779, 2014. a, b
Kalisch, S., Chun, H.-Y., Ern, M., Preusse, P., Trinh, Q. T., Eckermann, S. D., and Riese, M.: Comparison of simulated and observed convective gravity waves, J. Geophys. Res.-Atmos., 121, 13474–13492, https://doi.org/10.1002/2016JD025235, 2016. a
Kim, Y.-H., Bushell, A. C., Jackson, D. R., and Chun, H.-Y.: Impacts of introducing a convective gravity-wave parameterization upon the QBO in the Met Office Unified Model, Geophys. Res. Lett., 40, 1873–1877, https://doi.org/10.1002/grl.50353, 2013. a
Kim, Y.-J., Eckermann, S. D., and Chun, H.-Y.: An overview of the past, present and future of gravity-wave drag parameterization for numerical climate and weather prediction models — Survey article, Atmos. Ocean, 41, 65–98, https://doi.org/10.3137/ao.410105, 2003. a
Krebsbach, M. and Preusse, P.: Spectral analysis of gravity wave activity in SABER temperature data, Geophys. Res. Lett., 34, L03814, https://doi.org/10.1029/2006GL028040, 2007. a
Krisch, I., Preusse, P., Ungermann, J., Dörnbrack, A., Eckermann, S. D., Ern, M., Friedl-Vallon, F., Kaufmann, M., Oelhaf, H., Rapp, M., Strube, C., and Riese, M.: First tomographic observations of gravity waves by the infrared limb imager GLORIA, Atmos. Chem. Phys., 17, 14937–14953, https://doi.org/10.5194/acp-17-14937-2017, 2017. a
Lehmann, C. I., Kim, Y.-H., Preusse, P., Chun, H.-Y., Ern, M., and Kim, S.-Y.: Consistency between Fourier transform and small-volume few-wave decomposition for spectral and spatial variability of gravity waves above a typhoon, Atmos. Meas. Tech., 5, 1637–1651, https://doi.org/10.5194/amt-5-1637-2012, 2012. a
Li, H. Y., Huang, C. M., Zhang, S. D., Huang, K. M., Zhang, Y., Gong, Y., Gan, Q., and Jia, Y.: Low-frequency oscillations of the gravity wave energy density in the lower atmosphere at low latitudes revealed by U.S. radiosonde data, J. Geophys. Res.-Atmos., 121, 13458–13473, https://doi.org/10.1002/2016JD025435, 2016. a
Lindzen, R. S.: Turbulence and stress owing to gravity wave and tidal breakdown, J. Geophys. Res., 86, 9707–9714, 1981. a, b
Lindzen, R. S. and Holton, J. R.: A theory of the quasi-biennial oscillation, J. Atmos. Sci., 25, 1095–1107, 1968. a
Lott, F. and Miller, M. J.: A new subgrid-scale orographic drag parametrization: Its formulation and testing, Q. J. Roy. Meteor. Soc., 123, 101–127, 1997. a, b
Lott, F., Guez, L., and Maury, P.: A stochastic parameterization of non-orographic gravity waves: Formalism and impact on the equatorial stratosphere, Geophys. Res. Lett., 39, L06807, https://doi.org/10.1029/2012GL051001, 2012. a
Manney, G. L., Santee, M. L., Rex, M., Livesey, N. J., Pitts, M. C., Veefkind, P., Nash, E. R., Wohltmann, I., Lehmann, R., Froidevaux, L., Poole, L. R., Schoeberl, M. R., Haffner, D. P., Davies, J., Dorokhov, V., Gernandt, H., Johnson, B., Kivi, R., Kyro, E., Larsen, N., Levelt, P. F., Makshtas, A., McElroy, C. T., Nakajima, H., Concepcion Parrondo, M., Tarasick, D. W., von der Gathen, P., Walker, K. A., and Zinoviev, N. S.: Unprecedented Arctic ozone loss in 2011, Nature, 478, 469–477, https://doi.org/10.1038/nature10556, 2011. a
Marks, C. J. and Eckermann, S. D.: A three-dimensional nonhydrostatic ray-tracing model for gravity waves: formulation and preliminary results for the middle atmosphere, J. Atmos. Sci., 52, 1959–1984, 1995. a, b
McDonald, A. J.: Gravity wave occurrence statistics derived from paired COSMIC/FORMOSAT3 observations, J. Geophys. Res., 117, D15106, https://doi.org/10.1029/2011JD016715, 2012. a
McFarlane, N. A.: The effect of orographically excited gravity wave drag on the general circulation of the lower stratosphere and troposphere, J. Atmos. Sci., 44, 1775–1800, 1987. a, b
McLandress, C.: On the importance of gravity waves in the middle atmosphere and their parameterization in general circulation models, J. Atmos. Terr. Phys., 60, 1357–1383, 1998. a, b
Meyer, C. I., Ern, M., Hoffmann, L., Trinh, Q. T., and Alexander, M. J.: Intercomparison of AIRS and HIRDLS stratospheric gravity wave observations, Atmos. Meas. Tech., 11, 215–232, https://doi.org/10.5194/amt-11-215-2018, 2018. a, b
Mlynczak, M. G.: Energetics of the mesosphere and lower thermosphere and the SABER instrument, Adv. Space Res., 44, 1177–1183, 1997. a
Nastrom, G. D., Hansen, A. R., Tsuda, T., Nishida, M., and Ware, R. H.: A comparison of gravity wave energy observed by VHF radar and GPS/MET over central North America, J. Geophys. Res., 105, 4685–4687, 2000. a
Orr, A., Bechtold, P., Scinocca, J. F., Ern, M., and Janiskova, M.: Improved middle atmosphere climate and forecasts in the ECMWF model through a nonorographic gravity wave drag parameterization, J. Climate, 23, 5905–5926, https://doi.org/10.1175/2010JCLI3490.1, 2010. a, b
Pfister, L., Scott, S., Loewenstein, M., Bowen, S., and Legg, M.: Mesoscale disturbances in the tropical stratosphere excited by convection: Observations and effects on the stratospheric momentum budget, J. Atmos. Sci., 50, 1058–1075, 1993. a
Piani, C., Durran, D., Alexander, M. J., and Holton, J. R.: A numerical study of three-dimensional gravity waves triggered by deep tropical convection and their role in the dynamics of the QBO, J. Atmos. Sci., 57, 3689–3702, 2000. a
Placke, M., Hoffmann, P., Gerding, M., Becker, E., and Rapp, M.: Testing linear gravity wave theory with simultaneous wind and temperature data from the mesosphere, J. Atmos. Sol.-Terr. Phy., 93, 57–69, https://doi.org/10.1016/j.jastp.2012.11.012, 2013. a
Plougonven, R. and Zhang, F.: Internal gravity waves from atmospheric jets and fronts, Rev. Geophys., 52, 33–76, https://doi.org/10.1002/2012RG000419, 2014. a
Press, W. H., Teukolsky, S. A., Vetterling, W. T., and Flannery, B. P.: Numerical recipes in Fortran 77: The art of scientific computing, 2nd Edn., Cambridge Univ. Press, New York, 933 pp., 1992. a
Preusse, P., Eckermann, S. D., and Offermann, D.: Comparison of global distributions of zonal-mean gravity wave variance inferred from different satellite instruments, Geophys. Res. Lett., 27, 3877–3880, 2000. a, b
Preusse, P., Eckermann, S. D., Oberheide, J., Hagan, M. E., and Offermann, D.: Modulation of gravity waves by tides as seen in CRISTA temperatures, Adv. Space Res., 27, 1773–1778, 2001. a
Preusse, P., Dörnbrack, A., Eckermann, S. D., Riese, M., Schaeler, B., Bacmeister, J. T., Broutman, D., and Grossmann, K. U.: Space-based measurements of stratospheric mountain waves by CRISTA, 1. Sensitivity, analysis method, and a case study, J. Geophys. Res., 106, 8178, https://doi.org/10.1029/2001JD000699, 2002. a, b, c, d, e, f, g, h, i, j, k, l
Preusse, P., Ern, M., Eckermann, S. D., Warner, C. D., Picard, R. H., Knieling, P., Krebsbach, M., Russell III, J. M., Mlynczak, M. G., Mertens, C. J., and Riese, M.: Tropopause to mesopause gravity waves in August: Measurement and modeling, J. Atmos. Sol.-Terr. Phy., 68, 1730–1751, https://doi.org/10.1016/j.jastp.2005.10.019, 2006. a, b
Preusse, P., Eckermann, S. D., and Ern, M.: Transparency of the atmosphere to short horizontal wavelength gravity waves, J. Geophys. Res., 113, D24104, https://doi.org/10.1029/2007JD009682, 2008. a, b, c, d, e
Preusse, P., Schroeder, S., Hoffmann, L., Ern, M., Friedl-Vallon, F., Ungermann, J., Oelhaf, H., Fischer, H., and Riese, M.: New perspectives on gravity wave remote sensing by spaceborne infrared limb imaging, Atmos. Meas. Tech., 2, 299–311, https://doi.org/10.5194/amt-2-299-2009, 2009a. a, b, c, d
Preusse, P., Eckermann, S. D., Ern, M., Oberheide, J., Picard, R. H., Roble, R. G., Riese, M., Russell III, J. M., and Mlynczak, M. G.: Global ray tracing simulations of the SABER gravity wave climatology, J. Geophys. Res., 114, D08126, https://doi.org/10.1029/2008JD011214, 2009b. a, b
Preusse, P., Ern, M., Bechtold, P., Eckermann, S. D., Kalisch, S., Trinh, Q. T., and Riese, M.: Characteristics of gravity waves resolved by ECMWF, Atmos. Chem. Phys., 14, 10483–10508, https://doi.org/10.5194/acp-14-10483-2014, 2014. a, b, c
Randel, W., Chanin, M.-L., and Michaut, C.: SPARC intercomparison of middle atmosphere climatologies, WCRP 116, WMO/TD No. 1142, SPARC report No. 3, 2002. a, b, c, d, e, f, g, h, i, j
Randel, W., Udelhofen, P., Fleming, E., Geller, M., Gelman, M., Hamilton, K., Karoly, D., Ortland, D., Pawson, S., Swinbank, R., Wu, F., Baldwin, M., Chanin, M.-L., Keckhut, P., Labitzke, K., Remsberg, E., Simmons, A., and Wu, D. L.: The SPARC intercomparison of middle-atmosphere climatologies, J. Climate, 17, 986–1003, 2004. a, b, c, d, e, f, g, h, i, j
Remsberg, E. E., Gordley, L. L., Marshall, B. T., Thompson, R. E., Burton, J., Bhatt, P., Harvey, V. L., Lingenfelser, G., and Natarajan, M.: The Nimbus 7 LIMS version 6 radiance conditioning and temperature retrieval methods and results, J. Quant. Spectrosc. Ra., 86, 395–424, https://doi.org/10.1016/j.jqsrt.2003.12.007, 2004. a
Remsberg, E. E., Marshall, B. T., Garcia-Comas, M., Krueger, D., Lingenfelser, G. S., Martin-Torres, J., Mlynczak, M. G., Russell III, J. M., Smith, A. K., Zhao, Y., Brown, C., Gordley, L. L., Lopez-Gonzalez, M. J., Lopez-Puertas, M., She, C.-Y., Taylor, M. J., and Thompson, R. E.: Assessment of the quality of the Version 1.07 temperature-versus-pressure profiles of the middle atmosphere from TIMED/SABER, J. Geophys. Res., 113, D17101, https://doi.org/10.1029/2008JD010013, 2008. a, b, c, d, e
Ribstein, B. and Achatz, U.: The interaction between gravity waves and solar tides in a linear tidal model with a 4-D ray-tracing gravity-wave parameterization, J. Geophys. Res.-Space, 121, 8936–8950, https://doi.org/10.1002/2016JA022478, 2016. a
Richter, J. H., Sassi, F., and Garcia, R. R.: Toward a physically based gravity wave source parameterization in a general circulation model, J. Atmos. Sci., 67, 136–156, 2010. a
Riese, M., Spang, R., Preusse, P., Ern, M., Jarisch, M., Offermann, D., and Grossmann, K. U.: Cryogenic Infrared Spectrometers and Telescopes for the Atmosphere (CRISTA) data processing and atmospheric temperature and trace gas retrieval, J. Geophys. Res.-Atmos., 104, 16349–16367, https://doi.org/10.1029/1998JD100057, 1999. a
Riese, M., Friedl-Vallon, F., Spang, R., Preusse, P., Schiller, C., Hoffmann, L., Konopka, P., Oelhaf, H., von Clarmann, T., and Höpfner, M.: GLObal limb Radiance Imager for the Atmosphere (GLORIA): Scientific objectives, Adv. Space Res., 36, 989–995, https://doi.org/10.1016/j.asr.2005.04.115, 2005. a, b
Riese, M., Oelhaf, H., Preusse, P., Blank, J., Ern, M., Friedl-Vallon, F., Fischer, H., Guggenmoser, T., Höpfner, M., Hoor, P., Kaufmann, M., Orphal, J., Plöger, F., Spang, R., Suminska-Ebersoldt, O., Ungermann, J., Vogel, B., and Woiwode, W.: Gimballed Limb Observer for Radiance Imaging of the Atmosphere (GLORIA) scientific objectives, Atmos. Meas. Tech., 7, 1915–1928, https://doi.org/10.5194/amt-7-1915-2014, 2014. a, b
Russell III, J. M., Mlynczak, M. G., Gordley, L. L., Tansock, J., and Esplin, R.: An overview of the SABER experiment and preliminary calibration results, Proc. SPIE, 3756, 277–288, https://doi.org/10.1117/12.366382, 1999. a
Sato, K., Watanabe, S., Kawatani, Y., Tomikawa, Y., Miyazaki, K., and Takahashi, M.: On the origins of mesospheric gravity waves, Geophys. Res. Lett., 36, L19801, https://doi.org/10.1029/2009GL039908, 2009. a
Sato, K., Tateno, S., Watanabe, S., and Kawatani, Y.: Gravity wave characteristics in the southern hemisphere revealed by a high-resolution middle-atmosphere general circulation model, J. Atmos. Sci., 69, 1378–1396, https://doi.org/10.1175/JAS-D-11-0101.1, 2012. a
Schmidt, T., Alexander, P., and de la Torre, A.: Stratospheric gravity wave momentum flux from radio occultations, J. Geophys. Res.-Atmos., 121, 4443–4467, https://doi.org/10.1002/2015JD024135, 2016. a
Schroeder, S., Preusse, P., Ern, M., and Riese, M.: Gravity waves resolved in ECMWF and measured by SABER, Geophys. Res. Lett., 36, L10805, https://doi.org/10.1029/2008GL037054, 2009. a
Scinocca, J. F.: An accurate spectral nonorographic gravity wave drag parameterization for general circulation models, J. Atmos. Sci., 60, 667–682, 2003. a
Scinocca, J. F. and McFarlane, N. A.: The parametrization of drag induced by stratified flow over anisotropic orography, Q. J. Roy. Meteor. Soc., 126, 2353–2393, 2000. a
Song, I.-S. and Chun, H.-Y.: Momentum flux spectrum of convectively forced internal gravity waves and its application to gravity wave drag parameterization. Part I: Theory, J. Atmos. Sci., 62, 107–124, 2005. a, b
Song, R., Kaufmann, M., Ungermann, J., Ern, M., Liu, G., and Riese, M.: Tomographic reconstruction of atmospheric gravity wave parameters from airglow observations, Atmos. Meas. Tech., 10, 4601–4612, https://doi.org/10.5194/amt-10-4601-2017, 2017a. a
Song, R., Kaufmann, M., Ern, M., Ungermann, J., Liu, G., and Riese, M.: 3-D tomographic reconstruction of atmospheric gravity waves in the mesosphere and lower thermosphere (MLT), Atmos. Meas. Tech. Discuss., https://doi.org/10.5194/amt-2017-424, in review, 2017b. a
Stephan, C. and Alexander, M. J.: Realistic simulations of atmospheric gravity waves over the continental U.S. using precipitation radar data, J. Adv. Model. Earth Syst., 7, 823–835, https://doi.org/10.1002/2014MS000396, 2015. a
Swinbank, R. and Ortland, D. A.: Compilation of wind data for the UARS Reference Atmosphere Project, J. Geophys. Res., 108, 4615, https://doi.org/10.1029/2002JD003135, 2003. a, b, c, d, e, f, g, h
Trinh, Q. T., Kalisch, S., Preusse, P., Chun, H.-Y., Eckermann, S. D., Ern, M., and Riese, M.: A comprehensive observational filter for satellite infrared limb sounding of gravity waves, Atmos. Meas. Tech., 8, 1491–1517, https://doi.org/10.5194/amt-8-1491-2015, 2015. a, b, c, d, e, f, g, h, i, j
Trinh, Q. T., Kalisch, S., Preusse, P., Ern, M., Chun, H.-Y., Eckermann, S. D., Kang, M.-J., and Riese, M.: Tuning of a convective gravity wave source scheme based on HIRDLS observations, Atmos. Chem. Phys., 16, 7335–7356, https://doi.org/10.5194/acp-16-7335-2016, 2016. a, b, c, d, e
Tsuda, T., Nishida, M., Rocken, C., and Ware, R. H.: A global morphology of gravity wave activity in the stratosphere revealed by the GPS occultation data (GPS/MET), J. Geophys. Res., 105, 7257–7273, 2000. a, b, c
van Zandt, T. E.: A model for gravity wave spectra observed by Doppler sounding system, Radio Sci., 20, 1323–1330, 1985. a
Wang, L. and Alexander, M. J.: Global estimates of gravity wave parameters from GPS radio occultaton temperature data, J. Geophys. Res., 115, D21122, https://doi.org/10.1029/2010JD013860, 2010. a, b
Wang, L., Geller, M., and Alexander, M. J.: Spatial and temporal variations of gravity wave parameters. Part I: Intrinsic frequency, wavelength, and vertical propagation direction, J. Atmos. Sci., 62, 125–142, 2005. a
Warner, C. D. and McIntyre, M. E.: An ultrasimple spectral parameterization for nonorographic gravity waves, J. Atmos. Sci., 58, 1837–1857, 2001. a, b
Wright, C. J. and Gille, J. C.: Detecting overlapping gravity waves using the S-Transform, Geophys. Res. Lett., 40, 1850–1855, https://doi.org/10.1002/grl.50378, 2013. a
Wright, C. J., Osprey, S. M., Barnett, J. J., Gray, L. J., and Gille, J. C.: High Resolution Dynamics Limb Sounder measurements of gravity wave activity in the 2006 Arctic stratosphere, J. Geophys. Res., 115, D02105, https://doi.org/10.1029/2009JD011858, 2010. a
Wright, C. J., Rivas, M. B., and Gille, J. C.: Intercomparisons of HIRDLS, COSMIC and SABER for the detection of stratospheric gravity waves, Atmos. Meas. Tech., 4, 1581–1591, https://doi.org/10.5194/amt-4-1581-2011, 2011. a
Wright, C. J., Osprey, S. M., and Gille, J. C.: Global observations of gravity wave intermittency and its impact on the observed momentum flux morphology, J. Geophys. Res.-Atmos., 118, 10,980–10,993, https://doi.org/10.1002/jgrd.50869, 2013. a
Wright, C. J., Hindley, N. P., Hoffmann, L., Alexander, M. J., and Mitchell, N. J.: Exploring gravity wave characteristics in 3-D using a novel S-transform technique: AIRS/Aqua measurements over the Southern Andes and Drake Passage, Atmos. Chem. Phys., 17, 8553–8575, https://doi.org/10.5194/acp-17-8553-2017, 2017. a
Wu, D. L. and Waters, J. W.: Satellite observations of atmospheric variances: A possible indication of gravity waves, Geophys. Res. Lett., 23, 3631–3634, 1996. a
Yigit, E., Aylward, A. D., and Medvedev, A. S.: Parameterization of the effects of vertically propagating gravity waves for thermosphere general circulation models: Sensitivity study, J. Geophys. Res., 113, D19106, https://doi.org/10.1029/2008JD010135, 2008. a
Zhu, X.: Radiative damping revisited: Parameterization of damping rate in the middle atmosphere, J. Atmos. Sci., 50, 3008–3021, 1993. a


