the Creative Commons Attribution 4.0 License.
the Creative Commons Attribution 4.0 License.
 | 25 Apr 2018
A database of 10 min average measurements of solar radiation and meteorological variables in Ostrava, Czech Republic
Marie Opálková
Martin Navrátil
Vladimír Špunda
Philippe Blanc
Lucien Wald
A database containing 10 min means of solar irradiance measured on a horizontal plane in several ultraviolet and visible bands from July 2014 to December 2016 at three stations in the area of the city of Ostrava (Czech Republic) is presented. The database contains time series of 10 min average irradiances or photosynthetic photon flux densities measured in the following spectral bands: 280–315 nm (UVB); 315–380 nm (UVA); and 400–700 nm (photosynthetically active radiation, PAR); 510–700 nm; 600–700 nm; 610–680 nm; 690–780 nm; 400–1100 nm. A series of meteorological variables including relative air humidity and air temperature at surface is also provided at the same 10 min time step at all three stations, and precipitation is provided for two stations. Air pressure, wind speed, wind direction, and concentrations of air pollutants PM10, SO2, NOx, NO, NO2 were measured at the 1 h time step at the fourth station owned by the Public Health Institute of Ostrava. The details of the experimental sites and instruments used for the measurements are given. Special attention is given to the data quality, and the original approach to the data quality which was established is described in detail. About 130 000 records for each of the three stations are available in the database. This database offers a unique ensemble of variables having a high temporal resolution and it is a reliable source for radiation in relation to environment and vegetation in highly polluted areas of industrial cities in the of northern mid-latitudes. The database has been placed on the PANGAEA repository (https://doi.org/10.1594/PANGAEA.879722) and contains individual data files for each station.
- Article
(801 KB) - Full-text XML
-
Supplement
(9228 KB) - BibTeX
- EndNote


Solar radiation is the crucial factor which influences life on Earth. The intensity and spectral characteristics of incident solar radiation are important properties which cause physiological responses of plants, animals, and humans. Incident solar radiation, especially in the ultraviolet UVB 280–315 nm, UVA 315–400 nm, and visible (VIS) 380–760 nm spectral regions, is the key factor influencing plants. Although plants can adapt to changing environmental conditions, excessive radiation causes them acute damage because of over-excited photosystems and the evolution of free radicals (Reddy and Raghavendra, 2006). Conversely, a lack of radiation is an important stress factor as well (Lambers et al., 2008). Plants use different spectral regions of solar radiation in different processes in their metabolism. Solar radiation can be a source of energy for plant photosynthesis, mainly the blue, and red components of photosynthetically active radiation (PAR, 400–700 nm; Ohashi-Kaneko et al., 2007; Johkan et al., 2010). It is also a source of information (UVB, UVA, blue and red components of PAR) as plants contain photoreceptors which are capable of recognizing individual spectral regions: the UVR8 photoreceptor for UVB radiation (Tilbrook et al., 2013); cryptochromes and phototropins for UVA radiation (Verdaguer et al., 2017); and cryptochromes, phototropins, and phytochromes for PAR (Casal, 2013). UVB is mostly harmful and plants try to avoid damage by using, for example, UV shielding by producing chemical compounds which absorb UVB radiation (Meijkamp et al., 1999). UVA and the blue component of PAR are involved in phototropic reactions, in stomata activity, growth, and plant development (Barillot et al., 2010). Plants are also significantly affected by green light (Materová et al., 2017). Ratios of spectral regions of incident solar radiation, e.g. UVB/PAR or UVA/PAR and ratios between diffuse and global radiation, also have important effects on plants (Behn et al., 2010; Grifoni et al., 2008). Diffuse radiation spreads into the environment without a specific direction and is therefore able to penetrate within the plant canopy more effectively. Moreover, diffuse radiation is known for having a different blue/red ratio compared to direct radiation (Navrátil et al., 2007), so diffuse radiation influences photosynthesis of plant canopies in different ways than direct radiation. Although irradiance is lower in conditions when diffuse radiation is dominant, photosynthesis is more effective than under conditions of prevailing direct radiation. Because air pollutants increase the diffuse fraction, industrial areas have a tendency to exhibit greater diffuse fractions than natural areas and interactions between radiation and plants will be different between these two areas. Since changes in both spectral composition and intensity of incident solar radiation can affect physiological processes in plants, detailed measurements of radiation in several spectral bands in the UV and VIS ranges in highly polluted areas of industrial cities are useful for further understanding of these processes.
Solar radiation passing through the atmosphere is influenced by absorption and scattering due to gas, liquid, and solid particles contained in the atmosphere (Wald, 2007). The character of cloudiness and smog periods in industrial urban areas cause considerable changes in the radiation environment compared with clean air areas. These changes can directly affect the photosynthetic activity and reduce the resistance of plants to other abiotic stresses. However, systematic measurements of radiation in the UV and VIS spectral bands, which would allow for finding and studying patterns of changes in intensity and spectral quality of incident solar radiation in urban areas, are still missing. Several studies deal with a similar topic (e.g. Jacovides et al., 2004; Zhou and Savijärvi, 2014), but there is a lack of continuous measurements of irradiance in particular spectral regions of PAR, mainly blue (400–510 nm), green (510–600 nm), and red (600–700 nm) radiation, which are important for plants.
Ostrava is the third largest city in the Czech Republic with a long industrial history. Current industrial production is focused mainly on metallurgy and mechanical engineering and produces air pollutants emitted into the atmosphere. The Ostrava industrial region experiences a high occurrence of smog periods during winter months, but concentrations of air pollutants are noticeable up to severe during the whole year (Jančík et al., 2013). Approximately 20 % of the area of Ostrava is covered by public green areas including forests (EEA, 2017). This number is low in comparison with cities of similar size in the Czech Republic, but is comparable to that found in other cities of similar size in the world. The combination of these factors makes Ostrava a good place for studies of interactions between vegetation and meteorological factors. The detailed measurements spanning several vegetative seasons performed at Ostrava aim at supporting a comprehensive analysis of the changes in intensity and spectral composition of incoming irradiation in relation with air quality characteristics and other meteorological variables, and support further analysis of the impact of air pollution on the radiation regime in that region.
The database discussed here is closely connected with studies of plant photosynthesis and metabolism because this is the main research topic of the group of Biophysics at the Department of Physics at the University of Ostrava. The original goal of performing measurements of solar radiation was to inform about solar irradiances in different spectral regions during different meteorological conditions and to use these data in experiments on plants in artificial conditions in growth chambers. In addition, the database can be used for any environmental modelling, e.g. for atmospheric chemistry models or urbanistic studies.
Because of the existence of systematic errors in radiation measurements (e.g. Muneer and Fairooz, 2002; Younes et al., 2005), particular attention was devoted to a careful quality check (QC) on the measurements (e.g. Journée and Bertrand, 2011; Roesch et al., 2011) before releasing the data for further analyses.
The aim of this paper is to describe a database elaborated in cooperation between the University of Ostrava (Department of Physics, Faculty of Science) and the research centre Observation, Impacts, Energy of MINES ParisTech. The database covers the period 2014–2016 and includes quality-checked 10 min averages of seven spectral regions within the UV and VIS, as well as the broadband irradiance at three measuring stations situated at two locations within the wider area of the city of Ostrava. Meteorological variables, such as air temperature and relative air humidity, are also included in the database for all three measuring stations, and precipitation is included for two measuring stations. Other meteorological variables – such as air pressure, wind direction, wind speed, and concentrations of several air pollutants – are included for one location.
This paper is organized as follows: the study area and details about sensors for radiation measurements are given in Sect. 2, the QC procedures applied to the measurements are described in Sect. 3, their results and the structure of the database are detailed in Sect. 4. Finally, a summary and perspectives are given in Sect. 5. The quality-checked database is available at the PANGAEA repository (https://doi.org/10.1594/PANGAEA.879722) under Creative Commons Attribution 3.0 Unported International Public License (CC-BY 3.0).
2.1 Locations of the measurement sites
The city of Ostrava is located in the north-eastern part of the Czech Republic. Mean elevation of the city is 244 m a.s.l. and the countryside is flat or slightly undulating (Weissmannová et al., 2004). According to the Köppen–Geiger classification, Ostrava belongs to the DFb climate subtype (Peel et al., 2007) – mild warm climate, in addition to urban influences. Weissmannová et al. (2004) reported that summers at Ostrava are long, warm, and mildly dry; winters are short, mildly warm, and with a short duration of snow cover (50–60 days); and the mean annual sunshine duration is 1594 h. From our data, we computed a mean annual air temperature of 10.3 ∘C and a mean annual sum of precipitation of 585 mm.
Three identical systems of sensors were installed at two different locations. Two systems (stations S1 and S2) were installed very close to each other, 3 m apart, in the Botanical Garden of the University of Ostrava (BGOU) in the Radvanice district in Ostrava (235 m a.s.l.; Table 1, Fig. 1; Figs. S1–S3 in the Supplement). When the study was planned, it was believed that it was desirable to have two identical systems (i.e. sets of irradiance sensors) at the same place at one location to better assess custom-made sensors and the quality of the measurements. The third system (station S3) was installed in the Czech Hydrometeorological Institute (CHMI) in the Poruba district in Ostrava (240 m above sea level; Table 1, Fig. 1; Figs. S4–S6 in the Supplement). BGOU is situated approximately 3 km apart from an industrial area which produces large amounts of air pollutants (Jančík et al., 2013) and concentrations of air pollutants are greater at BGOU (stations S1, S2) than at CHMI (station S3), especially in the winter months (Table 2). Jančík et al. (2013) reported that the main source for air pollution at BGOU is industry while it is the road traffic at CHMI.
It was desirable to locate the stations in a very open space area but this was not possible in this project due to the necessity of a fenced and easy-to-visit area. There are some shrubs and trees in the surroundings of the measuring stations (S1, S2) at BGOU and other measuring devices in the surroundings of the measuring station (S3) at CHMI. Their shading effects were studied and included in the database. Shaded and non-shaded data were determined visually by coloured plots of the irradiance as a function of the solar azimuth and elevation angles (figures with details are included in the datasets and in the Supplement, Figs. S7–S9). These horizons were confirmed by the analysis of the digital elevation model found in Google maps.
Several meteorological variables (air temperature, relative air humidity, air pressure, wind speed, and wind direction) and concentrations of air pollutants (PM10, NO, NO2, NOx, and SO2) were measured at the measuring station owned by the Public Health Institute of Ostrava (PHI). The PHI has a network of four permanent measuring stations; the nearest PHI station to BGOU is located approximately 1.7 km from BGOU (49.819031∘ N, 18.340355∘ E; Fig. 1).
Table 1List of measuring stations owned by the University of Ostrava with some details. BGOU means Botanical Garden of University of Ostrava, CHMI means Czech Hydrometeorological Institute.
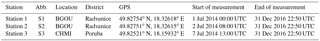
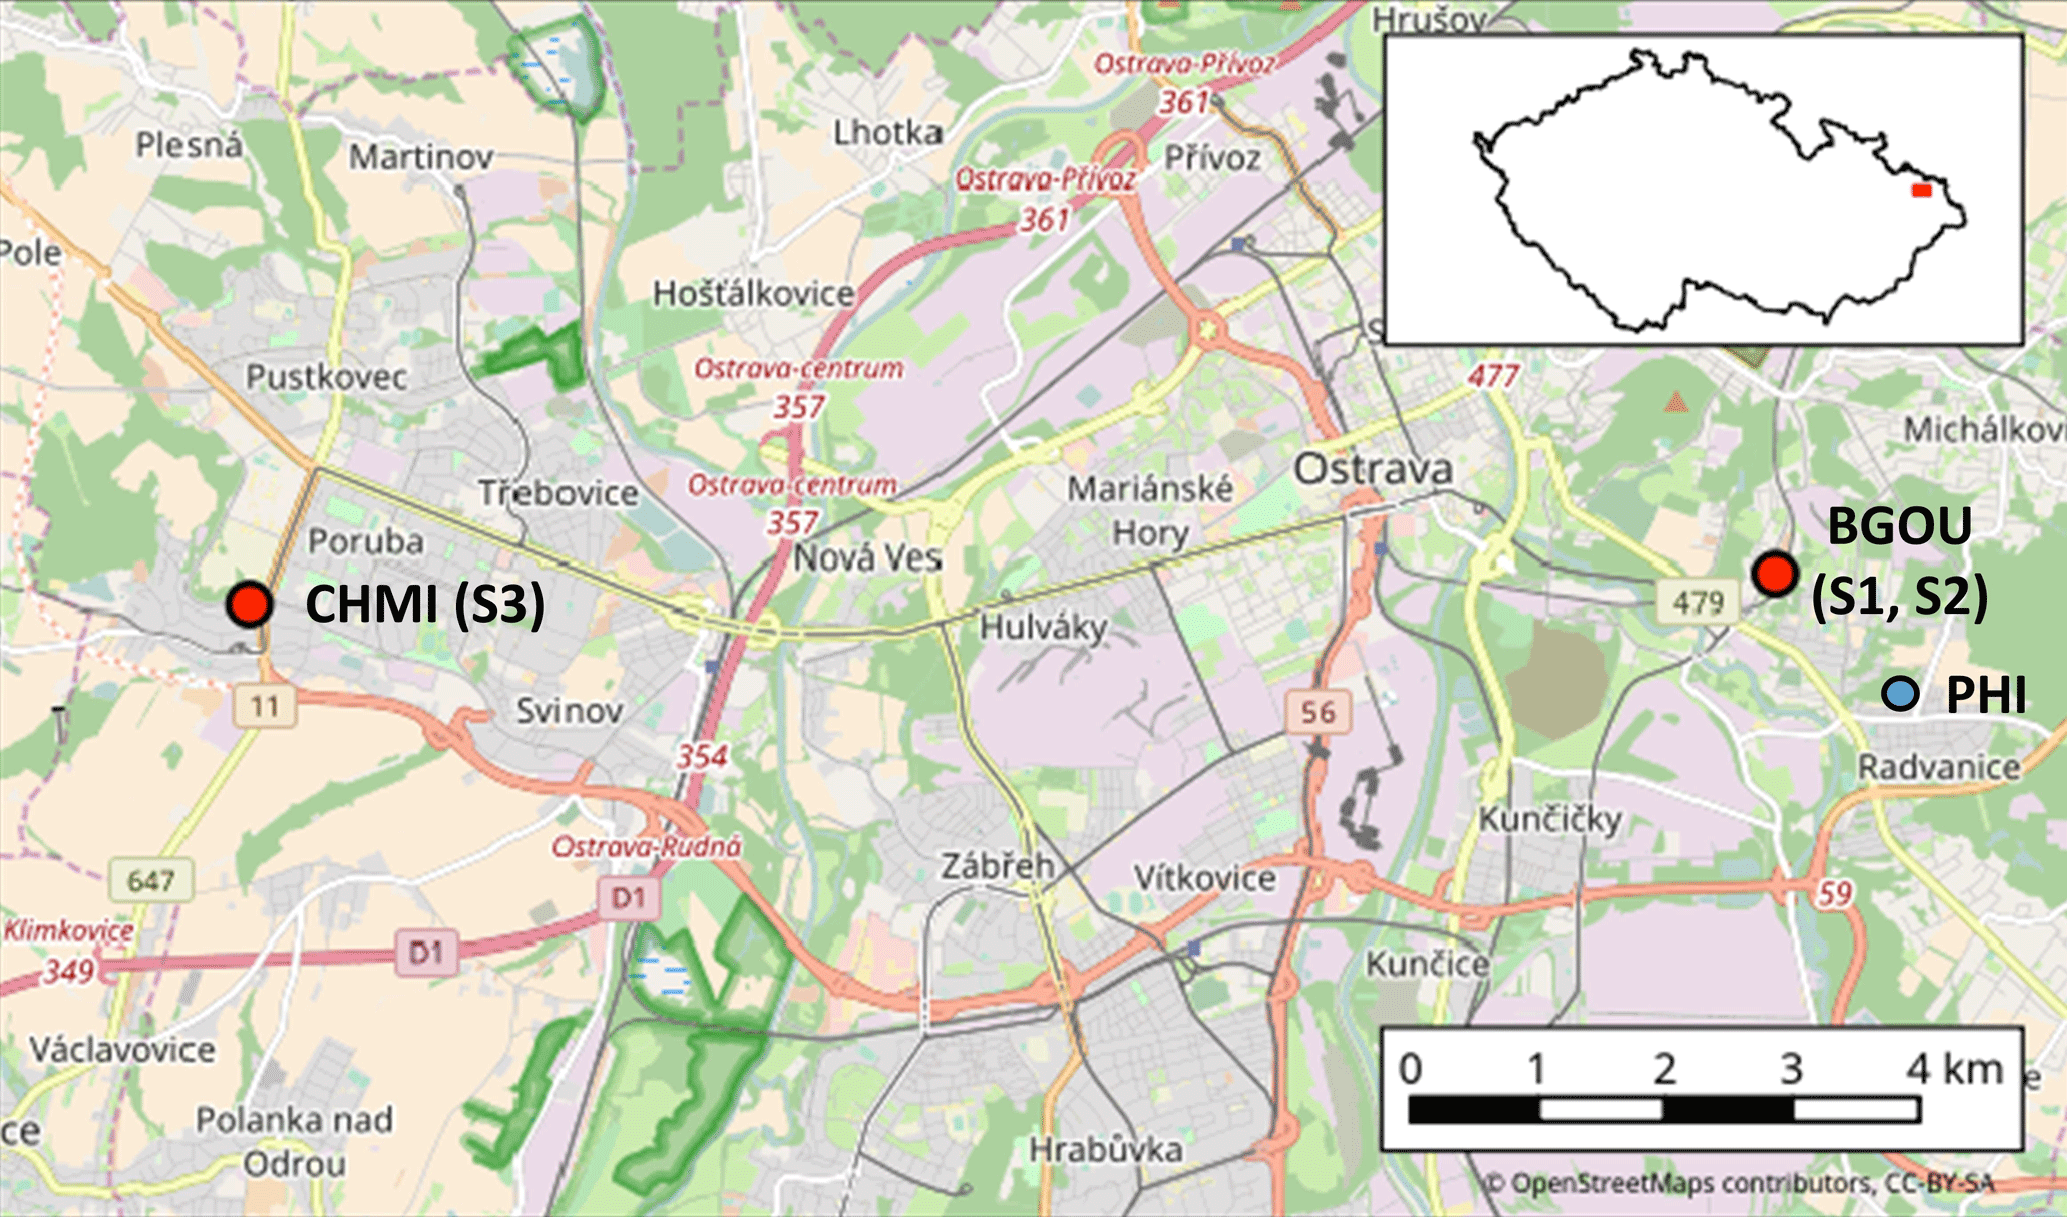
Figure 1Locations of the measuring stations. CHMI: Czech Hydrometeorological Institute area (station S3); BGOU: Botanical Garden of the University of Ostrava (stations S1 and S2); PHI: measuring station of the Public Health Institute of Ostrava. Map data copyrighted OpenStreetMap contributors.
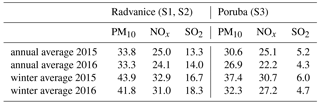
Table 2Average concentrations of PM10, NOx, and SO2 measured by the Public Health Institute of Ostrava close to Radvanice (stations S1, S2) and by the Czech Hydrometeorlogical Institute at Poruba (station S3). All values are given in µg m−3.
2.2 Sensors, measurements, data storage, maintenance, and calibration
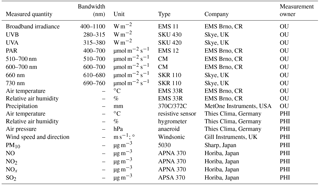
Several types of sensors were installed to measure the downwelling solar radiation or the photosynthetic photon flux density (PPFD) received at the ground level on a horizontal plane in different spectral bands. All used sensors were placed at 2 m above ground. The database contains measurements from July 2014 to December 2016. Data loggers collected signals from the sensors each minute. The raw data were stored as 10 min averages to ease further numerical processing.
At all three stations, there were sensors which measured global radiation in UVB, UVA, broadband, and the PPFD at various wavelength ranges within the PAR band: 400–700 nm, 510–700 nm, and 600–700 nm, and spectral bands around 660 and 730 nm (Table 3). The data were collected by Edgebox V12 data loggers from the EMS Brno company (http://www.emsbrno.cz, last access: 19 April 2018). At all three stations, air temperature and relative air humidity were measured (Table 3), precipitation was measured by the tipping-bucket rain gauge only at S1 and S3. Table S1 and Fig. S10 in the Supplement summarize the technical characteristics of the radiation sensors and their relative spectral responses.
Maintenance of sensors was performed every month in winter, when heavy loads of dust particles in the atmosphere are frequent, and every two months during the rest of the year. The sensors were cleaned with pure ethanol and the silica gel for removing air humidity within the data logger was changed at each maintenance.
The sensors were calibrated before the start of the measurements in 2014. EMS Brno recommends recalibration of their own sensors once every 5 years since all sensors are equipped with glass diffusers, which allow accurate measurements for a long time. To check the long-term stability of the sensors, measurements from each of them were compared to the measurements performed in the broadband range and linear regressions were computed in the whole measuring period and for each individual year. No significant changes in the values of the regression parameters were observed. In addition, at BGOU, measurements made by identical types of sensors were compared to check the temporal consistency at the two stations S1 and S2. Coefficients of determination were in the interval 0.94–0.98, thus confirming the expected similarity in data between S1 and S2. No significant systematic biases were observed and the least square linear regression provided a cross-calibration correction of less than 5 %. Differences between them could be caused by variable irradiance during partly cloudy days, i.e. one measuring station can be brightened by the Sun but a second measuring station can be shaded by clouds, or by technical properties of sensors. For example, sensors measuring radiation in the intervals 510–700 nm and 600–700 nm contain cut-off filters which have an S-shaped transmission curve and this causes slightly different measured values. Based on these tests, we can conclude that no long-term decrease in the sensitivity of solar sensors is noticeable.
Table 3Basic technical description of the sensors. Measurement owner: “OU” means University of Ostrava, these instruments were used at stations S1, S2, and S3. “PHI” means Public Health Institute Ostrava, these instruments were used at the measurement station of PHI. “CM” means custom made sensors.
Concentrations of air pollutants and meteorological variables were provided by PHI as 1 h averages. The measurements were part of a routine process for monitoring air quality in Ostrava. In this routine, the series of measurements are checked twice per day, each station is physically checked three times per week, the check and calibration of all sensors is performed by certified companies once per year, and the calibration of sensors in the calibration laboratory takes place once every two years. Measurements are controlled in three different procedures that occur (i) daily, (ii) once per month before sending to air pollutants database ISKO, and (iii) once per year. Air quality data measured by CHMI are not available for free usage. This is the reason why the database does not contain additional meteorological variables for the CHMI (station S3). This problem may have been overcome by using the PHI network but there was no PHI station near the CHMI station.
Three additional pieces of information are included in the database. The first piece is the season when the measurement was done: spring for the term 21 March to 20 June, summer for the term 21 June to 22 September, autumn for the term 23 September to 20 December, and winter for the term 21 December to 20 March. This information was added for potential analyses of solar radiation during different yearly seasons. The second piece is the prevailing cloudiness conditions – called “weather category” in the database – or each record with three categories: cloudy, partly cloudy, and sunny. This was determined by the analysis of the daily profile of the 10 min broadband irradiance as exemplified in Fig. 2, which presents daily profiles for three different days in March 2015; sunny days offer a bell-shaped profile, cloudy days have flat, low profiles, and partly cloudy days exhibit large variability within the day. The information about prevailing cloudiness conditions was allotted to the whole day including night. The third piece is the air pollution category and is available only at S1 and S2. It was established on the basis of intervals of concentrations of PM10 in the air at the measuring station of PHI following the five categories proposed by Elshout et al. (2008): very low air pollution (0–11 µg m−3), low (12–24 µg m3), medium (25–49 µg m3), high (50–99 µg m3), and very high (greater than 100 µg m3).
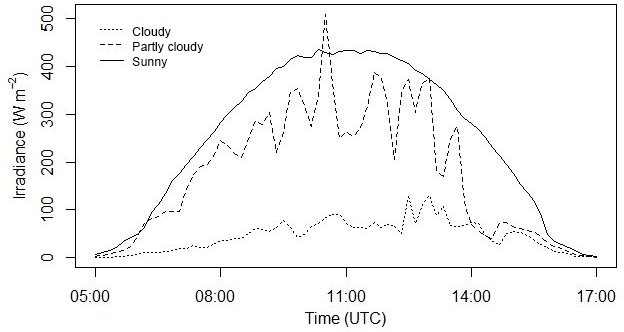
Figure 2Example of daily profiles of the 10 min broadband irradiance for three different days in March 2015: cloudy day on 14th, partly cloudy day on 15th, and sunny day on 17th.
Table 4Irradiance for each spectral band at the top of the atmosphere (TOA, in W m−2), its ratio to the total irradiance, conversion coefficients from W m−2 to µmol m−2 s−1 when needed, final coefficients for calculation of irradiance in spectral bands, and resulting upper thresholds.
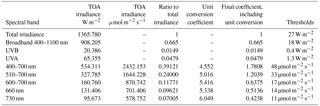
To the best knowledge of the authors, there has not been a published and accepted procedure for checking the quality of irradiances in the spectral bands of interest yet. In the absence of such a procedure we have adapted the approach of Korany et al. (2016) which applies to measurements of global and diffuse total irradiances. In our specific case, the quality check (QC) of Korany et al. (2016) consists of checking that each measurement E(t,Δλ) falls into the range [0.03 E0(t,Δλ), E0(t,Δλ)], where t is the time of measurement, λ the wavelength, Δλ the spectral range, E(t,Δλ) the measurement, and E0(t, Δλ) the corresponding irradiance or PPFD at the top of the atmosphere (TOA). Given a typical spectrum E0(λ) (Kurucz, 1992) of the irradiance at TOA, the ratio of the irradiance at TOA for a given spectral band E0(Δλ) to the total irradiance at TOA E0 was computed for each spectral band (Table 4). It was checked that these ratios are fairly constant by performing similar calculations with other reference spectra of irradiance at TOA found in LibRadtran software (Mayer and Kylling, 2005). In addition, the Kurucz spectrum was converted into spectral PPFD in µmol m−2 s−1 nm using the equation E0(λ) = h c∕λ, where E0(λ) is the spectral irradiance, h is the Planck constant, and c is the velocity of light. The PPFD E0(t,Δλ) in µmol m−2 s−1 was obtained when needed by summing up the spectral PPFD within the band (Table 4). The coefficient for the unit conversion for each spectral band was obtained by dividing the irradiances expressed in both units (Table 4). Finally, the final coefficient for converting E0 into E0(Δλ) was computed by multiplying the ratio to the total irradiance by the coefficient for the unit conversion (Table 4). Time series of the total irradiance at TOA in a 1 min step were downloaded from the website soda-pro.com (http://www.soda-pro.com/web-services/radiation/cams-radiation-service, last access: 22 May 2017) for BGOU and CHMI sites and then averaged every 10 min to match the measurements. By applying the appropriate coefficients for each spectral range, corresponding time series of E0(t, Δλ) were obtained against which the measurements E(t,Δλ) may be compared for the first step of the QC.
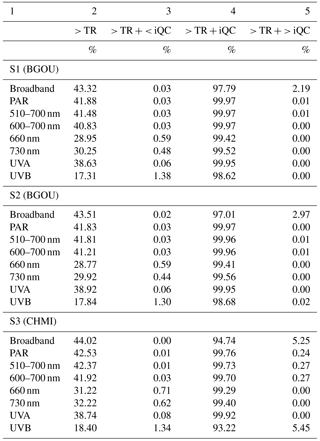
Table 5Data success rate for the QC of measured values of spectral irradiances. Rates are expressed as percentage. First row contains the column numbers. TR means threshold values from Table 4. The column > TR gives the percentage of data greater than TR calculated from all records. iQC means the interval [0.03 E0, E0]. The column > TR + < iQC gives the percentage of data < 0.03 E0 calculated from numbers of data > TR. The column > TR + iQC gives the percentage of data belonging to iQC calculated from numbers of data > TR. The column > TR + > iQC gives the percentage of data > E0 calculated from numbers of data > TR.
The second step was aiming at flagging measurements that are significantly different from 0, i.e. measurements that are greater than 1.5 times the measurement uncertainty given by the World Meteorological Organization (WMO, 2014). As this uncertainty is based on 95 % probability, multiplying it by 1.5 and assuming a normal law for uncertainty means that there is a 99.7 % chance that a measurement greater than this threshold is significantly different from 0. The WMO guide provides relative uncertainty in percent for hourly values of total irradiation and irradiation is expressed in MJ m−2, while our measurements are in W m−2 or µmol m−2 s−1. We have estimated the threshold for each spectral band as follows. The relative uncertainty for daily irradiation of good quality is set to 5 % in the WMO guide if the irradiation is greater than 8 MJ m−2, which corresponds to an hourly mean of irradiance of 220 W m−2 for an average day length, which was determined as the average number of hours when solar radiation incident on sensors was not influenced by objects on the horizon (trees, shrubs, etc.). It is ca. 5 h in winter and 15 h in summer, so the average is equal to 10 h. The 95 % relative uncertainty for hourly values in the WMO guide is 8 %, i.e. approximately 18 W m−2. Multiplying by 1.5 yielded the threshold for the total irradiance: 27 W m−2 reported in Table 4. In a similar way to the first step, the threshold for each spectral range was computed by multiplying the threshold for the total irradiance by the final coefficient (Table 4).
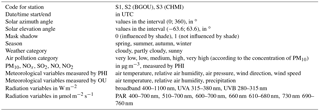
Table 6A list of variables contained in the database. PHI means the Public Health Institute Ostrava.
The QC for air temperature and relative air humidity was done by checking if data belong to the interval of values which were trustable for the measuring period at measuring places (nonsense values were eliminated). The QC for additional meteorological data and air quality measurements has been described in Sect. 2.2.
4.1 Results of the quality check
There were a total of 131 142 records for station S1 (BGOU), 131 558 records for station S2 (BGOU), and 130 659 records for station S3 (CHMI) from July 2014 to December 2016. The percentage of data greater than thresholds is greater than 30 %, except UVB (Table 5, column 2). This low percentage is explained by the fact that the records also include the night measurements which were close to 0 and they were rejected in the second step as not being different from 0. The greatest percentages are observed in broadband, PAR, and UVA. The lowest percentage of data greater than the threshold value is observed in the UVB region: 17.8 %. This fact was likely due to a too high threshold value for this spectral region (0.4 W m−2), but measurements of UVB radiation are known to be difficult (e.g. Sayre and Kligman, 1992).
Average percentage of data greater than the threshold and passing the QC based on the interval [0.03 E0, E0] was 98.8 % (Table 5, column 4). The data at S3 had less percentage of data which successfully passed QC than stations S1 and S2. Differences are less than 3 %; there is no apparent explanation.
4.2 Additional comments
Some values are greater than the corresponding irradiance at TOA. These values were usually connected with partly cloudy weather, when multiple scattering on the cloud edges could increase incident solar irradiation (Mims and Frederick, 1994).
Because of noticeable shading effects experienced by the three stations, the direct component of the radiation is extinguished when the sun is below the local horizon. In addition, a part of the sky is always shaded, so a part of diffuse radiation is always missing in the measurements, whose magnitude depends on the day, time of the day, and atmospheric constituents. Moreover, these objects reflect the downward radiation and part of the reflected radiation may contribute to the measured radiation. This effect can potentially increase the measured radiation. It is very difficult to quantify it as it depends on optical properties of the reflecting object, day, time of the day, and atmospheric constituents. Therefore, our measured data are influenced by these effects and they can be used only for purposes where these effects may be neglected.
All used sensors were equipped with cosine correctors which allow for final values of irradiance without the necessity of recalculations because of changing solar elevation angle (SEA). In technical manuals, it is said that these correctors work properly when SEA is greater than 5∘. We made an analysis of data variability dependent on SEA and a low variability of data was confirmed for SEAs greater than 8∘. It means that only data with SEAs greater than 8∘ should be used in further analyses.
One file containing 10 min averages of spectral irradiances, meteorological variables, and air quality observations was created for each of the three surface stations for each of the three years. These nine files can be downloaded from the PANGAEA website using a unique identifier (https://doi.org/10.1594/PANGAEA.879722). To avoid confusion, time stamps are given for both the beginning and the end of each 10 min averaging period. These files are self-explanatory and contain 40 columns for station S1, 29 columns for station S2, and 29 columns for station S3 with variables mentioned in Table 6.
For each spectral band, there is one column with a quality flag, which gives information if the measured value of spectral irradiance passed the QC: “1” means that the measurement falls in the interval [0.03 E0, E0] and “0” means that it is outside. All data including night measurements are present in the datasets. Figures depicting the influence of the horizon on the measuring stations are included in each dataset and in the Supplement. The dataset for the station S1 contains additional columns with meteorological data measured by PHI (Table 6). Data of air pollutants and meteorological variables measured by PHI had a native 1 h resolution, so they were copied to all six 10 min records of data measured by the University of Ostrava for each hour. These data can be connected with the dataset for station S2 because of the identical location of stations S1 and S2 (BGOU).
A homogeneous database of 10 min measurements of downward solar irradiance in several ultraviolet and visible bands has been assembled. Currently, the data cover the period from July 2014 to December 2016 and originate from three ground stations representing two locations in the Ostrava city (Czech Republic) with different air pollution conditions. These quality-checked data are available online at https://doi.org/10.1594/PANGAEA.879722. The data provide an insight into the spatial and temporal variability in solar radiation in spectral bands 280–315 nm (UVB), 315–380 nm (UVA), 400–700 nm (PAR), 510–700 nm, 600–700 nm, 610–680 nm (660 nm), 690–760 nm (730 nm), and 400–1100 nm (broadband). These spectral intervals were selected according to their significance for the plant physiology and development. It is possible to calculate the PPFD in blue 400–510 nm (the PAR PPFD minus the PPFD in 510–700 nm) or in green 510–600 nm (the PPFD in 510–700 nm minus the PPFD in 600–700 nm). Hence, changes and differences in irradiances and PPFDs in these spectral bands can be studied in different meteorological and air pollution conditions. Because of the specific environmental conditions of the stations, these data have some limitations that should be taken into account before use. Because of their high temporal resolution and the period spanning more than 2 years, these data constitute a precious tool for the estimation of the radiation environment in an industrial city in central Europe and they can be used as input data for any environmental modelling, e.g. for atmospheric chemistry models or urbanistic studies. One of the goals is to characterize the influence of atmospheric pollution on the spectral composition of incident solar radiation with a focus on analyses of differences between measured values. For example, analyses of relationships between some spectral ratios (e.g. UVB/PAR, UVA/PAR, blue/PAR, blue/red, etc.) and concentrations of air pollutants are planned. Based on preliminary results, changes in spectral composition of incident solar radiation induced by individual air pollutants can be specific and they could differently influence physiological processes in plants. Thus, the understanding of the radiation environment is crucial in relation to vegetation and its ecological services in cities. The measurements of solar irradiation will continue and new data can be added to this database later, thus longer and detailed studies of time series will become available for this location of an industrial city in central Europe.
The supplement related to this article is available online at: https://doi.org/10.5194/essd-10-837-2018-supplement.
Lucien Wald suggested possibilities for the data quality check. Philippe Blanc determined a shading effect on measuring stations according to combinations of solar zenithal and elevation angles and horizon. Lucien Wald, Philippe Blanc, Martin Navrátil, and Vladimír Špunda participated in the manuscript preparation. Marie Opálková did the operation and maintenance of the sensors and designed the data set, made a data quality check, and prepared the manuscript with contributions from all co-authors.
The authors declare that they have no conflict of interest.
This work was financially supported by COST CZ LD14005, Institutional
Research Support grants (SGS06/UVAFM/2016 and SGS05/UVAFM/2017) from the
University of Ostrava, by EU structural funding Operational Programme
Research and Development for Innovation, project no. CZ.1.05/2.1.00/19.0388,
and by the Ministry of Education, Youth and Sports of the Czech Republic in
the “National Feasibility Program I”, project LO1208 “TEWEP”. We thank the
Public Health Institute Ostrava and EMS Brno for the cooperation. We
thank Amelie Driemel for her valuable comments. We thank Vladimír
Bradáč for his English language assistance. We thank the anonymous
reviewers for their helpful comments and suggestions.
Edited by: Kirsten Elger
Reviewed by: two anonymous referees
Barillot, R., Frak, E., Combes, D., Durand, J. L., and Escobar-Gutiérrez, A. J.: What determines the complex kinetics of stomatal conductance under blueless PAR in Festuca arundinacea? Subsequent effects on leaf transpiration, J. Exp. Bot., 61, 2795–2806, https://doi.org/10.1093/jxb/erq115, 2010.
Behn, H., Albert, A., Marx, F., Noga, G., and Ulbrich, A.: Ultraviolet-B and photosynthetically active radiation interactively affect yield and pattern of monoterpenes in leaves of peppermint (Mentha × piperita L.), J. Agric. Food Chem., 58, 7361–7367, https://doi.org/10.1021/jf9046072, 2010.
Casal, J. J.: Photoreceptor Signaling Networks in Plant Responses to Shade, Annu. Rev. Plant Biol., 64, 403–427, https://doi.org/10.1146/annurev-arplant-050312-120221, 2013.
EEA (European Environment Agency): Urban Atlas, available at: https://www.eea.europa.eu/data-and-maps/data/urban-atlas#tab-gis-data (last access: 10 February 2018), 2017.
Elshout, S. van den, Léger, K., and Nussio, F.: Comparing urban air quality in Europe in real time. A review of existing air quality indices and the proposal of a common alternative, Environ. Int., 34, 720–726, https://doi.org/10.1016/j.envint.2007.12.011, 2008.
Grifoni, D., Carreras, G., Zipoli, G., Sabatini, F., Dalla Marta, A., and Orlandini, S.: Row orientation effect on UV-B, UV-A and PAR solar irradiation components in vineyards at Tuscany, Italy, Int. J. Biometeorol., 52, 755–763, https://doi.org/10.1007/s00484-008-0168-1, 2008.
Jacovides, C. P., Timvios, F. S., Papioannou, G., Asimakopoulos, D. N., and Theofilou, C. M.: Ratio of PAR to broadband solar radiation measured in Cyprus, Agric. For. Meteorol., 121, 135–140, https://doi.org/10.1016/j.agrformet.2003.10.001, 2004.
Jančík, P., Pavlíková, I., Bita, J., and Hladký, D.: Atlas ostravského ovzduší [The Guide of Ostrava Climate], Ostrava, VŠB-TUO Ostrava, 2013.
Johkan, M., Shoji, K., Goto, F., Hashida S., and Yoshihara, T.: Blue light-emitting diode light irradiation of seedlings improves seedling quality and growth after transplanting in red leaf lettuce, HortScience, 45, 1809–1814, 2010.
Journée, M. and Bertrand, C.: Quality control of solar radiation data within the RMIB solar measurements network, Sol. Energy, 85, 72–86, https://doi.org/10.1016/j.solener.2010.10.021, 2011.
Korany, M., Boraiy, M., Eissa, Y., Aoun, Y., Abdel Wahab, M. M., Alfaro, S. C., Blanc, P., El-Metwally, M., Ghedira, H., Hungershoefer, K., and Wald, L.: A database of multi-year (2004–2010) quality-assured surface solar hourly irradiation measurements for the Egyptian territory, Earth Syst. Sci. Data, 8, 105–113, https://doi.org/10.5194/essd-8-105-2016, 2016.
Kurucz, R. L.: Synthetic infrared spectra, in: Infrared Solar Physics, IAU Symp. 154, edited by: Rabin, D. M. and Jefferies, J. T., Kluwer, Acad., Norwell, MA, 1992.
Lambers, H., Chapin, III F. S., and Pons, T. L.: Plant Physiological Ecology, Springer, 2008.
Mayer, B. and Kylling, A.: Technical note: The libRadtran software package for radiative transfer calculations – description and examples of use, Atmos. Chem. Phys., 5, 1855–1877, https://doi.org/10.5194/acp-5-1855-2005, 2005.
Materová, Z., Sobotka, R., Zdvihalová, B., Oravec, M., Nezval, J., Karlický, V., Vrábl, D., Štroch, M., and Špunda, V.: Monochromatic green light induces and aberrant accumulation of geranylgeranyled chlorophylls in plants, Plant Physio. Biochem., 116, 48–56, https://doi.org/10.1016/j.plaphy.2017.05.002, 2017.
Meijkamp, B., Aerts, R., Staaij van de, J. W. M., Tosserams, M., Ernst W. H. O., and Rozema, J.: Effects of UV-B on secondary metabolites in plants, in: Stratospheric Ozone Depletion: The Effects of Enhanced UV-B Radiation on Terrestrial Ecosystems, edited by: Rozema, J., Leiden: Backhuys Publishers, 71–99, 1999.
Mims III, F. M. and Frederick, J. E.: Cumulus clouds and UV-B, Nature, 371, 291, https://doi.org/10.1038/371291a0, 1994.
Muneer, T. and Fairooz, F.: Quality control of solar radiation and sunshine measurements – lessons learnt from processing worldwide databases, Build. Serv. Eng. Res. Technol., 23, 151–166, https://doi.org/10.1191/0143624402bt038oa, 2002.
Navrátil, M., Špunda, V., Marková, I., and Janouš, D.: Spectral composition of photosynthetically active radiation penetrating into a Norway spruce canopy: the opposite dynamics of the blue/red spectral ratio during clear and overcast days, Trees, 21, 311–320, https://doi.org/10.1007/s00468-007-0124-4, 2007.
Ohashi-Kaneko, K., Takase, M., Kon, N., Fujiwara, K., and Kurata, K.: Effect of light quality on growth and vegetable quality in leaf lettuce, spinach and komatsuna, Environ. Control Biol., 45, 189–198, https://doi.org/10.2525/ecb.45.189, 2007.
Opálková, M., Navrátil, M., Spunda, V., Blanc, P., and Wald, L: High-resolution radiation and meteorological variables measurements for Ostrava, Czech Republic, PANGEA, https://doi.org/10.1594/PANGAEA.879722, 2017.
Peel, M. C., Finlayson, B. L., and McMahon, T. A.: Updated world map of the Köppen-Geiger climate classification, Hydrol. Earth Syst. Sci., 11, 1633–1644, https://doi.org/10.5194/hess-11-1633-2007, 2007.
Reddy, A. R. and Raghavendra, A. S.: Photooxidative stress, in: Physiology and Molecular Biology of Stress Tolerance, edited by: Madhava Rao, K. V., Raghavendra, A. S., and Reddy, K. J., Springer, 2006.
Roesch, A., Wild, M., Ohmura, A., Dutton, E. G., Long, C. N., and Zhang, T.: Assessment of BSRN radiation records for the computation of monthly means, Atmos. Meas. Tech., 4, 339–354, https://doi.org/10.5194/amt-4-339-2011, 2011.
Sayre, R. M. and Kligman, L. H.: Discrepancies in the Measurement of Spectral Sources, Photochem. Photobiol., 55, 141–143, https://doi.org/10.1111/j.1751-1097.1992.tb04221.x, 1992.
Tilbrook, K., Arongaus, A. B., Binkert, M., Heijde, M., Yin, R., and Ulm, R.: The UVR8 UVB-Photoreceptor: Perception, Signaling and Response, Arabidopsis Book, 11, e0164, https://doi.org/10.1199/tab.0164, 2013.
Verdaguer, D., Jansen, M. A., Llorens, L., Morales, L. O., and Neugart, S.: UV-A radiation effects on higher plants: Exploring the known unknown, Plant Sci., 255, 72–81, https://doi.org/10.1016/j.plantsci.2016.11.014, 2017.
Wald, L.: Solar Radiation Energy (Fundamentals and Theory). In Solar Energy Conversion and Photoenergy Systems, in: Encyclopedia of Life Support Systems (EOLSS), edited by: Blanco, J. and Malato, S., Developed under the Auspices of the UNESCO, Eolss Publishers, Oxford, UK, available at: http://www.eolss.net, last access: 17 July, 2007.
Weissmannová, H. et al.: Ostravsko [The Ostrava region], in: Chráněná území ČR, svazek X [Protected areas of the Czech Republic Volume X], edited by: Mackovčin, P. and Sedláček, M., AOPK ČR & Ekocentrum Brno, ISBN 80-86064-67-0, Praha, 456 pp., 2004.
WMO: CIMO Guide to meteorological instruments and methods of observation, WMO-No 8, 2008 edition updated in 2014, World Meteorological Organization, Commission for Instruments and Methods of Observation, Geneva, Switzerland, 2014.
Younes, S., Claywell, R., and Muneer, T.: Quality control of solar radiation data, present status and proposed new approaches, Energy, 30, 1533–1549, https://doi.org/10.1016/j.energy.2004.04.031, 2005.
Zhou, Y. and Savijärvi, H.: The effect of aerosols on long wave radiation and global warming, Atmos. Res., 135–136, 102–111, https://doi.org/10.1016/j.atmosres.2013.08.009, 2014.