the Creative Commons Attribution 4.0 License.
the Creative Commons Attribution 4.0 License.
 | 16 Jan 2018
The National Eutrophication Survey: lake characteristics and historical nutrient concentrations
Chanse Ford
Dustin Kincaid
Katelyn King
Heather Miller
Ryan Nagelkirk
Historical ecological surveys serve as a baseline and provide context for contemporary research, yet many of these records are not preserved in a way that ensures their long-term usability. The National Eutrophication Survey (NES) database is currently only available as scans of the original reports (PDF files) with no embedded character information. This limits its searchability, machine readability, and the ability of current and future scientists to systematically evaluate its contents. The NES data were collected by the US Environmental Protection Agency between 1972 and 1975 as part of an effort to investigate eutrophication in freshwater lakes and reservoirs. Although several studies have manually transcribed small portions of the database in support of specific studies, there have been no systematic attempts to transcribe and preserve the database in its entirety. Here we use a combination of automated optical character recognition and manual quality assurance procedures to make these data available for analysis. The performance of the optical character recognition protocol was found to be linked to variation in the quality (clarity) of the original documents. For each of the four archival scanned reports, our quality assurance protocol found an error rate between 5.9 and 17 %. The goal of our approach was to strike a balance between efficiency and data quality by combining entry of data by hand with digital transcription technologies. The finished database contains information on the physical characteristics, hydrology, and water quality of about 800 lakes in the contiguous US (Stachelek et al., 2017, https://doi.org/10.5063/F1639MVD). Ultimately, this database could be combined with more recent studies to generate meta-analyses of water quality trends and spatial variation across the continental US.
- Article
(483 KB) - Full-text XML
- BibTeX
- EndNote


Effective management of inland freshwater lakes requires an understanding of the factors that affect water quality and how these factors change over time. One of these factors, termed eutrophication, occurs when excess nutrient inputs from human activities fuels increases in algal growth, which can cause hypoxia and decreases in water clarity. Eutrophication of surface waters from increased phosphorus and nitrogen loading has been observed in connection with altered land use, especially in areas of rapid urbanization and intensive agriculture (Smith et al., 1999, 2014). As human populations and their impacts continue to grow, eutrophication is expected to become more widespread (Bennett et al., 2001; Taranu and Gregory-Eaves, 2008). Historical datasets are needed in order to track, understand, and manage eutrophication in lakes and reservoirs because they serve as an important baseline for modern studies.
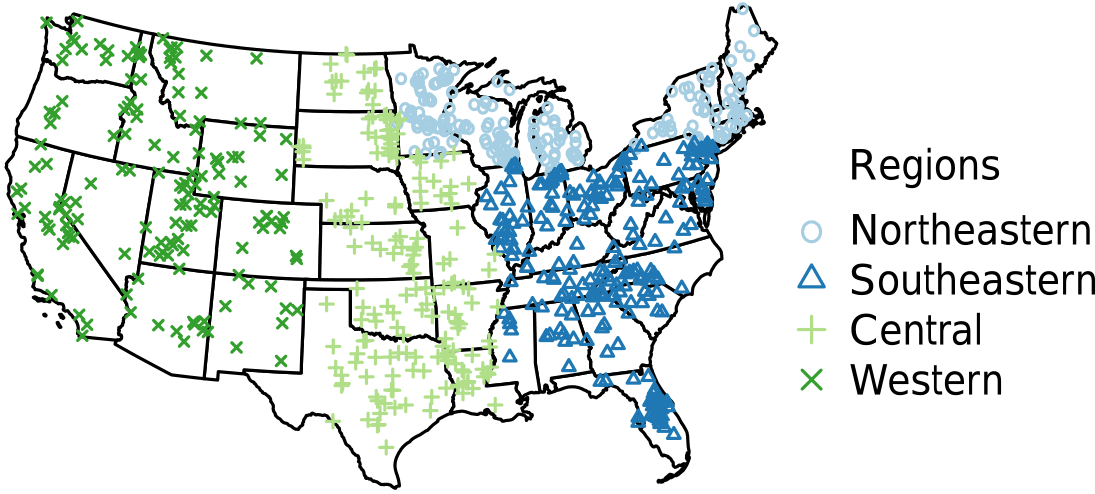
Figure 1Survey locations colored by sampling year (1972 northeastern: light blue; 1973 southeastern: blue; 1974 central: light green; 1975 western: green).
The US Environmental Protection Agency (EPA) designed and implemented the National Eutrophication Survey (NES) in order to investigate the extent of eutrophication in freshwater lakes and reservoirs across the contiguous US. Sampling took place in over 800 lakes and reservoirs from 1972 to 1975 and included a variety of physical, chemical, and biological metrics including data on nutrients and nutrient loading, hydrologic retention time, morphometry, and plankton community diversity. Each lake was sampled on a monthly basis for a period of 1 year. Except for the phytoplankton distribution subset, which we did not transcribe (see Stomp et al., 2011), the NES data are provided as annual averages. Unlike current EPA National Lakes Assessments (NLAs) that select a random sample of lakes across the US, the NES targeted only lakes impacted directly or indirectly by municipal sewage treatment plant discharge (USEPA, 2009, 1975). Until recently, these data were only available in their entirety as four separate scanned reports representing the northeastern and north-central (northeastern), eastern and southeastern (southeastern), central, and western regions of the US (Fig. 1). In the remainder of the present paper we refer to the former two regions as simply the northeastern and southeastern regions.
To our knowledge, there have been no attempts to transcribe the data into a usable, searchable digital database despite its use in previous studies. For example, large portions of the dataset were used to examine large-scale relationships between residence time and phytoplankton abundance (Soballe and Kimmel, 1987). Also, it was used to predict eutrophication incidence in a Bayesian framework (Lamon and Stow 2004). Smaller portions of the data were used to explore drivers of nutrient loading (Stomp et al., 2011; Brett and Benjamin, 2008). However, to our knowledge, the only study to use the NES dataset and provide a publicly available data supplement is that of Stomp et al. (2011), but their data supplement was limited to a small subset of the available variables relating to phytoplankton community diversity.
The present study is the first to leverage digital transcription technologies to unlock the full NES dataset. In this paper, we describe the digital transcription of the full NES dataset with the goal of making the dataset openly accessible to the research community. Specifically, our objective was to exactly reproduce the contents of the original dataset rather than to evaluate its scientific integrity. We introduce and publish the data in an open format that requires no proprietary software. It can be easily downloaded, used for analysis, and amended. The provided summary statistics and figures also allow users to quickly assess the utility of the data. Finally, the code and raw data files are provided to facilitate the extraction of fields not represented in our completed dataset (mostly phytoplankton diversity data).
Data were collected from multiple locations within the water column and included in situ measurements as well as laboratory analyses. Flow estimates and drainage area calculations were provided by the US Geological Survey and were determined from flow gauges when present. More detailed information on sampling methods, units, equipment, and accuracy can be found in the EPA survey methods publication (USEPA, 1975). Due to the historical nature of the dataset, the NES sampling design differs from more modern efforts (USEPA, 2009). For example, the original NES data were collected from four separate regions of the US over the course of 4 years, whereas current assessments complete nationwide sampling in a single summer. As such, NES data values represent the mean of measurements taken in the spring, summer, and fall in either 1972 (northeastern), 1973 (southeastern), 1974 (central), or 1975 (western) rather than summer measurements taken in a single year.
We obtained the NES archival scanned reports from the EPA National Service Center for Environmental Publications (available at: https://www.epa.gov/nscep). The data for each NES region are contained in four separate files. We extracted the data from each file using automated techniques followed by manual quality assurance and checking of each value. To begin, we enhanced (de-noised) each file using the local adaptive filtering algorithm as provided by the ImageMagick program (v6.8.9-9; available at https://www.imagemagick.org/). Next, we processed the enhanced files using the Tesseract optical character recognition (OCR) program (Ooms, 2017; Smith, 2007). The output of these initial extraction steps was recorded in a set of “raw data” files in which each file contains the raw unprocessed text of each document page. The contents of specific fields in the raw data were extracted to a database using the automated rules provided by the nesR software package (Stachelek, 2017). Finally, all values in the database were manually checked for accuracy against the original scanned reports. Inaccurate OCR outputs were corrected by hand in the final database. Because our goal was to reproduce the data from the original reports and not to verify the technical correctness of the original data, we only changed values if they did not match the original data reports. For example, we did not change data from the five NES lakes that had phosphate (PO4) values exceeding their corresponding total phosphorus (TP) values despite the fact that this is not physically possible (PO4 is a component of TP).
We provide the final dataset in an open nonproprietary format (comma-delimited, *.csv). In addition, we generated metadata descriptions from the contents of the original scanned reports. All calculations, table construction, and figure generation were performed in R and saved as reproducible R scripts (R Core Team, 2017). Table and figure generation was accomplished with the use of the reshape2, plyr, and sp packages (Wickham, 2016; Pebesma and Bivand, 2017).
Table 1Number of measurements (n) for each variable in each NES region.
The final NES dataset contains observations from 775 lakes and the distribution of these lakes was spatially variable. Although there were more lakes measured in the northeastern and southeastern US, the number of locations was close to evenly distributed among the remaining regions (Fig. 1, Table 1). Specifically, the number of lakes sampled in each region were as follows: northeastern – 200 lakes, southeastern – 245 lakes, central – 177 lakes, and western – 153 lakes.
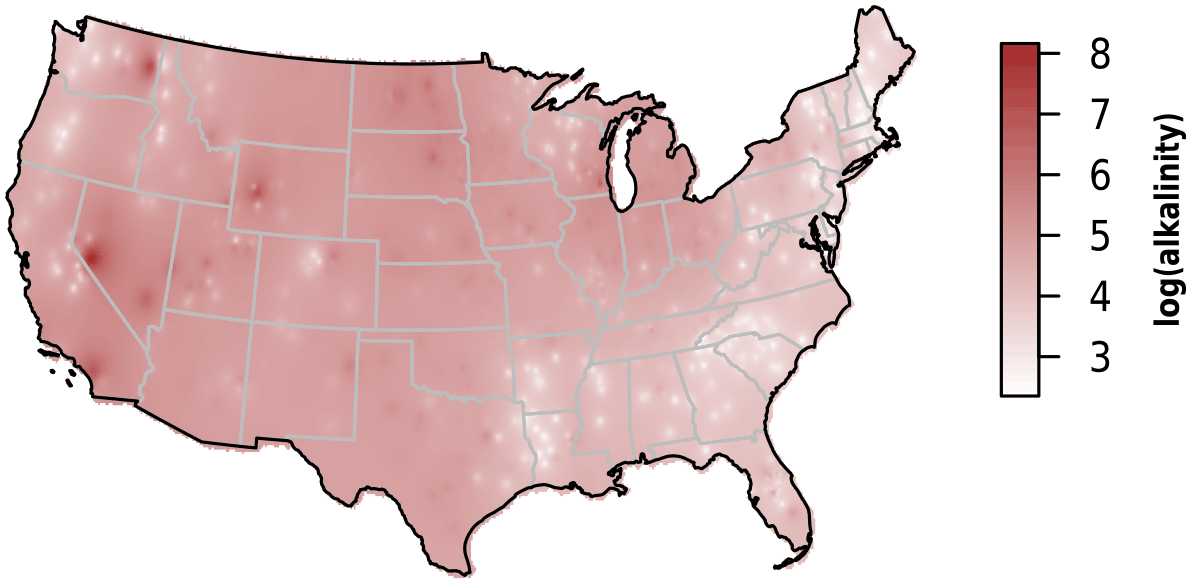
Figure 2Map of log-scaled alkalinity (mg L−1) interpolated using inverse distance weighting.
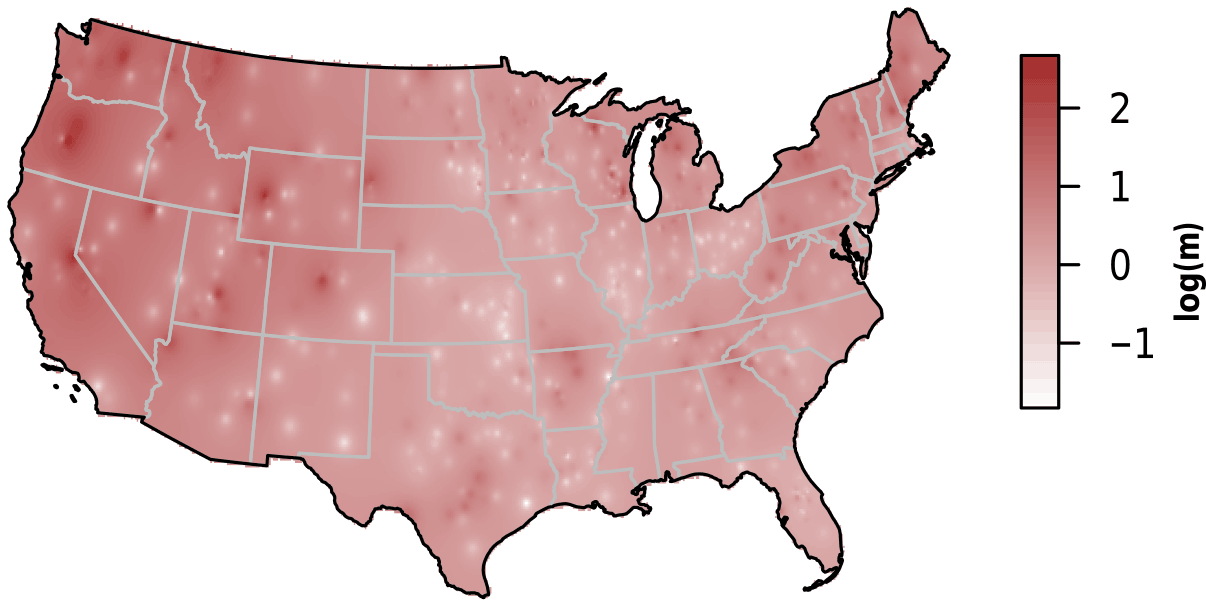
Table 2Mean and standard deviation (SD) for each variable in each NES region.
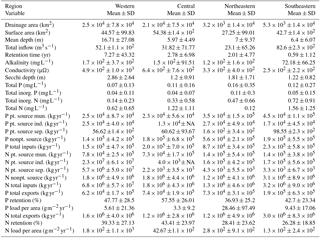
In addition to differences in the total number of lakes measured in each region, there were also differences in the proportion of lakes classified as impoundments rather than as natural lakes. For example, slightly more than half of all the lakes studied (462 of 775) were classified as impoundments yet the northeastern region had only 54 impoundments while the southeastern region had 168 impoundments. Conversely, the number of natural lakes sampled in the northeastern region (146 lakes) was more than double that of any other region (77, 48, and 42 for the southeastern, western, and central US, respectively).
We observed substantial spatial variation in many of the individual lake characteristics. For example, lakes in the eastern subregions were generally smaller and shallower than lakes in the western subregion (Table 2). In addition, lakes in the western subregion generally had higher alkalinity and higher water clarity (Figs. 2 and 3). Lakes with particularly low alkalinity were found in coastal areas, whereas lakes with particularly high alkalinity were found in Nevada, western Washington, and parts of North Dakota. Comparisons among regions was easy for some well-sampled lake chemistry parameters such as TP but more difficult for undersampled lake chemistry parameters. A particularly extreme example of this difficulty was total nitrogen measurements in the eastern region, as this parameter was only measured for a single lake (Table 1).
The ability to examine these spatial trends was made possible by our OCR procedure, which had 6–17 % accuracy depending on region and archival report scan quality. In total, we carried out approximately 5000 corrections to the automated data product by hand as part of our manual quality control review. A total of approximately 650 lakes had values for at least 80 % of the total number of variables shown in Table 1. On an individual lake basis, the most common “missing” data were nutrient loading estimates for individual point- and nonpoint-source components. In many cases, these data may not actually be missing but they may not have been a component of the budget for that particular lake. For example, not all lakes have industrial land use so no data are expected in these cases.
Original scanned reports from the EPA are available from the EPA National Service Center for Environmental Publications (https://www.epa.gov/nscep). Our cleaned and useable data are available for download at Stachelek et al. (2017). The data are provided as a zip file, which contains all versions of the data including the raw and quality-checked versions (Stachelek et al., 2017). Moreover, the R package and R code used to scrape and analyze the data are provided by Stachelek (2017) so that the methods may be reproduced and openly available for (re)use. All figures and summary statistics were generated with R scripts available in the data supplement.
We have demonstrated an approach for rescuing historical data from scanned documents. In particular, our approach involved a two-step process of automated data scraping followed by curation by hand and quality assurance. Overall, we found that OCR was an efficient method for reducing the labor associated with transcribing analog text records (e.g., Drinkwater et al., 2014). Unfortunately, OCR technology does not have absolute accuracy. In our case, transcription was hampered by poor print and scan quality of the source paper documents. We discovered through our manual validation procedure that the OCR computations produced inaccurate values in approximately 6–17 % of the cells in the complete dataset (n=4836). We expect that accuracy could be improved by experimenting with varying the window size of the local adaptive thresholding algorithm relative to the document font size. Our ability to experiment with thresholding window size was limited due to the computationally expensive nature of these extractions.
The end result of our approach was data from every lake and nearly every variable in the NES survey dataset. The only primary subset of the NES data that is not included in our final product is the phytoplankton distribution data, which have already been digitally transcribed by Stomp et al. (2011). The results of the present study could be used to explore anthropogenic and environmental drivers of lake eutrophication as well as to verify previously documented trends. One example is the 2007 National Lakes Assessment Report, which included a reanalysis of some of the NES study lakes (USEPA, 2009). This reanalysis considered population level trends in the NES lakes but did not consider trends in individual lakes or potential environmental drivers contributing to observed trends. On a population basis, the NLA reanalysis found that less than 30 % of the NES lakes had increased chlorophyll and phosphorus concentrations. The results of the present study could be used to verify these claims as well as to compare the NES data with more recent work such as the 2012 National Lakes Assessment. Note that sampling techniques may differ from current techniques; thus, care should be given when making comparisons. In addition to their utility in validating historical trends, this dataset has value because it contains data on a number of hydrographic variables that are difficult to estimate, such as water residence (retention) time. Such data are critical to a variety of hydrological and water quality modeling efforts (Brett and Benjamin, 2008).
Although our goal was to digitally transcribe the full NES dataset to facilitate studies on historical nutrient loading, it is worth noting the similarities between the present study and other scientific record digitization initiatives. Such initiatives are common in the climate and ocean sciences but they are just starting to gain momentum in the biological sciences (Allan et al., 2011; Freeman et al., 2017). To our knowledge, the present study is the first large-scale attempt at digitization of historical limnology records. We hope that by making our analysis open and reproducible we will inspire future efforts to recover important records from the pre-digital era.
All authors contributed to data quality assurance and edited the article text. JS conceived the study and implemented the optical character recognition code. CF, DK, and RN performed the data analysis and made figures. KK, HM, and JS wrote major parts of the paper.
The authors declare that they have no conflict of interest.
This work was developed as part of the Reproducible Quantitative Methods
course (https://cbahlai.github.io/rqm-template/) led by Christie
Bahlai, which was funded by the Mozilla Foundation, the Leona M. and Harry
B. Helmsley Charitable Trust, the Michigan State University Program in Ecology
and Evolutionary Biology, the BEACON Center for the Study of Evolution in Action, and the
Kellogg Biological Station Long-Term Ecological Research site (NSF-DEB
no. 1027253). Jemma Stachelek was supported by National Science Foundation grant ICER-1517823.
Edited by: David Carlson
Reviewed by: two anonymous referees
Allan, R., Brohan, P., Compo, G. P., Stone, R., Luterbacher, J., and Brönnimann, S.: The international atmospheric circulation reconstructions over the earth (ACRE) initiative, B. Am. Meteorol. Soc., 92, 1421–1425, 2011. a
Bennett, E. M., Carpenter, S. R., and Caraco, N. F.: Human impact on erodable phosphorus and eutrophication: a global perspective: increasing accumulation of phosphorus in soil threatens rivers, lakes, and coastal oceans with eutrophication, AIBS Bulletin, 51, 227–234, 2001. a
Brett, M. T. and Benjamin, M. M.: A review and reassessment of lake phosphorus retention and the nutrient loading concept, Freshwater Biol., 53, 194–211, https://doi.org/10.1111/j.1365-2427.2007.01862.x, 2008. a, b
Drinkwater, R. E., Cubey, R. W., and Haston, E. M.: The use of Optical Character Recognition (OCR) in the digitisation of herbarium specimen labels, PhytoKeys, 38, 15–30, 2014. a
Freeman, E., Woodruff, S. D., Worley, S. J., Lubker, S. J., Kent, E. C., Angel, W. E., Berry, D. I., Brohan, P., Eastman, R., Gates, L., Gloeden, W., Ji, Z., Lawrimore, J., Rayner, N. A., Rosenhagen, G. and Smith, S. R.: ICOADS Release 3.0: a major update to the historical marine climate record, Int. J. Climatol., 37, 2211–2232, https://doi.org/10.1002/joc.4775, 2017. a
Ooms, J.: tesseract: Open Source OCR Engine for R, available at: https://CRAN.R-project.org/package=tesseract, R package version 1.6, last access: 2 February 2017. a
Pebesma, E. and Bivand, R.: sp: Classes and Methods for Spatial Data, available at: https://CRAN.R-project.org/package=sp, R package version 1.2-5, last access: 2 February 2017. a
R Core Team: R: A Language and Environment for Statistical Computing, R Foundation for Statistical Computing, Vienna, Austria, available at: https://www.R-project.org/, last access: 2 February 2017. a
Smith, R.: An overview of the Tesseract OCR engine, in: Document Analysis and Recognition, ICDAR 2007, Ninth International Conference on, vol. 2, 629–633, IEEE, 2007. a
Smith, V. H., Tilman, G. D., and Nekola, J. C.: Eutrophication: impacts of excess nutrient inputs on freshwater, marine, and terrestrial ecosystems, Environ. Pollut., 100, 179–196, 1999. a
Smith, V. H., Dodds, W. K., Havens, K. E., Engstrom, D. R., Paerl, H. W., Moss, B., and Likens, G. E.: Comment: Cultural eutrophication of natural lakes in the United States is real and widespread, Limnol. Oceanogr., 59, 2217–2225, 2014. a
Soballe, D. and Kimmel, B.: A large-scale comparison of factors influencing phytoplankton abundance in rivers, lakes, and impoundments, Ecology, 68, 1943–1954, 1987. a
Stachelek, J.: nesR: Scrape Data from National Eutrophication Survey archival PDFs, https://doi.org/10.5281/zenodo.1048154, R package version 0.2, 2017. a, b
Stachelek, J., Ford, C., Kincaid, D., King, K., Miller, H., and Nagelkirk, R.: The National Eutrophication Survey: lake characteristics and historical nutrient concentrations. Knowledge Network for Biocomplexity, https://doi.org/10.5063/F1639MVD, 2017. a, b, c
Stomp, M., Huisman, J., Mittelbach, G. G., Litchman, E., and Klausmeier, C. A.: Large-scale biodiversity patterns in freshwater phytoplankton, Ecology, 92, 2096–2107, 2011. a, b, c, d
Taranu, Z. E. and Gregory-Eaves, I.: Quantifying relationships among phosphorus, agriculture, and lake depth at an inter-regional scale, Ecosystems, 11, 715–725, 2008. a
USEPA: National Eutrophication Survey Methods 1973–1976 (Working Paper No. 175), Tech. rep., United States Environmental Protection Agency, Office of Research and Development, Corvallis, OR, USA, 1975. a, b
USEPA: National Lakes Assessment: A Collaborative Survey of the Nation's Lakes, Tech. rep., United States Environmental Protection Agency, Office of Research and Development, Washington, D.C., USA, 2009. a, b, c
Wickham, H.: plyr: Tools for Splitting, Applying and Combining Data, available at: https://CRAN.R-project.org/package=plyr (last access: 2 February 2017), R package version 1.8.4, 2016. a