the Creative Commons Attribution 4.0 License.
the Creative Commons Attribution 4.0 License.
 | 21 Dec 2018
A synthesis dataset of permafrost-affected soil thermal conditions for Alaska, USA
Elchin Jafarov
Irina Overeem
Vladimir Romanovsky
Kevin Schaefer
Gary Clow
Frank Urban
William Cable
Mark Piper
Christopher Schwalm
Tingjun Zhang
Alexander Kholodov
Pamela Sousanes
Michael Loso
Kenneth Hill
Recent observations of near-surface soil temperatures over the circumpolar Arctic show accelerated warming of permafrost-affected soils. The availability of a comprehensive near-surface permafrost and active layer dataset is critical to better understanding climate impacts and to constraining permafrost thermal conditions and its spatial distribution in land system models. We compiled a soil temperature dataset from 72 monitoring stations in Alaska using data collected by the U.S. Geological Survey, the National Park Service, and the University of Alaska Fairbanks permafrost monitoring networks. The array of monitoring stations spans a large range of latitudes from 60.9 to 71.3∘ N and elevations from near sea level to ∼1300 m, comprising tundra and boreal forest regions. This dataset consists of monthly ground temperatures at depths up to 1 m, volumetric soil water content, snow depth, and air temperature during 1997–2016. These data have been quality controlled in collection and processing. Meanwhile, we implemented data harmonization evaluation for the processed dataset. The final product (PF-AK, v0.1) is available at the Arctic Data Center (https://doi.org/10.18739/A2KG55).
- Article
(3756 KB) - Full-text XML
- BibTeX
- EndNote


Permafrost is frozen ground that remains at or below 0 ∘C for at least two consecutive years and may be found within about a quarter of the terrestrial land area in the Northern Hemisphere and 80 % of the land area in Alaska (Brown et al., 1998; Jorgenson et al., 2008; Zhang et al., 1999). A continuous increase in near-surface air temperatures over the Alaskan Arctic (Romanovsky et al., 2015; Wang et al., 2017) causes warming and thawing of permafrost, which is expected to continue throughout the 21st century with impacts on ecosystems and infrastructure (Callaghan et al., 2011; Hinzman et al., 2013; Liljedahl et al., 2016; Melvin et al., 2017; Shiklomanov et al., 2017). Thaw may have global consequences due to the potential for a significant positive climate feedback related to newly released carbon previously stored within the permafrost (Abbott et al., 2016; Knoblauch et al., 2018; Schaefer et al., 2014). Modeling studies indicate that greenhouse gas emissions following thaw would amplify current rates of atmospheric warming (McGuire et al., 2018). However, large uncertainties exist regarding the timing and magnitude of this permafrost–carbon feedback, in part due to challenges associated with the representation of permafrost processes in the climate models and the lack of comprehensive permafrost datasets with which to test such models (Koven et al., 2015; McGuire et al., 2018). There is an immediate need for ready-to-use reliable near-surface permafrost datasets, including ground temperatures, soil moisture, and related climatic factors (such as air temperature and snow depth), which can serve as benchmarks for the modeling community and help evaluate potential physical, societal, and economic impacts.
The permafrost extent map by Brown et al. (1998) is one of the most widely used metrics for comparing permafrost model results against ground-based data (Koven et al., 2015; McGuire et al., 2018). Another widely used dataset in model validation is the Russian soil temperature dataset of daily ground temperature measurements at different depths ranging from 0 to 3.2 m for 51 years (Sherstiukov, 2012). An additional ground temperature dataset includes daily-mean ground temperatures at various depths from 0 to 3.2 m at more than 800 stations in China, which for selected locations date back to the 1950s (Wang et al., 2015). In addition to shallow borehole ground temperatures data (i.e., depths less than 3 m) there are datasets that archive temperatures from much deeper boreholes (generally >5 m) (Biskaborn et al., 2015; Clow, 2014). Moreover, the Circumpolar Active Layer Monitoring network measures active layer thickness – the maximum soil depth above permafrost that thaws every summer and refreezes in the winter (Brown et al., 2000; Shiklomanov et al., 2008). Here, we consolidated data from shallow borehole ground monitoring stations across Alaska from multiple government agencies. Shallow borehole data are important because they record the most immediate response to the changing environmental conditions, whereas deep ground temperatures take extensive time to respond.
A typical permafrost monitoring station consists of an air temperature sensor, a snow depth sensor, soil moisture sensors, and soil temperature sensors. In situ observations of ground temperatures from the Alaskan Arctic region have been dispersed over different monitoring efforts, which are spread over varying time spans, and are observed at non-standardized depths. The maximum depth of a typical monitoring station ranges from 1 to 3 m below the ground surface. However, not all stations use this design. For example, the National Park Service of Alaska network does not collect soil moisture data. Also, data from permafrost monitoring stations are not archived in a common standardized format and are hosted by different academic and government agencies, such as the Arctic Data Center, the Global Terrestrial Network for Permafrost (GTN-P), the Long Term Ecological Research Network (LTER), and the U.S. Geological Survey (USGS). Thus, we compiled a ready-to-use permafrost dataset in order to allow for efficient data retrieval and processing for permafrost-related analyses.
We compiled the first integrated shallow ground temperatures dataset for permafrost-affected soils across Alaska from the three most reliable monitoring networks operating over the past several decades: the Geophysical Institute Permafrost Laboratory at the University of Alaska Fairbanks (GI-UAF), the National Park Services in Alaska (NPS), and the USGS. This synthesis permafrost dataset for Alaska (PF-AK, version 0.1) includes measured air and ground temperatures at depth intervals up to 1.0 m, snow depth, and soil volumetric water content (VWC) for 72 permafrost monitoring stations across the state of Alaska. Detailed information and metadata are provided for the compiled dataset so that potential users can have a full understanding of the data and their associated limitations. Furthermore, two types of data evaluation were implemented: (i) testing for inconsistencies between air and ground temperature trends and (ii) the use of the snow and heat transfer metric (SHTM) to validate the relations between seasonal temperature amplitudes and snow depth. These technical evaluations are useful for proving data harmonization and reusing these data.
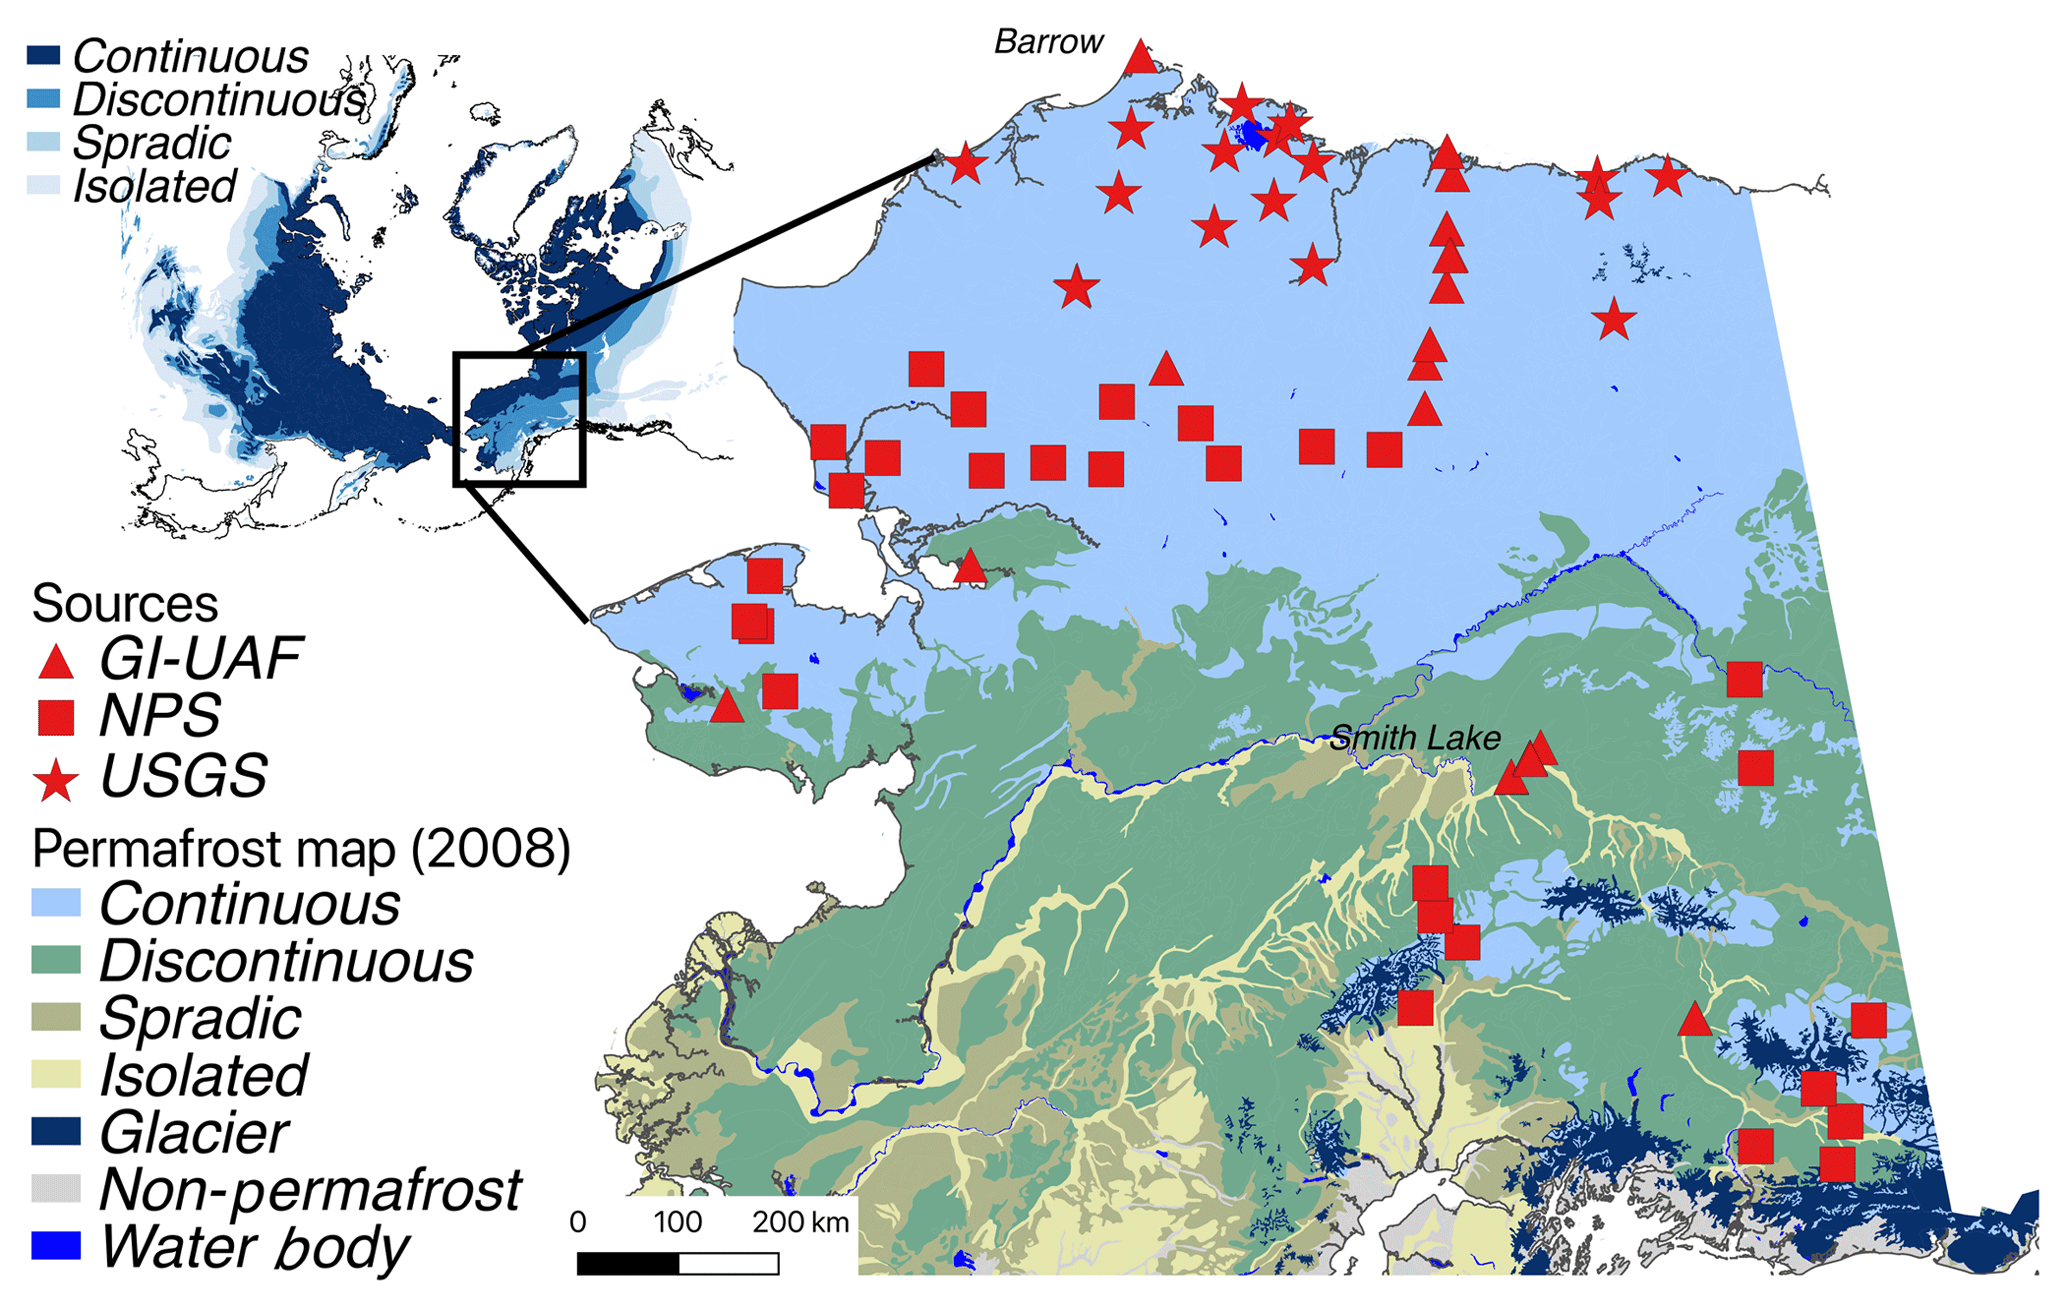
Figure 1Locations of the Geophysical Institute at the University of Alaska Fairbanks (GI-UAF), the U.S. Geological Survey (USGS), and the National Park Services (NPS) permafrost monitoring stations in Alaska. The basemap shows the permafrost distribution of Alaska compiled by Jorgenson et al. (2008).
2.1 Permafrost monitoring networks
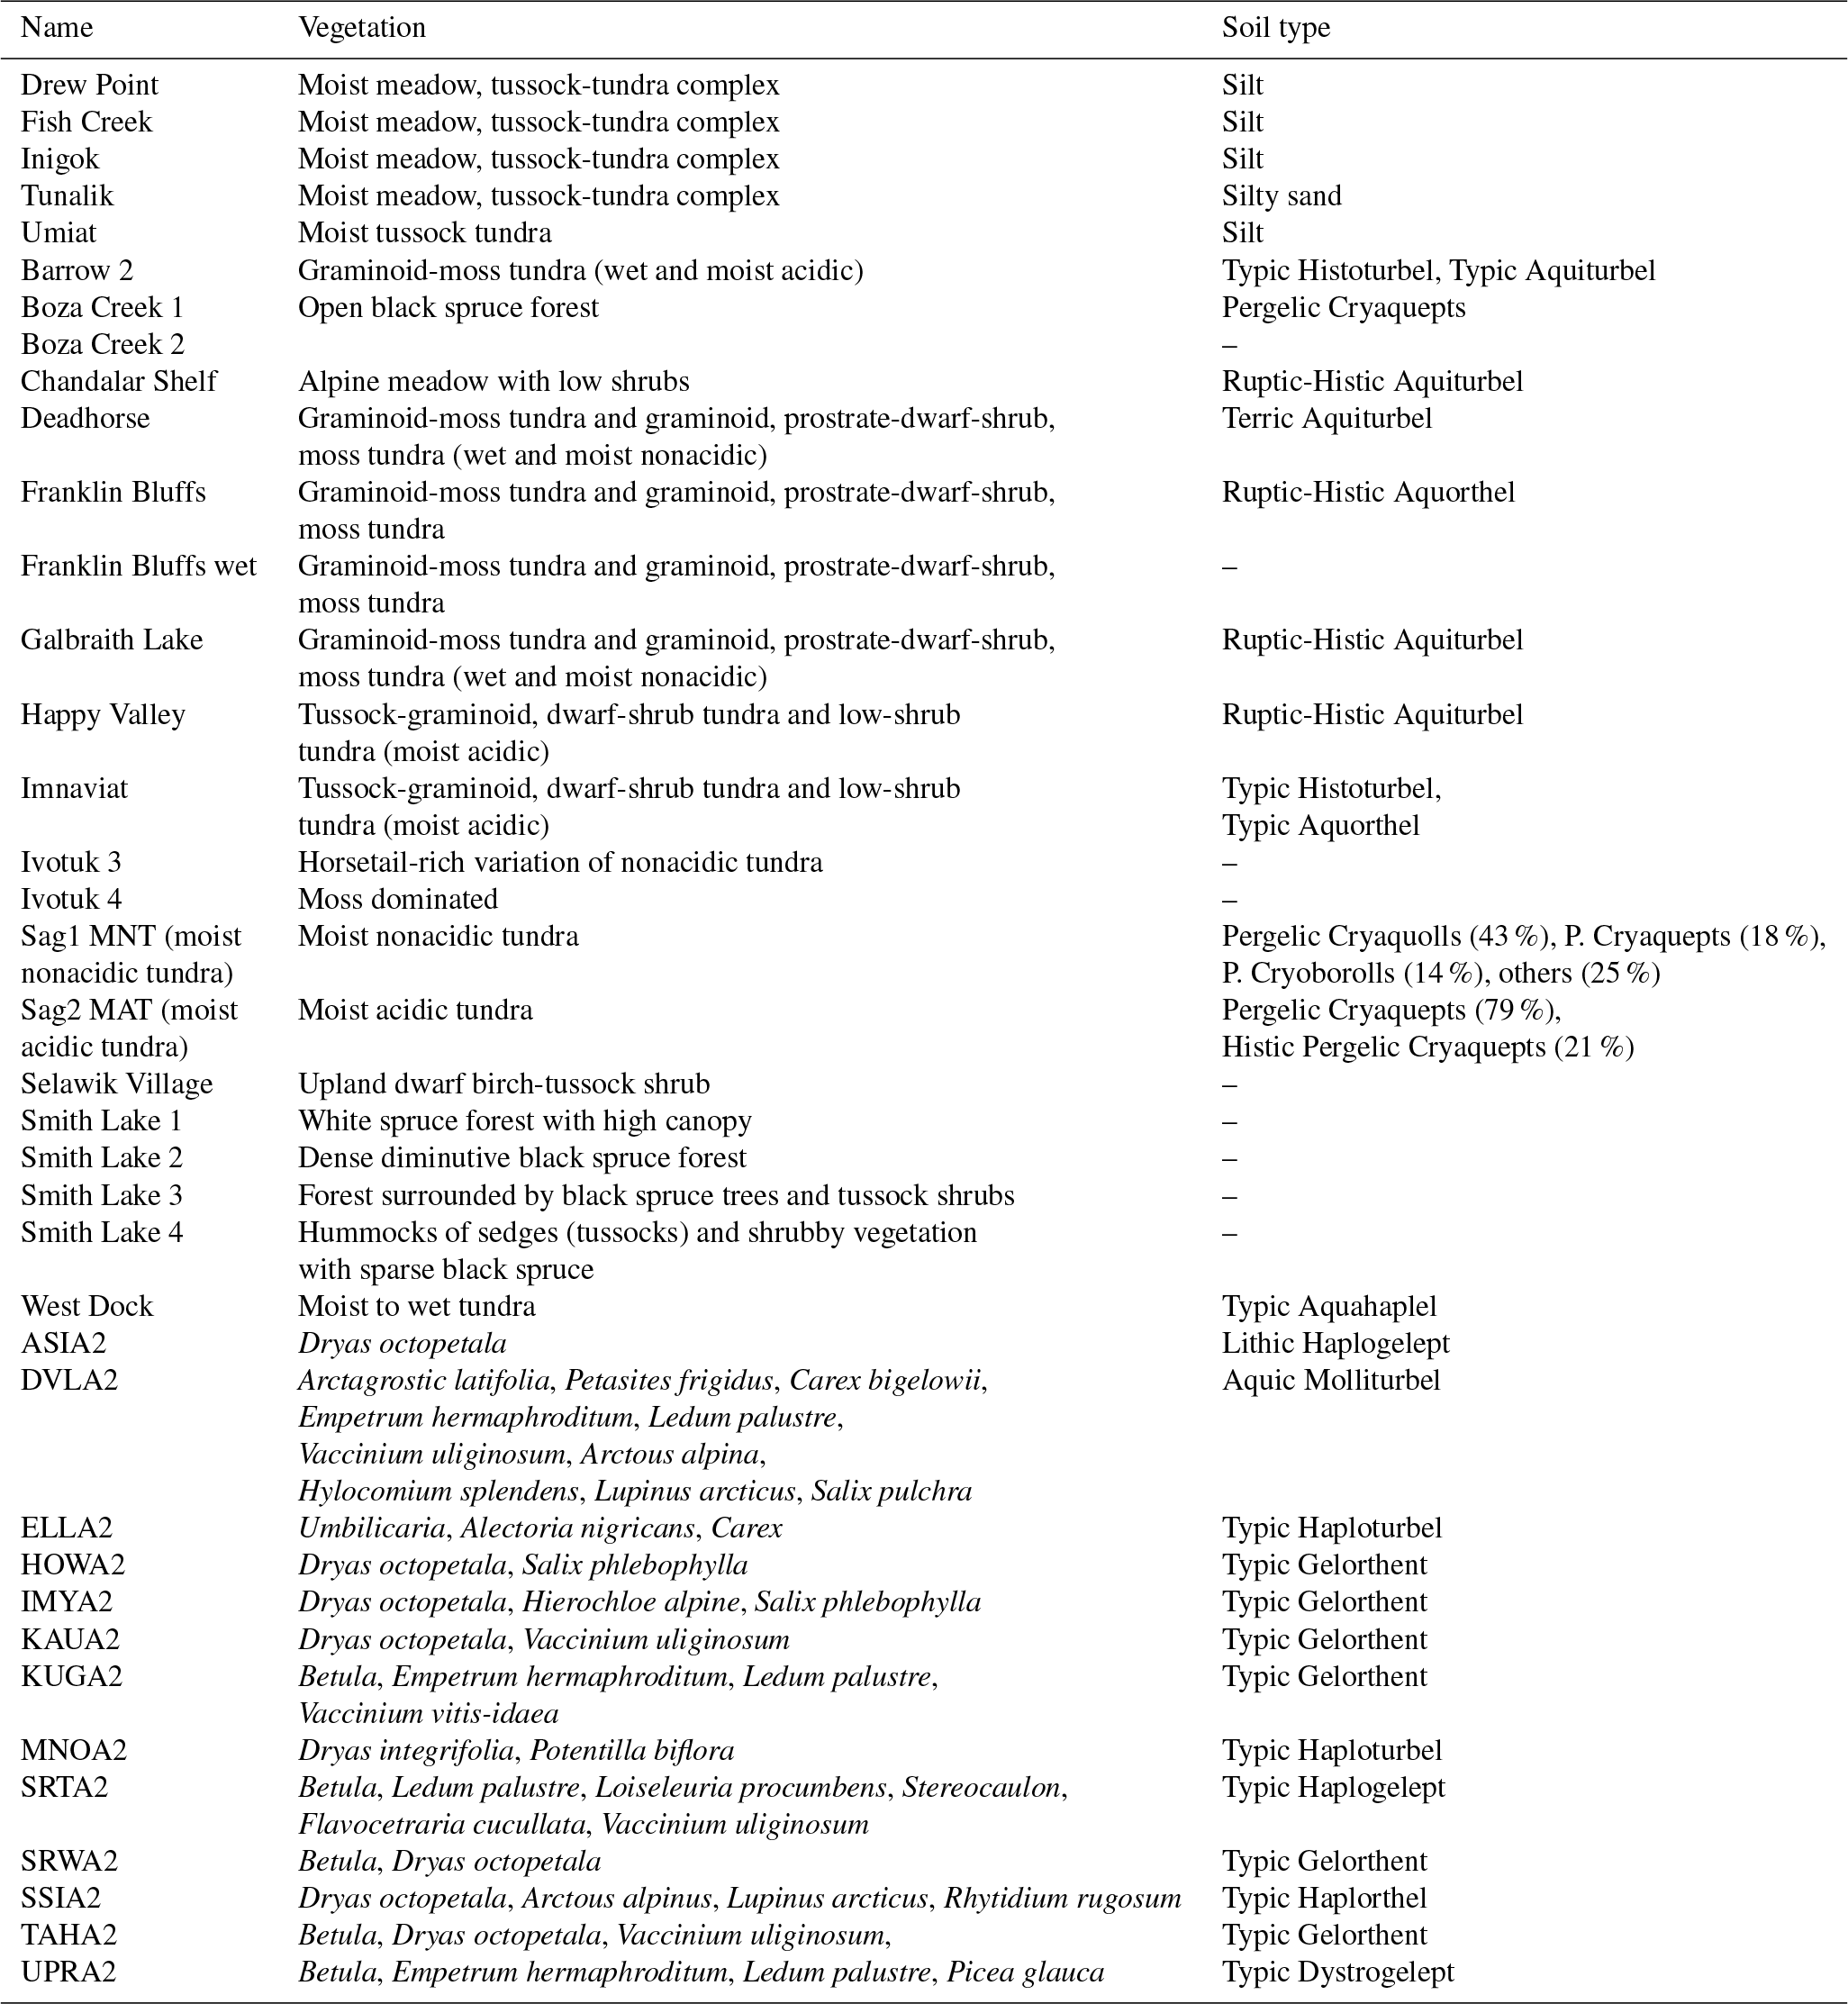
Our synthesis permafrost dataset for Alaska (Fig. 1 and Table 1) is based on observed in situ data collected by the USGS, NPS, and GI-UAF teams. In the late 1990s, researchers at the GI-UAF established a near-surface permafrost monitoring system consisting of 27 stations across Alaska, primarily along the Trans-Alaskan Highway (Fig. 1) (Romanovsky et al., 2015). Similarly, the USGS installed permafrost stations to monitor permafrost conditions within the two federally managed areas on the North Slope, the National Petroleum Reserve Alaska and the Arctic National Wildlife Refuge. Since August 1998, the USGS has maintained 17 automated stations in the area, spanning latitudes from 68.5 to 70.5∘ N and longitudes from 142.5 to 161∘ W (Fig. 1) (Urban and Clow, 2017). NPS has monitored ground temperatures since 2004 at several sites in national parks (Hill and Sousanes, 2015). All monitoring stations are installed on undisturbed land (Fig. 2) at a minimum specified distance from nearby infrastructure. This installation protocol ensures no biases occur associated with anthropogenic or ecosystem disturbances, which is one of the main differences with traditional meteorological stations which are often associated with airstrips and villages in Alaska. A brief description of environmental characteristics of each site, including dominant soil and vegetation type, is summarized in Table 2. Due to the differences in the station design and description used by the various teams, the soil and vegetation descriptions may not be fully comparable and are not available at all sites.
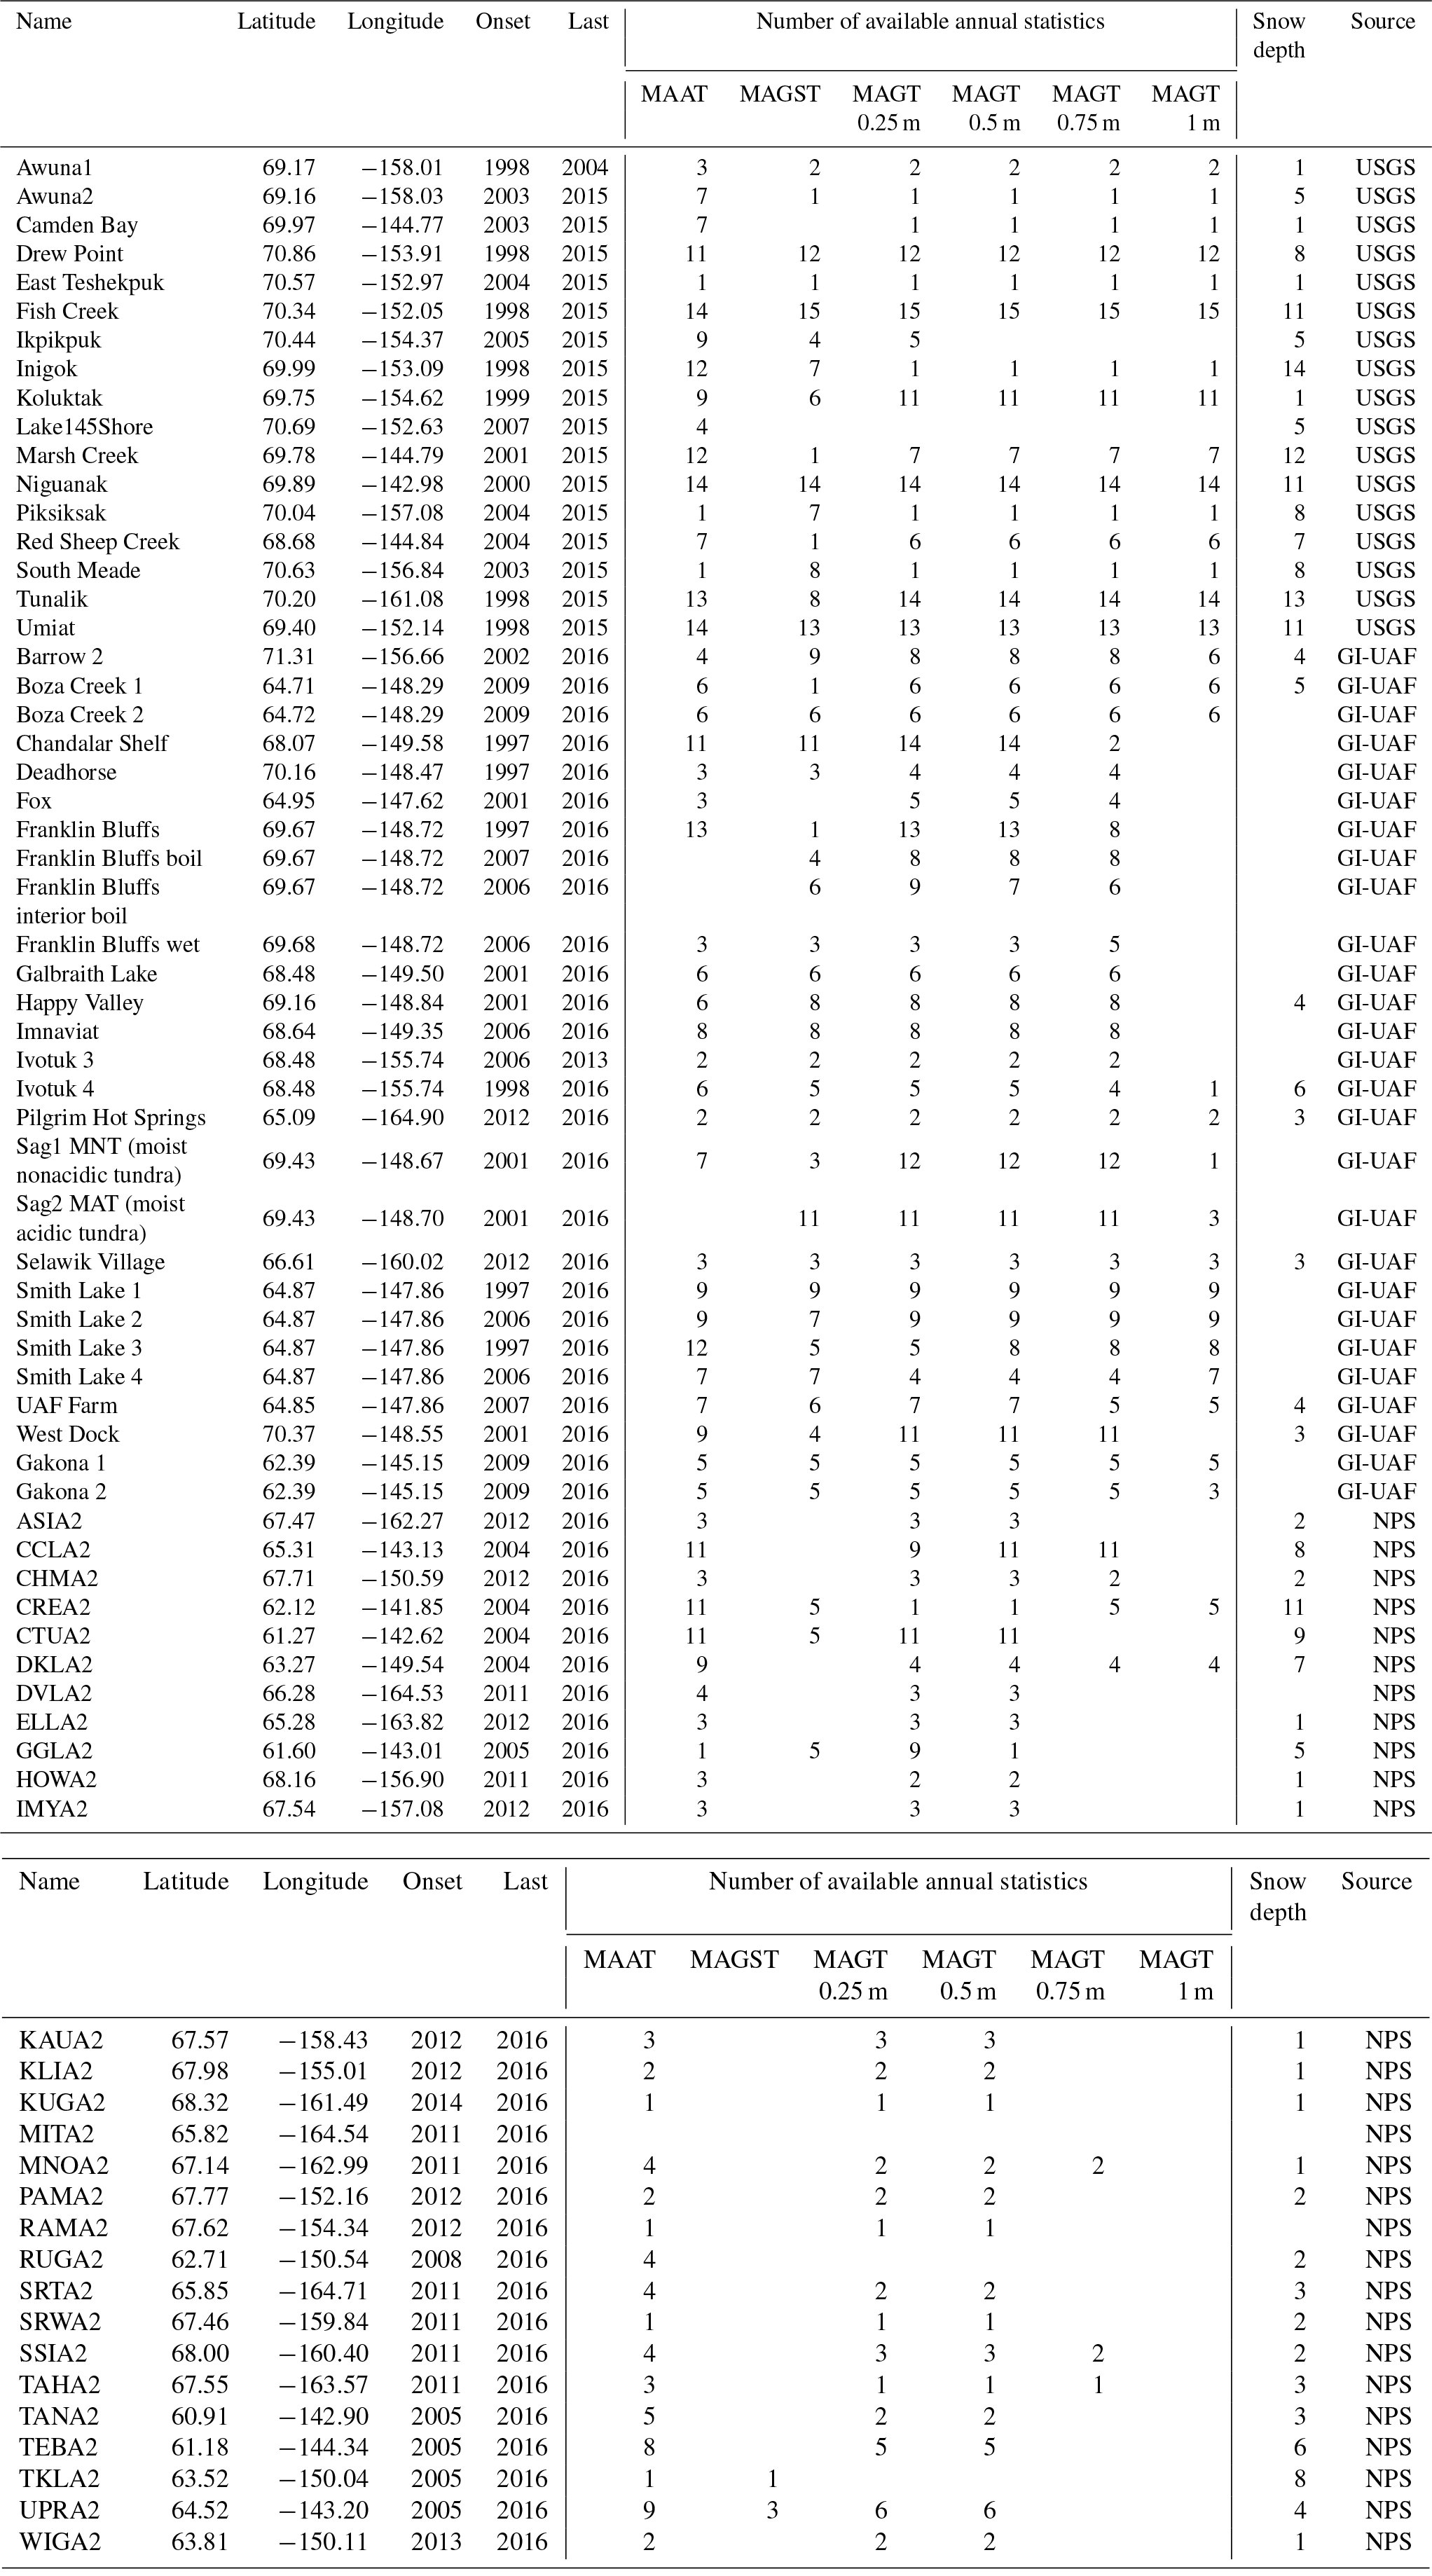
Table 2Brief description of vegetation and soil type of monitoring stations in Alaska.
These networks utilize radiation-shielded thermistors (Campbell Scientific CSI 107 temperature probes) to monitor air temperature. In the GI-UAF and NPS network, the air temperature sensors were installed at 1.5 or 2.0 m above the ground surface, whereas the USGS network monitors air temperature at 3.0 m above the ground surface in order to minimize damage by wildlife.
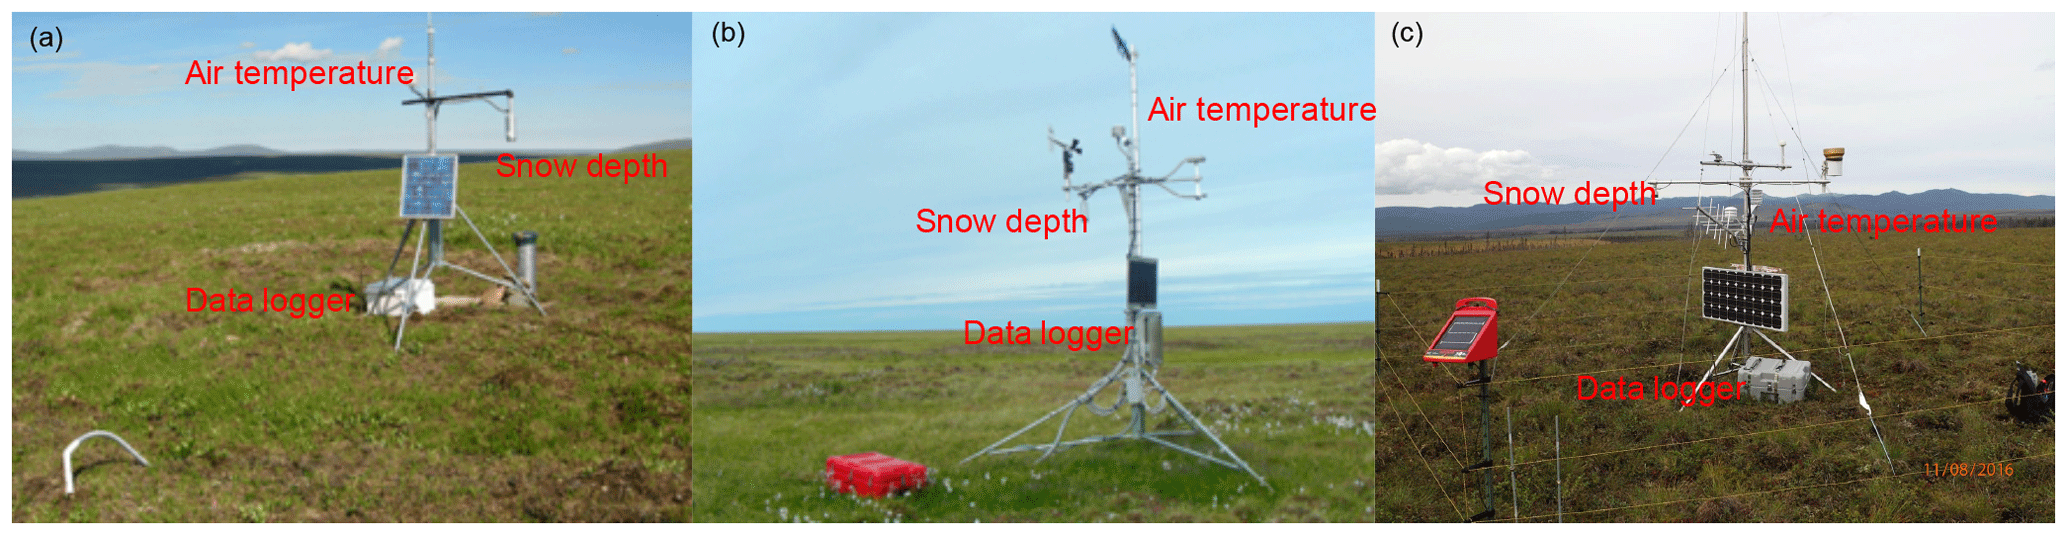
Figure 2Typical permafrost observing stations. (a) Imnaviat site (68.64∘ N, 149.35∘ W) in the GI-UAF network (source: http://permafrost.gi.alaska.edu/site/im1, last access: 15 December 2018); (b) the Drew Point station (70.86∘ N, 153.91∘ W) in the USGS network (source: http://pubs.usgs.gov/ds/0977/DrewPoint/DrewPoint.html, last access: 15 December 2018); (c) the Wigand site (63.81∘ N, 150.109∘ W) in the NPS network.
Instruments used in ground temperature monitoring are specified in Table 3. To monitor near-surface ground temperatures, the networks use either a probe with several thermistors embedded within a single rod, typically 1.0 to 1.5 m long, or several individual Campbell Scientific 107 thermistors anchored at specified depths within a single hole. The thermistor temperature sensors are designed to record temperatures ranging from −30 to 75 ∘C, with the exception of the 107 sensors, which record temperatures from −35 to 50 ∘C.
Table 3Summary of ground temperature instruments from the USGS, GI-UAF, and NPS networks of Alaska, USA.
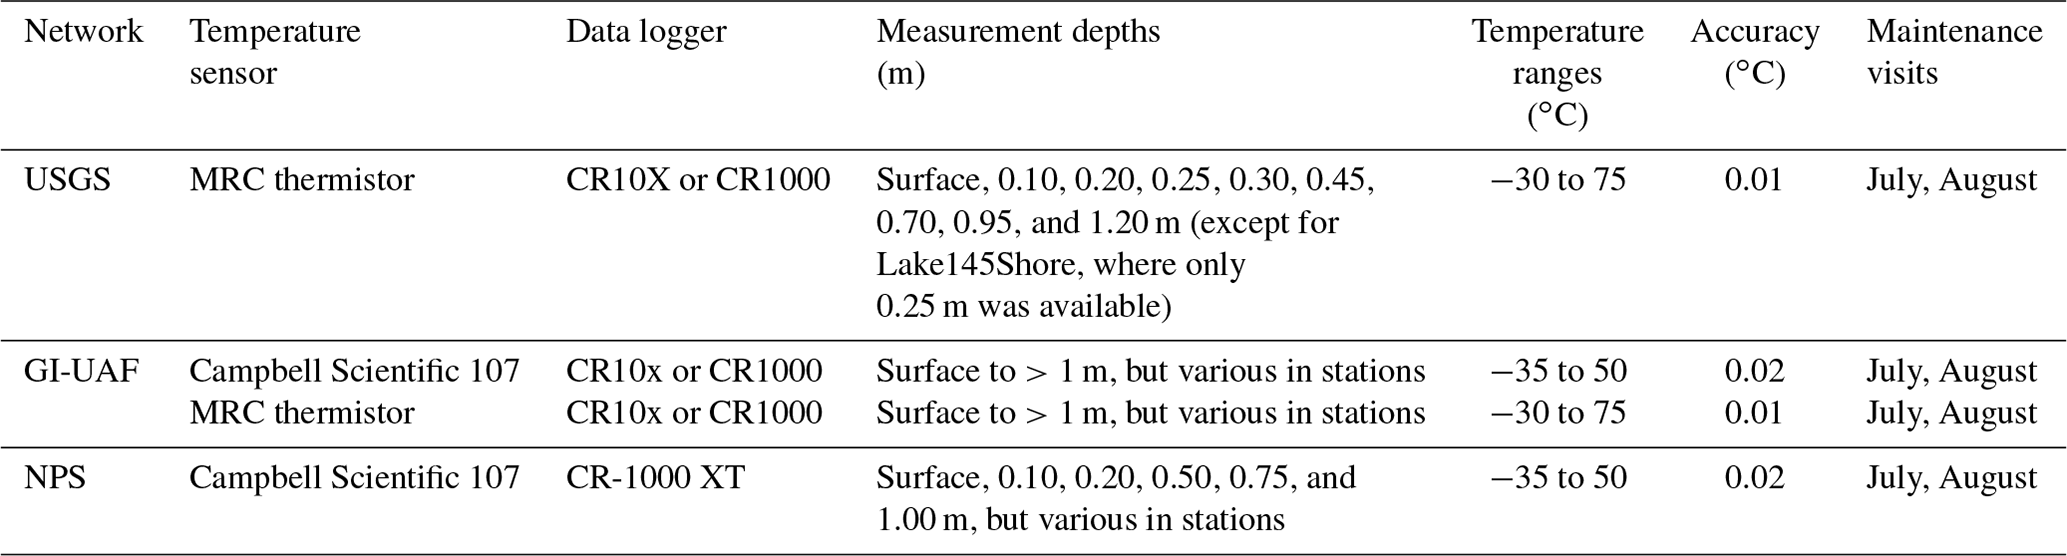
An ice-bath calibration is a required procedure before installation of the GI-UAF temperature probes. This calibration includes placing the sensors into an insulated container filled with a mixture of ice shavings and distilled water, measuring the temperature, and recording the offset from 0 ∘C. The measured offset is then used to correct the temperature measurements. The average accuracy of these sensors is ±0.01 ∘C (Romanovsky et al., 2008). For the USGS network, the thermistor sensors are installed inside a tight-fitting fluid-filled plastic tube, 1.25 m long, to measure ground temperatures at depths of 0.05, 0.10, 0.15, 0.20, 0.25, 0.30, 0.45, 0.70, 0.95, and 1.20 m (Urban and Clow, 2017). Newer USGS ground sensors are calibrated in the USGS temperature calibration facility while the older ones were calibrated in situ using an inversion (Urban and Clow, 2017). The NPS has three to four soil temperature sensors (CSI-107) installed in individual holes at depths of 0.10, 0.20 and 0.50 m, and at several locations an additional sensor is located at 1.00 m. The ground-measurement depths vary station by station within the GI-UAF network, typically ranging from the ground surface (i.e., 0 m) to 1 m below the ground surface. It is important to note that for most of the installed probes, frost heave occurs with time, and heaving depths are adjusted accordingly by subtracting the heaving values yearly. The USGS and NPS teams estimate frost heave by using ground temperature data from the topmost thermistor (at a depth of 0.05 or 0.10 m). If the temperature of the top thermistor during the thaw period exceeds air temperature, then the sensor is considered exposed or partly exposed to solar radiation. The GI-UAF team measures frost heave at every site and then subtracts heave depth from known sensors depths to correct for heaving (Romanovsky et al., 2008). Each team corrects for heaving every summer, and corrections are applied before releasing data. Our presented data thus already account for frost heave and consist of corrected ground temperatures.
Both the USGS and the GI-UAF networks measure liquid soil moisture using a HydraProbe sensor developed by Stevens Water Monitoring Systems Inc. The Stevens HydraProbe has a reported accuracy of ±0.03 m3 m−3 (Bellingham, 2015). Each volumetric water content sensor was calibrated in accordance with the manufacturer's recommendations. Uncertainties associated with the sensor's sensitivity still exist under certain specific conditions, e.g., for peat. The measured liquid soil moisture from a HydraProbe cannot be directly compared with the total soil moisture content values produced by land system models because in most of the models, soil moisture includes both ice and liquid water, whereas HydraProbe sensors only measure liquid soil moisture. The USGS network measures soil moisture at one depth, approximately 0.15 m below the ground surface in all cases. The soil moisture sensors depths vary between stations for the GI-UAF network because they are installed at representative depths depending on the soil profile and texture within the active layer. The GI-UAF network measures soil moisture typically at three different depths within the active layer, ranging from 0.10 to 0.60 m. The NPS network does not include moisture probes at any of their monitoring stations. Our processed dataset only presents the upper layer (up to 0.25 m) soil water content.
Snow depth is measured once per hour with a SR50 or SR50A ultrasonic distance sensor (Campbell Sci. Inc.) at all of the available stations. This downward-looking sensor is mounted on a crossarm typically at 2.5 m above the ground surface for the USGS and NPS networks, and 1.5 m above the ground surface for the GI-UAF network. The factory evaluated accuracy is ±0.01 m or 0.4 % of the distance to the ground surface. It is important to note that vegetation at the ground surface might influence shallow snow depth measurements.
2.2 Data processing workflow
All three networks apply data processing and quality-control checks before release. Typically, quality control occurs shortly after annual summer field campaigns; the fully processed and quality-controlled data become publicly available a year after the data collection. In the present version of the permafrost dataset, we use the USGS Data Series 1021, which includes data through July 2015 (https://doi.org/10.3133/ds1021; USGS data through July 2016 were released after the analysis presented in this paper Urban and Clow, 2018). The latest available quality-controlled data for the GI-UAF and NPS networks is through August 2016. The GI-UAF data are available at http://permafrost.gi.alaska.edu/sites_map (last access: 15 December 2018), while NPS data are available from https://irma.nps.gov/DataStore/Reference/Profile/2240059 (last access: 15 December 2018) and https://irma.nps.gov/DataStore/Reference/Profile/2239061 (last access: 15 December 2018).
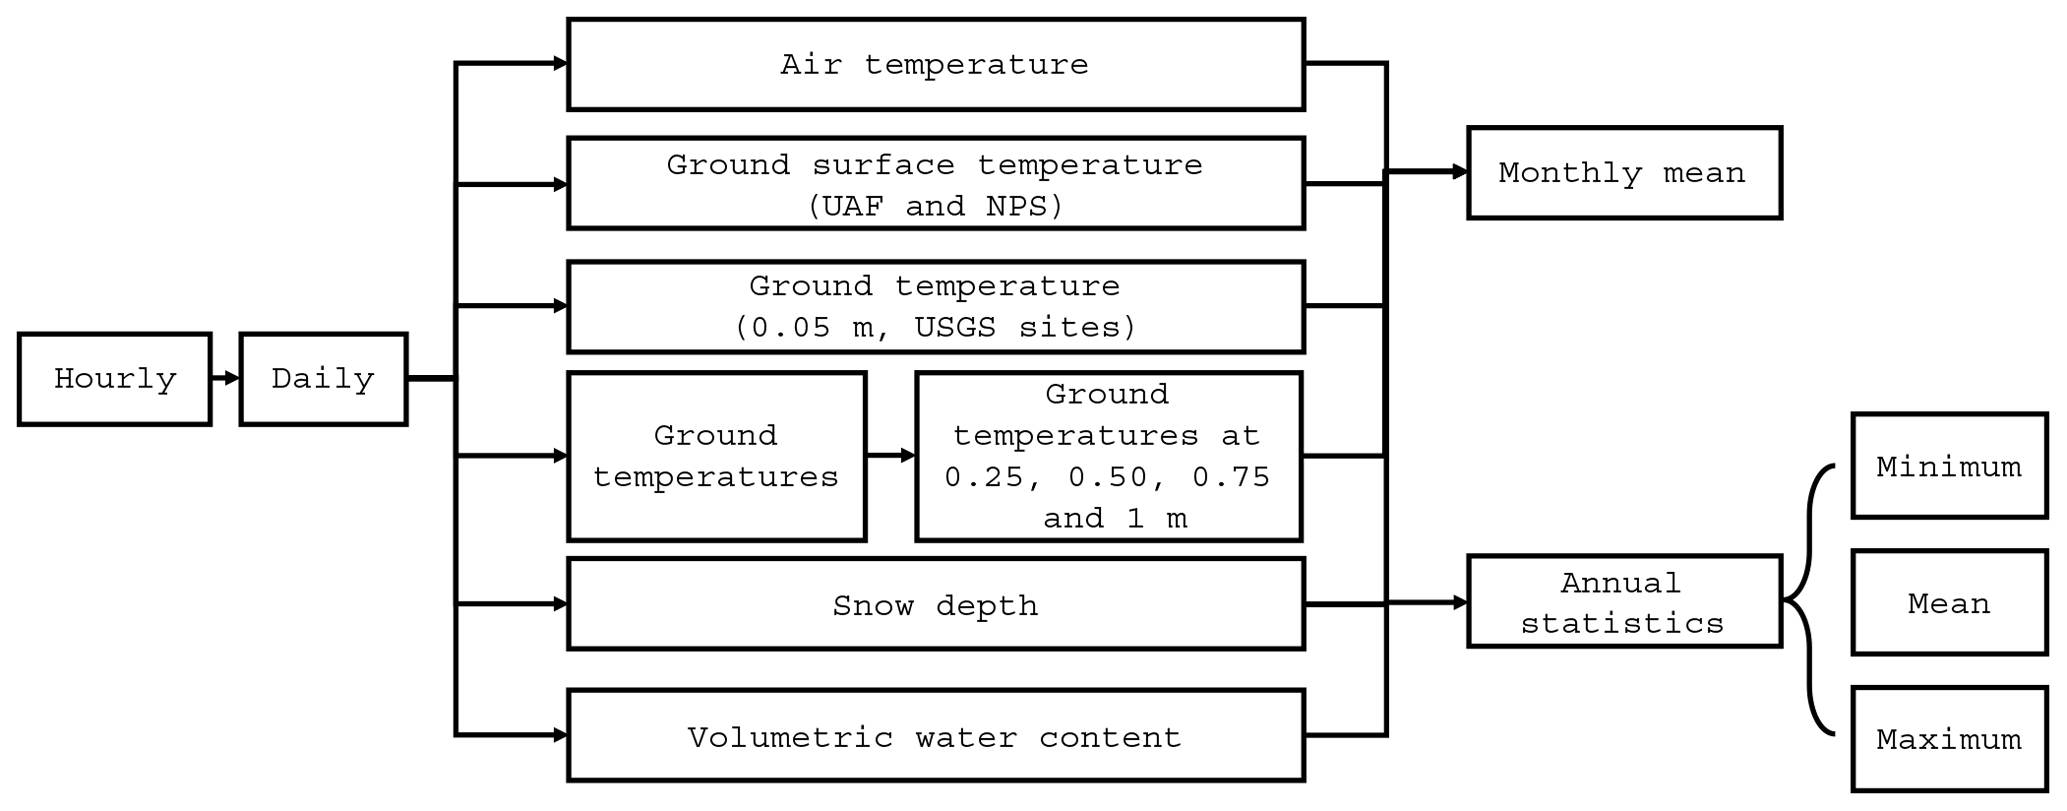
Figure 3Schematic representation of the data processing workflow used to compile the permafrost dataset in the Alaska.
Figure 3 shows a schematic representation of the data processing workflow used to compile our synthesis dataset. To standardize the ground temperature depths in the dataset, we linearly interpolate ground temperatures for target depths: 0.25, 0.50, 0.75, and 1.00 m. We only implemented interpolation for those stations with measurements at least four depths, which assures a relatively small interval around the specified target depths. In addition, soil temperatures were not extrapolated beyond the maximum observed depth at any site; ground surface temperature is only calculated when supporting measurements are indeed available. Then, the calculated soil temperature at a specific depth depends on the linear slope between the observations at adjacent depths. Therefore, using a linear interpolation method does not necessarily result in a linear prediction from the ground surface to 1 m. We examined the uncertainty resulting from our linear interpolation method for the most data-sparse case, i.e., when we only have observations at four depths. To do so we selected the entire year of data without any missing values or depths and used linear interpolation to predict temperatures at five depths. Then we randomly selected only four depths, and interpolated again by using these four depths. This analysis demonstrates that while missing depths would reduce the number of available interpolation results, the influence from missing depths is limited.
The USGS and NPS network releases data at hourly resolution, whereas the GI-UAF network releases data at daily resolution. Since the most common model data output intervals of the land system and global climate models are monthly, the monthly means were calculated for all variables, including air and ground temperatures, snow depth, and soil water content. In addition to monthly data, annual means were calculated to allow evaluation of the relationship between air and ground temperatures. Thus, the dataset also provides annual statistics, including mean-annual air temperature (MAAT); mean-annual ground surface temperature (MAGST); mean-annual ground temperature at 1 m (MAGT at 0.25, 0.50, 0.75, and 1.00 m); mean and maximum seasonal snow depth (SND); and maximum, mean, and minimum soil volumetric water content (VWC).
Data from many sites have gaps and discontinuities due to harsh environmental conditions and wildlife that may interrupt the monitoring. There are various methods for calculating monthly means from incomplete time series data. For example, the USGS standards allow only 5 % of missing values for both monthly and annual mean temperature data (Urban and Clow, 2017). The World Meteorological Organization (WMO) does not allow gaps of more than three consecutive days or more than 5 days total from each monthly data series (Plummer et al., 2003). Other researchers are more tolerant of missing data, acknowledging the difficulty of data collection in remote cold regions. Menne et al. (2009) allow up to 10 missing days in a monthly time series. Bieniek et al. (2014) calculated monthly averages using at least 15 days. Here we calculated monthly means for any station which has at least 20 days of measurements for that specific month. The annual means were calculated from daily data. Due to the scarcity of the data, we only calculate the annual means for those years with a coverage of at least 90 % of the daily data. For this reason, we separately present annual means for air and ground temperatures as well as soil moisture, derived from daily data.
During the dataset compilation, we identified similarly named sites with different installation times and locations that do not match precisely. It is important to note that these sites, even when located nearby each other, may have considerably different environmental conditions, and thus, different ground temperature thermodynamics. A unique name is assigned to each site. Deadhorse site, maintained by GI-UAF, and Awuna site, maintained by USGS, have new monitoring stations, and the old ones have been decommissioned. The new and retired systems ran simultaneously for a few months in order to evaluate the data consistency. The environmental conditions for the newer Deadhorse station remained the same, assuring data consistency. Environmental conditions between two monitoring stations at Awuna are quite different: the original Awuna site was located on a ridge, whereas the new site is in a valley 1.9 km away. Nevertheless, the temperature data are consistent between the old and new station at Awuna. The old site (Awuna1) did not monitor soil moisture, which would be expected to be more site-specific and spatially variable. Thus, in this dataset, we present both the new and old sites' records.
2.3 Derived variables
We calculated three derived variables from monthly temperature curve at each site: (i) degree days of freezing (DDF), (ii) degree days of thawing (DDT), and (iii) frost number (FN). Nelson and Outcalt (1987) and Zhang et al. (1996) have demonstrated that these variables calculated from monthly data closely correspond to those calculated from daily data. DDT and DDF are given by
and
The FN index was calculated for both air temperature and ground temperatures following Nelson and Outcalt (1987):
Here, dt is a day. FN serves as a simplified index for the likelihood of permafrost occurrence. A FN index of 0.5 implies equal freezing and thawing index. When the FN index is >0.5, it indicates that the annual period of freezing dominates thaw, implying climate conditions that promote permafrost.
2.4 Data evaluation
Despite the fact that individual station observations had originally been quality controlled, we still need to examine our own results for data harmonization. Here we implemented two methods of evaluation. The first one compares the trends in air and ground temperature trends, while the second method examines the effects of snow on the ground's thermal state.
The primary objective of the trend analysis is to evaluate the consistency between trends at each station (for different depths) and between stations rather than inform interannual variability. Most of the estimated trends have a short observational period (see Table 1). We chose to show trends only for those stations with more than 10 available annual means. Currently, some of the time series are still too short to provide significant trends. As more data become available in the future, a more rigorous analysis will be possible. It is well known that climatic trend analysis requires more than 30 years of time series (IPCC, 2013). On the other hand, Box et al. (2005) showed that 15 years is sufficient for interannual variability diagnosis to be statistically significant. Since the time series for most of the stations do not exceed 15 years, we calculate trends for temperatures at different depths to determine inconsistencies between air and ground temperature trends in terms of signs' differences.
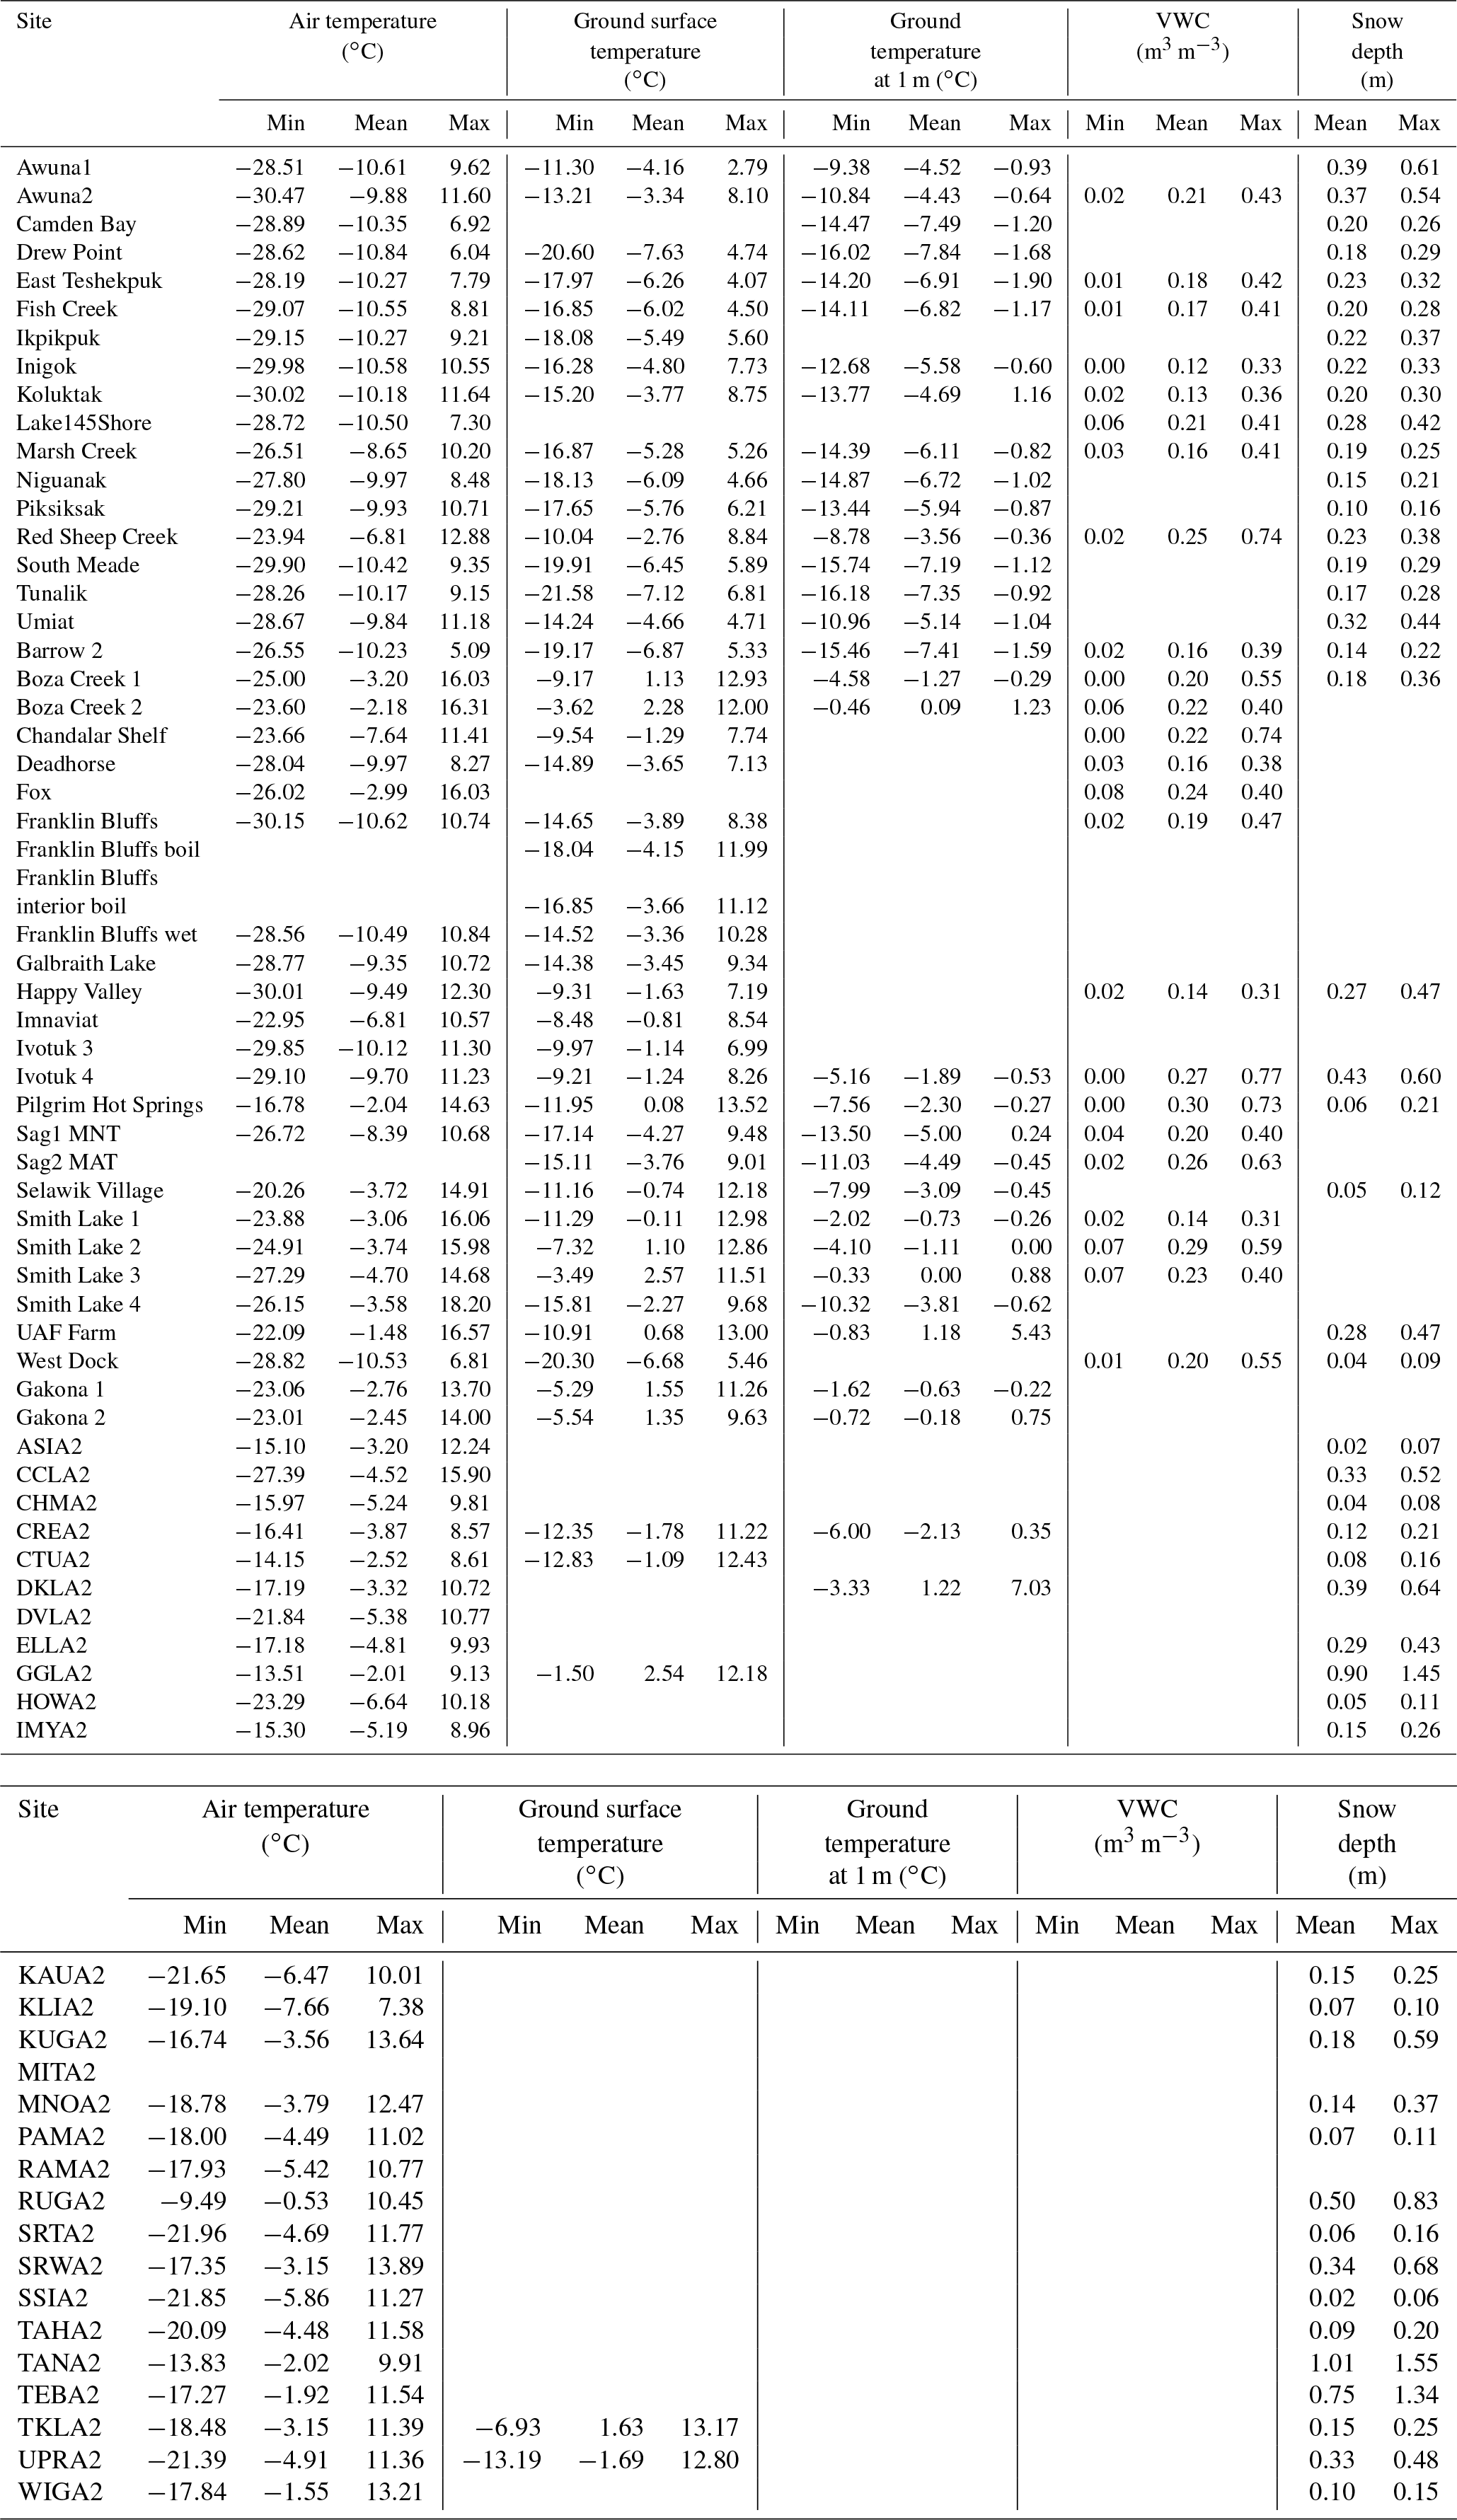
Table 4Summary of the air, ground surface, ground temperature at 1 m, volumetric water content, and snow depth over the entire observation period.
The second evaluation effort examines the physical mechanism among air temperature, snow cover, and ground thermal states, which is an auxiliary evaluation of the dataset. Seasonal snow cover will keep the ground warm by reducing cooling (or heat loss) during the winter (Yershov and Williams, 2004). Considering a semi-infinite column, the damping of the ground temperature annual cycle is dependent on both snow depth and soil thermal properties. In this study, the snow period is defined as October through March. We averaged the snow depth measurements over the period to obtain the effective snow depth (SNDeff) (Slater et al., 2017). The amplitudes of air temperature (Ampair) and ground surface temperature (Ampgnd) were calculated following Slater et al. (2017), for those stations with available snow depth data. The snow and heat transfer metric (SHTM) captures the correlation between the normalized temperature amplitude difference (ΔAmpnorm) (i.e., Eqs. 4–6) and SNDeff. Quantities Ampair, Ampgnd, and ΔAmpnorm are given by
3.1 Overview of this dataset
Table 4 presents an overview of the data compiled in the dataset for Alaska. Our dataset comprises 41 667 data points in total. There are significant missing data (e.g., some stations do not have soil moisture sensors installed) and there are different observational periods for each sensor (e.g., air temperature sensors were installed often earlier than other sensors in some cases). Excluding the missing time series when certain instruments were not installed, the percentage of complete data is about 77 %.
Figure 4 shows an annual summary of our core variables, including mean annual air temperature, ground surface temperature, and ground temperatures at 0.25, 0.50, 0.75, and 1.00 m. Overall, mean-annual air temperatures are colder than −10 ∘C in the Alaskan Arctic, while in the southern mountain tundra regions they are close to freezing point (−0.5 ∘C at RUGA2 site). Mean-annual ground surface temperatures for 46 available sites range from −7.6 ∘C through 2.5 ∘C, which, as expected, is considerably warmer than the mean-annual air temperature. For most of the sites, ground temperatures could be determined at depths of 0.25 and 0.50 m (69 and 67 sites, respectively). Ground temperatures at depths of 0.25 and 0.50 m range roughly from −7.8 to 3.3 ∘C. Mean-annual ground temperature at 0.75 m varies from −7.5 to 1.2 ∘C over 49 available sites. Ground temperatures at 1 m could only be determined at 32 sites, most of which are located in the southern portion of the Alaskan Arctic (∼62∘ N). Mean-annual ground temperatures at this depth range from −7.8 to 1.2 ∘C.
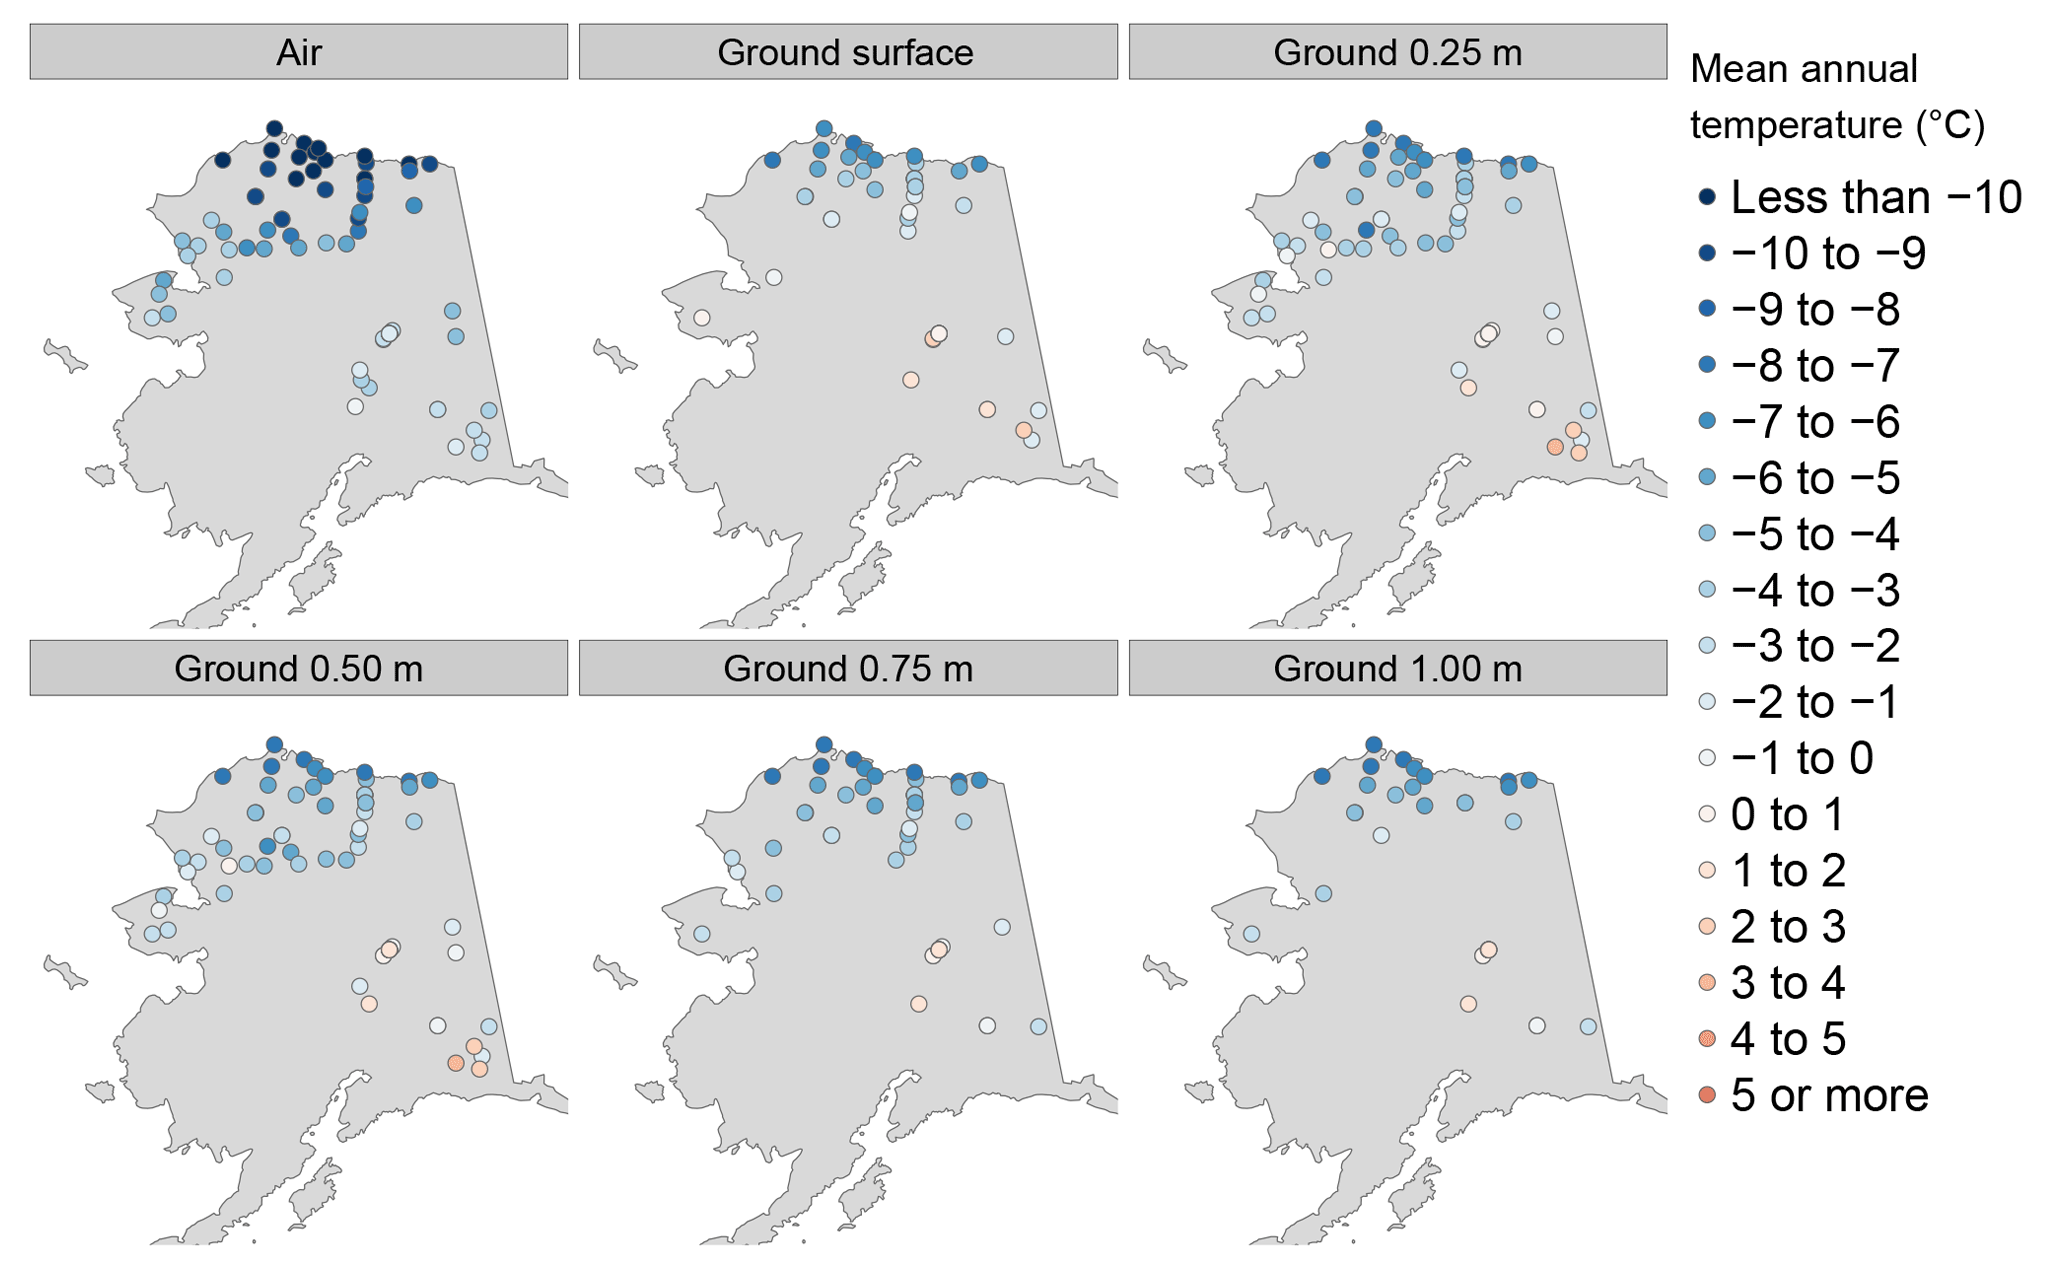
Figure 4Overview of spatial distribution of mean annual air temperature, ground surface temperature, and ground temperatures at 0.25, 0.50, 0.75, and 1.00 m.
The VWC shown in Table 4 is from the upper part of the soil (i.e., depth of up to 0.25 m). The VWC measurements are mainly available from the North Slope of Alaska. Maximum VWC is important for understanding active layer dynamics during summer. Notably, the spatial variance of the maximum VWC is 3 times larger than that of the annual means. Three sites, Chandalar Shelf, Pilgrim Hot Springs, and Red Sheep Creek, were much wetter than other sites (maximum VWCs exceeding 0.7 m3 m−3). This is mainly because these sites are close to a water body.
Snow depth is spatially variable over Alaska, although with a general trend of increasing snow depth in the southern part of the state, according to the synthesis dataset (Fig. 5). In the Alaskan Arctic, snow cover is shallower than in the southeast region. The maximum seasonal snow depth was >1.5 m at the Gates Glacier station (which is located near the glacier) in Wrangell St. Elias National Park. The lowest maximum snow depth occurs at West Dock near the Beaufort Sea in Prudhoe Bay, with only 0.09 m in 2010. Similar magnitudes of snow thickness were reported at West Dock during the period 1983–1993 (Zhang et al., 1997). The other two sites, Asik in Noatak National Park and Serpentine in Bering Land Bridge National Preserve, also showed a shallow snow cover in recent years. The thin snow cover is probably due to wind exposure.
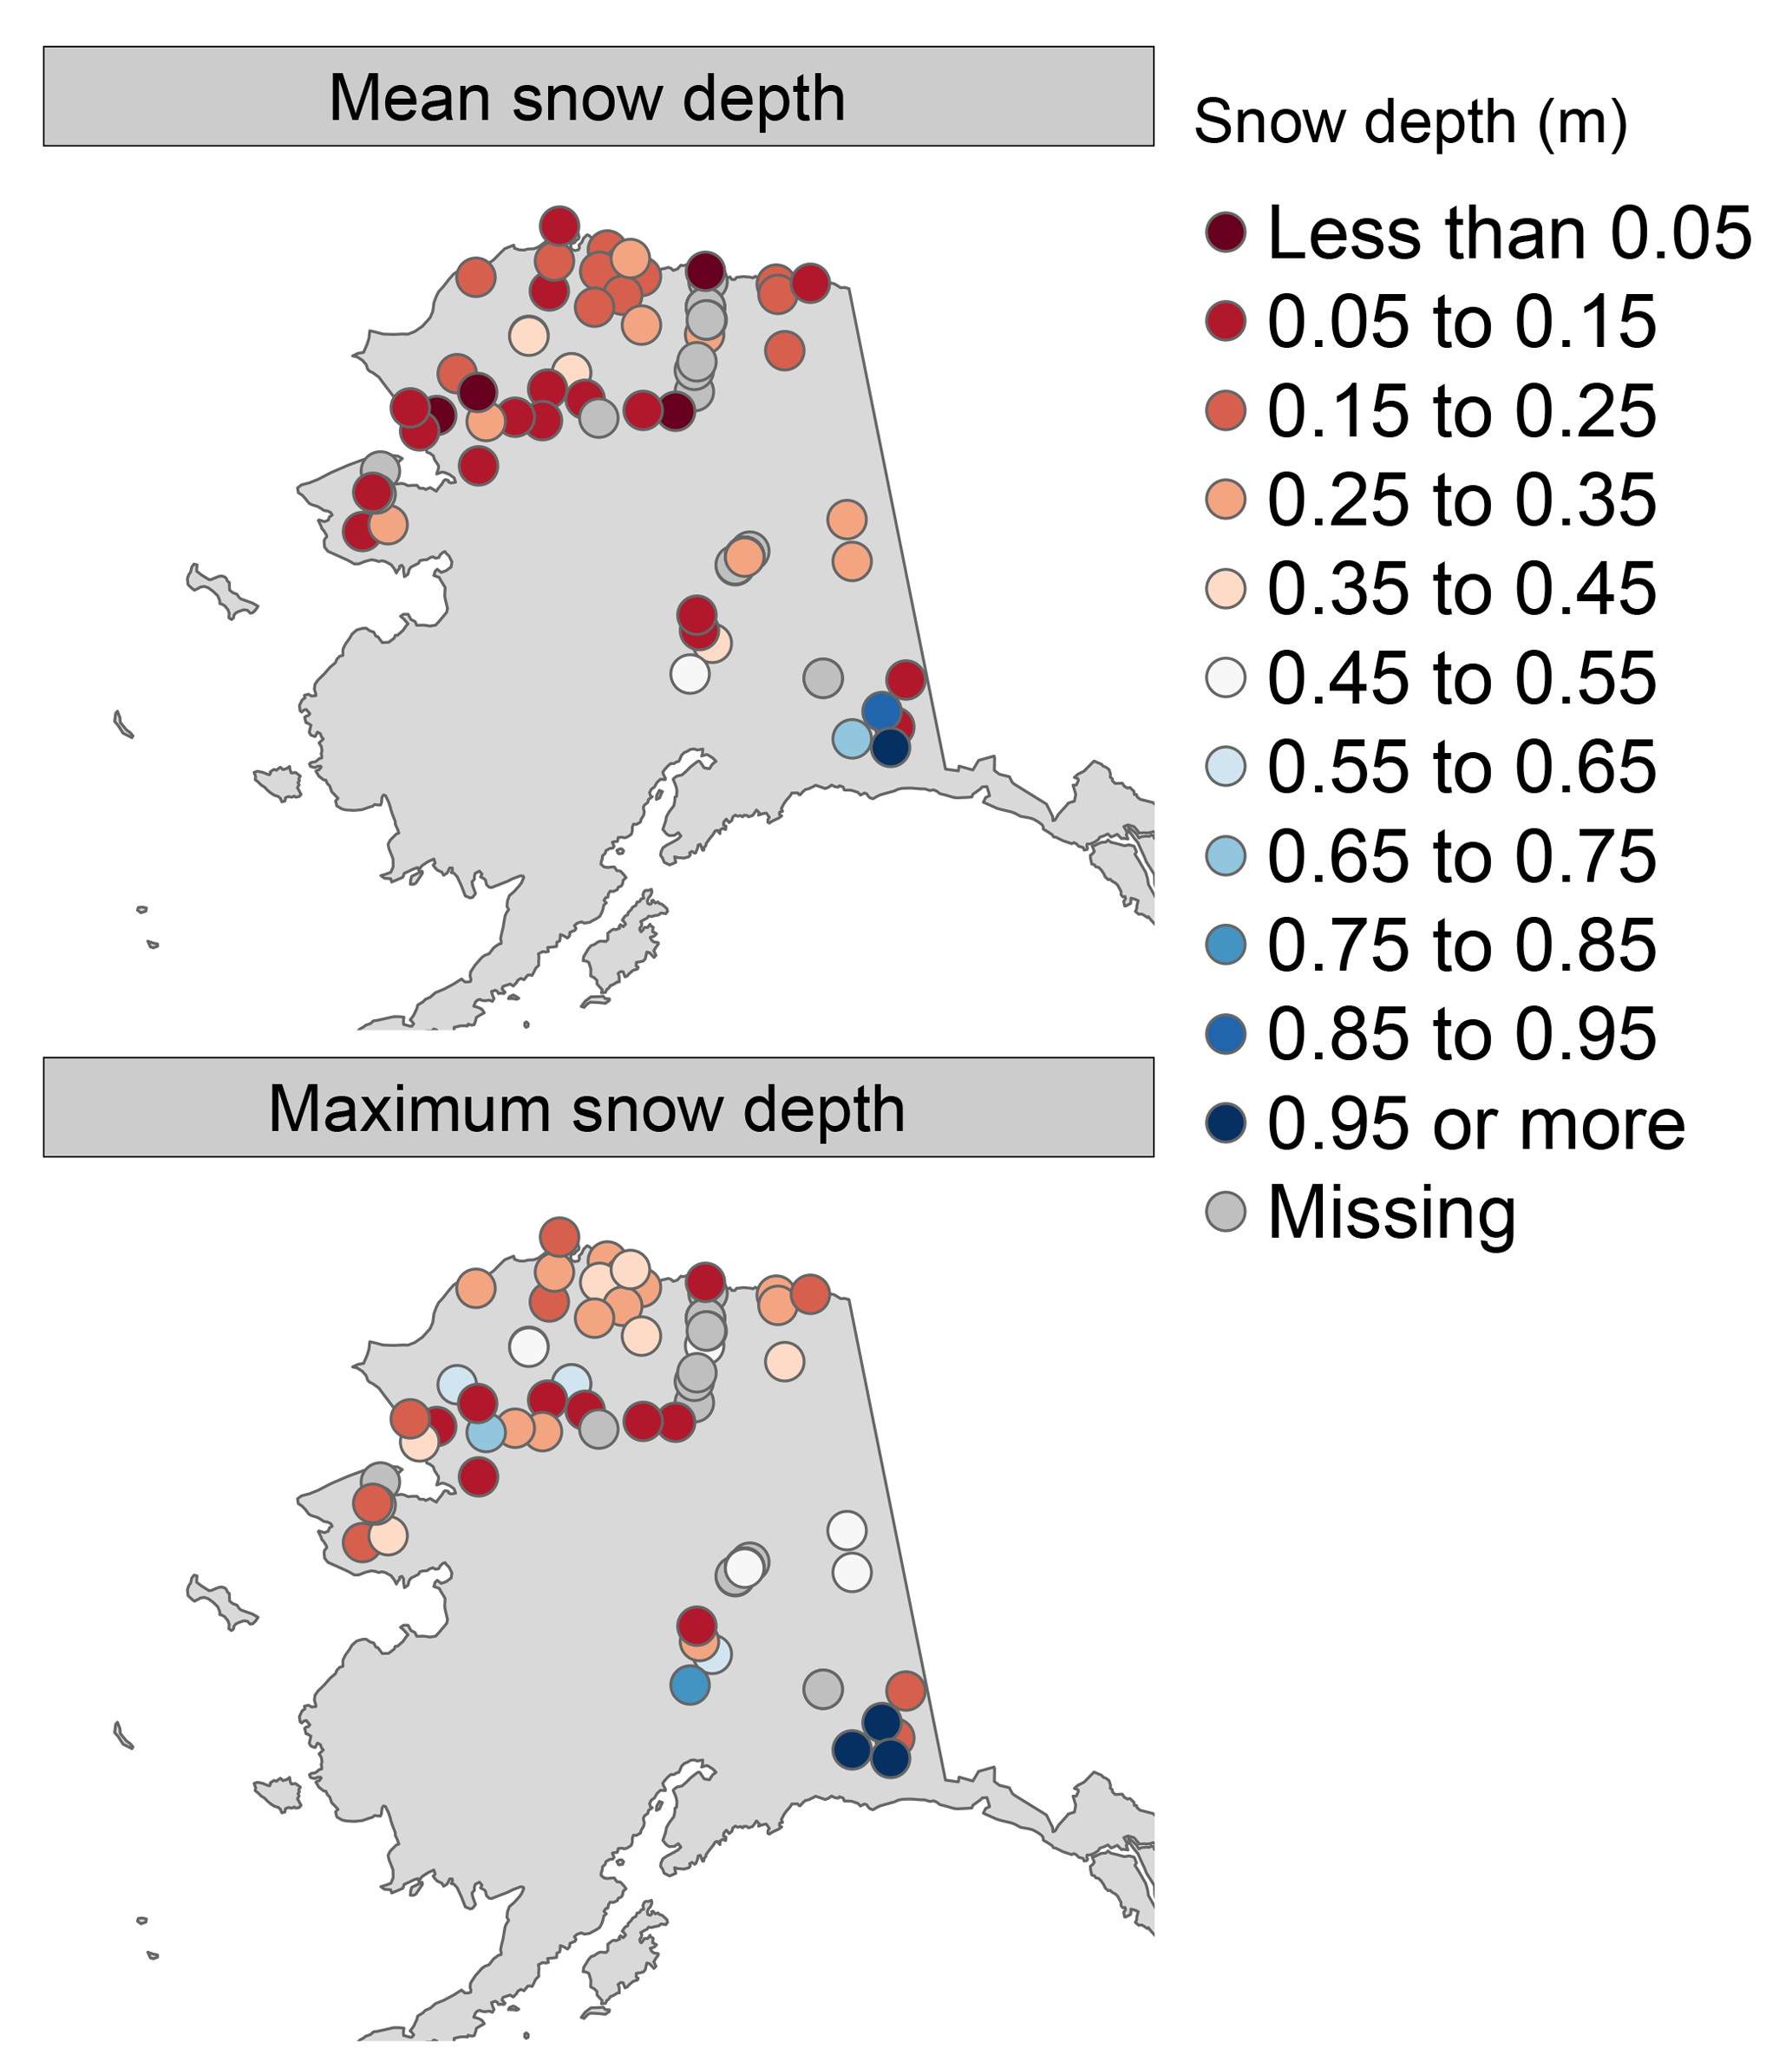
Figure 5Overview of spatial distribution of snow depth, including annual mean snow depth and maximum snow depth.
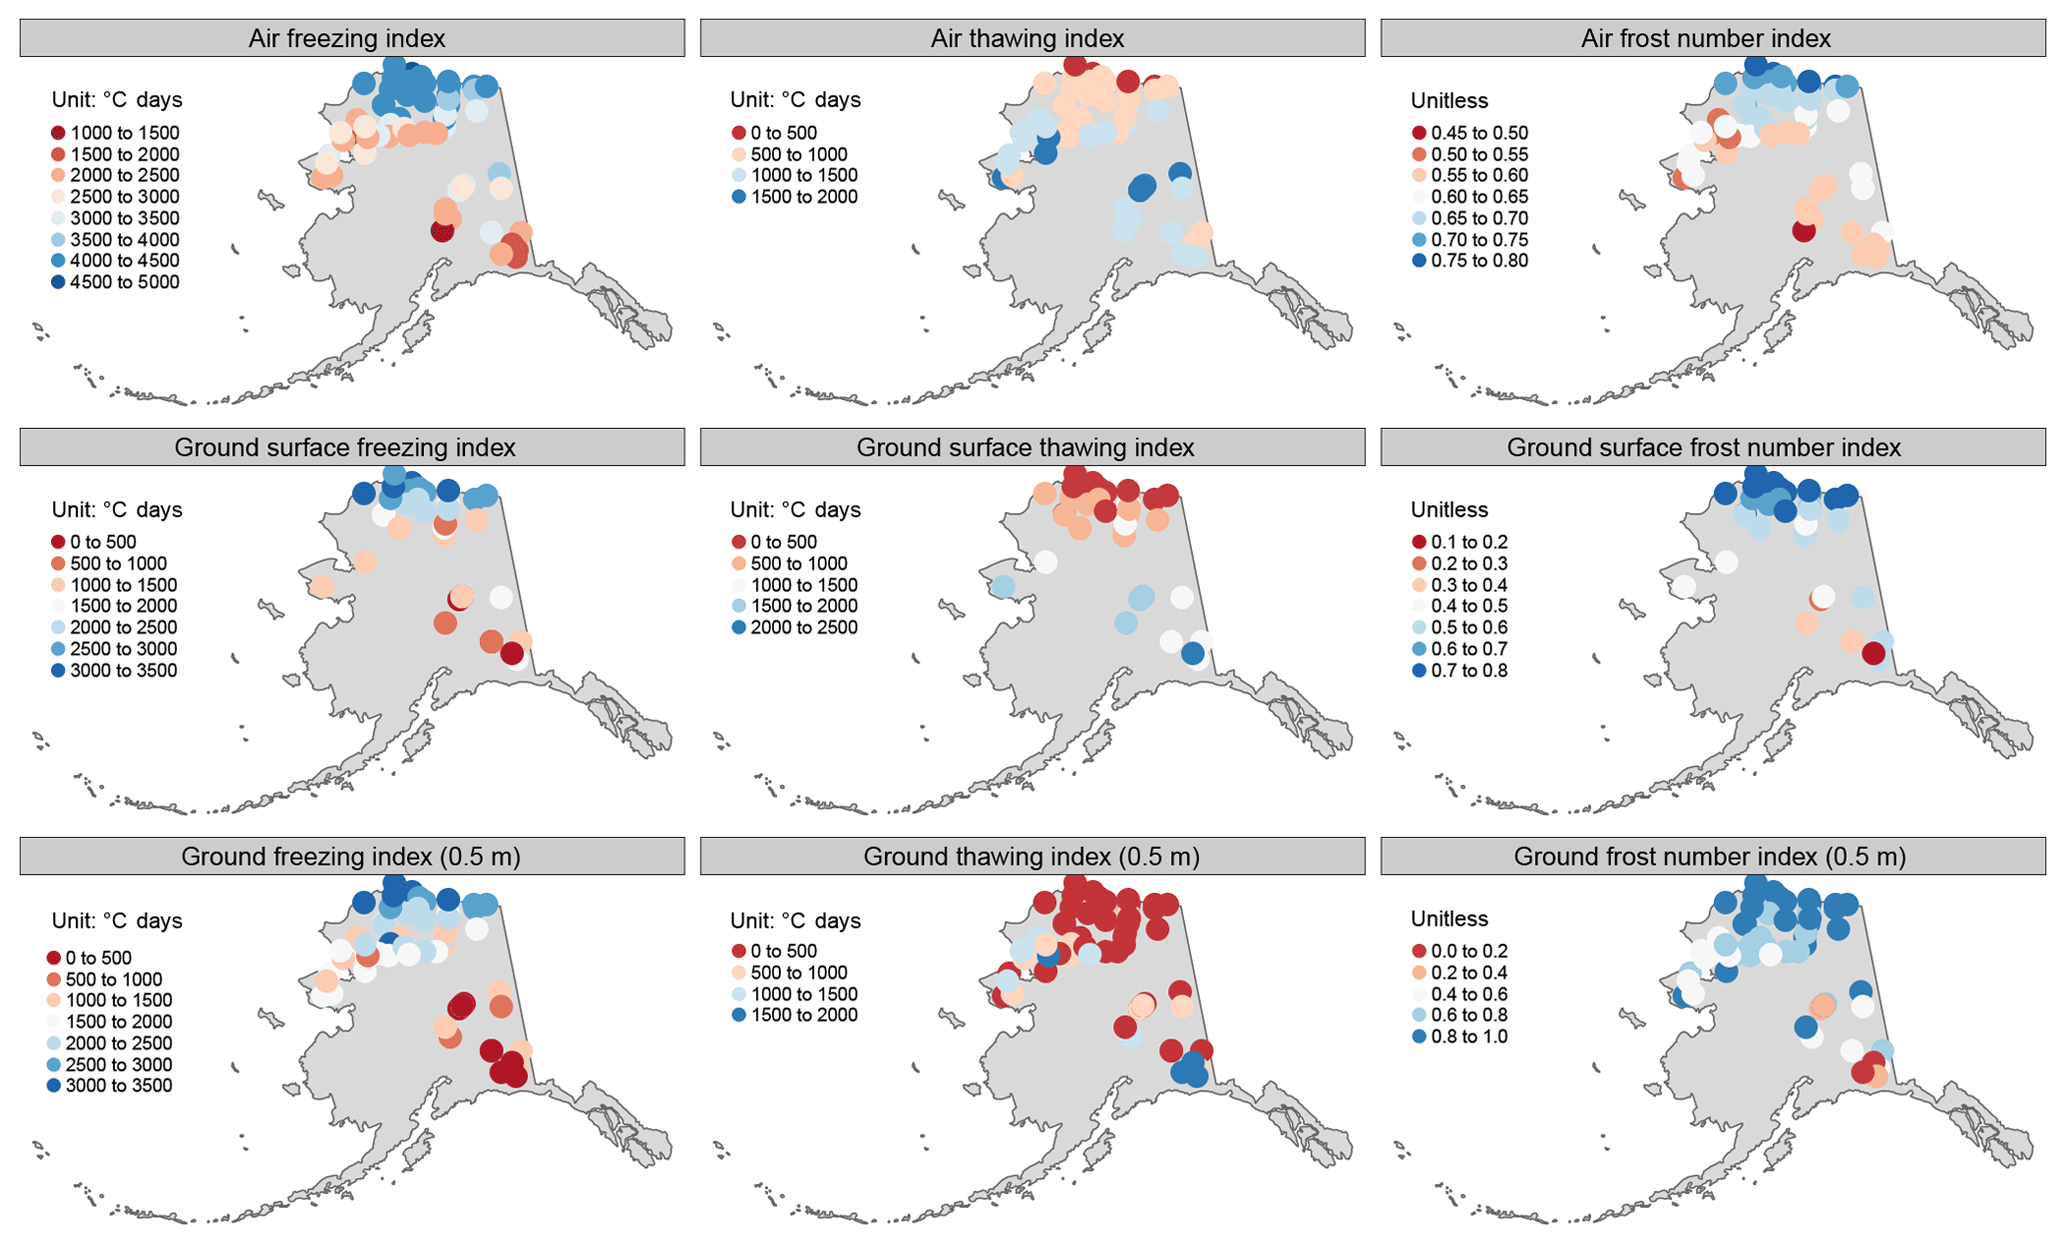
Figure 6Overview of spatial distribution of freezing–thawing index from air, ground surface temperature, and ground temperature at 0.50 m. Frost number (FN) was derived from the freezing–thawing index according to Nelson and Outcalt (1987).
3.2 Data evaluation
In this dataset, we derived the FN index for air and ground temperatures at various depths (Fig. 6 and Table 5). Because many stations do not have sensors at depths >1 m, we report the DDT–DDF indices of air, ground surface, and 0.5 m below the ground surface in Fig. 6, with all available results listed in Table 5. Overall, almost all stations have an air FN above 0.5. Stations on the North Slope have both air and ground surface FNs exceeding 0.6. In interior and southern Alaska, air FNs are above 0.5, although the ground surface FNs are much lower due to the thicker snow cover in this region. In the Alaskan Arctic, DDTs at ground surface are generally lower than air according to the station observations. There are 13 stations with a zero DDT based on ground temperature data at 0.5 m. These results indicate a shallow active layer (<0.5 m) at these sites. Another five stations have a DDT of 0.5 m ground temperature less than 10 ∘C days. The calculated frost number indices are consistent with the existing permafrost distribution map over Alaska (Jorgenson et al., 2008).
We examined the consistency among the trends of MAAT, MAGST, and MAGT at 1 m depth. Typically, if MAAT has a long-term positive trend, then MAGST is expected to have a positive trend, even if the rate is dampened (Romanovsky et al., 2015). Similarly, signs of trends in MAGST and MAGT at the depth of 1 m and MAAT and MAGT at 1 m depth are hypothesized to be consistent (Romanovsky et al., 2015). Here we show the annual mean temperatures at four stations, Drew Point, Fish Creek, Niguanak, and Tunalik, with 10 or more years of data (Fig. 7). Mean-annual air, ground surface, and ground temperature at 1 m indicates consistent warming at rates of 0.07–0.18, 0.14–0.23, and 0.12–0.22 , respectively. A notable feature is that at Fish Creek, ground surface temperature and ground temperature at 1 m showed amplified warming rates compared to the magnitude of the air temperature increases, which can be explained by the significant increase of seasonal snow depth over the same period. There are six stations with relatively long records (≥10 years) of air, ground surface, and ground temperature at 0.5 m for the same period. In other words, at these sites, the data used to estimate linear trends of air, ground surface, and ground temperature at 0.5 m were collected over corresponding years. Figure 8 shows that air temperature, ground surface, and ground temperature at 0.5 m have consistently positive trends. Furthermore, the trends in ground surface and 0.5 m were generally close.
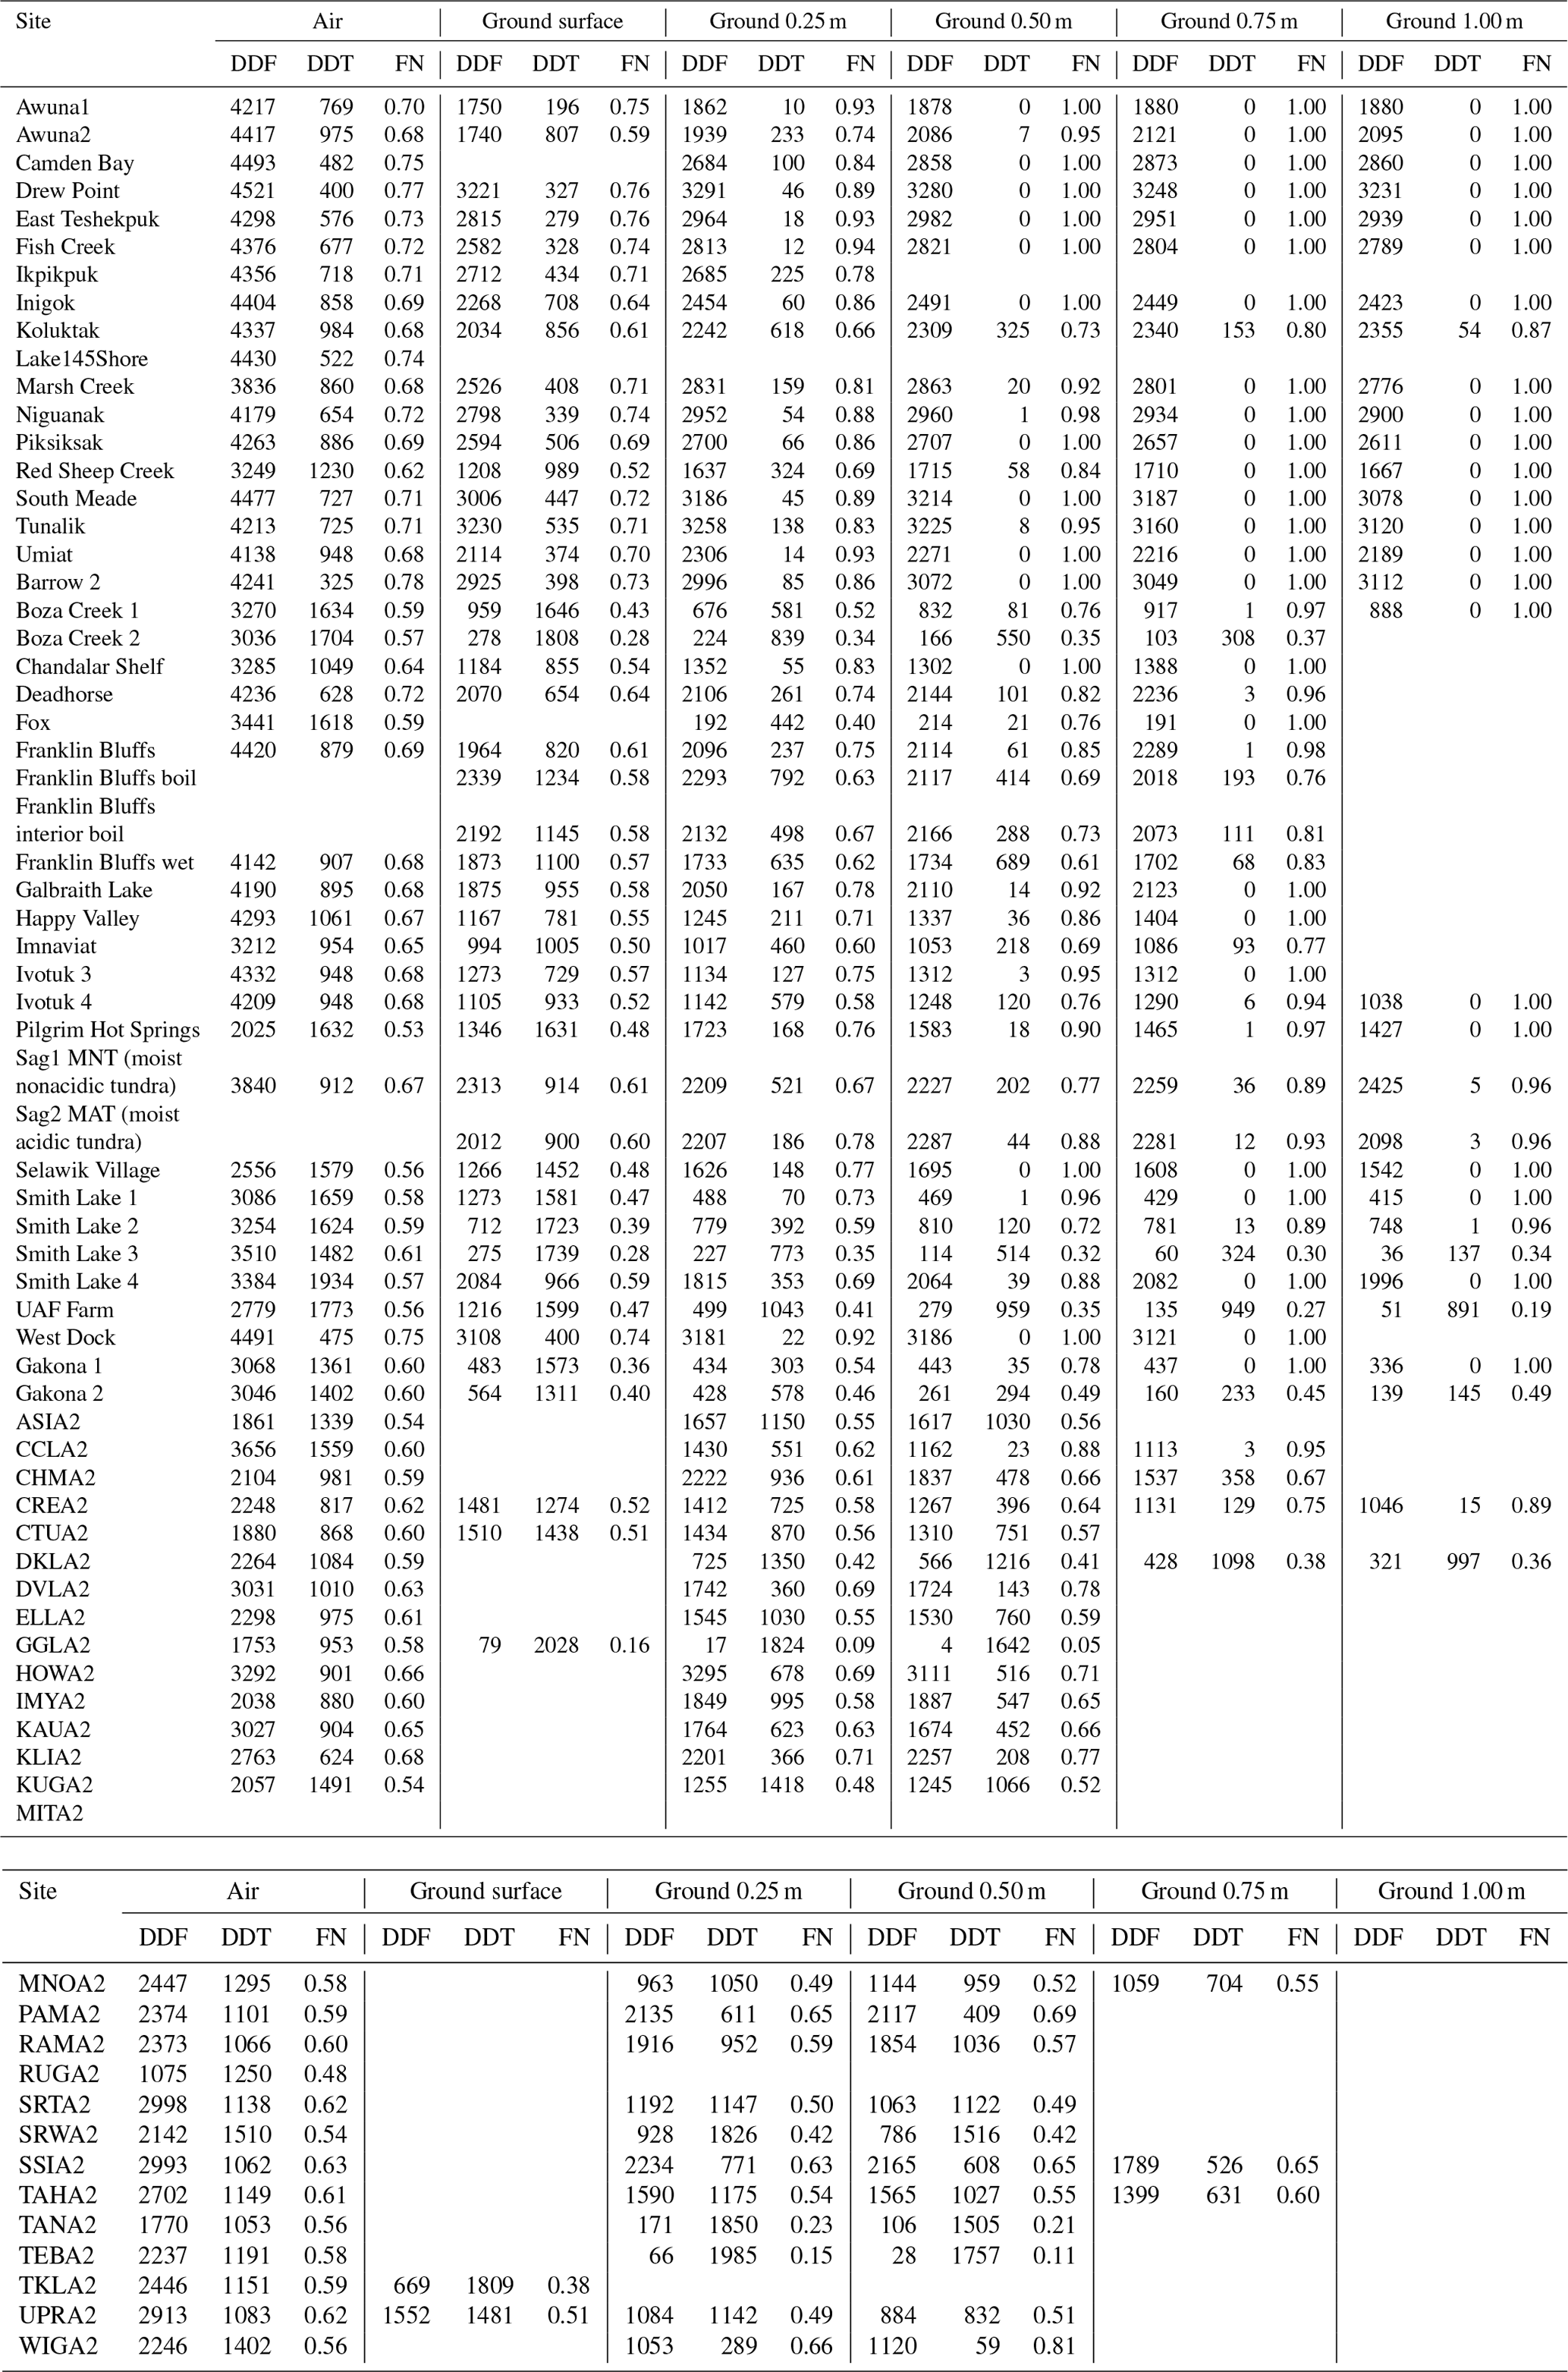
Table 5Summary of freezing index (DDF, ∘C days), thawing index (DDT, ∘C days), and frost number (FN, unitless) of air and ground temperatures over the entire observation period.
There are several sites in a small area that indicated inconsistency in air temperature trends. The inconsistency is mainly due to different observational periods and the relatively short duration of records. For example, there are several Smith Lake (SL) permafrost monitoring stations which are located north of the University of Alaska Fairbanks campus and west of Smith Lake with varying environmental conditions. (SL1 is in a white spruce forest with high canopy; SL2 is in a dense diminutive black spruce forest; and SL3 is located at the edge of the forest surrounded by black spruce trees and tussock shrubs; and SL4 is characterized by hummocks of sedges (tussocks) and shrubby vegetation with sparse black spruce.) The environmental conditions at the SL3 site provide favorable conditions for permafrost existence. The SL3 site has the longest air temperature record, indicating a cooling trend over the observational period (Fig. 9a). After calculating the differences between measured data for all three sites, we applied corresponding corrections and extend the data at all three sites. The overlap period (2006–2012) showed a consistent variation with the roughly constant offset between SL2 and SL3. By using the offset, we extended the records at SL3 to 2015. Figure 9b shows that extending the time series reduces the trend magnitude and changes the negative sign of the SL3 trend to positive, demonstrating the important difference between trends derived from a complete longer time series and those derived from a sparse time series.
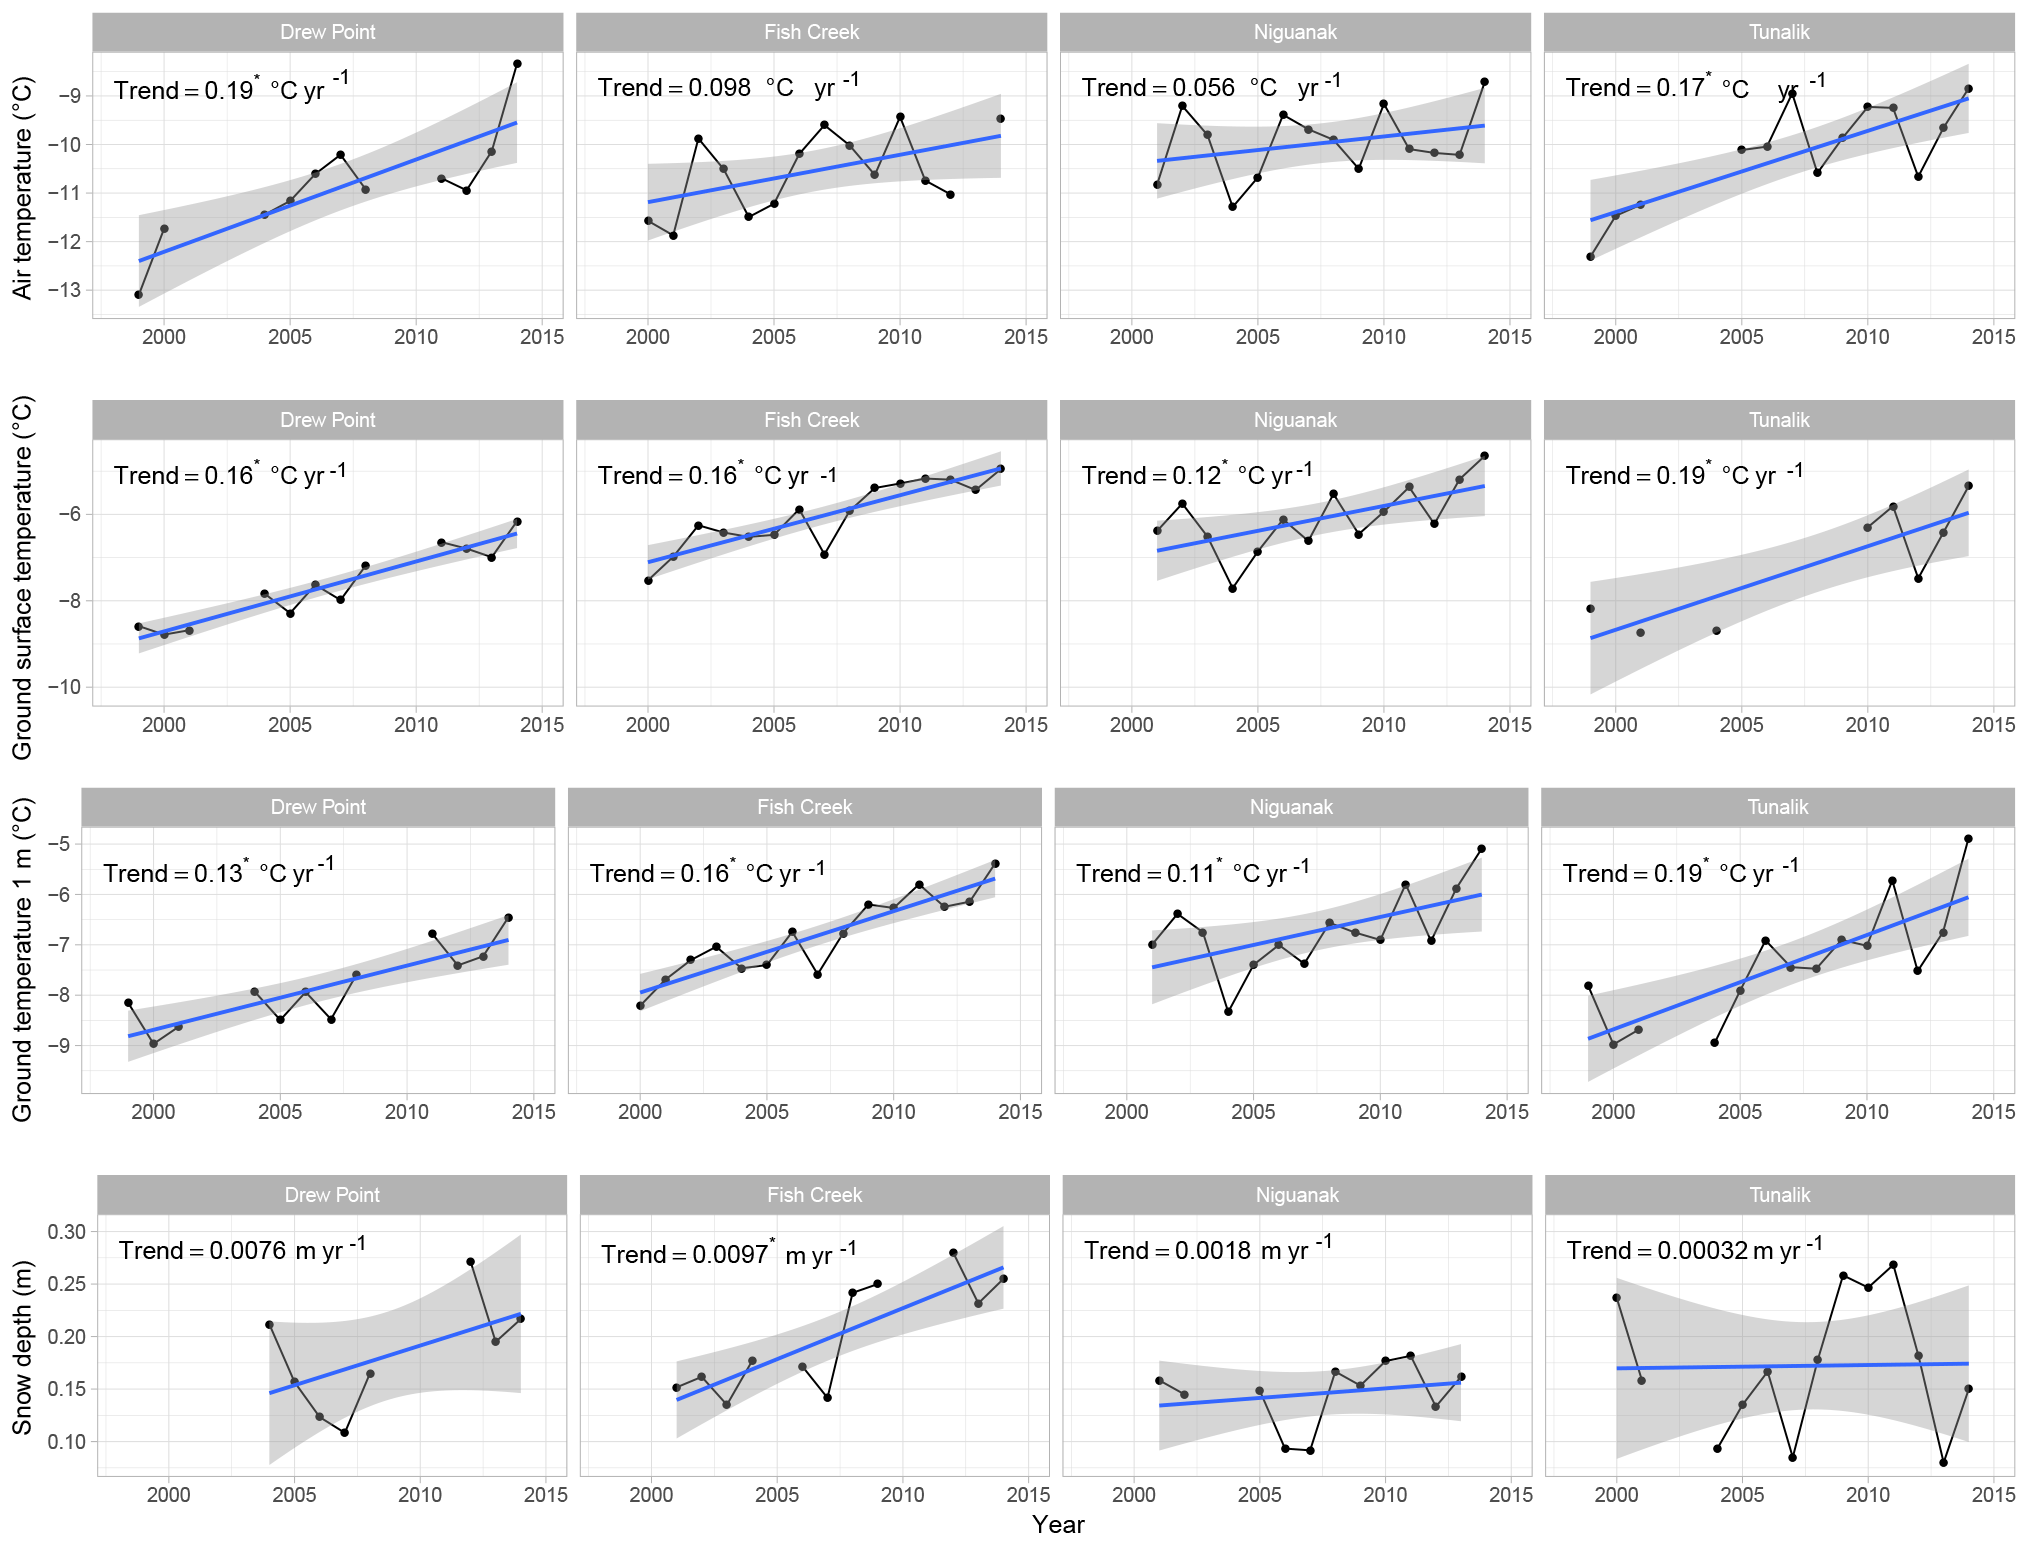
Figure 7Examples of time series of mean-annual air, ground surface, ground temperature at 1 m below ground surface, and snow depth. The black line shows the data time series, while the blue line is the estimated linear trend. Shading shows the standard error of the linear regression estimates. An asterisk indicates that the trend has a p value <0.05.

Figure 8(a) Stations with at least 10 years of identical period of air, ground surface, and ground temperature at 0.5 m. (b) Trend comparison of air temperature, ground surface temperature, and ground temperature at 0.5 m over 1997–2016. Trends were only estimated for those stations consisting of at least 10 years of data. Error bars represent standard errors from the linear regression analysis. Circles indicate trends with a p value ≤0.05; triangles indicate trends with a p value >0.05.
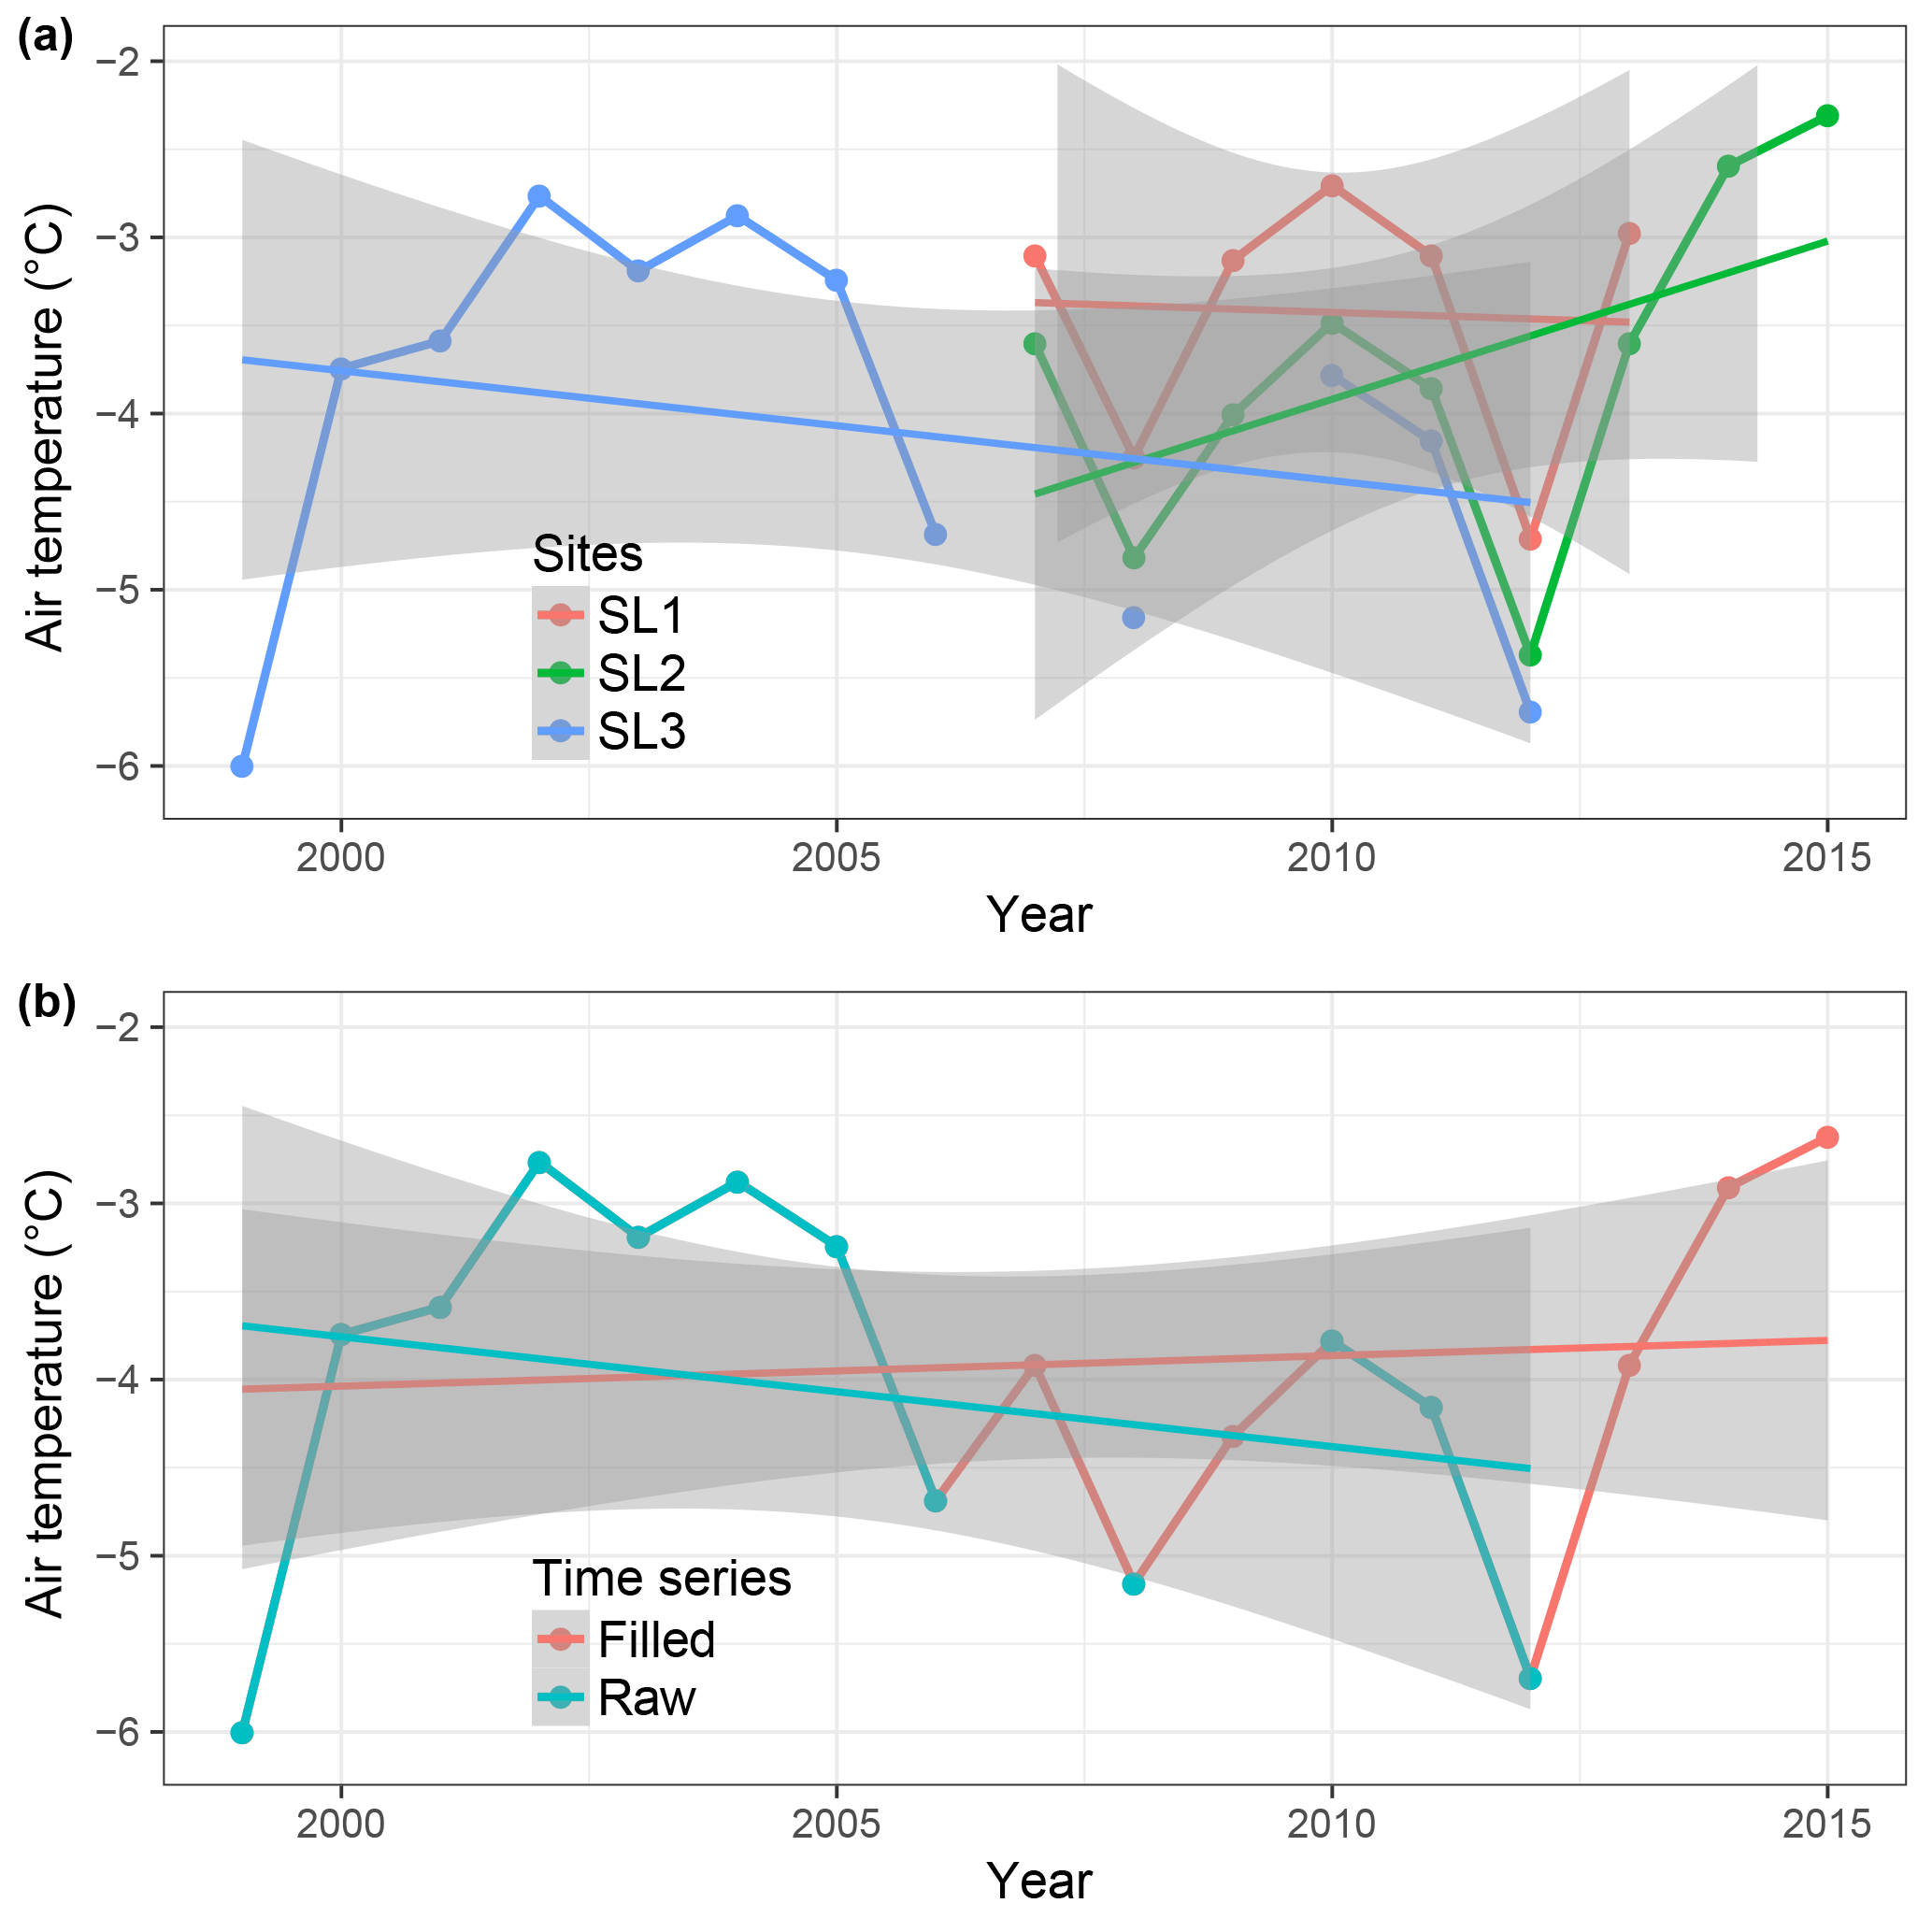
Figure 9Comparison between trends calculated using measured data at SL1, SL2, and SL3 (a). Panel (b) shows merged data series and corrected trends at SL3. Shading shows the standard error of the linear regression estimates.
Finally, we examined the physical relations among air temperature, snow cover, and ground thermal state (Fig. 10). Across stations, effective snow depth was generally less than 0.4 m. The normalized temperature amplitude difference (ΔAmpnorm) that calculates the temperature difference between air and ground surface shows a positive linear relationship with effective snow depth. This correlation, the so-called SHTM (Slater et al., 2017), implies that snow insulation effects increase with effective snow depth, which is consistent with previous studies (Burn and Smith, 1988; Demezhko and Shchapov, 2001; Morse et al., 2012; Slater et al., 2017; Zhang, 2005). In addition, while snow is considered an important factor in winter ground temperature, vegetation can also affect the amplitude through its influence on summer temperature.
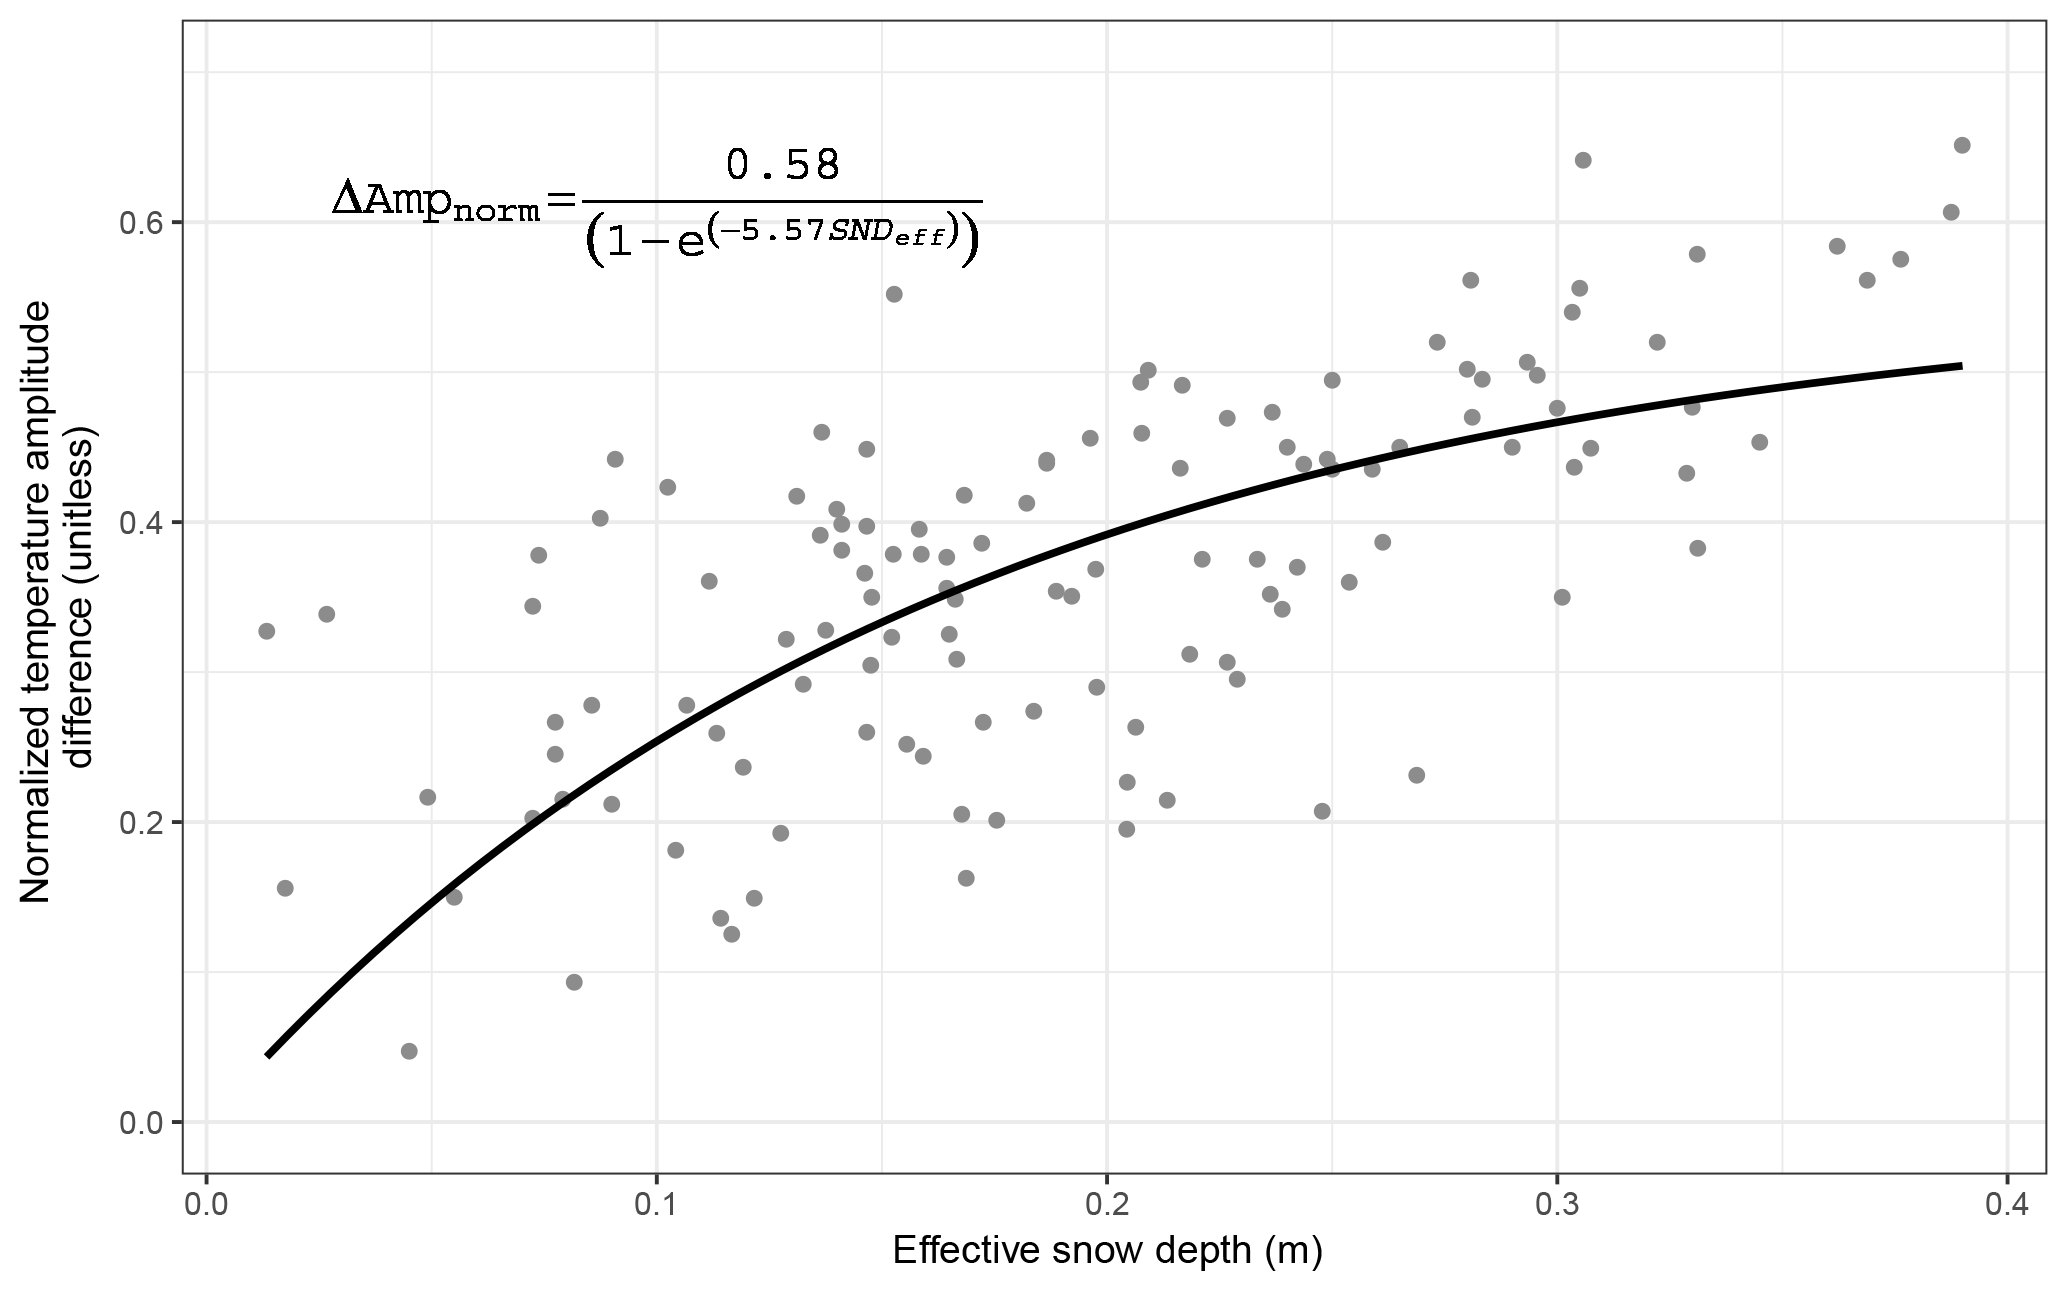
Figure 10Correlation between effective snow depth and normalized temperature amplitude difference between air and ground surface. The mathematical function of fit line follows the correlation showed in Slater et al. (2017).
The latest compiled dataset is available at the Arctic Data Center (https://doi.org/10.18739/A2KG55, Wang et al., 2018).
Changes in near-surface ground temperatures over time are important indicators of a changing climate because they provide vital information on the response of the permafrost to climate change. In this paper, we synthesize data of 72 monitoring stations in Alaska, spanning a large range of latitudes from 60.9 to 71.3∘ N and elevations from near sea level to 1327 m in tundra and boreal forest regions. This dataset consists of monthly ground temperatures at 0.25 m depth intervals up to 1 m, volumetric soil water content, snow depth, and air temperature during 1997–2016. The remoteness of the sites and the harsh environmental conditions inevitably result in missing data; our presented dataset is 77 % complete and consists of 41 667 data points. We describe the data compilation process, listing the workflow and the challenges associated with preparing the synthesis permafrost dataset for Alaska. These data were quality controlled during the data collection and processing stages. We also implemented a data harmonization evaluation for this compiled dataset. The PF-AK v0.1 can be easily integrated into model–data intercomparison tools such as the International Land Model Benchmarking (ILAMB) tool (Luo et al., 2012). Standard unified protocols developed nationally and internationally to monitor near-surface permafrost thermal conditions could significantly improve and simplify the development of permafrost benchmark datasets such as that presented in this paper and reduce the amount of time and effort required for data processing. This dataset should be a valuable permafrost dataset that is worth maintaining in the future. It also provides a prototype of basic data collection and management for other permafrost regions.
KW, EJ, and IO designed this study. KW compiled this dataset and wrote the draft. VR, WC, and AK provided the data and technical description from the UAF-GI monitoring network. GC and FU provided support for the USGS monitoring network. PS, ML, and KH supplied data from NPS network. All authors discussed the results and contributed to the final paper.
The authors declare that they have no conflict of interest.
This article is part of the special issue “Water, ecosystem, cryosphere, and climate data from the interior of Western Canada and other cold regions”. It is not associated with a conference.
We appreciate three anonymous reviewers, David Swanson, and the editor Chris
DeBeer for their careful review and insightful comments which significantly
strengthened our paper. We also appreciate all organizations and individuals for producing and making their data available. This study
was supported by the National Science Foundation (award no. 1503559) and the
NASA CMAC-14 project (no. NNX16AB19G). Gary Clow and Frank Urban were
supported by the U.S. Geological Survey's Climate and Land Use Change
Program. National Park Service data collection is supported by the NPS
Inventory and Monitoring Program. GI-UAF Permafrost Lab data collection was
supported by the National Science Foundation (Awards OPP-0120736,
ARC-0632400, ARC-0520578, ARC-0612533, and ARC-1304271) and by the State of
Alaska. Tingjun Zhang was supported by the Strategic Priority Research
Program of the Chinese Academy of Sciences (no. XDA20100308). Any use of
trade, firm, or product names is for descriptive purposes only and does not
imply endorsement by the U.S. Government.
Edited by: Chris DeBeer
Reviewed by: three anonymous referees
Abbott, B. W., Jones, J. B., Schuur, E. A. G., Chapin, F. S., Bowden, W. B., Bret-Harte, M. S., Epstein, H. E., Flannigan, M. D., Harms, T. K., Hollingsworth, T. N., Mack, M. C., McGuire, A. D., Natali, S. M., Rocha, A. V., Tank, S. E., Turetsky, M. R., Vonk, J. E., Wickland, K. P., Aiken, G. R., Alexander, H. D., Amon, R. M. W., Benscoter, B. W., Bergeron, Y., Bishop, K., Blarquez, O., Bond-Lamberty, B., Breen, A. L., Buffam, I., Cai, Y. H., Carcaillet, C., Carey, S. K., Chen, J. M., Chen, H. Y. H., Christensen, T. R., Cooper, L. W., Cornelissen, J. H. C., de Groot, W. J., DeLuca, T. H., Dorrepaal, E., Fetcher, N., Finlay, J. C., Forbes, B. C., French, N. H. F., Gauthier, S., Girardin, M. P., Goetz, S. J., Goldammer, J. G., Gough, L., Grogan, P., Guo, L. D., Higuera, P. E., Hinzman, L., Hu, F. S., Hugelius, G., Jafarov, E. E., Jandt, R., Johnstone, J. F., Karlsson, J., Kasischke, E. S., Kattner, G., Kelly, R., Keuper, F., Kling, G. W., Kortelainen, P., Kouki, J., Kuhry, P., Laudon, H., Laurion, I., Macdonald, R. W., Mann, P. J., Martikainen, P. J., McClelland, J. W., Molau, U., Oberbauer, S. F., Olefeldt, D., Pare, D., Parisien, M. A., Payette, S., Peng, C. H., Pokrovsky, O. S., Rastetter, E. B., Raymond, P. A., Raynolds, M. K., Rein, G., Reynolds, J. F., Robards, M., Rogers, B. M., Schadel, C., Schaefer, K., Schmidt, I. K., Shvidenko, A., Sky, J., Spencer, R. G. M., Starr, G., Striegl, R. G., Teisserenc, R., Tranvik, L. J., Virtanen, T., Welker, J. M., and Zimov, S.: Biomass offsets little or none of permafrost carbon release from soils, streams, and wildfire: an expert assessment, Environ. Res. Lett., 11, 34014–34014, https://doi.org/10.1088/1748-9326/11/3/034014, 2016. a
Bellingham, B. K.: Comprehensive Stevens Hydra Probe Users Manual, Report, Steven Water Monitoring System, Inc., 63 pp., 2015. a
Bieniek, P. A., Walsh, J. E., Thoman, R. L., and Bhatt, U. S.: Using Climate Divisions to Analyze Variations and Trends in Alaska Temperature and Precipitation, J. Climate, 27, 2800–2818, https://doi.org/10.1175/Jcli-D-13-00342.1, 2014. a
Biskaborn, B. K., Lanckman, J.-P., Lantuit, H., Elger, K., Streletskiy, D. A., Cable, W. L., and Romanovsky, V. E.: The new database of the Global Terrestrial Network for Permafrost (GTN-P), Earth Syst. Sci. Data, 7, 245–259, https://doi.org/10.5194/essd-7-245-2015, 2015. a
Box, G., Hunter, J. S., and Hunter, W. G.: Statistics for experimenters: design, innovation, and discovery, vol. 2, Wiley-Interscience New York, 2005. a
Brown, J., Ferrians, O., Heginbottom, J. A., and Melnikov, E.: Circum-Arctic Map of Permafrost and Ground-Ice Conditions, Version 2, avalable at: https://nsidc.org/data/ggd318 (last access: 12 December 2018), 1998. a, b
Brown, J., Hinkel, K. M., and Nelson, F. E.: The circumpolar active layer monitoring (calm) program: Research designs and initial results, Polar Geography, 24, 166–258, https://doi.org/10.1080/10889370009377698, 2000. a
Burn, C. R. and Smith, C. A. S.: Observations of the Thermal Offset in near-Surface Mean Annual Ground Temperatures at Several Sites near Mayo, Yukon-Territory, Canada, Arctic, 41, 99–104, 1988. a
Callaghan, T. V., Tweedie, C. E., Akerman, J., Andrews, C., Bergstedt, J., Butler, M. G., Christensen, T. R., Cooley, D., Dahlberg, U., Danby, R. K., Daniels, F. J., de Molenaar, J. G., Dick, J., Mortensen, C. E., Ebert-May, D., Emanuelsson, U., Eriksson, H., Hedenas, H., Henry, H. R. G., Hik, D. S., Hobbie, J. E., Jantze, E. J., Jaspers, C., Johansson, C., Johansson, M., Johnson, D. R., Johnstone, J. F., Jonasson, C., Kennedy, C., Kenney, A. J., Keuper, F., Koh, S., Krebs, C. J., Lantuit, H., Lara, M. J., Lin, D., Lougheed, V. L., Madsen, J., Matveyeva, N., McEwen, D. C., Myers-Smith, I. H., Narozhniy, Y. K., Olsson, H., Pohjola, V. A., Price, L. W., Riget, F., Rundqvist, S., Sandstrom, A., Tamstorf, M., Van Bogaert, R., Villarreal, S., Webber, P. J., and Zemtsov, V. A.: Multi-decadal changes in tundra environments and ecosystems: synthesis of the International Polar Year-Back to the Future project (IPY-BTF), Ambio, 40, 705–16, https://doi.org/10.1007/s13280-011-0179-8, 2011. a
Clow, G. D.: Temperature data acquired from the DOI/GTN-P Deep Borehole Array on the Arctic Slope of Alaska, 1973–2013, Earth Syst. Sci. Data, 6, 201–218, https://doi.org/10.5194/essd-6-201-2014, 2014. a
Demezhko, D. Y. and Shchapov, V. A.: 80,000 years ground surface temperature history inferred from the temperature–depth log measured in the superdeep hole SG-4 (the Urals, Russia), Global Planet. Change, 29, 219–230, https://doi.org/10.1016/S0921-8181(01)00091-1, 2001. a
Hill, K. and Sousanes, P.: Climate station maintenance in the Central Alaska Inventory and Monitoring Network: 2015 summary, Report, 2015. a
Hinzman, L. D., Deal, C. J., McGuire, A. D., Mernild, S. H., Polyakov, I. V., and Walsh, J. E.: Trajectory of the Arctic as an integrated system, Ecol. Appl., 23, 1837–1868, https://doi.org/10.1890/11-1498.1, 2013. a
IPCC: Climate change 2013: the physical science basis. Contribution of Working Group I to the Fifth Assessment Report of the Intergovernmental Panel on Climate Change, edited by: Stocker, T. F., Qin, D., Plattner, G.-K., Tignor, M., Allen, S. K., Boschung, J., Nauels, A., and Xia, Y., Cambridge University Press, Cambridge, United Kingdom and New York, NY, USA, 2013. a
Jorgenson, M., Yoshikawa, K., Kanevskiy, M., and Shur, Y.: Permafrost characteristics of Alaska, in: Proceedings of the Ninth International Conference on Permafrost, Fairbanks, AK, 29 June–3 July 2008, 29, 121–122, 2008. a, b, c
Knoblauch, C., Beer, C., Liebner, S., Grigoriev, M. N., and Pfeiffer, E.-M.: Methane production as key to the greenhouse gas budget of thawing permafrost, Nat. Clim. Change, 8, 309–312, https://doi.org/10.1038/s41558-018-0095-z, 2018. a
Koven, C. D., Lawrence, D. M., and Riley, W. J.: Permafrost carbon–climate feedback is sensitive to deep soil carbon decomposability but not deep soil nitrogen dynamics, P. Natl. Acad. Sci. USA, 112, 3752–3757, https://doi.org/10.1073/pnas.1415123112, 2015. a, b
Liljedahl, A. K., Boike, J., Daanen, R. P., Fedorov, A. N., Frost, G. V., Grosse, G., Hinzman, L. D., Iijma, Y., Jorgenson, J. C., and Matveyeva, N.: Pan-Arctic ice-wedge degradation in warming permafrost and its influence on tundra hydrology, Nat. Geosci., 9, 312–318, https://doi.org/10.1038/ngeo2674, 2016. a
Luo, Y. Q., Randerson, J. T., Abramowitz, G., Bacour, C., Blyth, E., Carvalhais, N., Ciais, P., Dalmonech, D., Fisher, J. B., Fisher, R., Friedlingstein, P., Hibbard, K., Hoffman, F., Huntzinger, D., Jones, C. D., Koven, C., Lawrence, D., Li, D. J., Mahecha, M., Niu, S. L., Norby, R., Piao, S. L., Qi, X., Peylin, P., Prentice, I. C., Riley, W., Reichstein, M., Schwalm, C., Wang, Y. P., Xia, J. Y., Zaehle, S., and Zhou, X. H.: A framework for benchmarking land models, Biogeosciences, 9, 3857–3874, https://doi.org/10.5194/bg-9-3857-2012, 2012. a
McGuire, A. D., Lawrence, D. M., Koven, C., Clein, J. S., Burke, E., Chen, G., Jafarov, E., MacDougall, A. H., Marchenko, S., Nicolsky, D., Peng, S., Rinke, A., Ciais, P., Gouttevin, I., Hayes, D. J., Ji, D., Krinner, G., Moore, J. C., Romanovsky, V., Schädel, C., Schaefer, K., Schuur, E. A. G., and Zhuang, Q.: Dependence of the evolution of carbon dynamics in the northern permafrost region on the trajectory of climate change, P. Natl. Acad. Sci. USA, 115, 3882–3887, https://doi.org/10.1073/pnas.1719903115, 2018. a, b, c
Melvin, A. M., Larsen, P., Boehlert, B., Neumann, J. E., Chinowsky, P., Espinet, X., Martinich, J., Baumann, M. S., Rennels, L., Bothner, A., Nicolsky, D. J., and Marchenko, S. S.: Climate change damages to Alaska public infrastructure and the economics of proactive adaptation, P. Natl. Acad. Sci. USA, 114, E122–E131, https://doi.org/10.1073/pnas.1611056113, 2017. a
Menne, M. J., Williams, C. N., and Vose, R. S.: The U.S. Historical Climatology Network Monthly Temperature Data, Version 2, B. Am. Meteorol. Soc., 90, 993–1007, https://doi.org/10.1175/2008bams2613.1, 2009. a
Morse, P. D., Burn, C. R., and Kokelj, S. V.: Influence of snow on near-surface ground temperatures in upland and alluvial environments of the outer Mackenzie Delta, Northwest Territories, Can. J. Earth Sci., 49, 895–913, https://doi.org/10.1139/E2012-012, 2012. a
Nelson, F. E. and Outcalt, S. I.: A computational method for prediction and regionalization of permafrost, Arctic Alpine Res., 19, 279–288, 1987. a, b, c
Plummer, N., Allsopp, T., Lopez, J. A., and Llansó, P.: Guidelines on Climate Observation: Networks and Systems, World Meteorological Organization, Geneva, Switzerland, 2003. a
Romanovsky, V., Marchenko, S., Daanen, R., Sergeev, D., and Walker, D.: Soil climate and frost heave along the permafrost/ecological North American Arctic transect, in: Proceedings of the Ninth International Conference on Permafrost, Institute of Northern Engineering: Fairbanks, AK, 2, 1519–1524, 2008. a, b
Romanovsky, V., Cable, W., and Kholodov, A.: Changes in permafrost and active-layer temperatures along an Alaskan permafrost-ecological transect, in: Proc. 68th Canadian Geotechnical Conf. and Seventh Canadian Conf. on Permafrost (GEOQuébec 2015), Quebec City, QC, 21–23 September 2015. a, b, c, d
Schaefer, K., Lantuit, H., Romanovsky, V. E., Schuur, E. A. G., and Witt, R.: The impact of the permafrost carbon feedback on global climate, Environ. Res. Lett., 9, 85003–85003, https://doi.org/10.1088/1748-9326/9/8/085003, 2014. a
Sherstiukov, A.: Dataset of daily soil temperature up to 320 cm depth based on meteorological stations of Russian Federation, RIHMI-WDC, 176, 224–232, 2012. a
Shiklomanov, N., Nelson, F., Streletskiy, D., Hinkel, K., and Brown, J.: The circumpolar active layer monitoring (CALM) program: data collection, management, and dissemination strategies, in: Proceedings of the ninth international conference on permafrost, vol. 29, Institute of Northern Engineering Fairbanks, Alaska, 2008. a
Shiklomanov, N. I., Streletskiy, D. A., Swales, T. B., and Kokorev, V. A.: Climate Change and Stability of Urban Infrastructure in Russian Permafrost Regions: Prognostic Assessment Based on Gcm Climate Projections, Geogr. Rev., 107, 125–142, https://doi.org/10.1111/gere.12214, 2017. a
Slater, A. G., Lawrence, D. M., and Koven, C. D.: Process-level model evaluation: a snow and heat transfer metric, The Cryosphere, 11, 989–996, https://doi.org/10.5194/tc-11-989-2017, 2017. a, b, c, d, e
Urban, F. E. and Clow, G. D.: DOI/GTN-P Climate and active-layer data acquired in the National Petroleum Reserve-Alaska and the Arctic National Wildlife Refuge, 1998–2015, U.S. Geological Survey Data Series 1021, 546 pp., https://doi.org/10.3133/ds1021, 2017. a, b, c, d
Urban, F. E. and Clow, G. D.: DOI/GTN-P climate and active-layer data acquired in the National Petroleum Reserve-Alaska and the Arctic National Wildlife Refuge, 1998–2016, U.S. Geological Survey Data Series 1092, 71 pp., https://doi.org/10.3133/ds1092, 2018. a
Wang, K., Zhang, T., and Zhong, X.: Changes in the timing and duration of the near-surface soil freeze/thaw status from 1956 to 2006 across China, The Cryosphere, 9, 1321–1331, https://doi.org/10.5194/tc-9-1321-2015, 2015. a
Wang, K., Zhang, T. J., Zhang, X. D., Clow, G. D., Jafarov, E. E., Overeem, I., Romanovsky, V., Peng, X. Q., and Cao, B.: Continuously amplified warming in the Alaskan Arctic: Implications for estimating global warming hiatus, Geophys. Res. Lett., 44, 9029–9038, https://doi.org/10.1002/2017gl074232, 2017. a
Wang, K., Overeem, I., Jafarov, E., Clow, G., Romanovsky, V., Schaefer, K., Urban, F., Cable, W., Piper, M., Schwalm, C., Zhang, T., Kholodov, A., Sousanes, P., Loso, M., Swanson, D., and Hill, K.: A synthesis dataset of near-surface permafrost conditions for Alaska, 1997–2016, Arctic Data Center, https://doi.org/10.18739/A2KG55, 2018. a
Yershov, E. D. and Williams, P. J.: General geocryology, Cambridge university press, New York, 2004. a
Zhang, T., Osterkamp, T. E., and Stamnes, K.: Influence of the Depth Hoar Layer of the Seasonal Snow Cover on the Ground Thermal Regime, Water Resour. Res., 32, 2075–2086, https://doi.org/10.1029/96WR00996, 1996. a
Zhang, T., Osterkamp, T. E., and Stamnes, K.: Effects of Climate on the Active Layer and Permafrost on the North Slope of Alaska, U.S.A., Permafrost Periglac., 8, 45–67, https://doi.org/10.1002/(SICI)1099-1530(199701)8:1<45::AID-PPP240>3.0.CO;2-K, 1997. a
Zhang, T., Barry, R. G., Knowles, K., Heginbottom, J. A., and Brown, J.: Statistics and characteristics of permafrost and ground-ice distribution in the Northern Hemisphere, Polar Geography, 23, 132–154, https://doi.org/10.1080/10889379909377670, 1999. a
Zhang, T. J.: Influence of the seasonal snow cover on the ground thermal regime: An overview, Rev. Geophys., 43, https://doi.org/10.1029/2004rg000157, 2005. a