the Creative Commons Attribution 4.0 License.
the Creative Commons Attribution 4.0 License.
 | 29 Nov 2018
Spatially distributed water-balance and meteorological data from the Wolverton catchment, Sequoia National Park, California
Erin M. Stacy
Xiande Meng
Martha H. Conklin
Peter B. Kirchner
Zeshi Zheng
Accurate water-balance measurements in the seasonal, snow-dominated Sierra Nevada are important for forest and downstream water management. However, few sites in the southern Sierra offer detailed records of the spatial and temporal patterns of snowpack and soil-water storage and the fluxes affecting them, i.e., precipitation as rain and snow, snowmelt, evapotranspiration, and runoff. To explore these stores and fluxes we instrumented the Wolverton basin (2180–2750 m) in Sequoia National Park with distributed, continuous sensors. This 2006–2016 record of snow depth, soil moisture and soil temperature, and meteorological data quantifies the hydrologic inputs and storage in a mostly undeveloped catchment. Clustered sensors record lateral differences with regards to aspect and canopy cover at approximately 2250 and 2625 m in elevation, where two meteorological stations are installed. Meteorological stations record air temperature, relative humidity, radiation, precipitation, wind speed and direction, and snow depth. Data are available at hourly intervals by water year (1 October–30 September) in non-proprietary formats from online data repositories (https://doi.org/10.6071/M3S94T).
- Article
(5366 KB) - Full-text XML
- BibTeX
- EndNote


The western slope of the Sierra Nevada, California, has an elevation-driven climate gradient where wintertime snowpack accumulation provides for a large part of California's annual water needs. Small temperature increases will raise the snowline elevation and alter snowmelt, and subsequent water use by vegetation, streamflow, and forest dryness (Goulden and Bales, 2014). The implications of such a shift affect forest management, downstream water management, and ultimately, regional water policy. This research program in the Wolverton basin (1720–3500 m elevation) of Sequoia National Park is part of a larger effort to quantify the two main near-surface stores of water, snowpack, and soil-water storage, across the current Sierra Nevada rain–snow transition.
As part of this research, we used distributed snow and soil sensors, as well as remotely sensed data, to characterize snow accumulation, snowmelt, and other components of the distributed water balance. The data set covers late 2006 through the end of water year (WY) 2016. This period includes the drought years of 2012–2015 as well as the high snow year in WY 2011.
Kirchner et al. (2014) found that snowmelt at the upper elevations occurs later in the season and at faster rates compared to lower elevations. Historically, the Wolverton basin has been in the seasonal snow zone of the southern Sierra Nevada, characterized by winter snow accumulation and spring ablation. At the lower elevations, winter snow cover is ephemeral in some years, with 70 %–95 % of the snow-covered season having slow melt rates (Kirchner et al., 2014). At upper elevations, melt occurs during less than 65 % of the season. Based on a 2010 set of lidar flights (Anderson et al., 2012), snow depth near the date of accumulation is greatest at an elevation of 3300 m, which is 200 m below the highest ridge. Between 1850 and 3300 m, snow depth increases at a rate of approximately 15 cm per 100 m; at higher elevations, snow depth decreases at a rate of 48 cm per 100 m (Kirchner et al., 2014). Elevation is one of the most important factors for determining snow depth across the catchment, though snow depth is also mediated by canopy penetration fraction northness and vegetation height (Zheng et al., 2016; Tennant et al., 2017). The difference between open canopy and under-canopy areas increases through the rain–snow transition up to 25–45 cm at high elevations (Fig. 1).
Meteorological factors, as well as the interference of canopy coverage, impact snow accumulation and melt at these sites. Sub-canopy direct-beam irradiance and a sky-view factor explain the most variation in snow ablation rates, especially at finer timescales (Musselman et al., 2012). A time-varying canopy parameter in snow modeling reduces errors by 7 days in the simulated snow disappearance date, and errors in the timing of soil-water fluxes by 11 days, on average, compared to a bulk parameterization of radiation transfer through the canopy (Kirchner et al., 2014).
Studies of this basin indicate that it is sensitive to a changing climate. The timing and rate of snowmelt indicate that this elevation range is sensitive to seasonal meteorology, especially where upper elevations may begin to experience snow melt during more of the snow-covered season (Kirchner et al., 2014). At both the upper and lower sites, peak soil moisture precedes the average date of snow disappearance, meaning that soil moisture declines even while snowmelt is infiltrating into the soil system (Harpold et al., 2015). With peak snow depth around 3300 m (Kirchner et al., 2014), such changes to the hydrological system could have major implications for snowpack water storage and runoff.
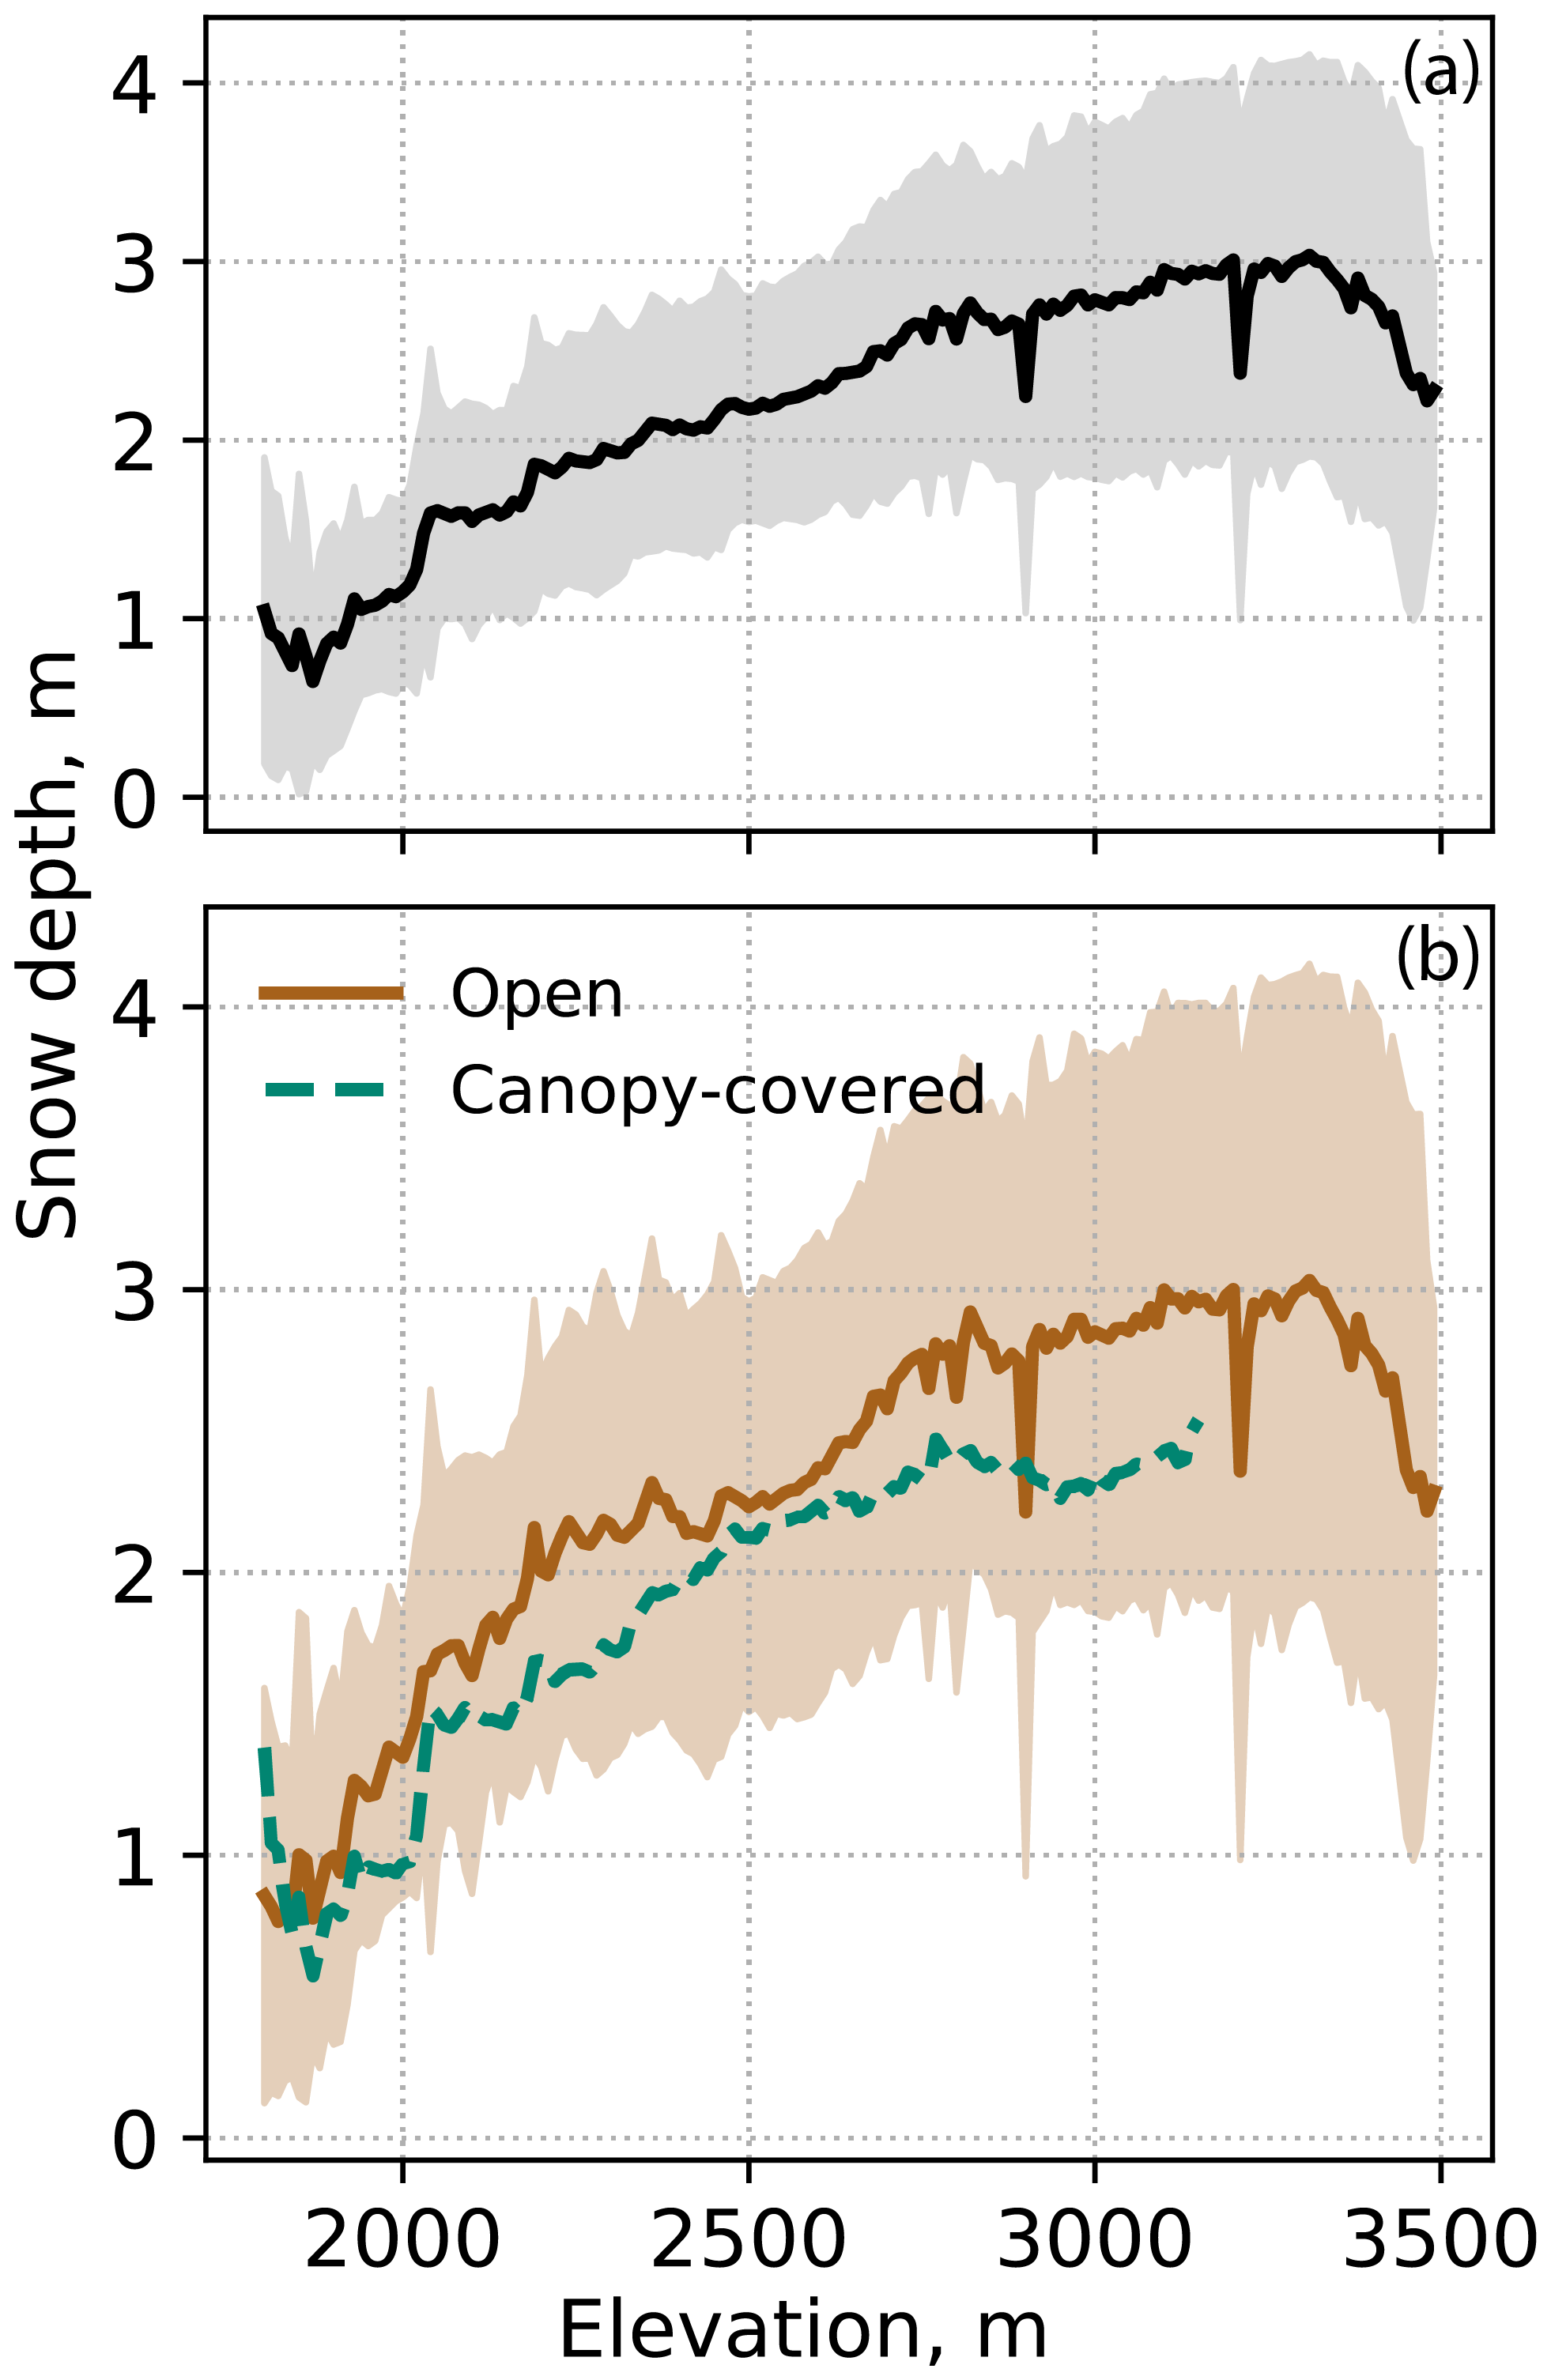
Figure 1Snow-depth changes over elevation observed from the lidar data in the Wolverton basin (a) for all snow-depth pixels and (b) for snow-depth pixels in the open area and under canopy. On average, snow depth increases with elevation nonlinearly with elevation below 3300 m and decreases when elevation is above 3300 m. Lidar data from Anderson et al. (2012).
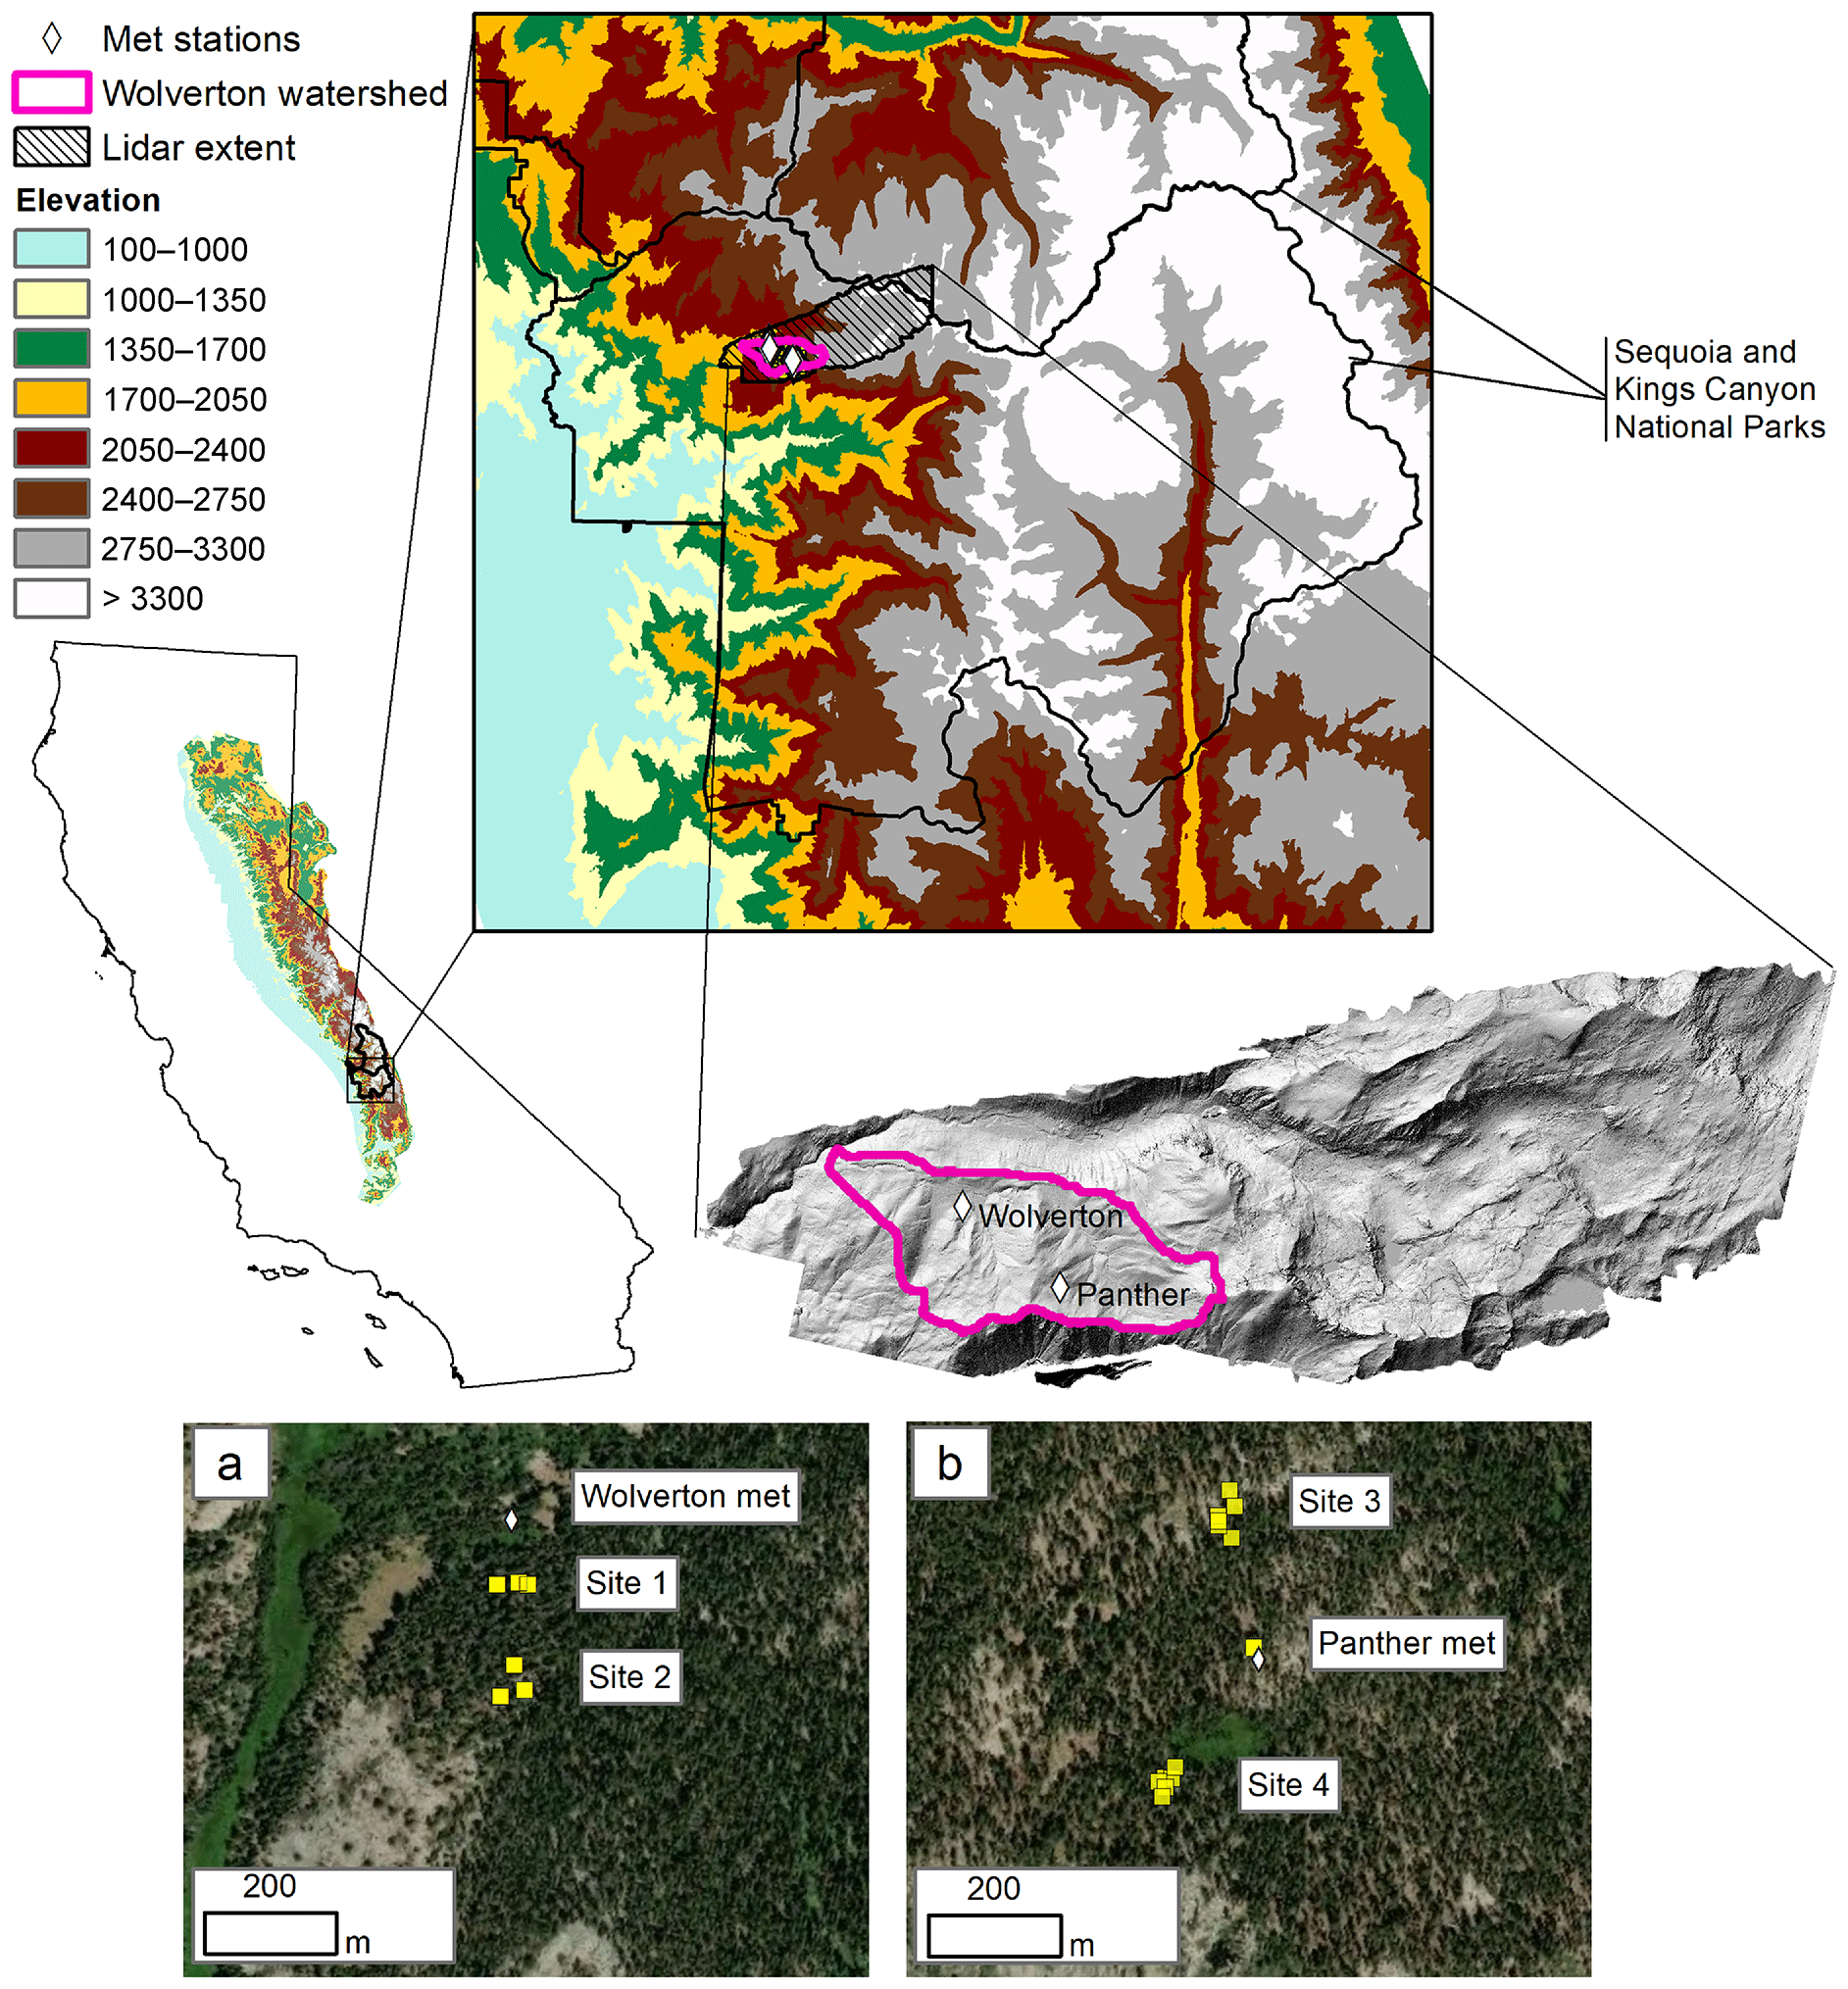
Figure 2Wolverton catchment in the Marble Fork of the Kaweah River, Sequoia and Kings Canyon National Parks. Distributed instruments are clustered around the (a) Wolverton and (b) Panther meteorological stations (topographic data: EDNA-filled DEM grid, U.S. Geological Survey, 2003. Lidar data: Anderson et al. (2012), snow-off surface raster. Imagery sources: Esri, DigitalGlobe, Earthstar Geographics, CNES/Airbus DS, GeoEye, USDA FSA, USGS, Aerogrid, IGN, IGP, and the GIS User Community, 20 July 2017.)
The Wolverton basin is a montane, forested catchment northeast of Giant Forest in Sequoia National Park (Fig. 2). In the 5.4 km2 catchment, the dominant aspect is 214∘ from the north, with an average slope of 21.1∘, determined by a Lidar flight (Harpold et al., 2014). Basin coverage is 45 %–55 % forest (Harpold et al., 2014). The forest transitions from mixed conifer at the lower elevations to subalpine forests at the higher elevations. Dominant species are red fir (Abies manifica), lodgepole pine (Pinus contorta), western white pine (Pinus monticola), incense cedar (Calocedrus decurrens), and Jeffrey pine (Pinus jeffreyi; Kirchner, 2014). A long, narrow meadow occupies the lower reaches of the western fork, and small meadows are present in the eastern fork.
Most of the catchment is undeveloped forest with no history of thinning, though there was a small downhill ski area in the basin for about 50 years until 1994. There is some recreational infrastructure at the base of the catchment, including trailhead parking lots, a water treatment plant, and recreational buildings. In addition, there are several recreational hiking trails around the catchment.
During the WY 2007–2016 period, mean annual precipitation was 728 mm at the nearby cooperative Lodgepole temperature and weather station operated by Sequoia and Kings Canyon National Parks. The mean annual temperature was 6.0 ∘C. The 2008–2010 water years in the Wolverton basin represent dry, normal, and wet years, where peak mean snow depths were 73 %–165 % of the 30-year average (Harpold et al., 2015). Soil texture in the upper 30 cm of soil was 6 % clay, 17 %–23 % silt, and 71 %–77 % sand (Harpold et al., 2015). Parts of the basin were previously glaciated. The geology of the basin is granodiorite, granite, and a mix of glacial and alluvial till in the lower reaches (U.S. Geological Survey, map GQ-1636).
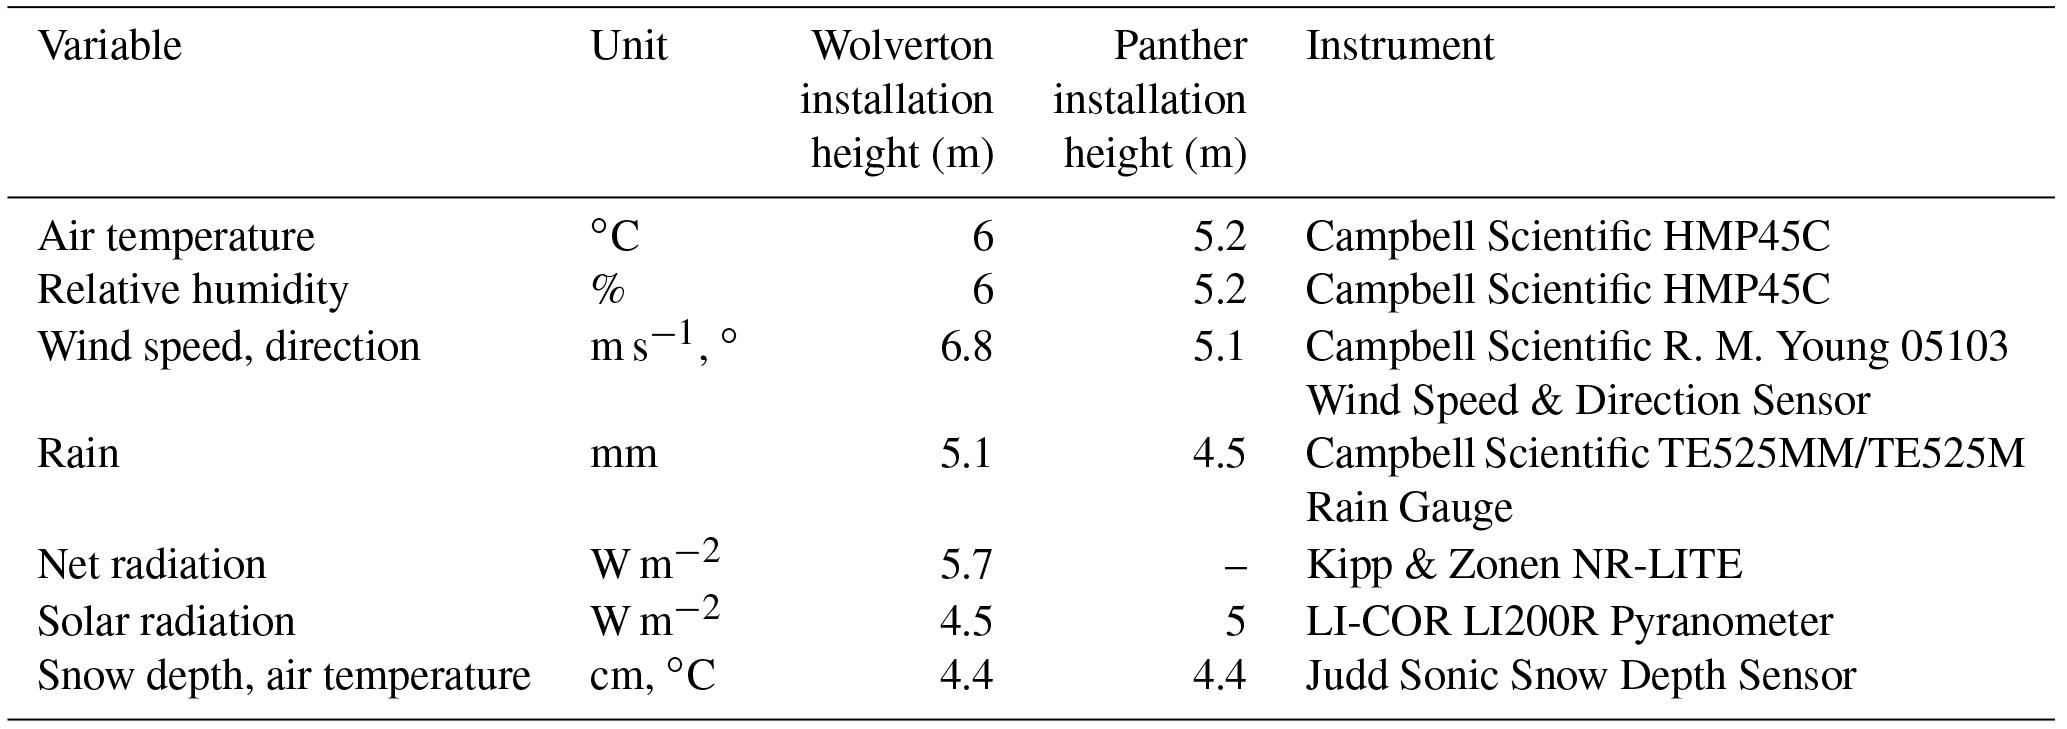
We installed and instrumented two meteorological stations (met) in 2008. The Wolverton meteorological station is at 2206 m, on a 7 m steel triangular-frame tower. The Panther meteorological station, at 2618 m, is a 6.1 m steel pole with cross-arms near the apex. Sensor instruments were installed for air temperature, relative humidity, wind speed, wind direction, net radiation, solar radiation, snow depth, and soil moisture and soil temperature. Sensor manufacturers and installation heights are listed in Table 1. Data are recorded at 60 min intervals on a on Campbell Scientific CR1000 data logger. Data acquisition programs are located on the UC Merced-SNRI digital library with the data.
The distributed sensor nodes were installed in four clusters at the upper and lower elevations in roughly north and south aspects (Fig. 2). The lower-elevation sites, 1 and 2, are south of Wolverton meteorological station and face north and southeast, respectively, at elevations of around 2226 and 2260 m. The upper-elevation sites, 3 and 4, are near the Panther meteorological station and face southeast and north, respectively, at elevations of around 2596 and 2636 m. Soil moisture and temperature, snow depth, and meteorological data (air temperature, relative humidity, and solar radiation) are measured at these clusters across the network at hourly intervals. Snow depth is stratified by canopy coverage, with 15 measurements at open canopy locations, six at the canopy drip edge, and five under the tree canopy (canopy classification was verified on-site). Distance to snow and soil surface and air temperature are measured with Judd Communications ultrasonic depth sensors, using analog control. Total solar radiation is measured with the LI-COR Environmental LI-200R Pyranometer, like the met stations. Soil volumetric water content (VWC) and soil temperature are measured using the Campbell Scientific CS 616 Water Content Reflectometer and 107 temperature probes at depths of 10, 30, and 60 cm below the mineral soil surface. The standard calibration for the CS-616 sensors was used. The fact that the sensors were not individually calibrated to soils at each site is one of the flaws in the original experimental design, but the standard calibration does have an accuracy of ±2.5 % VWC. Soil matric potential is measured in one location at each site using the Decagon Devices MPS-1 dielectric water potential sensor at depths of 10, 30, 60, and 90 cm below the mineral soil surface (http://www.decagon.com/products/discontinued-products/mps-1-dielectric-water-potential-sensor/, last access: 8 June 2018).
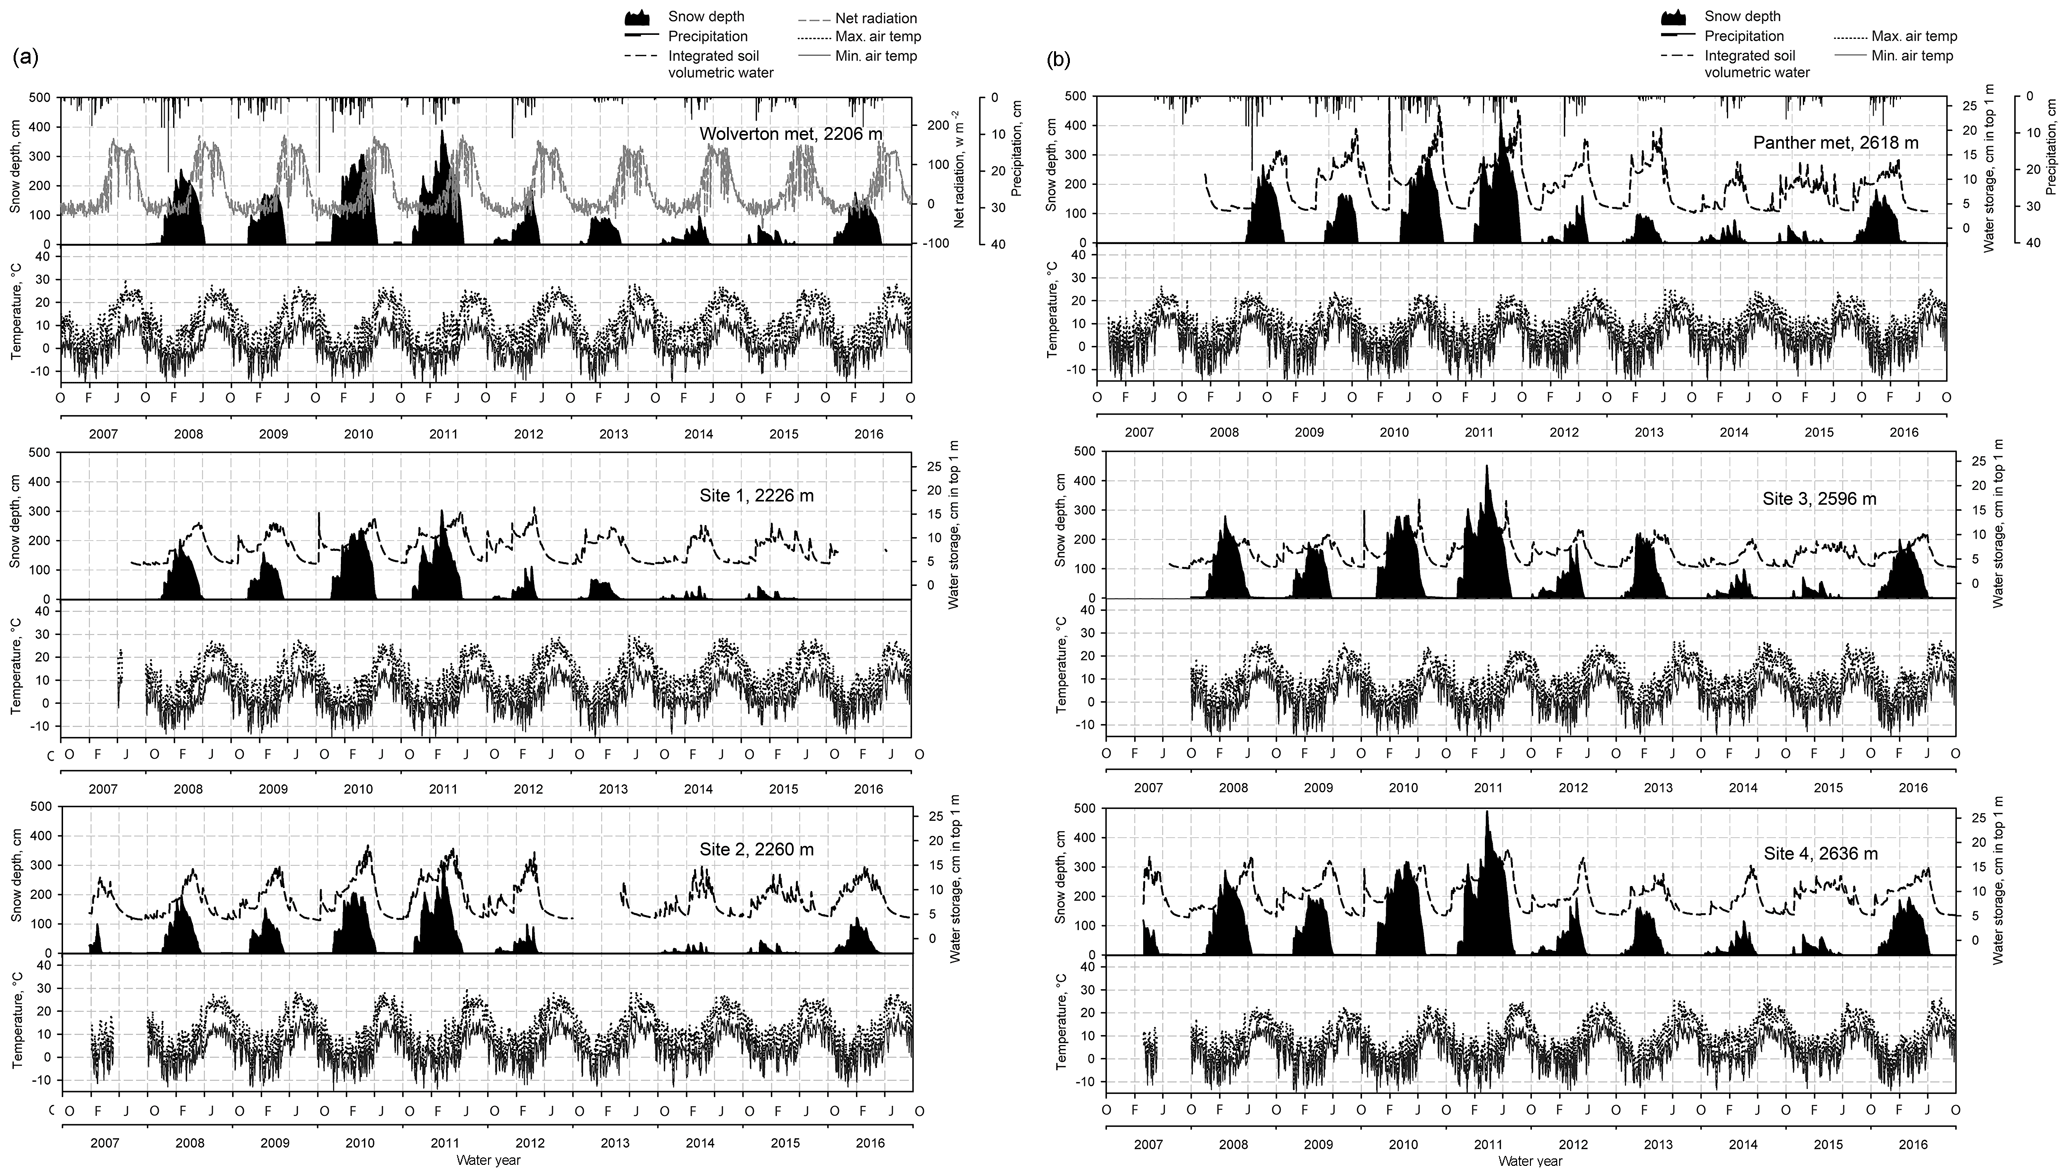
Figure 3(a) record of soil moisture, snow depth, and air temperature (max. and min.) at the lower-elevation instrument clusters. Near Wolverton meteorological station, Site 1 has a north aspect, and Site 2 has a southeast aspect. Precipitation from nearby meteorological station at Lodgepole is shown for comparison. (b) Record of soil moisture, snow depth, and air temperature (max. and min.) at the higher elevation instrument clusters. Near Panther meteorological station, Site 3 has a southeast aspect, and Site 4 has a north aspect. Precipitation from nearby meteorological station at Lodgepole is shown for comparison.
Data are recorded at 60 min scan intervals, with control and storage on Campbell Scientific CR1000 data logger, using an AM16/32B multiplexer. Program for data acquisition are located on the UC Merced-SNRI digital library with the data.
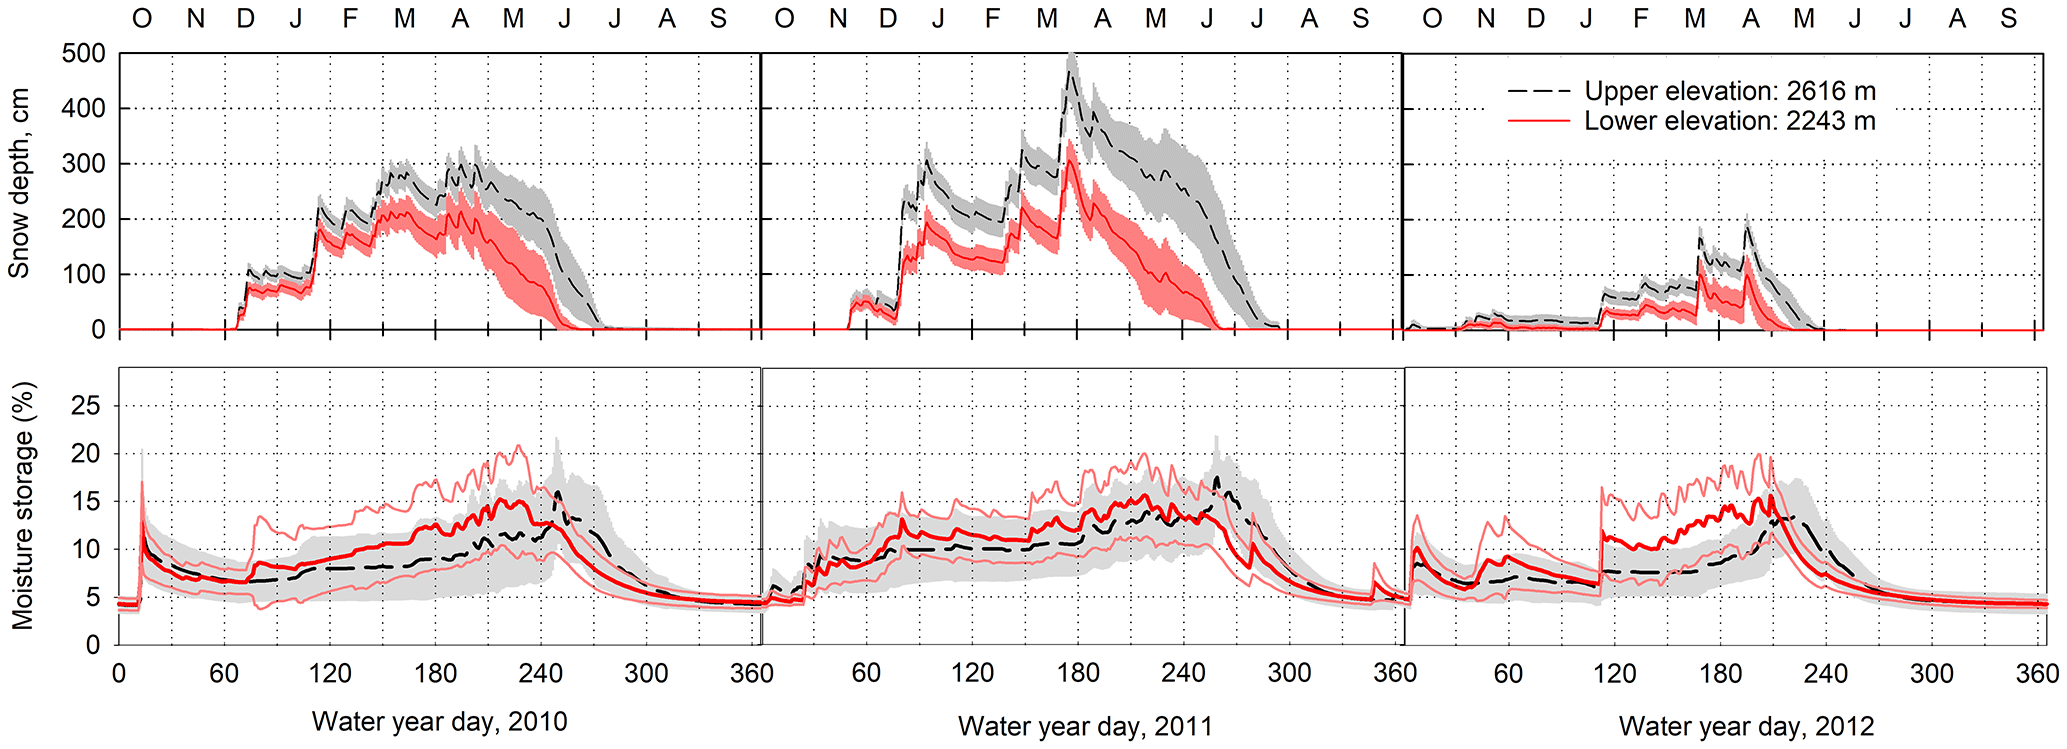
Figure 4The 24 sensor nodes highlight the spatial variability of soil moisture and snow depth through water years 2010 (average), 2011 (record-setting wet year), and 2012 (extremely dry). Soil moisture can be higher at the lower elevation than the higher elevation, and peak soil moisture may predate the end of snowmelt.
In water years 2007–2016, snowpack was deeper and more persistent at the higher-elevation sites (2640 m; Fig. 3a). Warmer temperatures at the lower-elevation sites (2245 m; Fig. 3b) result in earlier soil wet-up, higher mid-winter soil moisture storage, and earlier peak soil moisture storage in wet and dry years. Long data gaps at Site 2 in 2013 and at Site 1 in 2016 are due to battery and logger issues. Comparing average (WY 2010), wet (WY 2011), and dry (WY 2012) years, snowpack is persistent at both the upper- and lower-elevation sites (Fig. 4). However, in WY 2014 and 2015, snowpack receded multiple times during each winter. Soil moisture peaks earlier at the two lower-elevation clusters. The Wolverton met station experienced a wider swing in temperatures than the Panther met station. Mean annual temperature was 6.3 ∘C at the upper met station Panther, and 5.7 ∘C at the lower-elevation Wolverton station, with both warmer maximum and cooler minimum air temperatures at the Wolverton site. Water-level data are available for two locations in the meadow.
Some of the sensors have inherent possible biases. The precipitation sensors are unshielded and unheated tipping buckets. Precipitation measurements in each data set will underreport precipitation through undercatch, freezing, and coverage by snow. Considering this bias, the precipitation records shown for comparison with the other meteorological data (in Fig. 3a and b). That meteorological station has a weighing gauge with a long-term record, though the sensor is also unshielded.
Data are available at hourly intervals by water year (WY; 1 October–30 September), from WY 2007 through WY 2016. Data are available through online data repositories. Distributed snow depth, air temperature, and soil moisture and temperature are available through https://doi.org/10.6071/M3S94T (Bales et al., 2017), which links to data storage on a server hosted at University of California, Merced, or are available directly from our digital library at https://eng.ucmerced.edu/snsjho/files/MHWG/Field/SEKI/Wolverton (last access: 13 November 2018). These data from the distributed networks have been processed to level 1 (QA/QC) and level 2 (gap-filled, derived) data. Raw data for matric potential, sap flow, and solar radiation at each site are also available. Gaps are filled through regression with a nearby sensor node, which is selected based on the best correlation. Multiple neighboring nodes may be selected if needed, and different neighboring nodes may be used to fill each measurement. Short gaps, or gaps in soil temperature, may be filled through linear interpolation. Process notes (metadata) are available from the data repositories. Data in at each site of clusters (e.g., Site 1 or Site 3) are organized by and named by installation location (P1, P2, etc., with canopy coverage indicated as “DE” for drip edge, “UC” for under canopy, or “O” for open).
A 10-year meteorological and hydrologic data record is presented for a catchment in Sequoia National Park, in the southern Sierra Nevada. Distributed snow depth and soil temperature and moisture combined with two meteorological stations provide a means of testing and evaluating hydrologic processes in a productive montane forest. The Wolverton basin research site serves as a southern comparison point with installations in the Kings River (SSCZO; 2008–present; Bales et al., 2018), Merced River (MRB; 2006–present; Roche, 2017), Stanislaus River (2013–present, Pickard, 2015), American River (2014–present; Zhang et al., 2016, 2017a, b), and Feather River (2016–present; Avanzi et al., 2018) basins. Studies compiled to date indicate that hydrological variables, including snow depth, the timing and rate of snow melt, and soil moisture, are susceptible to changing climate patterns like warmer temperature or increased vegetation water demands in this part of the Sierra Nevada. We invite others to use this data for their own studies of the basin or as a comparison point to further the discussion.
RCB, MHC, and PBK designed the sensor networks. PBK, EMS, XM, and ZZ installed and maintained the sensor networks and processed the sensor-network data. RCB, EMS, and ZZ prepared the paper with contributions from all authors.
The authors declare that they have no conflict of interest.
This article is part of the special issue “Hydrometeorological data from mountain and alpine research catchments”. It is not associated with a conference.
We thank the Sequoia and Kings Canyon National Parks research and permitting
staff and the staff and research team at the Southern Sierra Critical Zone
Observatory. This research was funded in part by NSF EAR-0725097,
EAR-1239521, and EAR-1331939 for the Southern Sierra Critical Zone
Observatory, and the University of California, Merced.
Edited by: Danny Marks
Reviewed by: Edward Bair and one anonymous referee
Anderson, S. P., Qinghua, G., and Parrish, E. G.: Snow-on and snow-off Lidar point cloud data and digital elevation models for study of topography, snow, ecosystems and environmental change at Southern Sierra Critical Zone Observatory, California, Univ. Cal. Merced, digital media, https://doi.org/10.5069/G9BP00QB, 2012.
Avanzi, F., Maurer, T. P., Malek, S. A., Glaser, S. D., Bales, R. C., and Conklin, M. H.: Feather River Hydrologic Observatory: Improving hydrological snow pack forecasting for hydropower generation using intelligent information systems, State of California Energy Commission, Report CCCA4-CEC-2018-001, Sacramento, CA, 2018.
Bales, R. C., Stacy, E. M., Meadows, M., Kirchner, P. B., Conklin, M. H., and Meng, X.: Southern Sierra Critical Zone Observatory (SSCZO), Wolverton Creek meteorological data, soil moisture and temperature, v3, UC Merced Dash, Dataset, https://doi.org/10.6071/M3S94T, 2017.
Bales, R., Stacy, E., Safeeq, M., Meng, X., Meadows, M., Oroza, C., Conklin, M., Glaser, S., and Wagenbrenner, J.: Spatially distributed water-balance and meteorological data from the rain–snow transition, southern Sierra Nevada, California, Earth Syst. Sci. Data, 10, 1795–1805, https://doi.org/10.5194/essd-10-1795-2018, 2018.
Goulden, M. L. and Bales, R. C.: Mountain runoff vulnerability to increased evapotranspiration with vegetation expansion, P. Natl. Acad. Sci. USA, 111, 14071–14075, https://doi.org/10.1073/pnas.1319316111, 2014.
Harpold, A. A., Guo, Q., Molotch, N., Brooks, P. D., Bales, R., Fernandez-Diaz, J. C., Musselman, K. N., Swetnam, T. L., Kirchner, P., Meadows, M., Flanagan, J., and Lucas, R.: LiDAR-derived snowpack data sets from mixed conifer forests across the Western United States, Water Resour. Res., 50, 2749–2755, https://doi.org/10.1002/2013WR013935, 2014.
Harpold, A. A., Molotch, N. P., Musselman, K. N., Bales, R. C., Kirchner, P. B., Litvak, M., and Brooks, P. D.: Soil moisture response to snowmelt timing in mixed-conifer subalpine forests, Hydrol. Process., 29, 2782–2798, https://doi.org/10.1002/hyp.10400, 2015.
Kirchner, P.: Snow distribution over an elevation gradient and forest snow hydrology of the southern Sierra Nevada, California, Environmental Systems Graduate Group, Univ. Cal. Merced, PhD Dissertation, 192 pp., Merced, CA, 2014.
Kirchner, P. B., Bales, R. C., Molotch, N. P., Flanagan, J., and Guo, Q.: LiDAR measurement of seasonal snow accumulation along an elevation gradient in the southern Sierra Nevada, California, Hydrol. Earth Syst. Sci., 18, 4261–4275, https://doi.org/10.5194/hess-18-4261-2014, 2014.
Musselman, K. N., Molotch, N. P., Marguilis, S. A., Kirchner, P. B., and Bales, R. C.: Influence of canopy structure and direct beam solar irradiance on snowmelt rates in a mixed conifer forest, Agr. Forest. Meteorol., 161, 46–56, https://doi.org/10.1016/j.agrformet.2012.03.011, 2012.
Pickard, M. R.: Influence of within-stand tree spatial arrangement on snowpack distribution and ablation in the Sierra Nevada, CA, Environmental Systems Graduate Group, Univ. Cal. Merced, MS Thesis, Merced, CA, 82 pp., 2015.
Roche, J. W.: Evaluating water balance components in the Sierra Nevada: Snowpack sensitivity to climate warming and forest evapotranspiration reduction potential, Environmental Systems Graduate Group, Univ. Cal. Merced, Merced, CA, PhD Dissertation, 152 pp., 2017.
Tennant, C. J., Harpold, A. A., Lohse, K. A., Godsey, S. E., Crosby, B. T., Larsen, L. G., Brooks, P. D., Van Kirk, R. W., and Glenn, N. F.: Regional sensitivities of seasonal snowpack to elevation, aspect, and vegetation cover in western North America, Water Resour. Res., 53, 6908–6926, https://doi.org/10.1002/2016WR019374, 2017.
Zhang, Z., Glaser, S. D., Watteyne, T., and Malek, S.: Long-term monitoring of the Sierra Nevada snowpack using wireless sensor networks, IEEE Internet Things, 12, 1–9, 2016.
Zhang, Z., Glaser, S. D., Bales, R. C., Conklin, M. H., Rice, R., and Marks, D. G.: Insights into mountain precipitation and snowpack from a basin-scale wireless sensor network, Water Resour. Res., 53, 6626–6641, 2017a.
Zhang, Z., Glaser, S. D., Bales, R. C., Conklin, M. H., Rice, R., and Marks, D. G.: Technical report: The design and evaluation of a basin-scale wireless sensor network for mountain hydrology, Water Resour. Res., 53, 4487–4498, https://doi.org/10.1002/2016WR019619, 2017b.
Zheng, Z., Kirchner, P. B., and Bales, R. C.: Topographic and vegetation effects on snow accumulation in the southern Sierra Nevada: a statistical summary from lidar data, The Cryosphere, 10, 257–269, https://doi.org/10.5194/tc-10-257-2016, 2016.