the Creative Commons Attribution 4.0 License.
the Creative Commons Attribution 4.0 License.
 | 09 Jan 2018
Rainfall simulation experiments in the southwestern USA using the Walnut Gulch Rainfall Simulator
Viktor Polyakov
Jeffry Stone
Chandra Holifield Collins
Mark A. Nearing
Ginger Paige
Jared Buono
Rae-Landa Gomez-Pond
This dataset contains hydrological, erosion, vegetation, ground cover, and other supplementary information from 272 rainfall simulation experiments conducted on 23 semiarid rangeland locations in Arizona and Nevada between 2002 and 2013. On 30 % of the plots, simulations were conducted up to five times during the decade of study. The rainfall was generated using the Walnut Gulch Rainfall Simulator on 2 m by 6 m plots. Simulation sites included brush and grassland areas with various degrees of disturbance by grazing, wildfire, or brush removal. This dataset advances our understanding of basic hydrological and biological processes that drive soil erosion on arid rangelands. It can be used to estimate runoff, infiltration, and erosion rates at a variety of ecological sites in the Southwestern USA. The inclusion of wildfire and brush treatment locations combined with long-term observations makes it important for studying vegetation recovery, ecological transitions, and the effect of management. It is also a valuable resource for erosion model parameterization and validation.
The dataset is available from the National Agricultural Library at https://data.nal.usda.gov/search/type/dataset (DOI: https://doi.org/10.15482/USDA.ADC/1358583).
- Article
(2344 KB) - Full-text XML
- BibTeX
- EndNote


Soil erosion negatively impacts rangelands by impairing their ability to produce biomass (Stavi et al., 2009; Yisehak et al., 2013). The extent of this influence in comparison with other environmental and anthropogenic factors is poorly understood. Preservation and sustainable management of semiarid ecosystems require good knowledge of the physical processes involved in soil erosion and their interaction with plant communities. The experimental data needed to generate this knowledge are limited in time and space and often lacks the ecological context in which they were gathered. Further, such data are difficult and costly to acquire by instrumenting natural hydrological systems (Nichols, 2006).
Artificial rainfall experiments on small plots provide a relatively quick and economical way to obtain necessary erosion information in a controlled and replicable setting (Lascelles et al., 2000; Parsons and Lascelles, 2000; Yakubu and Yusop, 2017). Field experiments under simulated rainfall have been conducted in the US since the 1930s using stationary sprinkler systems (Meyer and McCune, 1958). Later simulators utilized a rotating boom design and V-jet nozzles (Swanson, 1965), which enhanced uniformity and allowed easier control of rainfall intensity. Further advancement came with the development of a portable Walnut Gulch Rainfall Simulator (WGRS) that featured improved spatial distribution of rainfall over a wider plot area, with rainfall energy and drop sizes similar to those of natural events (Paige et al., 2004).
The presented rainfall simulation data were collected by the Southwest Watershed Research Center (SWRC) over the period of 12 years (2002–2013) using a WGRS. The set encompasses 272 simulation experiments conducted at 23 rangeland sites located in grassland, shrubland, juniper, and oak savanna communities, many of which were affected by wildfire, grazing, or brush and tree removal. The dataset contains hydrological (runoff rate and flow velocity) and erosion (sediment concentration and rate) measurements obtained over a wide range (60 to 180 mm h−1) of rainfall intensities. Ground cover (vegetation, basal, litter, rock, soil) and other supporting information are also provided. The dataset is supplemented with photographs of individual plots and landscapes. The compiled and organized dataset will facilitate better dissemination of information among researchers, enabling further insights into soil erosion processes. It will compliment a similar and ongoing effort by SWRC to document long-term watershed-scale processes on arid rangelands (Nichols et al., 2008; Stone et al., 2008).
Our objectives are to provide information on (a) basic erosion processes and interactions between rainfall, runoff, infiltration, surface cover, and their spatial variability; (b) erosion rates at different ecological sites; (c) the impacts of grazing, brush treatment, wildfires, and ecological transitions on erosion; (d) parameters for hydrological and erosion models and their validation.
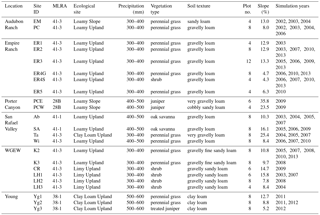
Twenty-three rainfall simulation sites were established throughout Arizona and Nevada rangelands (Table 1; Appendix B in Stone et al., 2017). In Arizona the climate is defined by the North American Monsoon (Adams and Comrie, 1997). Most precipitation is delivered by short-duration, high-intensity convective storms that occur in July through September. May and June are the driest months of the year.
Six sites were located at the Walnut Gulch Experimental Watershed (WGEW) in the upper San Pedro River basin in southeastern Arizona in CRA (Common Resource Area) 41.AZ3 (Chihuahuan–Sonoran Semidesert Grasslands). Mean annual temperature in the area is 17.7 ∘C. The LH and CR sites are located on Limy Upland (site ID R041XC309AZ) that dominate the western portion of the WGEW. The representative soil series there are Luckyhill (coarse-loamy, mixed, superactive, thermic Ustic Haplocalcids) and McNeal (fine-loamy, mixed, superactive, thermic Ustic Calciargids) very gravelly sandy loam (NRCS, 2003). The soil consists of approximately 39 % gravel, 32 % sand, 16 % silt, and 13 % clay. Limy Uplands have enough precipitation (290 mm yr−1) to support grass communities; however, the soils (coarsely textured and high in carbonates) favor drought-tolerant shrubs, such as creosote (Larrea tridentata (DC.) Coville) and whitethorn (Acacia constricta Benth.). Grasses in this environment account for no more than 30 % of biomass production, even less if the area is grazed. Brush control measures on Limy Uplands have a low chance of long-term success. The Kendall sites (K2, K3) are located on Loamy Upland (R041XC313AZ). The area receives an average of 345 mm of precipitation a year. The soils there are a complex of Stronghold (coarse-loamy, mixed, thermic Ustollic Calciorthids), Elgin (fine, mixed, thermic, Ustollic Paleargids), and McAllister (fine-loamy, mixed, thermic, Ustollic Haplargids) (NRCS, 2003). Stronghold, a dominant soil, contains 67 % sand, 16 % silt, and 17 % clay, with 79 % coarse fragments (> 2 mm). The organic carbon content of the soil surface (0–2.5 cm) is 1.1 %. Desert bunchgrasses, such as black grama (Bouteloua eriopoda Torr.), side oats grama (B. curtipendula Torr.), three-awn (Aristida sp.), and cane beard grass (Bothriochloa barbinodis (Lag.) Herter) and forbs dominate the area. Some shrubs and succulents are also present. The site has been affected by a recent Lehmann love grass (Eragrostis lehmanniana Nees) invasion (Moran et al., 2009; Polyakov et al., 2010).
Six rainfall sites located on the historic Empire Ranch northeast of Sonoita, Arizona, are also in CRA 41.AZ3 and all are Loamy Uplands. Empire Ranch has been heavily grazed in the past, although the timing and extent of grazing is poorly documented. The annual precipitation at these locations ranges between 300 and 400 mm yr−1. The soils are gravelly loams and belong to the White House (fine, mixed, thermic, Ustollic Haplargids) soil series (NRCS, 2003). They were formed on alluvial fans and are characterized by a shallow A horizon underlain by deep argillic and calcic horizons. Sites ER1, ER2, and ER5 have a historic climax plant community (HCPC) dominated by beard grass (Bothriochloa spp.), grama (Bouteloua spp.), love grass (Eragrostis spp.), three-awn (Aristida spp.), and native forbs. ER3, ER4S, and ER4G have a mesquite–native plant community. All Empire Ranch sites were being grazed at the time of the experiments, except for ER5 which has been an exclosure since the mid-1980s. The ER2 site had a wildfire in 2000 and had heavy grazing until the mid-2000s. The ER3 site burned in 2005 prior to rainfall simulation that year. The ER4S has established mesquites on the plots, and the mesquites on ER4G were mechanically removed in 2006 a month after rainfall simulation. By 2010, the mesquite had resprouted and was approximately 2 m tall. ER4S and ER4G are located in close proximity to each other and share the same hydro-ecological characteristics.
The San Rafael Valley and Audubon Ranch south of Sonoita, Arizona, contained six simulation locations. SA and Ab in San Rafael Valley are located in CRA 41.AZ1 (Mexican Oak–Pine Forest and Oak Savannah) at 1550–1600 m elevation in a 400–500 mm precipitation zone. Vegetation there includes Emory oak (Quercus emoryi Torr.), Mexican blue oak (Q. oblongifolia Torr.), Arizona white oak (Q. arizonica Sarg.), and grama species (Bouteloua spp.). The ecological sites in this area are Loamy Uplands (PC, Wi, Ab, and SA), Loamy Slope (EM) and Clay Loam Uplands (Ta). The San Rafael Valley is dominated by the White House soil series. The soil on EM is Terrarossa (fine, mixed, superactive, thermic Aridic Paleustalfs), and on PC it is Blacktail (fine, mixed, superactive, thermic Calcidic Argiustolls). The PC, EM, Wi, and Ta sites are grasslands dominated by black grama (Bouteloua eriopoda Torr.), plains love grass (Eragrostis intermedia Hitchc.), and cane bluestem (Bothriochloa barbinodis (Lag.) Herter) with inclusion of native forbs. All of the sites experienced recent wildfires: EM, and PC in 2002, Ab in 2003, Ta in 2004, SA in 2005, and Wi in 2006. At all San Rafael Valley sites a set of natural (non-burned) plots were established next to the burn sites as a control. Grasslands were under a US Forest Service grazing management plan during the time of the experiments.
Three experimental sites (Yg1, Yg2, and Yg3) were located 9 km north of Young, Arizona, in Major Land Resource Area (MLRA) 38 (Mogollon Transition Area) on Clay Loam Upland (R038XC303AZ) (USDA, 2006). The average annual precipitation in the area is 580 mm and the mean annual temperature is 11 ∘C. Snow falls occasionally in winter. The soil is Terrarossa clay loam (fine, mixed, superactive, thermic Aridic Paleustalfs). It is deep and well drained with > 1 % organic matter, has a well-developed argillic horizon and can be easily compacted by livestock when moist. The depth of soil freezing in the winter is 10–15 cm. Yg1 and Yg2 sites are in HCPC state dominated by grama species (Bouteloua sp.) (canopy cover of 40 to 60 %) and cool season grasses. Mean annual production of aboveground biomass is estimated at 1600 kg ha−1, and the effective rooting depth of perennial grasses is 70 cm. The possible state and transition model (STM) transition (with disturbance, invasion, or alteration of fire regimes) is to juniper woodland. Wildfires in the area occur every 10 to 15 years. Yg3 was in alligator juniper woodland state. Juniper was mechanically removed at the site a year prior to the 2012 rainfall simulation.
Two sites (PCE, PCW) were located in Nevada, 100 km east of Fallon in MLRA 28B (central Nevada Basin and Range) on Loamy Slopes (028BY113NV). The climate associated with this site is semiarid, characterized by cold, moist winters and warm, dry summers with large temperature variations. The driest period is from midsummer to mid-autumn. Average annual precipitation is 400 mm. Mean annual air temperature is 6 ∘C, and the freeze-free period averages 125 days. The soil at the site is the Tierney series (loamy-skeletal, mixed, superactive, frigid Cumulic Haploxerolls). It is formed in alluvium derived from mixed parent material, is very deep and well drained, and has very low available water capacity. The clay content averages 12 %, and rock fragments are 35 % by volume. The dominant vegetation at the site is bluegrass (Poa annua L.), mountain big sagebrush (Artemisia tridentata Nutt.), needle and thread (Hesperostipa comata (Trin. & Rupr.) Barkworth), rubber rabbitbrush (Ericameria nauseosa (Pall. ex Pursh) G. L. Nesom & Baird), sedge (Cyperaceae spp.), and western wheatgrass (Pascopyrum smithii (Rydb.) Á. Löve). The fire return interval varies from 15 to 25 years. Plants are readily killed in all seasons, even by light severity fires. Overgrazing and the decline in ecological conditions leads to an increase in big sagebrush and a decline in understory plants.
3.1 Water application
Rainfall was generated by a WGRS, a portable, computer-controlled, variable-intensity simulator (Paige et al., 2004). The WGRS can deliver rainfall rates ranging between 13 and 178 mm h−1 with a variability coefficient of 11 % across a 2 m by 6.1 m area. The estimated kinetic energy of simulated rainfall was 204 kJ ha−1 mm−1, and the drop size ranged from 0.288 to 7.2 mm. The simulator is equipped with a single oscillating boom with four V-jet nozzles with an overlapping spray pattern and a 50∘ sweep. The operating height of the nozzles is 2.4 m above ground at 55 kPa water pressure. The oscillations are controlled by a high-torque stepper motor that varies the speed of the nozzles, slower at the ends of the oscillation and faster in the middle when the nozzles are pointed directly down. This approach improves the uniformity of the water application across the plot. The spray time and sequence are controlled by three-way solenoids. A PC and a controller are used to set up various rainfall programs. A detailed description and the design of the simulator are available in Paige et al. (2004). Prior to each field season the simulator was calibrated over a range of intensities using a set of 56 rain gages arranged on the plot in a rectangular grid. During the experiments windbreaks were placed around the simulator to minimize the effect of wind on rain distribution. The general view of the simulator with windbreaks, runoff flume, and control equipment is shown in Fig. 1.
During 93 simulations run-on flow was applied at the top edge of the plot using a perforated pipe placed horizontally over a narrow strip of cloth directly on the soil surface. This arrangement ensured uniform initial sheet flow and prevented localized scour. The purpose of run-on water application was to simulate hydrological processes that occur on longer slopes (> 6 m) where the upper portion of the slope contributes runoff onto the lower portion. In a limited number of experiments, the run-on flow rate was unknown. In these cases it was labeled as “rate1”, “rate2”, etc., in the data file.
3.2 Runoff
The runoff rate from the plot was measured using a V-shaped supercritical flume positioned at a 4 % slope and equipped with an electronic depth gage. Flow depth was recorded manually and converted to flow rate using the following depth-to-discharge relationship:
where Q is discharge (L s−1), h is the flow depth in the flume (mm), and a and b are calibration coefficients. The flume was calibrated before every field season.

3.3 Flow velocity
Overland flow velocities on the plots were measured using an electrolyte and fluorescent dye solution starting in 2006. Two liters of the solution were uniformly applied on the surface using a perforated PVC pipe placed across the plot 3.3 m from the outlet. Dye moving from the application point to the outlet was timed with a stopwatch. Electrolyte transport in the flow was measured by resistivity sensors imbedded in the edge of the outlet flume at the end of the plot. The data were collected at 0.37 s intervals with real-time graphical output using LoggerNet software and CR10X data logger by Campbell Scientific. The maximum flow velocity (Vm, m s−1) was defined as the velocity of the leading edge of the solution and was determined from dye front. Mean flow velocity (Va, m s−1) was calculated using mean travel time obtained from the salt concentration breakthrough curve (Fig. 2) and the following equation:
where ts is curve start time (s), te is curve end time or return to baseline (s), ti is instantaneous time (s), and ci is normalized conductivity.
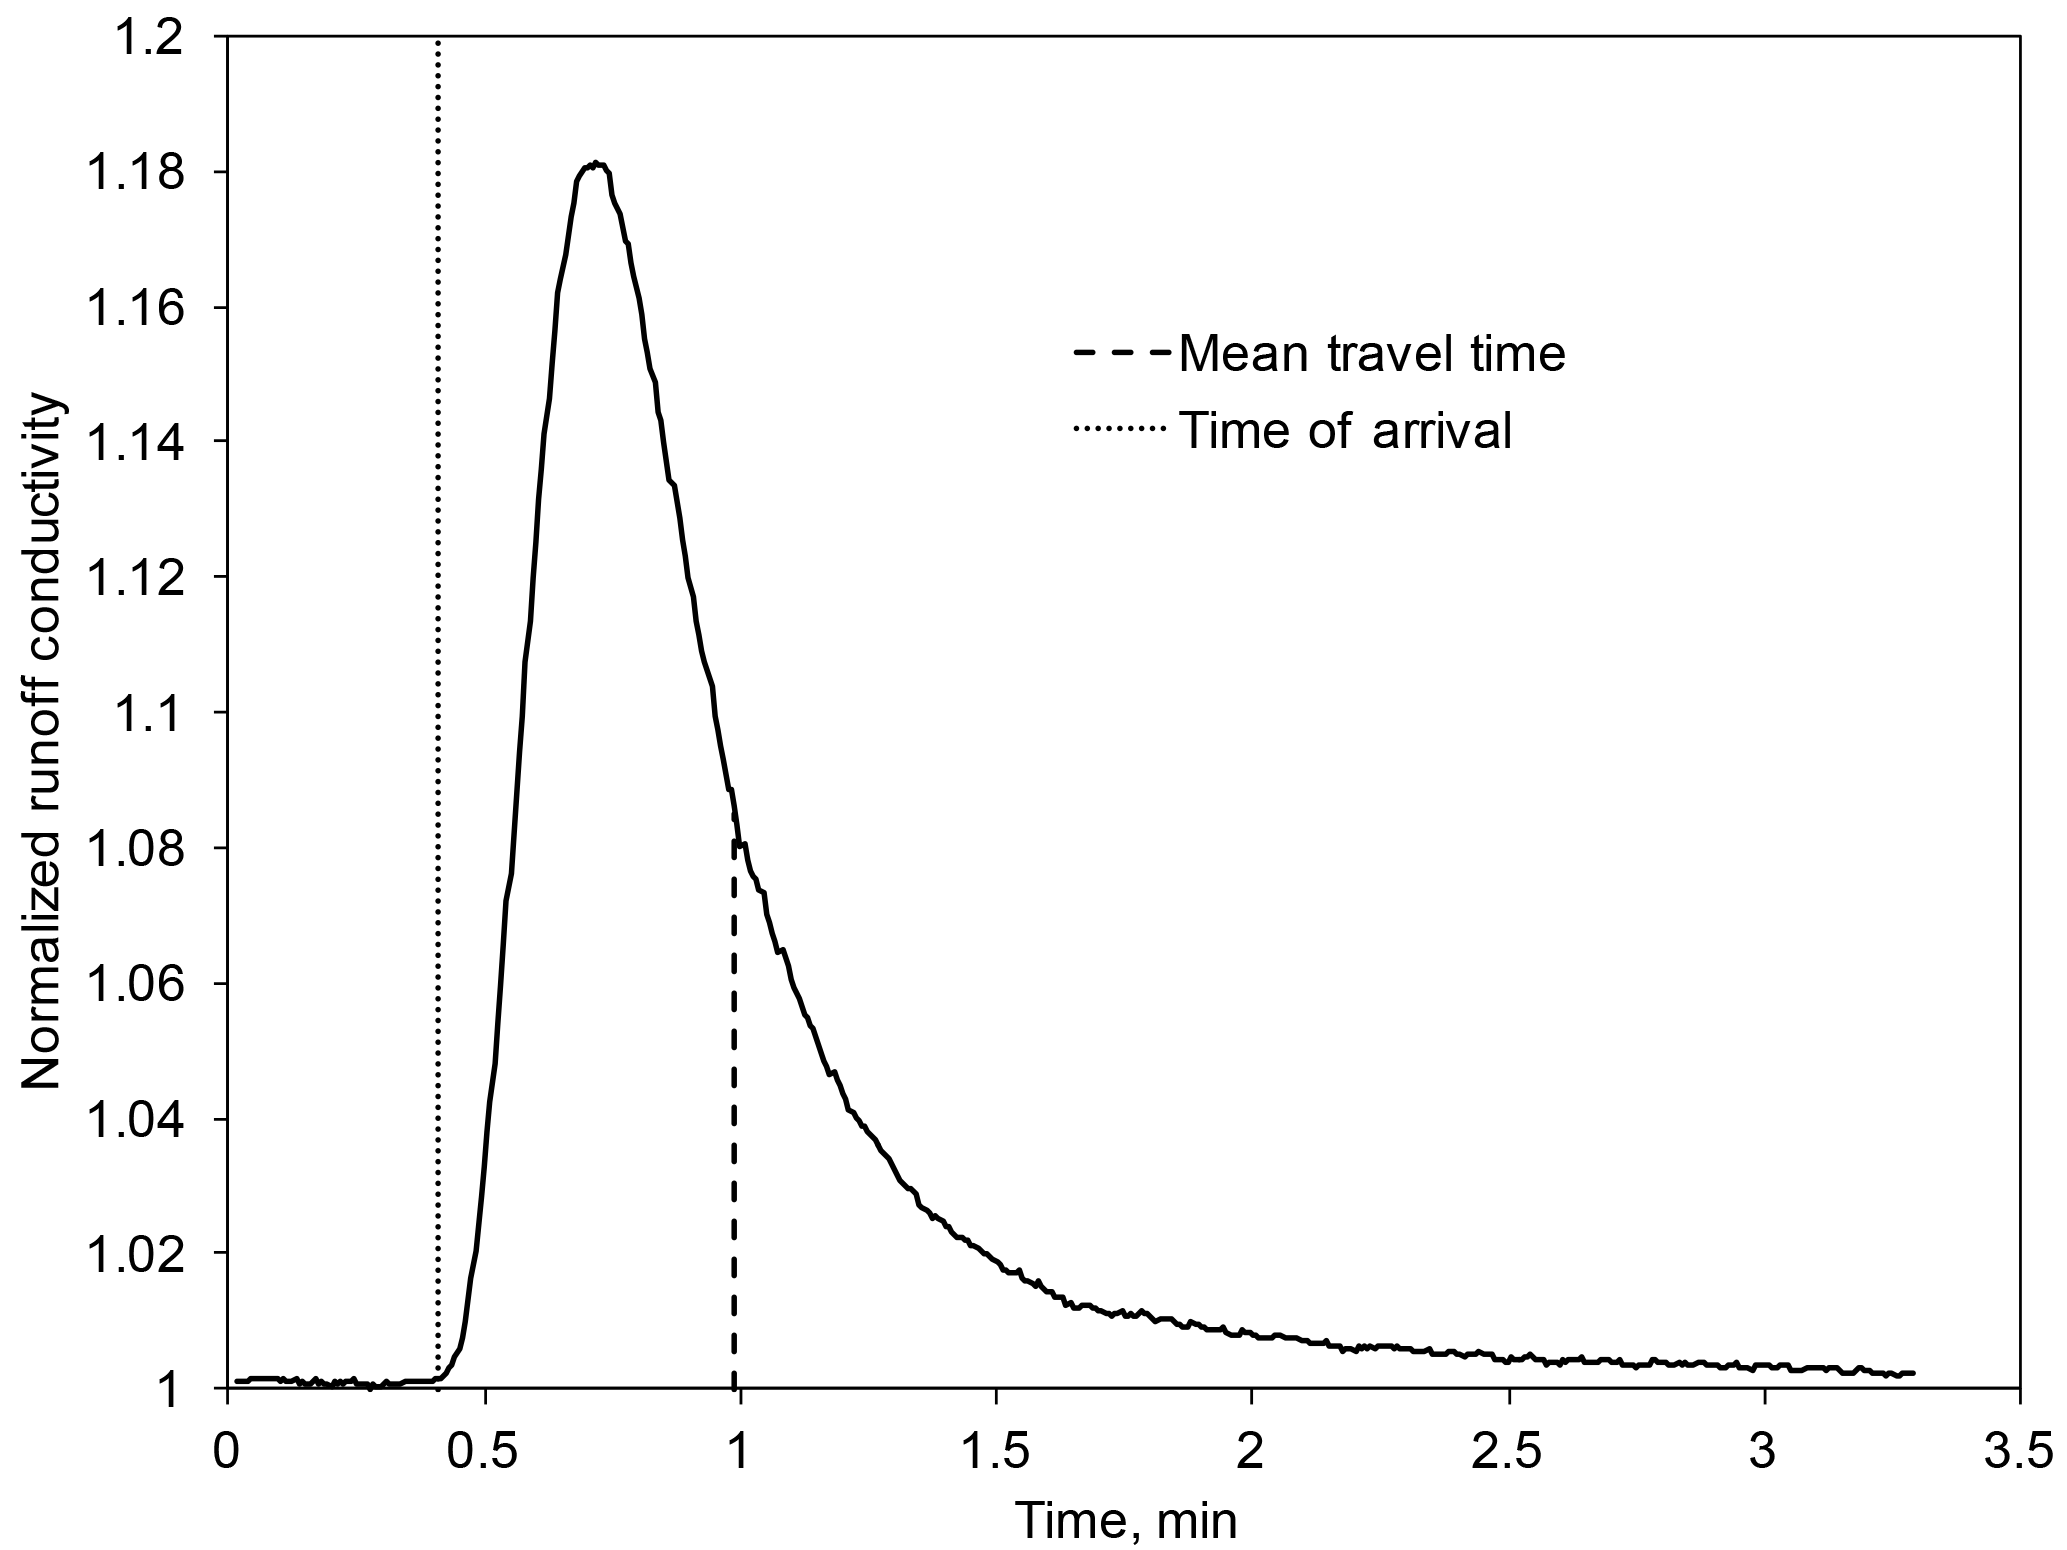
Figure 2Breakthrough curve of electrolyte solution in runoff at 150 mm h−1 rainfall intensity.
3.4 Erosion
Sediment concentrations from the plots were determined from 1 L runoff samples collected during each run. Sampling interval time was variable and aimed to represent rising and falling limbs of the hydrograph, any changes in runoff rate, and steady-state conditions (a minimum of 3 samples). This resulted in approximately 30 to 50 samples per simulation. A coagulant solution was added to the samples to flocculate and settle the sediments. After the settling, the excess water was decanted and the sediments were dried at 105 ∘C. Wet and dry samples were weighed, and sediment concentration in the runoff samples was calculated gravimetrically. Soil losses were determined from the combination of sediment concentration and discharge rates.
3.5 Vegetation and surface cover
Shortly before the simulations, plot surface and vegetative cover was measured at 400 points on a 15 cm× 20 cm grid using a laser and line-point intercept procedure (Herrick et al., 2005). Vegetative cover was classified as forbs, grass, and shrub. Surface cover was characterized as rock, litter, plant basal area, and bare soil. These four metrics were further classified as protected (located under plant canopy) and unprotected (not covered by the canopy).
In addition, plant canopy and basal gaps were measured on the plots over three lengthwise and six crosswise transects. These were reported as the sum and the average of all inter-canopy and inter-basal spaces greater than 10 cm along the transects.
Four to eight 6.1 m by 2 m replicated rainfall simulation plots were established at each site (Mayerhofer et al., 2017). The plots were bound by sheet metal borders hammered into the ground on three sides. On the downslope side a collection trough was installed to channel runoff into the measuring flume. If a site was revisited, repeat simulations were always conducted on the same long-term plots. In these cases the lateral borders remained installed in the field, while at the top, the border and runoff flume were removed to avoid obstructing natural runoff during the interim period.
The plots were classified as “burn” or “natural” (labeled as “B” or “N” respectively in Appendix B). The burn plots were established at six sites affected by wildfires that occurred between 2000 and 2006. These plots were in various stages of recovery during the experiments. The natural plots had no recent documented wildfires. With the exception of the Audubon Research Ranch burn plots were paired with natural control plots located in close proximity at the same site. At 53 plots (13 sites) rainfall simulations were repeated up to 5 times in the following years (2002 through 2013) in order to monitor post brush treatment, burn recovery, or ecological site transition.
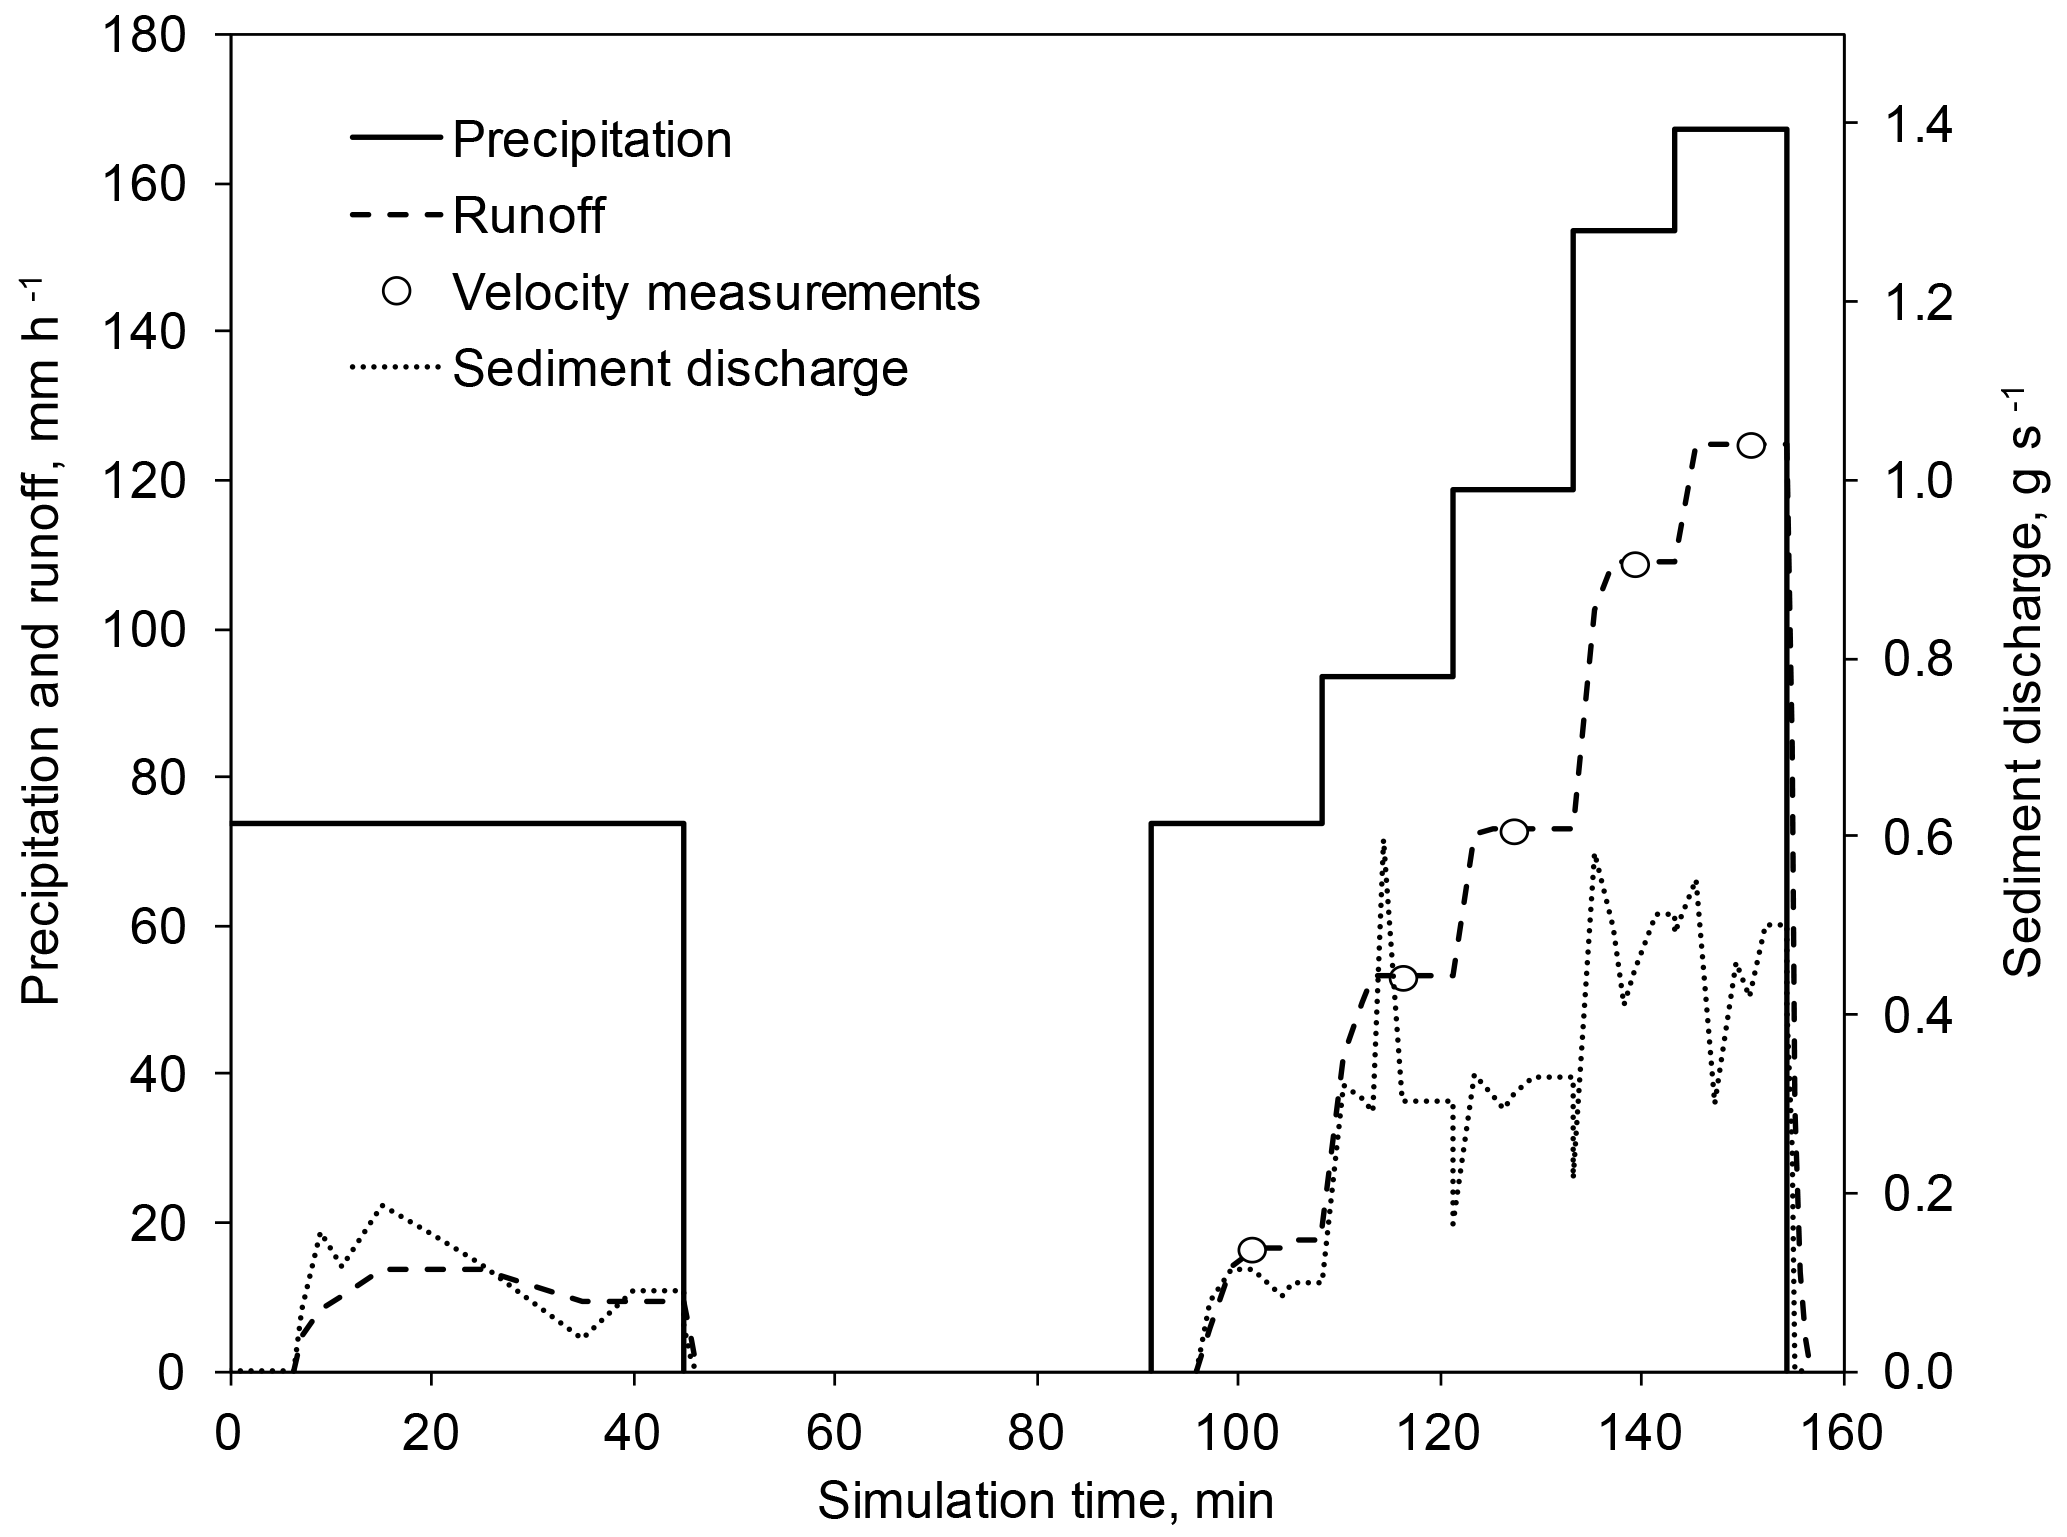
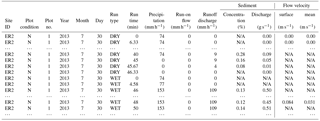
The experimental procedure was as follows. First, the plot was subjected to 45 min long, 65 mm h−1 intensity simulated rainfall (dry run) intended to create initial saturated conditions that could be replicated across all sites. This was followed by a 45 min pause and a second simulation with varying intensity (wet run) (Fig. 3). During wet runs, two modes of water application were used as previously described: rainfall and run-on. Rainfall-only wet runs accounted for 79 % of simulations, while the rest were run-on flow only or a combination of rainfall and run-on flow. Table 2 shows an excerpt from one of 272 simulation data sheets. The first seven columns are site attributes and the rest are time series of data recorded during the run. N/A indicates “not measured” or missing. The run time (min) of each experiment begins at the commencement of water application and ends at the cessation of runoff.
Rainfall wet runs typically consisted of a series of application rates (65, 100, 125, 150, and 180 mm h−1) that were increased after runoff had reached steady state for at least 5 min. Runoff samples were collected on the rising and falling limb of the hydrograph and during each steady state (a minimum of three samples). Overland flow velocities were measured during each steady state as previously described. Run-on wet runs followed the same procedure as rainfall runs, except that water application rates varied between 100 and 300 mm h−1.
In approximately 20 % of simulation experiments, the wet run was followed by another simulation (wet2 run) after a 45 min pause. Wet2 runs were similar to wet runs and also consisted of a series of varying-intensity rainfalls and/or run-on input.
The dataset is available from the National Agricultural Library at website https://data.nal.usda.gov/search/type/dataset (DOI: https://doi.org/10.15482/USDA.ADC/1358583). It includes a short description and the methods, data dictionary, geographic information, hydrological, erosion, vegetation data files, and a set of sites and plot images.
Soil erosion researchers study complex system with a large number of temporally variable inputs, interactions, feedbacks, and stochastic relationships. Many variables are difficult to measure accurately. Hence, it is critical to assemble comprehensive and long-term datasets to enable robust statistical analysis, facilitate comparisons, and detect long-term trends. There is also a need to standardize rainfall simulators and experimental protocols (Kibet et al., 2014) and provide for a better dissemination of collected information among researchers (Parsons and Lascelles, 2000).
This paper presents the results of 272 rainfall simulation experiments on small plots in semiarid rangelands of the southwestern USA. The experiments spanning 12 years were conducted in Arizona and Nevada in four MLRAs (28B, 38-1, 41-1, 41-3) and represented four ecological sites (Clay loam upland, Limy upland, Loamy slope, Loamy upland). These sites are characterized by coarse gravelly soils and annual precipitation of 250 to 500 mm.
The simulations were conducted under a wide range of rainfall intensities (60–180 mm h−1) on plots with a variety of slopes (4–40 %), ground cover (22–99 %), and foliar cover (0–85 %). Many of the locations have been affected by grazing, wildfire, or brush treatment and were in various stages of recovery or ecological transition during the experiments. Repeat multiyear simulations and detailed vegetation and land management records place the results in a broader ecological context, rare for this type of studies.
Runoff and erosion rates on plots were affected by the high heterogeneity and complex spatial structure of rangeland sites. Gravelly soils often develop a surface rock layer with increased roughness resulting in complex hydrological interactions. Hence, variability between replicated plots was greater than typically observed on cultivated fields. The variation in sediment yield during runs was also significant, suggesting that three runoff samples may not be enough to accurately characterize a steady-state sediment yield at a given rainfall rate. In a small number of simulations run-on flow rates were unknown, as previously described. Care must be taken when scaling the results to a hillslope or watershed size. On the plot size areas, surface roughness, vegetation pattern, and sheet-to-rill flow transition are critical factors, while lithology, topography, and channel network need to be considered at a greater spatial magnitude (Kirkby et al., 1996). Transmission losses of sediment and runoff at slope (Parsons et al., 2006) and watershed (Lane et al., 1997) scales have been observed. Although the simulator was shielded from wind while in operation some wind interference should not be discounted.
The scope of this data set combined with state of the art rainfall simulation equipment makes it particularly valuable to advance our understanding of basic erosion and transport processes specific to arid rangelands. Orthogonal photographs of the plots provide the basis for cover structure and connectivity analysis. The data can be used to evaluate and compare management practices and study ecological states, transitions, and thresholds. It can also support erosion model development and validation.
The authors declare that they have no conflict of interest.
The authors wish to express their appreciation to the Southwest Watershed
Research Center staff, particularly John Smith, Howard Larsen, and Aaron
Sobel, whose dedicated efforts in collecting data made this research
possible. The USDA is an Equal Opportunity Employer.
Edited by: David Carlson
Reviewed by: three
anonymous referees
Adams, D. K. and Comrie, A. C.: The North American monsoon, B. Am. Meteorol. Soc., 78, 2197–2213, 1997.
Herrick, J. E., Van Zee, J. W., Havstad, K. M., Burkett, L. M., and Whitford, W. G.: Monitoring manual for grassland, Shrubland and Savanna Ecosystems, in: Quick Start, USDA-ARS Jornal of Experimental Range, The University of Arizona Press, AZ, USA, 2005.
Kibet, L. C., Saporito, L. S., Allen, A. L., May, E. B., Kleinman, P. J. A., Hashem, F. M., and Bryant, R. B.: A Protocol for Conducting Rainfall Simulation to Study Soil Runoff, J. Vis. Exp., 86, e51664, https://doi.org/10.3791/51664, 2014.
Kirkby, M. J., Imeson, A. C., Bergkamp, G., and Cammeraat, L. H.: Scaling up processes and models from the field plot to the watershed and regional areas, J. Soil Water Conserv., 51, 391–396, 1996.
Lane, L. J., Hernandez, M., and Nichols, M.: Processes controlling sediment yield from watersheds as functions of spatial scale, Environ. Model. Softw., 12, 355–369, 1997.
Lascelles, B., Favis-Mortlock, D. T., Parsons, A. J., and Guerra, A. J. T.: Spatial and temporal variation in two rainfall simulators: Implications for spatially explicit rainfall simulation experiments, Earth Surf. Proc. Land., 25, 709–721, 2000.
Mayerhofer, C., Meissl, G., Klebinder, K., Kohl, B., and Markart, G.: Comparison of the results of a small-plot and a large-plot rainfall simulator – Effects of land use and land cover on surface runoff in Alpine catchments, Catena, 156, 184–196, 2017.
Meyer, L. D. and McCune, D. L.: Rainfall simulator for runoff plots, Agr. Eng., 39, 644–648, 1958.
Moran, M. S., Hamerlynck, E. P., Scott, R. L., Emmerich, W. E., and Holifield Collins, C. D.: Soil evaporative response to Lehmann lovegrass (Eragrostis lehmanniana) invasion in a semiarid watershed, in: The Third Interagency Conference on Research in the Watersheds, 8–11 September 2008, Estes Park, CO, 2009.
Nichols, M. H.: Measured sediment yield rates from semiarid rangeland watersheds, Rangel. Ecol. Manag., 59, 55–62, 2006.
Nichols, M. H., Stone, J. J., and Nearing, M. A.: Sediment database, Walnut Gulch Experimental Watershed, Arizona, United States, Water Resour. Res., 44, W05S06, https://doi.org/10.1029/2006WR005682, 2008.
NRCS: Soil Survey of Cochise County, Arizona, Douglas-Tombstone Part, NRCS, Washington, DC, 2003.
Paige, G. B., Stone, J. J., Smith, J. R., and Kennedy, J. R.: The walnut gulch rainfall simulator: A computer-controlled variable intensity rainfall simulator, Appl. Eng. Agric., 20, 25–31, 2004.
Parsons, A. J. and Lascelles, B.: Rainfall simulation in geomorphology, Earth Surf. Process. Land., 25, 679–679, 2000.
Parsons, A. J., Brazier, R. E., Wainwright, J., and Powell, D. M.: Scale relationships in hillslope runoff and erosion, Earth Surf. Process. Land., 31, 1384–1393, 2006.
Polyakov, V. O., Nearing, M. A., Stone, J. J., Hamerlynck, E. P., Nichols, M. H., Collins, C. D. H., and Scott, R. L.: Runoff and erosional responses to a drought-induced shift in a desert grassland community composition, J. Geophys. Res.-Biogeo., 115, G04027, https://doi.org/10.1029/2010JG001386, 2010.
Stavi, I., Lavee, H., Ungar, E. D., and Sarah, P.: Ecogeomorphic Feedbacks in Semiarid Rangelands: A Review, Pedosphere, 19, 217–229, 2009.
Stone, J. J., Nichols, M. H., Goodrich, D. C., and Buono, J.: Long-term runoff database, Walnut Gulch Experimental Watershed, Arizona, United States, Water Resour. Res., 44, W05S05, https://doi.org/10.1029/2006WR005733, 2008.
Swanson, N. P.: Rotating-boom rainfall simulator, T. ASAE, 8, 71–72, 1965.
USDA: Land Resource Regions and Major Land Resource Areas of the US, the Caribbean, and the Pacific Basin, United States Department of Agriculture, Handbook 296, available at: https://www.nrcs.usda.gov/Internet/FSE_DOCUMENTS/nrcs142p2_050898.pdf, 2006.
Yakubu, M. L. and Yusop, Z.: Adaptability of rainfall simulators as a research tool on urban sealed surfaces – a review, J. Sci. Hydrol., 62, 996–1012, 2017.
Yisehak, K., Belay, D., Taye, T., and Janssens, G. P. J.: Impact of soil erosion associated factors on available feed resources for free-ranging cattle at three altitude regions: Measurements and perceptions, J. Arid. Environ., 98, 70–78, 2013.