the Creative Commons Attribution 4.0 License.
the Creative Commons Attribution 4.0 License.
 | 16 Oct 2018
The ISC-GEM Earthquake Catalogue (1904–2014): status after the Extension Project
E. Robert Engdahl
Dmitry A. Storchak
We outline the work done to extend and improve the ISC-GEM Global Instrumental Earthquake Catalogue, a dataset which was first released in 2013 (Storchak et al., 2013, 2015). In its first version (V1) the catalogue included global earthquakes selected according to time-dependent cut-off magnitudes: 7.5 and above between 1900 and 1918 (plus significant continental earthquakes 6.5 and above); 6.25 between 1918 and 1959; 5.5 between 1960 and 2009. Such selection criteria were dictated by time and resource limitations. With the Extension Project we added both pre-1960 events below the original cut-off magnitudes (if enough station data were available to perform relocation and magnitude recomputation) and added events with magnitude 5.5 and above from 2010 to 2014. The project ran over a 4-year period during which a new version of the ISC-GEM Catalogue was released each year via the ISC website (http://http://www.isc.ac.uk/iscgem/, last access: 10 October 2018). For each year, not only have we added new events to the catalogue for a given time range but also revised events already in V1 if additional data became available or location and/or magnitude reassessments were required. Here we recall the general background behind the production of the ISC-GEM Catalogue and describe the features of the different periods in which the catalogue has been extended. Compared to the 2013 release, we eliminated earthquakes during the first 4 years (1900–1903) of the catalogue (due to lack of reliable station data), added approximately 12 000 and 2500 earthquakes before 1960 and between 2010 and 2014, respectively, and improved the solution for approximately 2000 earthquakes already listed in previous versions. We expect the ISC-GEM Catalogue to continue to be one of the most useful datasets for studies of the Earth's global seismicity and an important benchmark for seismic hazard analyses, and, ultimately, an asset for the seismological community as well as other geoscience fields, education and outreach activities. The ISC-GEM Catalogue is freely available at https://doi.org/10.31905/D808B825.
- Article
(5884 KB) - Full-text XML
- BibTeX
- EndNote


Earthquake catalogues are used in many activities by the seismological community. Usually these list basic focal parameters of seismic events (e.g. location, origin time, depth) along with the magnitude, and, eventually, other parameters (e.g. moment tensor or fault plane solutions). Studies concerning seismic hazard and the Earth's global seismicity often require as input an earthquake catalogue that (ideally) has been obtained using the same procedures over a long period of time. For such and other purposes, global instrumental earthquake catalogues have been produced by many authors since the beginning of the last century. Among others, catalogues from Gutenberg and Richter (1954), Båth and Duda (1979), Abe (1981, 1984), Abe and Noguchi (1983a, b) and Pacheco and Sykes (1992) have been extensively used over the past decades until Engdahl and Villaseñor (2002) and Allen et al. (2009) released the Centennial Catalogue and PAGER-CAT, respectively, both covering the period 1900–2007. Although such catalogues proved to be important resources for many years, they cover different time periods and, more importantly, are often characterised by either large heterogeneities in their parameters and/or produced with undocumented or mixed procedures and/or underlying data (e.g. Di Giacomo et al., 2015a). For example, the Centennial Catalogue lists both locations from various catalogues (including the ones mentioned above) and recomputed ones (from 1964 onwards and only for selected large earthquakes between 1918 and 1964) using the Engdahl et al. (1998) methodology (normally referred to as EHB), whereas magnitudes are not recomputed but compiled from several different sources/authors (see Di Giacomo et al., 2015a). Very similar considerations also apply to PAGER-CAT, which is based on the Centennial Catalogue up to 1973 (Allen et al., 2009). In addition, most of these catalogues terminate at different times and are no longer maintained. In this context, in 2010 the International Seismological Centre (ISC, http://www.isc.ac.uk/, last access: 10 October 2018), as requested by the GEM Foundation (https://www.globalquakemodel.org/, last access: 10 October 2018), undertook a major effort to reprocess 100+ years of instrumental seismological data to reassess both locations and magnitudes of global (i.e. having magnitude 5.5 and above in our framework) earthquakes and, consequently, to produce a new earthquake catalogue using homogeneous and documented methodologies over the longest possible period of instrumental seismology (i.e. since the early 20th century). In January 2013, after a 27-month project, the ISC and a team of international experts (http://www.isc.ac.uk/iscgem/people.php, last access: 10 October 2018) released on the ISC website (http://www.isc.ac.uk/iscgem/, last access: 10 October 2018) the first version (V1, for a general description see Storchak et al., 2013, 2015) of the ISC-GEM Global Instrumental Earthquake Catalogue (1900–2009).
Since then the ISC-GEM Catalogue has been used by many researchers investigating seismicity rates, patterns of seismicity and earthquake forecast (e.g. Cambiotti et al., 2016; Geist, 2014; Ikuta et al., 2015; Kagan, 2017; Kagan and Jackson, 2016; Katsumata, 2015; Pollitz et al., 2014; Quinteros Cartaya et al., 2016; Roth et al., 2017; Zaliapin and Kreemer, 2017; Zechar et al., 2016; Zhan and Shearer, 2015) as well as by groups working on earthquake catalogues for seismic hazard purposes (e.g. Alvarez et al., 2016; Deif et al., 2017; Ghasemi et al., 2016; Kadirioğlu et al., 2016; Markušić et al., 2015; Mikhailova et al., 2015; Poggi et al., 2017; Weatherill et al., 2016) and other seismological studies (e.g. Lange et al., 2017; Leonard, 2014; Metzger et al., 2017; Ye et al., 2016).
In recognition of the value of such a homogeneous (to the largest extent possible) instrumental catalogue, funding from public and commercial organisations (http://www.isc.ac.uk/iscgem/sponsors.php, last access: 10 October 2018) has been given to the ISC since November 2013 to work on the extension of the ISC-GEM Catalogue over a 4-year project which aimed, in a nutshell, at adding as many earthquakes as possible before 1960 and prolonging the catalogue beyond 2009. The Extension Project was also motivated by the fact that damaging pre-1960 earthquakes were below the cut-off magnitude of 6.25 (e.g. the 30 October 1930 central Italy event, which caused collapse and severe damage in various towns) and many pre-1960 events had no initial magnitude and therefore could not be selected for V1, yet they could be large enough to be part of the ISC-GEM Catalogue.
Below we detail the work done during the 4 years of the Extension Project (which ended in December 2017) and discuss features of the different time periods extended. Then we outline the overall state of the ISC-GEM Catalogue in its latest version (V5) and, finally, present the outlook for its further advancement.
The Extension Project of the ISC-GEM Catalogue has been designed to add earthquakes smaller than magnitude 6.25 before 1960 and extend it beyond 2009 with events of magnitude 5.5 and above. In addition, many earthquakes pre-1960 with no magnitude information needed to be processed to reassess location and magnitude, if enough station data were available. Figure 1 summarises the annual number of events before 1960 included in V1 of the ISC-GEM Catalogue along with the pre-1960 events available in the International Seismological Summary (ISS, 1918–1963; see also Villaseñor and Engdahl, 2005), BAAS (1913–1917) and the Centennial Catalogue plus additional hypocentres (hereafter we refer to it as the augmented Centennial Catalogue) that were not processed for the V1 release (see also Fig. 8 in Storchak et al., 2015). Note that ISS and BAAS earthquakes are also listed in the Centennial Catalogue but throughout the paper we try to refer to the original sources as much as possible. For simplicity, in the following we refer to earthquakes in grey in Fig. 1 as extension events (i.e. not listed in V1), meaning that those are the events we digitised station data for but not necessarily all will be selected for processing and then included in the ISC-GEM Catalogue. The station data collection and the selection process will be discussed in the following sections.
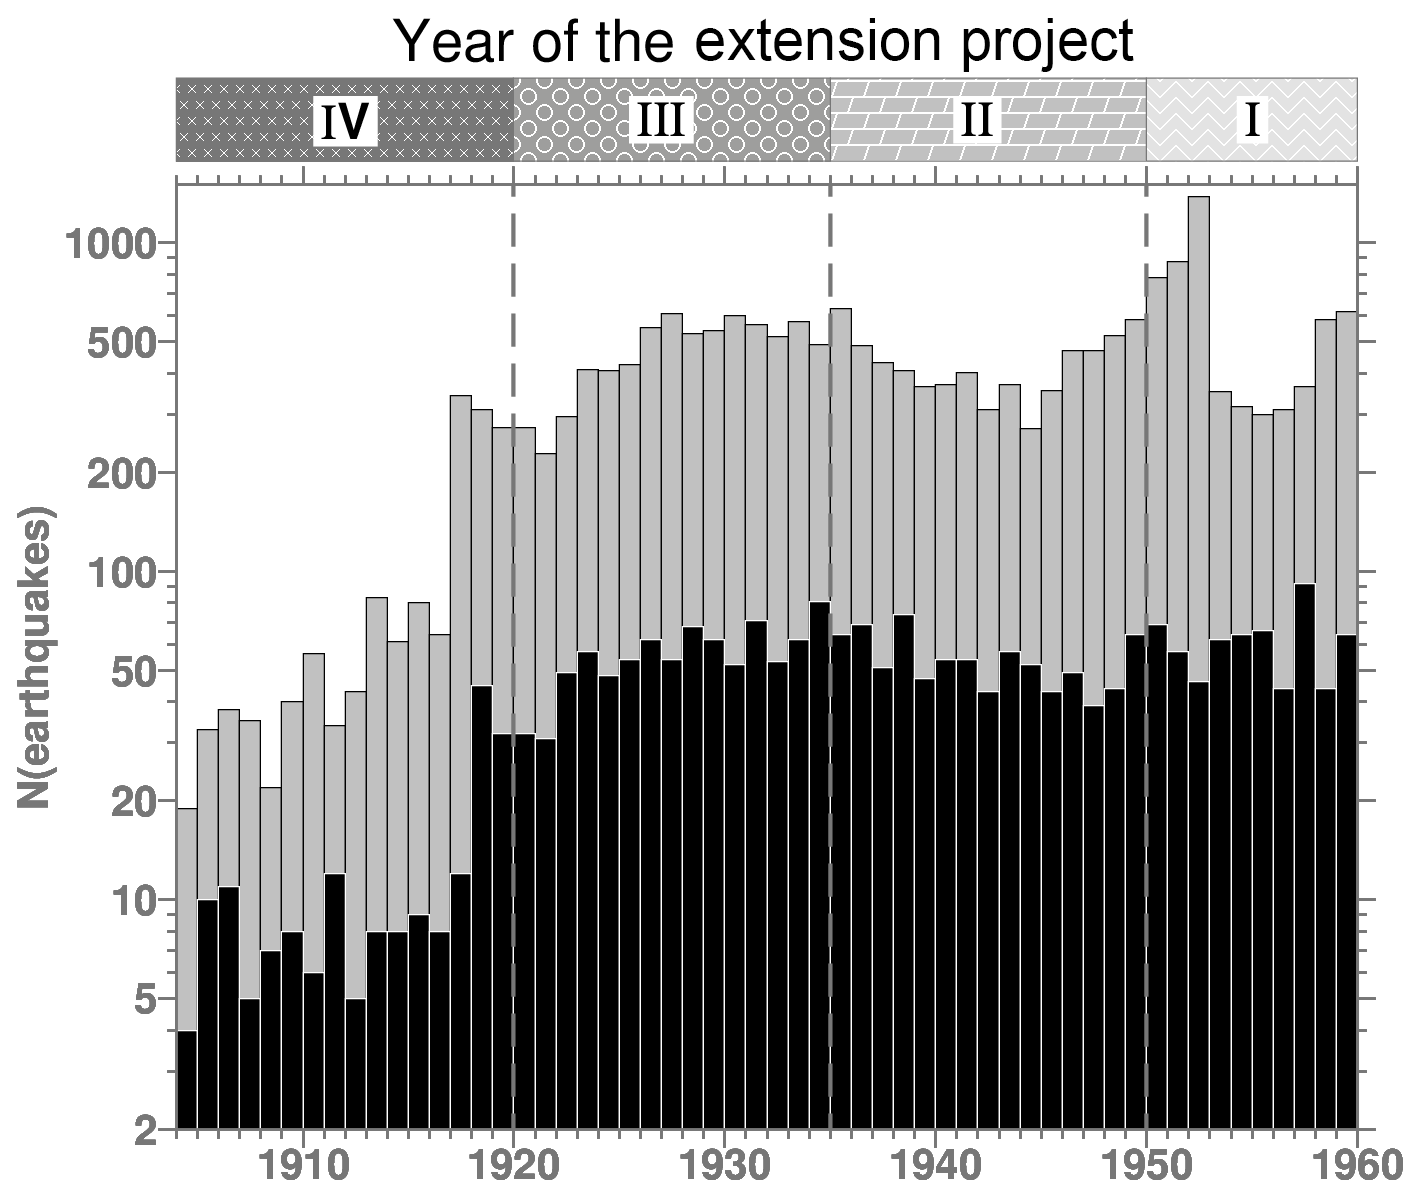
Figure 1Annual number of pre-1960 earthquakes in V1 of the ISC-GEM Catalogue (black, total =2439 events) and the events that are available in the ISS between 1918 and 1959 and the augmented Centennial Catalogue/BAAS between 1904 and 1917 (grey, total of 20 865 events) that were not processed for V1 (in the text referred to as extension events). The hachure patterns on top outline the period extended in each year of the Extension Project: 1950–1959, 1935–1949, 1920–1934 and 1904–1919 in Year I, II, III and IV, respectively. The period 2010–2014, not shown here, has also been progressively added during the Extension Project.
The annual number of events in V1 oscillates between 4 and 12 for 1904–1917, 31 and 92 for 1918–1959 and 235 and 489 for 1960–2009. Such variations reflect the cut-off magnitudes adopted for selecting earthquakes in different time periods: 7.5 and above before 1918 (plus significant continental earthquakes 6.5 and above); 6.25 between 1918 and 1959; 5.5 from 1960 onwards (see Di Giacomo et al., 2015b, for more details on the V1 earthquake selection criteria). It is worth remembering here that the cut-off magnitudes are simply thresholds set for selection purposes (not all pre-1960 events have known or reliable magnitudes) and should not be interpreted as completeness levels (variations of the completeness over different time periods for V1 were briefly outlined by Di Giacomo et al., 2015a, and investigated in more detail by Michael, 2014).
Considering the number of pre-1960 earthquakes available (nearly 21 000, i.e. about 2000 more than the V1 release covering 1900–2009) in the ISS (1918–1959), BAAS (1913–1917) and augmented Centennial Catalogue for which we had to look for station data (and, consequentially, digitise), we planned to extend the catalogue following a 4-year schedule as outlined in Fig. 1. Such a time frame was necessary to allow us to be as comprehensive as possible in the station data collection task and also to assess the ∼60 % of extension events that had no initial magnitude information (in our database), and, therefore, could not have been selected just using any cut-off magnitude criteria (details in the next section). In addition, the extension of the catalogue beyond 2009 would benefit from the data concurrently released in the ISC Bulletin and would follow the original selection criteria (i.e. earthquakes with magnitude 5.5 and above).
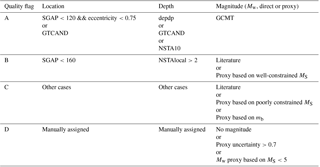
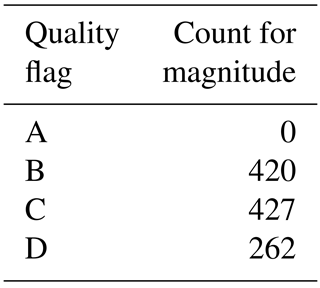
At the end of each project year an upgraded version of the catalogue was made available for download at http://www.isc.ac.uk/iscgem/ (last access: 10 October 2018). The catalogue is distributed in CSV format and is composed of two parts (the Main catalogue, also available as a KMZ file for use with Google Earth, and the Supplementary catalogue, the latter including events with either poor location and/or magnitude quality; see Storchak et al., 2015). Location parameters and magnitudes (either direct or proxy moment magnitude Mw; Di Giacomo et al., 2015a) come with formal uncertainties and quality flags (from A to D, denoting well and poorly constrained parameters, respectively), followed, if available, by the solution of the Global Centroid Moment Tensor (GCMT; http://www.globalcmt.org, last access: 10 October 2018, Dziewonski et al., 1981; Ekström et al., 2012). The criteria to assign the quality flags for location, depth and magnitude are summarised in Table 1. For the location quality flag we consider the secondary azimuthal gap (largest azimuthal gap filled by a single station; Bondár et al., 2004, hereafter referred to as SGAP), the eccentricity of the error ellipses (Bondár and Storchak, 2011) and the event location accuracy if it is of high confidence to become a candidate for the IASPEI Reference Event List (GTCAND in Table 1; see Bondár and McLaughlin, 2009, and http://www.isc.ac.uk/gtevents, last access: 10 October 2018). For the depth quality flag we consider the availability of very close stations (within 10 km, NSTA10) and in the local distance range (within 150 km, NSTAlocal), the depth constrained by depth-phases (if available, depdp in Table 1) and the location accuracy (GTCAND). For the magnitude quality flag we consider the author (GCMT or literature; Lee and Engdahl, 2015) for direct Mw values, whereas for the Mw proxy based on our recomputed MS or mb (Di Giacomo et al., 2015a), the quality flag depends on combinations of the magnitude value, type (MS or mb), uncertainty, number of stations used and the uncertainty of Mw proxy.
Table 1Criteria to assign the location quality flags for location, depth and magnitude. SGAP is the secondary azimuthal gap, GTCAND denotes a high confidence location accuracy that makes the event a candidate for the IASPEI Reference Event List (Bondár and McLaughlin, 2009; see also http://www.isc.ac.uk/gtevents, last access: 10 October 2018), depdp is the depth constrained by depth phases (if available), NSTA10 is the number of stations within 10 km and NSTA (local) is the number of stations within 150 km (Bondár and Storchak, 2011). MS is considered well constrained when it is obtained from more than four stations, within 5.5–7.5, and has uncertainty ≤0.2. See text for details.
One of the key features of the ISC-GEM Catalogue is that all events since 1904 have been reprocessed using instrumental station parametric data and the ak135 model (Kennett et al., 1995). To extend the catalogue, we followed the same steps and methodologies used to create V1, as described in the following.
-
Di Giacomo et al. (2015b, and references therein) was followed for digitising from printed bulletins body-wave arrival times and amplitudes/periods (of surface waves in particular) for the pre-1960 events to allow relocations and magnitude recomputation, respectively. For the extension events, the most important source of body-wave arrival times was the ISS, whereas amplitudes and periods were retrieved from individual station or network printed bulletins.
-
Bondár et al. (2015) describe the two-tier relocation approach, which benefits both from the EHB location algorithm (Engdahl et al., 1998) and the new ISC locator (Bondár and Storchak, 2011) used to constrain the depth and the epicentre, respectively. As the EHB and ISC location algorithms are also used to cross-check each other, the location consistency is checked twice.
-
Di Giacomo et al. (2015a) describe the magnitude recomputation, particularly for the surface wave magnitude MS, which, in turn, is used as the basis for Mw conversion for most of the events pre-1960.
-
Lee and Engdahl (2015) are referred to for the literature search of reliable and direct computations of seismic moment M0 and, therefore, of Mw, for events before the GCMT solutions start in 1976.
The data collection has been the most time-consuming task and indispensable part, not only to extend the catalogue but also to revise and better constrain solutions of events already in V1 (details in the next sections). Indeed, compared to the data collected for the V1 release, we made a significant improvement in the number of amplitude and period data digitised, particularly for MS recomputation, thanks both to additional bulletins donated (or lent) to the ISC from various institutions and individuals (including the personal collection of Nicholas Ambraseys; more details are available at http://www.isc.ac.uk/iscgem/acknowledge.php) and station bulletins that were not processed for V1 due to time and resource limitations. Later we also show how the additional data gathered during the last 4 years helped us revise and better constrain the MS of pre-1960 earthquakes already listed in V1. With the end of the Extension Project in December 2017, in the following we outline the improvements and features of different time periods during which the ISC-GEM Catalogue has been extended.
In this section we describe the work done in the first 3 years of the Extension Project to add earthquakes in the predigital period between 1920 and 1959. Note that throughout this work we consider as predigital earthquakes those that occurred before 1964 (i.e. before the beginning of the ISC Bulletin).
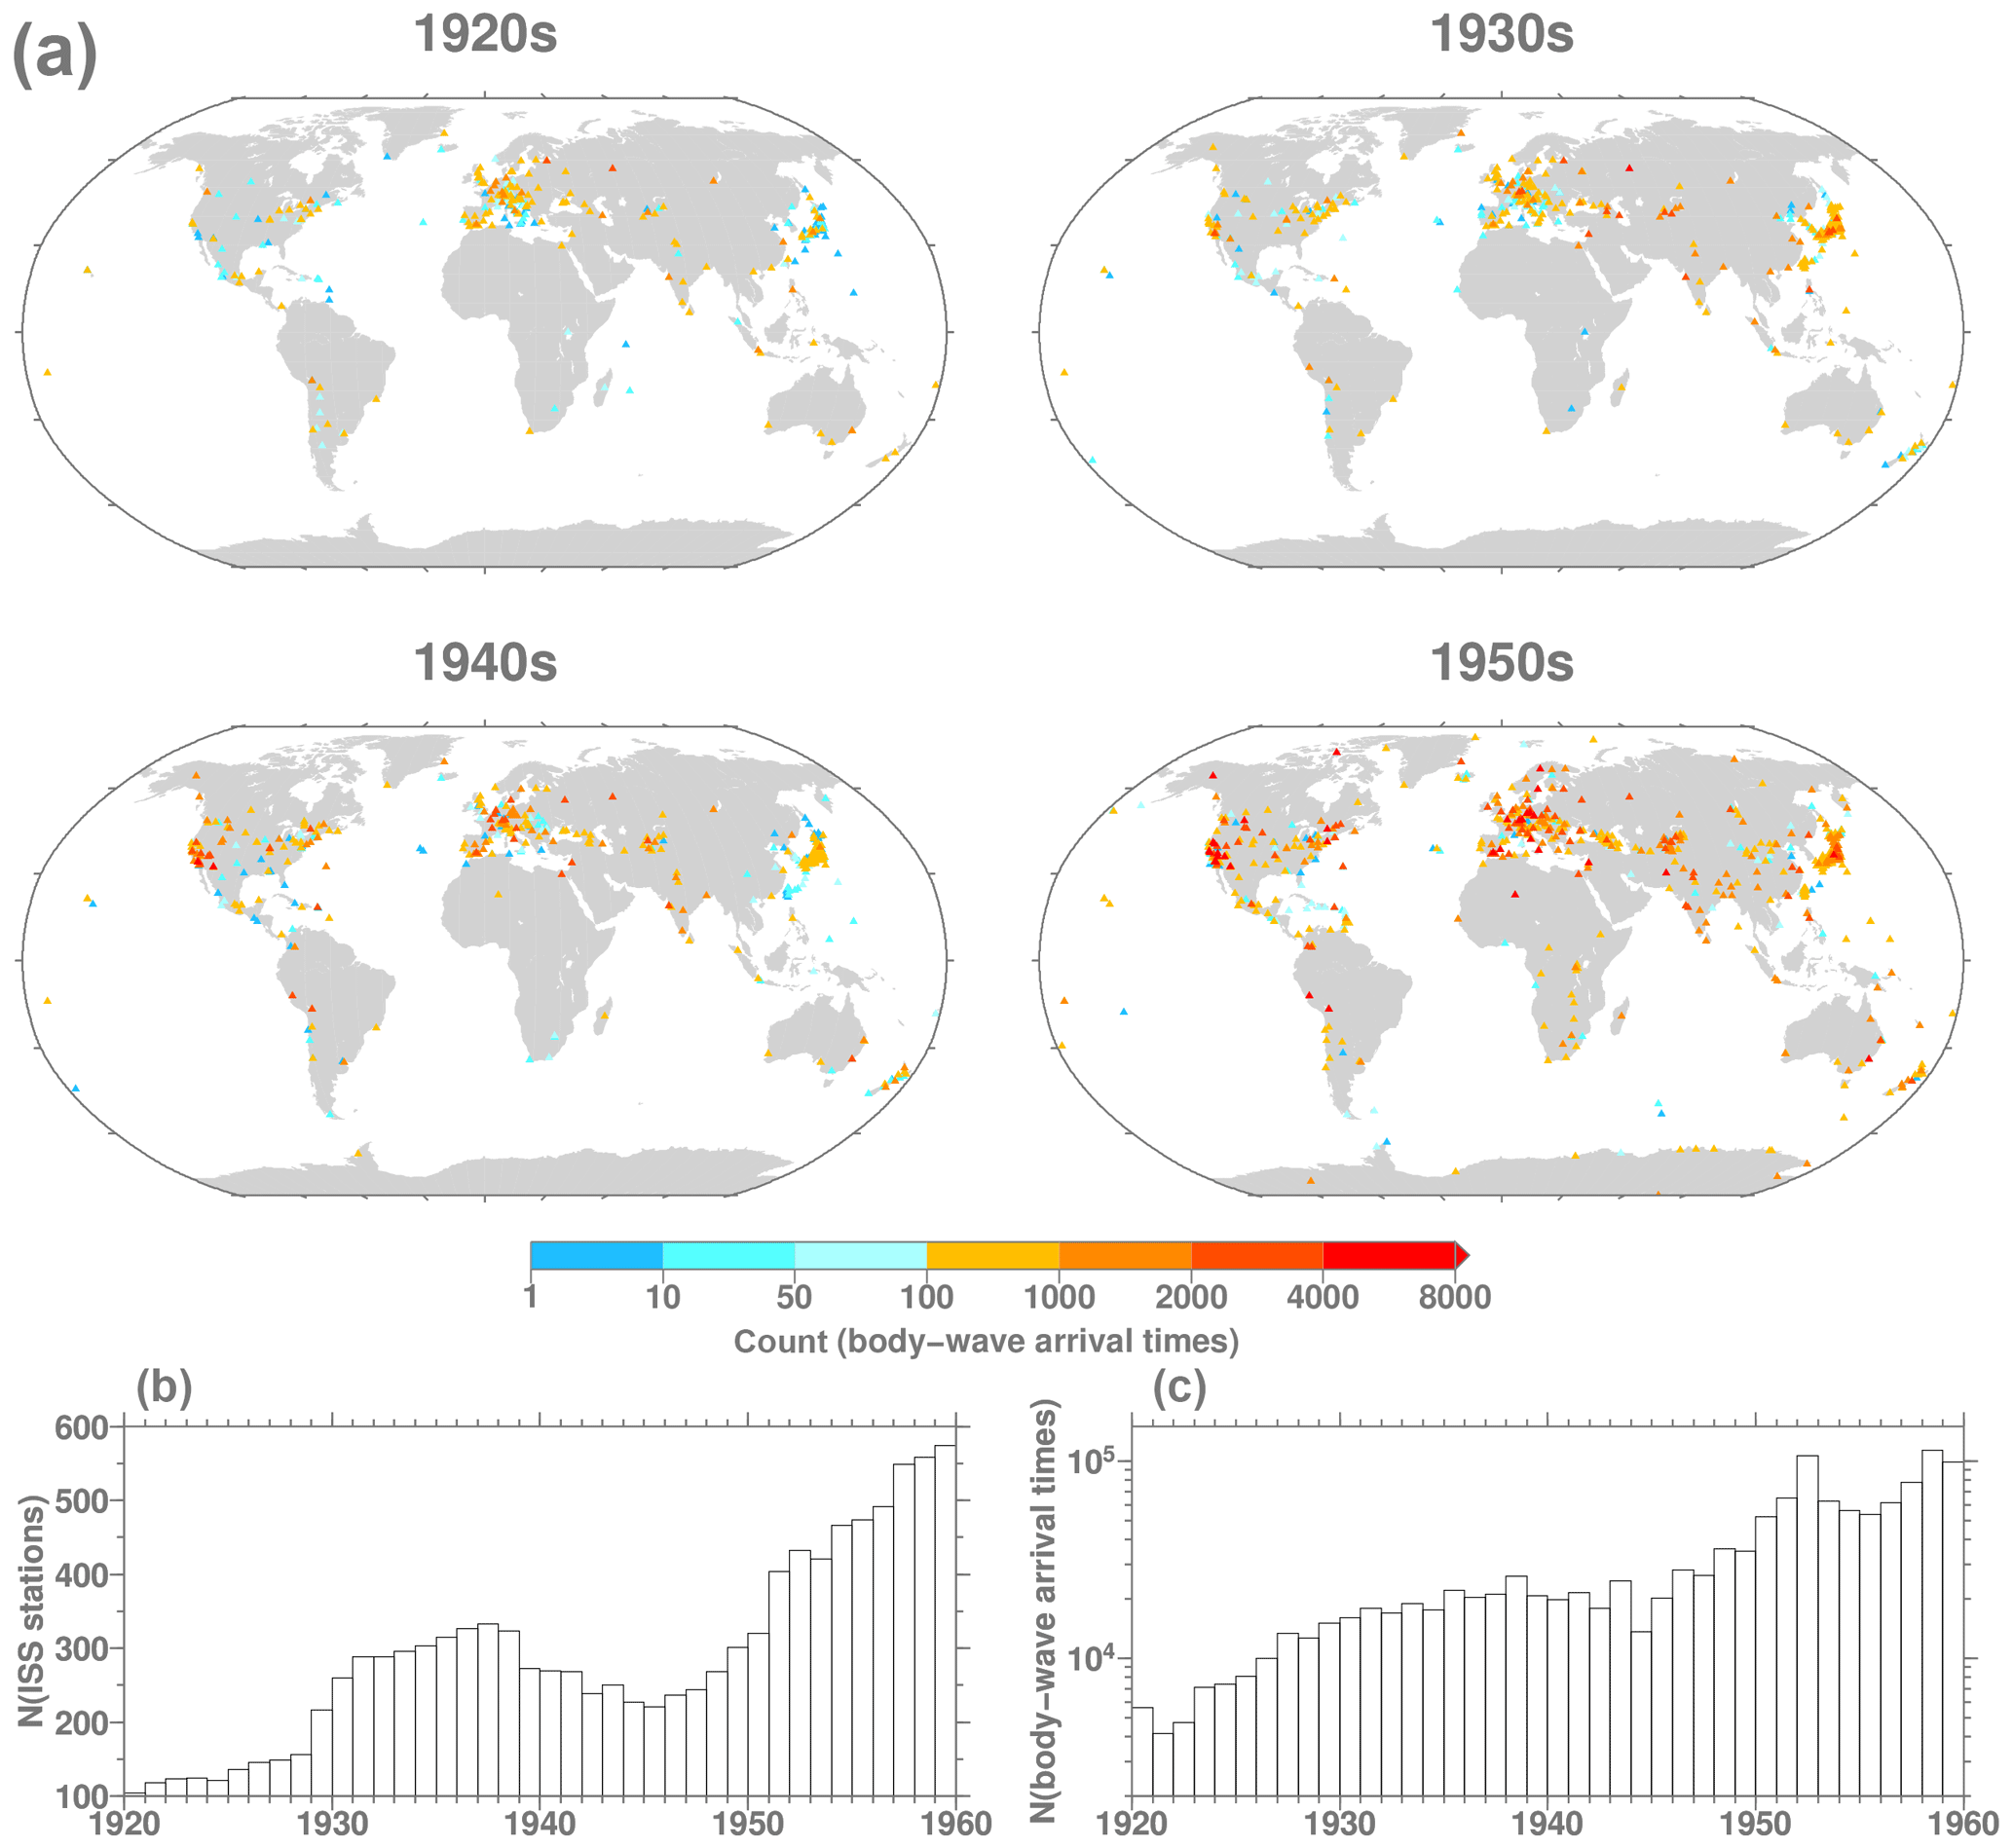
Figure 2Distribution of stations listed in the ISS in each decade contributing body-wave arrival times to the extension events and colour-coded by number of body-wave arrival times. The annual number of stations (b) and body-wave arrival times (c) are also summarised.
3.1 Station data collection and earthquake selection
The variations in the annual number of the extension events shown in Fig. 1 are the result of various factors. For example, a significant increase in the annual number of events can be seen in 1918 coinciding with the beginning of the ISS, whereas a dip in the late 1930s to mid-1940s is associated with the disruption caused by World War II (more details later) and another dip in the mid-1950s is due to the censoring introduced by ISS procedures (more details on page 3 of the ISS, 1953) to reduce the workload. The annual variations in the number of the extension events also introduce an issue in selecting earthquakes for the ISC-GEM Catalogue. For example, between 1950 and 1952 the annual number of extension events in the ISS is between 782 and 1384, and such numbers are above the annual number of earthquakes of magnitude 5.5 and above in the ISC-GEM Catalogue in recent years (e.g. the largest annual number of earthquakes is 654 for 2011). This means that a subset of the extension events in 1950–1952 should not be part of the ISC-GEM Catalogue as it falls below the cut-off magnitude of 5.5. However, since, as mentioned earlier, about 60 % of such events have no magnitude information in our database, we could not use the original magnitude criteria of 5.5. Thus, for the extension events we decided to base our selection criteria both on the distribution of stations in the ISS and the number of stations contributing amplitudes/periods for magnitude recomputation. This required a major effort to digitise both all ISS pages (not available in any electronic format) and amplitude and period pairs (of surface waves, in particular) from the station/network printed bulletins (Di Giacomo et al., 2015b) for all extension events. Here we briefly summarise the station data collected for the extension events and highlight some features that are relevant to the ISC-GEM Catalogue.
Figure 2 shows the distribution of stations listed in the ISS for each decade (1920s, 1930s, 1940s, 1950s) colour-coded by their body-wave arrivals contribution to the extension events along with the annual number of stations and body-wave arrivals digitised from the ISS. The number of stations listed in the ISS generally increased from the 1920s to the late 1930s before World War II affected various seismic stations, and it is only around 1953 that the station contribution improved significantly. The box-and-whisker plot of Fig. 3 summarises the median number of stations per event in each year. It shows that only a limited number of stations (median number ranging from 9 to 26) are usually associated with the extension events until 1952, whereas from 1953 onwards there is a general improvement in this respect (median number of stations ranging from 66 to 99). Another relevant feature to point out is the uneven station distribution, with Europe showing the highest density particularly before the 1950s, and the lack of stations in Africa and vast parts of the Southern Hemisphere.
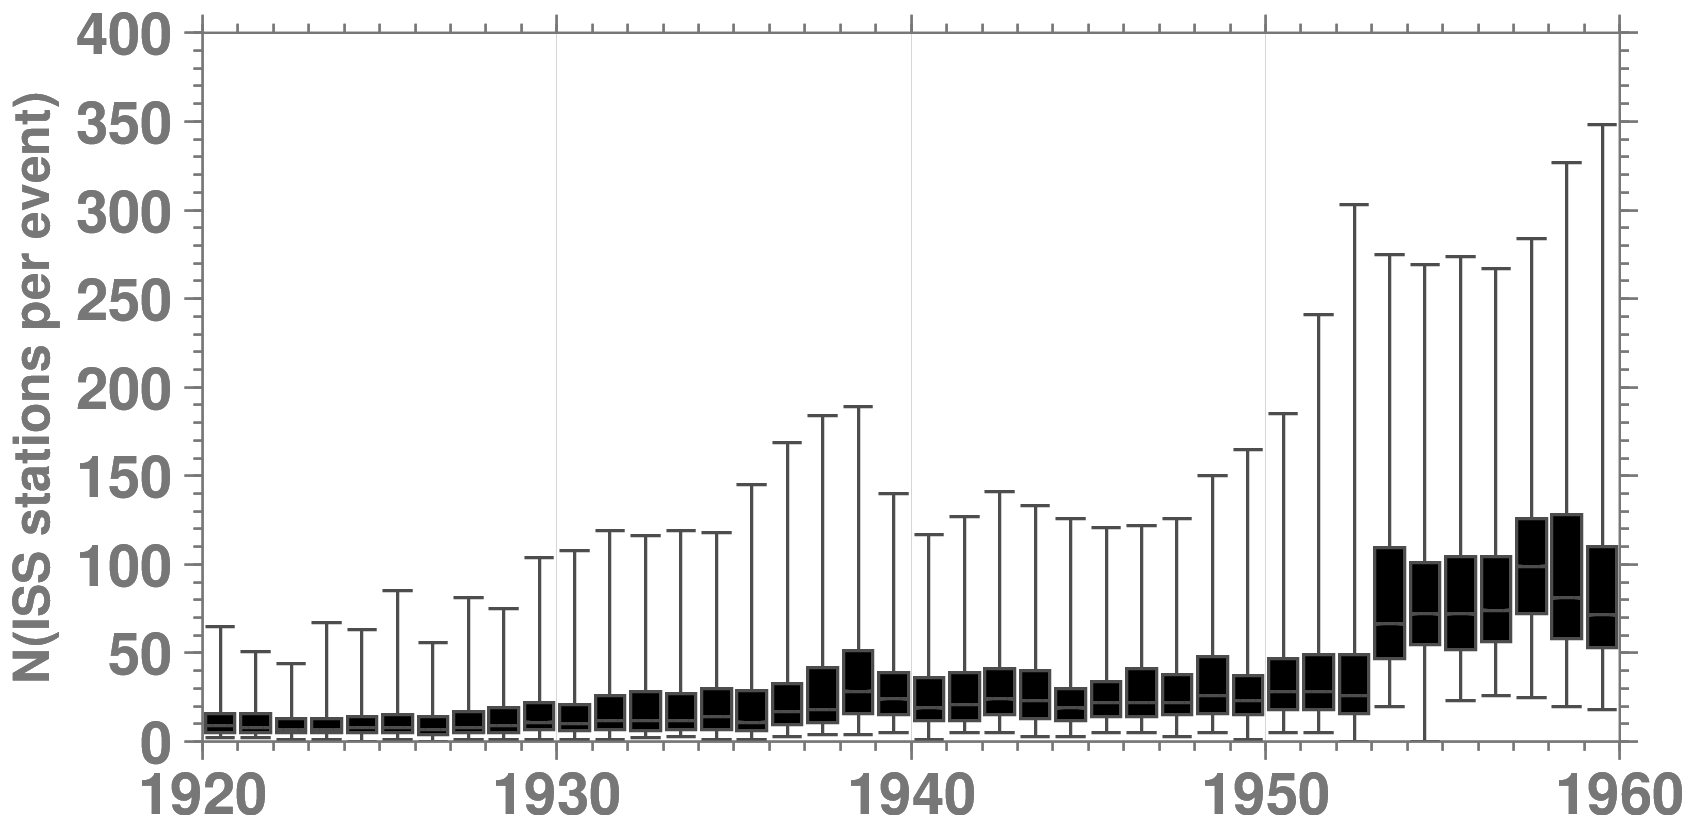
Figure 3Box-and-whisker plot for the extension events of the median number of ISS stations per event in each year. The box represents the 25 %–75 % quantile, the band inside the box represents the median and the ends of the whiskers represent the minimum and maximum of all data.
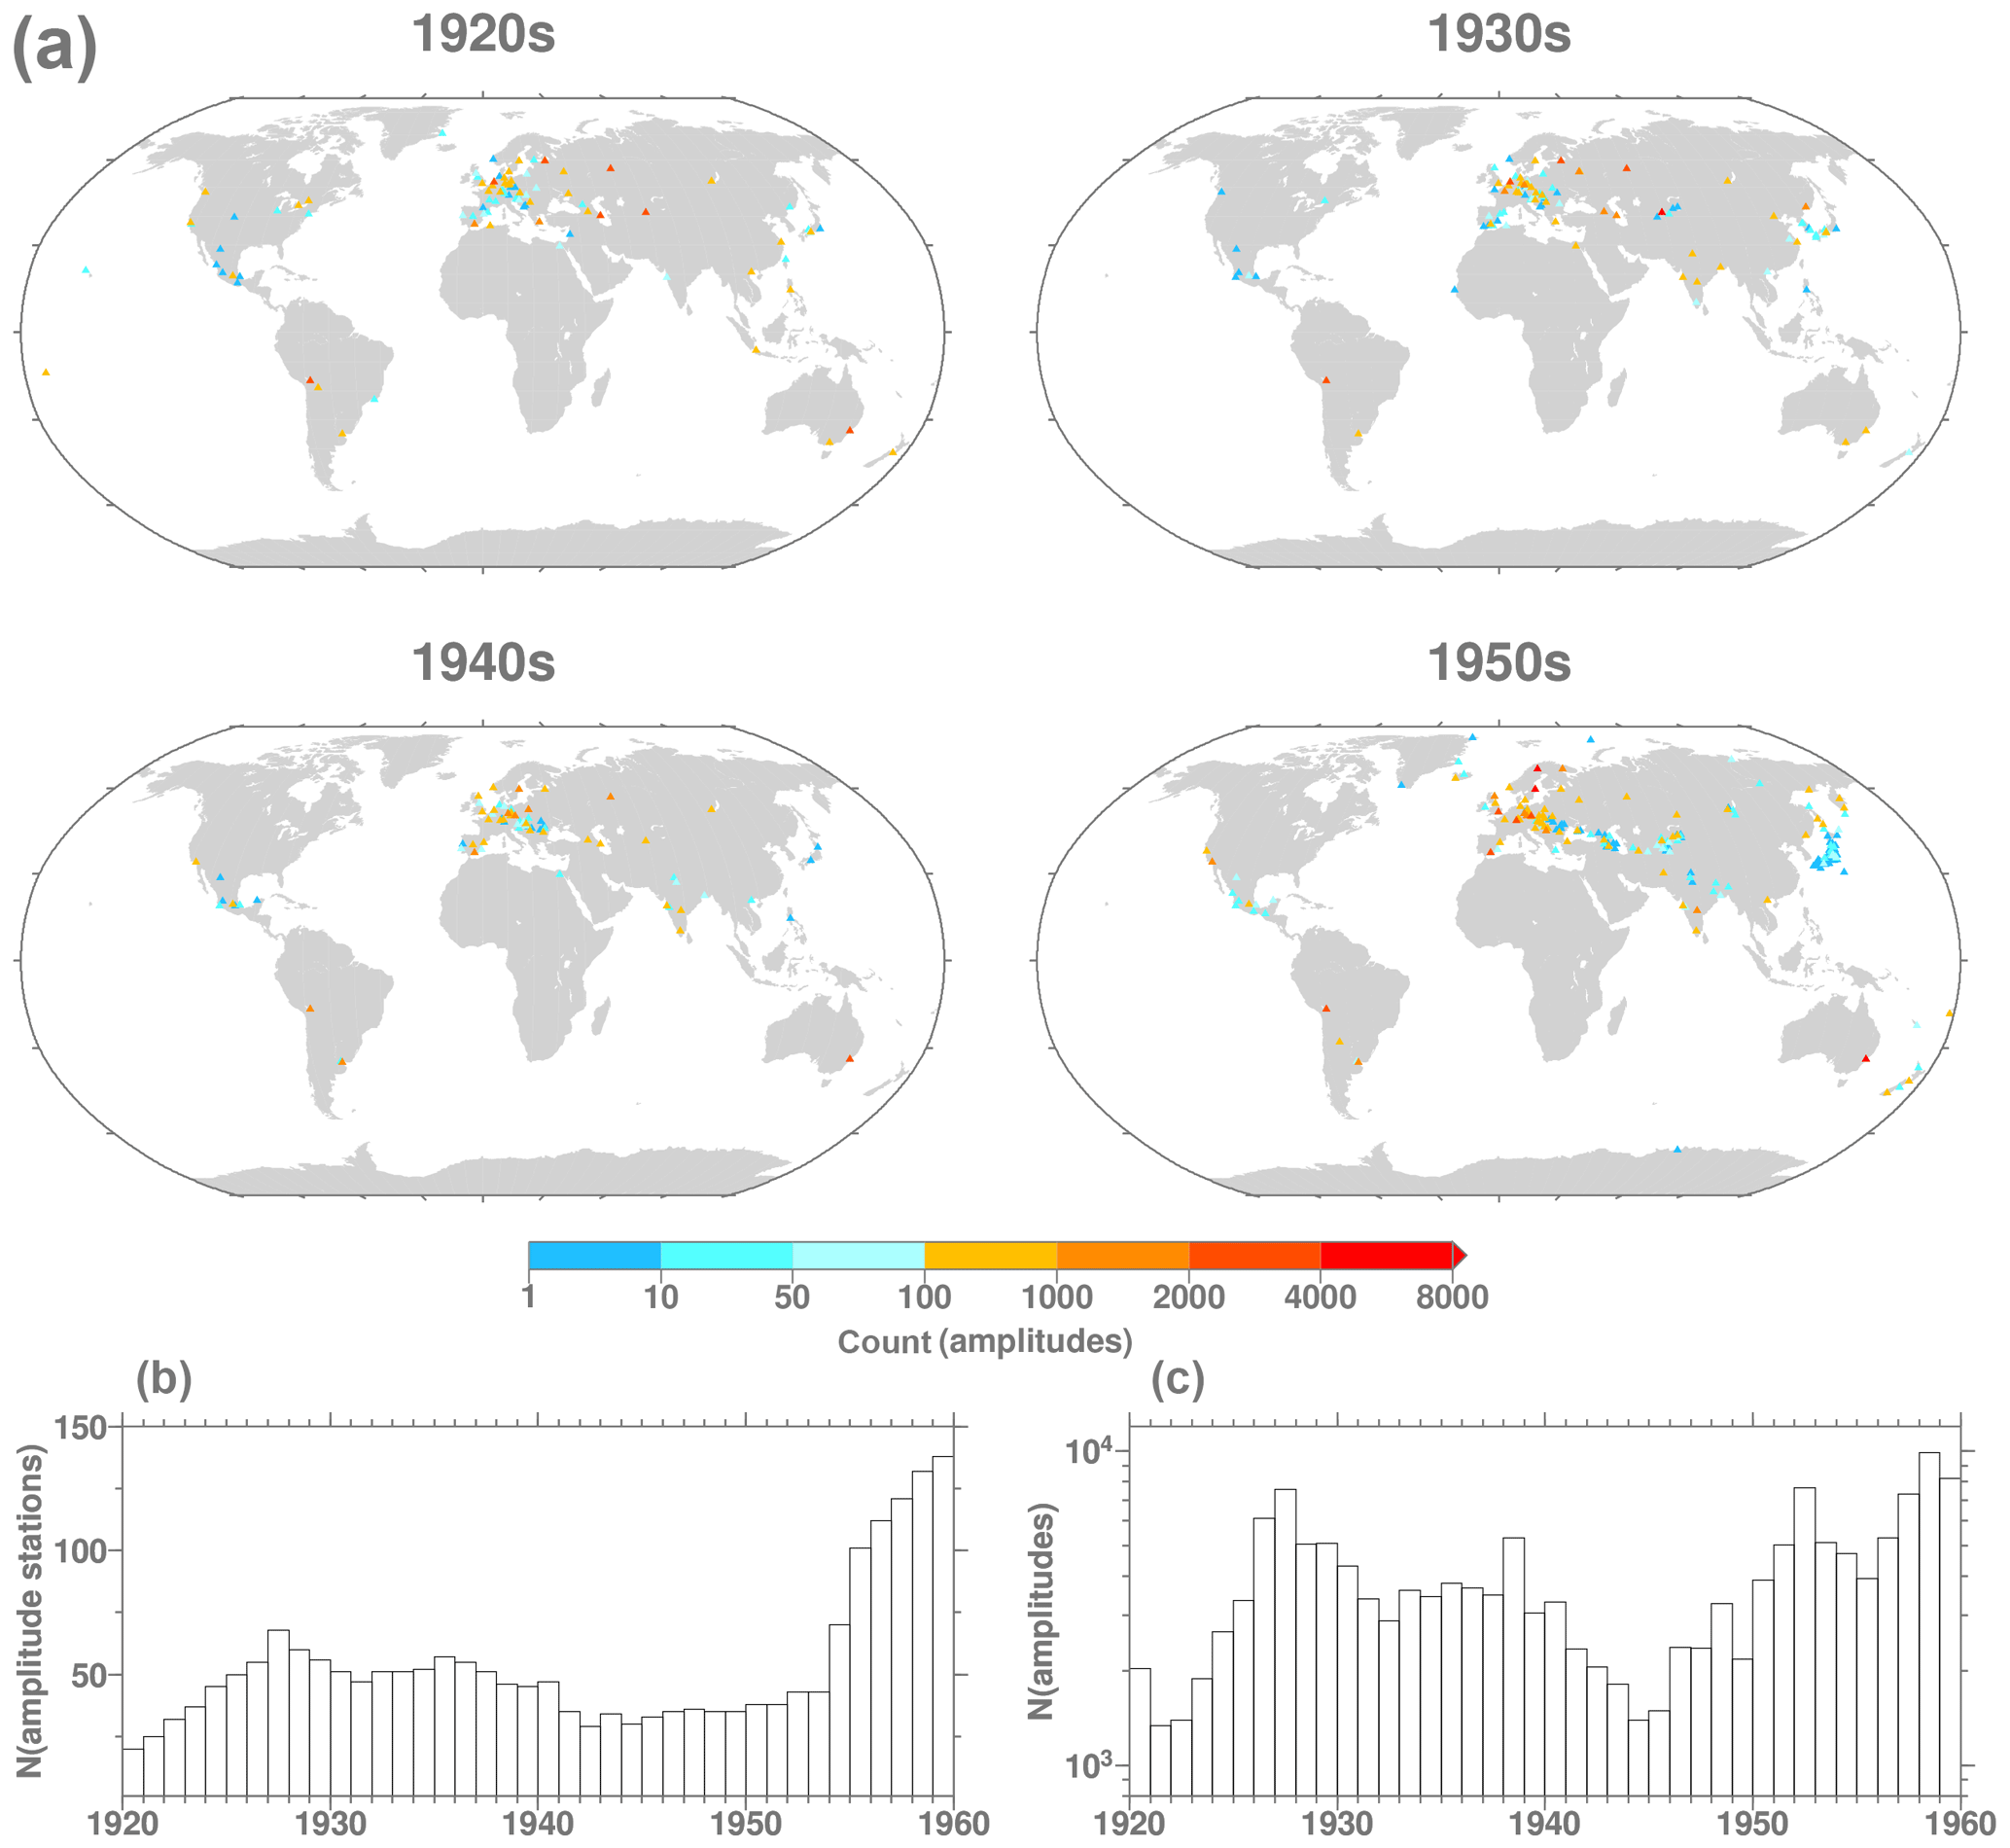
Figure 4Distribution of the stations in each decade contributing amplitudes to the extension events and colour-coded by number of amplitudes. The annual number of stations (b) and amplitudes (c) are also summarised.
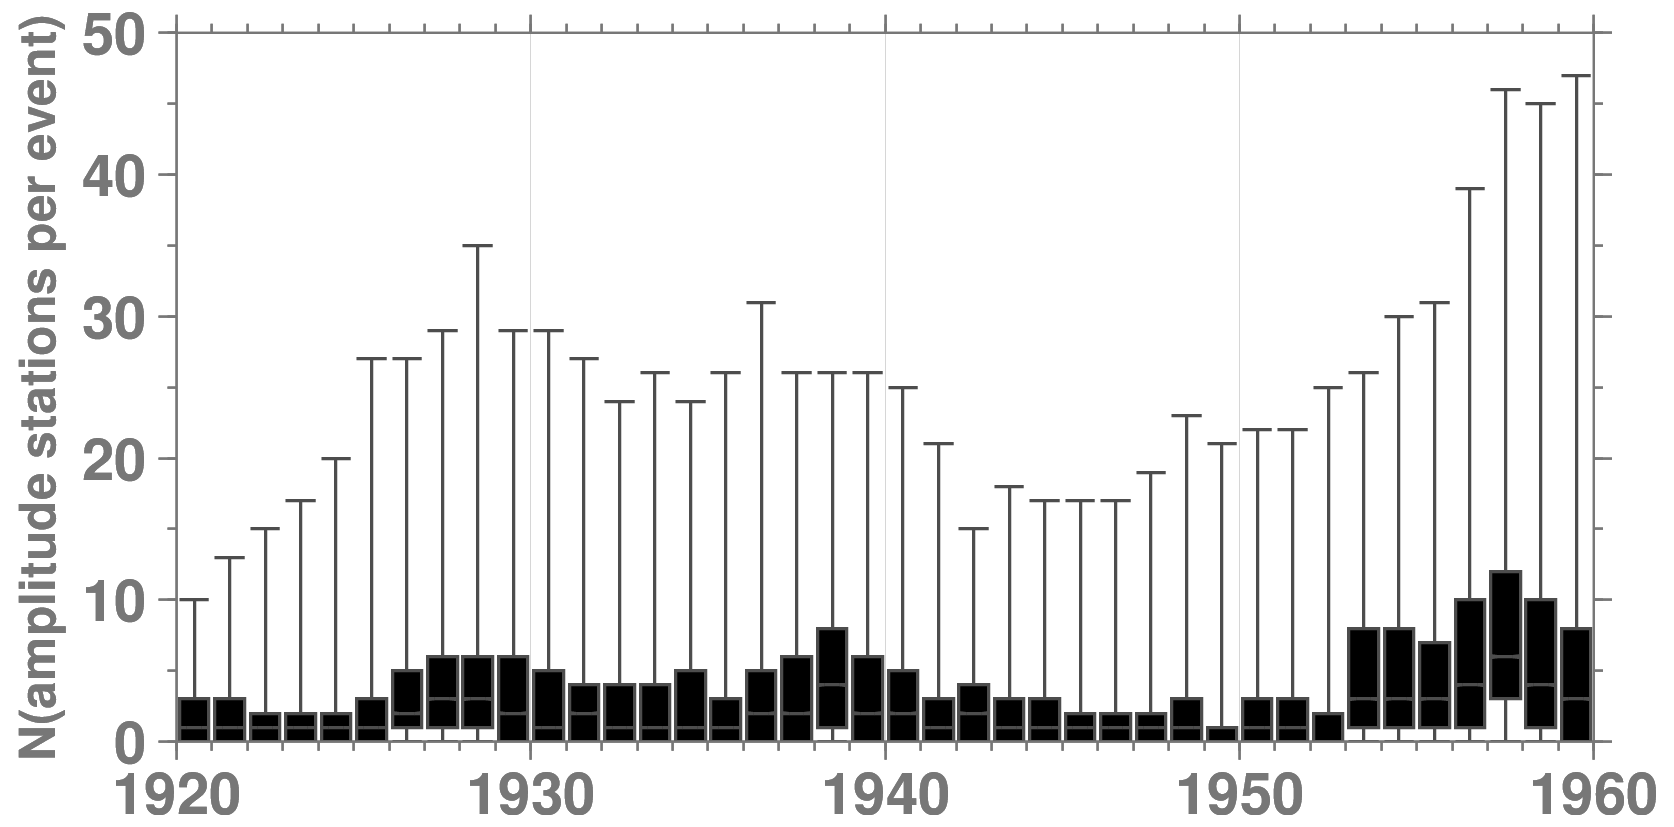
Figure 5Box-and-whisker plot for the extension events of the median number of stations supplying amplitudes per event in each year. The box represents the 25 %–75 % quantile, the band inside the box represents the median and the ends of the whiskers represent the minimum and maximum of all data.
Figures 4 and 5, similarly to Figs. 2 and 3, show the distribution of stations contributing amplitudes for each decade and the median number of stations supplying amplitudes in each year, respectively. The number of stations reporting amplitudes increased until World War II, dropped in the 1940s and improved significantly from 1953. European and many Russian stations are the most important contributors to amplitude readings compared to stations in other continents, except for La Paz (LPZ, Observatorio San Calixto, Bolivia) and Riverview College (RIV, Sydney, Australia) from the Jesuit seismic network (Udías and Stauder, 1996). The number of stations per event contributing amplitudes ranges from 0 to above 40, with the median per year oscillating from 0 to 6 (Fig. 5).
We based the selection of the extension events on combinations of the number of body-wave arrival times and the number of stations supplying amplitude data. Considering that our relocation approach (Bondár et al., 2015) relies largely on teleseismic observations (i.e. above 18∘ distance) and the magnitude reassessment (Di Giacomo et al., 2015a) on the availability of three (or two in some case) station magnitudes, we first excluded events with no teleseismic phases and fewer than two stations contributing amplitudes. After this first cut, we further excluded earthquakes with a limited number of body-wave arrival times and fewer than two to three stations with amplitudes. These are earthquakes for which we could not obtain a reliable solution (due to poor station coverage and/or arrival times) after preliminary relocation attempts. It is worth pointing out we have tried to be as comprehensive and conservative as possible by not rejecting all poorly constrained relocations (see next section). Also, we included all extension events between 1953 and 1956 available in the ISS (due to their small number; see Fig. 1) and well-recorded earthquakes but without amplitudes. As a result, out of the 19 341 extension events between 1920 and 1959 we relocated 11 572. The annual numbers are shown in Fig. 6, where the variations are linked to the state of the global network during those years and the operational practice changes at the ISS, as mentioned earlier.
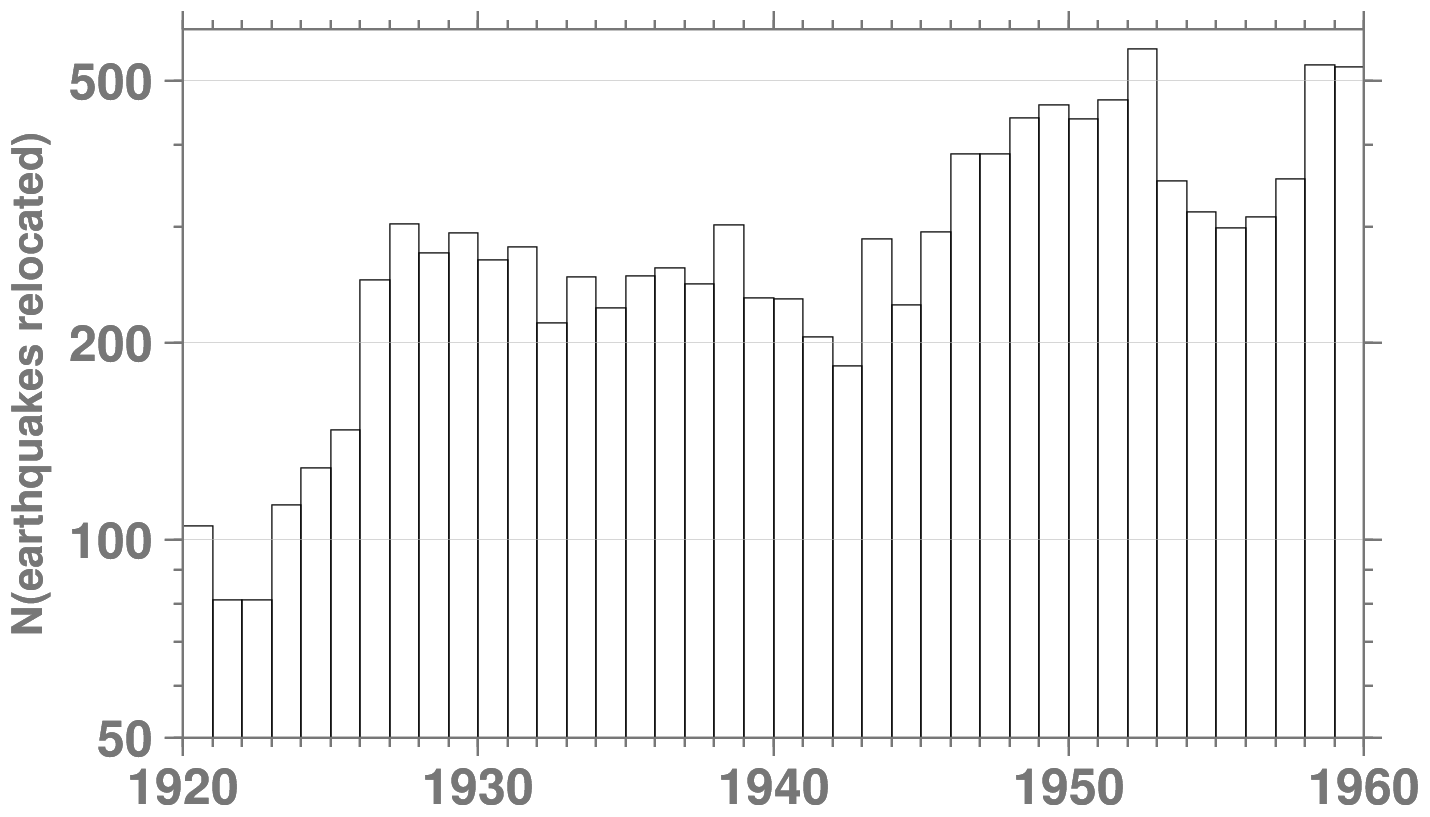
Figure 6Annual number of the relocated extension events between 1920 and 1959. See text for details.
3.2 Relocations
The location reassessment of previous hypocentres (from ISS or other authors adopted by it) of the selected extension events is one of the fundamental tasks of this work. The relocations are obtained by closely following the approach described by Bondár et al. (2015). In Fig. 7 the box-and-whisker plots of the defining stations (i.e. stations with at least one arrival time that constrains the location, hereafter referred to as NDEFSTA) and SGAP for each year are shown. The NDEFSTA gradually increases from the 1920s to the 1950s (except for the slight dip in the 1940s, for reasons explained earlier), whereas the SGAP gradually improves over time. This in general leads to improved confidence in locations. Figure 8 shows the location and depth differences between the previous (ISS or authors adopted by ISS) and the ISC-GEM hypocentres. With a few large exceptions, median location differences range from about 100 km in the 1920s to about 20 km in the late 1950s. With depth differences, one must consider that for 9418 relocated extension events the original depth was unknown and nominally set to zero. Also, it is important to point out that about half of the relocated extension events have no depth phases; therefore for those the depth was assigned to a default depth resulting from the tectonic setting or nearby earthquakes. However, as already pointed out by Bondár et al. (2015), we remove the artefact of having most shallow earthquakes set at zero km depth.
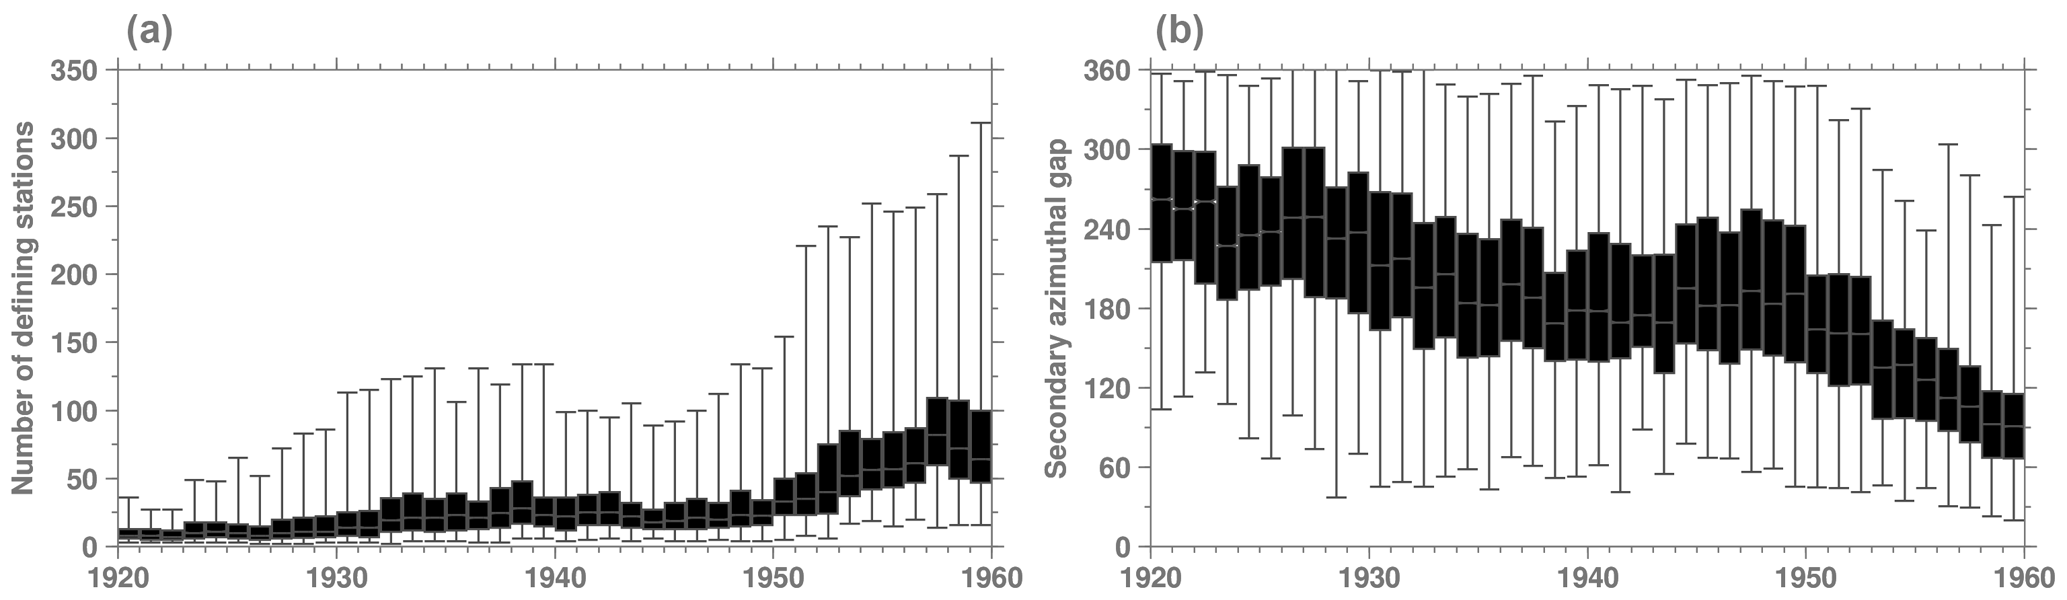
Figure 7Box-and-whisker plots of the number of defining stations (NDEFSTA, a) and the secondary azimuthal gap (SGAP, b) in each year.
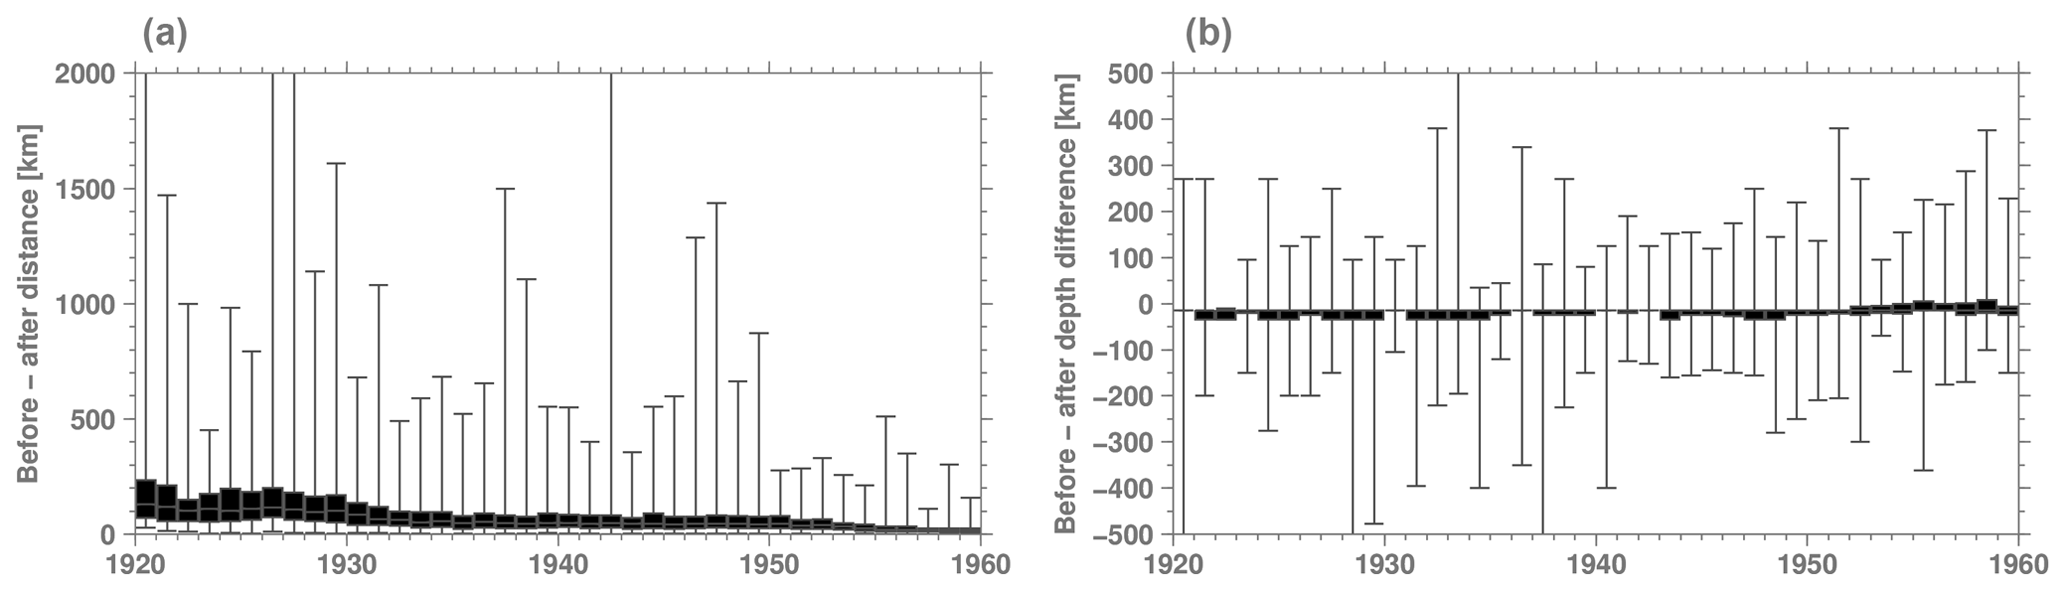
Figure 8Box-and-whisker plots of the epicentre (a) and depth (b) differences between previous hypocentres (before) from ISS (or authors adopted by ISS) and ISC-GEM (after) locations in each year. For 9417 of the 11 572 extension events relocated between 1920 and 1959 the depth for the previous hypocentres (before) was unknown and nominally set to zero.
We checked the reliability of the ISC-GEM relocations in terms of network coverage and deviation from the available hypocentres grouped for an event, performed a cross-check between the EHB and ISCloc algorithms and considered the nearby seismicity. At times we also used available comments in the individual station bulletins as a guide in solving uncertain cases. Obviously, relocations for events with large SGAP (>270∘) and/or small NDEFSTA are not well constrained and we decided case by case whether to manually assign location flag D (i.e. the event will be listed in the Supplementary Catalogue). A typical case in this respect (although time-dependent) is represented by earthquakes in the North Atlantic ridge where most of the phase data would come from European stations and SGAP could be even larger than 300∘ simply because North American stations (see Fig. 2) would not systematically report data for such earthquakes (except for large ones).
Table 2Summary of the location and depth quality flags for the extension events between 1920 and 1959.
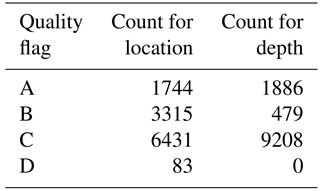
Table 2 summarises the location and depth quality flags for the relocated extension events between 1920 and 1959. The most frequent quality flag both for location and depth is C. However, despite the limitations of the global seismic network, particularly before the 1950s, it is possible to recognize the improvements of the ISC-GEM locations with respect to the original ones even on a global scale, as shown in Fig. 9. Although we do not claim that the ISC-GEM locations are the best possible solutions in this period for every single event, we recommend that any regional or focused study of predigital earthquakes instrumentally recorded should start from the ISC-GEM locations as they are obtained from (currently) the most comprehensive set of instrumental data.
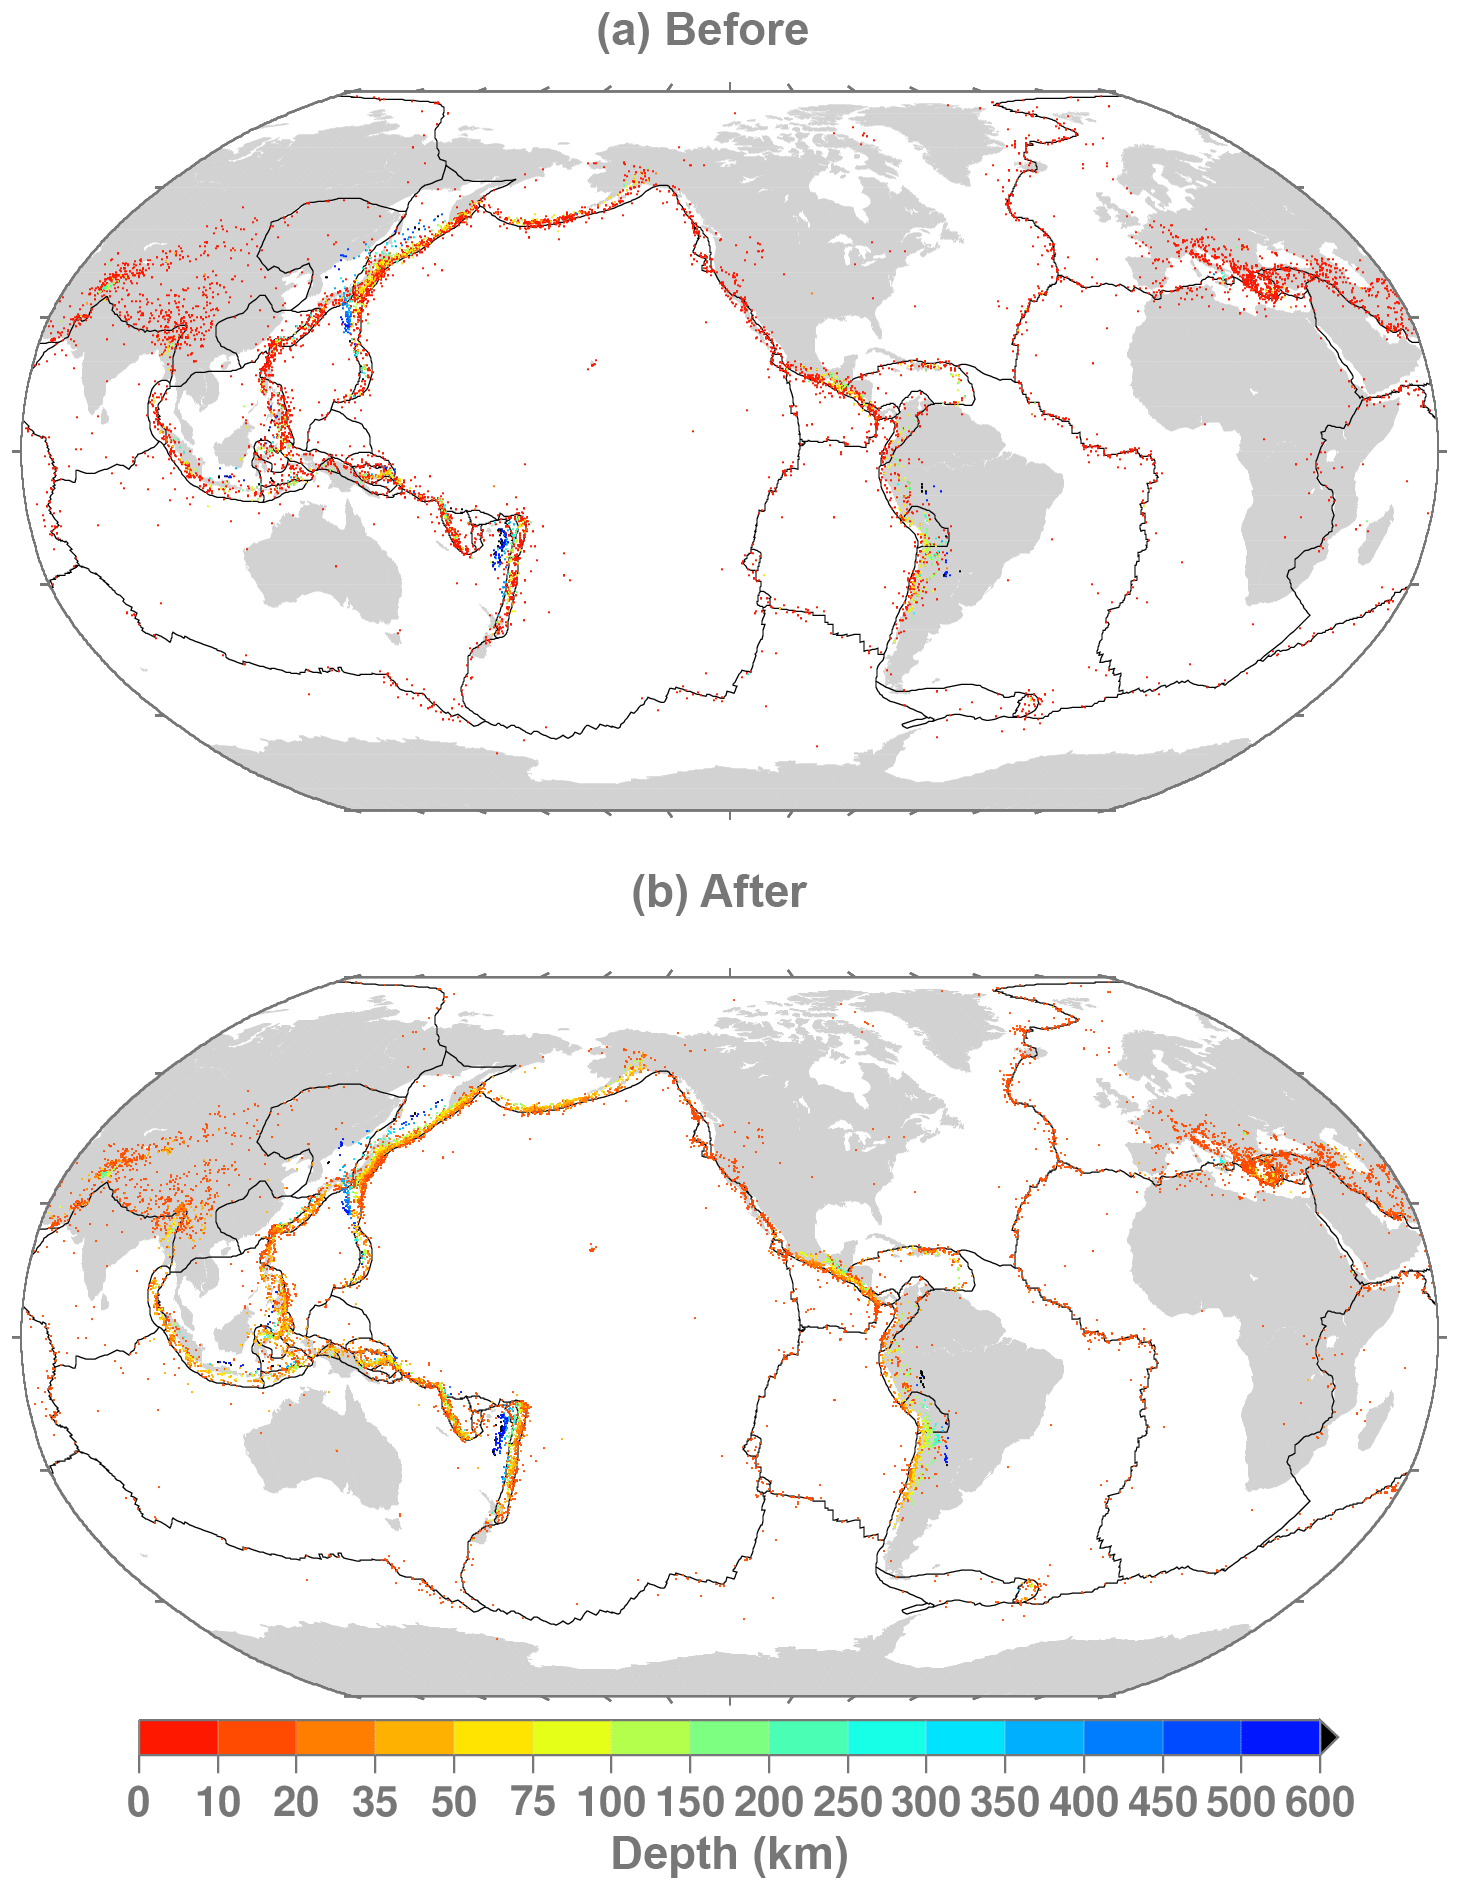
Figure 9(a) ISS (or authors adopted by ISS) (before) and (b) ISC-GEM locations (after) for the extension events relocated between 1920 and 1959. Bird (2003) plate tectonic boundaries are also shown. It is possible to observe how the ISC-GEM locations better depict the seismicity of the Earth even on a global scale.
3.3 Magnitude reassessment
We used the approach described in Di Giacomo et al. (2015a) to reassess the magnitude of the extension events consistently with their ISC-GEM relocations. Due to the lack of short-period body-wave amplitudes before the 1960s, here we focus on recomputed MS as the basis for the calculation of the proxy Mw. The MS recomputation is based on the amplitudes and periods of surface waves digitised during this work (Figs. 4 and 5). Before accepting an MS value, we checked the station distribution and, when possible, cross-checked our magnitudes with other magnitude information to investigate cases of large differences with previous results. Figure 10 shows the timeline of the recomputed MS and their annual counts. Besides the recurrent features discussed earlier (i.e. general increase in the annual counts from the early 1920s and the dip in the 1940s), there are 2304 events with MS below 5.5. This occurs because our selection criteria for this period, as explained earlier, had to be based on station data availability rather on magnitude. Although events with magnitude below 5.5 would not normally be part of the ISC-GEM Catalogue, we did not exclude them because of the importance of reassessing the magnitude of predigital earthquakes. Most of these events with MS<5.5 are mostly located in an area covering the mid-oceanic ridge of the North Atlantic to the European Mediterranean region. This is not surprising considering the distribution of stations contributing amplitudes (Fig. 4). Also, there are 80 earthquakes with MS≥6.5 that should have already been in V1. These events were not originally selected because the available magnitude information was considered not reliable or it was below the cut-off value of 6.25. This further highlights the necessity of a comprehensive and systematic magnitude reassessment with homogeneous procedures.
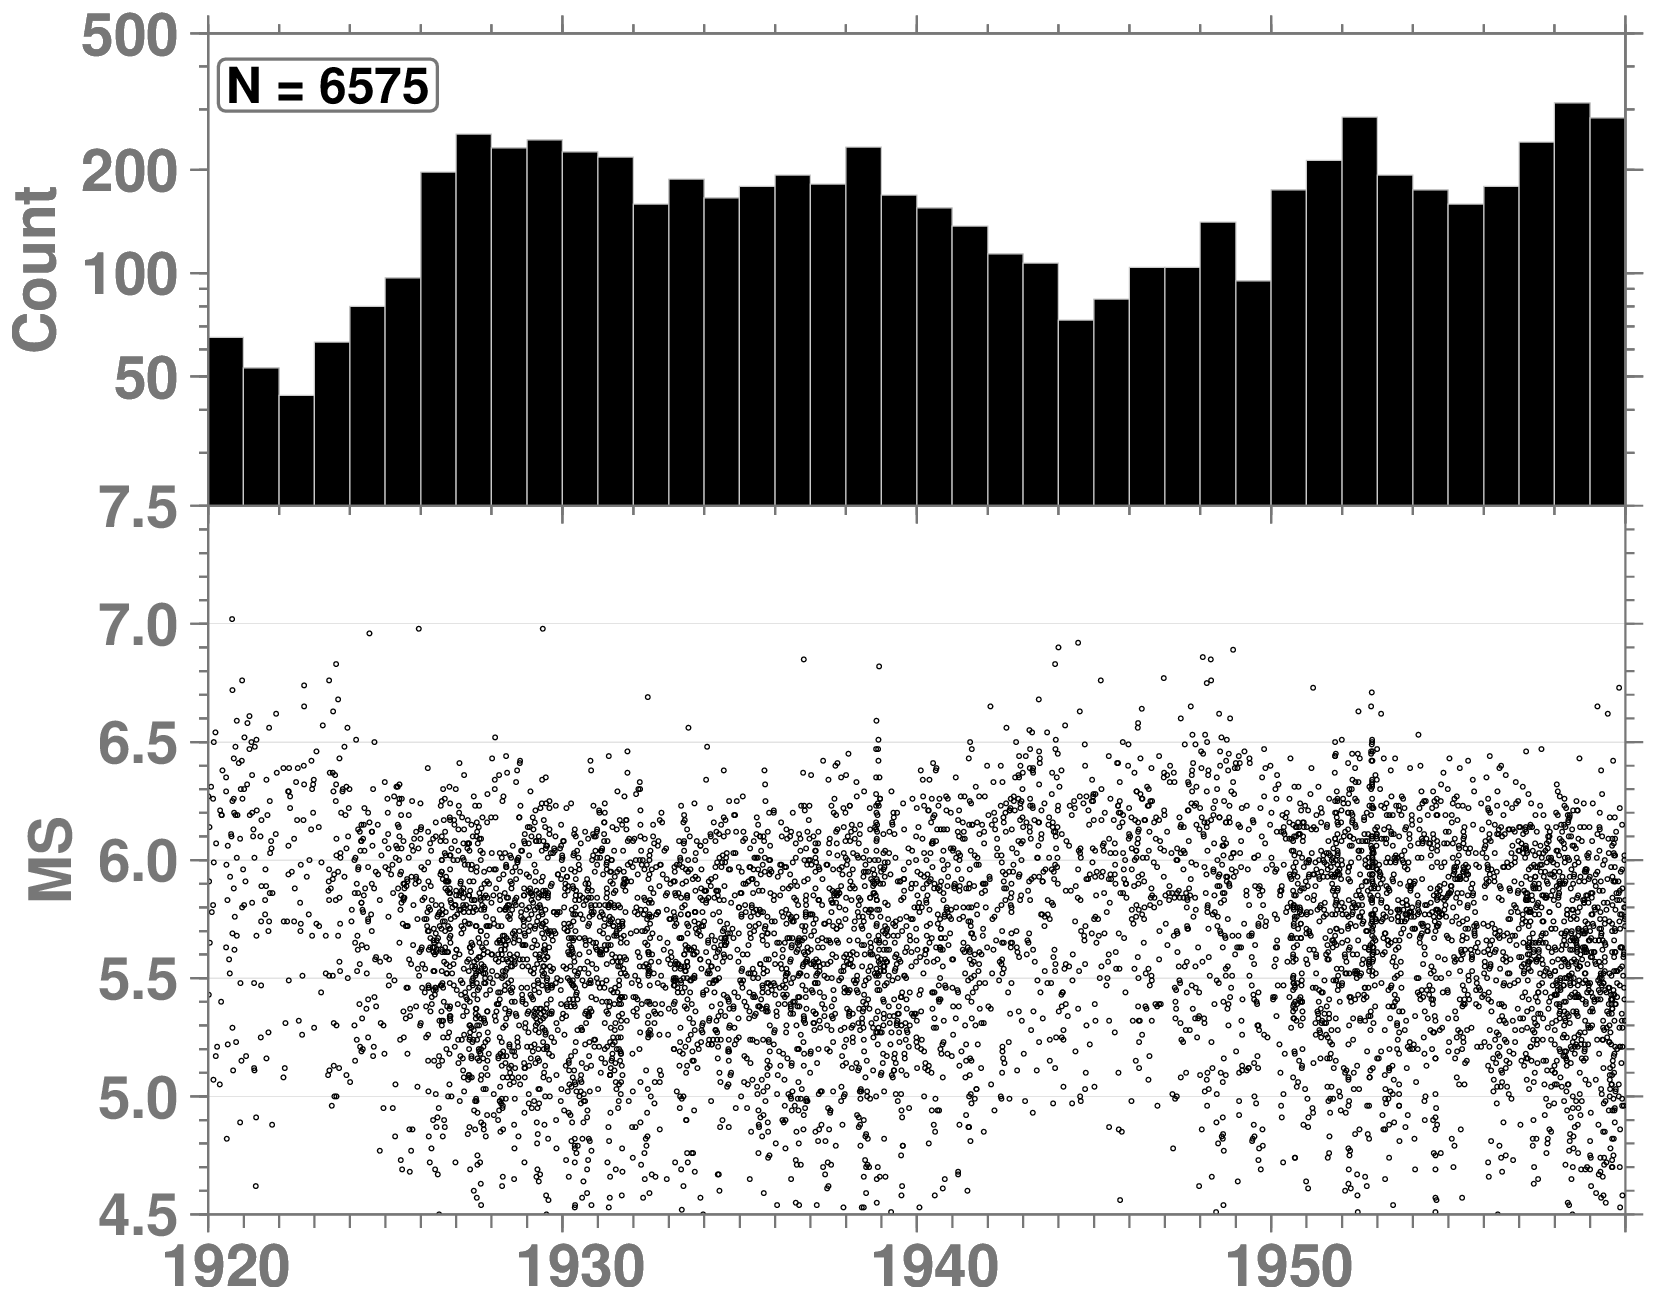
Figure 10Timeline of the 6575 recomputed MS (bottom) for the relocated extension events during 1920–1959 and their annual counts (top). 2304 earthquakes have MS<5.5 and 80 have MS≥6.5.
In total, we recomputed MS for 6575 (∼57 %) of the relocated extension events and obtained a magnitude (MS or any other type) for the first time (at least to the best of our knowledge) for 3011 of them. A lack of stations reporting amplitudes is normally the cause for not having a recomputed MS as we normally require a minimum of three stations. The only exception occurs when we have two station magnitudes from a subset of specially selected stations that do not differ more than 0.3 magnitude units (m.u.). In such circumstances we allowed MS recomputation for 276 earthquakes and assigned MS uncertainty of 0.5 m.u.
If no direct Mw value is available for an event, the recomputed MS values are then used as the basis for proxy calculations of Mw and magnitude quality flags (Di Giacomo et al., 2015a). Table 3 summarises the counts for the magnitude quality flags for the relocated extension events between 1920 and 1959. Only five of the extension events have direct values of Mw from the literature search (Lee and Engdahl, 2015). The high number of magnitude quality flags D is largely due to events for which no recomputed magnitude (MS, mb or Mw from the literature) is available and for which MS, as the basis for Mw conversion, is below 5. Figure 11 shows the timeline of the earthquakes without recomputed magnitudes along with their annual counts and depth frequency. Although MS is not estimated for deep earthquakes according to IASPEI (2013), the clear majority (nearly 70 %) of events without magnitude are shallow (depth ≤50 km). For such shallow earthquakes we continue to look for additional amplitudes (more details in a later section) so that we can calculate MS and eventually move some of those events from the Supplementary to the Main catalogue.
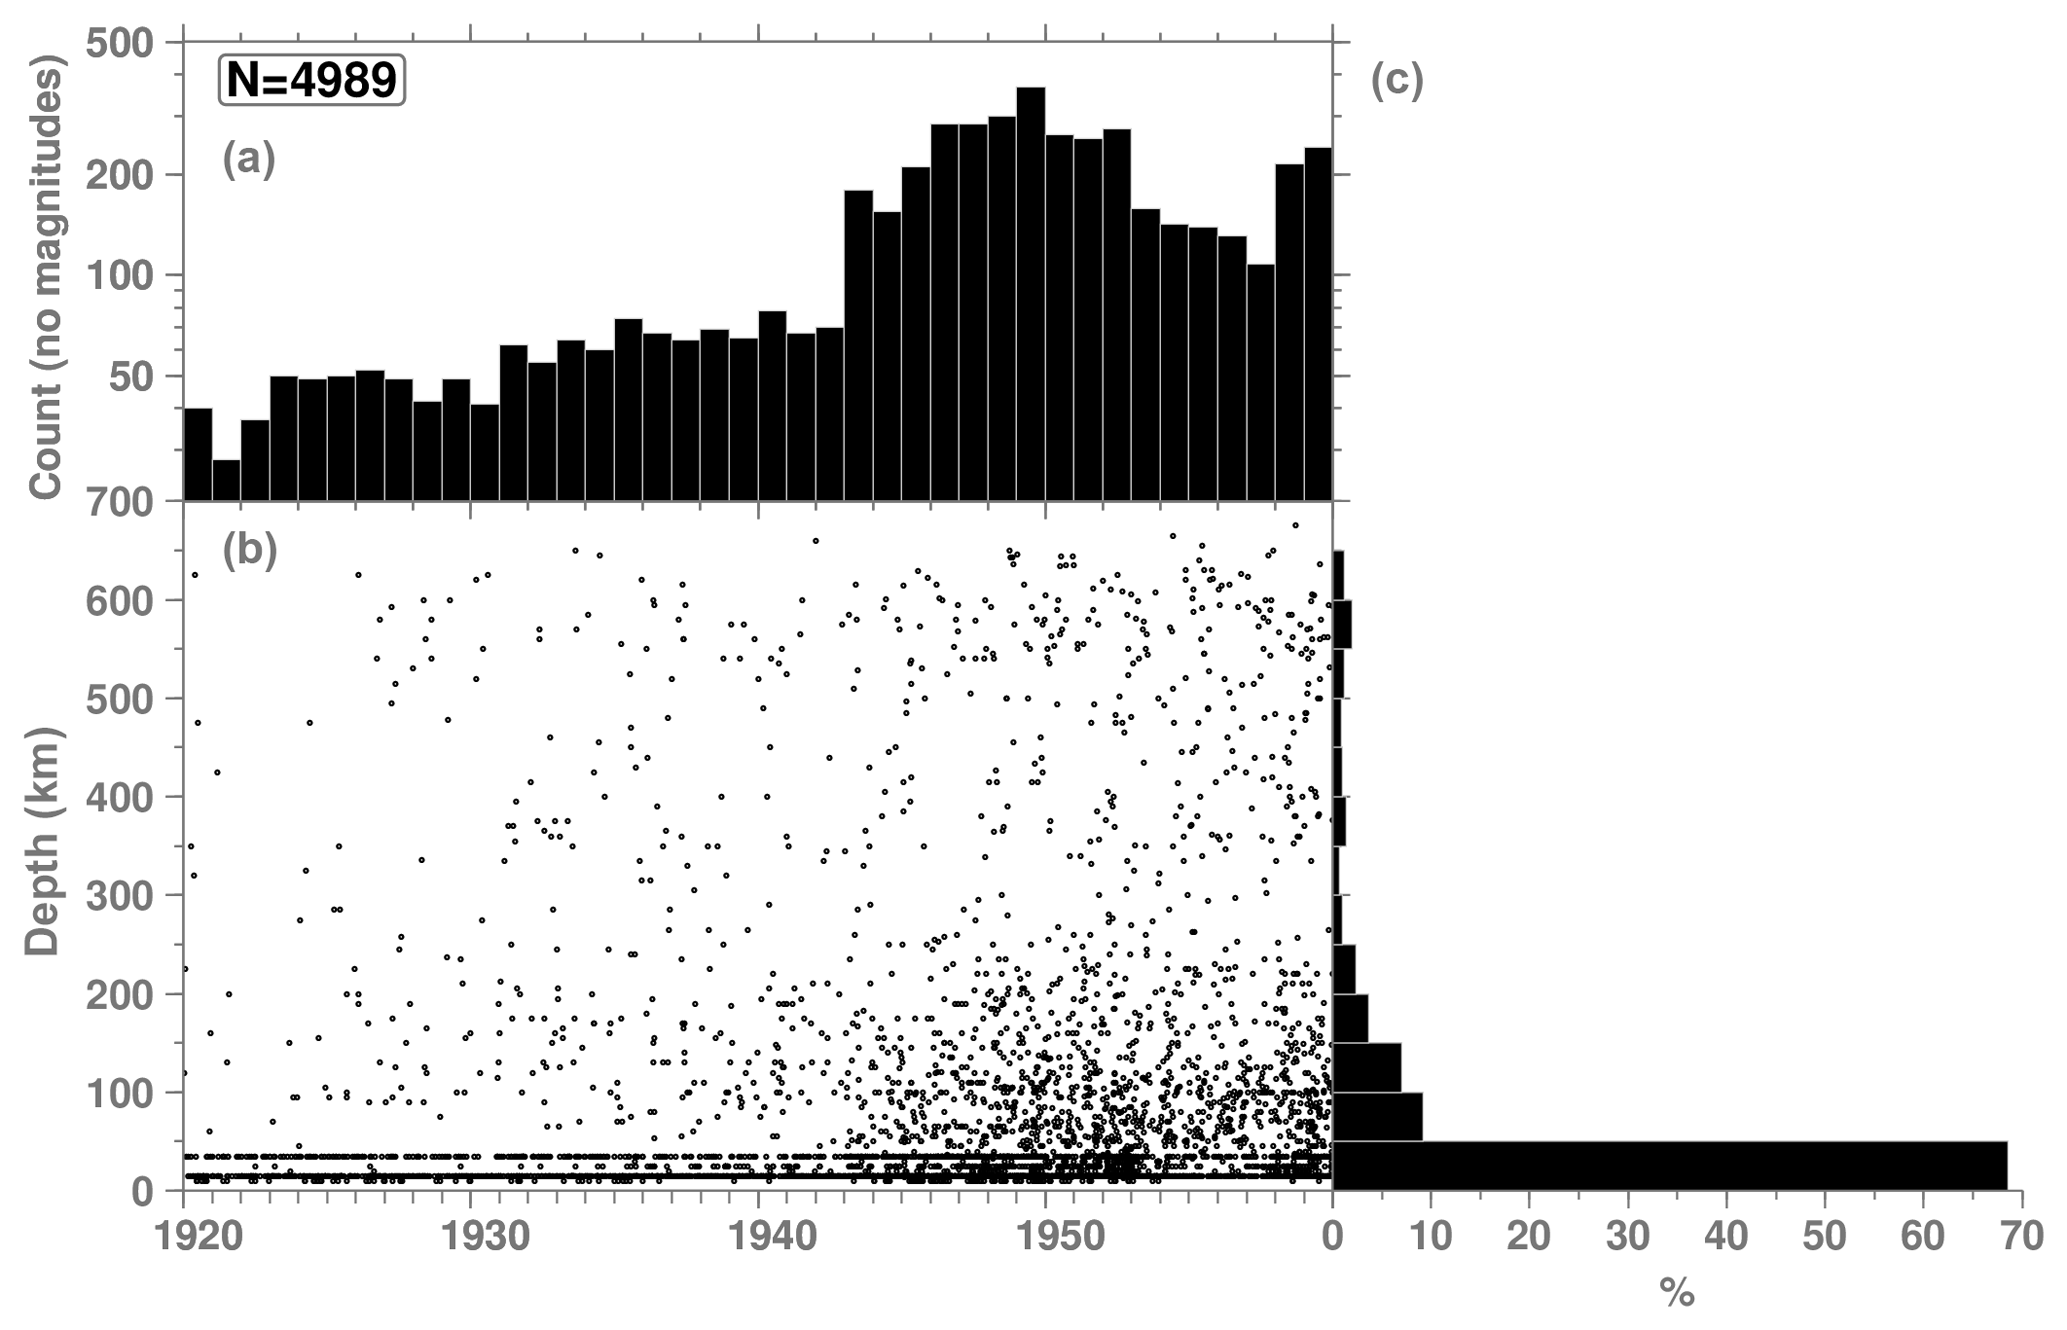
Figure 11Timeline (b) of the relocated extension events without magnitude between 1920 and 1959 along with their depth frequency (c) and annual counts (a).
Table 3Summary of the magnitude quality flags for the relocated extension events between 1920 and 1959. Included in the D flag are 4984 events for which no magnitude was recomputed.

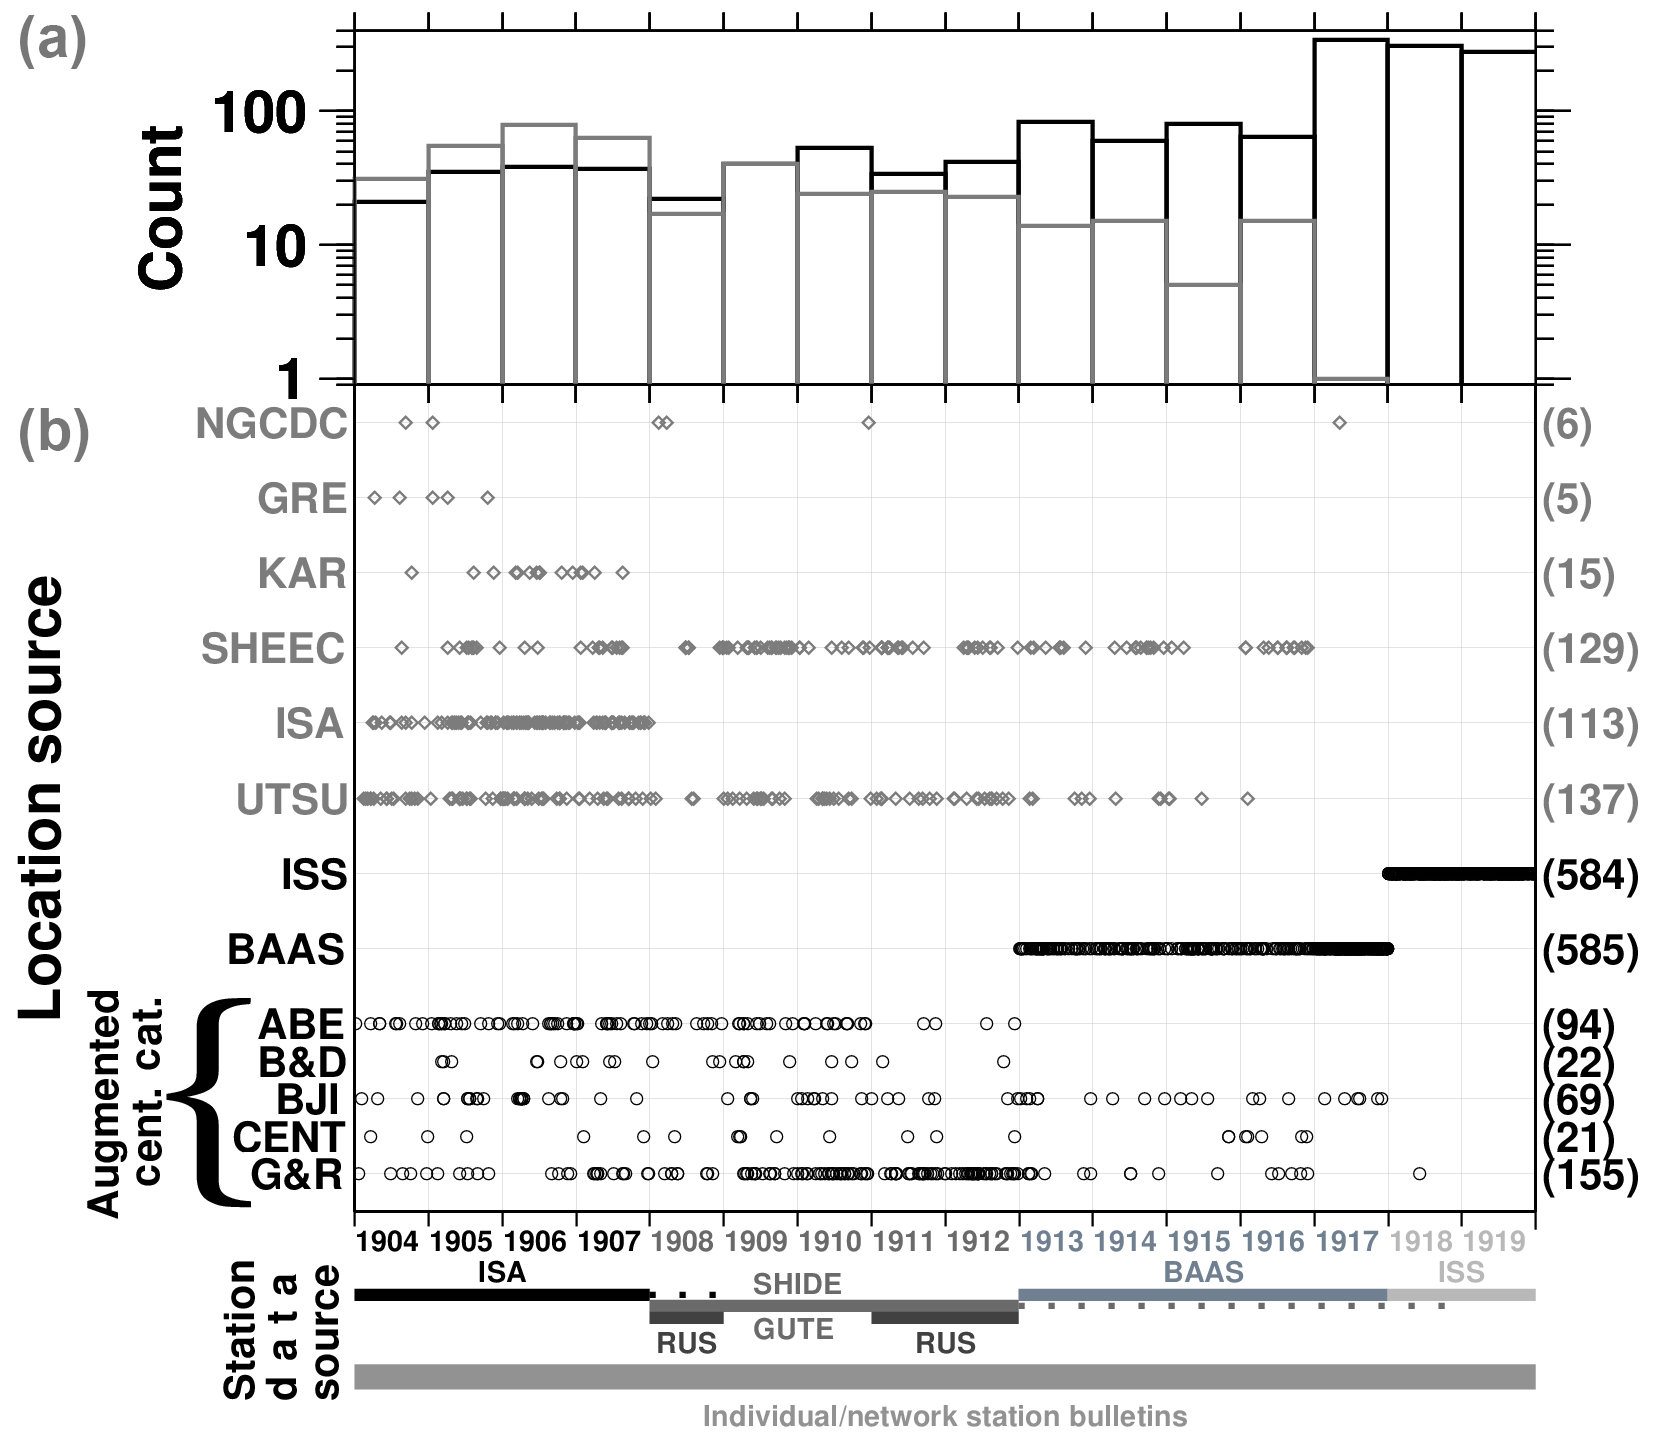
Figure 12Timelines of the extension earthquakes already in our record (black circles) and added ones (grey diamonds) split by original location author/source. See text for the augmented Centennial Catalogue authors (black) and a brief descriptions of the additional location sources (grey). The total counts for each location source are shown on the right-hand side. The annual counts (a) of the extension earthquakes already known and added ones (black and grey histograms, respectively) are summarised. The station data sources (b) are also outlined and shown in different grey colours for the time ranges they have been used for (see text for details). For 1908 we have added station data from the “Kleinere Beben” part of ISA (black dots) and during 1913–1918 we also looked into the GUTE notepads for earthquakes not listed in the BAAS and ISS (dark grey dots). Individual/network station bulletins have been used to add both surface wave amplitudes and body-wave arrival times between 1904 and 1919.
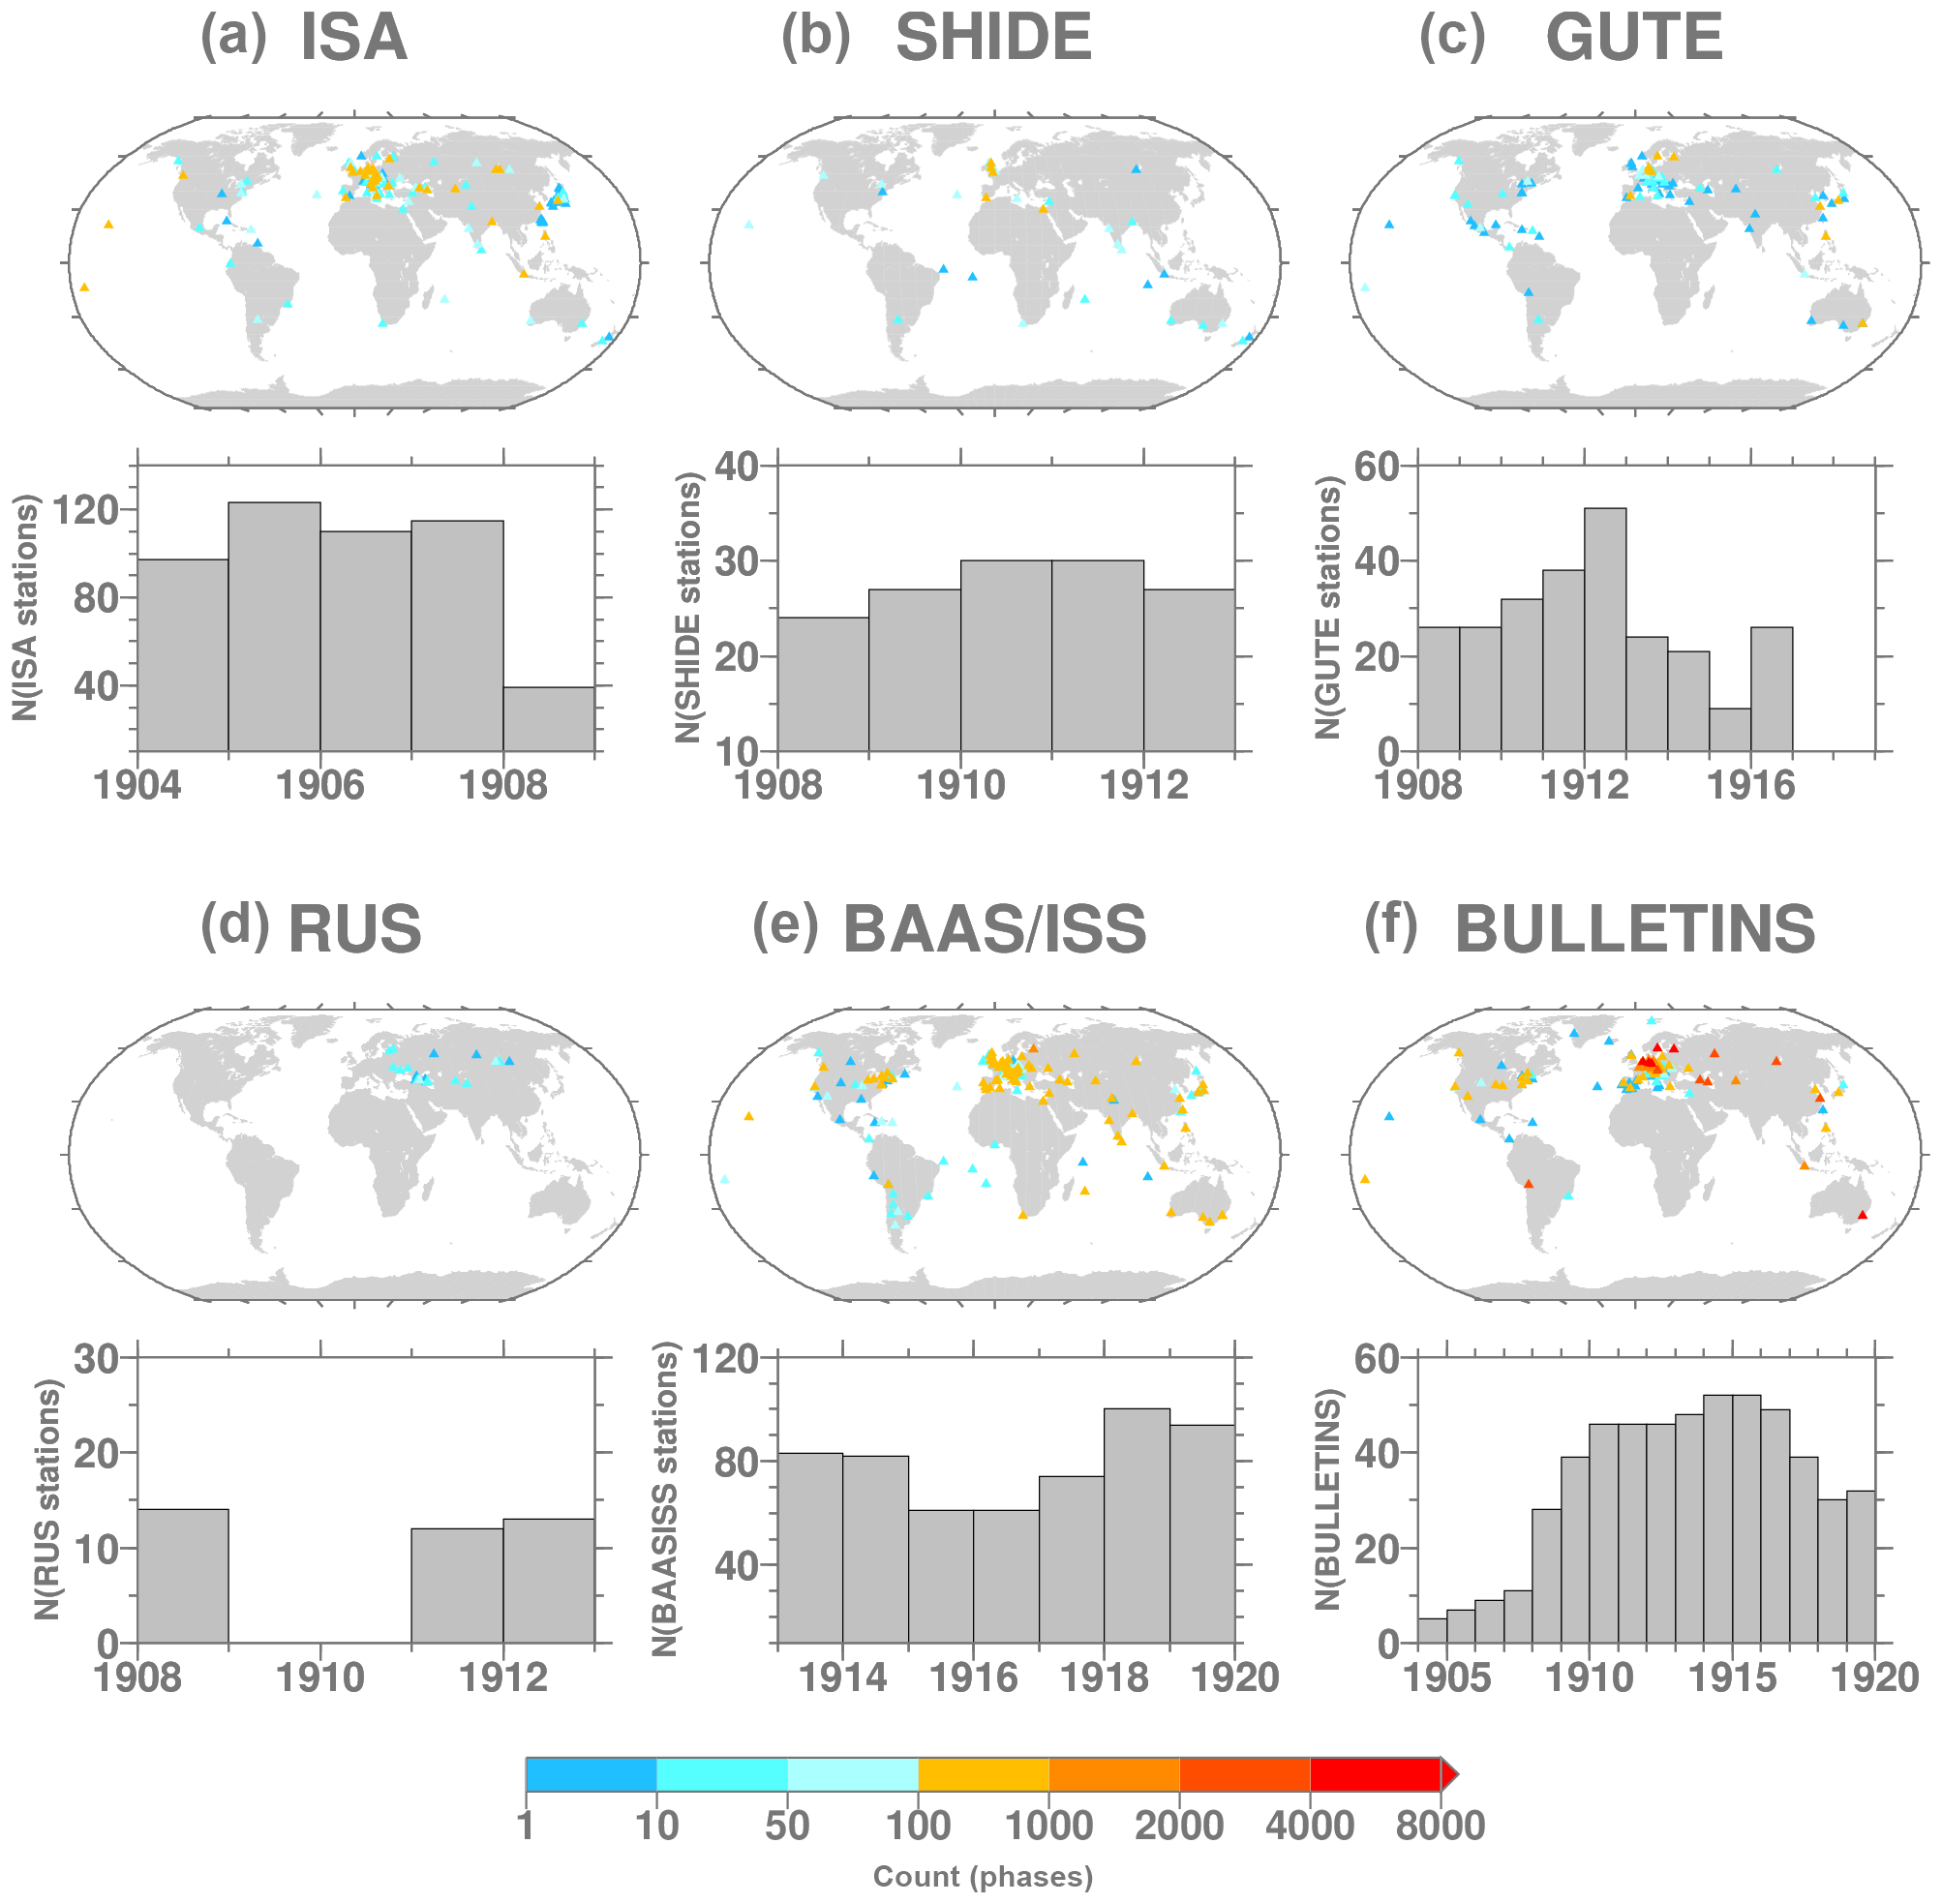
Figure 13Station data contributions from ISA (a), SHIDE (b), GUTE (c), RUS (d), BAAS and ISS (e) and BULLETINS (f) identifying the individual/network station bulletins. The stations are colour-coded by number of phases digitised (see text for details). For each station data source, the annual station counts are shown below the corresponding map (note the different scales for each contributor).
During the last year of the Extension Project we focused on the first part of 20th century and made special efforts to gather not only body-wave arrival times and amplitude of surface waves, but also known earthquakes not available in the ISC database. We did not add any station data before 1904 (basically only stations belonging to the Milne network are available; see, e.g. Adams, 1989) and, consequently, we decided to drop the 10 pre-1904 events listed before V5 from the ISC-GEM Catalogue and have the catalogue starting in 1904.
4.1 Data collection
Before the ISS was put in production starting with earthquakes that occurred in 1918, other seismic bulletins were compiled by different authors/agencies (e.g. Schweitzer and Lee, 2002; Storchak et al., 2015, and references therein). For this work we gathered station data from the following sources.
-
International Seismological Associations (ISA, 1904–1908) bulletins are the most comprehensive both in terms of earthquakes and stations listed for those years. They are composed of two parts, one for the large/significant earthquakes (in German “Hauptbeben”) and one for the small ones (“Kleinere Beben”). Unfortunately, the 1908 “Hauptbeben” part was not printed (at least to the best of our knowledge). These bulletins are referred to as ISA in the following.
-
Shide Circulars (BAASSC, 1900–1912) were used for 1908–1912, referred to as SHIDE.
-
Gutenberg's notepads were utilized for 1908–1916 (mostly up to 1912), referred to as GUTE.
-
Russian network bulletins were consulted for 1908 and 1911–1912, referred to as RUS.
-
BAAS (1913–1917) bulletins (predecessor of the ISS) listed both locations and station data.
-
The ISS was used for 1918–1919.
-
Individual station bulletins (1904–1919, referred to as BULLETINS) were consulted, not only for what concerns the surface wave amplitudes but also for body-wave arrival times (in support of relocation rather than only magnitude reassessment) as some stations (e.g. Uppsala, Nordlingen, Munich) were partially or completely missing in the BAAS or ISS. Furthermore, the body-wave arrival times from individual station bulletins are fundamental for the newly added earthquakes that we describe later in this section.
The ISA, SHIDE and RUS bulletins are available from the supplementary material of Schweitzer and Lee (2002), whereas scanned images of GUTE notepads were kindly provided by Katsuyuki Abe. The ISA, BAAS and ISS bulletins list arrival times from most of the stations operating at that time, whereas SHIDE mostly includes data from Milne stations and the GUTE notepads only a subset of global stations. Except for ISS 1918–1919 (already electronically available), the various sources of body-wave arrival times (ISA, SHIDE, GUTE, RUS and BAAS) for the 1904–1917 extension events were all manually typed in text files and then parsed into the ISC database.
As shown in Fig. 1, the annual number of recorded earthquakes, at least up to 1917, is smaller than an approximate average rate of ∼100 yr−1 for events of magnitude 6 and above. Therefore, for this period we also tried to add as many known earthquakes as possible that are not listed in the augmented Centennial Catalogue, BAAS or even the ISS 1918–1919. To do that we considered the following sources:
-
Catalog of Damaging Earthquakes in the World (http://iisee.kenken.go.jp/utsu/index_eng.html, last access: 10 October 2018, Utsu, 1990, 2002, 2004), referred to as UTSU in the following;
-
ISA (only for 1904–1907);
-
SHARE European Earthquake Catalogue (SHEEC) 1900–2006 (Grünthal et al., 2013), referred to as SHEEC in the following;
-
Karnik (1971) catalogue of the European area (referred to as KAR) and Papazachos et al. (2000, 2010) catalogue for Greece and surrounding areas (available at http://geophysics.geo.auth.gr/ss/CATALOGS/seiscat.dat (last access: 10 October 2018), referred to as GRE) for earthquakes before 1908 with station data in ISA (either not available in SHARE or for which the KAR/GRE solution would be a better starting point considering the ISA station data);
-
Significant Earthquake Database of the National Geophysical Data Center/World Data Service (NGDC/WDS) (https://www.ngdc.noaa.gov/nndc/struts/form?t=101650&s=1&d=1, last access: 10 October 2018), referred to as NGDC.
As we have a rather mixed set of starting points for hypocentre relocations, in Fig. 12 we show the timelines of the extension earthquakes 1904–1919 split by original location author, along with their counts and the time coverage of the station data sources we digitised. The augmented Centennial Catalogue location sources G&R, B&D, ABE, CENT and BJI are from Gutenberg and Richter (1954), Båth and Duda (1979), Abe (1981, 1984) and Abe and Noguchi (1983a, b), Centennial itself and Chinese catalogue, respectively. In total we have found 405 additional earthquakes (mostly before 1917) on top of the 1530 earthquakes already listed between 1904 and 1919 in the augmented Centennial Catalogue, BAAS and ISS. Notably, between 1904 and 1907 the annual number of earthquakes we added (mostly from ISA and UTSU) is larger than the annual number of extension earthquakes previously available in our record. Between 1908 and 1912 the annual number of earthquakes added is comparable or smaller than the ones already available, whereas from the beginning of the BAAS and then ISS the annual number of newly added earthquakes drops significantly during the BAAS and then it is zero with the beginning of the ISS.
For all earthquakes outlined in Fig. 12 we tried to associate as many body-wave arrival times and surface wave amplitudes as possible from the station data sources mentioned earlier. The contribution of each station data source is presented in Fig. 13. For the early years of the past century, ISA was comprehensive in compiling data from stations around the world, whereas the other sources only included subsets of the stations operating at that time. Unfortunately, between 1908 and 1912 (coinciding with the end of ISA, “Hauptbeben” part, in 1907 and before the beginning of BAAS in 1913) we do not have a comprehensive bulletin such as ISA in preceding years or BAAS in the following ones. Therefore, we gathered station data from SHIDE, GUTE, RUS and individual/network station bulletins. From 1913 onwards, the overall station data collection improves significantly thanks to BAAS and then ISS.
Considering all sources depicted in Fig. 13, Fig. 14 shows the overall annual counts for the number of stations, phases and, finally, the box-and-whisker plot of the annual number of stations per event. A significant dip is present in the station data between 1908 and 1912 since the station (and location) sources available to us for these years are not as comprehensive as ISA or BAAS/ISS. The box-and-whisker plot of Fig. 14 also shows that several earthquakes have none to three associated stations (59 from the augmented Centennial Catalogue, BAAS and ISS and 116 from the newly added ones). Obviously, the limitations in the collection of station data influenced the earthquakes that we finally selected for processing and the quality of the relocations/magnitude reassessment. The results are discussed in the next two subsections.

Figure 14Annual number of station (a), phases (b) and box-and-whisker plot (c) for the overall station data collected between 1904 and 1919.
4.2 Relocations
Not all extension earthquakes have sufficient station data to perform a relocation using our approach. First, we have discarded 175 earthquakes with fewer than four stations, as pointed out earlier. We then progressively discarded another 650 as either the relocation failed or was considered unreliable. We may go back to the discarded earthquakes if additional station data become available to us. In the end, we accepted the relocation for 1110 out of the 1935 extension earthquakes. Figure 15 shows the annual counts of the relocated extension earthquakes 1904–1919. Note the dip in the annual number of the relocated extension earthquakes for 1908–1912, reflecting the absence (to the best of our knowledge) of a comprehensive global bulletin between ISA and BAAS.
As in Fig. 7, Fig. 16 shows the box-and-whisker plots of NDEFSTA and SGAP. For this period the relocations are usually based on a small number of stations (median between 6 and 16) resulting in a large SGAP (median between 201 and 310∘), even during the years covered by BAAS and ISS. Figure 17 shows the median location, depth and origin time differences between previous (see Fig. 12) and ISC-GEM locations. The median location differences oscillate between 70 and 205 km, with large differences above 1000 km for 46 earthquakes (16 above 2000 and 4 above 3000 km). Such large location differences can occur for various reasons (from typos in the latitude/longitude of previous locations to poorly recorded earthquakes having low confidence locations). One extreme example is the epicentre change from Bristol Bay, offshore Alaska (G&R location), to offshore Jamaica (ISC-GEM location) for an event that occurred on 22 August 1907 (∼22 h 23 m). The reason for such a large difference originates from the fact that G&R ignored the report that the event was felt in Kingston (see, e.g. ISA, 1907, part B, p. 73) and preferred to fit the phase data to an intermediate-depth event offshore Alaska. As for 1920–1959, most of the earthquakes have no depth resolution and the previous depths were largely unknown or set to zero, and this occasionally results in large depth changes (±100 and ±300 km for 51 and 10 earthquakes, respectively). Figure 17 also shows the box-and-whisker plot of the origin time (OT) differences in each year. We show the OT differences because in this period (particularly before BAAS) the OT listed in the previous location sources was at times truncated to the minute or with some minute error that we were able to address thanks to the stations data we digitised. Although ∼90 % of the OT differences are within 1 min, some large OT changes of ±5 min or more occur for 16 earthquakes (8 originally from ABE).
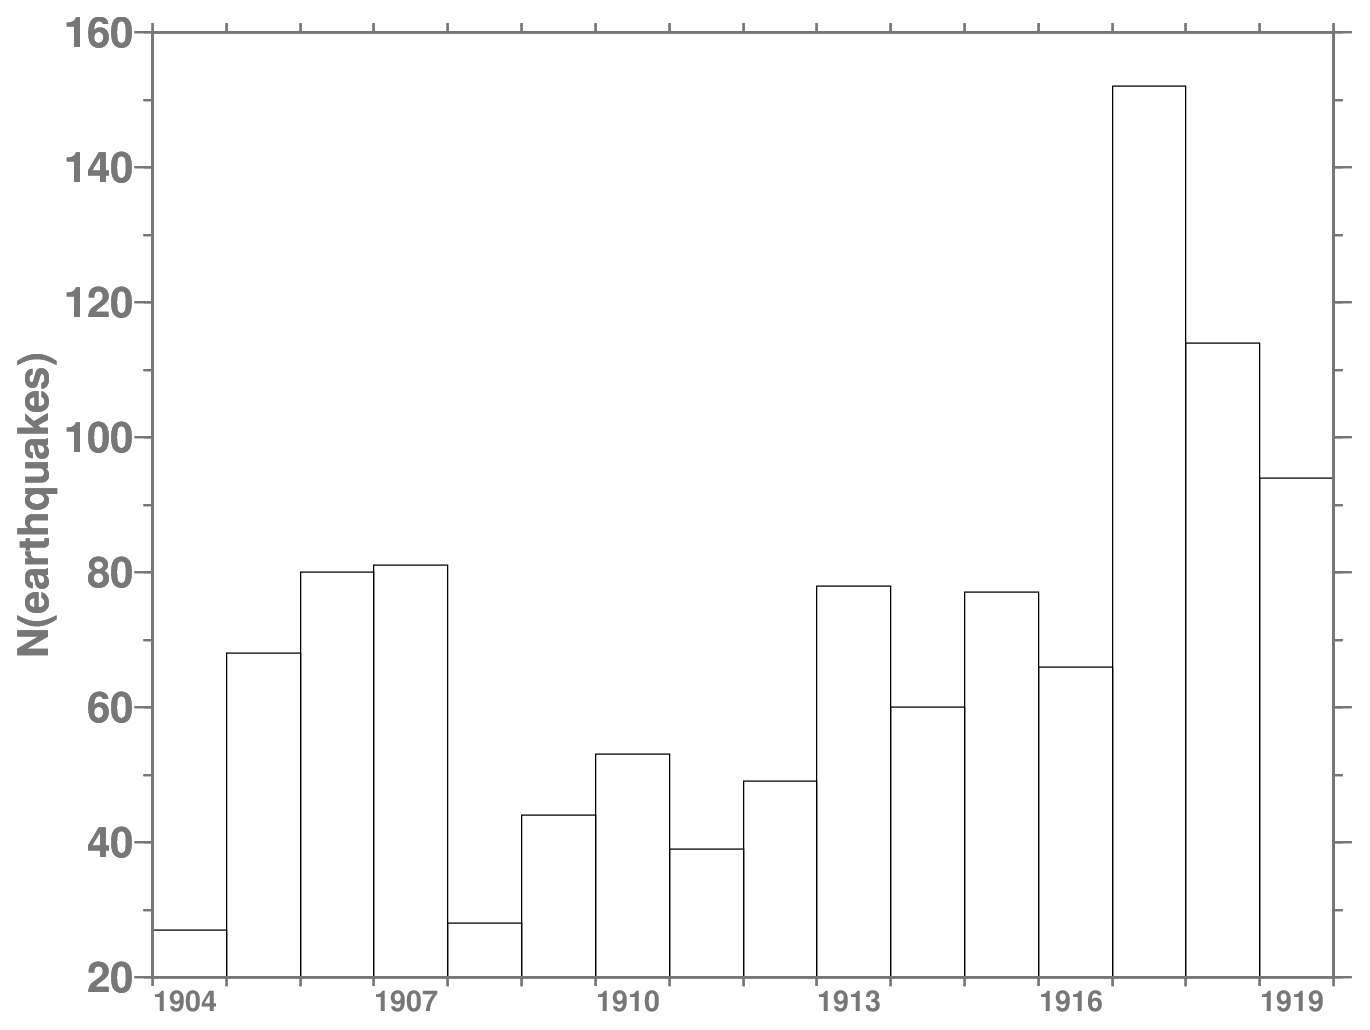
Figure 15Annual number of relocated extension events between 1904 and 1919. See text for details.
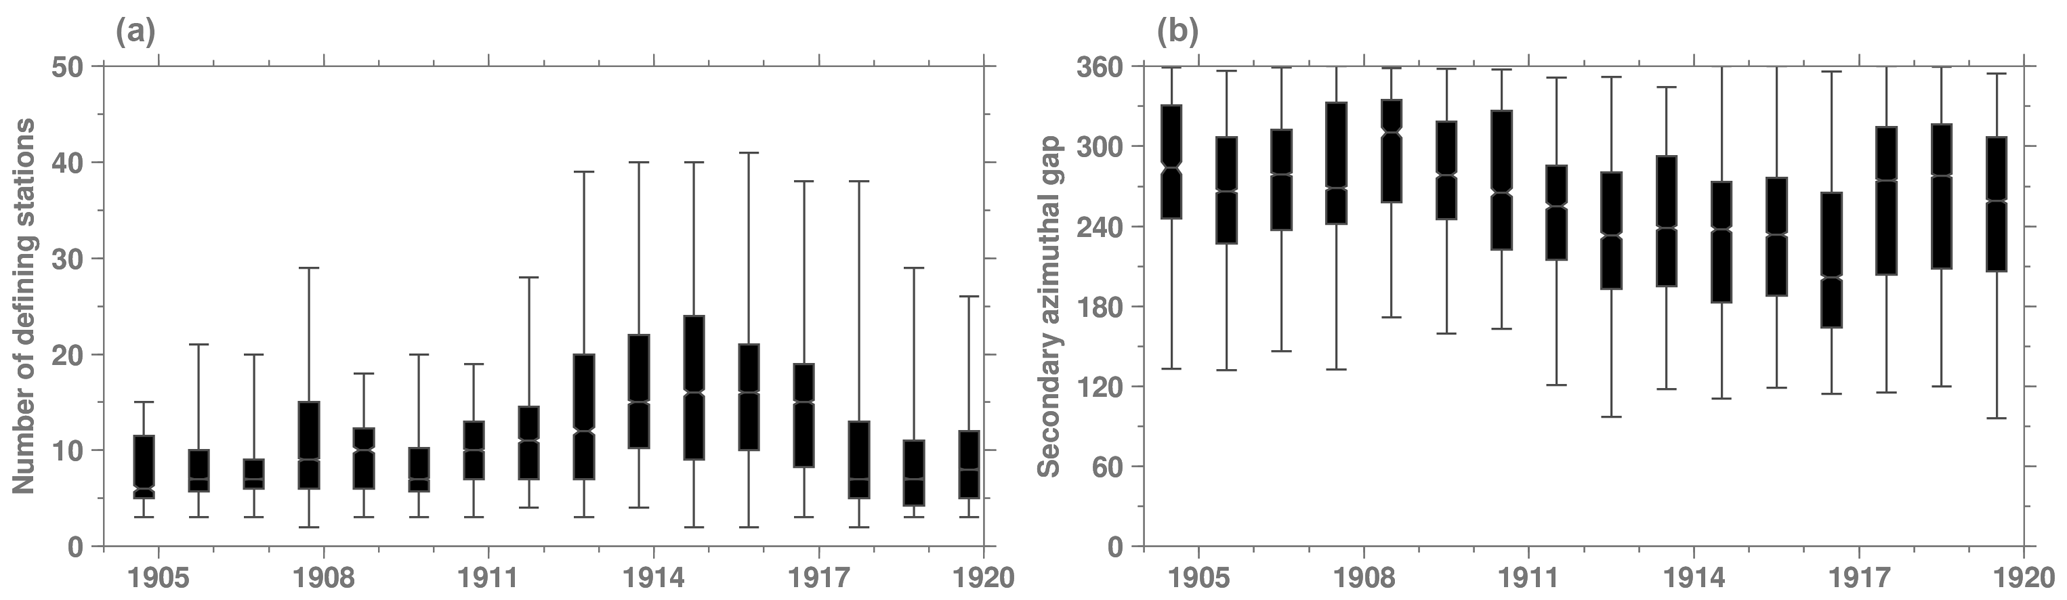
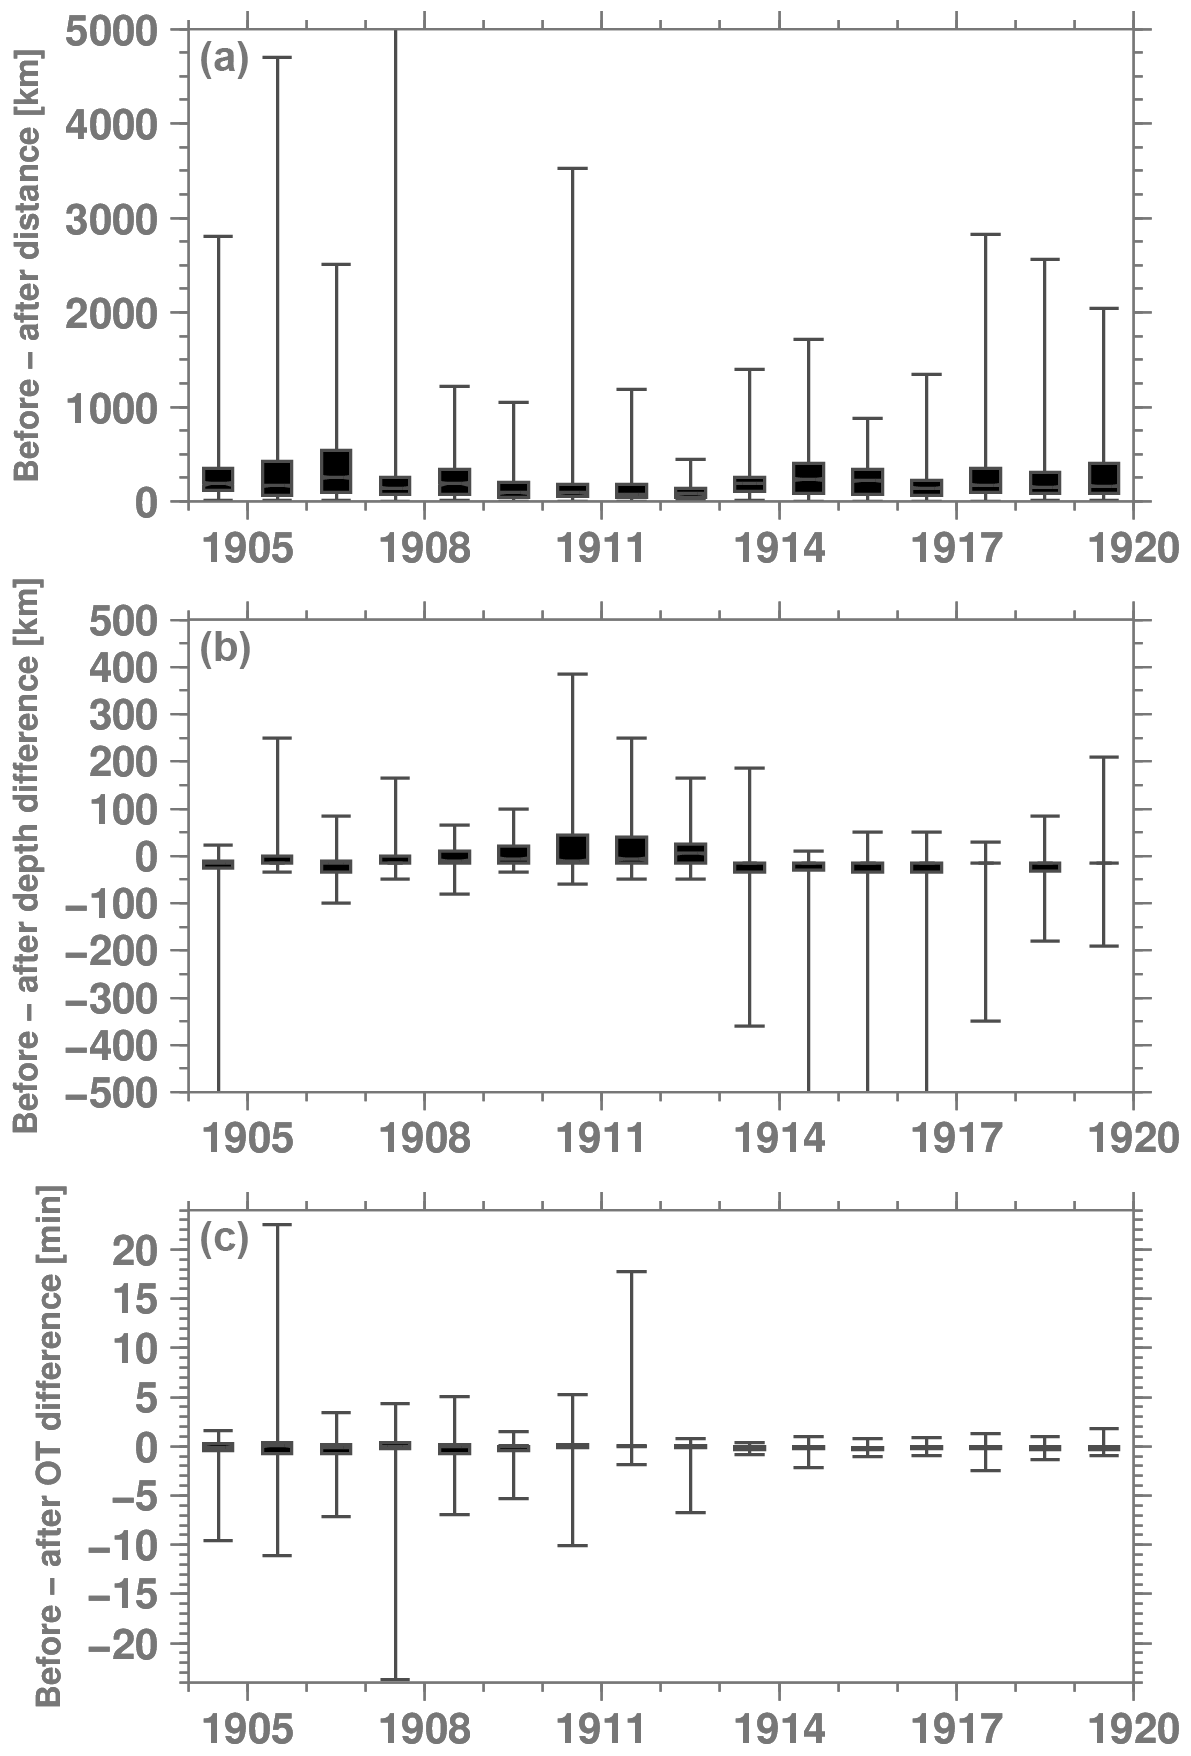
Figure 17Box-and-whisker plots of the epicentre (a), depth (b) and origin time (OT) differences between previous (before, see Fig. 12) and ISC-GEM hypocentres (after) in each year. For 880 of the 1110 extension events relocated between 1904 and 1919 the depth of the previous locations was unknown and nominally set to zero.
Similar to the 1920–1959 period, we assigned location quality flag D if the location was not constrained well enough. This time this task was done not only by considering the usual criteria (see Sect. 3.2) but also consulting available information on the earthquake's effects (e.g. tsunami, damage). In this respect we made systematic use of the earthquake effect information available in UTSU and NGCDC. Table 4 summarises the location and depth quality flags for the relocated extension events between 1904 and 1919. The limitations of the global network in this period are generally more prominent than for 1920–1959 and this translates in most of the earthquakes having location and depth quality C and about 246 of them have location quality D. As for the discarded earthquakes, if additional station data become available we will try to improve the location quality and eventually move some of the location flag D earthquakes from the Supplementary to the Main catalogue. As for Fig. 9, Fig. 18 compares the previous (before) and ISC-GEM locations (after) on global maps for which, again, a general improvement in the earthquakes' distribution along plate boundaries is delineated. This is particularly the case for several global earthquakes along the subduction zone of the Pacific and Indian oceans whose previous locations were hundreds of kilometres away from plate boundaries.
Table 4Summary of the location and depth quality flags for the relocated extension events between 1904 and 1919.
4.3 Magnitude reassessment
Even for this period the magnitude reassessment is mostly based on our recomputed MS. Following the same procedures described earlier, we obtained 927 MS for the relocated extension earthquakes, as shown in Fig. 19. For 500 of them we have computed a magnitude for the first time (in our record). Notably, for 137 earthquakes MS<5.5, whereas MS≥6.5 for 306 of them and >7.5 for 12 of them. The latter includes six earthquakes originally from GUTE, four from ABE and two from BAAS that were not selected for V1 because the magnitudes available were not considered reliable or were below 7.5 (the original cut-off magnitude for the V1 selection before ISS started in 1918). Nearly all earthquakes with MS<5.5 occurred in the European Mediterranean area (because in this period the stations contributing surface wave amplitudes are strongly concentrated in Europe; see Fig. 13). In 1904 the collection of surface wave amplitudes is limited to two stations, GTT (Göttingen) and POT (Potsdam), until December, when we could also add data from station LEI (Leipzig). Consequently, in 1904 we were able to recompute MS for three earthquakes only, all occurring in December. For 18 earthquakes between 1905 and 1919 we accepted MS based on two station magnitudes. Except for four earthquakes for which we have direct Mw values from the Lee and Engdahl (2015) literature search, all recomputed MS values are used as the basis for Mw proxy calculations (Di Giacomo et al., 2015a). Table 5 summarises the counts for the magnitude quality flags for the relocated extension events between 1904 and 1919. About 50 % of the 183 relocated extension earthquakes for which we do not have a magnitude (no direct Mw or recomputed MS) are deep (MS not allowed in our procedures).

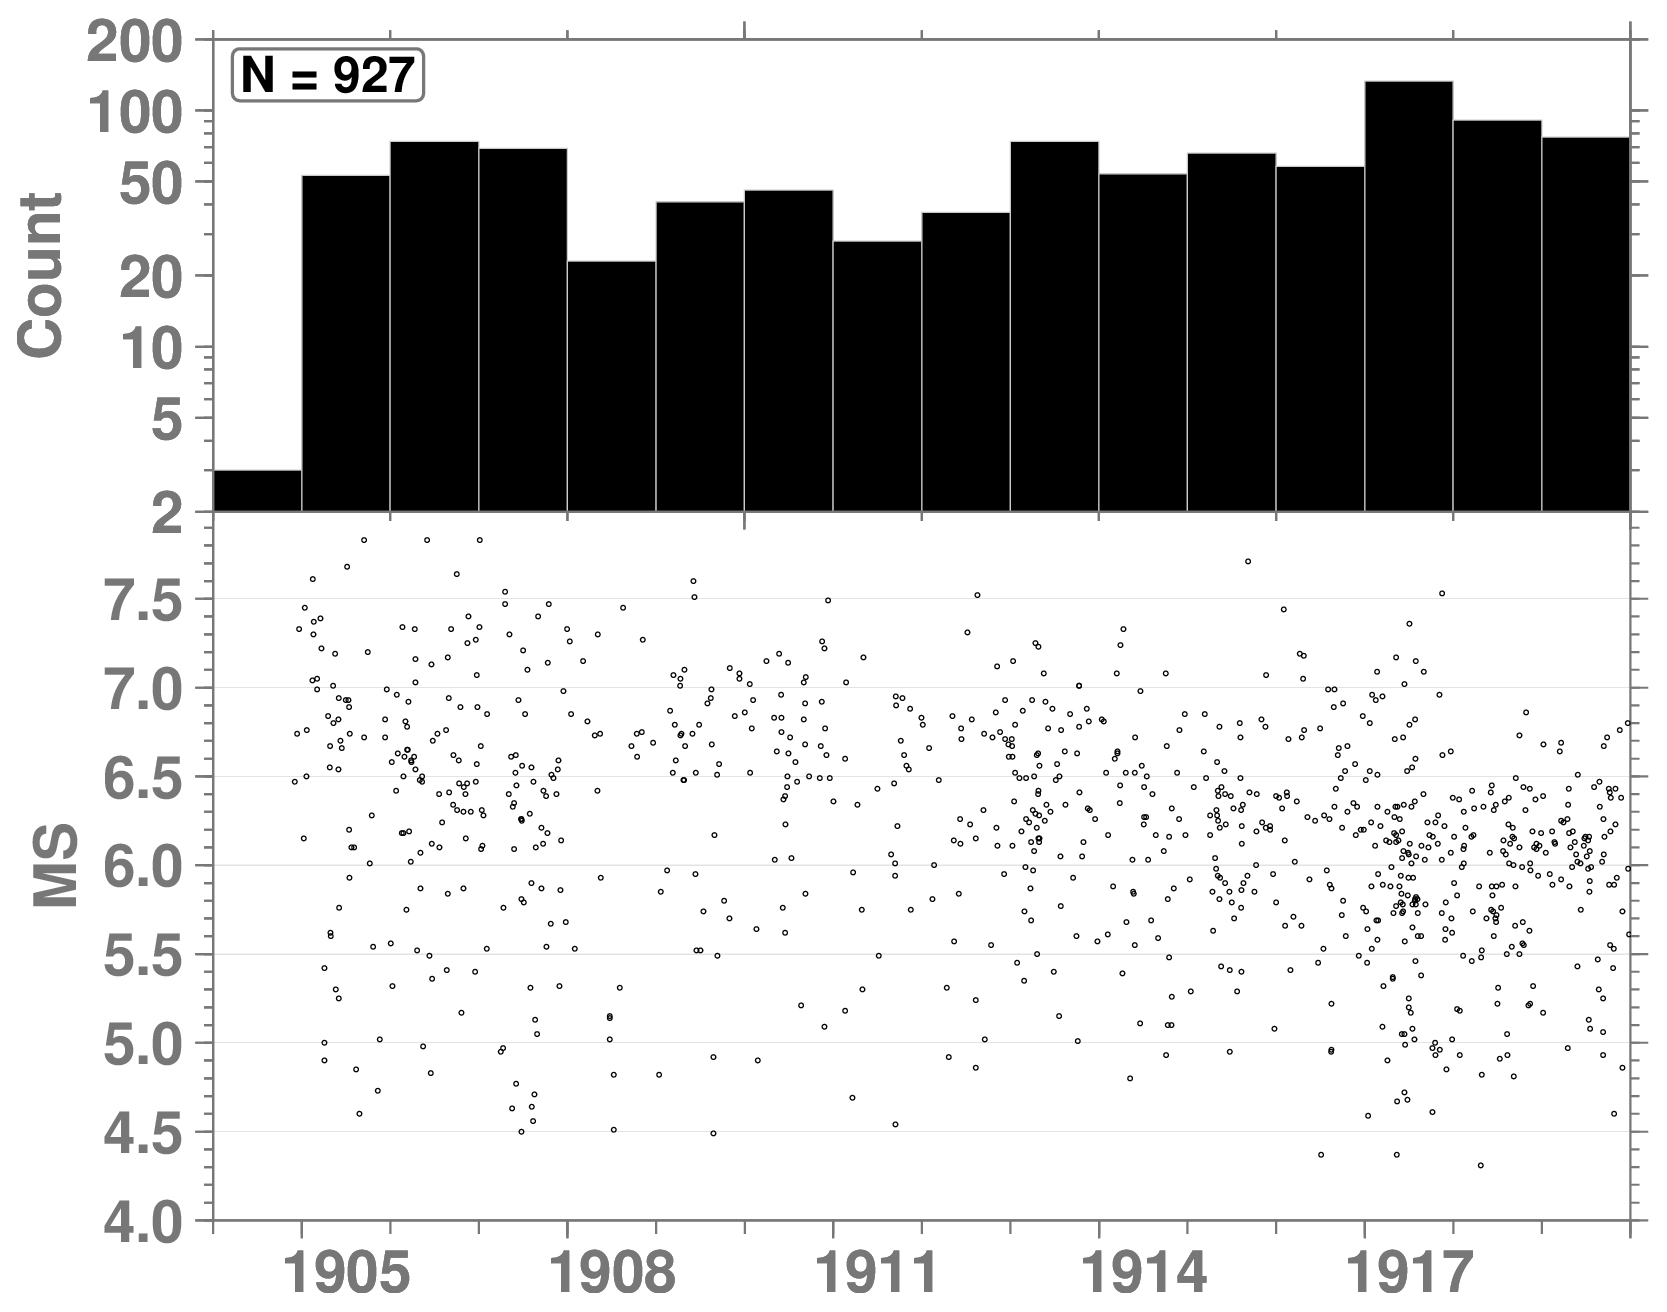
Table 5As for Table 3 but for 1904–1919. Included in the D flag are 183 events for which no magnitude was recomputed.
The extension of the ISC-GEM Catalogue beyond 2009 (last year in V1) benefits from the data already available in the ISC Bulletin and the review of global earthquakes by ISC analysts. The earthquake selection for recent years is based on magnitude (5.5 and above). Table 6 summarises the number of earthquakes added per year during 2010–2014. The relatively high number of earthquakes in 2011 is due to the 11 March Mw=9.1 Tohoku earthquake that was followed by about 120 aftershocks with magnitude 5.5 and above just in the first 24 h. In contrast to the predigital period, global earthquakes in recent years are recorded by a dense global network that usually allows us to constrain the location with hundreds of stations and a relatively small SGAP. This is shown in Fig. 20 (note the difference in scale for the plot of the number of stations compared to Figs. 7 and 16). The ISC-GEM epicentres do not move significantly from the previous ones (ISC locations), although occasional significant changes in depth occur, as shown in Fig. 21.
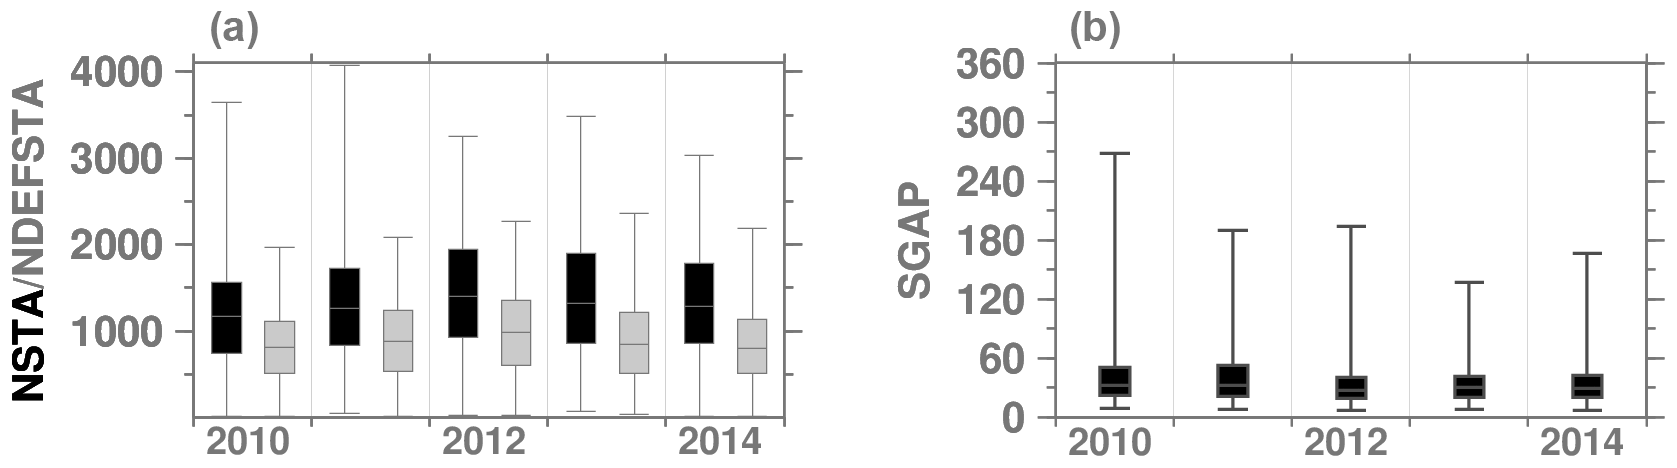
Figure 20Box-and-whisker plots of (a) the number of stations (NSTA, black) and defining stations (NDEFSTA, grey) and (b) of the secondary azimuthal gap (SGAP) in each year for the earthquakes added for the period 2010–2014.
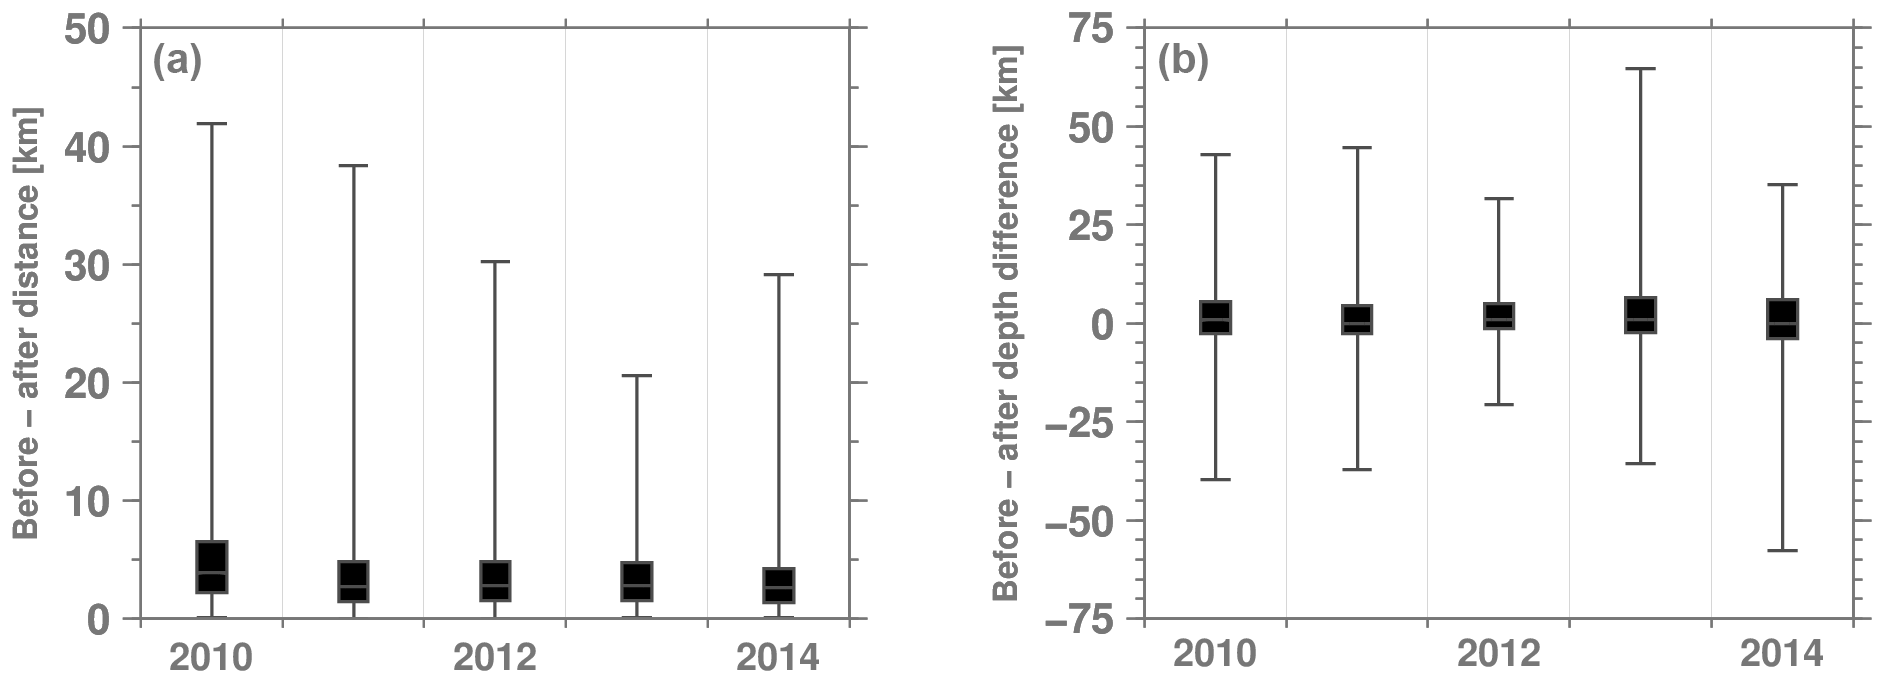
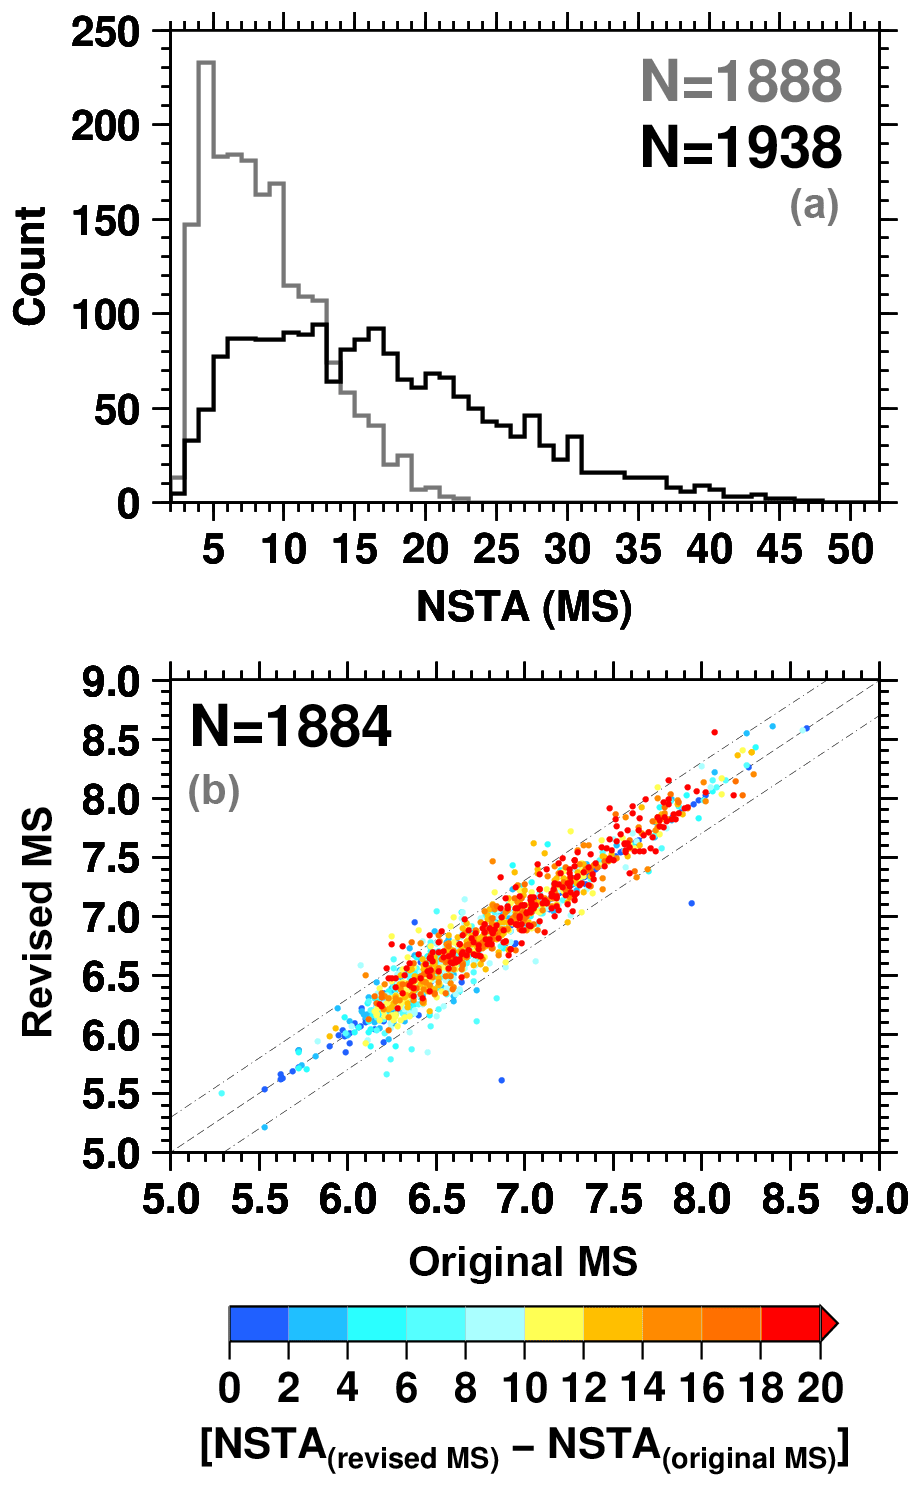
Figure 22(a) Histogram distributions of the number of stations (NSTA) contributing to MS for the pre-1960 earthquakes already in previous versions of the ISC-GEM Catalogue (grey) and after revision (black) using the newly added amplitude data. (b) Comparison between original and revised MS colour-coded by the difference of NSTA used to obtain MS. The black dashed and the dotted-dashed lines are for the 1:1 and the ±0.3 values, respectively. Note that during revision we dropped the MS for four earthquakes.
As to magnitude, we largely list direct Mw from GCMT (2347 earthquakes). Proxy Mw values from recomputed MS or mb are given for 248 earthquakes. The location and magnitudes of these earthquakes will be included in the figures of the section outlining the state of V5.
The ISC-GEM Catalogue comes with a version number that keeps track of the catalogues's updates and/or additions. Even when an earthquake is listed in the catalogue, we continue to look for additional station data and information that could help us to improve, whenever necessary, the earthquakes' parameters we list in the catalogue. At the same time, we cooperate with users of the catalogue who inquire about earthquakes of their interest in different parts of the world, at times resulting in an updated location, depth and/or magnitude for one or more earthquake. Examples of updates we made thanks to users' help are available on the ISC-GEM Catalogue update log web page (http://www.isc.ac.uk/iscgem/update_log, last access: 10 October 2018). We also run internal checks as progress is made with the Rebuild of the ISC Bulletin (Storchak et al., 2017) and/or the ISC-EHB dataset (Weston et al., 2018). We try to keep the number of releases to a minimum and recommend users quote the version number when using the ISC-GEM Catalogue for their studies.
As mentioned before, during the Extension Project we gathered station data (particularly for amplitudes of surface waves) from printed station bulletins that were not available to us. Therefore, during the data collection task of the Extension Project we did not limit the search for amplitude data to extension earthquakes but also to earthquakes that were already listed in previous versions (before V5) of the catalogue. This way we revised the MS of earthquakes already listed in the catalogue even if we added just one or two station readings. Figure 22 shows the number of stations contributing to MS as well as the comparison between original and revised MS for pre-1960 earthquakes already listed in previous versions of the catalogue. The increase in the number of stations contributing to the recomputation of MS is significant: ∼30 % and ∼74 % of the original MS were constrained using fewer than 6 and 11 stations, respectively, whereas with the revised MS these percentages drop to ∼8.5 % and 31 %. Also, the station data added allowed us to gain about 50 earthquakes with MS. About 97 % of the revised MS are within ±0.3 m.u. of the original ones, with only five earthquakes with MS differences above ±0.6 m.u. (often due to originally mis-associated readings, also resulting in the loss of four original MS values).
The new version (V5) of the ISC-GEM Catalogue covers the period 1904–2014 and was released on the ISC website (http://www.isc.ac.uk/iscgem/, last access: 10 October 2018) on 27 February 2018. It is composed of 35 225 earthquakes in total, with 7126 listed in the Supplementary catalogue (about 93 % of them having occurred before 1960). The annual number of events in the Main and Supplementary files is shown in Fig. 23. The magnitude sources are the same four described in Di Giacomo et al. (2015a) and the updated composition is as follows: 45.72 % for Mw from GCMT, 42.85 % for Mw proxy from recomputed MS, 8.1 % for Mw proxy from recomputed mb and, finally, 3.33 % for Mw from the literature search. As outlined in Di Giacomo et al. (2015a), the Mw proxy values based on MS are mostly for pre-GCMT earthquakes (i.e. with few exceptions, before 1976).

Figure 23Annual number of earthquakes in the Main (black) and Supplementary (grey) ISC-GEM Catalogue; from the count of the Supplementary catalogue we have excluded a subset of earthquakes with MS below 5.
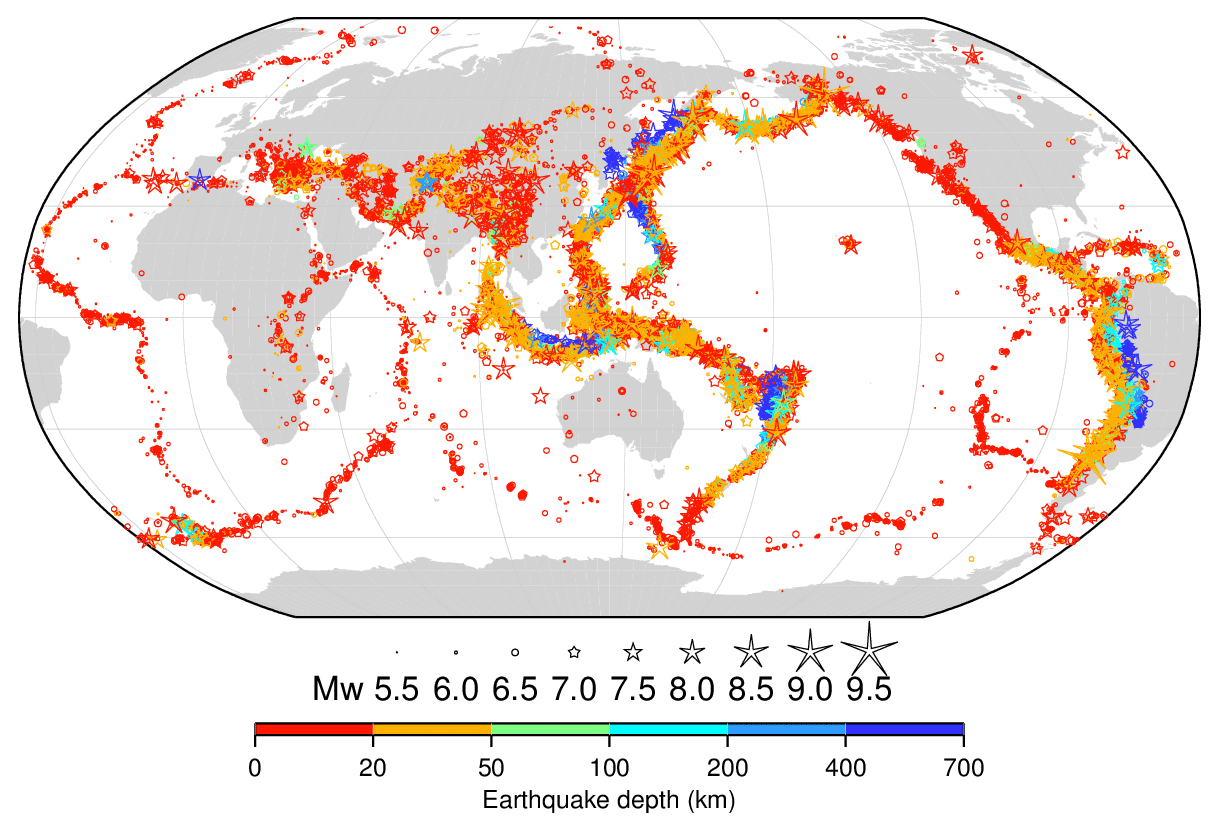
Figure 24Map showing the earthquakes listed in V5 of the ISC-GEM Catalogue (more than 28 000 earthquakes, see Fig. 25). The symbols are plotted according to Agnew (2014) and colour-coded according to the ISC-GEM depth. The earthquakes shown are from the Main catalogue plus those earthquakes in the Supplementary catalogue that have reliable magnitude but poor location (i.e. magnitude quality flag not equal to D and location/depth quality flag equal to D).
The primary use of the ISC-GEM Catalogue is seismic hazard (including calibration of regional seismic catalogues) and Earth's seismicity pattern studies as is it the longest and most homogeneous record of natural global seismicity recorded during the instrumental period. For this reason, in Fig. 24 we plot V5 of the ISC-GEM Catalogue using Agnew (2014) symbols to emphasise the magnitude of the earthquakes in the catalogue. To produce the figure, we included earthquakes in the Main catalogue plus those earthquakes in the Supplementary catalogue that have reliable magnitude but poor location (i.e. magnitude quality flag not equal to D and location/depth quality flag equal to D). The subduction zones and the mid-oceanic ridges are well depicted as are areas where global earthquakes occur more frequently.
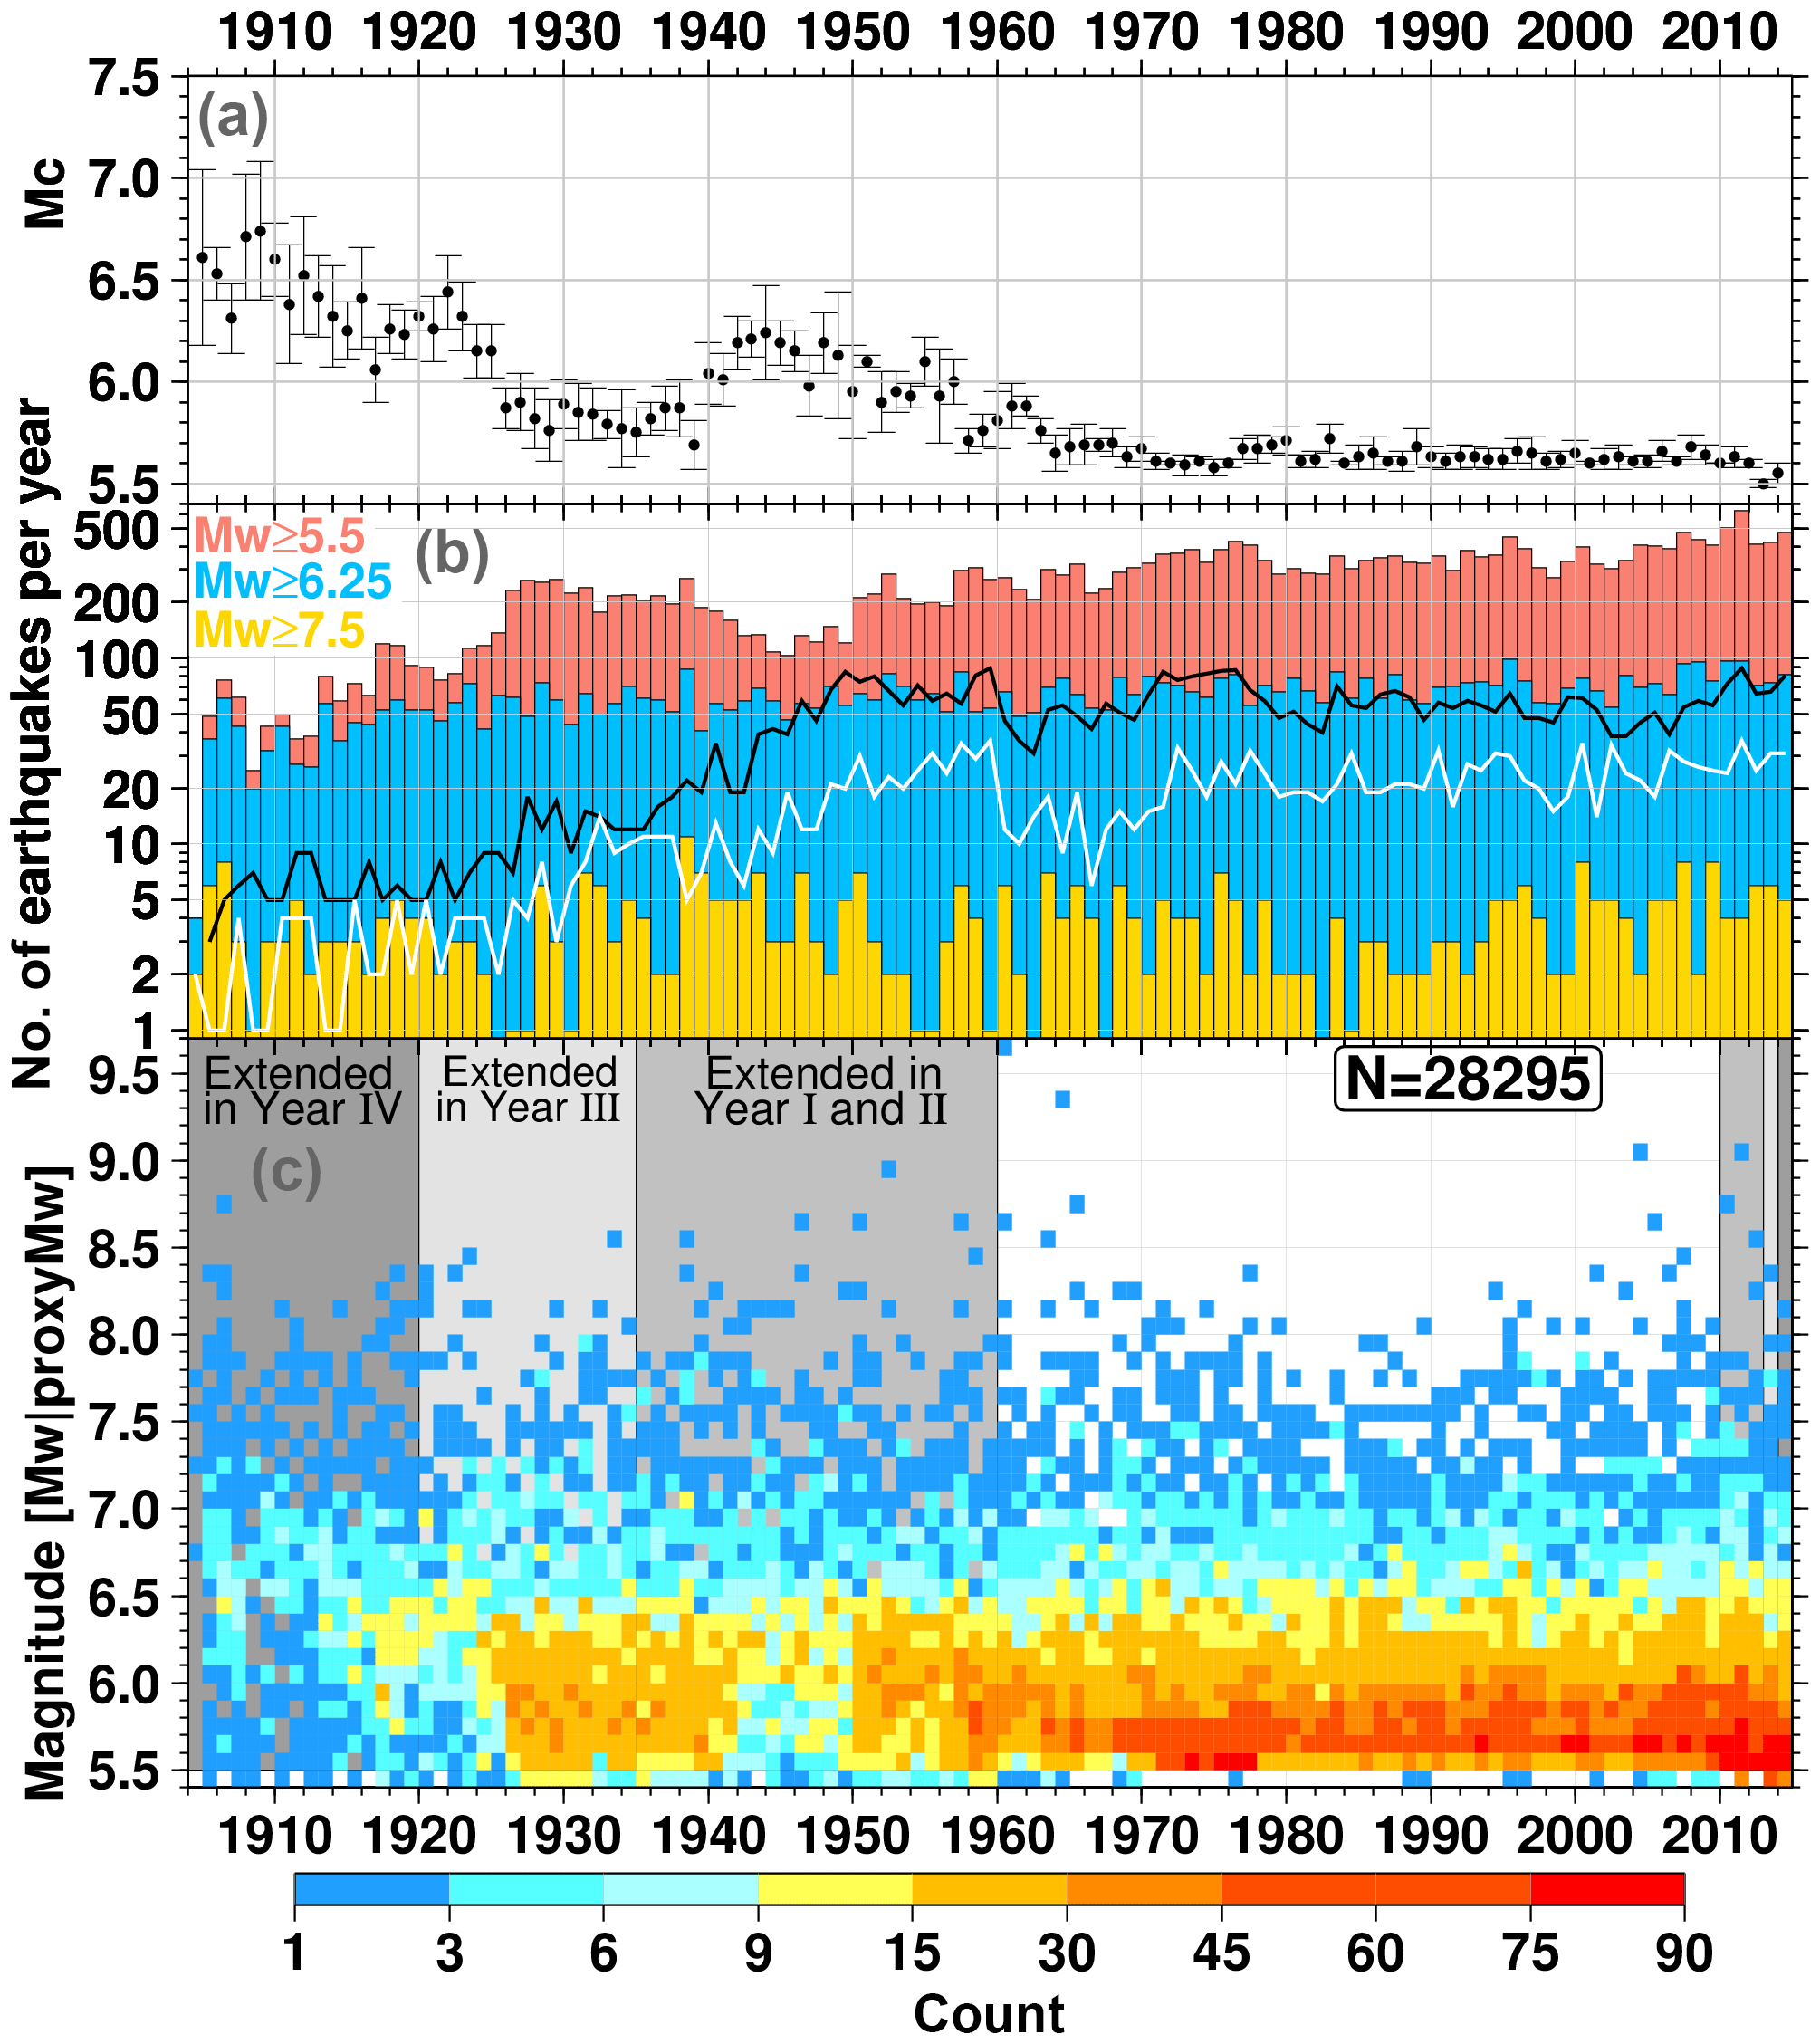
Figure 25(c) Time–magnitude distribution colour-coded for cells of 0.1 m.u. in each year for the earthquakes used to produce Fig. 24. (b) Cumulative annual number of earthquakes with Mw≥5.5 (red), ≥6.5 (blue) and ≥7.5 (yellow), along with the annual counts of intermediate-depth (60 km < depth < 300 km, solid black line) and deep (≥300 km, solid white line) earthquakes; the blue and yellow lines are obtained considering all earthquakes in V5 (i.e. both Main and Supplementary Catalogue). (a) Annual completeness magnitude (Mc, black circles ±1 standard deviation) estimated with the maximum curvature method of Wiemer and Wyss (2000) implemented in the R-code of Mignan and Woessner (2012). Note that we skipped 1904 for the Mc assessment due to the small number of earthquakes.
The current magnitude content as well as a basic magnitude completeness (Mc) assessment is shown in Fig. 25 (update on Fig. 20 of Di Giacomo et al., 2015a). It is not our aim to do a detailed completeness study as Michael (2014); here we use the magnitude content and Mc to highlight the following features of the catalogue.
-
The predigital period is not as complete (average annual Mc varying between 5.7 and 6.8) as more recent decades (average annual Mc between 5.5 and 5.7 since 1964). Important fluctuations in the annual number of earthquakes∕Mc are present in specific periods or years. For example, because of World War II there is a significant decrease in the number of recorded earthquakes (particularly below magnitude 6) consistent with the disruption of the global network during the 1940s; other minor fluctuations are present in almost every decade (e.g. slight rise in Mc in the early 1960s and late 1970s). The fluctuations over time of the number of earthquakes (i.e. variations of Mc) in the full catalogue (especially at the lower magnitudes, below ∼6.5) should be checked before using it in its current status for studies concerning temporal and seismicity patterns.
-
The number of intermediate-depth (between 60 and 300 km) and deep (≥300 km) earthquakes per year before the 1950s–1960s is significantly smaller compared to more recent decades. The reason is not fully clear and will be a matter for further investigation (see Sect. 8). Most likely, it is the result of a combination of factors, which include the detection capability for moderate deep-focus earthquakes of analog seismographs (see, e.g. Kanamori, 1988) deployed around the world before the 1950s, the lack of stations close to subduction zones for many decades (Figs. 2 and 13) and the earthquake selection criteria. For global earthquakes, instruments such as the Wiechert, Bosh-Omori, Maika and Galitzin were able to record surface wave signals (medium period range, centred around 20 s) better than body-waves (higher frequency signals, particularly P-waves, from around 10 s and below). The effect could have been that many stations would not report station data for moderate deep-focus earthquakes and, therefore, the ISS would not compile data for such earthquakes (i.e. the earthquake would not be recorded). The selection criteria could also play a role, although the earthquakes not selected for processing either lack station data (and depth resolution) or, more importantly, are usually too small to account for the small number of deep-focus earthquakes depicted in Fig. 25.
In addition, users should be aware that the magnitude uncertainty for predigital earthquakes is inevitably larger than for earthquakes in the GCMT era (from 1976 onwards). The timeline of the Mw uncertainty in the ISC-GEM Main Catalogue is shown in Fig. 26. This is to further remind users of the full catalogue that, for patterns of seismicity studies, they should be aware of the larger magnitude uncertainty in the first part of last century.
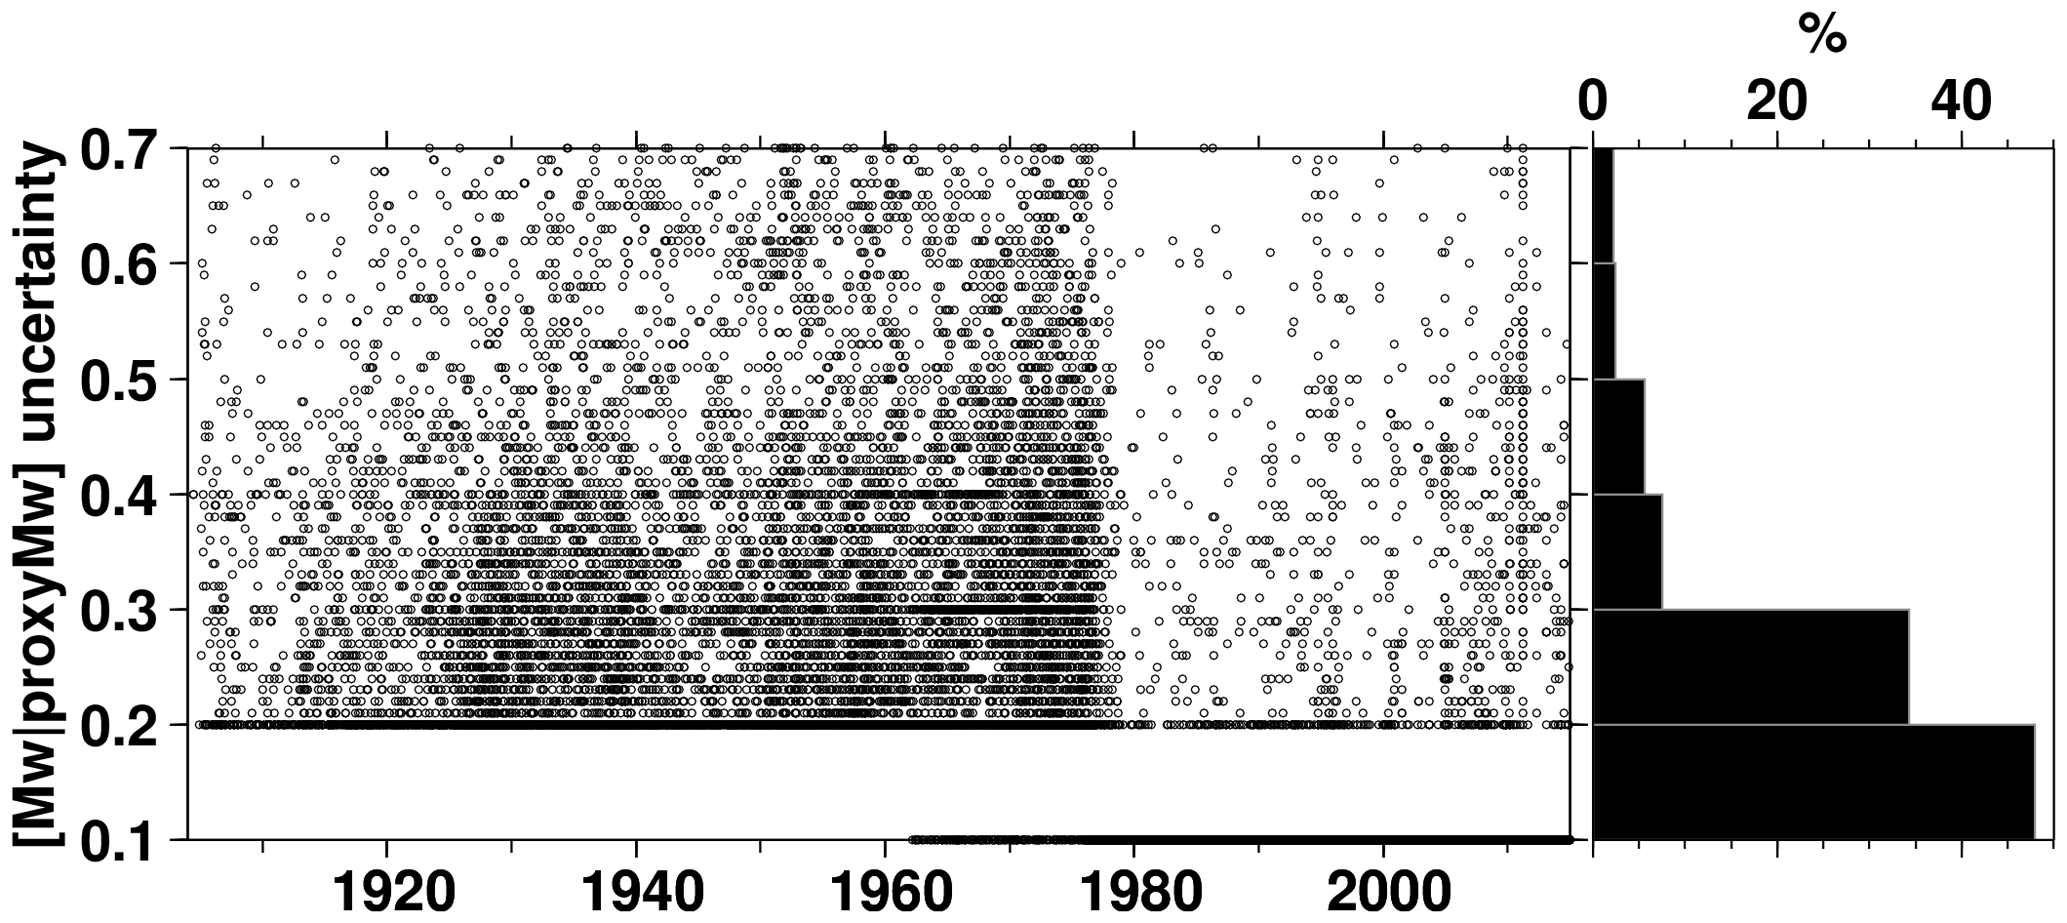
Figure 26Timeline of the magnitude uncertainty in the Main file of the ISC-GEM Catalogue. On the right the percentage distribution is shown.
We plan to continue maintaining the ISC-GEM Catalogue for years to come and work on its advancement by
-
adding recent years (2015 onwards);
-
regularising the magnitude for earthquakes between 1960 and 1990 to remove as many fluctuations as possible in the Mc over those decades;
-
adding earthquakes between magnitude 5 and 5.5 that have occurred in continental areas from 1960 onwards;
-
improving the content for the predigital period (before 1964) by filling gaps in the station reports (particularly for what concerns surface wave amplitudes) and possibly bringing additional earthquakes and station data from the Bureau Central International de Seismologie (BCIS, 1933–1968); we will also consider any other source (if available) not considered so far that will bring useful data (station data and/or earthquake information) that will allow us to improve the catalogue; with this task we aim at moving as many earthquakes as possible from the Supplementary to the Main catalogue (see Fig. 23);
-
integrating the results from the ISC Bulletin Rebuild project (1964–2010; see Storchak et al., 2017) and the ISC-EHB reconstruction (1964 onwards, Weston et al., 2018);
-
continuing and extending our literature search for new or updates of direct estimation of Mw for pre-GCMT earthquakes as well as general focal parameters; we also aim at including fault plane solutions from the literature for predigital earthquakes.
A more detailed description of the Advancement Project of the ISC-GEM Catalogue is available at http://www.isc.ac.uk/iscgem/advancement.php (last access: 10 October 2018). We will continue releasing a new version after the end of each year of the Advancement Project. In this way we will be able to provide the seismological, as well as the broader geoscience community, with the most comprehensive and homogeneous account of earthquake global seismicity recorded instrumentally at any point in time.
Since 27 February 2018, V5 of the ISC-GEM Catalogue has been available for download at http://doi.org/10.31905/D808B825 (International Seismological Centre, 2018). All data used in this paper are maintained at the ISC (http://www.isc.ac.uk/, last access: 10 October 2018). The ISC-GEM Catalogue is released without the associated seismic wave arrival times and amplitudes used for this work. These underlying parametric data are either already available or will be before the end of 2018 as part of corresponding events in the ISC Bulletin (http://www.isc.ac.uk/iscbulletin/, last access: 10 October 2018).
We presented the procedures and results of a 4-year project which extended and improved the ISC-GEM Catalogue first released in 2013 (Storchak et al., 2013). We have added about 12 000 more events between 1904 and 1960 and the new version (V5) ends in 2014 instead of 2009. To extend the catalogue before the 1960s we have digitised ∼650 000 phase arrival times from various sources (ISS, BAAS, ISA, Shide Circulars, Gutenberg notepads, etc.) in different periods and added ∼140 000 amplitudes from printed station bulletins. The features and limitations of the global network before 1960 have been outlined and the results show that the relocations, based on our two-tier approach (Bondár et al., 2015), provide solutions distributed along main tectonic boundaries, even though they are usually based on a small number of stations compared to relocations of earthquakes in recent years. We have recomputed over 6000 MS values for pre-1960 earthquakes and obtained (to the best of our knowledge) a magnitude for the first time for more than 3000 of them. For the period 2010–2014 we have greatly benefited from both the station data available in the ISC Bulletin and the reviews done by ISC analysts which provide us with robust starting points for the relocations and the Mw from the GCMT.
At the same time as the digitisation from printed sources of stations supplying amplitude data (of surface waves in particular), we also looked for additional data for predigital earthquakes (pre-1960) already listed in previous versions of the ISC-GEM Catalogue. The newly added amplitude data made us revise a significant number of pre-1960 earthquakes listed in V1 and improve the magnitude solutions as the revised magnitudes are now based on a much higher number of stations.
The current state of V5 of the ISC-GEM Catalogue has been summarised and its features outlined. With the Advancement project we aim to further improve and extend the catalogue in coming years and address some of the limitations that have been pointed out here during different periods of time.
DDG was the leading author of the paper and responsible for the station data collection, earthquake selection, second step of the relocation task, magnitude reassessment and final checks. ERE provided scientific input and determined the depths and starting locations which were used in the second step of the relocation process. DAS obtained the funding for the project, oversaw its progress and gathered additional station bulletins. All authors contributed to the paper and approved the final version.
The authors declare no competing interests in the production of the ISC-GEM Catalogue.
This project was supported by the NSF (Award 1417970), USGS (Award
G15AC00202), FM Global, OYO Corporation, the Lighthill Risk Network, the
Aspen Re, Bundesanstalt für Geowissenschaften und Rohstoffe (BGR) and 65
members of the ISC (http://www.isc.ac.uk/members/, last access:
10 October 2018). Year I and II of the Extension Project were also supported
by the GEM Foundation. We thank two anonymous reviewers for their comments
that helped us to improve the manuscript. Daniela Olaru and Elizabeth Ayres
were instrumental in the data collection from printed station bulletins and
the ISS. We used computer codes by Antonio Villase to digitise the ISS phase
data. Lynn Elms checked and streamlined the text. We are deeply indebted to
various institutions and individuals that provided additional station
bulletins to the ISC (more details at
http://www.isc.ac.uk/iscgem/acknowledge.php, last access:
10 October 2018). We are grateful to Josep Batlló for sharing additional
data on the 1919 Torremendo (Spain) series (Batlló et al., 2015) and related
discussions which allowed us to correct the corresponding events originally
listed in the ISS. For the Mw literature search we thank Paolo
Harabaglia for pointing out the papers from Pino et al. (2000, 2008) for
two significant earthquakes in Italy (12 December 1908 Messina and 23 July
1930 Irpinia) as well as the centroid solution for the 29 November 1975 Hilo
(Hawaii) earthquake from Nettles and Ekström (2004). Further acknowledgements
to users of the ISC-GEM Catalogue are available at
http://www.isc.ac.uk/iscgem/update_log/ (last access:
10 October 2018). Figures were drawn using the Generic Mapping Tools
(Wessel et al., 2013).
Edited by: David Carlson
Reviewed by: two anonymous referees
Abe, K.: Magnitudes of large shallow earthquakes from 1904 to 1980, Phys. Earth Planet. In., 27, 72–92, https://doi.org/10.1016/0031-9201(81)90088-1, 1981. a, b
Abe, K.: Complements to “Magnitudes of large shallow earthquakes from 1904 to 1980”, Phys. Earth Planet. Int., 34, 17–23, https://doi.org/10.1016/0031-9201(84)90081-5, 1984. a, b
Abe, K. and Noguchi, S.: Determination of magnitude for large shallow earthquakes 1898–1917, Phys. Earth Planet. Int., 32, 45–59, https://doi.org/10.1016/0031-9201(83)90077-8, 1983a. a, b
Abe, K. and Noguchi, S.: Revision of magnitudes of large shallow earthquakes, 1897–1912, Phys. Earth Planet. In., 33, 1–11, https://doi.org/10.1016/0031-9201(83)90002-x, 1983b. a, b
Adams, R. D.: The development of global earthquake seismology, in: Observatory Seismology, edited by: Liteheiser, J. J., Univeristy of California Press, Berkeley, CA, available at: http://ark.cdlib.org/ark:/13030/ft7m3nb4pj/ (last access: 10 October 2018), 1989. a
Agnew, D. C.: Variable Star Symbols for Seismicity Plots, Seismol. Res. Lett., 85, 775–780, https://doi.org/10.1785/0220130214, 2014. a, b
Allen, T. I., Marano, K. D., Earle, P. S., and Wald, D. J.: PAGER-CAT: A Composite Earthquake Catalog for Calibrating Global Fatality Models, Seismol. Res. Lett., 80, 57–62, https://doi.org/10.1785/gssrl.80.1.57, 2009. a, b
Alvarez, L., Lindholm, C., and Villalón, M.: Seismic Hazard for Cuba: A New Approach, B. Seismol. Soc. Am., 107, 229–239, https://doi.org/10.1785/0120160074, 2016. a
BAAS: British Association for the Advancement of Science, Seismological Committee, quarterly issues, 1913–1917. a, b
BAASSC: British Association for the Advancement of Science, Seismological Committee, Circular Nos. 1–27, these circulars are generally known as the “Shide Circulars”, 1900–1912. a
Båth, M. and Duda, S. J.: Some aspects of global seismicity, Tectonophysics, 54, T1–T8, https://doi.org/10.1016/0040-1951(79)90105-7, 1979. a, b
Batlló, J., Martínez-Solares, J. M., Macià, R., Stich, D., Morales, J., and Garrido, L.: The autumn 1919 Torremendo (Jacarilla) earthquake series (SE Spain), Ann. Geophys., 58, S0324, https://doi.org/10.4401/ag-6686, 2015. a
BCIS: Bureau Central International de Seismologie, monthly issues, 1933–1968. a
Bird, P.: An updated digital model of plate boundaries, Geochem. Geophy. Geosy., 4, 1027, https://doi.org/10.1029/2001gc000252, 2003. a
Bondár, I. and McLaughlin, K. L.: A new Ground Truth data set for seismic studies, Seismol. Res. Lett., 80, 465–472, https://doi.org/10.1785/gssrl.80.3.465, 2009. a, b
Bondár, I. and Storchak, D.: Improved location procedures at the International Seismological Centre, Geophys. J. Int., 186, 1220–1244, https://doi.org/10.1111/j.1365-246x.2011.05107.x, 2011. a, b, c
Bondár, I., Myers, S. C., Engdahl, E. R., and Bergman, E. A.: Epicentre accuracy based on seismic network criteria, Geophys. J. Int., 156, 483–496, https://doi.org/10.1111/j.1365-246x.2004.02070.x, 2004. a
Bondár, I., Engdahl, E. R., Villaseñor, A., Harris, J., and Storchak, D.: ISC-GEM: Global Instrumental Earthquake Catalogue (1900–2009), II. Location and seismicity patterns, Phys. Earth Planet. In., 239, 2–13, https://doi.org/10.1016/j.pepi.2014.06.002, 2015. a, b, c, d, e
Cambiotti, G., Wang, X., Sabadini, R., and Yuen, D.: Residual polar motion caused by coseismic and interseismic deformations from 1900 to present, Geophys. J. Int., 205, 1165–1179, https://doi.org/10.1093/gji/ggw077, 2016. a
Deif, A., Al-Shijbi, Y., El-Hussain, I., Ezzelarab, M., and Mohamed, A. M.: Compiling an earthquake catalogue for the Arabian Plate, Western Asia, J. Asian Earth Sci., 147, 345–357, https://doi.org/10.1016/j.jseaes.2017.07.033, 2017. a
Di Giacomo, D., Bondár, I., Storchak, D. A., Engdahl, E. R., Bormann, P., and Harris, J.: ISC-GEM: Global Instrumental Earthquake Catalogue (1900–2009), III. Re-computed MS and mb, proxy MW, final magnitude composition and completeness assessment, Phys. Earth Planet. In., 239, 33–47, https://doi.org/10.1016/j.pepi.2014.06.005, 2015a. a, b, c, d, e, f, g, h, i, j, k, l, m
Di Giacomo, D., Harris, J., Villaseñor, A., Storchak, D. A., Engdahl, E. R., and Lee, W. H.: ISC-GEM: Global Instrumental Earthquake Catalogue (1900–2009), I. Data collection from early instrumental seismological bulletins, Phys. Earth Planet. In., 239, 14–24, https://doi.org/10.1016/j.pepi.2014.06.003, 2015b. a, b, c
Dziewonski, A. M., Chou, T.-A., and Woodhouse, J. H.: Determination of earthquake source parameters from waveform data for studies of global and regional seismicity, J. Geophys. Res.-Sol. Ea., 86, 2825–2852, https://doi.org/10.1029/jb086ib04p02825, 1981. a
Ekström, G., Nettles, M., and Dziewoński, A.: The global CMT project 2004–2010: Centroid-moment tensors for 13,017 earthquakes, Phys. Earth Planet. In., 200-201, 1–9, https://doi.org/10.1016/j.pepi.2012.04.002, 2012. a
Engdahl, E. R. and Villaseñor, A.: Global seismicity: 1900–1999, in: International Handbook of Earthquake and Engineering Seismology, edited by: Lee, W., Kanamori, H., Jennings, J., and Kisslinger, C., vol. A, chap. 41, 665–690, Academic Press, San Diego, 2002. a
Engdahl, E. R., van der Hilst, R., and Buland, R.: Global teleseismic earthquake relocation with improved travel times and procedures for depth determination, B. Seismol. Soc. Am., 88, 722–743, 1998. a, b
Geist, E. L.: Explanation of Temporal Clustering of Tsunami Sources Using the Epidemic-Type Aftershock Sequence Model, B. Seismol. Soc. Am., 104, 2091–2103, https://doi.org/10.1785/0120130275, 2014. a
Ghasemi, H., McKee, C., Leonard, M., Cummins, P., Moihoi, M., Spiro, S., Taranu, F., and Buri, E.: Probabilistic seismic hazard map of Papua New Guinea, Nat. Hazards, 81, 1003–1025, https://doi.org/10.1007/s11069-015-2117-8, 2016. a
Grünthal, G., Wahlström, R., and Stromeyer, D.: The SHARE European Earthquake Catalogue (SHEEC) for the time period 1900–2006 and its comparison to the European-Mediterranean Earthquake Catalogue (EMEC), J. Seismol., 17, 1339–1344, https://doi.org/10.1007/s10950-013-9379-y, 2013. a
Gutenberg, B. and Richter, C.: Seismicity of the Earth and Associated Phenomena, Princeton Univ. Press, Princeton, NJ, 310 pp., 1954. a, b
IASPEI: Summary of Magnitude Working Group recommendations on standard procedures for determining earthquake magnitudes from digital data, available at: ftp://ftp.iaspei.org/pub/commissions/CSOI/Summary_WG_recommendations_20130327.pdf (last access: 10 October 2018), 2013. a
Ikuta, R., Mitsui, Y., Kurokawa, Y., and Ando, M.: Evaluation of strain accumulation in global subduction zones from seismicity data, Earth Planet. Space, 67, 192, https://doi.org/10.1186/s40623-015-0361-5, 2015. a
International Seismological Centre: ISC-GEM Earthquake Catalogue, https://doi.org/10.31905/d808b825, 2018. a
ISA: International Seismological Association, annual volumes, 1904–1908. a, b
ISS: International Seismological Summary, annual volumes, 1918–1963. a
Kadirioğlu, F. T., Kartal, R. F., Kılıç, T., Kalafat, D., Duman, T. Y., Eroğlu Azak, T., Özalp, S., and Emre, O.: An improved earthquake catalogue (M ≥ 4.0) for Turkey and its near vicinity (1900–2012), B. Earthq. Eng., 8, 3317–3338, https://doi.org/10.1007/s10518-016-0064-8, 2016. a
Kagan, Y. Y.: Worldwide earthquake forecasts, Stoch. Env. Res. Risk A., 31, 1273–1290, https://doi.org/10.1007/s00477-016-1268-9, 2017. a
Kagan, Y. Y. and Jackson, D. D.: Earthquake rate and magnitude distributions of great earthquakes for use in global forecasts, Geophys. J. Int., 206, 630–643, https://doi.org/10.1093/gji/ggw161, 2016. a
Kanamori, H.: The importance of historical seismograms for geophysical research, in: Historical Seismograms and Earthquakes of the World, edited by: Lee, W., 16–33, Academic Press, New York, 1988. a
Karnik, V.: Seismicity of the European Area, vol. Part II, Reidel Publ. Co., Dordrecht, Holland, 1971. a
Katsumata, K.: A Long-Term Seismic Quiescence before the 2004 Sumatra (Mw 9.1) Earthquake, B. Seismol. Soc. Am., 105, 167–176, https://doi.org/10.1785/0120140116, 2015. a
Kennett, B. L. N., Engdahl, E. R., and Buland, R.: Constraints on seismic velocities in the Earth from traveltimes, Geophys. J. Int., 122, 108–124, https://doi.org/10.1111/j.1365-246x.1995.tb03540.x, 1995. a
Lange, D., Ruiz, J., Carrasco, S., and Manríquez, P.: The Chiloé Mw 7.6 earthquake of 2016 December 25 in Southern Chile and its relation to the Mw 9.5 1960 Valdivia earthquake, Geophys. J. Int., 213, 210–221, https://doi.org/10.1093/gji/ggx514, 2017. a
Lee, W. H. K. and Engdahl, E. R.: Bibliographical search for reliable seismic moments of large earthquakes during 1900–1979 to compute MW in the ISC-GEM Global Instrumental Reference Earthquake Catalogue, Phys. Earth Planet. In., 239, 25–32, https://doi.org/10.1016/j.pepi.2014.06.004, 2015. a, b, c, d
Leonard, M.: Self-Consistent Earthquake Fault-Scaling Relations: Update and Extension to Stable Continental Strike-Slip Faults, B. Seismol. Soc. Am., 104, 2953–2965, https://doi.org/10.1785/0120140087, 2014. a
Markušić, S., Gülerce, Z., Kuka, N., Duni, L., Ivančić, I., Radovanović, S., Glavatović, B., Milutinović, Z., Akkar, S., Kovačević, S., Mihaljević, J., and Šalić, R.: An updated and unified earthquake catalogue for the Western Balkan Region, B. Earthq. Eng., 14, 321–343, https://doi.org/10.1007/s10518-015-9833-z, 2015. a
Metzger, S., Schurr, B., Ratschbacher, L., Sudhaus, H., Kufner, S.-K., Schöne, T., Zhang, Y., Perry, M., and Bendick, R.: The 2015 Mw 7.2 Sarez Strike-Slip Earthquake in the Pamir Interior: Response to the Underthrusting of India's Western Promontory, Tectonics, 36, 2407–2421, https://doi.org/10.1002/2017tc004581, 2017. a
Michael, A. J.: How Complete is the ISC-GEM Global Earthquake Catalog?, B. Seismol. Soc. Am., 104, 1829–1837, https://doi.org/10.1785/0120130227, 2014. a, b
Mignan, A. and Woessner, J.: Estimating the magnitude of completeness for earthquake catalogs, https://doi.org/10.5078/corssa-00180805, available at: http://www.corssa.org (last access: 10 October 2018), 2012. a
Mikhailova, N. N., Mukambayev, A. S., Aristova, I. L., Kulikova, G., Ullah, S., Pilz, M., and Bindi, D.: Central Asia earthquake catalogue from ancient time to 2009, Ann. Geophys., 58, S0102, https://doi.org/10.4401/ag-6681, 2015. a
National Geophysical Data Center/World Data Service (NGDC/WDS): Significant Earthquake Database, National Geophysical Data Center, NOAA, https://doi.org/10.7289/V5TD9V7K, 1972. a
Nettles, M. and Ekström, G.: Long-Period Source Characteristics of the 1975 Kalapana, Hawaii, Earthquake, B. Seismol. Soc. Am., 94, 422–429, https://doi.org/10.1785/0120030090, 2004. a
Pacheco, J. and Sykes, L.: Seismic moment catalog of large shallow earthquakes, 1900 to 1989, B. Seismol. Soc. Am., 82, 1306–1349, 1992. a
Papazachos, B., Comninakis, P., Karakaisis, G., Karakostas, B., Papaioannou, C., Papazachos, C., and Scordilis, E.: A catalogue of earthquakes in Greece and surrounding area for the period 550BC–1999, Publ. Geophys. Laboratory, University of Thessaloniki, 333 pp., 2000. a
Papazachos, B., Comninakis, P., Scordilis, E., Karakaisis, G., and Papazachos, C.: A catalogue of earthquakes in the Mediterranean and surrounding area for the period 1901–2010, Publ. Geophys. Laboratory, University of Thessaloniki, 2010. a
Pino, N. A., Giardini, D., and Boschi, E.: The December 28, 1908, Messina Straits, southern Italy, earthquake: Waveform modeling of regional seismograms, J. Geophys. Res.-Sol. Ea., 105, 25473–25492, https://doi.org/10.1029/2000jb900259, 2000. a
Pino, N. A., Palombo, B., Ventura, G., Perniola, B., and Ferrari, G.: Waveform modeling of historical seismograms of the 1930 Irpinia earthquake provides insight on “blind” faulting in Southern Apennines (Italy), J. Geophys. Res., 113, B05303, https://doi.org/10.1029/2007jb005211, 2008. a
Poggi, V., Durrheim, R., Tuluka, G. M., Weatherill, G., Gee, R., Pagani, M., Nyblade, A., and Delvaux, D.: Assessing seismic hazard of the East African Rift: a pilot study from GEM and AfricaArray, B. Earthq. Eng., 15, 4499–4529, https://doi.org/10.1007/s10518-017-0152-4, 2017. a
Pollitz, F. F., Burgmann, R., Stein, R. S., and Sevilgen, V.: The Profound Reach of the 11 April 2012 M 8.6 Indian Ocean Earthquake: Short-Term Global Triggering Followed by a Longer-Term Global Shadow, B. Seismol. Soc. Am., 104, 972–984, https://doi.org/10.1785/0120130078, 2014. a
Quinteros Cartaya, C. B., Nava Pichardo, F. A., Glowacka, E., Treviño, E. G., and Dmowska, R.: Forecast of Large Earthquakes Through Semi-periodicity Analysis of Labeled Point Processes, Pure Appl. Geophys., 173, 2571–2585, https://doi.org/10.1007/s00024-016-1338-4, 2016. a
Roth, F., Dahm, T., and Hainzl, S.: Testing stress shadowing effects at the South American subduction zone, Geophys. J. Int., 211, 1272–1283, https://doi.org/10.1093/gji/ggx362, 2017. a
Schweitzer, J. and Lee, W. H. K.: Old seismic bulletins to 1920: a collective heritage from early seismologists, in: International Handbook of Earthquake and Engineering Seismology, edited by: Lee, W., Kanamori, H., Jennings, J., and Kisslinger, C., vol. B, chap. 88, 1665–1723, Academic Press, San Diego, 2002. a, b
Storchak, D., Giacomo, D. D., Engdahl, E., Harris, J., Bondár, I., Lee, W., Bormann, P., and Villaseñor, A.: The ISC-GEM Global Instrumental Earthquake Catalogue (1900–2009): Introduction, Phys. Earth Planet. In., 239, 48–63, https://doi.org/10.1016/j.pepi.2014.06.009, 2015. a, b, c, d, e
Storchak, D. A., Di Giacomo, D., Bondár, I., Engdahl, E. R., Harris, J., Lee, W. H. K., Villaseñor, A., and Bormann, P.: Public Release of the ISC–GEM Global Instrumental Earthquake Catalogue (1900–2009), Seismol. Res. Lett., 84, 810–815, https://doi.org/10.1785/0220130034, 2013. a, b, c
Storchak, D. A., Harris, J., Brown, L., Lieser, K., Shumba, B., Verney, R., Di Giacomo, D., and Korger, E. I. M.: Rebuild of the Bulletin of the International Seismological Centre (ISC), part 1: 1964–1979, Geoscience Letters, 4, 32, https://doi.org/10.1186/s40562-017-0098-z, 2017. a, b
Udías, A. and Stauder, W.: The Jesuit contribution to seismology, Seismol. Res. Lett., 67, 10–19, 1996. a
Utsu, T.: Catalog of Damaging Earthquakes in the World (Through 1989), Utsu, Tokuji, Tokyo, 243 pp., 1990 (in Japanese). a
Utsu, T.: A list of deadly earthquakes in the World: 1500–2000, in: International Handbook of Earthquake and Engineering Seismology, edited by: Lee, W., Kanamori, H., Jennings, J., and Kisslinger, C., vol. A, chap. 42, 691–717, Academic Press, San Diego, 2002. a
Utsu, T.: Catalog of Damaging Earthquakes in the World (Through 2002), the Dbase file distributed at the memorial party of Prof. Tokuji Utsu held in Tokyo, 2004. a
Villaseñor, A. and Engdahl, E.: A digital hypocentre catalog for the International Seismological Summary, Seismol. Res. Lett., 76, 554–559, 2005. a
Weatherill, G., Pagani, M., and Garcia, J.: Exploring earthquake databases for the creation of magnitude-homogeneous catalogues: tools for application on a regional and global scale, Geophys. J. Int., 206, 1652–1676, https://doi.org/10.1093/gji/ggw232, 2016. a
Wessel, P., Smith, W. H. F., Scharroo, R., Luis, J., and Wobbe, F.: Generic Mapping Tools: Improved Version Released, Eos, Transactions American Geophysical Union, 94, 409–410, https://doi.org/10.1002/2013eo450001, 2013. a
Weston, J., Engdahl, E. R., Harris, J., Di Giacomo, D., and Storchak, D. A.: ISC-EHB: reconstruction of a robust earthquake data set, Geophysical J. Int., 214, 474–484, https://doi.org/10.1093/gji/ggy155, 2018. a, b
Wiemer, S. and Wyss, M.: Minimum Magnitude of Completeness in Earthquake Catalogs: Examples from Alaska, the Western United States, and Japan, B. Seismol. Soc. Am., 90, 859–869, https://doi.org/10.1785/0119990114, 2000. a
Ye, L., Lay, T., Kanamori, H., and Koper, K. D.: Rapidly Estimated Seismic Source Parameters for the 16 September 2015 Illapel, Chile M w 8.3 Earthquake, Pure Appl. Geophys., 173, 321–332, https://doi.org/10.1007/s00024-015-1202-y, 2016. a
Zaliapin, I. and Kreemer, C.: Systematic fluctuations in the global seismic moment release, Geophys. Res. Lett., 44, 4820–4828, https://doi.org/10.1002/2017gl073504, 2017. a
Zechar, J. D., Marzocchi, W., and Wiemer, S.: Operational earthquake forecasting in Europe: progress, despite challenges, B. Earthq. Eng., 14, 2459–2469, https://doi.org/10.1007/s10518-016-9930-7, 2016. a
Zhan, Z. and Shearer, P. M.: Possible seasonality in large deep-focus earthquakes, Geophys. Res. Lett., 42, 7366–7373, https://doi.org/10.1002/2015gl065088, 2015. a
- Abstract
- Introduction
- The 4-year plan of the Extension Project
- Extension for the period 1920–1959
- Extension for the period 1904–1919
- Summary of the Extension for 2010–2014
- Review of events that have already been part of the catalogue
- Overall status of the new (V5) ISC-GEM Catalogue
- Outlook
- Data availability
- Conclusions
- Author contributions
- Competing interests
- Acknowledgements
- References