the Creative Commons Attribution 4.0 License.
the Creative Commons Attribution 4.0 License.
 | 11 Oct 2018
Mediterranean Sea climatic indices: monitoring long-term variability and climate changes
Athanasios Theodorou
Sarantis Sofianos
Sylvain Watelet
Charles Troupin
Jean-Marie Beckers
We present a new product composed of a set of thermohaline climatic indices from 1950 to 2015 for the Mediterranean Sea such as decadal temperature and salinity anomalies, their mean values over selected depths, decadal ocean heat and salt content anomalies at selected depth layers as well as their long time series. It is produced from a new high-resolution climatology of temperature and salinity on a 1∕8∘ regular grid based on historical high-quality in situ observations. Ocean heat and salt content differences between 1980–2015 and 1950–1979 are compared for evaluation of the climate shift in the Mediterranean Sea. The two successive periods are chosen according to the standard WMO climate normals. The spatial patterns of heat and salt content shifts demonstrate that the climate changes differently in the several regions of the basin. Long time series of heat and salt content for the period 1950 to 2015 are also provided which indicate that in the Mediterranean Sea there is a net mean volume warming and salinification since 1950 that has accelerated during the last two decades. The time series also show that the ocean heat content seems to fluctuate on a cycle of about 40 years and seems to follow the Atlantic Multidecadal Oscillation climate cycle, indicating that the natural large-scale atmospheric variability could be superimposed onto the warming trend. This product is an observation-based estimation of the Mediterranean climatic indices. It relies solely on spatially interpolated data produced from in situ observations averaged over decades in order to smooth the decadal variability and reveal the long-term trends. It can provide a valuable contribution to the modellers' community, next to the satellite-based products, and serve as a baseline for the evaluation of climate-change model simulations, thus contributing to a better understanding of the complex response of the Mediterranean Sea to the ongoing global climate change. The product is available in netCDF at the following sources: annual and seasonal T∕S anomalies (https://doi.org/10.5281/zenodo.1408832), annual and seasonal T∕S vertical averaged anomalies (https://doi.org/10.5281/zenodo.1408929), annual and seasonal areal density of OHC/OSC anomalies (https://doi.org/10.5281/zenodo.1408877), annual and seasonal linear trends of T∕S, OHC/OSC anomalies (https://doi.org/10.5281/zenodo.1408917), annual and seasonal time series of T∕S, OHC/OSC anomalies (https://doi.org/10.5281/zenodo.1411398), and differences of two 30-year averages of annual and seasonal T∕S, OHC/OSC anomalies (https://doi.org/10.5281/zenodo.1408903).
- Article
(7916 KB) - Full-text XML
- BibTeX
- EndNote


During the twentieth century the Mediterranean Sea has undergone profound and rapid changes. Temperature and salinity have increased with accelerating trends in recent decades (Rohling and Bryden, 1992; Vargas-Yáñez et al., 2010a; Schroeder et al., 2017), reflecting apparently the global warming tendency (Levitus et al., 2012). Because of its geographical position, its small size (reduced volume to area size ratio) and its being enclosed between continents, the Mediterranean Sea is very sensitive and responds faster and more strongly to climate changes than the open ocean, e.g. changes to atmospheric forcings and/or anthropogenic influences (Béthoux et al., 1999; Schroeder et al., 2017). Moreover, the Mediterranean region has been identified as one of the hotspots for future climate change in the world (Giorgi, 2006) where changes are expected to be largest. According to the IPCC (2014) 5th assessment report, the observed global mean sea level (GMSL) has changed since the mid-nineteenth century, with a larger rate than the mean rate during the previous two millennia (high confidence). It is very likely that the mean rate of global averaged sea level rise was 1.7 [1.5 to 1.9] mm yr−1 between 1901 and 2010, 2.0 [1.7 to 2.3] mm yr−1 between 1971 and 2010, and 3.2 [2.8 to 3.6] mm yr−1 between 1993 and 2010. The most important contributions to global and regional mean sea level rise are a) increase in the ocean volume as a result of increase in the mass of the water (due to melting of ice sheets and shrinking of glaciers), and b) increase in the ocean volume as a result of decrease in ocean water density (the ocean expands as it warms). However, ocean observations indicate that the ocean is getting saltier and an increase in density should compensate for the thermal expansion. Recent studies suggest that the water cycle has been amplified because of the global warming, contributing to a saltier ocean (Skliris et al., 2016; Durack and Wijffels, 2010; Durack et al., 2012; Zika et al., 2018). The projected future changes show that the GMSL will continue to rise during the twenty-first century with a rate that will very likely exceed that observed during 1971 to 2010 due to increased ocean warming and increased loss of mass from glaciers and ice sheets. Sea level rise will not be uniform. In the Mediterranean region, climate model projections show an acceleration of warming, salinification as well as sea level rise during the twenty-first century (Somot et al., 2008; Mariotti et al., 2008; Giorgi, 2006; Giorgi and Lionello, 2008; Adloff et al., 2015; IPCC, 2014) with a potential strong impact on the marine environment, its effective management and thus human welfare (IPCC, 2014; Füssel et al., 2017).
In turn, the Mediterranean Sea plays an essential role in influencing the water formation processes and thermohaline circulation in the North Atlantic (Lozier et al., 1995; Béthoux et al., 1998; Rahmstorf, 1998). As a concentration basin (where evaporation exceeds precipitation) it exports at intermediate depths salty water through the Strait of Gibraltar to the Atlantic, a major site of dense water formation for the global thermohaline circulation. In this context, monitoring the changes of the ocean heat content (OHC) and ocean salt content (OSC) of the Mediterranean Sea is of fundamental importance.
The ocean is the dominant component of the Earth's heat balance, and most of the total warming caused by climate change is manifested in increased OHC. Good estimates of past changes in OHC are essential for understanding the role of the oceans in past climate change and for assessing future climate change (IPCC, 2014). However, accurate assessments of the OHC are still a challenge, mainly because of insufficient and irregular data coverage.
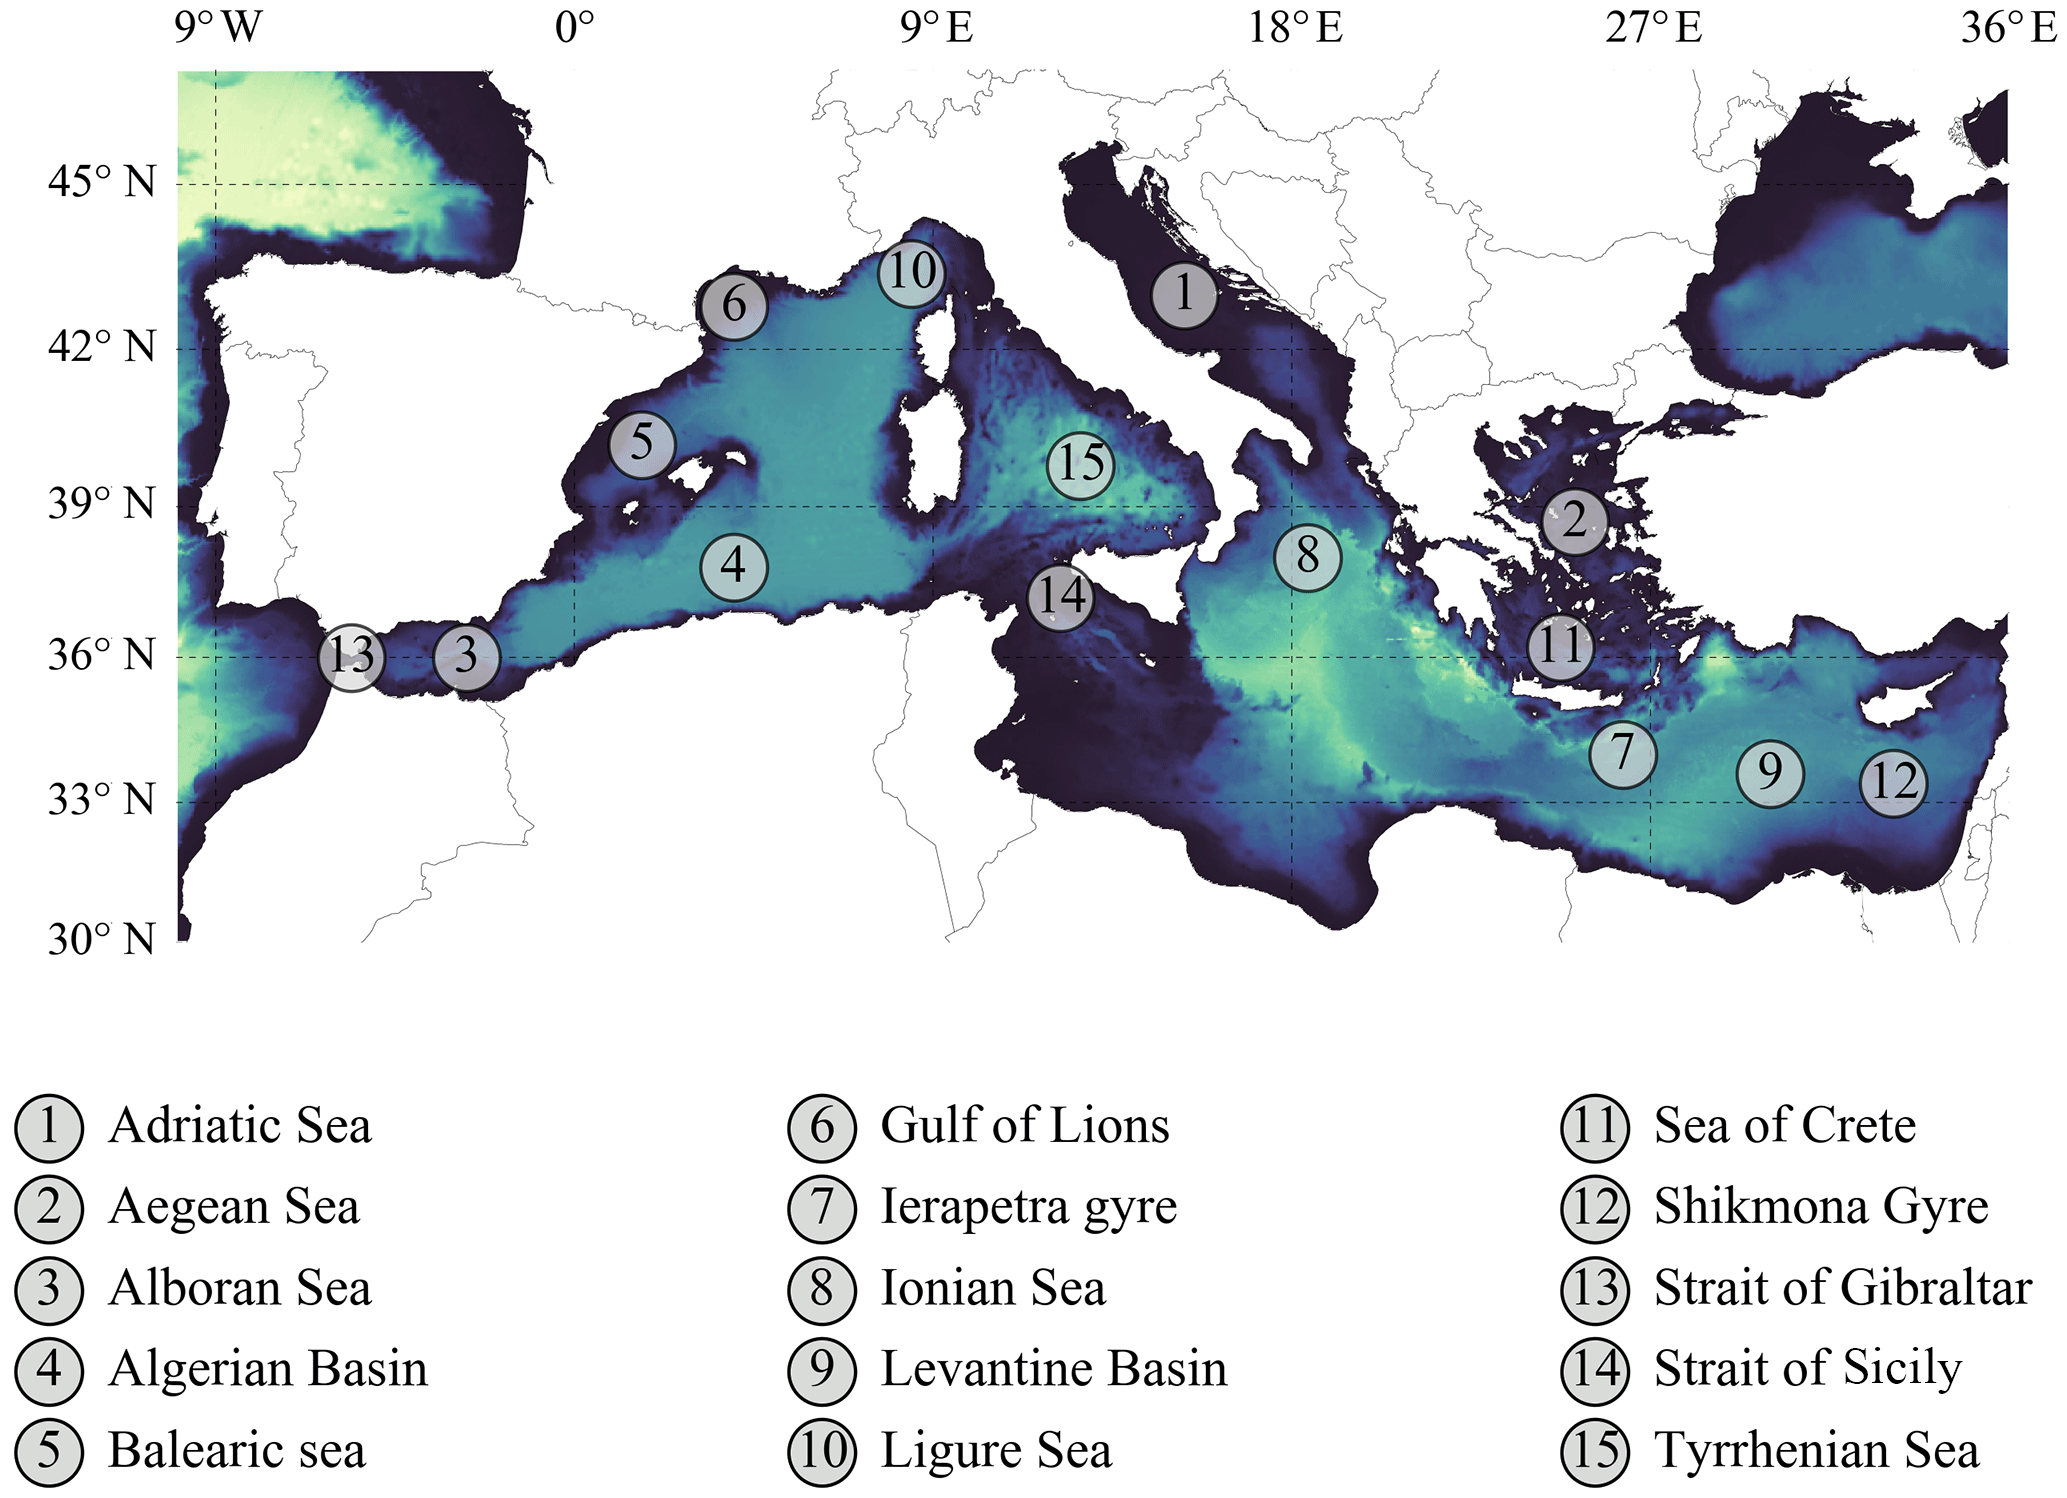
The Mediterranean Sea (Fig. 1) has a very high spatial and temporal variability at all scales, from small turbulence to basin-scale processes (Fusco et al., 2003). Three main water masses are found, the surface, intermediate and deep waters, which form a special flow regime characterized by an active thermohaline (overturning) circulation: (a) one shallow cell that extends over the two basins and communicates directly with the Atlantic Ocean and consists of the inflowing Atlantic Water and the return flow of saltier Mediterranean Water, and (b) two separate deep overturning cells, in the western and eastern basins with several sites of deep water formation, e.g. in the Gulf of Lions in the western and southern Adriatic, and the Aegean Sea in the eastern basin (Tsimplis et al., 2006, and references therein). Complexity arises from multiple driving forces, strong topographic and coastal influences and internal dynamical processes that interact on several temporal and spatial scales (basin, sub-basin and mesoscale) to form an extremely complex and variable circulation. The seasonal, interannual and decadal variabilities are associated with the internal variability of the climatic system. The variability of the atmospheric circulation patterns induces variations in the water masses either by changing temperature and salinity properties through freshwater and heat fluxes or indirectly by changing the main circulation pathways which in turn can produce changes in the preconditioning phases previous to intermediate and deep water production or redistributing salt and heat content in the water column (Schroeder et al., 2012, and references therein).
A major abrupt change has been recorded in the Mediterranean in the last decades which induced important changes to the heat and salt contents. Between the late 1980s and middle 1990s an interannual variation, the Eastern Mediterranean Transient (EMT), strongly influenced the intermediate and deep water masses' pathways and characteristics (Malanotte-Rizzoli et al., 1999; Lascaratos et al., 1999; Klein et al., 1999; Roether et al., 1996). During that event, the circulation of the eastern Mediterranean experienced a dramatic change from the surface layers to the bottom. Dense water of Aegean origin replaced the resident Eastern Mediterranean Deep Water (EMDW) of Adriatic origin. Inducing the uplifting of the Ionian deep waters, the EMT significantly modified the characteristics of the water masses flowing through the Sicily Strait, while the remarkable presence of salty Cretan Intermediate Water (CIW) (Klein et al., 1999) in the Ionian Sea enhanced the salt export from the eastern to western Mediterranean at the end of the 1990s. The EMT affected not only the nearby Tyrrhenian Sea, but also the Western Mediterranean Deep water production (Schröder et al., 2006; Schroeder et al., 2017). After the late 1990s, the dense waters of Aegean origin were no longer dense enough to reach the bottom layer and the Adriatic Sea regained its role as the primary source of dense water (Theocharis et al., 2002; Manca, 2003).
Heat and salt contents are calculated from temperature and salinity differences in relation to mean climatological reference values integrated over a particular reference depth and study area (see the next section for more details). To detect their long-term tendency, long time series extending to more than a few decades are needed in order to identify the natural climate long-term oscillations and quantify any remaining trends related to global warming. In small areas where the data coverage is sufficient, OHC/OSC changes are calculated directly from the in situ measurements. But at the large basin scale, where the coverage is not good enough, we need to interpolate the data to fill the gaps. In such cases, the noise from the interpolation schemes is an additional source of uncertainty. Levitus (2000), in using the World Ocean Database (https://www.nodc.noaa.gov/OC5/WOD/pr_wod.html, last access: 9 October 2018), was the first who spoke about the warming of the global oceans and quantified the interannual-to-decadal variability of the heat content. Since then, periodical updates are released based on additional data, updated estimations of corrections for the time-varying systematic bias in expendable bathythermograph data and corrections of some ARGO float data. The first publication on the time-dependent warm bias of the bathythermograph data was by Gouretski and Koltermann (2007). The proposed corrections were included in the World Ocean Database and in Levitus et al. (2009). Levitus showed that the proposed corrections of bathythermographs reduce the interdecadal variability but that the long-term trends remain similar (Levitus et al., 2009). An analogous study in the Mediterranean showed that including or not the bathythermographs in the OHC estimates of the western Mediterranean does not significantly change the results (Vargas-Yáñez et al., 2010b). Levitus et al. (2012) reported that for the period 1955–2010, the heat content of the world ocean for the 0–2000 m layer increased by J, corresponding to a rate of 0.39 W m−2 (per unit area of the world ocean) and a volume mean warming of 0.09 ∘C. This warming corresponds to a rate of 0.27 W m−2 per unit area of the Earth's surface. The heat content of the world ocean for the 0–700 m layer increased by J, corresponding to a rate of 0.27 W m−2 (per unit area of the world ocean) and a volume mean warming of 0.18 ∘C. They also reported that the 0–700 m ocean layer accounted for approximately one-third of the warming of the 0–2000 m layer of the world ocean (Levitus et al., 2012). It is worth mentioning that the ARGO array of profiling floats (their deployment started in 2000) improved significantly the in situ observations' spatial coverage and the subsequent assessments for 0–2000 m, but there are still many regional seas uncovered (observations in these seas come mainly from hydrographic cruises).
In the Mediterranean, many works since the late 1980s have been carried out trying to quantify the trends of temperature and salinity and determine which causes underlie these (such as global warming or anthropogenic climate change due to main rivers damming). Table 1 in Vargas-Yáñez et al. (2008) and Manca et al. (2004), and Table 1 in Skliris et al. (2018), summarize the main findings. An analysis of these results shows that there are differences between them arising from (a) the input data (in situ or interpolated data or model or satellite), (b) their spatial and temporal variability, (c) the choice of the climatological reference, (d) the quality control procedures, (e) the instruments' accuracy, and (f) the mapping techniques, e.g. the gridding and infilling methodologies such as optimal interpolation or variational inverse methods used to fill the data gaps and obtain a gridded 3-D continuous field and time series thereafter as well as which assumptions are made in areas of missing data (Jordà et al., 2017).
Some of the above findings are outlined below. The increasing trend is more evident in the salinity than the temperature. The temperature and salinity of the deep waters of the western Mediterranean are increasing. In the eastern Mediterranean, for the intermediate layer there is no general consensus. Rixen et al. (2005), using the MEDATLAS climatology (MEDAR Group, 2002), found an increase in OHC and OSC of about [1.3–1.5] 1021 J and [1.4–1.6] 1014 PSU m3, respectively, over the whole Mediterranean for the period 1950–2000, corresponding to volume mean T and S anomalies of about [0.09–0.10] ∘C and [0.035–0.04], respectively. During the last decades, the western Mediterranean OHC and OSC have been increasing with an accelerating tendency of the western deep waters towards higher temperatures and salinities since the 1950s, with the process accelerating after the second half of the 1980s. The variation of the intermediate layers is attributed to decadal variability. Skliris et al. (2018) identified a strong basin-scale multi-decadal salinification, particularly in the intermediate and deep layers of order 0.015 practical salinity scale(pss) decade−1, by analysing the inter-annual objectively analysed gridded fields from EN4 from the Met Office Hadley Centre (subversion En4.1.1., http://www.metoffice.gov.uk/hadobs/en4, last access: 9 October 2018) and MEDAR/MEDATLAS climatology (MEDAR Group, 2002), for two reference periods, 1950–2002 and 1950–2015. Schroeder et al. (2016), analysing in situ data, found that over the period 1950–2010, the deep Western Mediterranean Deep Water heat and salt contents increased almost steadily, with an acceleration after the mid-1980s. Below 1000 m, the Mediterranean underwent the strongest salinity gain in the world ocean (Skliris et al., 2014).
The objective of this work is to provide estimates of T∕S and OHC/OSC variations using the latest SeaDataNet historical data sets combined with a modern, numerically efficient interpolation technique that takes into account constraints such as physical boundaries. The new product is expected to give a more detailed insight into the spatial pattern of the changes for the whole Mediterranean and the decadal variability of OHC/OSC. The originality of this product compared to the existing ones is that we (a) use a higher spatial and temporal resolution for gridded fields of T∕S anomalies, (b) provide a large, basin-scale spatial pattern for the trends of the decadal T∕S and OHC/OSC anomalies, (c) provide long-term time series of the decadal anomalies, and (d) provide 30-year averages for evaluating the climate shift in the Mediterranean. The finer spatial resolution of the input data climatology filters out the noise induced by the mesoscale features, but at the same time is such that it smoothes less the large-scale features. The temporal resolution is such that it smoothes the strong seasonal, interannual and decadal variability so that the final product is able to resolve in more detail the climatic variability and identify possible warming trends. Three layers were considered in this work as representative of the main water masses found in the Mediterranean: 0–150, 150–600, and 600–4000 m, respectively, for the surface, intermediate and deep waters, as in Robinson et al. (2001), and one additional 0–4000 m for the whole water column and volume assessments.
2.1 Data sources
Gridded horizontal fields from a new high-resolution climatology of temperature and salinity for the Mediterranean (Iona et al., 2018) were used as input data. These fields were produced using the SeaDataNet temperature/salinity historical data collection V2 (Simoncelli et al., 2015, available at http://sextant.ifremer.fr/record/8c3bd19b-9687-429c-a232-48b10478581c/, last access: 9 October 2018). The SeaDataNet collection comprises 213 542 temperature and 138 691 salinity profiles from in situ measurements for the 1911 to 2015 period. The gridded fields cover the geographical region 6.25∘ W–36.5∘ E, 30–46∘ N on 31 standard depth levels from 0 to 4000 m: [0, 5, 10, 20, 30, 50, 75, 100, 125, 150, 200, 250, 300, 400, 500, 600, 700, 800, 900, 1000, 1100, 1200, 1300, 1400, 1500, 1750, 2000, 2500, 3000, 3500, 4000]. The spatial resolution is . The seasonal scale is winter (January–March), spring (April–June), summer (July–September), and autumn (October–December). The gridding of the in situ observations was done with the Data Interpolating Variational Analysis (DIVA) software tool that allows the spatial interpolation of data in an optimal way, comparable to optimal interpolation (OI) using a finite-element method (Beckers et al., 2014; Troupin et al., 2012).
The time filtering applied to the in situ observations (decadal averaging) results in spatial correlations found in the data of the order 300–350 km, much larger than the Rossby radius of the deformation scale (10–15 km) associated with mesoscale motions. The mesoscale features and other smaller patches are therefore filtered out and the climatologies used for the indices' calculations focus on the variability of the large-scale features. The influence of the uneven distribution in space where a large number of data points are concentrated in a very small area and within a very short period is controlled by applying different weights (and lower than 1) to each of these data points because such points cannot be considered independent in a climatological analysis. The characteristic length of weighting was set to be equal to 0.08∘ (in the same units as the data locations) and the characteristic time of weighting was set to be equal to 90 days (3 months). Detrending was applied in the observations used for the reference climatologies in order to remove the uneven spatial distributions in time.
The input gridded data are listed below. They are stored in netCDF files and are accessible from the Zenodo platform, a research platform where papers, data, software codes or any other object contributing to the reproducibility of scientific results can be uploaded and then cited using a digital object identifier (DOI).
-
Annual climatology (reference), obtained by analysing all data (regardless of month or season) for the whole period from 1950 to 2015. This climatology is used as a mean reference that is subtracted from the annual decadal climatology to obtain the T∕S anomalies. It is available here: https://doi.org/10.5281/zenodo.1146976 (Iona, 2018a).
-
Annual decadal climatology, obtained by analysing all data regardless of month or season for each of the 57 running decades from 1950–1959 to 2006–2015. It is available here: https://doi.org/10.5281/zenodo.1146957 (Iona, 2018b).
-
Seasonal climatology (reference), obtained by analysing all data of the whole period from 1950 to 2015 falling within each season. This climatology is used as a mean reference that is subtracted from the seasonal decadal climatologies to obtain the T∕S anomalies. It is available here: https://doi.org/10.5281/zenodo.1146953 (Iona, 2018c).
-
Seasonal decadal climatology, obtained by analysing all data falling within each season for each of the 57 running decades from 1950–1959 to 2006–2015. It is available here: https://doi.org/10.5281/zenodo.1146938 (Iona, 2018d).
The input data used for the current work have already been evaluated with existing comparable products in the region such as SeaDataNet 2015 and WOA13 monthly climatologies, along with MEDAR/MEDATLAS 2002 monthly and decadal climatologies, and are of higher spatial and temporal resolution (Iona et al., 2018). It is important to note that in the used input climatology, each gridded field is accompanied by an error field that allows one to assess the reliability of the input data. This helps to objectively identify areas with poor data coverage, mask them and exclude them from further processing.
2.2 Definitions
- Anomalies
-
In all products, temperature and salinity anomalies have been used. Anomaly is defined as the difference between the value of a grid point and a mean climatological reference.
- Mean climatological references
-
-
Annual climatology used as a reference for the annual decadals.
-
Seasonal climatology used as a reference for the seasonal decadals.
-
- Climates
-
The World Meteorological Organization (WMO) recommendation of using 30-year averages (climate normals) to describe climate conditions was used in this study (WMO, 2011). Climate shift is defined as the difference between two successive 30-year averages.
- Linear trends
-
They were computed by linear regression with a constant term.
It is noted that in the climate shifts presented in this work, the period 1950 to 1979 contains 3 decades and the period 1980 to 2015 contains 6 years more because the period from 2000 to 2015 is treated as a decade. This was done for two reasons: (a) not to exclude the recent data from the representations of the regional patterns of the climate shifts (or the oldest ones if the study period was shifted later than 1950), and (b) the averaging of the additional recent years actually does not change the qualitative results of the comparison of the two successive periods. Concerning the quantitative differences, Tables 1 and 2 below show, for the two different averaging periods, the mean values of the climate shifts for OHC and OSC areal density over the whole Mediterranean. It can be seen that the inclusion of the additional recent years (about 15 000 additional T∕S on the about 150 000 T and 100 000 S profiles of the period 1980–2009) actually reduces the T changes of the first 600 m. The user of course can choose between any period and average the decades according to their needs of each study since the available product includes all 57 running decades from where the climates are computed.
Table 1Mean values for the whole Mediterranean for areal density of ocean heat content in 109 J m−2.
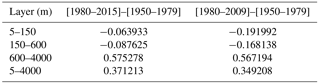
Table 2Mean values for the whole Mediterranean for areal density of ocean salt content in 102 ppt m.
2.3 Process outline
First, seasonal and annual decadal fields of temperature and salinity anomalies (T∕S) at each standard depth were generated. Next, T∕S vertical averages were calculated for the four layers, 0–150 m (and 5–150 m in the case of the annual fields), 150–600, 600–4000, and 0–4000 m. The thickness of the layers was used as weights for the vertical averaging calculated as half of the distance between adjacent depths. The following weights were used for the 31 standard depth levels: 2.5, 5, 7.5, 10, 15, 22.5, 25, 25, 25, 37.5, 50, 50, 75, 100, 100, 100, 100, 100, 100, 100, 100, 100, 100, 100, 175, 250, 375, 500, 500, 500, 500. In the case of the annual fields, 30 weights are used starting from the second value (5). The used weights are available with the netCDF files used for the computation of the indices. For the estimation of the OHC anomalies the following methodology was used. Each T∕S anomaly at each standard depth is associated with a volume which consists of the area of the longitude–latitude grid multiplied by the thickness of each layer, e.g. the vertical weights. By multiplying the volume by the T anomalies, by the density of seawater, and by the specific heat, we obtain the OHC anomaly of a specific grid point at each standard depth. By integrating over a depth layer and over all of the analysis area, we obtain the OHC anomaly (in Joules) for the whole Mediterranean Sea according to the following equation:
The areal density of OHC (in J m−2) is obtained by integrating the vertically averaged T anomaly over a depth layer according to the equation
where ρ=1028 kg m−3 is the density of reference seawater, Cp=3985 J kg−1 ∘C the specific heat of seawater, n the number of grid cells and almost the same as the number of grid points as nx= length(lon), ny= length(lat) and , dx=10951.1 m, dy=13897.2 m, ΔT the temperature anomaly, and z1 and z2 the upper and lower depths. In the current climatologies density and specific heat of seawater are not calculated separately, but it would be possible to derive them from T and S gridded fields. Such calculations will be available in future releases of the indices. The dx, dy are the longitude (), latitude () steps of the output grid transformed from degrees to metres. A mean basin volume is estimated at 3.86×10¹⁵ m3 and corresponds to the mean wet volume of the analysis grid of the interpolation. For the OSC, the same methodology is used except that we do not multiply by (ρ Cp), the term that converts temperature to thermal energy (heat). The OSC (in ppt m3) is given from the equation
and the areal density of OSC (in ppt m) from the following equation:
2.4 Climatic index content
The produced climatic indices for the whole Mediterranean Sea (6.25∘ W–36.5∘ E, 30–46∘ N) consist of the following.
-
Annual and seasonal T∕S anomalies at 31 standard depths, for 57 running decades from 1950–1959 to 2006–2015.
-
Annual and seasonal T∕S vertical averaged anomalies at four layers (surface, intermediate, deep and whole column), for 57 running decades from 1950–1959 to 2006–2015.
-
Annual and seasonal areal density of OHC/OSC anomalies in four layers (surface, intermediate, deep and whole column), for 57 running decades from 1950–1959 to 2006–2015.
-
Annual and seasonal linear trends of T∕S, OHC/OSC anomalies at four layers (surface, intermediate, deep and whole column) for all 57 decades.
-
Annual and seasonal time series of T∕S, OHC/OSC anomalies at four layers (surface, intermediate, deep and whole column) over the whole Mediterranean Sea.
-
Differences of two 30-year averages of annual and seasonal T∕S anomalies at 31 standard depths for the period 1950 to 2015.
-
Differences of two 30-year averages of annual and seasonal T∕S, OHC/OHC anomalies for the period 1950 to 2015, at four layers (surface, intermediate, deep and whole column).
All data are stored in netCDF files and are accessible using the following DOIs.
-
Annual and seasonal T∕S anomalies: https://doi.org/10.5281/zenodo.1408832 (Iona, 2018e).
-
Annual and seasonal T∕S vertical averaged anomalies: https://doi.org/10.5281/zenodo.1408929 (Iona, 2018f).
-
Annual and seasonal areal density of OHC/OSC anomalies: https://doi.org/10.5281/zenodo.1408877 (Iona, 2018g).
-
Annual and seasonal linear trends of T∕S, OHC/OSC anomalies: https://doi.org/10.5281/zenodo.1408917 (Iona, 2018h).
-
Annual and seasonal time series of T∕S, OHC/OSC anomalies: https://doi.org/10.5281/zenodo.1411398 (Iona, 2018i).
-
Differences of two 30-year averages of annual and seasonal T∕S, OHC/OSC anomalies: https://doi.org/10.5281/zenodo.1408903 (Iona, 2018j).

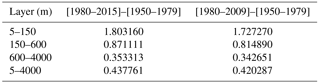
Figure 2Climate shift of areal density of ocean heat content in 109 J m−2 between two 30-year periods 1980–2015 and 1950–1979 for (a) 5–150 m, (b) 150–600 m, (c) 600–4000 m, and (d) 5–4000 m.
We outline below some of the capabilities of the new product. The explanation of the long-term variability patterns that are revealed and attribution of possible causes is out of the scope of this work. A short overview of these was given in the introduction to facilitate the viewing of the products for those readers who are not familiar with the Mediterranean complex dynamics. The comparison of two successive 30-year averages of heat and salt content anomalies for the period 1950 to 2015 can be used for the evaluation of the Mediterranean Sea climate changes. The 30-year periods are averages of three successive decades: the first one refers to the decades 1950–1959 to 1970–1979 and the second to 1980–1989 to 2000–2015. The two 30-year successive periods were selected for consistency with the World Meteorological Organization's recommendation of using as climate normals 30-year periods. Figure 2 illustrates the geographical distribution over the whole Mediterranean of the 30-year climate shift as the OHC differences between the period 1980–2015 and 1950–1979 in the upper 5–150 m (Fig. 2a), 150–600 m (Fig. 2b), 600–4000 m (Fig. 2c), and 5–4000 m (Fig. 2d).
From the surface layer down to 150 m the climate shift is not uniform. The western Mediterranean surface layer (Fig. 2a) has experienced warming almost everywhere expect the Gulf of Lions and the northern Tyrrhenian–Ligurian eastern basins. The surface layer of the eastern Mediterranean (Fig. 2a) is cooling with a noticeable warming spot at the Ierapetra gyre. We observe the same with surface patterns at the intermediate layers of 150–600 m but with about half the strength of the surface (Fig. 2b). The deep waters are warming almost everywhere except the southern Adriatic, the southern Levantine and the south-western Ionian basin (Fig. 2c).
Regarding salinity, it is important to notice that in the whole western Mediterranean there is a clear OSC increase throughout the whole water column (Fig. 3a–d), while in the eastern basin we see that the spatial pattern is not uniform and a notable salt content increase is observed in the areas of deep water formation, e.g. the southern Adriatic and Aegean Sea. According to the bibliography, this is the Eastern Mediterranean Transit (EMT) signature on the intermediate and deep waters, not only in the eastern Mediterranean, but also in the whole basin (Klein et al., 1999; Theocharis et al., 1999; Rixen et al., 2005; Schroeder et al., 2016). Notable salt increases are found at the Shikmona gyre and the south-western Ionian Sea, following the patterns of the heat content. To illustrate the temporal variability of the thermohaline content, the annual OHC and OSC anomalies for six discrete periods, for the three layers (5–150, 150–600, 600–4000 m) and the whole water column (5–4000 m) are shown in Fig. 4a–b. We observe that apart from the strong spatial variability shown in Figs. 2 and 3, there is a similar irregular pattern from one decade to another. One remarkable feature in these distributions is the acceleration and the substantial heat and salt gain of the deep layer (600–4000 m) starting from 1990. It is also found that the correlations (significant at the 95 % confidence level) between the decadal Atlantic Multidecadal Oscillation (AMO) index and the decadal OHC averages are 0.69 for 0–150 m, 0.64 for 150–600 m, 0.63 for 600–4000 m and 0.76 for the whole column: 5–4000 m. The corresponding correlations with the North Atlantic Oscillation (NAO) index are 0.23, −0.22, 0.50 and 0.38. These findings seem to be in agreement with the bibliographical references, where observed acceleration from satellite data of the Mediterranean waters' warming during the 1990s could be attributed to the positive phase of AMO (Macias et al., 2013).
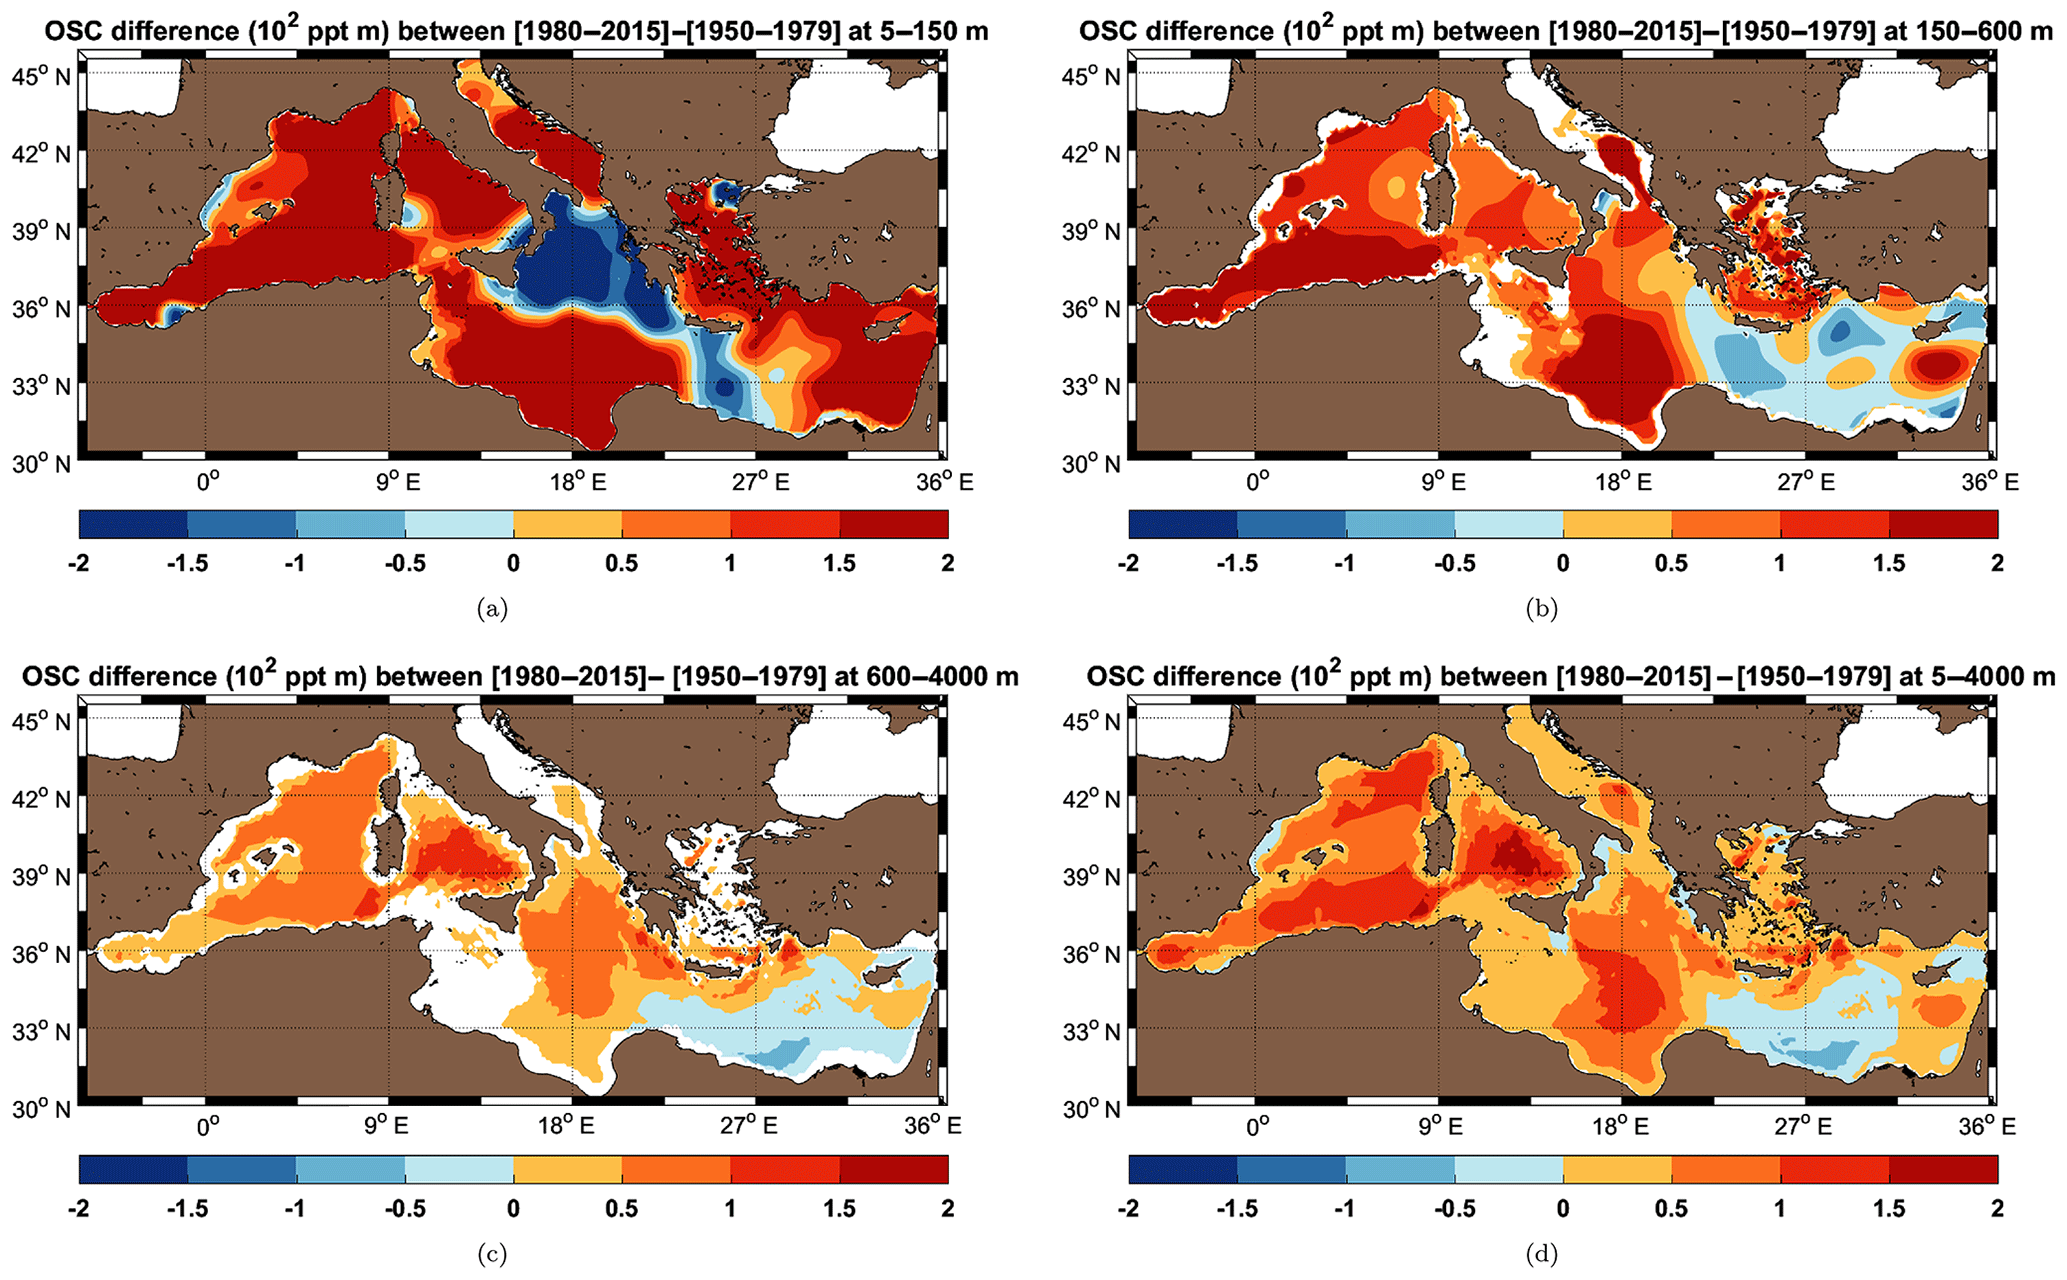
Figure 3As in Fig. 2 for the climate shift of areal density of ocean salt content in 102 ppt m between two 30-year periods 1980–2015 and 1950–1979 for (a) 5–150 m, (b) 150–600 m, (c) 600–4000 m, and (d) 5–4000 m.
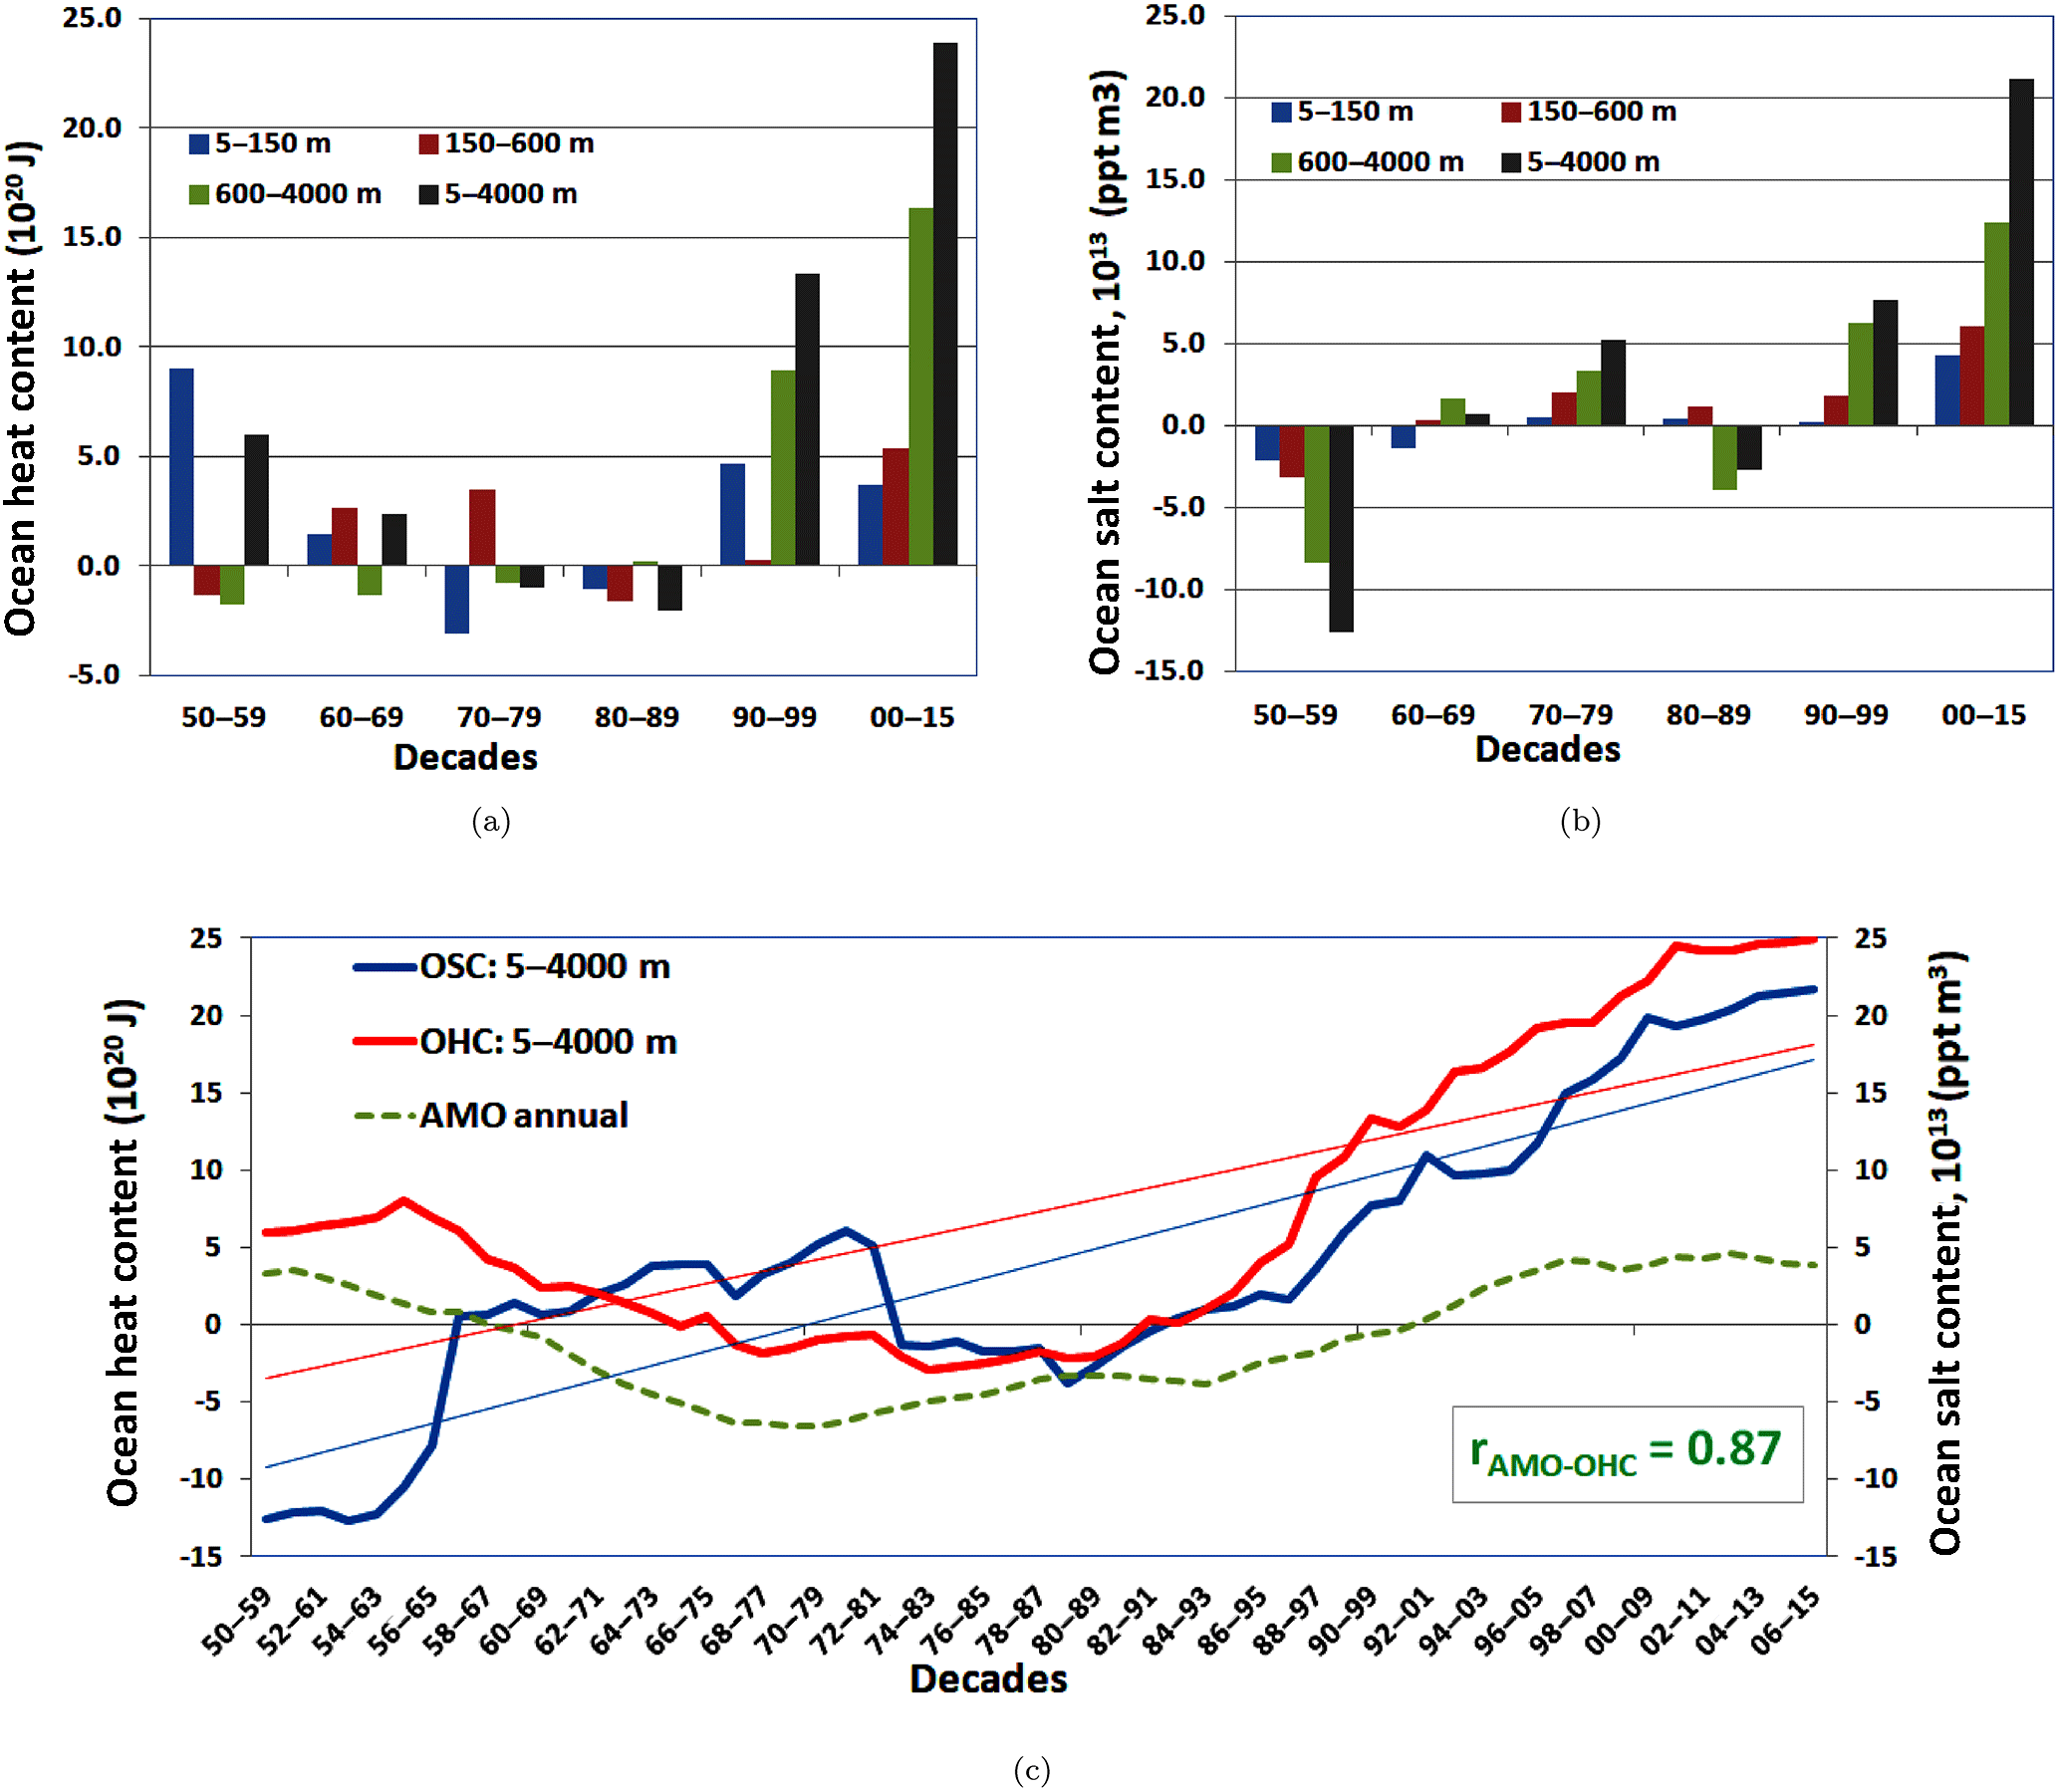
Figure 4Decadal anomalies of OHC (a) and OSC (b) in 5–150, 150–600, 600–4000, and 5–4000 m. OHC anomalies are in 1020 J and OSC in 1013 ppt m3. (c) Volume integrals of OHC (1020 J) and OSC (1013 ppt m3) anomalies at 5–4000 m over the whole Mediterranean Sea. Trend values (per decade) are given for OHC (in red) and OSC (in blue). AMO annual values (multiplied by 25 to resemble the OHC shape) are shown with green dots. The correlation between annual AMO (normal and non-multiplied values) and decadal OHC significant at the 95 % confidence level is shown in green.
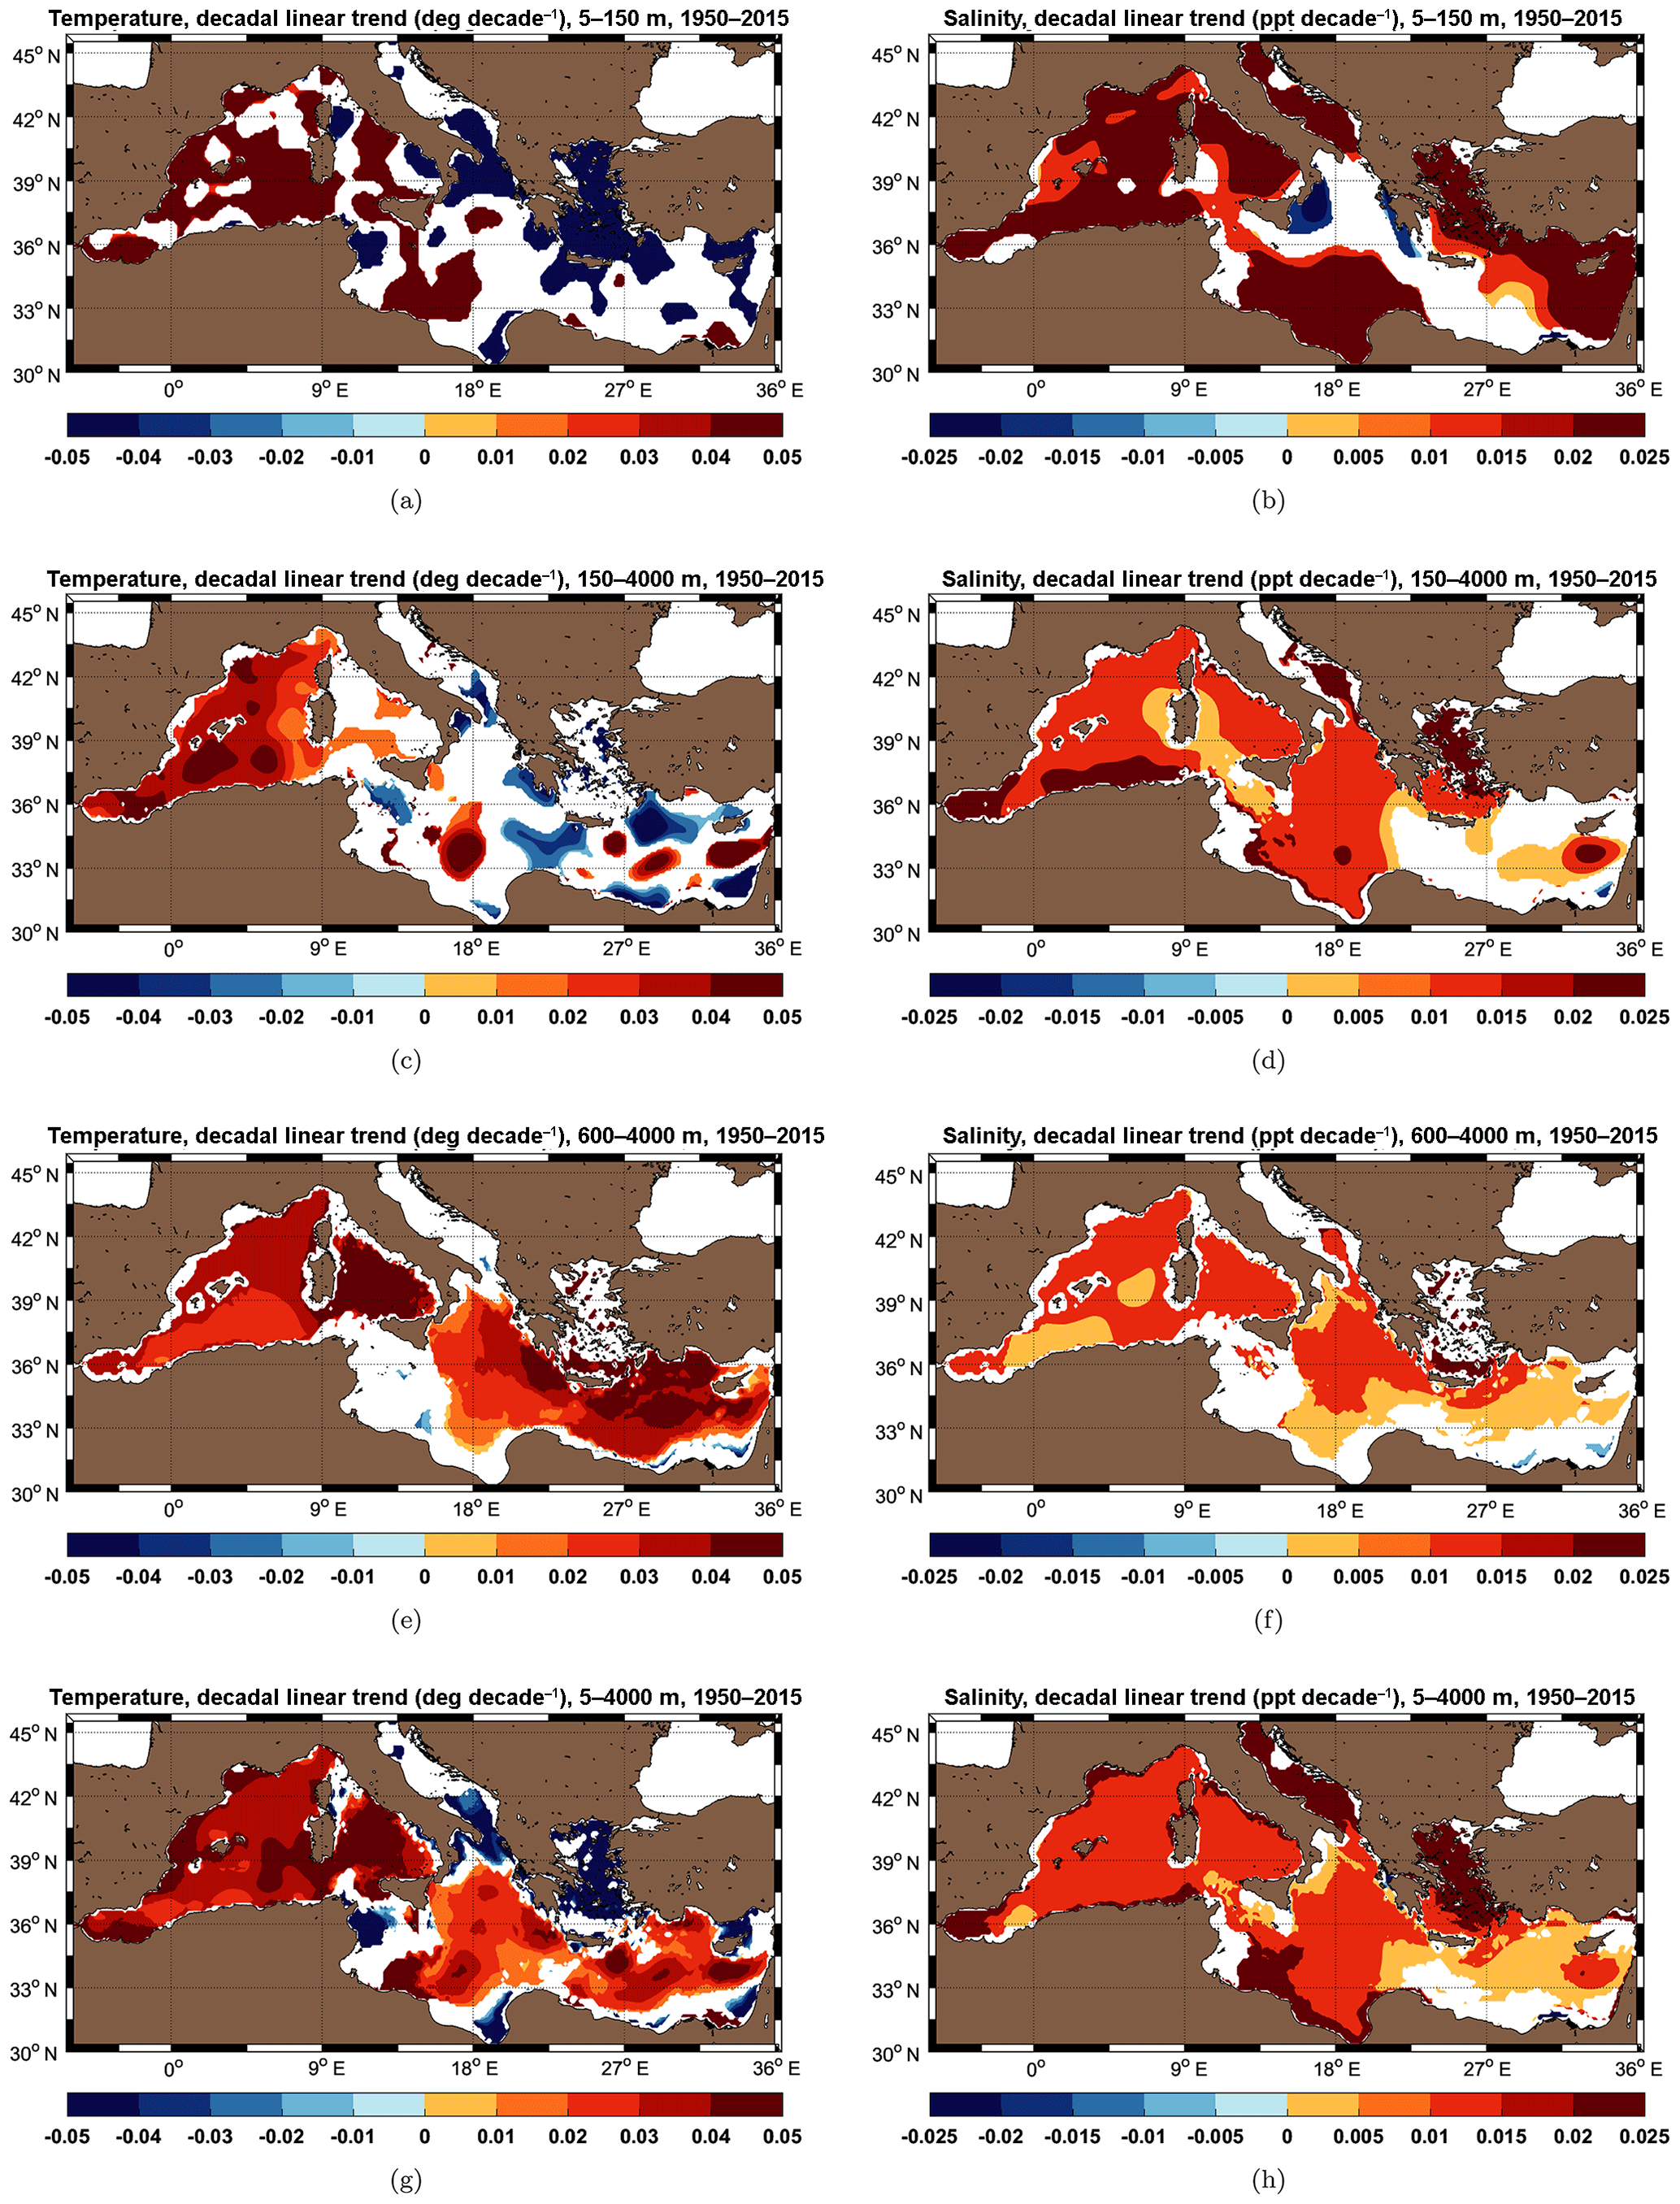
Figure 557-year liner trend of temperature (a, c, e, g) and salinity anomalies (b, d, f, h) averaged over 5–150, 150–600, 600–4000, and 5–4000 m, in ∘C decade−1 and ppt decade−1, respectively. Regions where the linear trend is not significant at the 95 % confidence level are not plotted.
To get a more detailed insight into the long-term fluctuations we show in Fig. 4c, time series of the decadal OHC and OSC anomalies were integrated over the whole column depth and area of the Mediterranean Sea. There are changes, slowdowns and accelerations throughout the study period and we can distinguish three main periods: (a) from 1960 to the late 1970s with an increasing trend in salt but a decreasing heat trend, (b) from 1980 to 1990 with no significant changes, and (c) from 1990 to 2015 with strong OHC/OSC increasing trends (Skliris et al., 2018).
For the study period there is an overall change in heat and salt content of about +18.9 (1020 J) and +34.2 (1013 ppt m3) between the last decade 2006–2015 and the first decade 1950–1959.
Finally we computed a 57-year trend for the period 1950–1959 to 2000–2015 based on the decadal T∕S anomalies averaged over the four depth layers. As reference, the annual climatology of all years was used. Figure 5 illustrates the statistically significant spatial pattern of the linear trends for temperature (∘C decade−1, Fig. 5, left-hand side) and salinity (ppt decade−1, Fig. 5), right-hand side). The trend for the whole water column (Fig. 5g and h) reveals that for the salinity (Fig. 5h) there is a positive trend everywhere. The temperature pattern reveals two main areas of long-term decreasing trends (Fig. 5d), the Aegean and southern Adriatic Sea. The results show a noisy and patchy spatial patterns of the temperature anomaly trend at the first 600 m (Fig. 5a and c) which are more noisy than the corresponding ones for the salinity (Fig. 5b and d). At the surface (Fig. 5b) the salinity trend is positive almost everywhere in the Mediterranean Sea, while in the intermediate depths (Fig. 5d) we distinguish the strong positive trends at the areas of deep water formation at the eastern Mediterranean, southern Adriatic and Aegean Sea. This strong signal can also be traced out at the Alboran Sea and the southern Algerian basin (Fig. 5d), the outflow path of the LIW towards the Atlantic Ocean, a result that is in agreement with the bibliography (Millot et al., 2006).
Comparing with the spatial salinity linear trends at three layers 0–150, 150–600, and 600–400, presented in Skliris et al. (2018), we observe the following. There are similarities to the patterns of the MEDATLAS 2002 climatology of 1∕4∘ horizontal resolution expected from the refreshing areas at the surface and intermediate layers of the northern Aegean, northern Adriatic, and Gulf of Lions. Also, there are more spatial maskings in the current indices because of the statistical significance of the linear trend. SeaDataNet V2 data collection on which the current product is based has almost double more salinity profiles for the period 1950–2015 than the MEDATLAS collection of the period 1950–2002.
Compared with the patterns of the EN4 Met Office climatology of 1∘ horizontal resolution, in the current product there are areas with decreasing trends at the central Mediterranean only and more spatial variability at the intermediate layers. EN4 climatology is based to a great extent on the World Ocean Database and the latter for the common period 1950–2015 with the current product has about 14 % more salinity profiles for the common period 1950–2015 with the current product.
The netCDF Operators (NCO) command-line programs and the mathematical and statistical algorithms of the GSL (the GNU Scientific Library) were used for the manipulation and analysis of the netCDF gridded fields of temperature and salinity of the Mediterranean Atlas (functions gsl_fit_linear, gsl_stats_covariance, gsl_stats_sd) NCO toolkit is available here: http://nco.sourceforge.net/ (last access: 9 October 2018). The GSL is available here: http://www.gnu.org/software/gsl (last access: 9 October 2018). The climatic indices are distributed through Zenodo at the following links: https://doi.org/10.5281/zenodo.1408832, https://doi.org/10.5281/zenodo.1408929, https://doi.org/10.5281/zenodo.1408877, https://doi.org/10.5281/zenodo.1408917, https://doi.org/10.5281/zenodo.1411398, https://doi.org/10.5281/zenodo.1408903 (Iona, 2018e, f, g, h, i, j). The DIVA interpolation software tool is distributed through Zenodo (https://zenodo.org/record/836727, Watelet et al., 2017) and GitHub (https://github.com/gher-ulg/DIVA, last access: 9 October 2018).
We presented a new product of climatic indices for the Mediterranean Sea oriented to the description and study of the long-term variability and climate change of the area. The assessment of the T∕S and OHC/OSC changes is a key priority for monitoring the climate changes in a focal region such as the Mediterranean. So far, the insufficient spatial and temporal coverage of historical in situ data has induced large uncertainties and differences among the used approaches, especially in large basin-scale estimations. Thanks to data repositories such as SeaDataNet, which are improving continuously in terms of abundance, quality and state-of-the-art mapping techniques (implemented by the DIVA software tool), we were able to interpolate in an optimal way and produce high-resolution products. These products can fill data gaps and can be used in a more efficient way by many applications, for the study of the past, present and future climate changes. There is a total increase of 7 % in the number of profiles in the latest SeaDataNet version V2 (2015) used in this study compared to the previous version V1.1 (8 % increase in T and 15 % increase in S profiles). SeaDataNet infrastructure includes data of more than 100 data providers which are quality controlled, archived in data centres and distributed into the infrastructure by the SeaDataNet participants. The data aggregation and validation are performed by regional experts and in close collaboration with the data originators for ensuring the highest quality of the delivered data sets. To avoid duplicates, data not belonging to the SeaDataNet consortium are not included in the repository. There is therefore a significant amount of data such as bathythermographs (more than 100 000 T profiles, mainly navy data) which were used in the World Ocean Atlas 2013 but not in this study. In the next version of this product, these additional sources will be combined with the SeaDataNet data. Future improvements include the use of density climatological fields instead of a constant value at the OHC estimations. Such a density gridded field is not currently available as input since we interpolate T∕S separately, but it would be possible to derive it from the T∕S gridded fields. Another improvement concerns the correction of the historical bathythermograph data, although previous studies indicated that it does not alter the final results.
AI created the climatic index product, wrote the first version of the manuscript and prepared the figures. JMB, SW, CT, AT and SS reviewed the manuscript. AI, CT and SW formatted the document in LaTeX. CT prepared Fig. 1 and the netCDF files for the time series.
The authors declare that they have no conflict of interest.
It cannot be guaranteed that the product is free from errors or omissions. Correct and appropriate product interpretation and usage are solely the responsibility of data users.
Data were provided through the SeaDataNet Pan-European infrastructure for
ocean and marine data management
(http://www.seadatanet.org, last access: 9 October 2018).
The DIVA development received funding from the European Union Sixth Framework
Programme (FP6/2002–2006) under grant agreement no. 026212, SeaDataNet, the
Seventh Framework Programme (FP7/2007–2013) under grant agreement no.
283607, SeaDataNet II, SeaDataCloud and EMODnet (MARE/2008/03 – Lot 3
Chemistry – SI2.531432) from the Directorate-General for Maritime Affairs
and Fisheries.
Edited by: Giuseppe M. R.
Manzella
Reviewed by: Aristomenis Karageorgis and Roger
Proctor
Adloff, F., Somot, S., Sevault, F., Jordà, G., Aznar, R., Déqué, M., Herrmann, M., Marcos, M., Dubois, C., Padorno, E., Alvarez-Fanjul, E., and Damia, G.: Mediterranean Sea response to climate change in an ensemble of twenty first century scenarios, Clim. Dynam., 45, 2775–2802, https://doi.org/10.1007/s00382-015-2507-3, 2015. a
Beckers, J.-M., Barth, A., Troupin, C., and Alvera-Azcárate, A.: Some approximate and efficient methods to assess error fields in spatial gridding with DIVA (Data Interpolating Variational Analysis), J. Atmos. Ocean. Tech., 31, 515–530, https://doi.org/10.1175/JTECH-D-13-00130.1, 2014. a
Béthoux, J.-P., Gentili, B., and Tailliez, D.: Warming and freshwater budget change in the Mediterranean since the 1940s, their possible relation to the greenhouse effect, Geophys. Res. Lett., 25, 1023–1026, https://doi.org/10.1029/98gl00724, 1998. a
Béethoux, J. P., Gentili, B., Morin, P., Nicolas, E., Pierre, C., and Ruiz-Pino, D.: The Mediterranean Sea: a miniature ocean for climatic and environmental studies and a key for the climatic functioning of the North Atlantic, Prog. Oceanogr., 44, 131–146, https://doi.org/10.1016/s0079-6611(99)00023-3, 1999. a
Durack, P. J. and Wijffels, S. E.: Fifty-Year Trends in Global Ocean Salinities and Their Relationship to Broad-Scale Warming, J. Climate, 23, 4342–4362, https://doi.org/10.1175/2010jcli3377.1, 2010. a
Durack, P. J., Wijffels, S. E., and Matear, R. J.: Ocean Salinities Reveal Strong Global Water Cycle Intensification During 1950 to 2000, Science, 336, 455–458, https://doi.org/10.1126/science.1212222, 2012. a
Fusco, G., Manzella, G. M. R., Cruzado, A., Gacic, M., Gasparini, G. P., Kovacevic, V., Millot, C., Tziavos, C., Velasquez, Z. R., Walne, A., Zervakis, V., and Zodiatis, G.: Variability of mesoscale features in the Mediterranean Sea from XBT data analysis, Ann. Geophys., 21, 21–32, https://doi.org/10.5194/angeo-21-21-2003, 2003. a
Füssel, H.-M., Jol, A., Marx, A., and Hildén, M.: Climate change, impacts and vulnerability in Europe 2016, An indicator-based report, Tech. rep., European Environment Agency, https://doi.org/10.2800/534806, 2017. a
Giorgi, F.: Climate change hot-spots, Geophys. Res. Let., 33, L08707, https://doi.org/10.1029/2006gl025734, 2006. a, b
Giorgi, F. and Lionello, P.: Climate change projections for the Mediterranean region, Global Planet. Change, 63, 90–104, https://doi.org/10.1016/j.gloplacha.2007.09.005, 2008. a
Gouretski, V. and Koltermann, K. P.: How much is the ocean really warming?, Geophys. Res. Lett., 34, L01610, https://doi.org/10.1029/2006gl027834, 2007. a
Iona, A.: Mediterannean Sea-Temperature and Salinity Annual Climatology [Data set], Zenodo, https://doi.org/10.5281/zenodo.1146976, 2018a. a
Iona, A.: Mediterannean Sea-Temperature and Salinity Annual Climatology for 57 running decades from 1950–1959 to 2006–2015 [Data set], Zenodo, https://doi.org/10.5281/zenodo.1146957, 2018b. a
Iona, A.: Mediterannean Sea-Temperature and Salinity Seasonal Climatology [Data set], Zenodo, https://doi.org/10.5281/zenodo.1146953, 2018c. a
Iona, A.: Mediterannean Sea-Temperature and Salinity Seasonal Climatology for 57 running decades from 1950–1959 to 2006–2015 [Data set], Zenodo, https://doi.org/10.5281/zenodo.1146938, 2018d. a
Iona, A.: Mediterranean Sea Climatic Indices – T∕S Anomalies [Data set], Zenodo, https://doi.org/10.5281/zenodo.1408832, 2018e. a, b
Iona, A.: Mediterranean Sea Climatic Indices – T∕S Vertical Averages [Data set], Zenodo, https://doi.org/10.5281/zenodo.1408929, 2018f. a, b
Iona, A.: Mediterranean Sea Climatic Indices – Areal density of OHC/OSC [Data set], Zenodo, https://doi.org/10.5281/zenodo.1408877, 2018g. a, b
Iona, A.: Mediterranean Sea Climatic Indices – Linear trends of T∕S, OHC/OSC Anomalies [Data set], Zenodo, https://doi.org/10.5281/zenodo.1408917, 2018h. a, b
Iona, A.: Mediterranean Sea Climatic Indices – Time Series of T∕S, OHC/OSC Anomalies [Data set], Zenodo, https://doi.org/10.5281/zenodo.1411398, 2018i. a, b
Iona, A.: Mediterranean Sea Climatic Indices – Differences of two 30-years averages of T∕S, OHC/OSC Anomalies [Data set], Zenodo, https://doi.org/10.5281/zenodo.1408903, 2018j. a, b
Iona, A., Theodorou, A., Watelet, S., Troupin, C., Beckers, J.-M., and Simoncelli, S.: Mediterranean Sea Hydrographic Atlas: towards optimal data analysis by including time-dependent statistical parameters, Earth Syst. Sci. Data, 10, 1281–1300, https://doi.org/10.5194/essd-10-1281-2018, 2018. a, b
IPCC: Climate Change 2013 – The Physical Science Basis: Working Group I Contribution to the Fifth Assessment Report of the Intergovernmental Panel on Climate Change, chap. Technical Summary, Cambridge University Press, https://doi.org/10.1017/CBO9781107415324, 2014. a, b, c, d
Jordà, G., Von Schuckmann, K., Josey, S., Caniaux, G., García-Lafuente, J., Sammartino, S., Özsoy, E., Polcher, J., Notarstefano, G., Poulain, P.-M., and Adloff, F.: The Mediterranean Sea heat and mass budgets: Estimates, uncertainties and perspectives, Prog. Oceanogr., 156, 174–208, https://doi.org/10.1016/j.pocean.2017.07.001, 2017. a
Klein, B., Roether, W., Manca, B. B., Bregant, D., Beitzel, V., Kovacevic, V., and Luchetta, A.: The large deep water transient in the Eastern Mediterranean, Deep-Sea Res. Pt. I, 46, 371–414, https://doi.org/10.1016/s0967-0637(98)00075-2, 1999. a, b, c
Lascaratos, A., Roether, W., Nittis, K., and Klein, B.: Recent changes in deep water formation and spreading in the eastern Mediterranean Sea: a review, Prog. Oceanogr., 44, 5–36, https://doi.org/10.1016/s0079-6611(99)00019-1, 1999. a
Levitus, S.: Warming of the World Ocean, Science, 287, 2225–2229, https://doi.org/10.1126/science.287.5461.2225, 2000. a
Levitus, S., Antonov, J. I., Boyer, T. P., Locarnini, R. A., Garcia, H. E., and Mishonov, A. V.: Global ocean heat content 1955–2008 in light of recently revealed instrumentation problems, Geophys. Res. Lett., 36, L07608, https://doi.org/10.1029/2008gl037155, 2009. a, b
Levitus, S., Antonov, J. I., Boyer, T. P., Baranova, O. K., Garcia, H. E., Locarnini, R. A., Mishonov, A. V., Reagan, J. R., Seidov, D., Yarosh, E. S., and Zweng, M. M.: World ocean heat content and thermosteric sea level change (0–2000 m), 1955–2010, Geophys. Res. Lett., 39, L10603, https://doi.org/10.1029/2012gl051106, 2012. a, b, c
Lozier, M. S., Owens, W. B., and Curry, R. G.: The climatology of the North Atlantic, Prog. Oceanogr., 36, 1–44, https://doi.org/10.1016/0079-6611(95)00013-5, 1995. a
Macias, D., Garcia-Gorriz, E., and Stips, A.: Understanding the Causes of Recent Warming of Mediterranean Waters. How Much Could Be Attributed to Climate Change?, PLoS ONE, 8, e81591, https://doi.org/10.1371/journal.pone.0081591, 2013. a
Malanotte-Rizzoli, P., Manca, B. B., d'Alcala, M. R., Theocharis, A., Brenner, S., Budillon, G., and Ozsoy, E.: The Eastern Mediterranean in the 80s and in the 90s: the big transition in the intermediate and deep circulations, Dynam. Atmos. Oceans, 29, 365–395, https://doi.org/10.1016/s0377-0265(99)00011-1, 1999. a
Manca, B., Burca, M., Giorgetti, A., Coatanoan, C., Garcia, M.-J., and Iona, A.: Physical and biochemical averaged vertical profiles in the Mediterranean regions: an important tool to trace the climatology of water masses and to validate incoming data from operational oceanography, J. Marine Syst., 48, 83–116, https://doi.org/10.1016/j.jmarsys.2003.11.025, 2004. a
Manca, B. B.: Evolution of dynamics in the eastern Mediterranean affecting water mass structures and properties in the Ionian and Adriatic Seas, J. Geophys. Res., 108, 8102, https://doi.org/10.1029/2002jc001664, 2003. a
Mariotti, A., Zeng, N., Yoon, J.-H., Artale, V., Navarra, A., Alpert, P., and Li, L. Z. X.: Mediterranean water cycle changes: transition to drier 21st century conditions in observations and CMIP3 simulations, Environ. Res. Lett., 3, 044001, https://doi.org/10.1088/1748-9326/3/4/044001, 2008. a
MEDAR Group: MEDATLAS/2002 database, Mediterranean and Black Sea database of temperature salinity and bio-chemical parameters, Climatological Atlas, Tech. rep., Ifremer, 4 Cdroms, 2002. a, b
Millot, C., Candela, J., Fuda, J.-L., and Tber, Y.: Large warming and salinification of the Mediterranean outflow due to changes in its composition, Deep-Sea Res. Pt. I, 53, 656–666, https://doi.org/10.1016/j.dsr.2005.12.017, 2006. a
Rahmstorf, S.: Influence of mediterranean outflow on climate, Eos, Transactions American Geophysical Union, 79, 281–281, https://doi.org/10.1029/98eo00208, 1998. a
Rixen, M., Beckers, J.-M., Levitus, S., Antonov, J., Boyer, T., Maillard, C., Fichaut, M., Balopoulos, E., Iona, S., Dooley, H., Garcia, M.-J., Manca, B., Giorgetti, A., Manzella, G., Mikhailov, N., Pinardi, N., Zavatarelli, M., and the Medar Consortium: The Western Mediterranean Deep Water: a proxy for global climate change, Geophys. Res. Lett., 32, L12608, https://doi.org/10.1029/2005GL022702, 2005. a, b
Robinson, A., Leslie, W., Theocharis, A., and Lascaratos, A.: Mediterranean Sea Circulation, Encyclopedia of Ocean Sciences, 1689–1705, https://doi.org/10.1006/rwos.2001.0376, 2001. a
Roether, W., Manca, B. B., Klein, B., Bregant, D., Georgopoulos, D., Beitzel, V., Kovacevic, V., and Luchetta, A.: Recent Changes in Eastern Mediterranean Deep Waters, Science, 271, 333–335, https://doi.org/10.1126/science.271.5247.333, 1996. a
Rohling, E. J. and Bryden, H. L.: Man-Induced Salinity and Temperature Increases in Western Mediterranean Deep Water, J. Geophys. Res., 97, 11191–11198, https://doi.org/10.1029/92jc00767, 1992. a
Schröder, K., Gasparini, G. P., Tangherlini, M., and Astraldi, M.: Deep and intermediate water in the western Mediterranean under the influence of the Eastern Mediterranean Transient, Geophys. Res. Lett., 33, L21607, https://doi.org/10.1029/2006gl027121, 2006. a
Schroeder, K., García-Lafuente, J., Josey, S. A., Artale, V., Nardelli, B. B., Carrillo, A., Gačić, M., Gasparini, G. P., Herrmann, M., Lionello, P., and Ludwig, W.: Circulation of the Mediterranean Sea and its Variability, The Climate of the Mediterranean Region, 187–256, https://doi.org/10.1016/b978-0-12-416042-2.00003-3, 2012. a
Schroeder, K., Chiggiato, J., Bryden, H. L., Borghini, M., and Ben Ismail, S.: Abrupt climate shift in the Western Mediterranean Sea, Sci. Rep.-UK, 6, 23009, https://doi.org/10.1038/srep23009, 2016. a, b
Schroeder, K., Chiggiato, J., Josey, S. A., Borghini, M., Aracri, S., and Sparnocchia, S.: Rapid response to climate change in a marginal sea, Sci. Rep.-UK, 7, 4065, https://doi.org/10.1038/s41598-017-04455-5, 2017. a, b, c
Simoncelli, S., Coatanoan, C., Myroshnychenko, V., Sagen, H., Bäck, O., Scory, S., Grandi, A., Barth, A., and Fichaut, M.: SeaDataNet, First Release of Regional Climatologies. WP10 Third Year Report – DELIVERABLE D10.3, Tech. rep., SeaDataNet, https://doi.org/10.13155/50381, 2015. a
Skliris, N., Marsh, R., Josey, S. A., Good, S. A., Liu, C., and Allan, R. P.: Salinity changes in the World Ocean since 1950 in relation to changing surface freshwater fluxes, Clim. Dynam., 43, 709–736, https://doi.org/10.1007/s00382-014-2131-7, 2014. a
Skliris, N., Zika, J. D., Nurser, G., Josey, S. A., and Marsh, R.: Global water cycle amplifying at less than the Clausius-Clapeyron rate, Sci. Rep.-UK, 6, 38752, https://doi.org/10.1038/srep38752, 2016. a
Skliris, N., Zika, J. D., Herold, L., Josey, S. A., and Marsh, R.: Mediterranean sea water budget long-term trend inferred from salinity observations, Clim. Dynam., 51, 2857–2876, https://doi.org/10.1007/s00382-017-4053-7, 2018. a, b, c, d
Somot, S., Sevault, F., Déqué, M., and Crépon, M.: 21st century climate change scenario for the Mediterranean using a coupled atmosphere–ocean regional climate model, Global Planet. Change, 63, 112–126, https://doi.org/10.1016/j.gloplacha.2007.10.003, 2008. a
Theocharis, A., Nittis, K., Kontoyiannis, H., Papageorgiou, E., and Balopoulos, E.: Climatic changes in the Aegean Sea influence the eastern Mediterranean thermohaline circulation (1986–1997), Geophys. Res. Lett., 26, 1617–1620, https://doi.org/10.1029/1999gl900320, 1999. a
Theocharis, A., Klein, B., Nittis, K., and Roether, W.: Evolution and status of the Eastern Mediterranean Transient (1997–1999), J. Marine Syst., 33-34, 91–116, https://doi.org/10.1016/s0924-7963(02)00054-4, 2002. a
Troupin, C., Sirjacobs, D., Rixen, M., Brasseur, P., Brankart, J.-M., Barth, A., Alvera-Azcárate, A., Capet, A., Ouberdous, M., Lenartz, F., Toussaint, M.-E., and Beckers, J.-M.: Generation of analysis and consistent error fields using the Data Interpolating Variational Analysis (Diva), Ocean Model., 52–53, 90–101, https://doi.org/10.1016/j.ocemod.2012.05.002, 2012. a
Tsimplis, M. N., Zervakis, V., Josey, S. A., Peneva, E. L., Struglia, M. V., Stanev, E. V., Theocharis, A., Lionello, P., Malanotte-Rizzoli, P., Artale, V., Tragou, E., and Oguz, T.: Chapter 4 Changes in the oceanography of the Mediterranean Sea and their link to climate variability, in: Developments in Earth and Environmental Sciences, edited by: Lionello, P., Malanotte-Rizzoli, P., and Boscolo, R., Elsevier, 227–282, https://doi.org/10.1016/s1571-9197(06)80007-8, 2006. a
Vargas-Yáñez, M., Moya, F., Tel, E., García-Martínez, M. C., Guerber, E., and Bourgeon, M.: Warming and salting in the western Mediterranean during the second half of the 20th century: inconsistencies, unknowns and the effect of data processing, Sci. Mar., 73, 7–28, https://doi.org/10.3989/scimar.2009.73n1007, 2008. a
Vargas-Yáñez, M., Moya, F., García-Martínez, M., Tel, E., Zunino, P., Plaza, F., Salat, J., Pascual, J., López-Jurado, J., and Serra, M.: Climate change in the Western Mediterranean Sea 1900–2008, J. Marine Syst., 82, 171–176, https://doi.org/10.1016/j.jmarsys.2010.04.013, 2010a. a
Vargas-Yáñez, M., Zunino, P., Benali, A., Delpy, M., Pastre, F., Moya, F., García-Martínez, M. d. C., and Tel, E.: How much is the western Mediterranean really warming and salting?, J. Geophys. Res., 115, C04001, https://doi.org/10.1029/2009jc005816, 2010b. a
Watelet, S., Troupin, C., Beckers, J.-M., Barth, A., and Ouberdous, M.: gher-ulg/DIVA: v4.7.1 (Version v4.7.1), Zenodo, https://doi.org/10.5281/zenodo.836727, 2017. a
WMO: Guide to Climatological Practices, Tech. rep., World Meteorological Organization, Geneva, Switzerland, available at: https://library.wmo.int/pmb_ged/wmo_100_en.pdf (last access: 9 October 2018), ISBN 978-92-63-10100-6, 2011. a
Zika, J. D., Skliris, N., Blaker, A. T., Marsh, R., Nurser, A. J. G., and Josey, S. A.: Improved estimates of water cycle change from ocean salinity: the key role of ocean warming, Environ. Res. Lett., 13, 074036, https://doi.org/10.1088/1748-9326/aace42, 2018. a