the Creative Commons Attribution 4.0 License.
the Creative Commons Attribution 4.0 License.
 | 14 Aug 2018
The SeaSWIR dataset
David Doxaran
Ana Dogliotti
Bouchra Nechad
Kevin Ruddick
Dries Raymaekers
Sindy Sterckx
The SeaSWIR dataset consists of 137 ASD (Analytical Spectral Devices, Inc.) marine reflectances, 137 total suspended matter (TSM) measurements and 97 turbidity measurements gathered at three turbid estuarine sites (Gironde, La Plata, Scheldt). The dataset is valuable because of the high-quality measurements of the marine reflectance in the Short Wave InfraRed I region (SWIR-I: 1000–1200 nm) and SWIR-II (1200–1300 nm) and because of the wide range of TSM concentrations from 48 up to 1400 mg L−1. The ASD measurements were gathered using a detailed measurement protocol and were subjected to a strict quality control. The SeaSWIR marine reflectance is characterized by low reflectance at short wavelengths (<450 nm), peak reflectance values between 600 and 720 nm and significant contributions in the near-infrared (NIR) and SWIR-I parts of the spectrum. Comparison of the ASD water reflectance with simultaneously acquired reflectance from a three-radiometer system revealed a correlation of 0.98 for short wavelengths (412, 490 and 555 nm) and 0.93 for long wavelengths (686, 780 and 865 nm). The relationship between TSM and turbidity (for all sites) is linear, with a correlation coefficient of 0.96.
The SeaSWIR dataset has been made publicly available (https://doi.org/10.1594/PANGAEA.886287).
- Article
(924 KB) - Full-text XML
- BibTeX
- EndNote


The SeaSWIR dataset (https://doi.org/10.1594/PANGAEA. 886287) has been collected in the framework of the SeaSWIR project (Remote sensing of turbid waters in the Short Wave Infrared) to determine the variability of the marine reflectance in the short-wave infrared (SWIR, 1000–2500 nm) as a function of total suspended matter (TSM) concentration and turbidity (T). In Knaeps et al. (2015) the SWIR region between 1000 and 1300 nm was divided into two sub-regions based on the shape and magnitude of the pure water absorption. The SWIR-I region ranges from 1000 to 1200 nm, close to a local maximum in the pure water absorption. The SWIR-II region ranges from 1200 to 1300 nm, where the pure water absorption reaches a value of 132.2 m−1. Beyond 1300 nm the pure water absorption is extremely high (>140 m−1) and there is no reflectance emerging from the water.
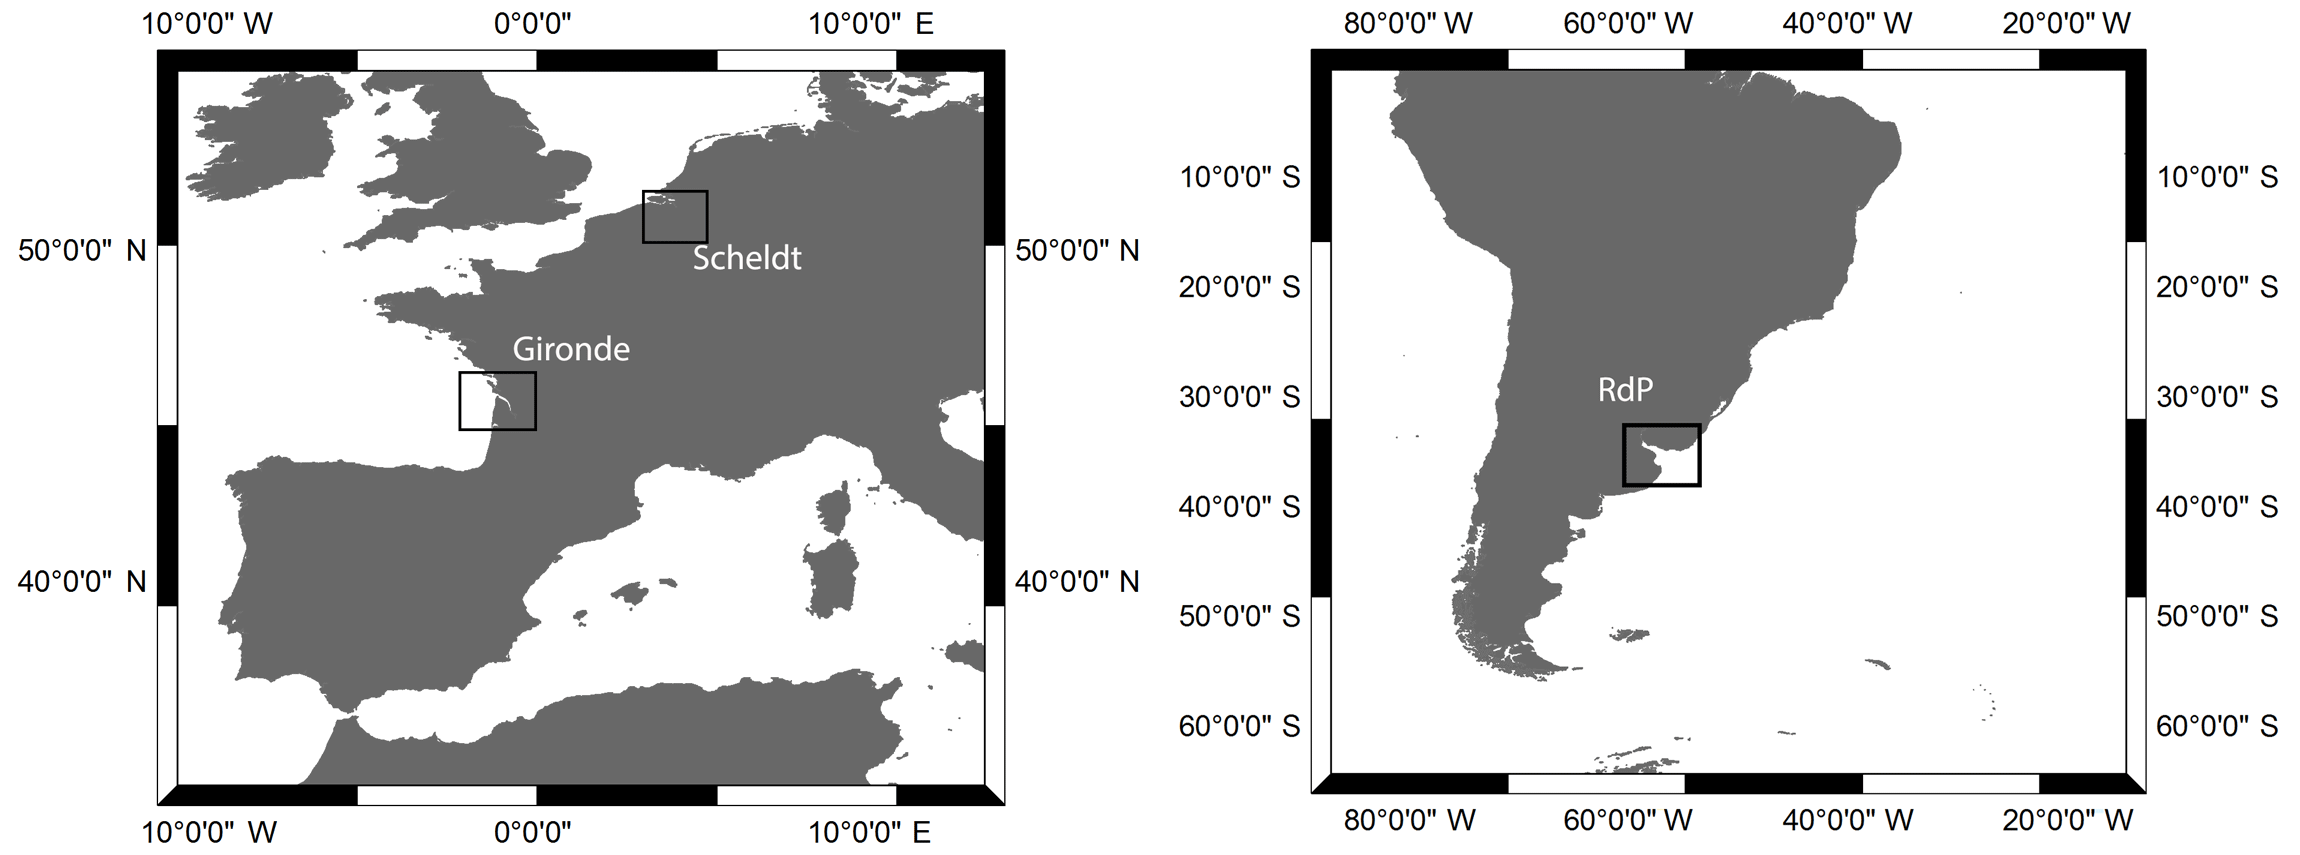
Figure 1Locations of the study sites: Scheldt (Belgium), Gironde (France), and Río de La Plata (Argentina).
The marine reflectance in the SWIR has not been reported before because specialized optical instrumentation is required to measure in the SWIR. More information on the SWIR marine reflectance is essential because several satellites have sensors with spectral bands in this range. Examples include Sentinel-3 OLCI with a spectral band at 1020 nm, MODIS AQUA and TERRA with spectral bands at 1240, 1640 and 2130 nm, and the Visible Infrared Imaging Radiometer Suite (VIIRS) with spectral bands at 1240, 1378, 1610 and 2250 nm. Knowledge of the marine reflectance in these spectral bands will be used first of all to underpin or refute the assumptions of a black pixel (often assumed in atmospheric correction over turbid waters). However, earlier publications using this dataset (Knaeps et al., 2012, 2015) have also shown the existence of a relationship between the SWIR marine reflectance at 1020 and 1070 nm and the TSM concentrations and have proposed a TSM algorithm for the SWIR bands. Such a SWIR TSM algorithm is particularly useful in coastal waters with extremely high turbidity where shorter bands in the NIR saturate.
To measure marine reflectance in the SWIR-I and SWIR-II, a typical “land” ASD (Analytical Spectral Devices, Inc.) spectroradiometer (FieldSpec) was used, recording data from 350 to 2500 nm. A measurement methodology was developed for the ASD to derive the marine reflectance from this single radiometer system and results were compared with marine reflectance measured using a three-radiometer system (TRIOS). As the pure water absorption is high in the SWIR, only water with a high concentration of suspended particles will have a measurable reflectance. Therefore, test sites were chosen with high to extremely high turbidity: the Scheldt River in Belgium, the Gironde estuary in France and Río de la Plata estuary in Argentina (Fig. 1). Measurement campaigns were organized at all three sites, mainly on fixed pontoons (floating dock) along the rivers/estuaries.
The measurement campaigns resulted in a large dataset of 137 ASD reflectance spectra in the visible/near-infrared (VNIR) and SWIR with corresponding TSM concentrations and turbidity. This paper describes the methodology for data acquisition and processing and analyzes the final reflectance, TSM concentrations and turbidity values. Additional quality control of the ASD reflectance is performed with simultaneously acquired TRIOS reflectance data.
Field data have been collected in three different estuaries with high to extremely high TSM concentrations: the Scheldt in Belgium, the Gironde in France and the Río de la Plata in Argentina (Fig. 1). These three estuaries were chosen because of their high concentration range of suspended particles and diversity of particle composition/type. It was expected that the high concentration of TSM would result in a measurable water reflectance signal in the SWIR.
The Scheldt River has its origin in France, flows through Belgium and reaches the North Sea in the Netherlands. It forms a macrotidal estuary leading to TSM concentrations within surface waters varying from a few to several hundreds of mg L−1 during one tidal cycle. The study area is located near the city and the harbor of Antwerp where there is a tide-dominated Maximum Turbidity Zone (MTZ). The tidal current induces re-suspension of local bottom sediments leading to high suspended matter concentration (Chen et al., 2005). The field sampling was performed on the Sint Anna pontoon near the city of Antwerp in 2010 and 2012 (Table 1).
The Gironde is a macrotidal estuary where the water optical properties are dominated by non-algal particles, i.e., by suspended sediments (silts and clays) delivered by the Garonne and Dordogne rivers and trapped within the maximum turbidity zone of the estuary. TSM concentrations typically vary from 10 to 4000 mg L−1 within surface waters, mainly depending on fortnightly tidal cycles (Doxaran et al., 2009). Field sampling was performed on a vessel and on the pontoons of Blaye and Pauillac in 2012 and 2013 (Table 1).
The Río de la Plata is a shallow (<20 m) and large-scale estuary which drains the second largest basin in South America. High values of TSM have been reported in this region, with mean values ranging from 100 to 300 mg L−1 and extreme concentrations around 1000 mg L−1 in the Maximum Turbidity Zone (Dogliotti et al., 2014). This estuary has been identified by a number of investigators (Shi and Wang, 2009; Doerffer, 2006; Moore et al., 2010; Doron et al., 2011) as a very bright target which can be used for evaluating the performance of atmospheric correction algorithms, so far tested without any in situ data (Dogliotti et al., 2011). Field sampling was performed on the Club de Pescadores Pier in Buenos Aires in 2012 (Table 1).
Most of the measurements from the SeaSWIR dataset were collected from fixed pontoons along the sides of the rivers/estuaries. These pontoons allow measurement of a large variation of TSM concentration and T during the daily tidal cycle and allow us to make high-quality reflectance measurements. In particular, the vertical orientation of the irradiance sensor or horizontal orientation of the ASD reflectance plaque can be much better controlled than on a ship. The range of azimuth viewing angles on such pontoons can be limited because of shadow/reflection by the structure itself.
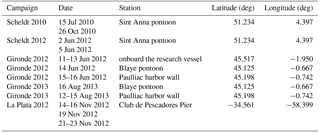
Five sampling campaigns and in total 23 measurement days were organized between 2010 and 2013 on all test sites (Table 1).
In 2010, the first field campaigns were organized at the Sint Anna pontoon on the Scheldt River (Antwerp, Belgium). The campaign included 2 days of measurement, 1 day in July and 1 day in October. The campaign was repeated in the same pontoon in June 2012 with a 2-day campaign.
Later in the same month, an extensive field campaign was organized in the Gironde estuary (France) with 3 days of measurements from a vessel and 3 days of measurements from fixed pontoons.
-
1st day (11 June 2012) onboard the research vessel: fixed location close to the river mouth, 85 km downstream from Bordeaux
-
2nd day (12 June 2012) onboard the research vessel: fixed location 67 km downstream from Bordeaux
-
3rd day (13 June 2012) onboard the research vessel: fixed location 30 km downstream from Bordeaux
-
4th day (14 June 2012) from a pontoon located in Blaye, right shore of the estuary
-
5th day (15 June 2012) from the harbor wall located in Pauillac, left shore of the estuary
During 2 weeks (12–23 November 2012) a 9-day campaign was organized at the Club de Pescadores Pier at the Río de la Plata in Buenos Aires (Argentina).
Finally a last campaign was organized in the Gironde in August 2013. A 5-day sampling campaign was organized at the pontoons of Pauillac and Blaye.
All measurements are listed in the tables below.
At all test sites concomitant water reflectance, turbidity and TSM measurements were made (https://doi.org/10.1594/PANGAEA.886287). Table 2 provides an overview of the measurements performed at each campaign and station. The reported number of measurements refers to the remaining number of measurements after quality control. The measurement methodology is described in detail below.
Table 2Data collection. Campaign site location and year, type of platform used, number of radiometry (using ASD and Trios radiometers), total suspended matter, and turbidity measurements collected.
4.1 ASD water reflectance
Water reflectance (Rw) between 350 and 2500 nm was measured with an ASD Fieldspec FR spectrometer. The ASD spectrometer measures above the water light that is backscattered from the water and the light reflected at the air–water interface in the visible/near-infrared (VNIR, 350–1050 nm) and short-wave infrared (SWIR, 900–2500 nm) parts of the spectrum. The VNIR spectrometer has a spectral resolution of approximately 3 nm at around 700 nm. The spectral resolution in the SWIR varies between 10 and 12 nm. All measurements were performed using a pistol grip and a fiber optic cable. A fore optics lens was attached to the pistol grip, limiting the field-of-view to 8∘. Each individual measurement that the ASD makes is an average of 40 scans.
As the ASD has only one radiometer, three consecutive measurements have to be made to obtain the downwelling irradiance, the total upwelling radiance and the downwelling sky radiance. To do so, the instrument was mounted on a steel frame which can be rotated easily keeping a 40∘ measurement angle from the nadir.
Measurements were performed under consistently cloudy and sunny skies. Patchy clouds and highly variable light conditions were avoided. The three individual measurements are performed as follows.
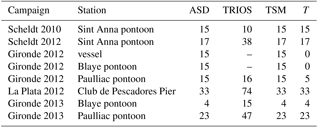
The downwelling irradiance above the surface (Ed(0+)) was determined using an almost 100 % reflecting Spectralon® reference panel (Analytical Spectral Devices, Inc.). The Spectralon panel was placed perfectly horizontally and objects were avoided within the hemisphere to prevent shadows. Figure 2 shows the instrument setup on the pontoon with the Spectralon panel in light blue mounted on a tripod and the ASD in black pointing towards the Spectralon panel. The measured signal is the downwelling irradiance reflected by the plaque (Ldspec) which can be used to determine Ed(0+) (Doxaran et al., 2004).
The total upwelling radiance from the water (Lu(a)) (i.e., from the water and from the air–sea interface) was measured by pointing the sensor at the water surface at 40∘ from nadir (θv in Fig. 3), maintaining an azimuth of 90 or 135∘ from the solar plane, depending on the pontoon orientation with respect to the Sun (Fig. 3).
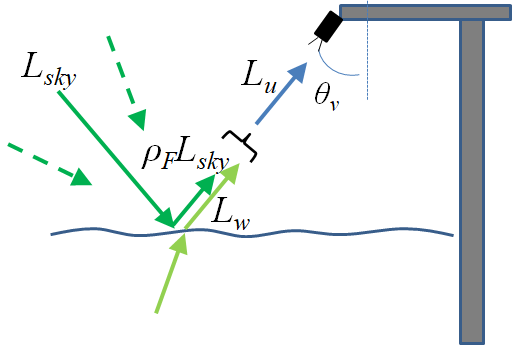
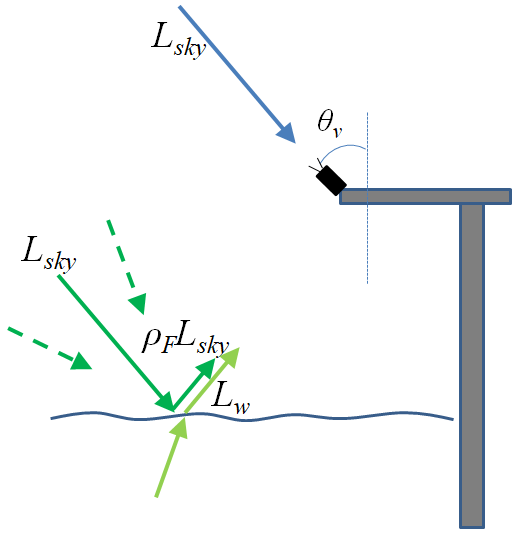
The downwelling sky radiance (Lsky(a)) was measured by pointing the sensor towards the sky at a zenith angle of 40∘ (θv in Fig. 4), to account for the skylight reflection, maintaining the exact same azimuth angle from the solar plane.
A measurement procedure was defined of 21 consecutive measurements which are preceded by the optimization of the spectrometer integration time. Optimization is performed by pointing the optic head of the spectrometer towards the center of the Spectralon panel. Optimization results in automatic setting of gains and offsets for the SWIR detector, automatic setting of the integration time value for the VNIR detector and automatic dark current collection. The instrument was re-optimized after a change in lighting conditions. Then the measurement sequence is as follows.
sequence 1: Ed1(0+), Lu1(a), Lsky1(a), Lu2(a), Lsky2(a), Lu3(a), Lsky3(a)
sequence 2 Ed2(0+), Lu4(a), Lsky4(a), Lu5(a), Lsky5(a), Lu6(a), Lsky6(a)
sequence 3: Ed3(0+), Lu7(a), Lsky7(a), Lu8(a), Lsky8(a), Lu9(a), Lsky9(a)
Each spectrum is saved in digital numbers as an unsigned 16-bit integer. While performing the measurements, start and end times of a measurement sequence were written down, as well as information on the atmospheric conditions and state of the sea surface. The latter were used in the quality control of the data.
The water reflectance (Rw) for sequence 1 is calculated using the following equations (Mobley, 1999):
ρas is the air–sea interface reflection coefficient. For all test sites measurements are being made in estuaries where surface waves are fetch-limited and certainly not related to wind speed by the relationship developed by Cox and Munk (1954). ρas is set to a fixed value of 0.0256 instead of the wind speed formula of Ruddick et al. (2006), based on Mobley (1999).
The average and standard deviations of Rw1, Rw2 and Rw3 are calculated. Rw2 and Rw3 refer to the water reflectance for sequences 2 and 3, respectively.
Finally, an extra white reflectance correction was performed for residual glint by subtracting the water reflectance at 1305 nm from all wavelengths. Several measurements were performed under homogenous overcast sky conditions and it has been shown that a residual white correction improves the results under these conditions (e.g., Garaba and Zielinski, 2013). Pure water absorption is very high at this wavelength such that the water reflectance should be zero. Remaining reflectance at this wavelength is assumed to be related to sky glint.
The quality control is performed as follows.
-
Evaluating the three Ed measurements (Ed1(0+), Ed2(0+), Ed3(0+)) for one sampling. If the difference between the Ed measurements is too high (a threshold of 5000 digital numbers or 7.6 % of the full scale used for difference between measurements), the complete sample is removed. A large difference in Ed indicates highly variable light conditions during the measurements.
-
The standard deviation of Rw1, Rw2 and Rw3 at 750 nm is calculated. When Rw_SD(750)>0.01 the measurement is discarded.
-
After subtracting 1350 nm an inspection is performed of remaining reflection between 1500 and 1700 nm which could be an indication of problems with skylight reflection. All measurements in this wavelength range with Rw>0.005 are removed.
The SeaSWIR dataset contains all water reflectance measurements retained after quality control, as well as the downwelling irradiance (average of Ed1(0+), Ed2(0+), Ed3(0+)), the downwelling sky radiance (average of Lsky1(λ), Lsky2(λ), Lsky3(λ), Lsky4(λ), Lsky5(λ), Lsky6(λ), Lsky7(λ), Lsky8(λ), Lsky9(λ)) the total upwelling radiance (average of Lsky1(λ), Lsky2(λ), Lsky3(λ), Lsky4(λ), Lsky5(λ), Lsky6(λ), Lsky7(λ), Lsky8(λ), Lsky9(λ)) and all standard deviations.
4.2 TRIOS water reflectance
The water reflectance is measured with three TriOS-RAMSES hyperspectral spectroradiometers. Two spectroradiometers measure radiance and one measures the downwelling irradiance. The instruments are mounted on a frame, which is projected over the side of the platform using a 2 m horizontal tube. Zenith angles of the sea- and sky-viewing radiance sensors are 40∘. The azimuth angle of the sensors is adjusted prior to each measurement to obtain a relative azimuth angle with respect to the Sun of 90∘, either left or right (depending on which angle has an unobstructed view of the water). Measurements are made for 10 min, taking a scan of the three instruments every 10 s. The TRIOS sensors measure from 350 to 950 nm, which is a more limited wavelength range compared to the ASD. The sampling interval of the TRIOS is approximately 3.3 nm and the spectral width is about 10 nm. Position is measured simultaneously by GPS. Data were acquired with the MSDA-XE software and radiometrically calibrated using nominal calibration constants. Calibrated data for , , and are interpolated to 2.5 nm intervals and exported to MATLAB or R for further processing. Data are recalibrated using calibration updates from annual laboratory or factory calibrations. Full details of the data processing, including scan selection and averaging and quality control, are described in Ruddick et al. (2006), including its Web Appendix 1, except that a fixed value of 0.0256 is used for the air–sea interface reflection coefficient in sunny conditions, instead of the wind speed formulation, because of the fetch-limited surface wave field, as explained previously for the ASD data in Sect. 4.1.
4.3 Total suspended matter concentration
TSM was analyzed from water samples collected and filtered in the field. The filters for the TSM analysis (Whatman GF/F filters with a nominal pore size of 0.7 µm) were first prepared in the laboratory before transportation to the test site. The filters were placed in an aluminum plate and ashed for 1 h at 450 ∘C, and then they were dried for 12 h at 60 ∘C in an oven. All filters were weighted, stored in Petri dishes and transported to the test sites.
At the test sites, water samples were collected in brown bottles just below the water surface. The water (volumes of 3 to 100 mL) was filtered in triplicate through the filters at low vacuum pressure. The exact volume filtered depended on the turbidity of the water as recommended by Neukermans et al. (2012), which was measured on site as described in Sect. 4.4. Each filter was then rinsed with Milli-Q water (250 mL) and stored in a freezer on site. They were transported in dry ice to the laboratories (LOV and/or VITO). Here they were temporarily stored at −80 ∘C. Finally, they were dried for 24 h at 60 ∘C and weighed again in a dry atmosphere.
Systematically the water samples were filtered in triplicates in order to determine the precision of the TSM concentration measurements. After removal of outliers the average of the triplicates was used for further analysis. When TSM was measured by both the VITO and LOV laboratories, the average was also used here.
4.4 Turbidity
Turbidity was measured using portable HACH 2100P and 2100QIS turbidimeters as in Nechad et al. (2009). The instrument records turbidity between 0 and 1000 FNU, with a resolution of three significant figures. A 10 mL vial is filled with the surface water sample and illuminated by a light-emitting diode with emission at 860±60 nm. The instrument measures turbidity via the ratio of light scattered at an angle of to forward-transmitted light as compared to the same ratio for a standard suspension of formazin. This optical measurement technique of turbidity is in accordance with ISO 7027 (1999), and determines turbidity in formazin nephelometric units (FNUs). Turbidity was recorded in triplicates that were averaged. Turbidities of the STABLCAL stabilized formazin turbidity 10 or 20, 100 and 800 FNU standards and that of pure water were recorded after each sampling campaign to check the instrument stability.
5.1 ASD and TRIOS reflectance
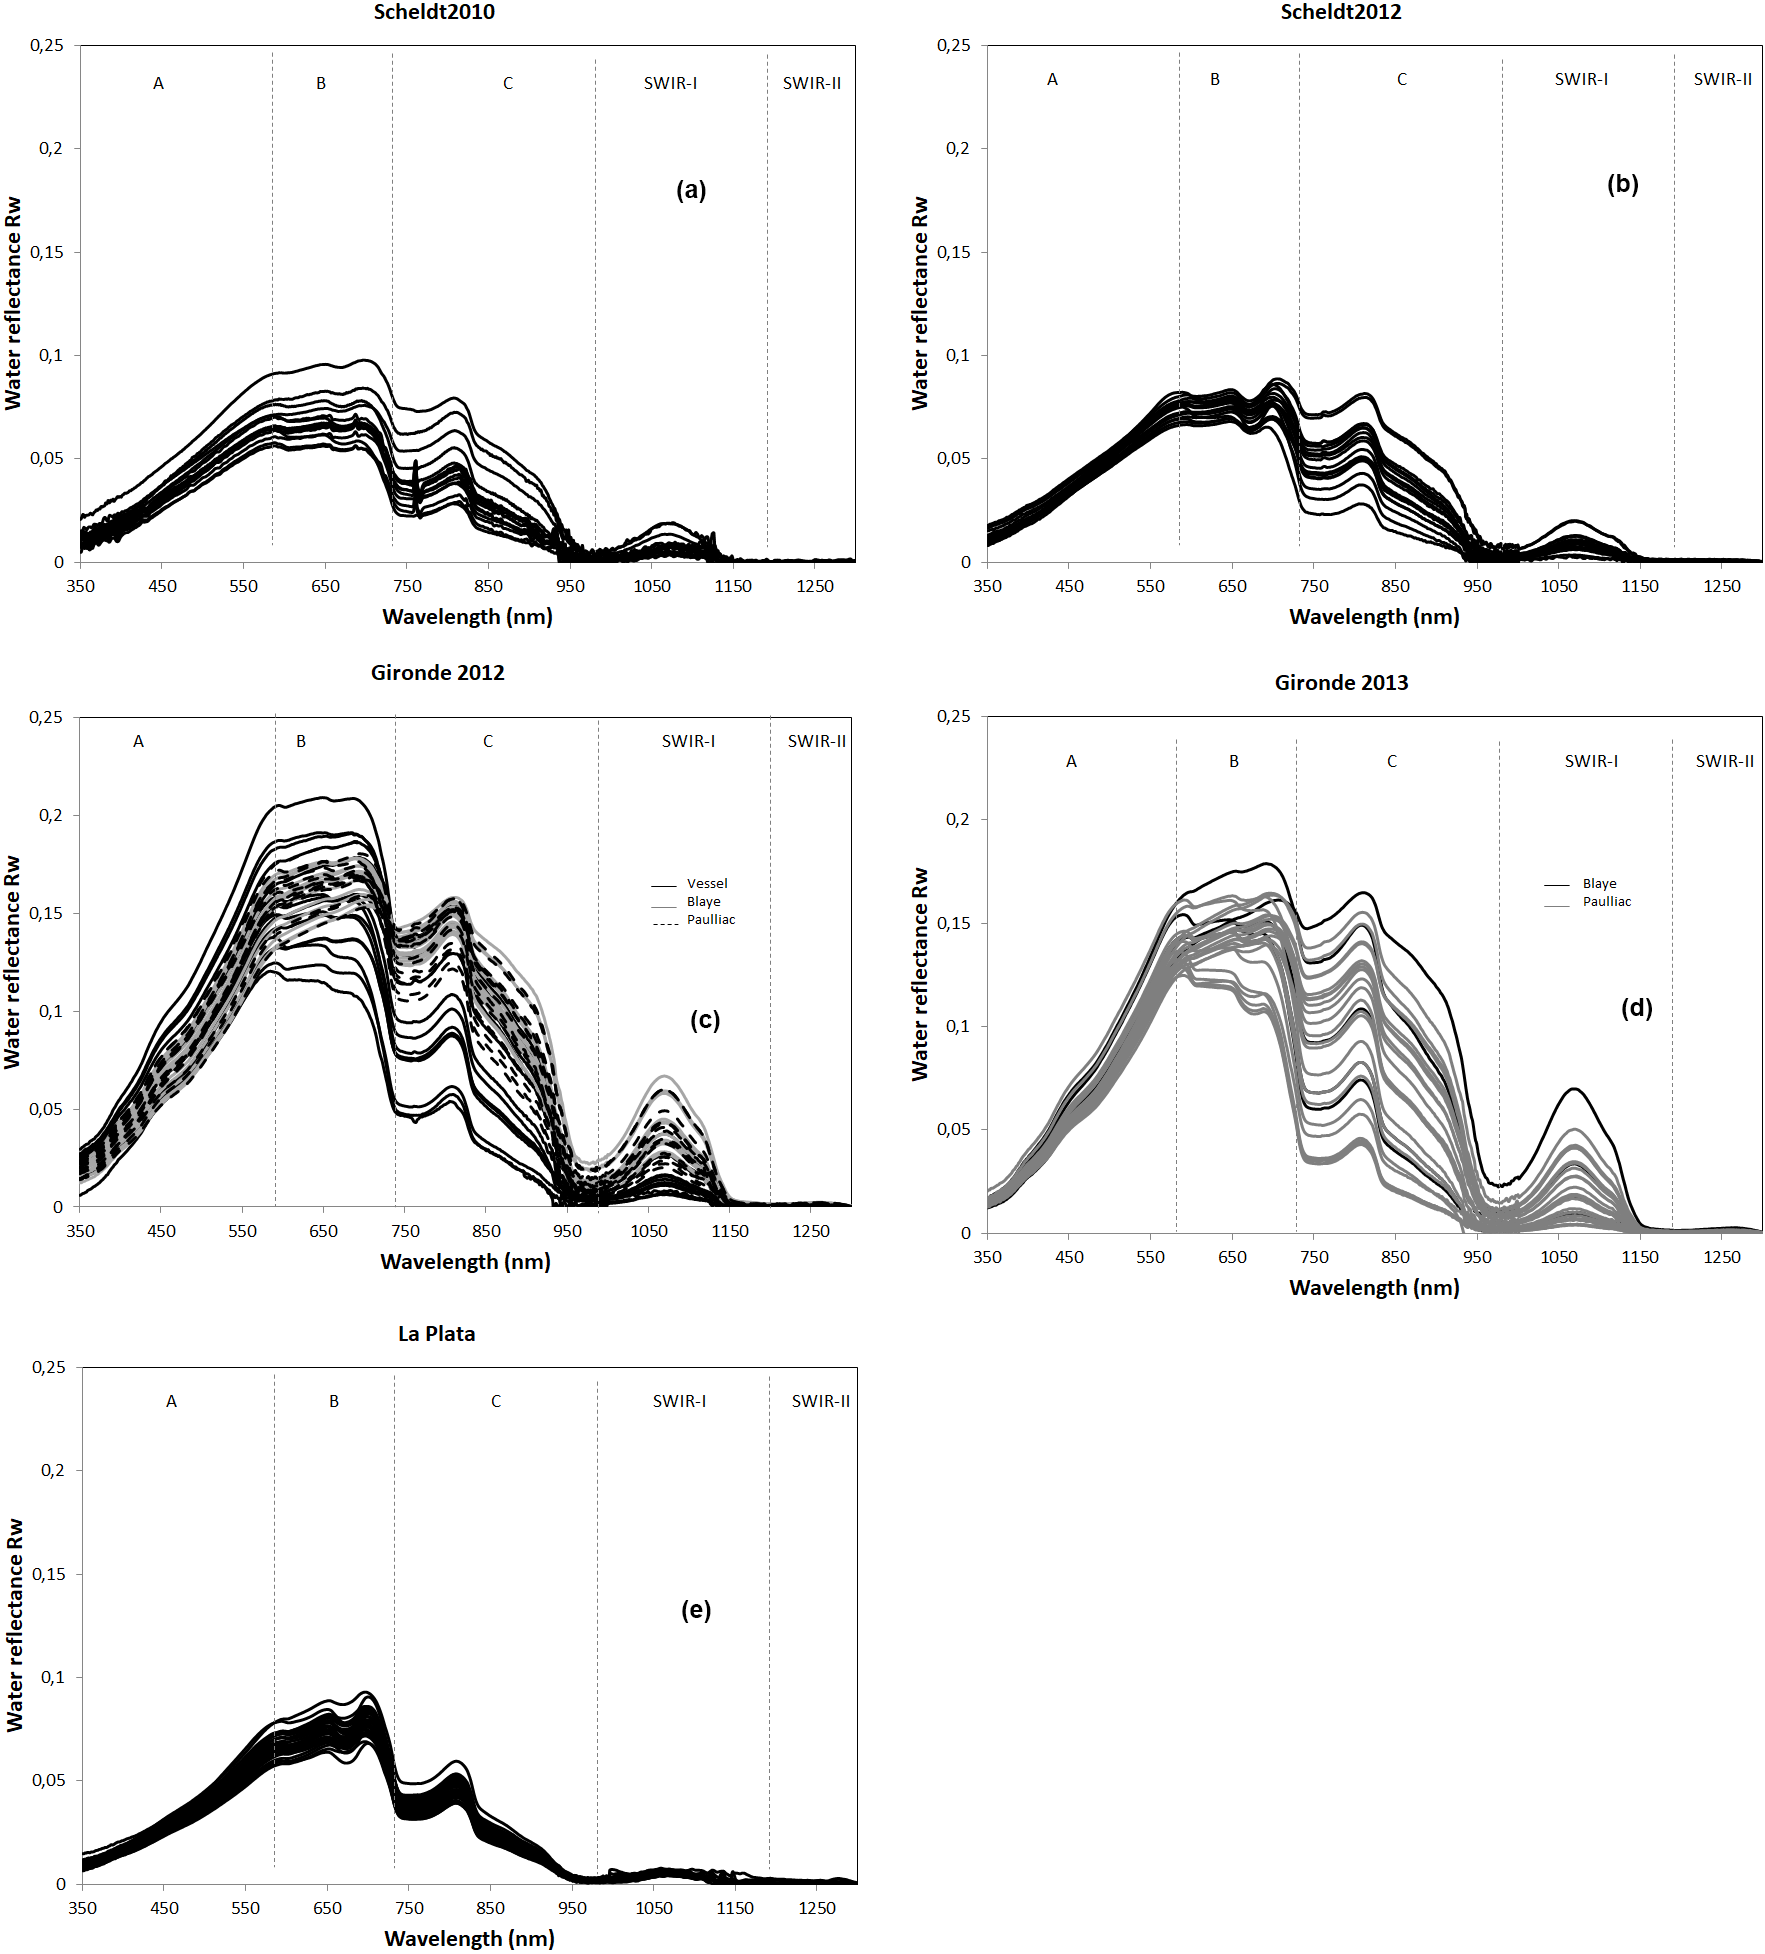
The SeaSWIR reflectance dataset is generally characterized by low reflectance values at short wavelengths (<450 nm), peak reflectance values between 600 and 720 nm and significant contributions in the NIR and SWIR-I parts of the spectrum – see Fig. 5. However, significant variations exist among the different test sites. To further explain these differences, the water reflectance spectra for all data campaigns are displayed in Fig. 5 from 350 to 1300 nm. Beyond 1300 nm the pure water absorption is extremely high (>140 m−1) and there is no reflectance emerging from the water. In Fig. 5, five characteristic spectral regions are defined between 350 and 1300 nm: (A) between 350 and 600 nm, (B) between 600 and 720 nm, (C) in the NIR between 720 and 1000 nm, and finally regions corresponding to (D) SWIR-I (1000–1200 nm) and (E) SWIR-II.
The spectra for the Scheldt (data campaigns Scheldt2010 and Scheldt2012, Fig. 5a and b) have overall high reflectance values. In region A the spectra have a similar slope related to light absorption of CDOM and non-algal particles. In region B, maximum reflectance values are found of up to 0.1 and the spectra show clear changes in shape and magnitude. The influence of light absorption by chlorophyll a, for example, is clearly noticeable around 665 nm in the Scheldt2012 dataset. In region C, there is more variability in the magnitude of the spectra more related to the concentration of particles, while spectral variability is determined by pure water absorption (Ruddick et al., 2006). In SWIR-I a significant signal can be observed with maxima around 0.02 (at 1071 nm). In SWIR-II the maximum reflectance is 0.001 at 1268 nm. The shape of the water reflectance spectrum in the SWIR is also clearly influenced by pure water absorption (Knaeps et al., 2012).
The spectra for La Plata are shown in Fig. 5e. All the spectra have a very similar shape and have only small differences in magnitude. Maximum reflectance values are found around 700 nm with values of up to 0.1. There is also a local minimum around 665 nm probably related to chlorophyll a absorption. There is a very weak signal in SWIR-I (maximum 0.007 at 1071 nm), and no significant signal in SWIR-II.
The Gironde spectra (data campaigns Gironde2012 and Gironde2013, Fig. 5c and d) have extremely high values, up to 0.2 around 700 nm. Also here, a saturation effect (little or no increase in reflectance with increasing TSM concentrations) is observed at the shorter wavelengths in region A, followed by a spectral region with high reflectance (B) with maximum values at 500 and 700 nm. In region C very large variability in reflectance values is observed. A reflectance signal of up to 0.07 is observed in SWIR-I and a small signal is observed in SWIR-II (the highest reflectance signal is 0.0028 at 1276 nm). For the MODIS and VIIRS bands at 1240 nm, a maximum reflectance of 0.0026 is measured. Two measurements have Rw(1240) above 0.002 and six measurements have Rw(1268) above 0.002.
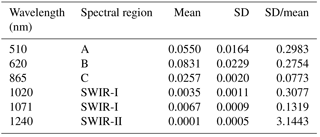
To compare the reflectance spectra from the three estuarine sites, all reflectance spectra with a TSM concentration around 100 mg L−1 for all three sites are plotted in Fig. 6 (exact concentrations: 96 and 105 mg L−1 for the Gironde; 91, 93, 96 and 110 mg L−1 for La Plata; 102, 107 and 110 mg L−1 for the Scheldt River). The mean and standard deviation (SD) from all spectra are calculated at six different wavelengths (510, 650, 865, 1020, 1071 and 1240 nm) and are presented in Table 3. From the figure it can be observed that the reflectance spectra in A and B spectral regions are very different (SD/mean = 0.298 and 0.275, respectively), mainly due to the high reflectance values observed for the Gironde. Furthermore, in region B the reflectance spectra for the Scheldt are flatter than the reflectance spectra for Río de la Plata, which gradually increase to a maximum reflectance around 695 nm. All spectra exhibit a similar shape above 700 nm clearly related to the pure water absorption. For the same TSM concentration the reflectance spectra are very similar at 865 and 1071 nm (SD/mean = 0.077 and 0.13, respectively). Finally, a clear reflectance signal is observed for all sites in SWIR-I, but no significant signal for SWIR-II can be detected. The reflectance increase observed around 1275 nm for one spectrum from Río de la Plata is treated as a measurement error.
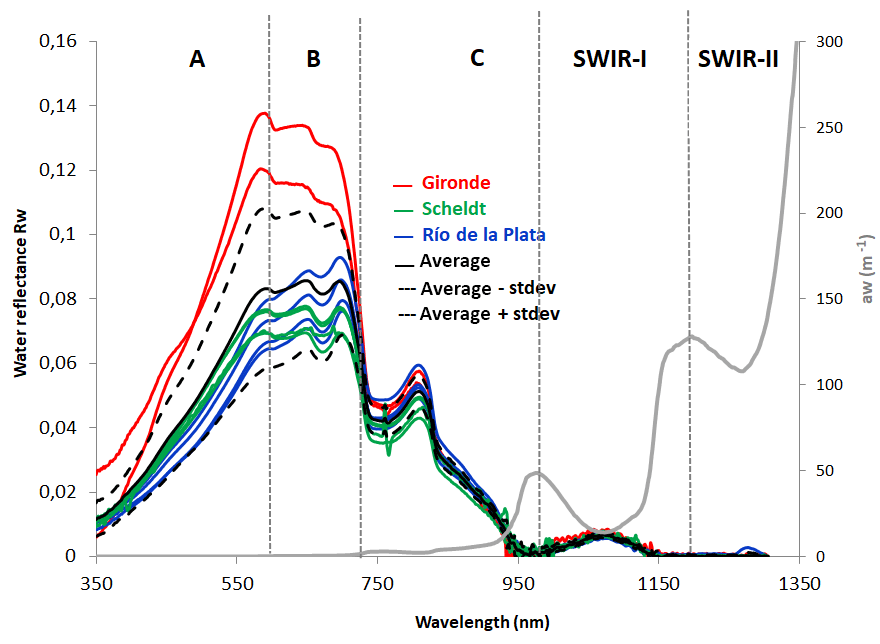
Figure 6Water reflectance spectra with a TSM concentration of ∼100 mg L−1 for the Scheldt (n=4), Río de la Plata (n=4) and Gironde (n=2) estuaries. The average of all spectra is shown as a black solid line. The average minus and plus the standard deviation is shown in dashed black line. The pure water absorption coefficient (Pope and Fry, 1997; Kou et al., 1993) is shown in light grey.
Table 3Statistics for the ASD reflectance for the reflectance spectra shown in Fig. 6 with a TSM concentration of ∼100 mg L−1.
5.2 Intercomparison ASD-TRIOS
For all stations where both TRIOS and ASD reflectance is available, the correlation is shown in Fig. 7 for six spectral bands. The best correlation is obtained for the shortest wavelengths (412, 490 and 555 nm) with a correlation coefficient of 0.98. The correlation coefficient for the longer wavelengths (683, 780 and 865 nm) is slightly lower (0.93) and more scatter is observed. Again, we can observe slightly higher water reflectance values for the TRIOS. Overall these results are very satisfying and give confidence in the ASD measurement methodology and processing.
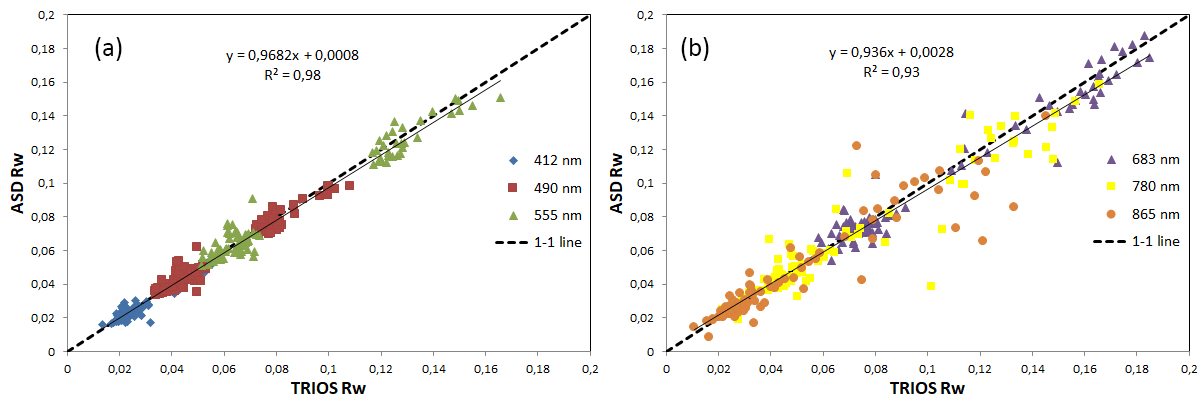
Figure 7ASD water reflectance versus TRIOS water reflectance (a) for wavelengths at 412, 490 and 555 nm and (b) for wavelengths at 683, 780 and 865 nm.
5.3 TSM and turbidity results
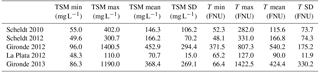
The mean, minimum, maximum and standard deviation of the TSM concentrations and turbidity measurements are shown in Table 4 and Fig. 8. Based on the triplicates, the accuracy was excellent (<5 % on average) for the Scheldt and the Gironde and ∼10 % for La Plata. When interpreting these results, it should be noted that for the Gironde 2012 campaign, only limited turbidity measurements were available (only for the last measurement day in Pauillac).
TSM concentrations measured over the three sites range from 48 mg L−1 up to extreme values of 1400 mg L−1. Turbidity ranged from 48 to 1422 FNU (calculated with dilutions). At the pontoon of Pauillac, the highest TSM concentrations were recorded and the lowest were recorded at La Plata. The TSM concentration in the Gironde follows the tidal cycle and can vary by 1 order of magnitude in 1 day (standard deviations of 294 and 269 mg L−1 for Gironde 2012 and Gironde 2013, respectively). Little variation was observed in La Plata with a TSM standard deviation of 15 mg L−1.

A few water samples from the Gironde and Scheldt campaigns were analyzed for TSM at both the VITO and LOV laboratories. Figure 9 shows the relationship between both. The correlation is high (R2 is 0.96) and there is only a very small offset of 0.8 mg L−1.

5.4 Intercomparison: TSM–turbidity
The TSM–turbidity relationship for all sites is linear, with a correlation coefficient of 0.96 (Fig. 10a). The outlier observed at 456 FNU and 176 mg L−1 TSM is station gir61 from the Gironde 2012 campaign (second measurement day at Pauillac). The trend line is slightly steeper than the 1-1 line and there is a negative offset of −9.7 mg L−1. Figure 10b shows the TSM–turbidity relationship with the different sites in different colors and Fig. 10c zooms in on the data with TSM concentration below 300 mg L−1. Slightly different relationships can be observed for the different sites, with the Gironde trend line matching more closely the 1-1 line and the Scheldt and la Plata trend lines more deviating. This can be related to the different particle size and composition at the sites and suggests that different relationships are needed when converting T to TSM.
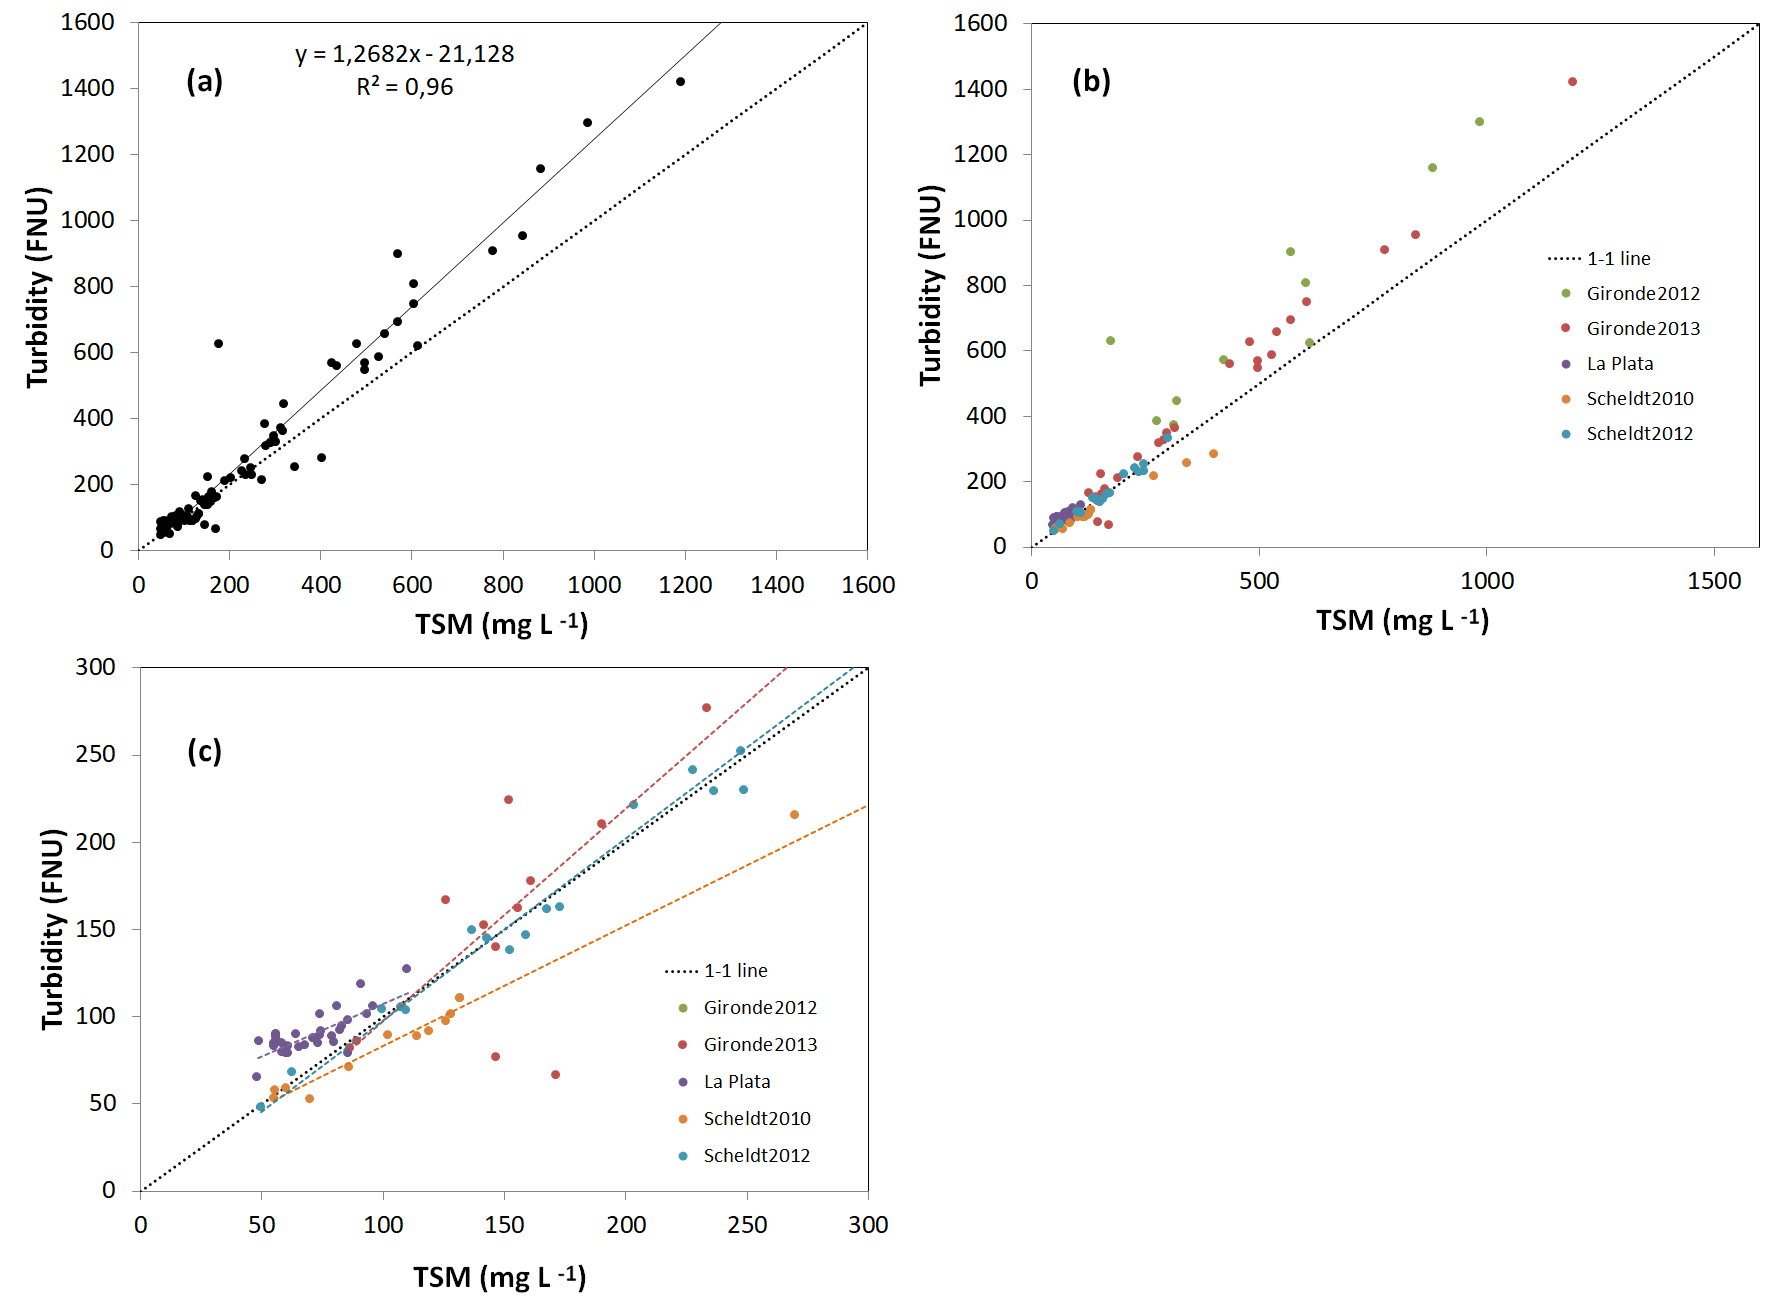
Figure 10Intercomparison TSM and turbidity (a) for all sites, (b) different sites in different colors and (c) zooming in on lower concentrations of up to 300 mg L−1.
The SeaSWIR dataset has been made publicly available (https://doi.org/10.1594/PANGAEA.886287, Knaeps et al., 2018).
The SeaSWIR dataset presents the first hyperspectral measurements of the water reflectance in the SWIR. Measuring water reflectance in the SWIR was made possible by using an ASD spectrometer with one radiometer and a measurement protocol where the instrument is turned facing the sky, the water and the Spectralon panel. Using this measurement protocol and consecutive post-processing it was shown, by intercomparison with TRIOS measurements, that high-quality water reflectance measurements can be made with the ASD. It is however suggested to strictly follow the same procedure as outlined in this paper and apply a strict quality control. Measurements which passed quality control were all performed under relatively constant atmospheric conditions, being blue sky or completely overcast. Variable light conditions prohibit a correct retrieval of the water reflectance as lighting conditions change while turning the instrument and making the three individual measurements of downwelling irradiance, the total upwelling radiance and downwelling sky radiance. It should also be noted that most measurements were made from fixed pontoons, which simplifies the measurement significantly and improves the quality of the data. Still, even when measuring on a pontoon, the location on the pontoon should be chosen wisely and should not be close to any large obstacles which could alter the measurements of the downwelling irradiance and downwelling sky radiance.
The quality of this dataset opens up the possibility of including the ASD in future measurement campaigns on water, for the development of algorithms as well as for calibration and validation of satellite and airborne observations. This is important for current (e.g., Sentinel-3 OLCI) and future (e.g., Environmental Mapping and Analysis Program – EnMAP, Hyperspectral Precursor and Application Mission – PRISMA and Sentinel-10) satellite missions with more spectral bands in the SWIR-I and SWIR-II.
Next to the water reflectance measurements, the SeaSWIR dataset also contains simultaneous TSM and turbidity measurements (using a HACH portable turbidity meter). The high quality of these measurements was confirmed by the standard deviation of the triplicates and the duplicate measurements performed in the LOV and VITO laboratories. As all measurements were made in estuaries during the tidal cycle, the TSM range of the SeaSWIR dataset is very high, ranging from 48 mg L−1 up to extreme values of 1400 mg L−1. Hence, the SeaSWIR dataset is not only unique in terms of its spectral content, but also in terms of its concentration range.
EK, KR, AD and DD designed all the experiments. EK and SS defined the ASD measurement procedure. All the authors contributed to the field campaigns.
The authors declare that they have no conflict of interest.
The research leading to these results has received funding from the Belgian
Science Policy Office through the STEREO program (SeaSWIR project).
Edited by: David Carlson
Reviewed by: Ken Voss and one anonymous referee
Chen, M. S., Wartel, S., Van Eck, B., and Van Maldegem, D.: Suspended matter in the Scheldt estuary, Hydrobiologia, 540, 79–104, 2005.
Cox, C. and Munk, W.: Measurements of the Roughness of the Sea Surface from Photographs of the Sun's Glitter, J. Opt. Soc. Am., 44, 834–850, 1954.
Doerffer, R.: MERIS case 1 validation: Performance of the NN case 2 water algorithm for case 1 water, MERIS Validation Team Meeting, ESA ESRIN, Frascati, 20–24 March 2006.
Dogliotti, A. I., Ruddick, K., Nechad, B., and Lasta, C.: Improving water reflectance retrieval from MODIS imagery in the highly turbid waters of La Plata River, Proceedings of VI International Conference “Current Problems in Optics of Natural Waters”, Publishing House “Nauka” of RAS, St. Petersburg, Russia, 2011.
Dogliotti, A. I., Camiolo, M., Simionato, C., Jaureguizar, A., Guerrero, R., and Lasta, C.: First optical observations in the turbidity maximum zone in the Río de la Plata estuary: A challenge for atmospheric correction algorithms, Proceeding of Ocean Optics XXII Conference, 26–31 October 2014, Portland (ME), United States of America, 2014.
Doron, M., Bélanger, S., Doxaran, D., and Babin, M.: Spectral variations in the nearinfrared ocean reflectance, Remote Sens. Environ., 115, 1617–1631, 2011.
Doxaran, D., Cherukuru, C. R. C., Lavender, S. J., and Moore, G. F.: Use of a spectralon panel to measure the downwelling irradiance signal: case studies and recommendations, Appl. Optics, 43, 5981–5986, 2004.
Doxaran, D., Froidefond, J. M., Castaing, P., and Babin, M.: Dynamics of the turbidity maximum zone in a macrotidal estuary (the Gironde, France): Observations from field and MODIS satellite data, Estuar. Coast. Shelf S., 81, 321–332, 2009.
Garaba, S. P. and Zielinski, O.: Methods in reducing surface reflected glint for shipborne above-water remote sensing, J. Eur. Opt. Soc.-Rapid, 8, available at: http://www.jeos.org/index.php/jeos_rp/article/view/13058, 2013.
Knaeps, E., Raymaekers, D., Sterckx, S., Ruddick, K., and Dogliotti, A. I.: In-situ evidence of non-zero reflectance in the OLCI 1020 nm band for a turbid estuary, Remote Sens. Environ., 120, 133–144, 2012.
Knaeps, E., Ruddick, K. G., Doxaran, D., Dogliotti, A. I., Nechad, B., Raymaekers, D., and Sterckx, S.: A SWIR based algorithm to retrieve Total Suspended Matter in extremely turbid waters, Remote Sens. Environ., 168, 66–79, 2015.
Knaeps, E., Doxaran, D., Dogliotti, A. I., Nechad, B., Ruddick, K., Raymaekers, D., and Sterckx, S.: The SeaSWIR dataset, PANGAEA, https://doi.org/10.1594/PANGAEA.886287, 2018.
Kou, L., Labrie, D., and Chylek, P.: Refractive índices of water and ice in the 0.65–2.5 m spectral range, Appl. Optics, 32, 3531–3540, 1993.
Mobley, C. D.: Estimation of the remote-sensing reflectance from above-surface measurements, Appl. Optics, 38, 7442–7455, 1999.
Moore, G., Lavender, S., Kratzer, S., Icely, J., and Huot, J.-P.: The MERIS bright pixel atmospheric correction: evolution, performance assessment and validation for the MERIS 3rd reprocessing, Proceedings of the Ocean Optics XX conference, Anchorage, USA, 27 September–1 October 2010.
Nechad, B., Ruddick, K. G., and Neukermans, G.: Calibration and validation of a generic multisensor algorithm for mapping of turbidity in coastal waters, SPIE European International Symposium on Remote Sensing, Berlin, 2009.
Neukermans, G., Ruddick, K., Loisel, H., and Roose, P.: Optimization and quality control of suspended particulate matter concentration measurement using turbidity measurements, Limnol. Oceanogr.-Methods, 10, 1011–1023, 2012.
Pope, R. M. and Fry, E. S.: Absorption spectrum (380–700 nm) of pure water. II. Integrating cavity measurements, Appl. Optics, 36, 8710–8723, 1997.
Ruddick, K. G., Cauwer, V. D., Park, Y. J., and Moore, G.: Seaborne measurements of near infrared water-leaving reflectance: The similarity spectrum for turbid waters, Limnol. Oceanogr., 51, 1167–1179, 2006.
Shi, W. and Wang, M.: An assessment of the black ocean pixel assumption for MODIS SWIR bands, Remote Sens. Environ., 113, 1587–1597, 2009.