the Creative Commons Attribution 4.0 License.
the Creative Commons Attribution 4.0 License.
 | 02 Jul 2018
Eleven years of mountain weather, snow, soil moisture and streamflow data from the rain–snow transition zone – the Johnston Draw catchment, Reynolds Creek Experimental Watershed and Critical Zone Observatory, USA
Sarah E. Godsey
Danny Marks
Patrick R. Kormos
Mark S. Seyfried
Clarissa L. Enslin
Adam H. Winstral
James P. McNamara
Timothy E. Link
Detailed hydrometeorological data from the rain-to-snow transition zone in mountain regions are limited. As the climate warms, the transition from rain to snow is moving to higher elevations, and these changes are altering the timing of downslope water delivery. To understand how these changes impact hydrological and biological processes in this climatologically sensitive region, detailed observations from the rain-to-snow transition zone are required. We present a complete hydrometeorological dataset for water years 2004 through 2014 for a watershed that spans the rain-to-snow transition zone (https://doi.org/10.15482/usda.adc/1402076). The Johnston Draw watershed (1.8 km2), ranging from 1497 to 1869 m in elevation, is a sub-watershed of the Reynolds Creek Experimental Watershed (RCEW) in southwestern Idaho, USA. The dataset includes continuous hourly hydrometeorological variables across a 372 m elevation gradient, on north- and south-facing slopes, including air temperature, relative humidity, and snow depth from 11 sites in the watershed. Hourly measurements of incoming shortwave radiation, precipitation, wind speed and direction, soil moisture, and soil temperature are available at selected stations. The dataset includes hourly stream discharge measured at the watershed outlet. These data provide the scientific community with a unique dataset useful for forcing and validating hydrological models and will allow for better representation and understanding of the complex processes that occur in the rain-to-snow transition zone.
- Article
(2751 KB) - Full-text XML
- BibTeX
- EndNote


As the climate warms and many mountain regions shift from snow domination to a mix of rain and snow, we need to understand how these changes will alter hydrologic response (Stewart, 2009). Hydrometeorological conditions in the rain-to-snow transition zone are dynamic, with phase changes occurring over short distances and durations (Marks et al., 2013), and while comprehensive datasets are needed, data availability is limited. We present a detailed, serially complete, hourly hydrometeorological dataset from the rain-to-snow transition zone to improve understanding of these complex regions.
The rain-to-snow transition zone in mountainous regions is the elevation band where precipitation phase varies between rain, snow, or a mixture of rain and snow throughout the winter season and oftentimes during single storm events (Marks et al., 2013). In the northwestern US, the elevation of the rain-to-snow transition zone currently ranges from approximately 1500 to 1800 m (Nayak et al., 2010), covering ∼1 % of total land area in the region (Nolin and Daly, 2006). This broad characterization is not stationary in space or time, however, and its extent varies with climate conditions, latitude, and distance from the ocean. The precipitation regime in the current rain-to-snow transition zone in the northwestern US is expected to shift from a transitional to rain-dominated system as the climate warms and the zone moves up in elevation (Nayak et al., 2010; Klos et al., 2014). Mountain rain-to-snow transition zones are important to study because they are particularly sensitive to changes in climate (Klos et al., 2014). Because these areas frequently experience winter temperatures near 0 ∘C (Mote, 2003; Kormos et al., 2014), small changes in weather conditions can alter seasonal snow cover, the timing of melt, the delivery of liquid water to soil and streams, and, ultimately, the ecosystems they sustain.
Although the rain-to-snow transition zone is recognized as important on regional and continental scales (e.g., Mote et al., 2005; Klos et al., 2014; Trujillo and Molotch, 2014; Lute et al., 2015), it is surprisingly poorly characterized. Published watershed-scale datasets of precipitation, temperature, humidity, wind, radiation, snow, and resultant streamflow representative of an entire basin spanning the rain-to-snow transition are limited. We conducted a meta-analysis in order to determine published data availability in the rain-to-snow transition zone. We did this by searching the key words “rain-snow transition data” OR “rain snow zone data” in Web of Science (search date: 5 February 2018). Out of the 91 returns, only 5 publications (5.4 %) had published freely available hydrometeorological data in the rain-to-snow transition zone. These five datasets are from (1) a small catchment in the Dry Creek Experimental Watershed (DCEW) in southwestern Idaho, US (Kormos et al., 2014b), (2) various small- to medium-sized watersheds in the contiguous US (Newman et al., 2015), (3) a site in Washington Cascades, US (Wayand et al., 2015), (4) various sub-watersheds from the Reynolds Creek Experimental Watershed (RCEW) southwestern Idaho (Marks et al., 2013), and (5) a site in Davos, Switzerland (WSL Institute for Snow and Avalanche Research SLF, 2015). The remaining 86 returns either were conducted in watersheds that did not span the rain-to-snow transition or the data associated with their research were neither published nor easily available for public use. It is possible that additional datasets exist, but were not discovered using the search terms that we applied (e.g., data from the H.J. Andrews Long-Term Ecological Research site, Oregon, USA, and a site at Col de Porte, France; Morin et al., 2012). Although data presented by Morin et al. (2012), Wayand et al. (2015), and the WSL Institute for Snow and Avalanche Research SLF (2015) are useful, our dataset is unique because it includes basin-wide measurements and stream discharge, which permit hydrologic modeling and a mass balance approach to validation using soil moisture and streamflow records.
In this paper, we present a comprehensive hydrometeorological dataset for 11 water years (WY, 1 October through 30 September) from WY2004 to WY2014 for the Johnston Draw (JD) watershed that spans the rain-to-snow transition zone in southwestern Idaho. The dataset is unique not only because the site falls within this climatically sensitive zone, but also because it has instrumentation that encompasses information on the effects of both elevation and aspect on snow accumulation and melting, and soil moisture and temperature. The dataset includes measurements of soil temperature and moisture that support studies of the interactions between the atmosphere and the ground surface. The dataset spans a time period in which conditions were warmer than previous years of record in the RCEW (Nayak et al., 2010; Kormos et al., 2017), possibly representing what can be expected as regional climate warming advances. Our objective is to provide this high spatiotemporal resolution dataset to study short-term variations at intra-event, intra-annual, and inter-annual scales, and we plan to continue these observations to assess long-term climatic trends at the sensitive rain-to-snow transition zone.
The JD is a 1.8 km2 sub-watershed of the RCEW and is located in southwestern Idaho (Fig. 1). The RCEW is managed by the US Department of Agriculture (USDA) Agricultural Research Service (ARS) Northwest Watershed Research Center (NWRC) and is also a National Science Foundation Critical Zone Observatory (CZO). The elevation at the JD ranges between 1497 and 1869 m, spanning the rain-to-snow transition zone where the precipitation phase at higher elevations is snow-dominated, and rain-dominated at lower elevations. Over the period of record, magnitude-weighted incoming precipitation was 39 and 53 % snow at the lowest and highest precipitation gages, respectively. The annual average air temperature is 8.1 ∘C, with precipitation averaging 609 mm annually, based on all measurement sites (also see Table 1). Vegetation on the north-facing slopes is characterized by snowberry (Symphoricarpos), big sagebrush (Artemisia tridentate), aspen (Populus tremuloides) groves and low sagebrush (Artemisia arbuscula) with wheatgrass (Elymus trachycaulus), while south-facing slope vegetation includes Artemisia arbuscula, Elymus trachycaulus, mountain mahogany (Cercocarpus ledifolius), and bitterbrush (Purshia tridentate) (Stephenson, 1970). The dominant soil texture on both north- and south-facing slopes is classified as sandy loam and soils are shallower (∼50 cm deep) on south-facing slopes compared to north-facing slopes (∼100 cm deep) (USDA, 2015). North-facing slopes are slightly steeper with an average slope of 16.8∘, whereas the average south-facing slopes are 13.9∘ (Patton, 2016). The bedrock in the watershed consists mainly of granitic rock (79 %), with some basalt (3 %), and welded tuff (18 %) (Stephenson, 1970).
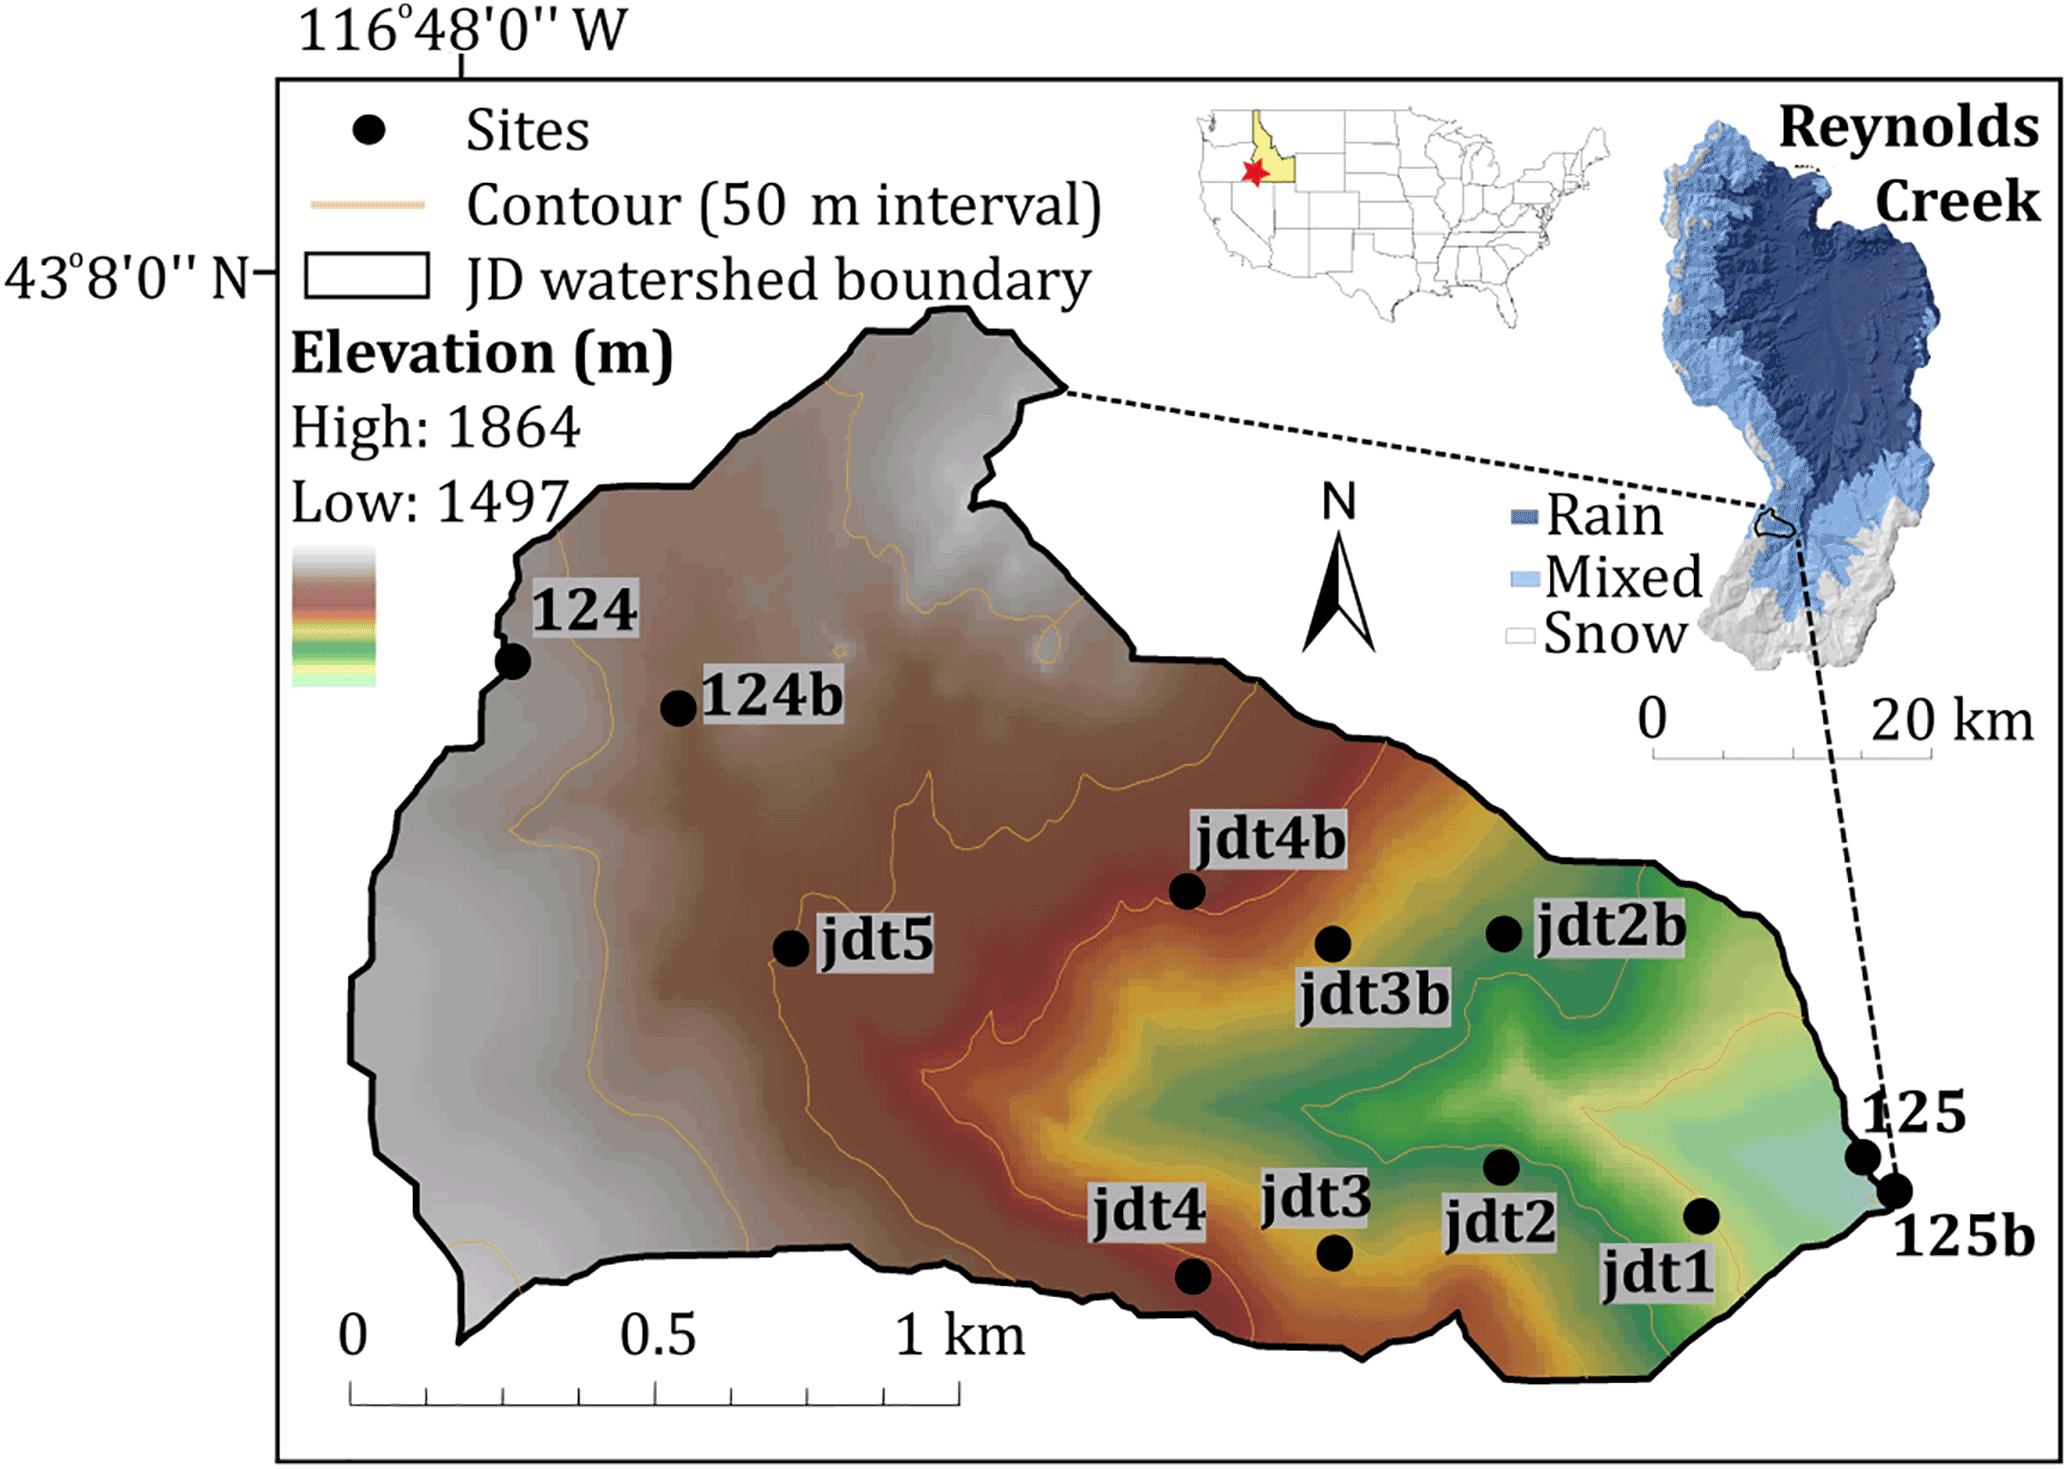
Figure 1Johnston Draw (JD) with instrumentation location. For more information on each site, refer to Table 1 and the naming convention file attached to the data.
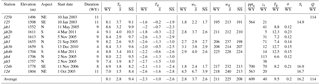
Table 1Stations within Johnston Draw watershed, their elevations, and available parameters at each station. Although data presented in this dataset are limited to the end of WY2014 (30 September 2014), data from all stations continue further than WY2014 as all stations are currently maintained. Full station names used by the USDA ARS and recorded in the published dataset include the prefix “rc.tg.dc.jd-” before each abbreviated station name recorded in the first column of this table; however, for simplicity, these abbreviated station names are used throughout this paper. A full naming convention is provided in the Naming Convention file with the published dataset. Because Td was calculated based on RH (see text for details), RH is not summarized here, but is available at all stations except 125b (streamflow station). Start date is presented as DD-mmm-YYYY. Ta – air temperature (∘C), Td – dewpoint temperature (∘C), ws – wind speed (m s−1), wd – wind direction (0–359∘, 0 = north; 180 = south), ppta – wind-corrected precipitation (mm), zs – snow depth (mm), Tg – soil temperature at 20 cm depth (∘C), θ – soil water or moisture at 20 cm depth (m3 m−3), Si – incoming solar radiation (MJ m−2 day−1), Q – streamflow (mm), mean WY value, mean storm value, and = mean non-storm value. for Tg and θ at 124b were calculated based on the two subsurface measurement locations at this site (see text for details). Note that Si and Q units have been converted from the database to the units reported here for comparison across parameters and sites. Snow depth is averaged over WY2011–2014 for all sites to facilitate meaningful comparisons.
3.1 Instrumentation overview
The dataset includes data from 11 meteorological stations and 1 streamflow station (Table 1). Three full meteorological stations (124, 124b, and 125) measure an extensive suite of variables, including air temperature, relative humidity, wind speed and direction, incoming shortwave radiation, precipitation, snow depth, and soil temperature and moisture. The additional eight meteorological stations (jdt1, jdt2, jdt3, jdt4, jdt5, jdt2b, jdt3b, and jdt4b) measure select variables for specific purposes (see Table 1 and below for details). In 2002, the ARS installed full meteorological stations at the bottom (site 125) and top (site 124) of the JD, and a weir at the outlet (site 125b). During 2003–2005, an additional five meteorological stations (jdt1, jdt2, jdt3, jdt4, and jdt5) were installed on the north-facing side of the JD to provide measurements of air temperature (Ta), humidity (RH), wind speed and direction (ws and wd, respectively), and snow depth (zs, equivalent to HS in the International Seasonal Snow Classification established by Fierz et al., 2009) – so that along with stations 125 at the bottom and 124 at the top – a measurement site was established for every 50 m of elevation in the JD catchment. In 2005, a full meteorological station (site 124b) was established in an aspen grove near the top of the JD to provide weather data at a wind-sheltered site. In 2010, three additional stations (jdt2b, jdt3b, and jdt4b) were installed on the south-facing side of the JD, at roughly the same elevations as jdt2, jdt3 and jdt4 on the north-facing side (Fig. 1). At the same time, instruments to measure soil temperature (Tg) and moisture (θ) were added to 8 of the 11 sites (jdt1, jdt2, jdt3, jdt4, jdt2b, jdt3b, jdt4b, and 124b) starting at 5 cm depth below the surface and then every ∼15 to 50 cm depth. Sensors were also placed at 75, 90 and 100 cm below the ground surface wherever possible. The maximum depth at each site depends on the depth to bedrock because the instruments could not be installed in bedrock or saprolite. Two soil profiles were installed at 124b due to large vegetation differences within a small area: 124ba, which is located in an aspen grove, and 124bs, which is located in mountain sagebrush. Details of the sensors used to measure each parameter, as well as the sensor accuracy, operating range, and temperature dependence are provided with the data.
3.2 Meteorological data
All data presented here were checked for time inconsistencies based on the World Meteorological Organization's QA∕QC standards (Zahumenský, 2004), using the plausible instantaneous value ranges and maximum/minimum step changes outlined therein. The data were corrected and gap-filled using linear interpolation for gaps of less than 3 h or multiple linear regression for longer gaps from published measurements of the same variable at nearby long-term Reynolds Creek stations 144 and 145. Because additional sites were added during the period of record, sometimes gaps were filled by different neighboring sites during different periods; during the periods reported as active for each station in Table 1, up to ∼1 % of records were gap-filled or corrected. All observations were recorded on an hourly time step with varying start dates for each station (Table 1). We have condensed the relatively large amount of data into summaries to convey conditions within the watershed. For this purpose, we chose two representative WYs; WY2011 was a cool and wet year, and WY2014 a warm and dry year (see Fig. 3 for the range of conditions). These WYs were selected to illustrate subsequent figures and analyses because we assumed these two years represent the range and diversity of conditions during the 11-WY time period.
3.2.1 Temperature and relative humidity
Ta and RH were measured continuously in the JD from WY2004 to WY2014. Water vapor pressure (ea) and dewpoint temperature (Td) were calculated using measured Ta, RH, and software tools from the Image Processing Workbench (IPW) (Frew, 1990; Marks et al., 1999b). The IPW tools are optimized for temperatures near 0 ∘C, providing greater accuracy for ea and Td as Ta approaches 0 ∘C. This accuracy is critical for the determination of precipitation phase in the rain-to-snow transition zone.
We define a storm as a period of time during which there are no more than 2 consecutive hours without measurable precipitation. Ta during storms is 6.6 ∘C cooler than Ta during non-storms, reflecting seasonal regional precipitation patterns and the dominance of winter storm events, whereas Td during storms is 1.7 ∘C warmer than Td during non-storms. Figure 2 shows the average monthly temperatures for Ta and Td for non-storms (Fig. 2a and c) and storms (Fig. 2b and d) in WY2011 and WY2014. For both non-storm and storm periods, the mean Ta and Td are also close to 0 ∘C for roughly 8 months out of the year (October–May), whereas during summer months (June–September), these temperatures are significantly warmer than 0 ∘C. These mean values demonstrate the sensitivity of the JD to climate warming, as changes in temperature and humidity are likely to strongly impact the precipitation phase at this location (Nayak et al., 2010).

Figure 2Monthly average Ta (white) and Td (grey) during non-storm (a, c) and storm (b, d) periods for WY2011 and WY2014 based on data from all stations. The legend in (b) applies to all panels; boxes depict the interquartile range and longest whiskers indicate the 5th and 95th percentiles of data.
3.2.2 Radiation
Incoming shortwave radiation (280–2800 nm) (Si) was measured continuously at three elevations (stations 125, 124b, and 124). Station 124 Si had to be occasionally gap-filled because ∼0.5 % of the time series was missing. Only nighttime hours were missing, so gaps were replaced with zeros, matching the other two stations. Sites were selected to minimize effects of topographic and vegetation shading, which only affect the sites briefly at very low sun angles. The WY averages for sites 125, 124b, and 124 are 172.5, 195.6, and 193.6 W m−2, which equates to 14.9, 16.9, and 16.7 MJ m−2 day−1. Peak daily incoming shortwave radiation occurs over a much broader period during the summer: peak Si typically occurs from ∼10:00 to 16:00 (Mountain Standard Time (MST)) during summer, and from ∼12:00 to 14:00 (MST) during winter.
Longwave radiation is important in many energy balance applications, such as simulating snowmelt and evapotranspiration (Flerchinger et al., 2009), and Raleigh et al. (2016) show that lack of longwave radiation data can limit model performance when assessing snowmelt timing, peak snow water equivalent, and snow surface temperatures. However, many measurement networks, including the JD, lack instrumentation to measure this variable and it is thus not reported in our dataset. Nonetheless, longwave radiation is measured within the RCEW at a slightly higher elevation (2034 m) at site 176 approximately 3 km to the SE of the JD (Reba et al., 2011) and this instrumentation may be added to the JD in the future. Alternately, clear-sky longwave radiation can be accurately calculated (Flerchinger et al., 2009) based on Ta, ea, or precipitable water, using methods by Ångström (1918), Prata (1996), or Dilley and O'Brien (1998). New work (Bair et al., 2018) suggests that some of these calculations may be sensitive to elevation and should be calibrated against nearby measurements, if possible.
3.2.3 Wind
Wind speed (ws) and direction (wd) were continuously measured at seven sites at ∼3 m above the ground surface. Six of those sites are representative of surrounding wind conditions, and site 124b was deliberately established in a wind-sheltered aspen grove to better characterize snow accumulations in the upper portions of the basin. Ranging from 0.4 (the instrument threshold) to 24.2 m s−1 for all sites, ws is greatest at 124 because this site is heavily exposed to wind (Table 1). In fact, ws at the exposed 124 site is on average twice that of all other sites at 4.5 m s−1 compared to 2.8 m s−1 for all the sites. During storms, wind speeds are on average 1.4 times faster than during non-storms. During winter storms, wd ranges from 180 to 220∘ (measured clockwise from north), whereas wd usually ranges between 135 and 225∘. These values agree with the relatively consistent wind directions of 175 to 230∘ observed in other sub-watersheds of the RCEW and in the nearby DCEW (Winstral et al., 2013; Kormos et al., 2014).
3.2.4 Precipitation
The dataset includes wind-corrected (ppta) precipitation measurements for three sites in the JD (125, 124, 124b) and the percentage of precipitation that is in the form of rain, snow, or a mixture of rain and snow. The latter were calculated using the humidity-based methods developed by Marks et al. (1999a, b, 2013), where Td values below −0.5 ∘C are considered all snow and above +0.5 ∘C are considered all rain, with a linear ratio of mixed rain/snow between these thresholds. The precipitation data for stations 125 and 124 were wind-corrected using a dual-gage correction method developed at the RCEW (Hamon et al., 1973; Hanson et al., 2004), whereby wind-corrected precipitation is an empirical function of the ratio between unshielded and shielded gage catch. Because the 124b site has only a single gage, the dual gage correction methods cannot be applied to this site. Instead the shielded data for 124b were wind-corrected using WMO (2008) methods, where the corrected precipitation mass is a function of the wind speed and precipitation phase. Wind exposure at the upper measurement site 124 results in roughly the same corrected precipitation as at the lower elevation site 125. Precipitation catch at the sheltered site 124b is on average 1.2 times greater than at the wind-exposed site 124 (Table 1). Based on water balance methods, we believe that the wind-exposed values are anomalously low and that measurements at the sheltered sites are more representative of other high-elevation sites in the JD. Thus, we suggest that an orographic lapse rate using only sites 125 and 124b better represents the true precipitation lapse rate. We approximated precipitation for site 124b for WY2004–2007 via multiple linear regression using nearby precipitation measurement sites, which were within 1 km horizontally and within 100 m of the same elevation. Mean cumulative ppta for the 11 WYs for stations 124, 124b, and 125 was 563, 700, and 564 mm, respectively (Table 1).
3.3 Stream, snow, and soil data
3.3.1 Stream discharge
Stream discharge was measured continuously with a stage recorder using a drop box weir at the watershed outlet (Pierson et al., 2001). The intermittent stream draining the JD typically starts flowing in early November as winter seasonal precipitation resumes and ceases to flow around mid-July. Stage height was converted to stream discharge using a rating curve (Pierson and Cram, 1998) and frequent field measurements to ensure high-quality flow records (Pierson et al., 2001). Average stream discharge over the period of record is approximately 0.007 m3 s−1, with the largest discharge of 1.63 m3 s−1 on 14 February 2014 during a rain-on-snow event. Total annual runoff for each WY is shown in Fig. 3.
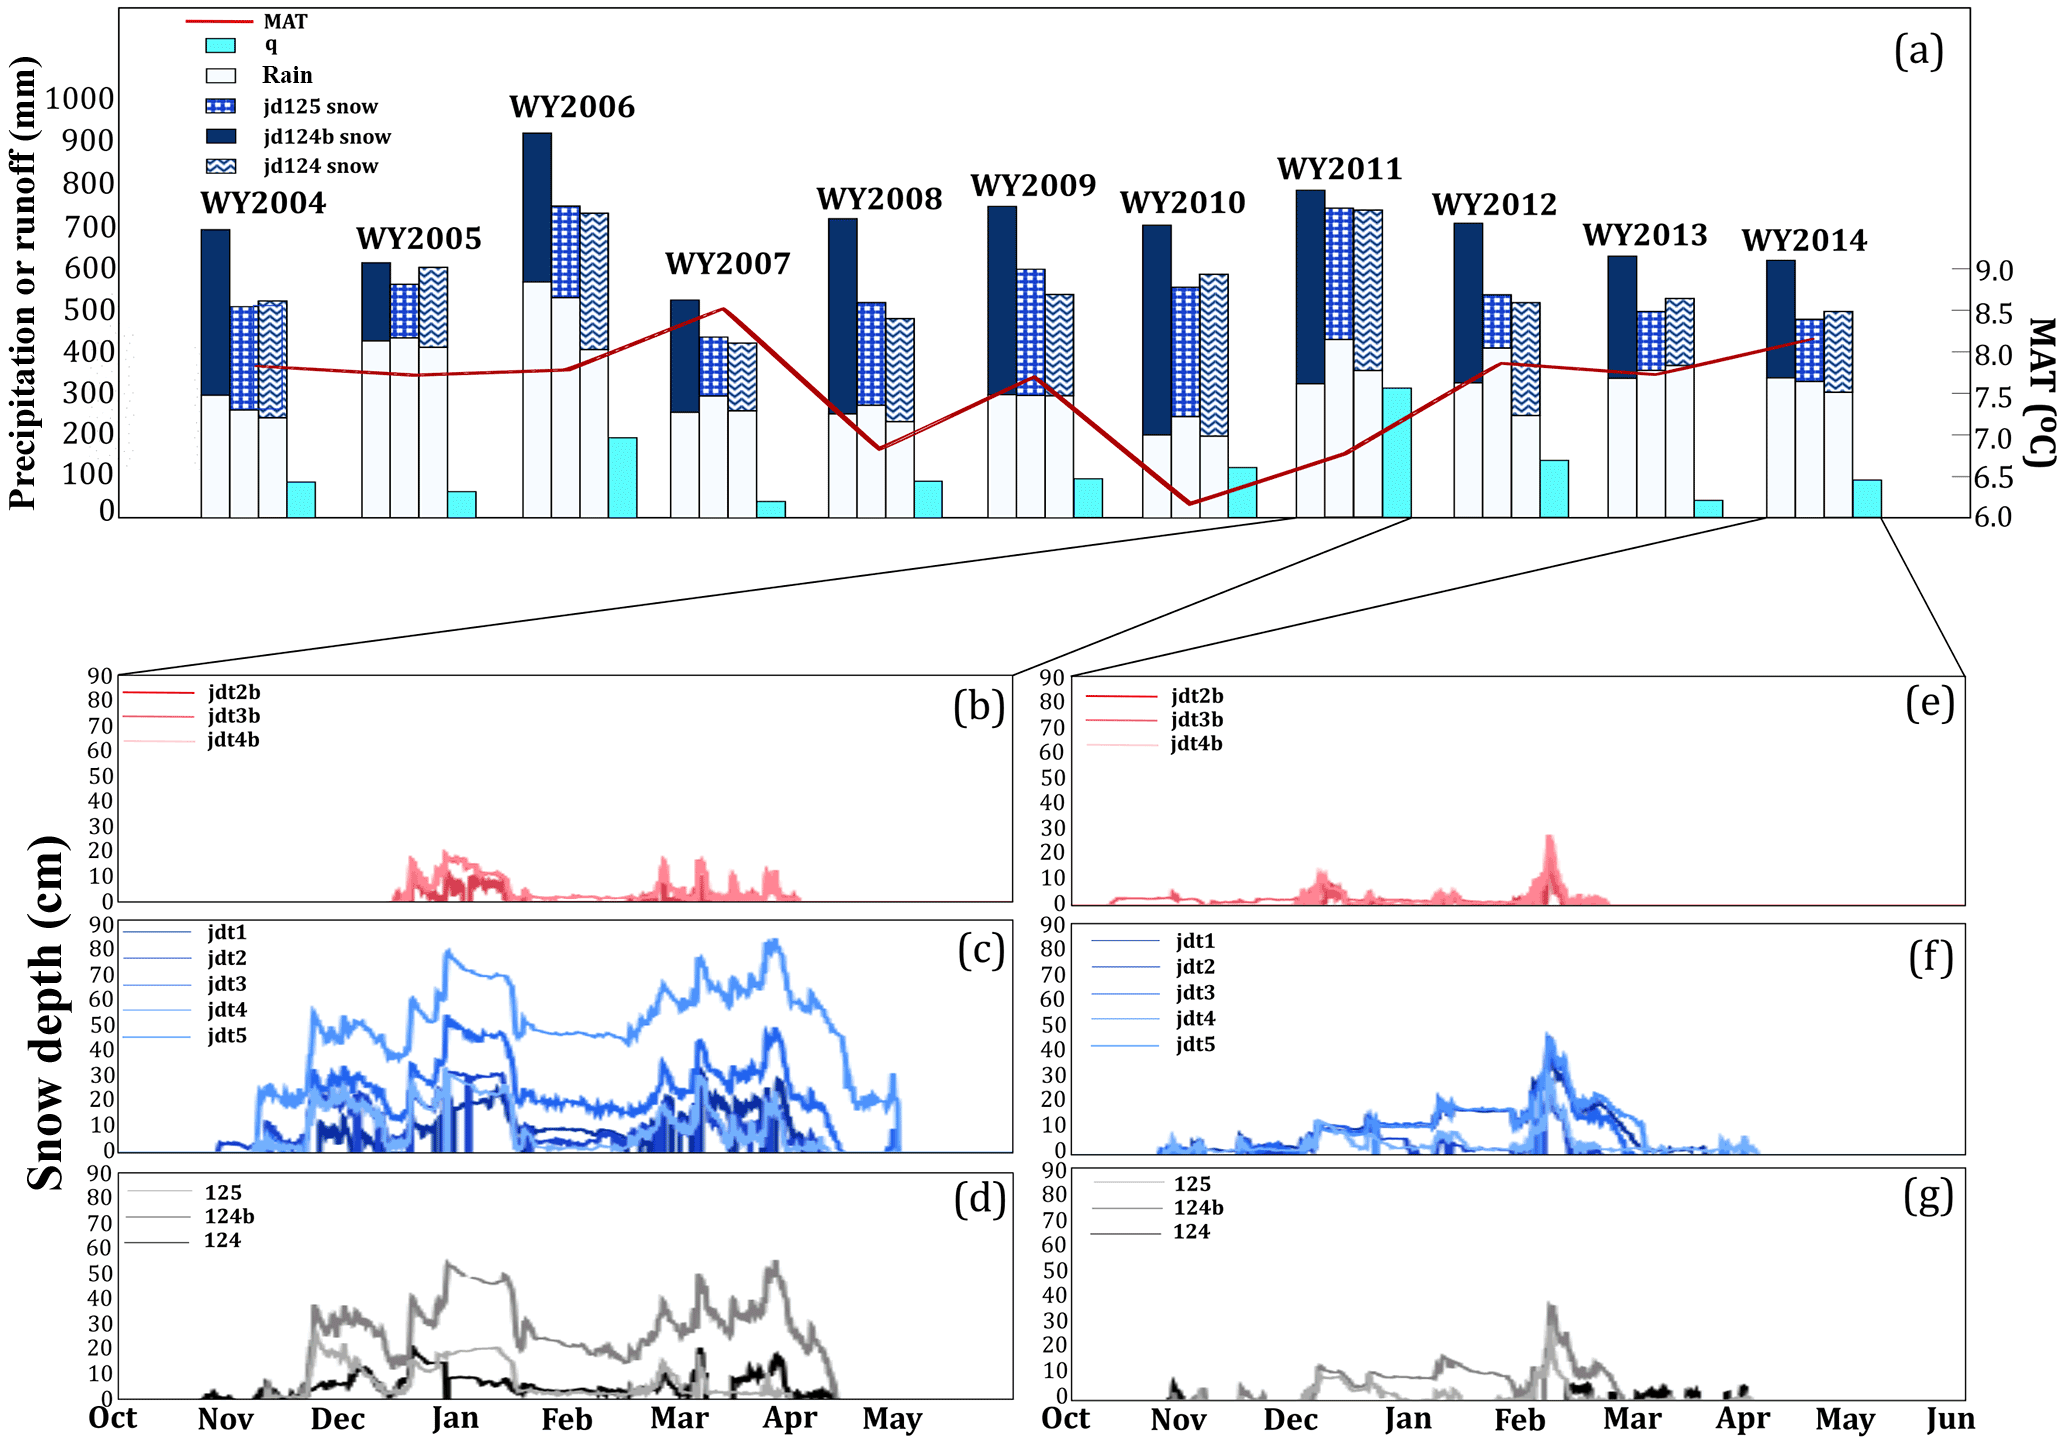
Figure 3(a) Cumulative annual precipitation from sites 125, 124b, and 125 and cumulative runoff (q) as measured at the JD outlet and mean annual temperature (MAT) based on stations 124 and 125 which are collecting data over the entire 11 WY. That the three precipitation sites are similar in WY2005 and WY2011 suggests warmer, less windy conditions. Streamflow (q) is specific discharge, or total volumetric streamflow (Q) normalized by catchment area. (b–g) Snow depth in the JD for WY2011 (b–d) and WY2014 (e–g). Panels (b, e) show snow depth from sites on the south-facing slopes in red colors, (c, f) show snow depth on the north-facing slopes in blue colors, and (d, g) show snow depth from 125, 124b, and 124 in grayscale. Each legend shows sites ordered from the lowest to highest elevations, with brighter tones at lower elevations. Snow depths increase inconsistently with increasing elevations due to wind scour from exposed sites and accumulation in sheltered areas. Gaps due to instrument failure are seen as breaks in the continuous time series line in some subplots.
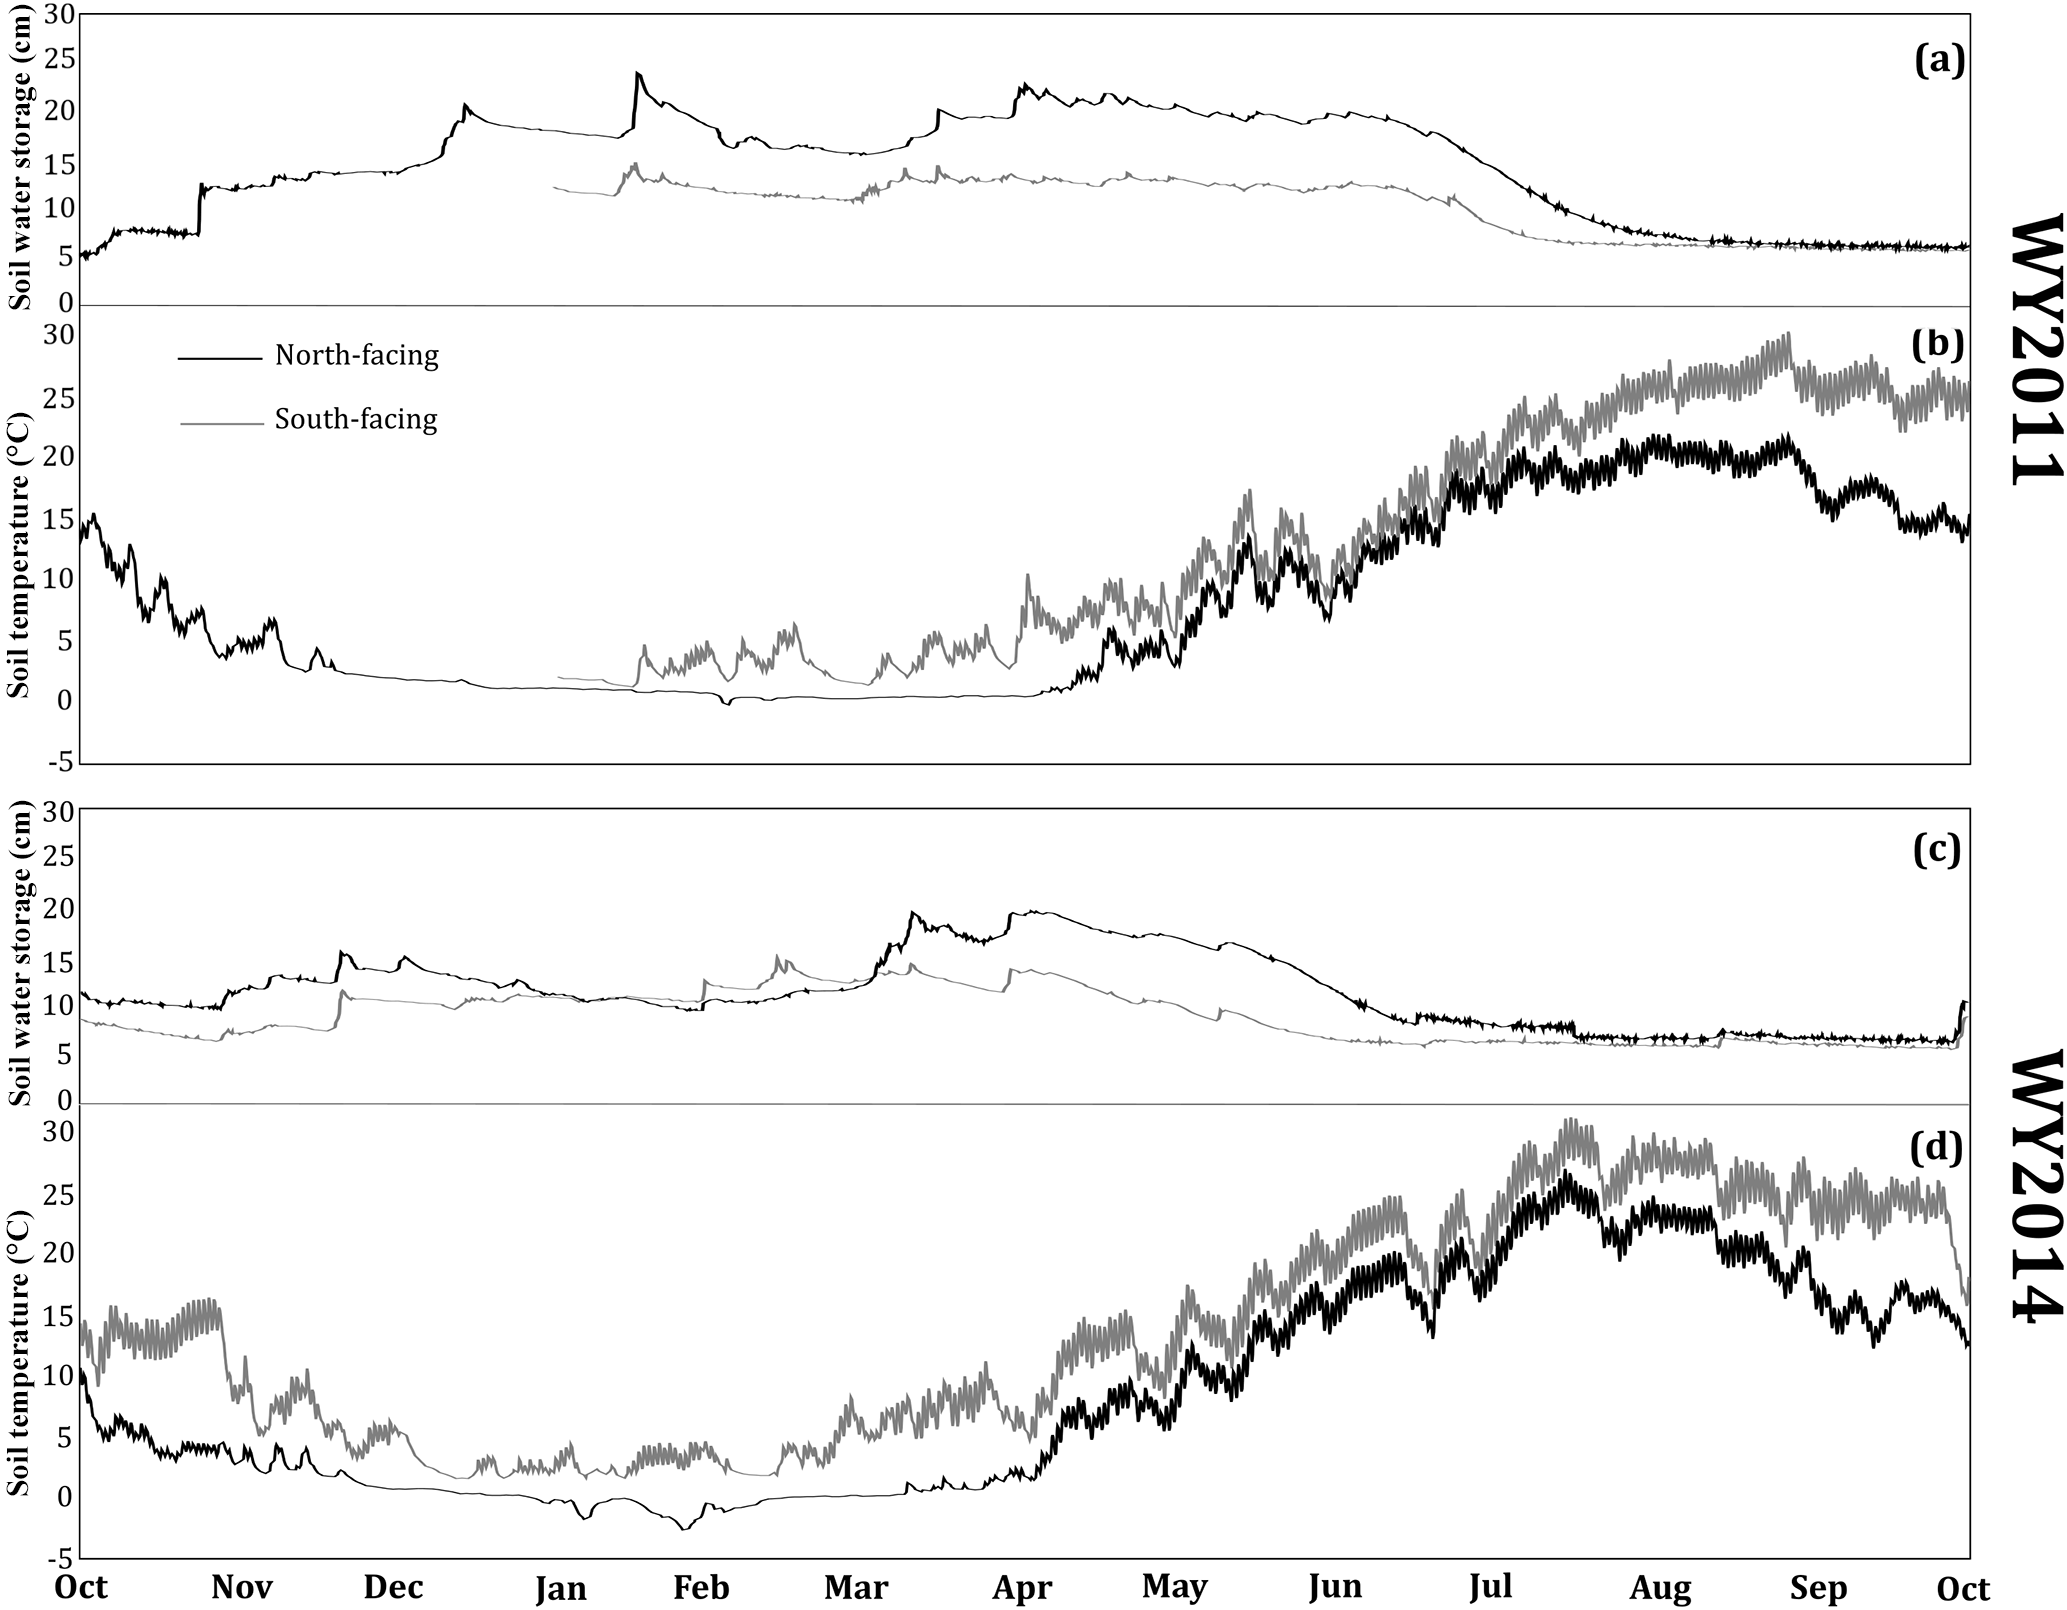
Figure 4Soil water storage (a, c) and ground temperatures at 20 cm (b, d) on both north- and south-facing slopes, up to depths of 100 and 50 cm, respectively, in WY2011 (a–b) and WY2014 (c–d). The legend in (b) applies to all panels. Water storage and temperatures for north-facing slopes were calculated based on jdt1, jdt2, jdt3, and jdt4, and for south-facing slopes, these values were calculated based on jdt2b, jdt3b, and jdt4b. During October–January of WY2011 (a), no soil temperature or moisture data on the south-facing slopes were collected due to the soil moisture sensors not yet being installed.
3.3.2 Snow depths
Instantaneous snow depths were collected at all 11 sites on an hourly basis for all periods when each Judd Communications depth sensor was installed. Raw snow depths from all stations were processed in a multi-step fashion analogous to methods evaluated by Ryan et al. (2008). We first defined the start and end of the snow-covered period for each WY, the peak snow depth, and a smoothing window for each sensor (usually 8 h, but under specific circumstances extended to 40 h as detailed below). Because JD snow cover is often ephemeral, the start of the snow-covered period was defined as the first day with a positive snow depth after the start of the new water year, and the end of the snow-covered period was the last day with positive snow depth during that water year. Thus, the snow-covered period may include periods without snow cover if ephemeral snowpacks melted, especially during the fall and spring. Furthermore, because the snow depth sensor is unreliable during storms due to the ultrasonic signal reflecting from hydrometeors, these values were filtered and removed. If the gaps that this created were longer than the specified smoothing window, they were not filled. There were 127 unfilled gaps for all stations and years. If gaps were shorter than the smoothing window, then missing data were interpolated. This smoothed dataset was further quality-checked by visually comparing cumulative precipitation and changes in snow depth. If snow depth increased while precipitation was zero, we extended the typical 8 h smoothing window to 40 h to minimize incorrectly interpreting noise as the snow depth signal. Thus, if snow depth decreased during a storm due to compaction, these data were smoothed and preserved. Mean snow depths can be found in Table 1. As expected, north-facing slopes and sheltered sites have deeper snowpacks that last longer throughout the snow season compared to south-facing slopes and wind-exposed sites (Fig. 3), primarily due to shortwave radiation and scour differences. Wind redistribution of blowing snow is known to affect the nearby Reynolds Mountain East (RME) catchment (Winstral et al., 2013) and may also be important at times in the JD; this dataset facilitates further exploration of wind effects at the rain–snow transition on melt patterns and runoff generation.
Although this dataset does not include snow water equivalent (SWE) or snow density measurements, which complement snow depths, it appears likely that methods of converting lidar-derived snow depth to SWE may soon allow conversion of the 11 continuous snow depth measurements (Kirchner et al., 2014) to SWE, and some snow models (e.g., SNOWPACK, Lehning et al., 1999) can utilize snow depth measurements to simulate SWE as part of avalanche hazard assessment. We expect that an improved understanding of snowmelt and soil frost may build on these observed snow depth, and soil moisture and temperature measurements.
3.3.3 Soil moisture and temperature
Soil moisture probes were installed at 8 of the 11 sites at various depths (Table 1) in 2010 to measure soil temperature (Tg) and moisture (θ). Mean WY soil temperatures reflect distinct aspect differences (Fig. 4) with mean soil temperatures of 7.7 ∘C on north-facing slopes and 12.2 ∘C on south-facing slopes at a depth of 20 cm.
Processing of the soil moisture data included correcting extremely dry measurements resulting from sensors with bad components. The faulty equipment was not immediately apparent because errors are only expressed when water contents are very low. Thus, the reported values are accurate for all the hydrologically active periods. During the summer dry down and winter freezing events, once a value of about 0.08 m3 m−3 is reached, the data drop rapidly to unrealistic values, and when water contents rise due to precipitation inputs or thawing, they return to accurate values. In order to make a continuous estimate of water content and storage, we replaced the faulty values using continuous values from adjacent functional sensors. From these corrected values, we calculated the average water storage (Fig. 4) for the north-facing slopes using a soil depth of 100 cm and for south-facing slopes using a depth of 50 cm, based on the typical depths to which the sensors could be installed. For both WYs, water storage on north-facing slopes is on average 1.4 times greater and lasts longer than on south-facing slopes.
We estimated evapotranspiration using a mass balance approach based on measured precipitation and stream discharge to ensure that the measurements were reasonable when integrated at a watershed scale. We assumed that net groundwater fluxes and annual changes in storage were negligible, which is supported by soil moisture data. We approximated the annual precipitation of the JD by arithmetically averaging the annual precipitation from 125 and 124b (as described in Sect. 3.2.4, site 124 is located on a very wind exposed ridge, and is therefore not representative of the general precipitation lapse rate in the catchment). WY precipitation was estimated to be 765±78 and 548±69 mm yr−1 for WY2011 and WY2014, respectively, with uncertainties based on the reported instrument error. We converted annual stream discharge to specific discharge by normalizing the annual stream discharge to the watershed area (181.35 ha). These values were estimated to be 309±37 and 89±11 mm yr−1 for WY2011 and WY2014, respectively, assuming up to a 12 % annual discharge uncertainty. Uncertainty in the individual discharge or precipitation measurements was propagated to the annual discharge and precipitation estimates via a simple sum or average (following Morgan and Henrion, 1990). We then used the hydrological mass balance equation to estimate evapotranspiration ( storage), which was approximated to be 456±86 and 459±69 mm yr−1 for WY2011 and WY2014, respectively. These estimates agree closely with the value of 425 mm yr−1 measured in the nearby Reynolds Mountain East catchment using eddy covariance techniques (Flerchinger et al., 2010).
All data presented in this paper are available from the USDA National Agricultural Library (see Godsey et al., 2016, https://doi.org/10.15482/usda.adc/1402076). The directory includes a readme file in PDF format listing the contents within each directory with a detailed data description, naming conventions, instruments used, contact information for additional inquiries, a watershed digital elevation model, and shapefiles of the watershed boundary and the station locations. The readme file defines the formats for the 3 precipitation files, 11 meteorological data files, 1 stream discharge file, 1 snow depth file, and 8 soil temperature and moisture files. Header descriptions in the associated files indicate subscripts used throughout this paper, with the _ symbol appearing before subscripted characters.
To our knowledge, the dataset presented is the most complete and comprehensive available to date from the rain–snow transition zone. It includes 11 water years (2004–2014) of continuous hourly meteorological data, including air and dewpoint temperature, relative humidity, vapor pressure, precipitation, wind speed and direction, and shortwave radiation at 50 m elevation intervals spanning the JD catchment. Other data include snow depth, stream discharge, and soil temperature and moisture. Data continue to be collected at the sites described here, and updated datasets will be published based on available resources. The dataset is important for a variety of scientific questions because it (1) captures complex atmosphere–surface–subsurface dynamics in the rain-to-snow transition zone, (2) represents hydrometeorological differences along both an elevational gradient and between aspects, and (3) provides all the necessary data required for applying a variety of hydrometeorological models. It is our intention that this dataset will be used by scientists to improve understanding of the basin-scale interactions and responses for a mountain watershed transitioning from snow- to rain-dominated. High-resolution hydrometeorological datasets can offer researchers opportunities for interdisciplinary studies at the watershed scale. For example, future studies might leverage these data to better understand how (1) changes in precipitation magnitude and temperature impact water storage and movement, and the average annual snowline, (2) soil temperature and moisture respond to changes in energy and water fluxes, and (3) variability in meteorological conditions impacts subniveal biogeochemistry beneath transient snowpacks at the rain–snow transition.
SEG, DM, PRK, MSS, and CLE prepared the dataset. Datasets were collected by DM, MSS, TEL, JMN, AHW, and ARS staff. CLE, SEG, and DM prepared the manuscript with contributions from all co-authors.
The authors declare that they have no conflict of interest.
Any reference to specific equipment types or manufacturers is for informational purposes and does not represent a product endorsement. ISU and USDA are equal opportunity providers.
This article is part of the special issue “Hydrometeorological data from mountain and alpine research catchments”. It is not associated with a conference.
The data presented in this paper were collected by the USDA
NWRC. Adam H. Winstral and Mark S. Seyfried designed the expanded JD
measuring network. We also thank the NWRC and the Idaho State
University Department of Geosciences for support. The collection and
processing of the data presented in this paper were funded in part
by the NSF-EPSCoR program (IIA-1329469), NSF-CBET (0854553),
USDA-ARS CRIS Snow and Hydrologic Processes in the Intermountain
West (5362-13610-008-00D), USDA-NRCS National Water and Climate
Center-Portland, Oregon (60-5362-4-003), and the NSF Reynolds Creek
CZO project (58-5832-4-004).
Edited by: John
Pomeroy
Reviewed by: Jeff Dozier, Ulrich Strasser, and one
anonymous referee
Ångström, A.: A study of the radiation of the atmosphere, Smithson Misc. Collect., 65, 1–159, 1918.
Bair, E. H., Davis, R. E., and Dozier, J.: Hourly mass and snow energy balance measurements from Mammoth Mountain, CA USA, 2011–2017, Earth Syst. Sci. Data, 10, 549–563, https://doi.org/10.5194/essd-10-549-2018, 2018.
Dilley, A. C. and O'Brien, D. M.: Estimating downward clear sky long-wave irradiance at the surface from screen temperature and precipitable water, Q. J. Roy. Meteor. Soc., 124, 1391–1401, https://doi.org/10.1002/qj.49712454903, 1998.
Fierz, C., Armstrong, R. L., Durand, Y., Etchevers, P., Greene, E., McClung, D. M., Nishimura, K., Satyawali, P. K., and Sokratov, S. A.: The International Classification for Seasonal Snow on the Ground, IHP-VII Technical Documents in Hydrology No. 83, IACS Contribution No. 1, UNESCO-IHP, Paris, 2009.
Flerchinger, G. N., Xaio, W., Marks, D., Sauer, T. J., and Yu, Q.: Comparison of algorithms for incoming atmospheric long-wave radiation, Water Resour. Res., 45, 1–13, https://doi.org/10.1029/2008WR007394, 2009.
Flerchinger, G. N., Marks, D., Reba, M. L., Yu, Q., and Seyfried, M. S.: Surface fluxes and water balance of spatially varying vegetation within a small mountainous headwater catchment, Hydrol. Earth Syst. Sci., 14, 965–978, https://doi.org/10.5194/hess-14-965-2010, 2010.
Frew, J.: The Image Processing Workbench, PhD Thesis, University of California, Santa Barbara, CA, 1990.
Godsey, S. E., Marks, D. G., Kormos, P. R., Seyfried, M. S., Enslin, C. L., McNamara, J. P., and Link, T. E.: Data from: Eleven years of mountain weather, snow, soil moisture and stream flow data from the rain-snow transition zone – the Johnston Draw catchment, Reynolds Creek Experimental Watershed and Critical Zone Observatory, USA. v1.1. USDA Ag Data Commons, Idaho, USA, https://doi.org/10.15482/usda.adc/1402076. 2016.
Hamon, W. R.: Computing Actual Precipitation, in: WMO-IAHS Symposium on the Distribution of Precipitation in Mountainous Areas, no. 326, Geilo, Norway, 31 July–5 August 1972, 159–174, 1973.
Hanson, C., Pierson, F., and Johnson, G.: Dual-gauge system for measuring precipitation: historical development and use, J. Hydrol. Eng., 9, 350–358, https://doi.org/10.1061/(ASCE)1084-0699(2004)9:5(350), 2004.
Kirchner, P. B., Bales, R. C., Molotch, N. P., Flanagan, J., and Guo, Q.: LiDAR measurement of seasonal snow accumulation along an elevation gradient in the southern Sierra Nevada, California, Hydrol. Earth Syst. Sci., 18, 4261–4275, https://doi.org/10.5194/hess-18-4261-2014, 2014.
Klos, Z. P., Link, T. E., and Abatzoglou, J. T.: Extent of the rain-snow transition zone in the western US under historic and projected climate, Geophys. Res. Lett., 41, 4560–4568, https://doi.org/10.1002/2014GL060500, 2014.
Kormos, P. R., Marks, D., McNamara, J. P., Marshall, H. P., Winstral, A., and Flores, A. N.: Snow distribution, melt and surface water inputs to the soil in the mountain rain–snow transition zone, J. Hydrol., 519, 190–204, https://doi.org/10.1016/j.jhydrol.2014.06.051, 2014.
Kormos, P. R., Marks, D. G., Seyfried, M. S., Havens, S. C., Hedrick, A., Lohse, K. A., and Sandusky, M.: 31 years of hourly spatially distributed air temperature, humidity, and precipitation amount and phase from Reynolds Critical Zone Observatory, Earth Syst. Sci. Data Discuss., https://doi.org/10.5194/essd-2017-82, in review, 2017.
Lehning, M., Bartelt, P., Brown, B., Russi, T., Stockli, U., and Zimmerli, M.: SNOWPACK model calculations for avalanche warning based upon a new network of weather and snow stations, Cold Reg. Sci. Technol., 30, 145–157, 1999.
Lute, A., Abatzoglou, J., and Hegewisch, K.: Projected changes in snowfall extremes and interannual variability of snowfall in the western US, Water Resour. Res., 51, 960–972, https://doi.org/10.1002/2014WR016267, 2015.
Marks, D., Domingo, J., Susong, D., Link, T., and Garen, D.: A spatially distributed energy balance snowmelt model for application in mountain basins, Hydrol. Process., 13, 1935–1959, https://doi.org/10.1002/(SICI)1099-1085(199909)13:12/13<1935::AID-HYP868>3.0.CO;2-C, 1999a.
Marks, D., Susong, D., and Frew, J.: Software tools for hydro climatic modeling and analysis: Image Processing Workbench, ARS USGS Version 2, in: ARS Technical Bulletin NWRC-99-1, Northwest Watershed Research Center, Electronic Document, USDA Agricultural Research Service, Boise, ID, 1999b.
Marks, D., Winstral, A., Reba, M., Pomeroy, J., and Kumar, M.: An evaluation of methods for determining during-storm precipitation phase and the rain/snow transition elevation at the surface in a mountain basin, Adv. Water Resour., 55, 98–110, https://doi.org/10.1016/j.advwatres.2012.11.012, 2013.
Morgan, M. G. and Henrion, M.: Uncertainty: A Guide for Dealing with Uncertainty in Quantitative Risk and Policy Analysis, Cambridge University Press, New York, NY, 1990.
Morin, S., Lejeune, Y., Lesaffre, B., Panel, J.-M., Poncet, D., David, P., and Sudul, M.: An 18 yr long (1993–2011) snow and meteorological dataset from a mid-altitude mountain site (Col de Porte, France, 1325 m alt.) for driving and evaluating snowpack models, Earth Syst. Sci. Data, 4, 13–21, https://doi.org/10.5194/essd-4-13-2012, 2012.
Mote, P. W.: Trends in snow water equivalent in the Pacific Northwest and their climatic causes, Geophys. Res. Lett., 30, 1601, https://doi.org/10.1029/2003GL017258, 2003.
Mote, P. W., Hamlet, A. F., Clark, M. P., and Lettenmaier, D. P.: Declining Mountain Snowpack in Western North America, B. Am. Meteorol. Soc., 86, 39–49, https://doi.org/10.1175/BAMS-86-1-39, 2005.
Nayak, A., Marks, D., Chandler, D. G., and Seyfried, M.: Long-term snow, climate, and streamflow trends at the Reynolds Creek Experimental Watershed, Owyhee Mountains, Idaho, United States, Water Resour. Res., 46, W06519, https://doi.org/10.1029/2008WR007525, 2010.
Newman, A. J., Clark, M. P., Sampson, K., Wood, A., Hay, L. E., Bock, A., Viger, R. J., Blodgett, D., Brekke, L., Arnold, J. R., Hopson, T., and Duan, Q.: Development of a large-sample watershed-scale hydrometeorological data set for the contiguous USA: data set characteristics and assessment of regional variability in hydrologic model performance, Hydrol. Earth Syst. Sci., 19, 209–223, https://doi.org/10.5194/hess-19-209-2015, 2015.
Nolin, A. W. and Daly, C.: Mapping “At Risk” Snow in the Pacific Northwest, J. Hydrometeorol., 7, 1164–1171, https://doi.org/10.1175/JHM543.1, 2006.
Patton, N. R.: Topographic controls on total mobile regolith and total soil organic carbon in complex terrain, MS Thesis, Idaho State University, Pocatello, ID, 2016.
Pierson, F. B. and Cram, Z. K.: Reynolds Creek Experimental Watershed Runoff and Sediment Data Collection Field Manual, Rep. NWRC 98-2, Northwest Watershed Res. Center, USDA-ARS, Boise, Idaho, 30, 1998.
Pierson, F. B., Slaughter, C. W., and Cram, Z. K.: Long-term stream discharge and suspended-sediment database, Reynolds Creek Experimental Watershed, Idaho, Water Resour. Res., 37, 2857–2861, https://doi.org/10.1029/2001WR000420, 2001.
Prata, A. J.: A new long-wave formula for estimating downward clear-sky radiation at the surface, Q. J. Roy. Meteor. Soc., 122, 1127–1151, https://doi.org/10.1002/qj.49712253306, 1996.
Raleigh, M. S., Livneh, B., Lapo, K., and Lundquist, J. D.: How Does Availability of Meteorological Forcing Data Impact Physically Based Snowpack Simulations?, J. Hydrometeorol., 17, 99–120, https://doi.org/10.1175/JHM-D-14-0235.1, 2016.
Reba, M., Marks, D., Seyfried, M. S., Winstral, A., Kumar, M., and Flerchinger, G.: A long-term data set for hydrologic modeling in a snow dominated mountain catchment, Water Resour. Res., 47, W07702, https://doi.org/10.1029/2010WR010030, 2011.
Ryan, W. A., Doesken, N. J., and Fassnacht, S. R.: Evaluation of ultrasonic snow depth sensors for U.S. snow measurements, J. Atmos. Ocean. Tech., 25, 667–684, https://doi.org/10.1175/2007JTECHA947.1, 2008.
Stewart, I.: Changes in Snowpack and Snowmelt Runoff for Key Mountain Regions, Hydrol. Process., 23, 78–94, 2009.
Stephenson, G. R.: Soil-Geology-Vegetation Inventories for Reynolds Creek Watershed, Agric. Exp. Stn. Univ. Idaho Coll. Agric. USDA-ARS, 1970.
Trujillo, E. and Molotch, N.: Snowpack regimes of the Western United States, Water Resour. Res., 50, 5611–5623, https://doi.org/10.1002/2013WR014753, 2014.
USDA: Soil Survey Staff, Natural Resources Conservation Service, Web Soil Surv., available at: http://websoilsurvey.nrcs.usda.gov (last access: 20 May 2017), 2015.
Wayand, N. E., Massmann, A., Butler, C., Keenan, E., Stimberis, J., and Lundquist, J. D.: A Meteorological and Snow observational data set from Snoqualmie Pass (921 m), Washington Cascades, US, Univ. Washingt. Res. Work. Arch., Seattle, WA, 1–20, https://doi.org/10.6069/H57P8W91, 2015.
Winstral, A., Marks, D., and Gurney, R.: Simulating wind-affected snow accumulations at catchment to basin scales, Adv. Water Resour., 55, 64–79, https://doi.org/10.1016/j.advwatres.2012.08.011, 2013.
WMO: Part I. Measurement of Meteorological Variables, in: Guide to Meteorological Instruments and Methods of Observation, Vol. I–II, I.8-1–I.9-1, World Meteorological Organization, Geneva, Switzerland, 2008.
WSL Institute for Snow and Avalanche Research SLF: Meteorological and snowpack measurements from Weissfluhjoch, Davos, Switzerland, https://doi.org/10.16904/1, 2015.
Zahumenský, I.: Guidelines on quality control procedures for data from automatic weather stations, World Meteorol. Organ. Switz., 955, 2–6, 2004.