the Creative Commons Attribution 4.0 License.
the Creative Commons Attribution 4.0 License.
 | 28 Jun 2018
31 years of hourly spatially distributed air temperature, humidity, and precipitation amount and phase from Reynolds Critical Zone Observatory
Patrick R. Kormos
Danny G. Marks
Mark S. Seyfried
Scott C. Havens
Andrew Hedrick
Kathleen A. Lohse
Micah Sandusky
Annelen Kahl
David Garen
Thirty-one years of spatially distributed air temperature, relative humidity, dew point temperature, precipitation amount, and precipitation phase data are presented for the Reynolds Creek Experimental Watershed, which is part of the Critical Zone Observatory network. The air temperature, relative humidity, and precipitation amount data are spatially distributed over a 10 m lidar-derived digital elevation model at an hourly time step using a detrended kriging algorithm. This 21 TB dataset covers a wide range of weather extremes in a mesoscale basin (238 km2) that encompasses the rain–snow transition zone and should find widespread application in earth science modeling communities. Spatial data allow for a more holistic analysis of basin means and elevation gradients, compared to weather station data measured at specific locations. Files are stored in the NetCDF file format, which allows for easy spatiotemporal averaging and/or subsetting. Data are made publicly available through an OPeNDAP-enabled THREDDS server hosted by Boise State University Libraries in support of the Reynolds Creek Critical Zone Observatory (https://doi.org/10.18122/B2B59V).
- Article
(6075 KB) - Full-text XML
- BibTeX
- EndNote


Spatially distributed air temperature, relative humidity, dew point temperature (Td), precipitation amount, and precipitation phase data are presented from the Reynolds Creek Experimental Watershed (RCEW) from 1 October 1983 to 30 September 2014 (31 water years, where a water year extends from 1 October to 30 September) (Fig. 1). Relative humidity data were available at three locations in RCEW starting in 1983, which is necessary for distributing humidity and precipitation phase variables. Although data collection is ongoing at RCEW, the dataset ends at water year 2014 due to the timing of research funding. Updated weather station data for these and other data are available at http://reynoldscreekczo.org/rcewdata/ (last access: 13 June 2018) and the dataset will be updated to include additional weather variables and water years as funding allows. These data provide a whole-catchment view of the dynamic weather conditions that occur in a mountainous catchment that encompasses the rain–snow transition zone. The rain–snow transition zone is of specific importance as warming trends are expected to shift the current precipitation regime toward being rain-dominated and move the rain–snow transition to higher elevations (Nayak et al., 2010; Klos et al., 2014). In the interior Pacific Northwest, United States, where RCEW is located, the rain–snow transition zone typically occurs in middle elevations ranging from 1500 to 1800 m (Nayak et al., 2010).
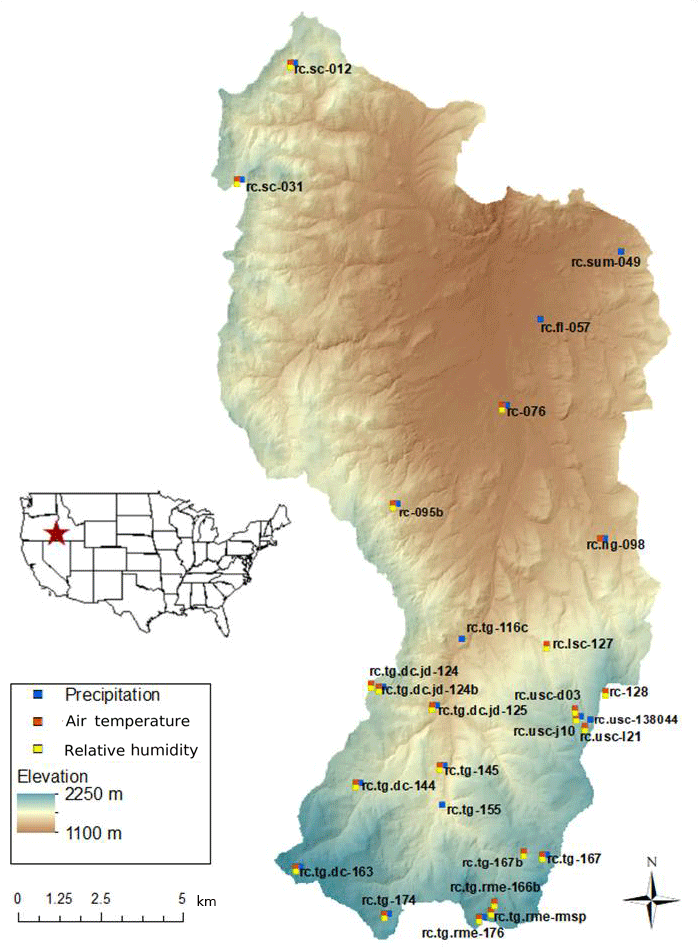
Figure 1Location map of Reynolds Creek Experimental Watershed showing the elevation (m a.s.l.) and the location of stations used to measure precipitation, air temperature, and relative humidity.
RCEW was established in 1960 to address water yield, flood flow, and sedimentation problems of the interior northwestern United States. Today, RCEW monitors 11 weirs, 23 dual-gage precipitation stations, and 22 weather stations (relative humidity, air temperature, wind, and incoming solar radiation as a minimum), many of which have been continuously monitoring for decades (Fig. 2). The station density in RCEW is far beyond that found in other large mountain study basins, and we are confident that the critical meteorological gradients are represented in the presented dataset.

Figure 2Measurement sites and the corresponding time periods that data from that site were used in the construction of the spatial data.
RCEW became a Critical Zone Observatory in 2014, with the purpose of improving the prediction of soil carbon storage and flux. Part of that goal is met by the creation of these high spatiotemporal resolution data, which address a strategic priority to develop an integrated modeling framework. These data will be used in conjunction with soil carbon and other environmental variables in land surface models with the end goal of watershed-scale biogeochemistry modeling (model development, model validation, total carbon and nitrogen storage estimation). In addition to biogeochemical modeling, this dataset provides the weather variables commonly used to force models from disciplines ranging from hydrology and snowmelt to ecology and biogeochemistry.
This dataset meticulously describes weather variables in a mountain rain–snow transition zone, which provides pertinent information for analyzing climate warming trends. The snow cover in this zone is sensitive to climate warming trends because it is generally warm and thin (less than 1 m for most of the snow season). Since precipitation can be deposited as either rain that is rapidly transmitted to the soil, or snow that delays the delivery of liquid water to the soil, changes in the precipitation phase translate directly into changes in the timing of water inputs to catchment soils. Previous studies have documented historic changes in mountain snow cover due to climate warming trends (Mote, 2003), but most of these studies rely on point data (Nayak et al., 2010) or model results (Brown and Mote, 2009). Spatially distributed data derived from measured data, such as this dataset, are essential for diagnosing changes in snow regime in the Mountain West, United States. Weather datasets have been published from rain-dominated (Western and Grayson, 1998) and snow-dominated areas (Reba et al., 2011; Morin et al., 2012), but there is a general lack of weather data from the rain–snow transition zone (Kormos et al., 2014; Godsey, 2016).
The combination of (1) length of record, (2) high spatial resolution, (3) high temporal resolution, (4) the availability of supporting data, and (5) meticulous maintenance and upkeep of weather station data at RCEW makes it an ideal location for the development of a detailed dataset of this magnitude.
The Reynolds Creek Experimental Watershed (RCEW) is a 238 km2 catchment located in the Owyhee Mountains in southwest Idaho, United States (Fig. 1). Catchment elevation ranges from 1100 to 2244 m a.s.l. (meters above sea level) with a mean of 1529 m a.s.l. (Figs. 1, 5a) and, along with aspect, controls several important environmental gradients. Some of these gradients include a strong precipitation gradient, vegetation community gradients and land use gradients. Mean annual precipitation is approximately 200 mm for the lowest elevations and 1140 mm for the highest elevations, with a basin mean value of 462 mm. The majority of precipitation falls in the winter, spring, and fall, with low precipitation during summer months (June–August) (Figs. 3 and 5a). The upper elevations of RCEW are snow-dominated and the lower elevations are rain-dominated. The dominant wind direction during storms is out of the southwest, and snow drifts form on the lee side of slopes. The mean annual air temperature is 7.8 ∘C, with the warmest month being July (20.5 ∘C) and the coldest month being December (−2.3 ∘C) (Fig. 3).
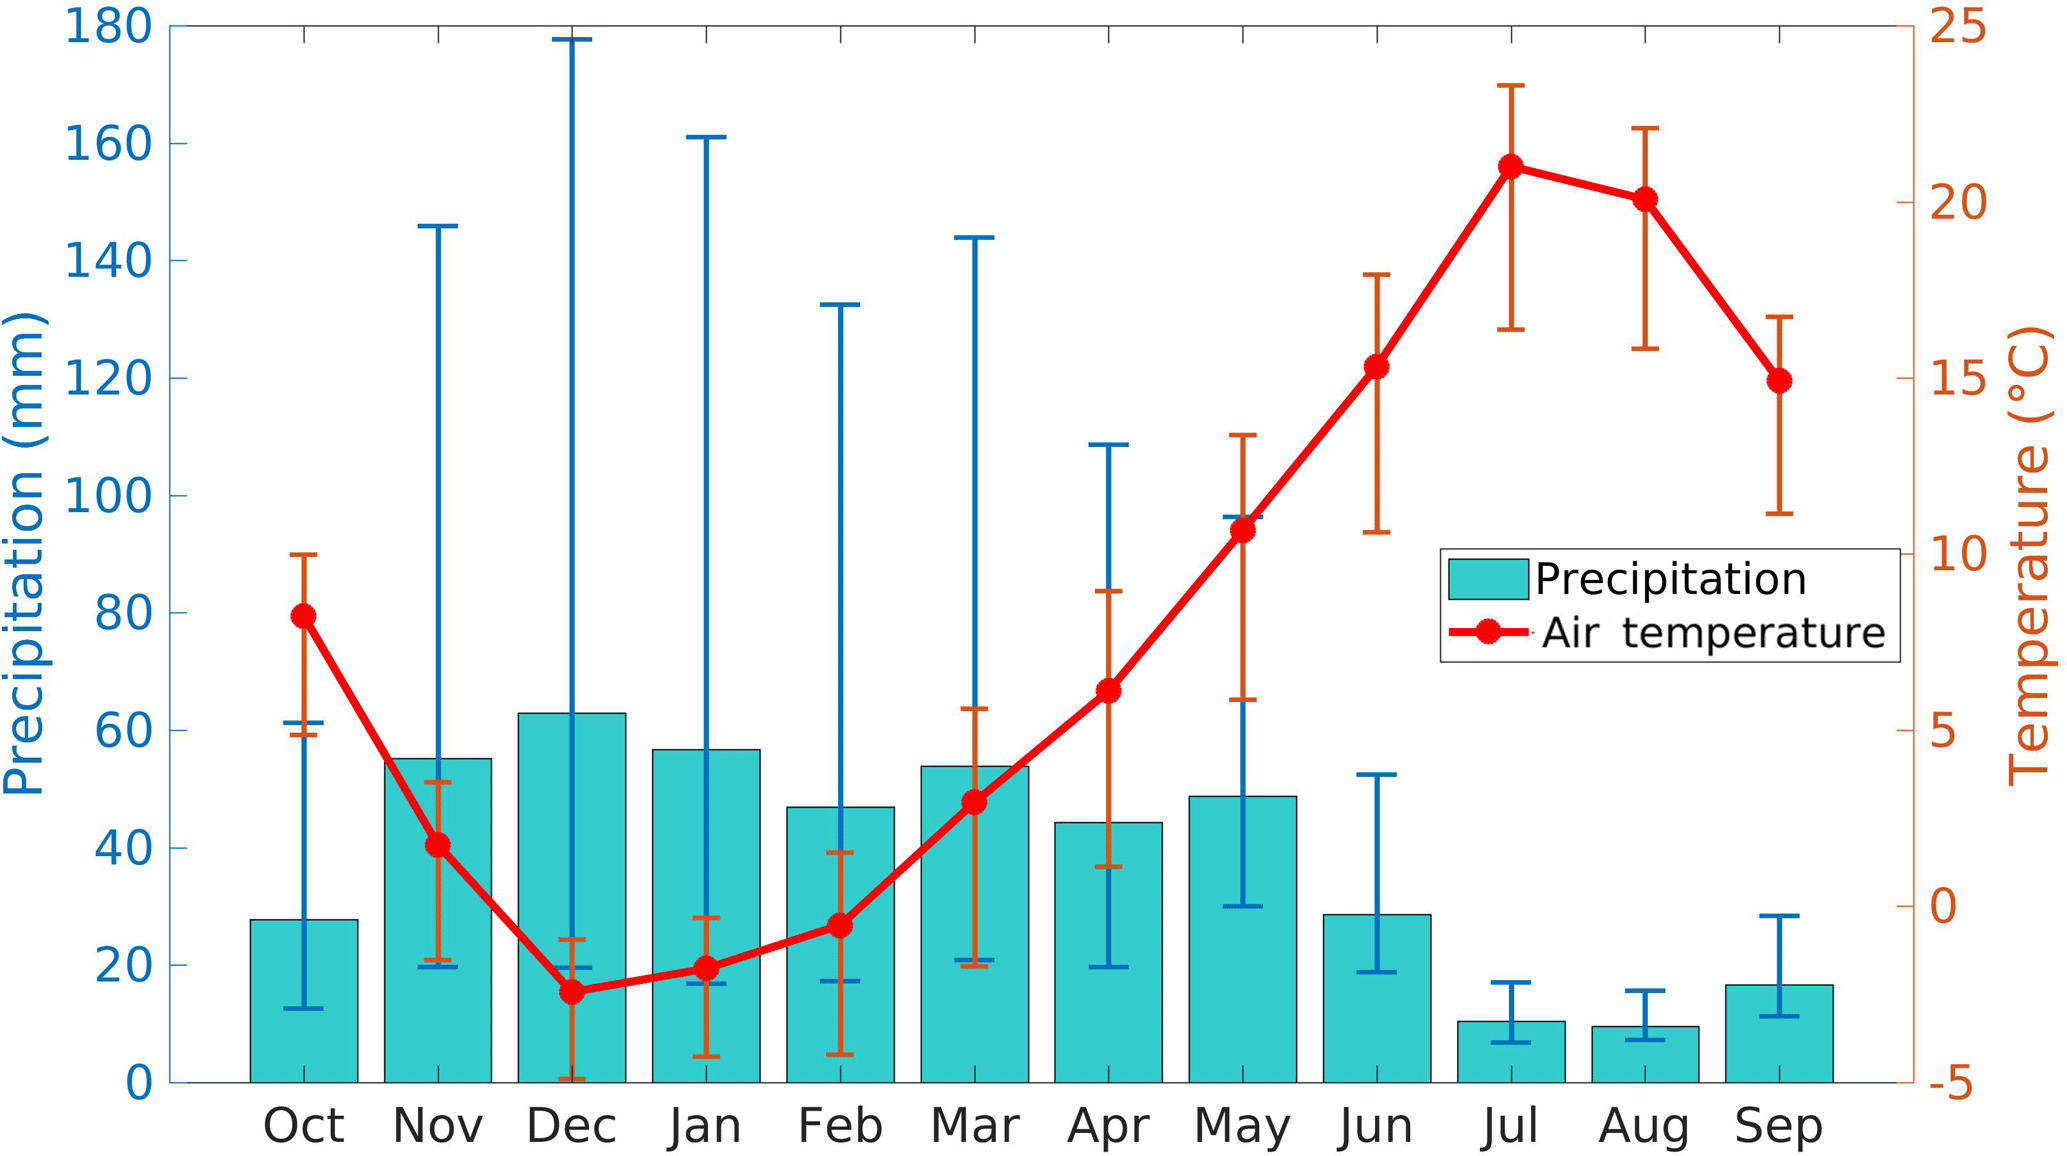
Figure 3Mean monthly precipitation and air temperature showing that warm temperatures are out of phase with high precipitation. Red and blue vertical bars show the range in monthly data for the 31 years of this dataset.
Vegetation cover in the lower elevations of RCEW is characterized by sparse shrub and grasslands, while upper elevations are characterized by mixed conifer woodlands. Northerly aspects are commonly more productive and have denser vegetation. There exists a strong snow–vegetation feedback, where drift areas commonly support denser shrub and aspen communities. The spatial distributions of vegetation, soils, and geology, and the availability of those data, are described in Seyfried et al. (2001).
Precipitation, air temperature, and relative humidity have been measured at multiple locations within RCEW at different time periods (Figs. 1 and 2). Since many of the measurement locations in RCEW have been operating for long time periods, changes in instrumentation have been necessary. Instruments have always been carefully calibrated. Precipitation is measured with a dual Belfort style gauge system described by Hanson et al. (2001). This arrangement measures alter-shielded and unshielded precipitation in Belfort-type precipitation gauges and allows for wind correction of the data in the absence of wind speed data (Hanson et al., 2004). Air temperature and relative humidity data have been measured using Vaisala HMP series sensors and have been upgraded as improved models became available. Measurements of these variables have been made at approximately 3 m.
Measured data from precipitation gauges and weather stations were error-checked in a number of steps. Precipitation amount, air temperature, relative humidity, and calculated vapor pressure were plotted simultaneously month by month to visually inspect for erroneous measurements, instrument failures, and instrument icing. Coincidentally, measured data from the individual stations were plotted separately and missing data were flagged. Early time shifts resulting from clock synchronization errors were fixed.
Erroneous data in air temperature and relative humidity time series were identified by visual inspection and removed. Short data gaps were filled by either linear interpolation or multiple linear regressions to surrounding stations. Data gaps longer than a day were filled with multiple linear regression using up to four surrounding stations if a strong relationship existed. We chose to fill these gaps during the quality control stage of the dataset preparation, as opposed to filling them with the detrended kriging algorithm, for computational efficiency reasons. Recalculation of station weights, the most computationally expensive part of the spatial distribution process, must be performed every time the detrended kriging software encounters a missing value. Data gaps that were longer than a day and lacked this relation were left as missing data. All available weather stations that had air temperature or relative humidity were used in the spatial distributions of that variable.
Precipitation data were filtered following Nayak et al. (2008) and wind-corrected following Hanson et al. (2004, 2001). Precipitation station data were included based on (1) the degree of wind sheltering due to topography and vegetation and (2) the spatial arrangement of measurement locations. Wind-sheltered precipitation gauges were preferentially used over wind exposed sites following Winstral et al. (2013) and Winstral and Marks (2014). However, some exposed precipitation stations were used because they were the only ones representing large portions of RCEW (e.g., 057, 049, and 127). We note that Fig. 2 represents the data used in the spatial distribution of variables, not necessarily the data available. For example, lower sheep creek (rc.lsc-127) has precipitation measurements, but we did not use them because they did not meet our wind sheltering requirements. Based on these criteria, 19 precipitation locations were selected.
Detrended kriging was used to spatially distribute measured air temperature, relative humidity, and precipitation for each hour (Garen et al., 1994; Garen, 1995). The detrended kriging method first fits an elevation model to measured data using a least absolute deviations regression. That model is used to spatially distribute the variable over a user-supplied digital elevation model (DEM). Residuals from that elevation model were then kriged to obtain a spatial distribution of deviations from the elevation model and added to the elevation distribution to get the final distributed variable. The linear elevation model is constrained to have a negative slope with elevation for air temperature, positive slope with elevation for precipitation, and has no constraints for relative humidity.
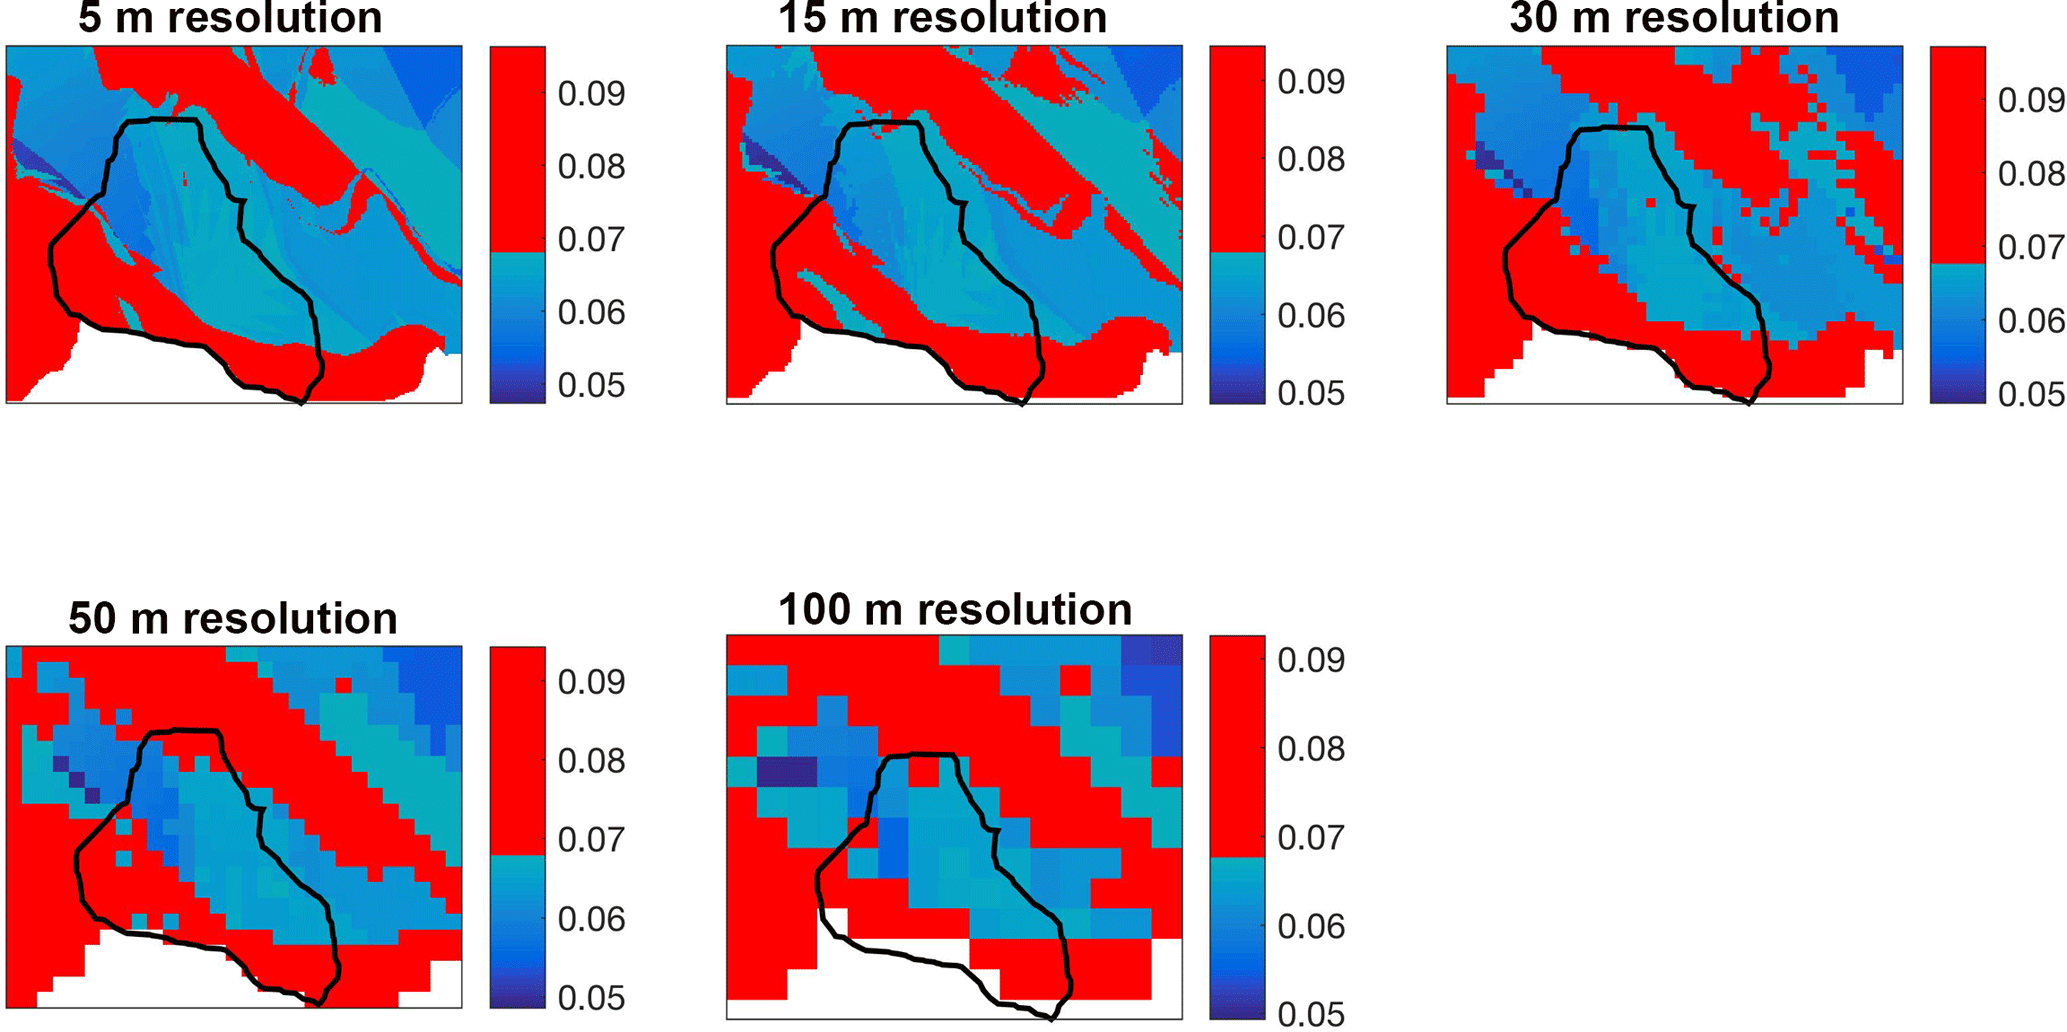
Figure 4Maps of the percent of precipitation received as mixed precipitation at the Reynolds Mountain East subcatchment from January 2002 to compare different spatial resolutions.
The performance of the detrended kriging algorithm on measured precipitation data has been previously quantified at RCEW through a combination of cross validation, checking for temporal consistency, and a rough comparison to PRISM (Kahl, 2013) over a longer period (1964–2008), which includes all but the last few years of the 31-year period of record presented here (1984–2014). Cross validation was performed by systematically leaving out 1 of 24 daily measured precipitation values, distributing precipitation, and comparing the modeled result to the measured values. Differences in total basin precipitation ranged from −3.38 to 3.13 % with a mean value of 0.07 %, and differences at point locations ranged from −165 to 38 % with a mean of −11 %. Temporal consistency was evaluated by comparing the sum of hourly distributed grids to the distributed daily grid for multiple days. Mean differences were less than 0.4 %, and the average root-mean-square difference between the two surfaces was 7 % of daily precipitation. Kahl (2013) also showed that over RCEW detrended kriging distributions compared better than 1 % to PRISM distributions at monthly and annual scales.
A spatial resolution was selected for this dataset based on future development of distributed radiation. We feel that the lidar dataset provides sufficient data on the topography and vegetation to justify a 10 m grid cell. This complementary dataset will be distributed on the same grid. In addition, this resolution will allow for a more specific delineation of the rain–snow transition zone. The area of the rain–snow transition zone was compared when distributing all variables over a 5, 10, 30, 50, and 100 m DEM for January 2002. For this specific illustration, we define the rain–snow transition zone as areas of the watershed that receive 7 % or more of the precipitation as mixed events during this time period (Fig. 4). Although the areal extent of the rain–snow transition zone was not sensitive to the grid sizes evaluated, the detail of the spatial patterns degrades quickly at lower resolutions in smaller subcatchments (e.g., Reynolds Mountain East, shown in Fig. 4).
Precipitation phase is based on during-storm humidity. Though Harder and Pomeroy (2013) suggest that ice bulb or wet bulb temperature is most appropriate, Marks et al. (2013) showed that in RCEW there is little or no difference between dew point (Td) and wet bulb (Tw) temperatures. For this analysis we used during-storm Td to determine phase. Dew point temperature (Td) was calculated from distributed air temperature and relative humidity using methods developed by Marks et al. (1999). Precipitation that fell with Td less than −0.5 ∘C is assumed to be 100 % snow, and precipitation that fell with Td greater than 1.0 ∘C is assumed to be 0 % snow (all rain) (Marks et al., 2013). Percent snow for mixed-phase precipitation is linearly interpolated from 0 % at Td of −0.5 ∘C to 100 % at Td of 1.0 ∘C.
The unprecedented spatial and temporal resolution of this dataset resulted in over 20 TB of data and took more than 2 years to perform quality control on the weather station data. The computational demands were considerable on both a 6-processor desktop computer as well as a 40-core server.
As an example of the type of detailed information that can be extracted from this dataset, we look at 1 h of a mixed-phase precipitation event that occurred on 21 January 2002 at 13:00 mountain standard time (Fig. 5). Distributed air temperature and relative humidity were used to calculate distributed Td, which was in turn used to classify precipitation as rain, snow, or mixed phase. We then divided the basin elevation into 10 % quantiles to get a more detailed description of where it was raining and where it was snowing (Fig. 5a and f). Precipitation data do not account for wind redistribution of snow.
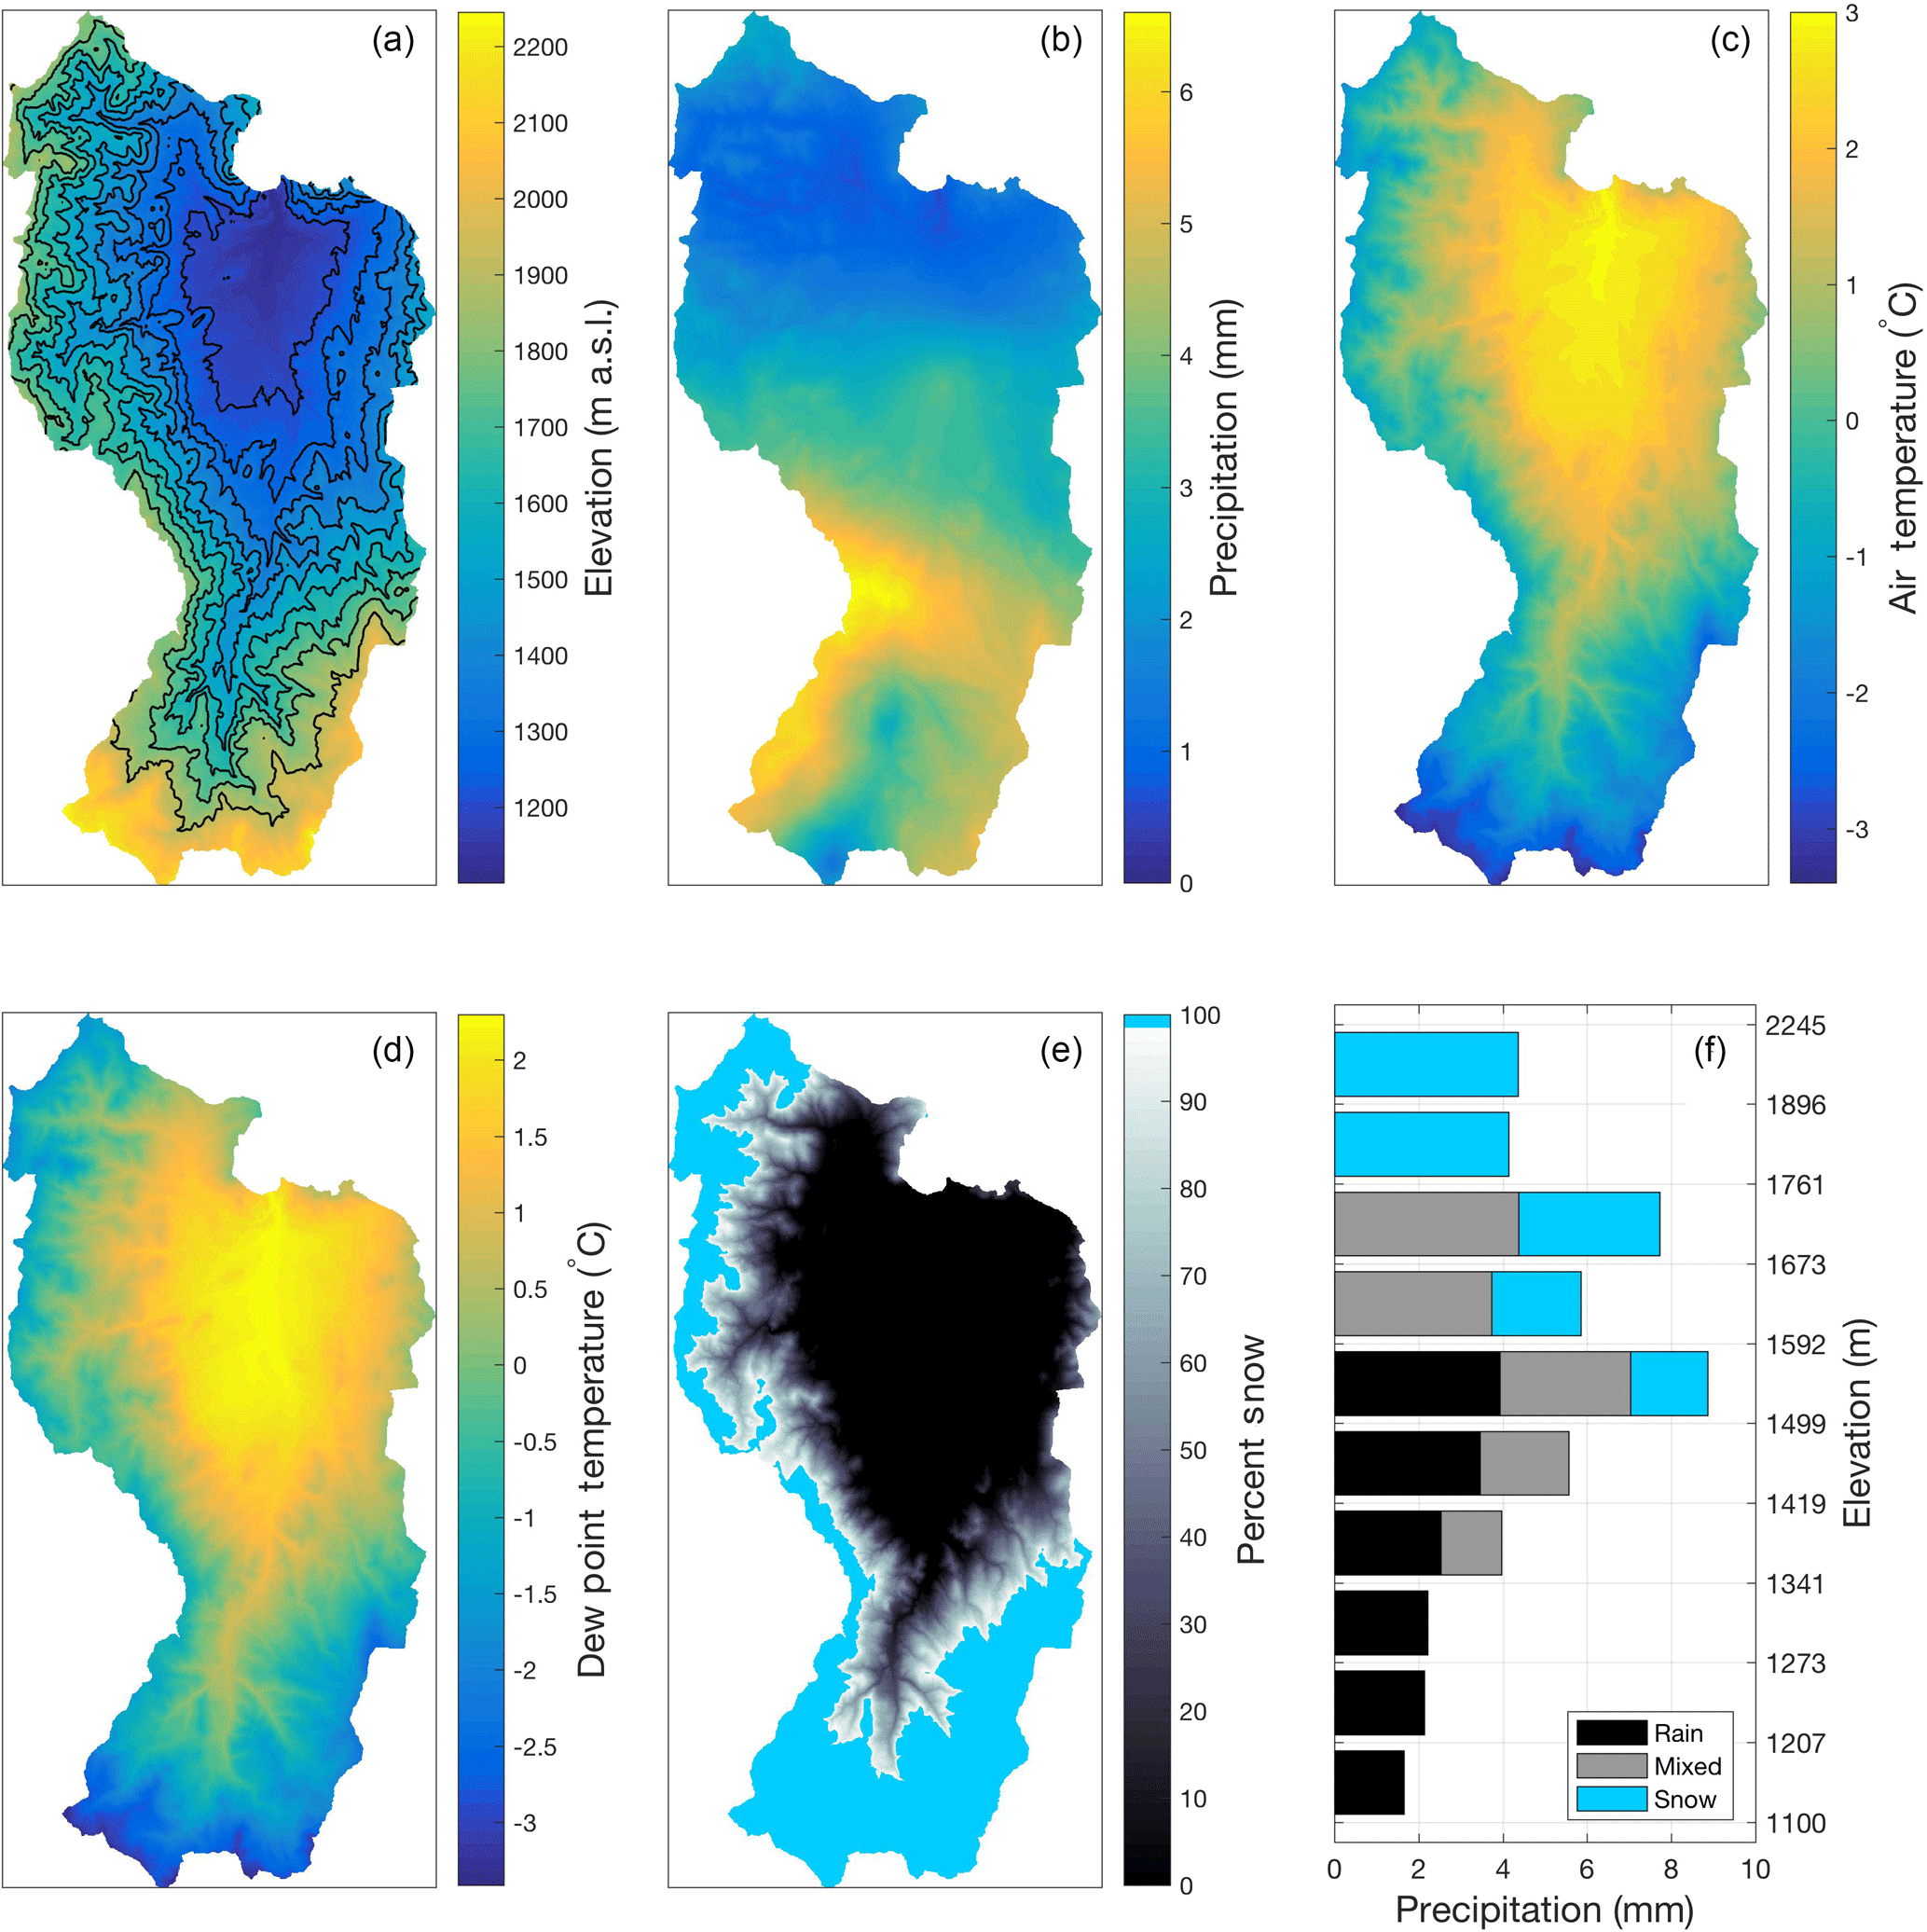
Figure 5Example data from a mixed-phase precipitation event that occurred on 21 January 2002 at 13:00 mountain standard time showing (a) the digital elevation model with black lines showing the delineation of bands that precipitation phase was extracted for (f), (b) the distributed precipitation amount, (c) the distributed air temperature, (d) the distributed dew point temperature, (e) the distributed precipitation phase, and (f) the amount and phase of precipitation that fell in each elevation band described in (a). Air temperature and dew point temperature are very similar because this time period is during a precipitation event.
As an example of the type of weather summary that can be extracted from this dataset, we replicate Fig. 5 but replace the 1 h data with the 31-year mean values in Fig. 6.
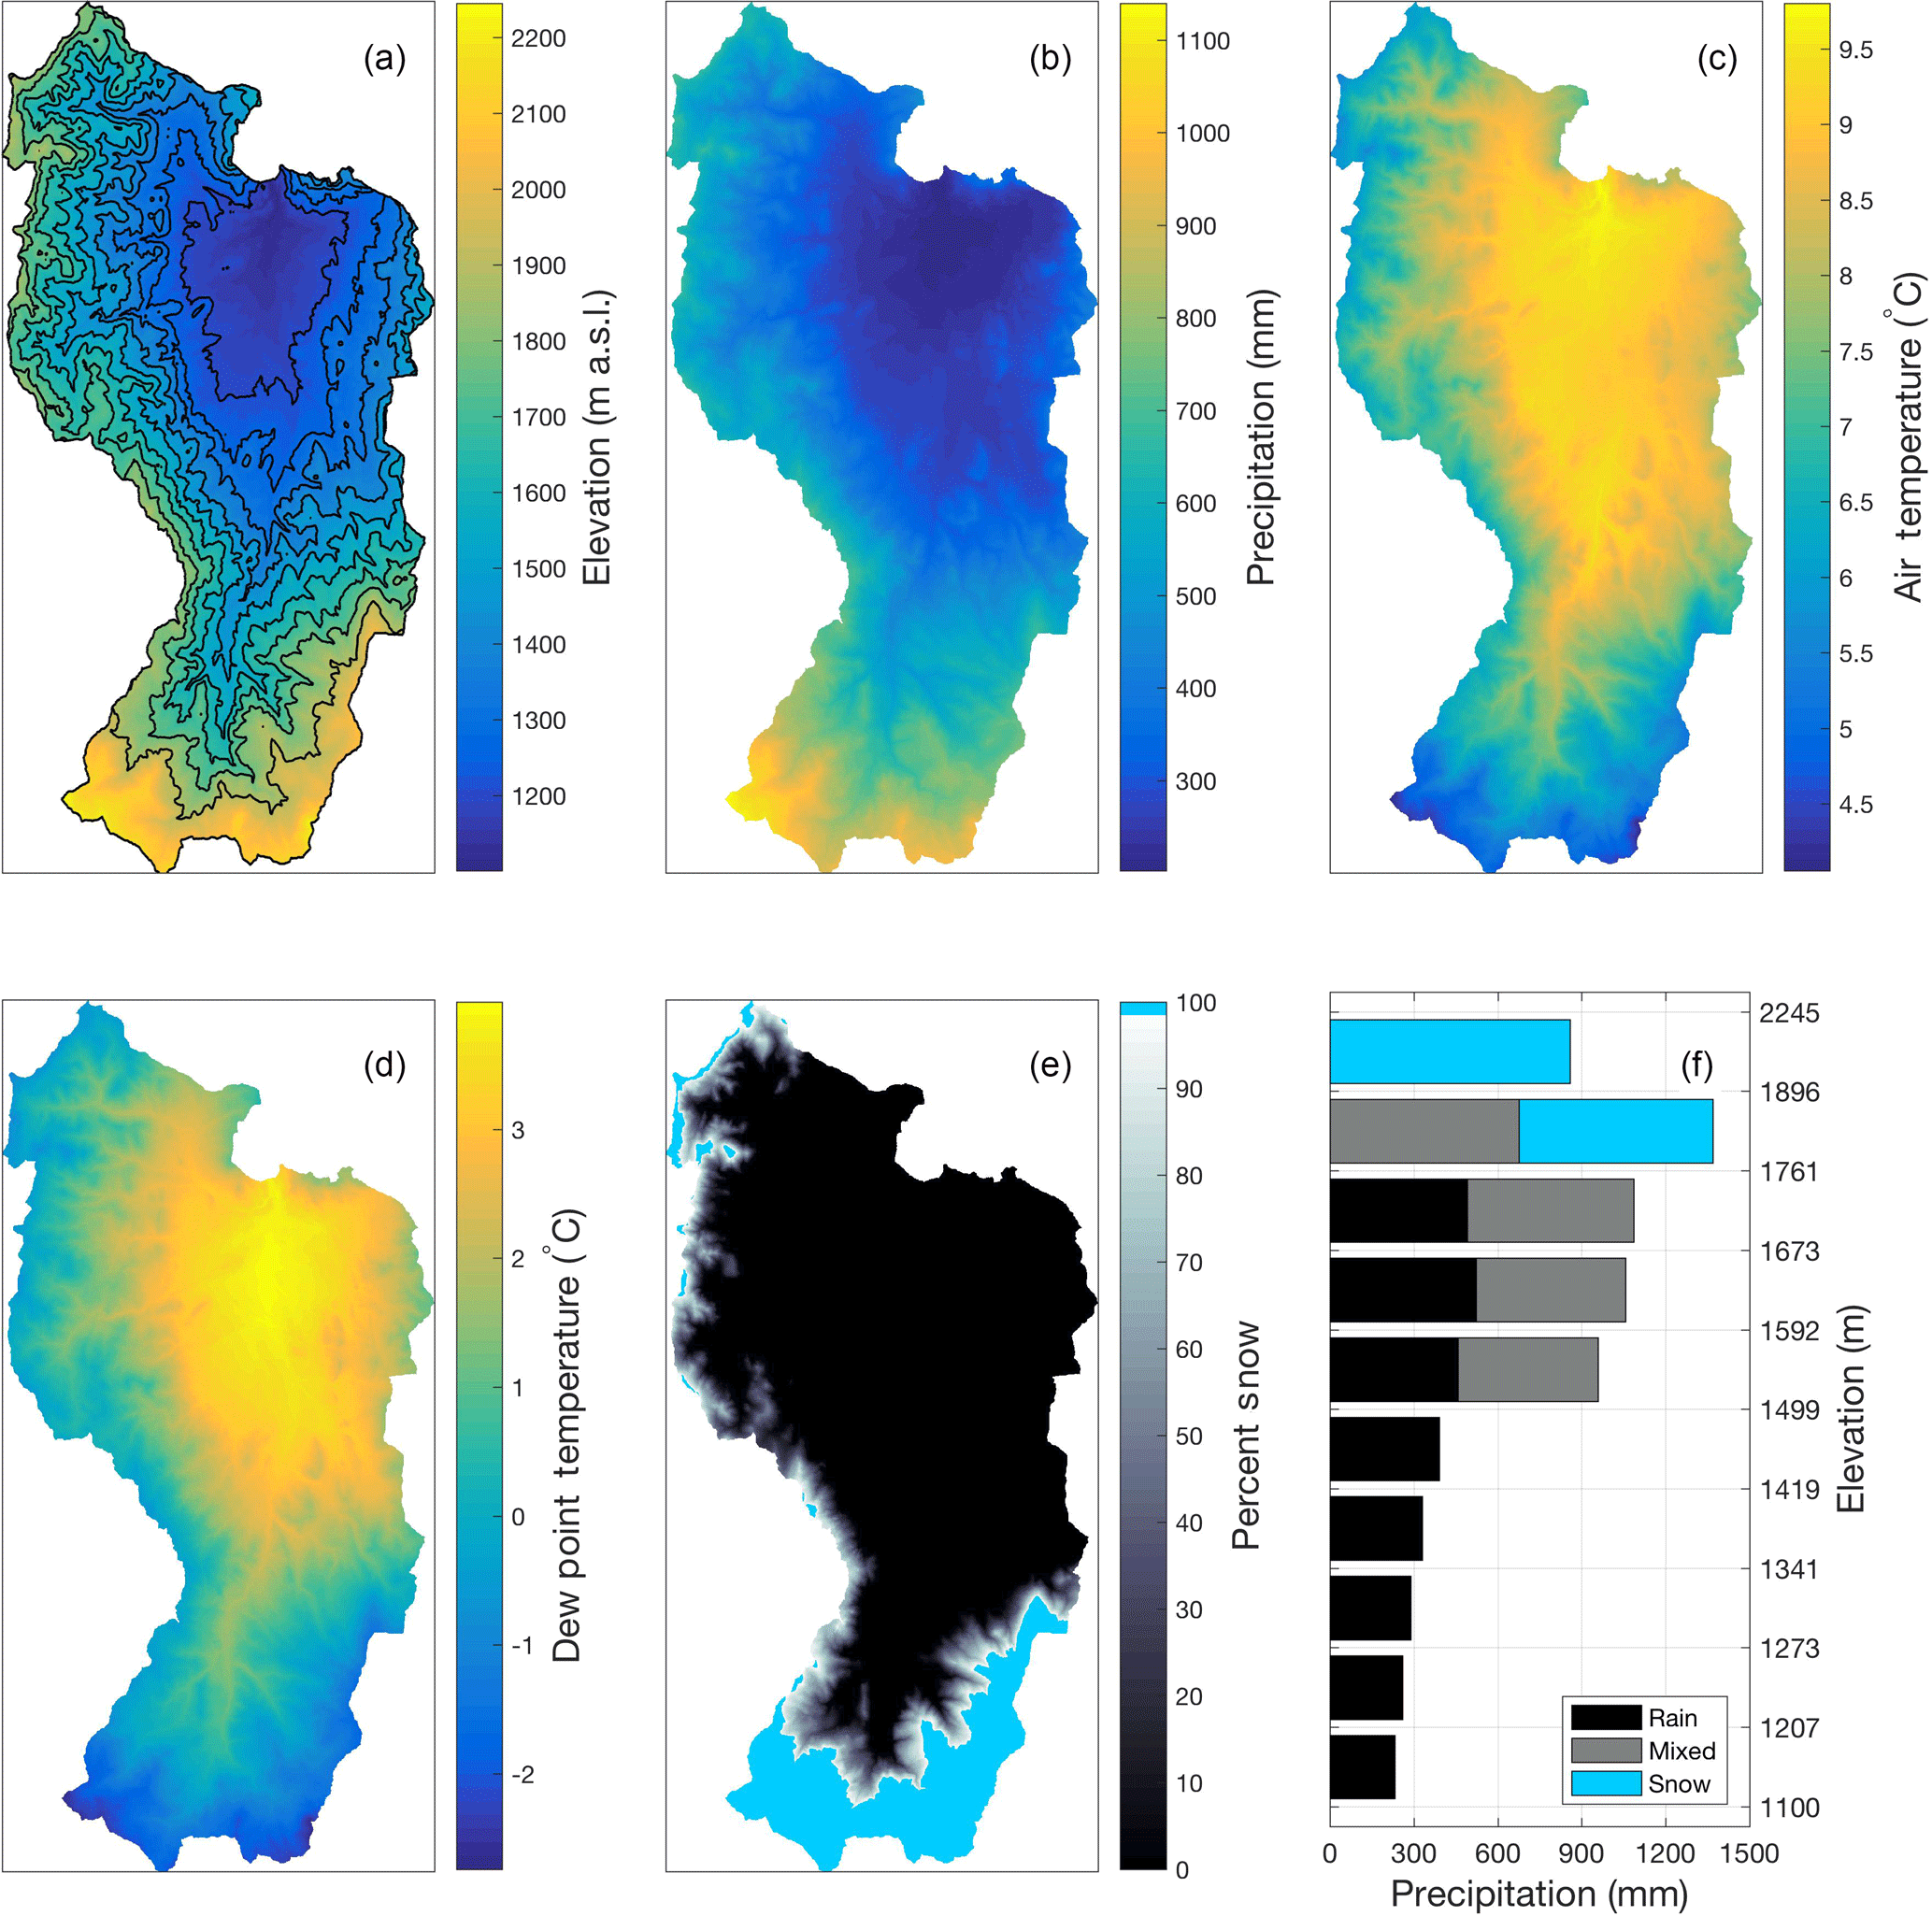
Figure 6Example summary data from the 31-year dataset showing (a) the digital elevation model with black lines showing the delineation of bands that precipitation phase was extracted for (f), (b) the mean water year distributed precipitation amount, (c) the mean water year distributed air temperature, (d) the mean water year distributed dew point temperature during precipitation, (e) the mean distributed precipitation phase, and (f) the amount and phase of precipitation that fell in each elevation band described in (a).
All data are publicly available through an OPeNDAP-enabled THREDDS server hosted by Boise State University Libraries in support of the Reynolds Creek Critical Zone Observatory at https://doi.org/10.18122/B2B59V (Kormos et al., 2016). The server allows users to download subsets of the data by variable, and in space and time. Calls to the OPeNDAP portal can be made directly from a number of scientific programming languages, including Matlab, Python, and R. An example Python script is available in the ARS-Snow GitLab repository (https://gitlab.com/ars-snow/RCZO_spatial_data_code, last access: 13 June 2018). Spatial reference information is all in the projection UTM, NAD83, Zone 11. Weather data are stored in the NetCDF file format using conventions CF-1.6 (http://cfconventions.org/Data/cf-conventions/cf-conventions-1.6/build/cf-conventions.pdf, last access: 13 June 2018). Files are organized by variable and water year. Each file contains a three-dimensional array of the distributed variable of size 1395 (grid cells east–west) by 2813 (grid cells north–south) by 8760 (hours or 8784 for leap years). In addition, each file contains the digital elevation model used to distribute the spatial data, masks of the subwatersheds within the larger Reynolds Creek Experimental Watershed, the eastings and northings of the center of each grid cell in meters, the latitudes and longitudes of the center of each grid cell in decimal degrees, and the time vector corresponding to the distributed variable. Precipitation mass, air temperature, and relative humidity files also contain the measured time series data, names, and coordinates (easting, northing) of the weather stations used to distribute the data for that water year. Additional supporting data for RCEW, including streamflow data, vegetation, geology, and soil data, are available from ftp://ftp.nwrc.ars.usda.gov/reynolds-creek-datasets/archived-2001-water-resources-research-versions.zip (last access: 13 June 2018).
Thirty-one years of spatially distributed air temperature, relative humidity, dew point temperature, and precipitation mass and phase are presented for the Reynolds Creek Experimental Watershed. This fine spatial (10 m grid cells) and temporal (hourly) dataset facilitates (1) analysis of “whole catchment” weather data as opposed to point measurement data, and (2) hydrological and ecological modeling of a mesoscale catchment in the rain–snow transition zone. Data are relevant to studies exploring historic climate changes in one of the most sensitive environments in the Mountain West, United States: the rain–snow transition zone. Future analysis will include a detailed uncertainty analysis of all parameters, a comparison of phase determination between Td and Tw, and inclusion of solar and thermal radiation, and wind.
The authors declare that they have no conflict of interest.
This article is part of the special issue “Hydrometeorological data from mountain and alpine research catchments”. It is not associated with a conference.
We thank the scientists and support staff at the Agricultural Research
Service – Northwest Watershed Research Center for the careful collection of
weather station data at the Reynolds Creek Experimental Watershed. This work
was funded in part by the NSF Critical Zone Observatory (2052-13610-010-08R),
NASA Jet Propulsion Laboratory (2052-13610-010-09T), Bureau of Reclamation
(2052-13610-010-05I), and the Natural Resources Conservation Service
(2052-13610-010-10I). USDA is an equal opportunity provider and
employer.
Edited by: John
Pomeroy
Reviewed by: three anonymous referees
Brown, R. D. and Mote, P. W.: The Response of Northern Hemisphere Snow Cover to a Changing Climate, J. Climate, 22, 2124–2145, https://doi.org/10.1175/2008JCLI2665.1, 2009. a
Garen, D. C.: Estimation of spatially distributed values of daily precipitation in mountainous areas, in: Mountain Hydrology: Peaks and Valleys in Research and Applications, Canadian Water Resources Association, Cambridge, Ont., Canada, 237–242, 1995. a
Garen, D. C., Johnson, G. L., and Hanson, C. L.: Mean Areal Precipitation For Daily Hydrologic Modeling In Mountainous Regions, J. Am. Water Resour. As., 30, 481–491, https://doi.org/10.1111/j.1752-1688.1994.tb03307.x, 1994. a
Godsey, S. E., Marks, D. G., Kormos, P. R., Seyfried, M. S., Enslin, C. L., McNamara, J. P., and Link, T. E.: Data from: Eleven years of mountain weather, snow, soil moisture and stream flow data from the rain-snow transition zone – the Johnston Draw catchment, Reynolds Creek Experimental Watershed and Critical Zone Observatory, USA, USDA National Agricultural Library Data Commons, https://doi.org/10.15482/USDA.ADC/1402076, 2016. a
Hanson, C., Burgess, M., Windom, J., and Hartzmann, R.: New Weighing Mechanism for Precipitation Gauges, J. Hydrol. Eng., 6, 75–77, https://doi.org/10.1061/(ASCE)1084-0699(2001)6:1(75), 2001. a, b
Hanson, C., Pierson, F., and Johnson, G.: Dual-Gauge System for Measuring Precipitation: Historical Development and Use, J. Hydrol. Eng., 9, 350–359, https://doi.org/10.1061/(ASCE)1084-0699(2004)9:5(350), 2004. a, b
Harder, P. and Pomeroy, J.: Estimating precipitation phase using a psychrometric energy balance method, Hydrol. Process., 27, 1901–1914, https://doi.org/10.1002/hyp.9799, 2013. a
Kahl, A.: Reconstruction of heterogeneous snow water equivalent from MODIS imagery and energy balance modeling, PhD thesis, University of California, Santa Barbra, ISBN: 9781303539114, 2013. a, b
Klos, P. Z., Link, T. E., and Abatzoglou, J. T.: Extent of the rain-snow transition zone in the western U.S. under historic and projected climate, Geophys. Res. Lett., 41, 4560–4568, https://doi.org/10.1002/2014GL060500, 2014. a
Kormos, P. R., Marks, D., Williams, C. J., Marshall, H. P., Aishlin, P., Chandler, D. G., and McNamara, J. P.: Soil, snow, weather, and sub-surface storage data from a mountain catchment in the rain–snow transition zone, Earth Syst. Sci. Data, 6, 165–173, https://doi.org/10.5194/essd-6-165-2014, 2014. a
Kormos, P. R., Marks, D. G., Seyfried, M. S., Havens, S. C., Hedrick, A., Lohse, K. A., Masarik, M., and Flores, A. N.: 31 Years of Spatially Distributed Air Temperature, Humidity, Precipitation Amount and Precipitation Phase From a Mountain Catchment in the Rain-snow Transition Zone, Reynolds Creek Critical Zone Observatory Data, https://doi.org/10.18122/B2B59V, 2016. a
Marks, D., Domingo, J., Susong, D., Link, T., and Garen, D.: A spatially distributed energy balance snowmelt model for application in mountain basins, Hydrol. Proc., 13, 1935–1959, 1999. a
Marks, D., Winstral, A., Reba, M., Pomeroy, J., and Kumar, M.: An evaluation of methods for determining during-storm precipitation phase and the rain/snow transition elevation at the surface in a mountain basin, Adv. Water Resour., 55, 98–110, 2013. a, b
Morin, S., Lejeune, Y., Lesaffre, B., Panel, J.-M., Poncet, D., David, P., and Sudul, M.: An 18-yr long (1993–2011) snow and meteorological dataset from a mid-altitude mountain site (Col de Porte, France, 1325 m alt.) for driving and evaluating snowpack models, Earth Syst. Sci. Data, 4, 13–21, https://doi.org/10.5194/essd-4-13-2012, 2012. a
Mote, P. W.: Trends in snow water equivalent in the Pacific Northwest and their climatic causes, Geophys. Res. Lett., 30, 1601, https://doi.org/10.1029/2003GL017258, 2003. a
Nayak, A., Chandler, D. G., Marks, D., McNamara, J. P., and Seyfried, M.: Correction of electronic record for weighing bucket precipitation gauge measurements, Water Resour. Res., 44, W00D11, https://doi.org/10.1029/2008WR006875, 2008. a
Nayak, A., Marks, D., Chandler, D. G., and Seyfried, M.: Long-term snow, climate, and streamflow trends at the Reynolds Creek Experimental Watershed, Owyhee Mountains, Idaho, United States, Water Resour. Res., 46, W06519, https://doi.org/10.1029/2008WR007525, 2010. a, b, c
Reba, M. L., Marks, D., Seyfried, M., Winstral, A., Kumar, M., and Flerchinger, G.: A long-term data set for hydrologic modeling in a snow-dominated mountain catchment, Water Resour. Res., 47, W07702, https://doi.org/10.1029/2010WR010030, 2011. a
Seyfried, M., Harris, R., Marks, D., and Jacob, B.: Geographic Database, Reynolds Creek Experimental Watershed, Idaho, United States, Water Resour. Res., 37, 2825–2829, https://doi.org/10.1029/2001WR000414, 2001. a
Western, A. W. and Grayson, R. B.: The Tarrawarra Data Set: Soil moisture patterns, soil characteristics, and hydrological flux measurements, Water Resour. Res., 34, 2765–2768, https://doi.org/10.1029/98WR01833, 1998. a
Winstral, A. and Marks, D.: Long-term snow distribution observations in a mountain catchment: Assessing variability, time stability, and the representativeness of an index site, Water Resour. Res., 50, 293–305, https://doi.org/10.1002/2012WR013038, 2014. a
Winstral, A., Marks, D., and Gurney, R.: Simulating wind-affected snow accumulations at catchment to basin scales, Adv. Water Resour., 55, 64–79, 2013. a