the Creative Commons Attribution 4.0 License.
the Creative Commons Attribution 4.0 License.
 | 16 Nov 2026
PhaFoS: a global database of Phanerozoic foraminiferal size
Yan Feng
Jiankang Lai
Daoliang Chu
Xiaokang Liu
Xiang Shu
Lee Hsiang Liow
Yuyang Wu
Yunfei Huang

Body size is a key phenotypic trait of living organisms, reflecting ecological function and individual metabolism. Evolutionary changes in body size also provide information on interactions between the organisms and their changing physical and biotic environments. Despite the utilitarian value of body size for understanding evolution and past environments, we lack a standardized, occurrence-based, Phanerozoic body size database for most groups of organisms, limiting large-scale studies of size evolution and size-environment interactions. Foraminifera are an ideal group to fill this data gap, given their abundant fossil record, extensive palaeogeographic distribution, and sensitivity to environmental changes. Here, we present PhaFoS, short for Phanerozoic Foraminifera Size database. PhaFoS compiles 118 885 specimens, of which 103 121 from 963 published papers and the remaining 15 764 from our field colletions, representing 4167 genera and 34 256 species. Each record is linked to standardized and queryable metadata fields, including test volume (log10 µm3), taxonomy, stratigraphic age, and both modern and paleogeographic coordinates. This database can be used to quantify temporal and spatial patterns of foraminiferal body-size over the Phanerozoic, and to explore the body size relationships with environmental conditions and their changes. The data files described in this paper are available at https://doi.org/10.5281/zenodo.20777319 (Feng and Song, 2026).
- Article
(9194 KB) - Full-text XML
- BibTeX
- EndNote


The fossil record provides a valuable foundation for understanding organismal evolution and the coeval changes in the geobiosphere (Raup and Sepkoski, 1982; Benton et al., 2000; Benson et al., 2021). To allow for research across disparate scales, ranging from local sites to regions and whole globe, it is crucial to systematically compile and standardise palaeontological data (Benton, 1999; Dowding et al., 2026). Sepkoski (1982) compiled the stratigraphic distribution of marine fossil groups, providing a foundation for subsequent research on macroevolution and biodiversity changes. With the expansion of literature and data, manually compiled datasets were increasingly organised in structured digital formats, including Neptune (Lazarus, 1994). The Paleobiology Database (PBDB) (Alroy et al., 2001), a large-scale relational database containing fossil occurrence records with spatial, temporal, stratigraphic, and taxonomic information that could be updated by the scientific community. Some more taxon-specific databases have also emerged, such as the New and Old Worlds (NOW) database (The NOW Community, 2026) for Cenozoic terrestrial mammal morphology, ecology and locality records (Jernvall and Fortelius, 2002), and the Global Acritarch Database (GAD), which standardises global dispersed acritarch records (Shu et al., 2025). Broader resources include the Geobiodiversity Database (GBDB) for outcrop-level fossil occurrences and absences (Fan et al., 2011, 2013, 2014), and BioDeepTime, for modern and fossil community time series (Smith et al., 2023).
Body size is a truly fundamental biological trait, closely related to lifespan, life history, ecological niche, and resource utilization (Peters, 1983; Blanckenhorn, 2000; Chole et al., 2019; Rao, 2021). For example, Cope's Rule, proposed by paleontologist Edward Drinker Cope in the 19th century, states that lineages tend to evolve toward larger individuals (Cope, 1896; Stanley, 1973). Furthermore, size variations in individuals, populations, species and higher taxonomic groups can reflect (past) ecological and evolutionary patterns and processes, including the gigantism observed in high-oxygen environments (Miller, 1966; Dudley, 2000; Fike et al., 2006; Papineau et al., 2007; Payne et al., 2009; Heim et al., 2015), Bergmann's rule (Bergmann, 1847), the temperature-size rule (Partridge and French, 1996; Angilletta and Dunham, 2003; Hunt and Roy, 2006), and the Lilliput effect during mass extinction events (Schmidt et al., 2004; Payne, 2005; Twitchett, 2007; Huang et al., 2010; Payne et al., 2012; Groves and Wang, 2013; Feng et al., 2020; Huang et al., 2023). Fortunately, the importance of body size databases has been recognised. Indeed, researchers began establishing body size databases 2.5 decades ago, covering mammals (Smith et al., 2003), birds (Dunning, 2007), crinoids (Salamon et al., 2021, 2023), and marine animals (Heim et al., 2015; McClain et al., 2025). Yet Foraminifera, an ecologically and palaeontologically vital assemblage of marine protists, are omitted from these existing occurrence-based databases.
Foraminifera are single-celled protists that are highly diverse and extremely abundant in modern oceans (Sen Gupta, 2003; Brummer and Kučera, 2022; Simmons and Aretz, 2026). They are also well-known for their extensive and relatively continuous fossil record, which can be traced back to the early Cambrian (Loeblich and Tappan, 1988; Faulkner et al., 2025). As primary consumers in marine ecosystems, foraminiferans occupy an important position in trophic networks, and changes in their body size likely record biotic responses to environmental changes and major events (Hallock, 1985; Walker et al., 2017). Previous studies have shown that foraminiferal body size variations can be grouped into three major patterns. First, under hyperoxic conditions, late Paleozoic foraminiferans evolved gigantism, with fusulinoidean Foraminifera representing the largest group (Payne et al., 2012). Second, size reduction in Foraminifera is evident during severe environmental stress. For instance, foraminiferans demonstrate a significant Lilliput effect (a reduction in body size) during the Guadalupian-Lopingian (Payne et al. 2012; Groves and Wang, 2013; Feng et al., 2020), end-Permian (Song et al., 2011; Rego et al., 2012; Payne et al., 2013; Feng et al., 2020; Yang et al., 2024), and end-Cretaceous extinctions (Arnold et al., 1995; Keller and Abramovich, 2009). Third, size seems to rebound after extinction events. For example, average test size began to recover during the Early Triassic and stabilized during the Middle and Late Triassic (Feng et al., 2020). Similarly, planktonic Foraminifera increased in size during the Cenozoic (Arnold et al., 1995). Although some foraminiferal body size data exist, these records have not yet been systematically compiled into a Phanerozoic global database. The establishment of such a database is essential for quantifying the size evolution and further understanding how foraminiferans respond to environmental changes.
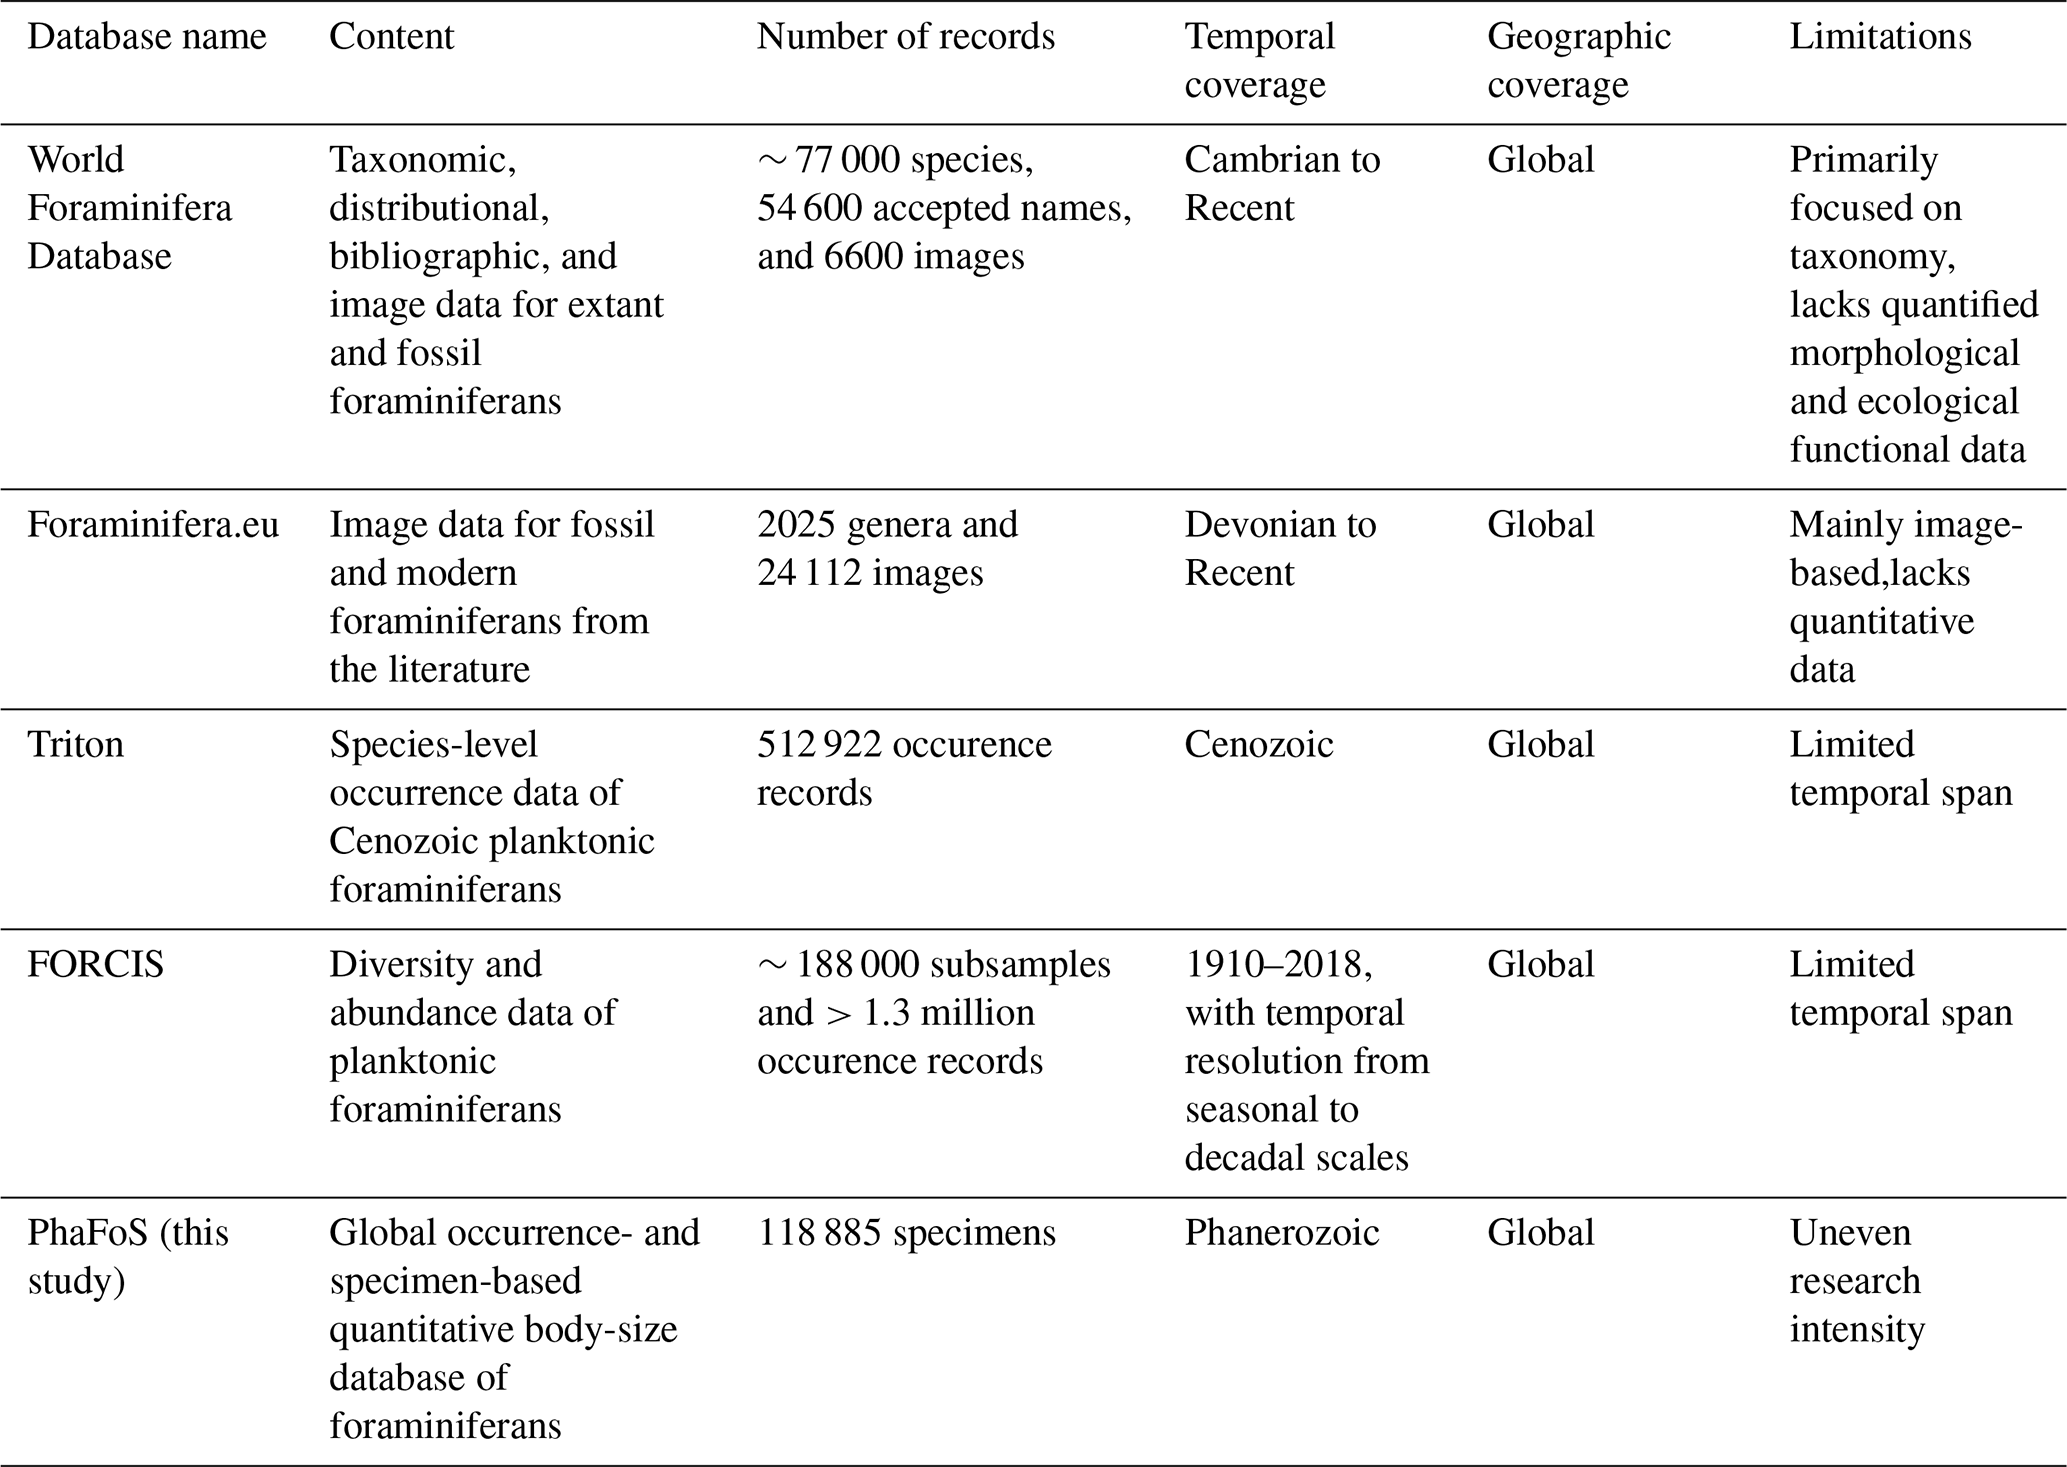
Currently, there are several public databases and online platforms dedicated to foraminiferal research, providing taxonomic, geographic, stratigraphic, and image data. Representative examples include:
-
World Foraminifera Database (Fenton et al., 2021), a taxonomic database within the World Register of Marine Species (WoRMS) that provides authoritative information on extant and fossil foraminiferal names, distribution records, images, and references (https://www.marinespecies.org/foraminifera, last access: 1 April 2026).
-
Foraminifera.eu, an image database integrating fossil and modern foraminiferal information from the literature and providing illustrated material for taxonomic comparison and morphological identification (https://foraminifera.eu/, last access: 1 April 2026).
-
Triton, a species-level database of Cenozoic planktonic foraminiferal occurrences that integrates multiple sources of spatiotemporal records and contains more than 500 000 records, substantially expanding upon earlier resources such as Neptune (Lazarus, 1994; Fenton et al., 2021).
-
FORCIS (Foraminifera Response to Climatic Stress), a global database of planktonic foraminiferal diversity, distribution, and abundance from ocean waters spanning 1910 to 2018, compiled from plankton tows, Continuous Plankton Recorders (CPR), plankton pumps, and sediment traps, together with associated sampling and taxonomic metadata (Chaabane et al., 2023).
Although these databases provide valuable resources for foraminiferal taxonomy, distribution, and ecology (Table 1), several limitations remain. First, the existing databases have little systematic documentation of phenotypic and functional traits. Second, their temporal coverage is uneven and heavily biased toward the Cenozoic and Mesozoic. Third, much of the accessible information remains descriptive, image-based, or occurrence-based, with little standardized quantitative trait data suitable for statistical modelling and comparative analyses across or within foraminiferal groups, geographic regions and/or time intervals. Although Payne et al. (2013) compiled a major Phanerozoic-scale dataset of foraminiferal body size, it was based mainly on type specimens, rather than an occurrence- or specimen-based database (Dowding et al., 2026). As a result, a global, specimen-based database specifically dedicated to foraminiferal body-size data is still lacking.
PhaFoS version 0.0.1 is available in table (.csv/.xlsx) format. In the following sections, we provide an overview of the database, describe the data sources and selection criteria, and explain the definitions and standardisation procedures applied to body-size measurements, taxonomic information, geographic distribution, and geological age metadata. We further examine the spatial and temporal distribution of the compiled records and discuss the potential applications, current limitations, and future development of the database.
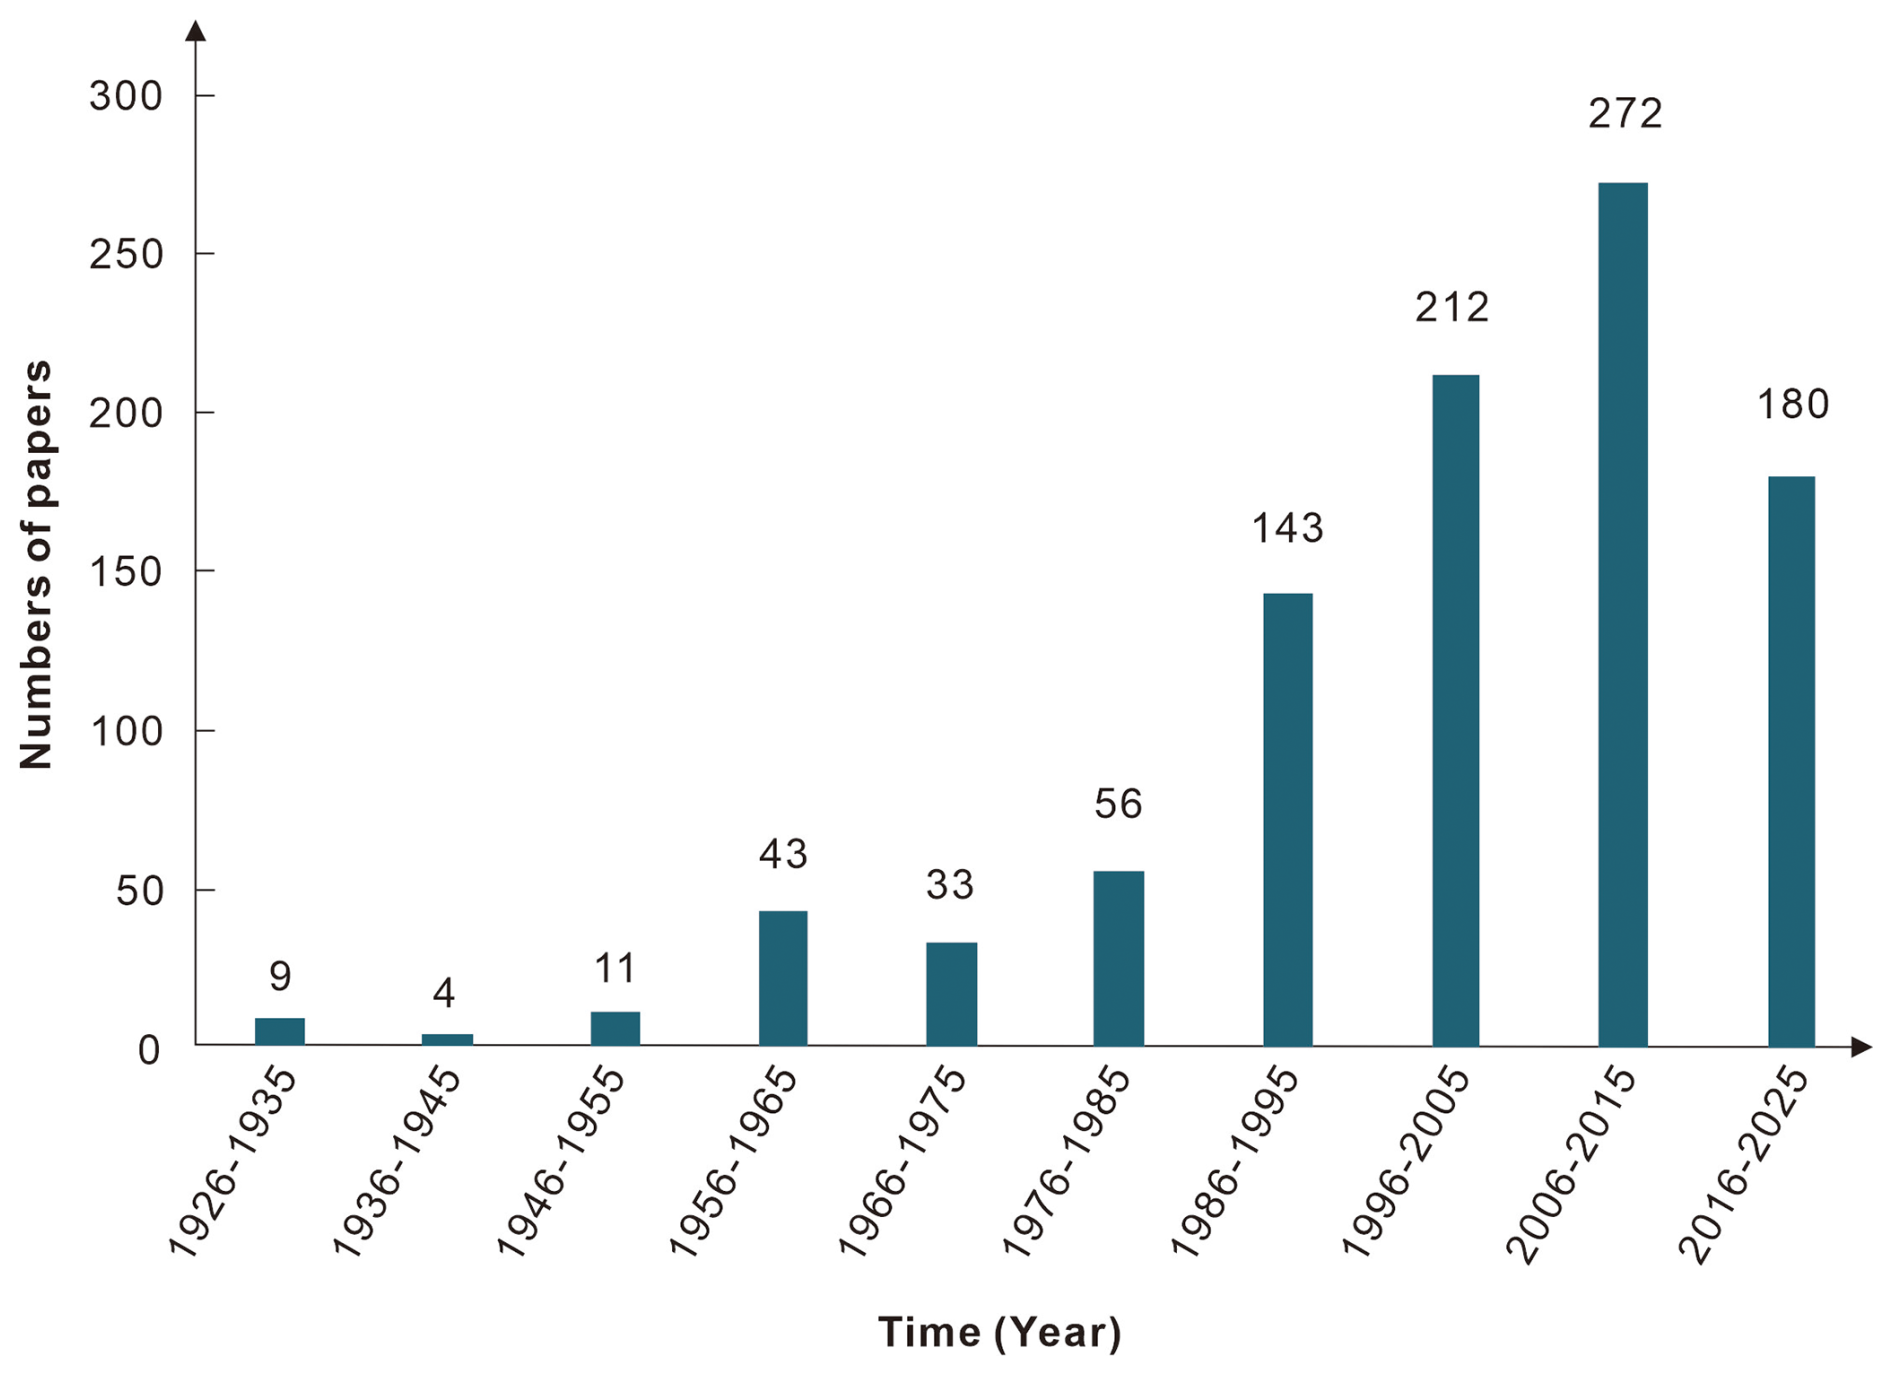
PhaFoS is a specimen-based database of foraminiferal body size spanning the Phanerozoic. The data was compiled from published studies containing foraminiferal size information, including both papers with illustrated plates of foraminiferans and size tables. In total, 963 references were included in PhaFoS (Fig. 1). To improve the completeness of the literature coverage and taxonomic consistency of PhaFoS, we also checked publicly available online resources containing foraminiferal plate or taxonomic information, including Foraminifera.eu (https://foraminifera.eu, last access: 1 June 2026), the World Foraminifera Database hosted by the World Register of Marine Species (WoRMS) (https://www.marinespecies.org, last access: 1 June 2026), the PETS database (v. 1.4) (https://pets.nhm.uio.no/PETS/, last access: 1 June 2026), and Mikrotax (https://www.mikrotax.org/pforams/, last access: 1 June 2026). For example, the World Foraminifera Database was used to verify accepted names, synonymies, and taxonomic hierarchy. The Foraminifera.eu was consulted to supplement the incomplete morphological information in the original literature. In addition, the database includes field data collected by members of our research team, including 15 764 specimens in total, i.e., 680 specimens from the Carnian (Late Triassic) of the Quxia section, 1355 specimens from the Carnian of the Erguan section, 660 specimens from the Anisian (Late Triassic) of the Qingyan section, 2093 specimens from the Anisian, Ladinian (Late Triassic), and Carnian of the Guandao section, 2590 specimens from the Wuchiapingian (Late Permian), Changhsingian (Late Permian) and Anisian of the Bianyang section, 2413 specimens from the Wuchiapingian (Late Permian) and Changhsingian of Liangfengya and Meishan sections, 495 specimens from the Changhsingian and Induan (Early Triassic) of Southern Tibet, and 5388 specimens from the Toarcian (Early Jurassic) of the Nianduo section.
To assess the completeness of stage-level coverage, the compiled dataset was cross-checked against authoritative resources such as the Paleobiology Database (PBDB), particularly the “Age range and collections” section, and the taxonomic synthesis of Loeblich and Tappan (1988), in order to identify potentially missing intervals and overlooked records. By integrating measurements from published literature, online resources, newly collected field material, and supplementary measurements from additional publications identified during cross-checking, PhaFoS assembles a globally distributed body-size dataset with broad stratigraphic coverage across the Phanerozoic. The database is intended to minimize temporal and spatial gaps in currently available foraminiferal size data and to provide a more comprehensive basis for analyses of body-size evolution and macroevolutionary patterns.
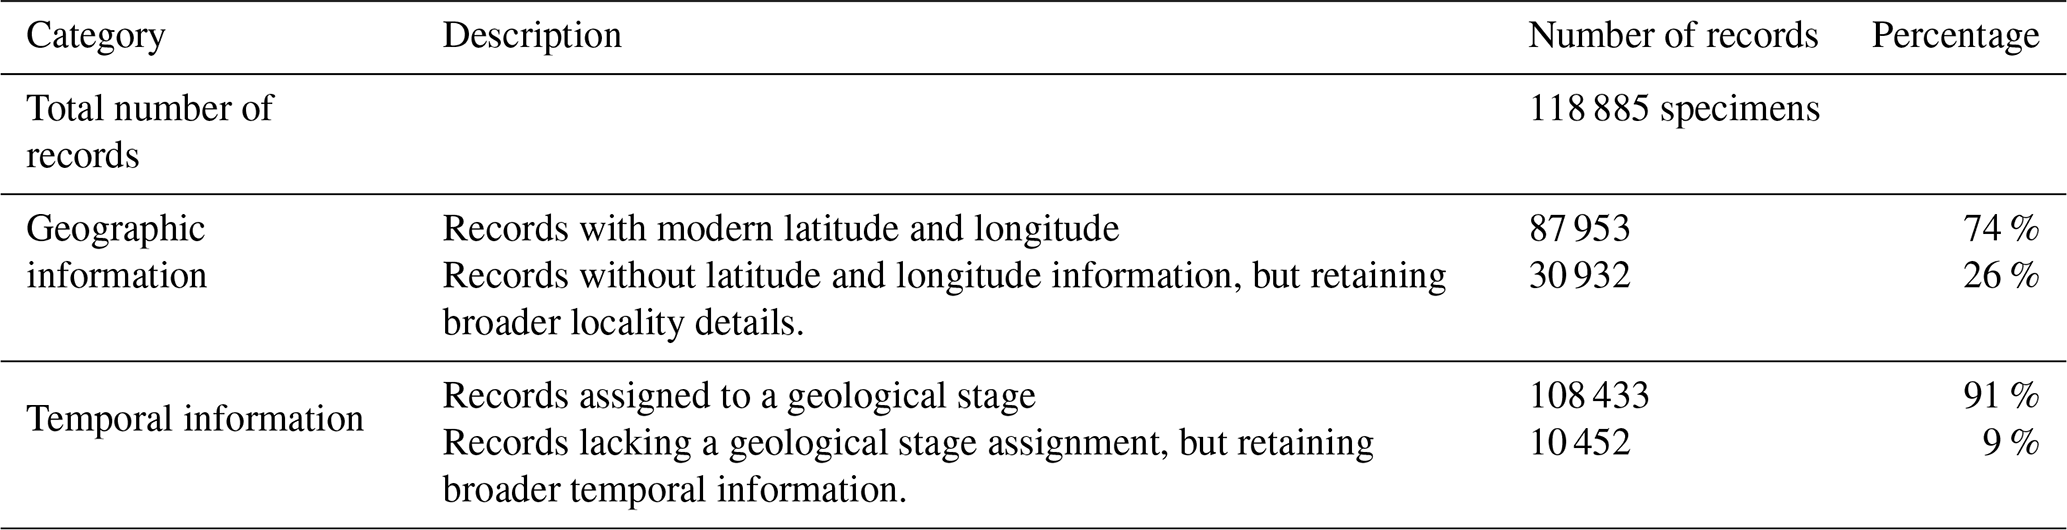
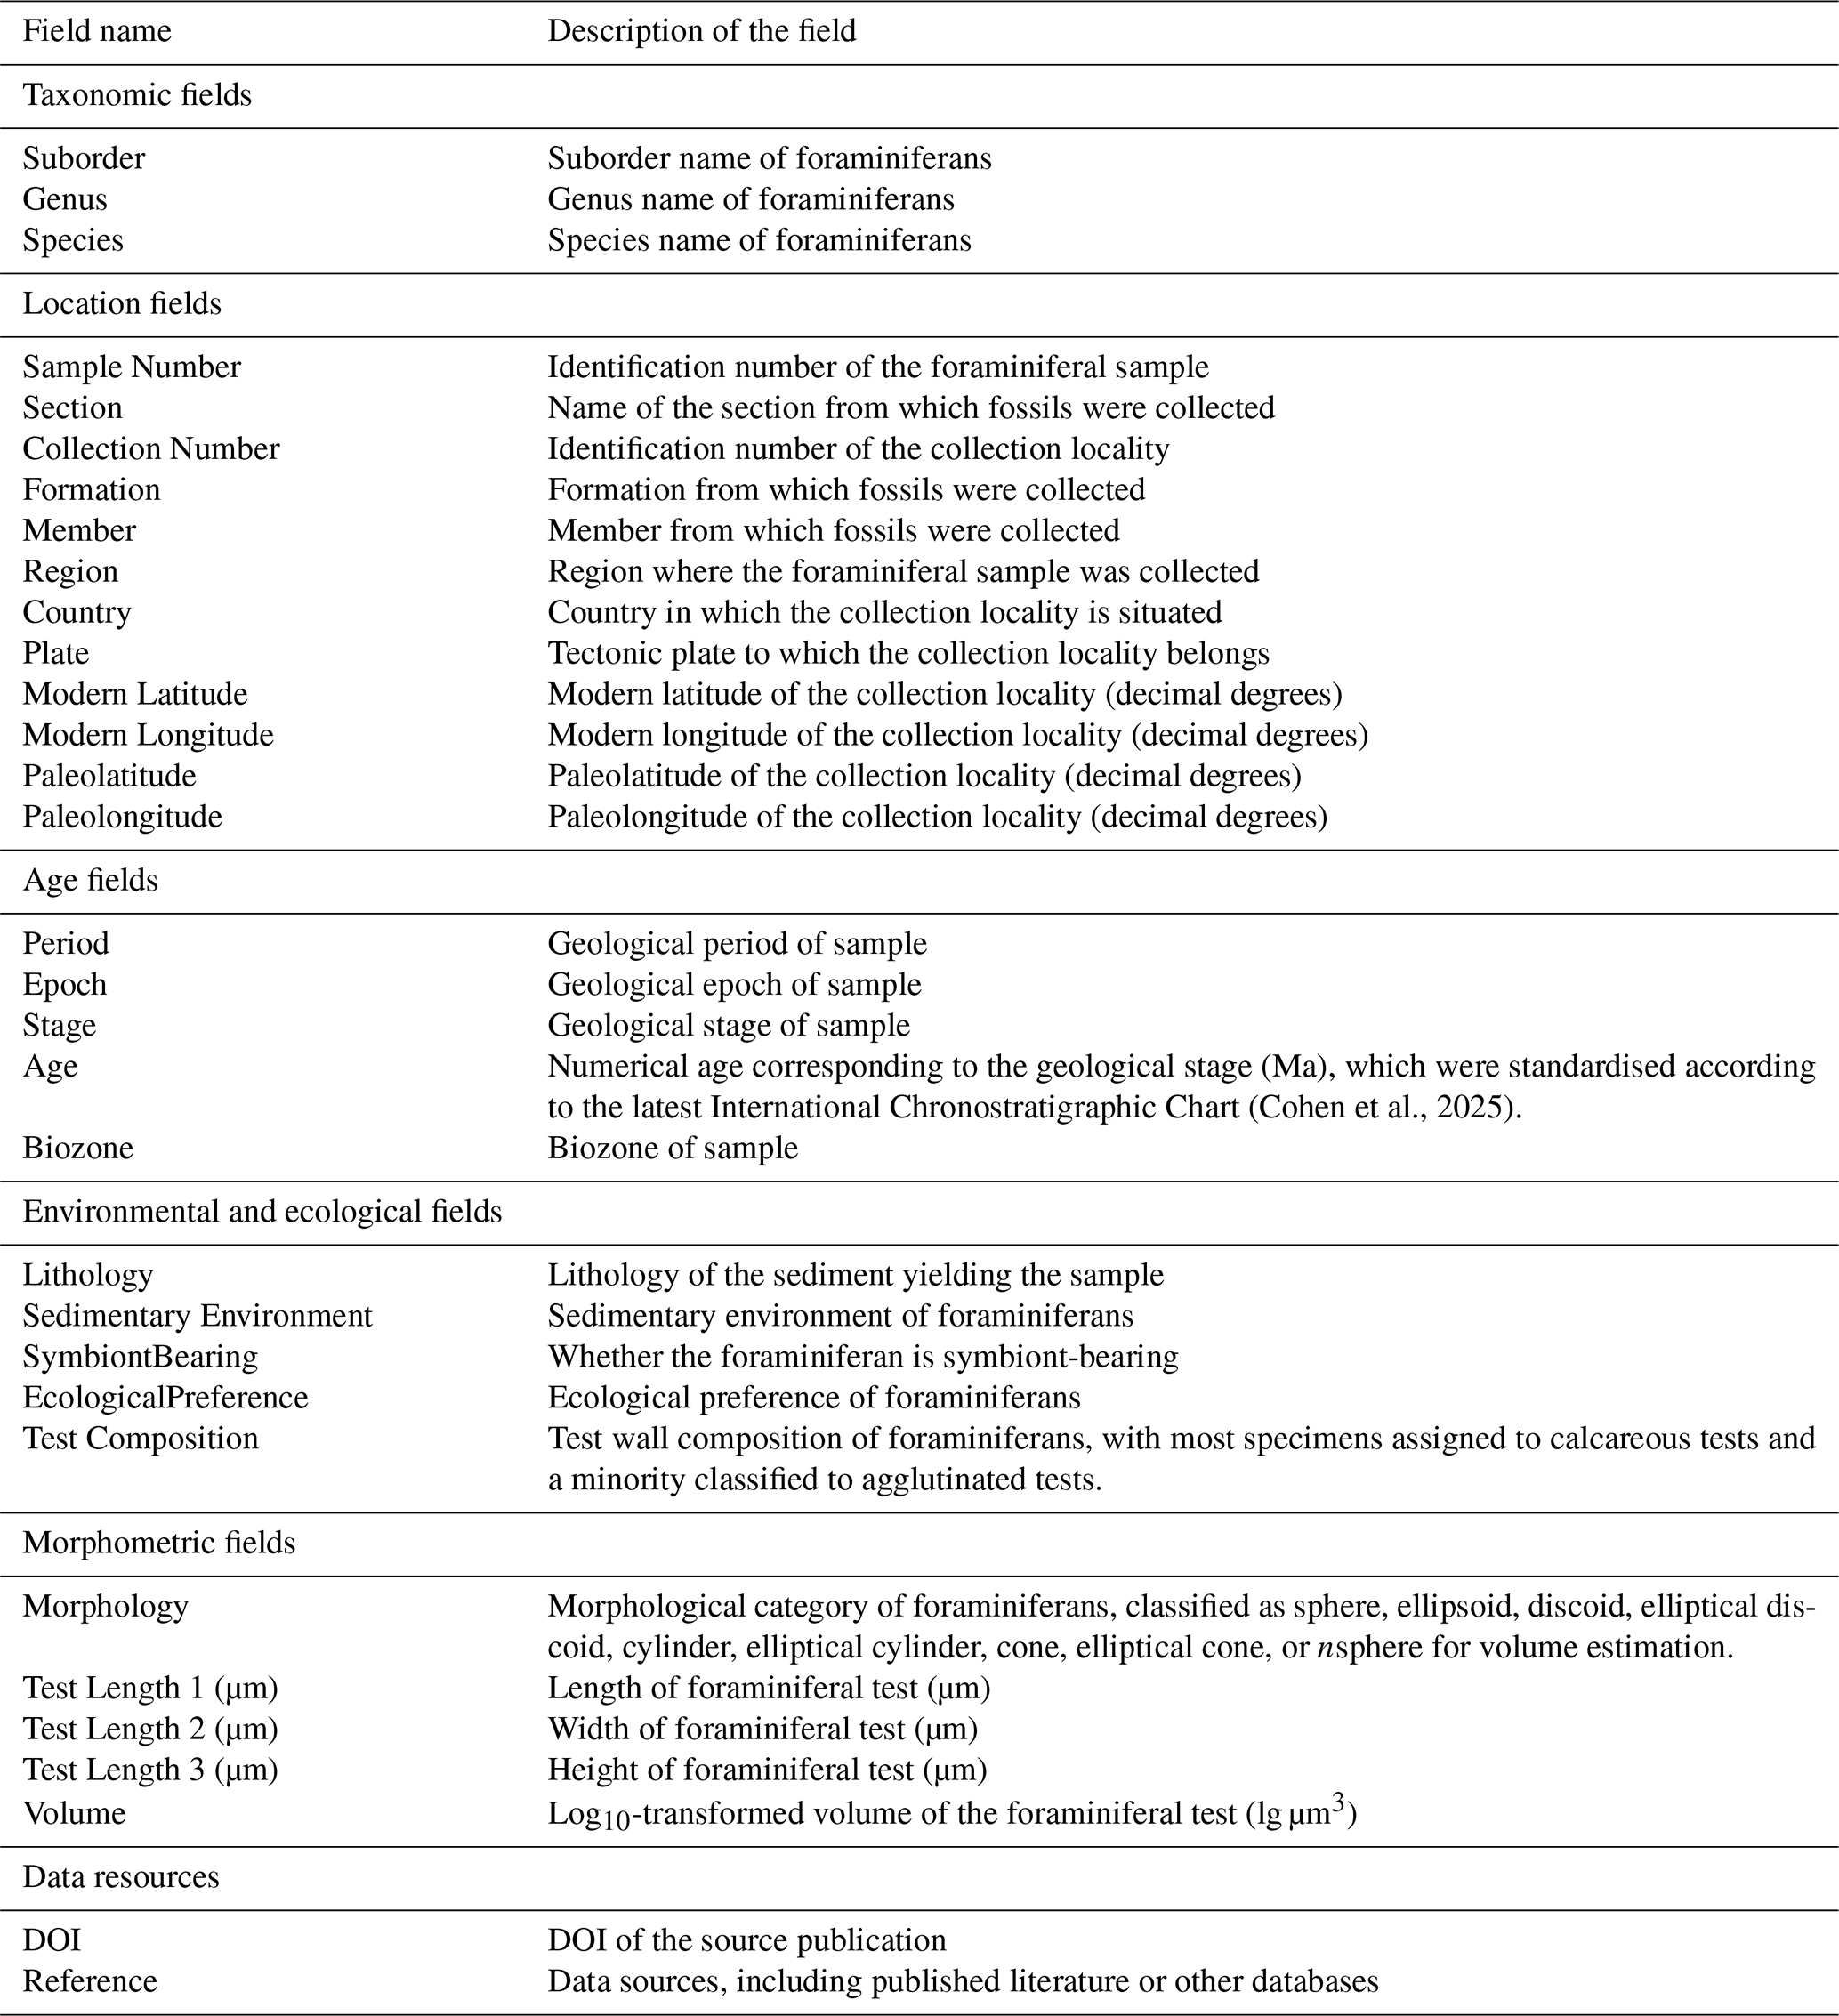
The PhaFoS database comprises 118 885 records of foraminiferal body size. Of these records, 87 953 (74 %) include latitude and longitude information, whereas 30 932 (26 %) do not contain geographic coordinates. In terms of temporal resolution, 108 433 records (91 %) are resolved to the stage level, whereas 10 452 records (9 %) are not assigned to a specific stage (Table 2). Each record includes taxonomic information (Suborder, Family, Genus, Species), sample and locality information (Sample Number, Section, Collection Number, Formation, Member, Region, Country, Plate), geographic information (Modern Latitude, Modern Longitude, Paleolatitude, Paleolongitude), age information (Period, Epoch, First Age, Last Age, Stage, Age, Biozone), environmental information (Lithology, Sedimentary Environment), ecological and morphological attributes (SymbiontBearing, EcologicalPreference, Test Composition, Morphology), body-size measurements, including up to three test dimensions for each specimen where applicable, corresponding to length, width and height (Test Length 1, Test Length 2, Test Length 3), estimated test volume (Volume), and source information (DOI, Reference) (Table 3).
Table 3Field name and descriptions in the PhaFoS database. Please see the text for more details.
This section describes the screening and processing criteria applied during data entry, validation, and standardisation of the PhaFoS database. The overall workflow was organized around six components: taxonomy and identifiers, age, locality and geography, stratigraphy and environment, functional traits, and size and data sources (Fig. 2).
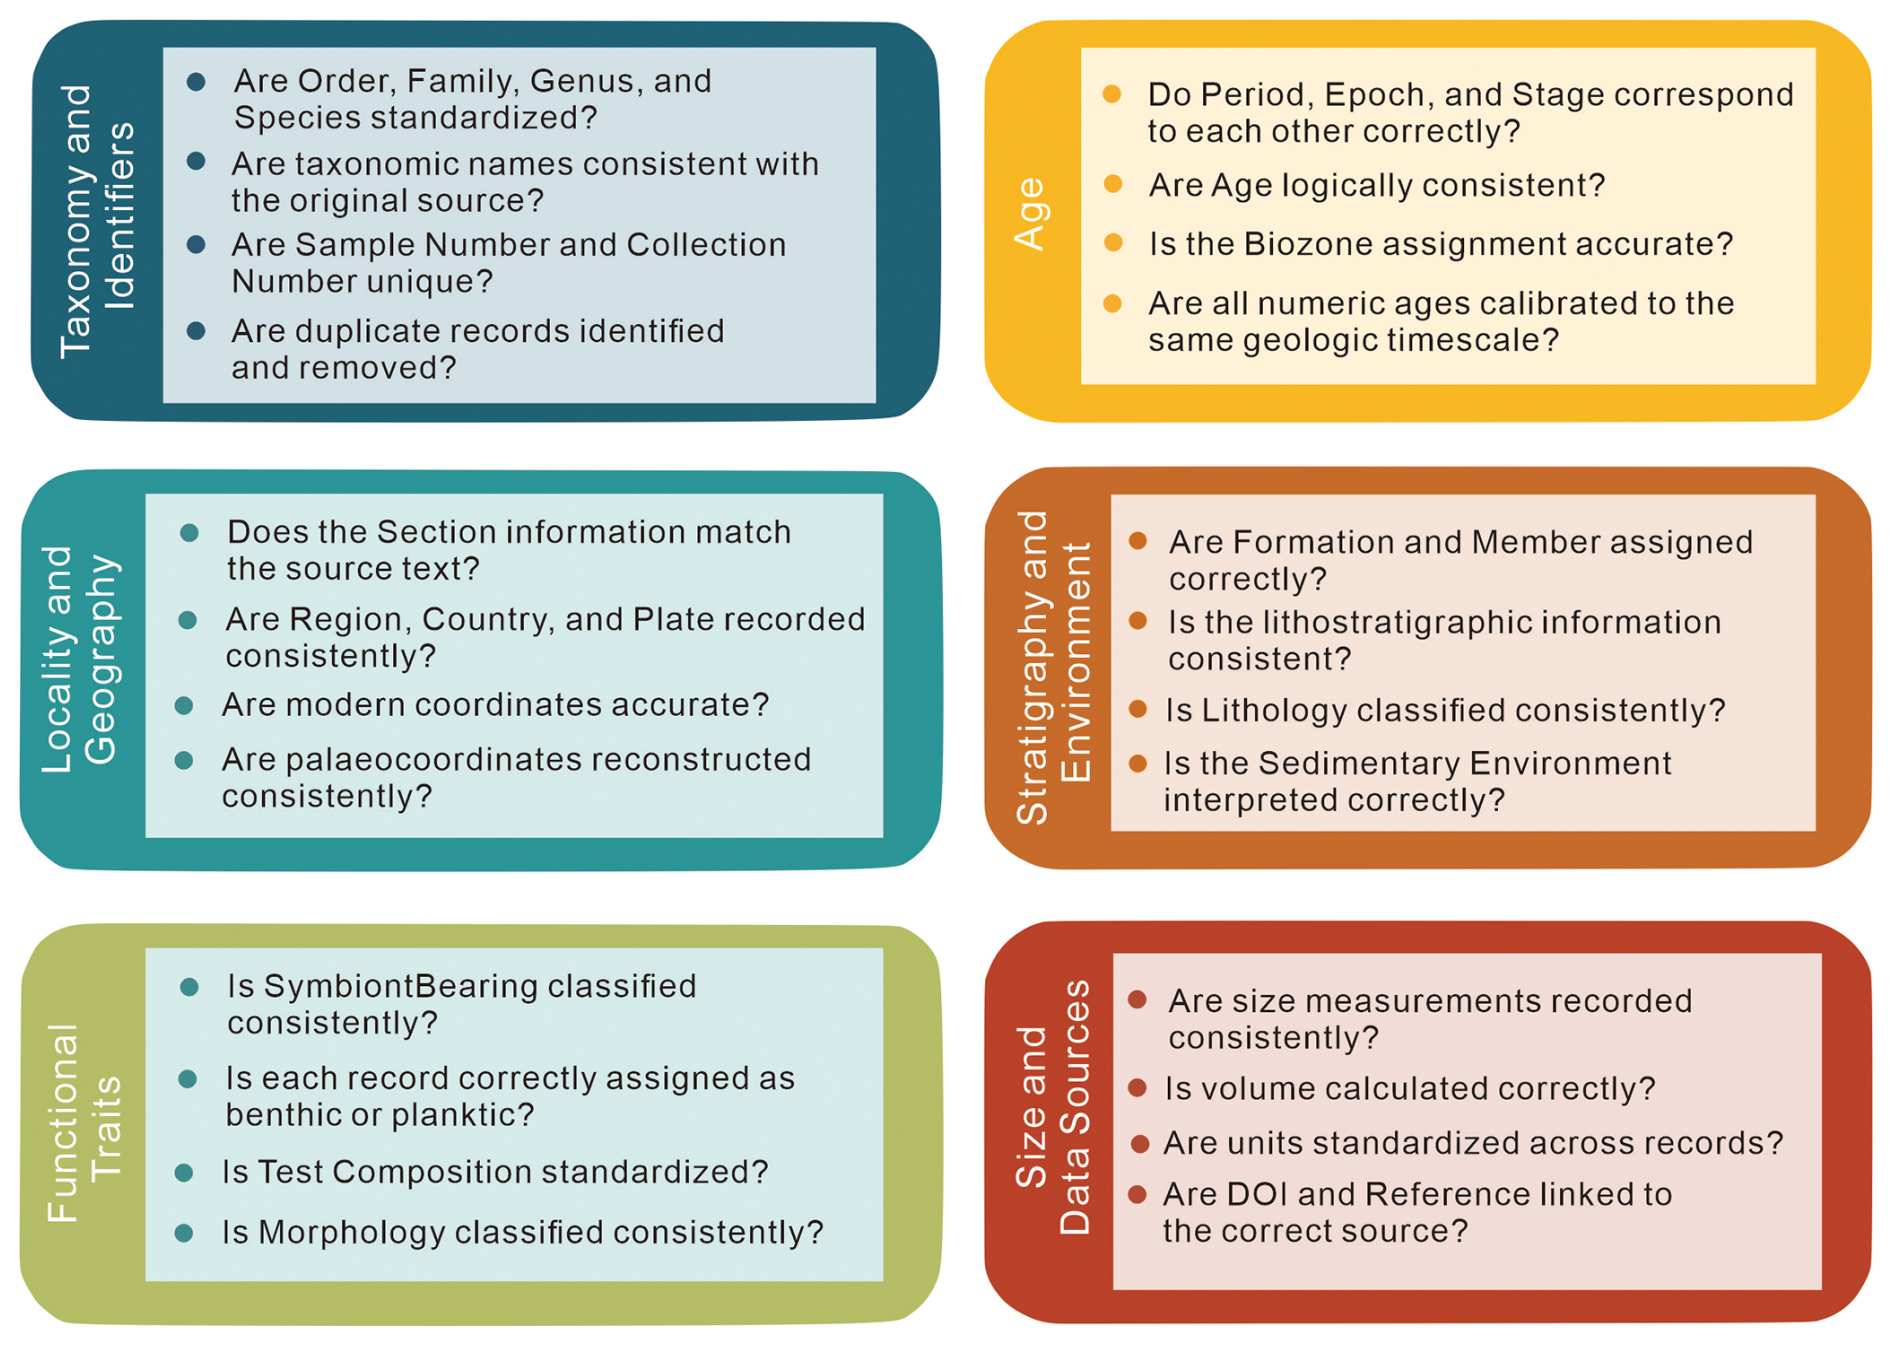
For taxonomic information, the database records Order, Family, Genus, and Species. Because the systematic classification of Foraminifera remains partly controversial, taxonomic assignments were standardised with reference to several currently widely-used classification schemes, including Loeblich and Tappan (1988), Mikhalevich (2000), Armstrong and Brasier (2004), and Groves et al. (2005). Species names were standardised according to Linnaean binomial nomenclature. References and DOIs were also retained, allowing records to be traced back to their original sources. Records marked as “sp.” were retained to preserve genus-level information where species-level identification was unavailable but generic assignment was clear, whereas records containing “?”, which usually indicates uncertain taxonomic placement, were excluded during data cleaning. Species names were further checked for potential spelling errors, synonyms, and obsolete nomenclature. Missing higher-level taxonomic fields, including Genus, Family, and Suborder, were supplemented where possible.
To assign numerical ages to records of specimens in the database, we first compiled the stratigraphic information reported in the original sources and checked whether Period, Epoch, and Stage corresponded correctly to one another, and whether Biozone assignments were consistent with the stratigraphic information provided in the literature. For records assigned to a standard geological stage, numerical ages were taken as the midpoint between the start and end ages of that stage, based on the age boundaries provide in the latest International Chronostratigraphic Chart (Cohen et al., 2025). In this way, stage-level information was converted into a numerical age framework suitable for quantitative analyses. When only broader stratigraphic assignments such as Period or Epoch were available, the corresponding information was retained, but stage-level ages were assigned only where sufficient evidence was available.
For locality and geography, the database includes Sample Number, Section, Collection Number, Region, Country, Modern Latitude, Modern Longitude, Paleolatitude, and Paleolongitude. Sample Number refers to the identification number assigned to each foraminiferal specimen, whereas Collection Number denotes the identifier of the collection locality. One collection locality may correspond to multiple specimens. Section records the name of the section from which the fossil material was collected, while Formation and Member provide the associated lithostratigraphic context where available. Region and Country indicate the geographic area of the collection site.
To ensure that the dataset is suitable for quantitative analyses, we georeferenced the localities of specimens by assigning latitude and longitude wherever possible. Modern geographic coordinates (Modern Latitude and Modern Longitude) were obtained in three main ways. First, some studies directly reported coordinates in the text, and these were recorded after conversion into a standardized decimal-degree format. Second, many studies marked fossil collection sites on maps or figures together with latitude and longitude information, from which coordinates could be extracted. Third, when no explicit coordinates were provided, approximate coordinates were assigned by locating the central point of the named collection locality using map tools (https://www.gps-coordinates.net/, last access: 1 June 2026). Through these procedures, modern latitude and longitude were compiled as consistently as possible across the dataset. Palaeogeographic coordinates (Paleolatitude and Paleolongitude) were reconstructed using the PALEOMAP plate reconstruction model in Time Machine (https://docs.deeptime.world/, last access: 1 June 2026), an integrated platform for plate-tectonic and paleogeographic reconstructions. Records containing modern latitude and longitude and corresponding start and end ages were uploaded to the platform, with these columns assigned to the appropriate coordinate and age fields. The resulting palaeogeographic coordinates were incorporated into the database.
For stratigraphic and environmental information, the database records Formation, Member, Lithology, and Sedimentary Environment. We first checked whether Formation and Member were correctly assigned and whether the lithostratigraphic information reported in the sources was internally consistent. Lithology descriptions include a wide range of sediment types, such as carbonate, mudstone, clay, and sandstone. The depositional environment terms reported in the literature are highly heterogeneous, including shallow water, semi-deep water, deep water, abyssal, bathyal, near-shore shelf, inshore basin, delta margin, proximal inner-fjord, deep-water fjord, brackish water, and ice shelf settings. To improve comparability across records, these depositional environments were standardised and ultimately grouped into two broad categories: deep water and shallow water. Shallow water environments are defined as marginal-marine and shelf settings, including shorelines, coastal lagoons, tidal flats, carbonate platforms and reefs. Deep water environments are defined as settings at or beyond the shelf margin, including slope, base-of-slope, basin and ridge settings (Flügel, 2004). Where the Sedimentary Environment was not explicitly reported in the source, it was inferred from lithology, together with occurrence and ecological information. More detailed depositional environment descriptions, where available, can be consulted in the original sources through the reference links provided in the database.
For functional traits, the database records Symbiont Bearing, Ecological Preference, and Test Composition. We first checked whether these fields were assigned consistently across records and whether their interpretations were compatible with the original descriptions in the literature. Symbiont Bearing was coded as YES or NO where sufficient information was available, indicating whether a taxon is known to host algal endosymbionts. NO was assigned only where published information supported the absence of algal endosymbionts. These assignments were based on published taxonomic and ecological information regarding algal endosymbiosis within specific foraminiferal species (Hallock, 1999; Lee, 2006). Ecological Preference was classified into two broad ecological categories (benthic and planktonic). Test Composition records the wall composition of the foraminiferal test. Most records were assigned to calcareous tests, while a smaller number were assigned to agglutinated tests. Where trait informations were not explicitly reported in the original source, assignments were made carefully based on the recorded species names and standard published works on foraminiferal taxonomy and ecology. For these fields, where neither the original source nor the references consulted provide sufficient information to allow for reliable classification, the relevant entries are left blank. Consequently, a blank entry indicates that the trait is unknown or insufficiently documented, rather than that the trait does not exist.
For body size, the database records morphology, test dimensions, and volume. Morphology was classified into predefined geometric categories, including sphere, ellipsoid, discoid, elliptical discoid, cylinder, elliptical cylinder, conical, elliptical cone, and n-sphere (Fig. 3). Because foraminiferal tests exhibit substantial morphological diversity, test volume was estimated from measured dimensions based on test morphology (Feng et al., 2020, 2024). Size data were compiled from two main source formats, namely tabulated measurements and illustrated plates. Tabulated values were directly incorporated after conversion to a common unit of micrometres (µm), whereas illustrated data were measured from figures after scale calibration with either numerical or line scales, using ImageJ (Abràmoff et al., 2004). Where one or more axes could not be directly measured, missing dimensions were inferred from the length-to-width ratio of the type species. All estimated test volumes were log-transformed before analysis to improve comparability across strongly right-skewed size distributions (Gingerich, 1983; Payne, 2005).
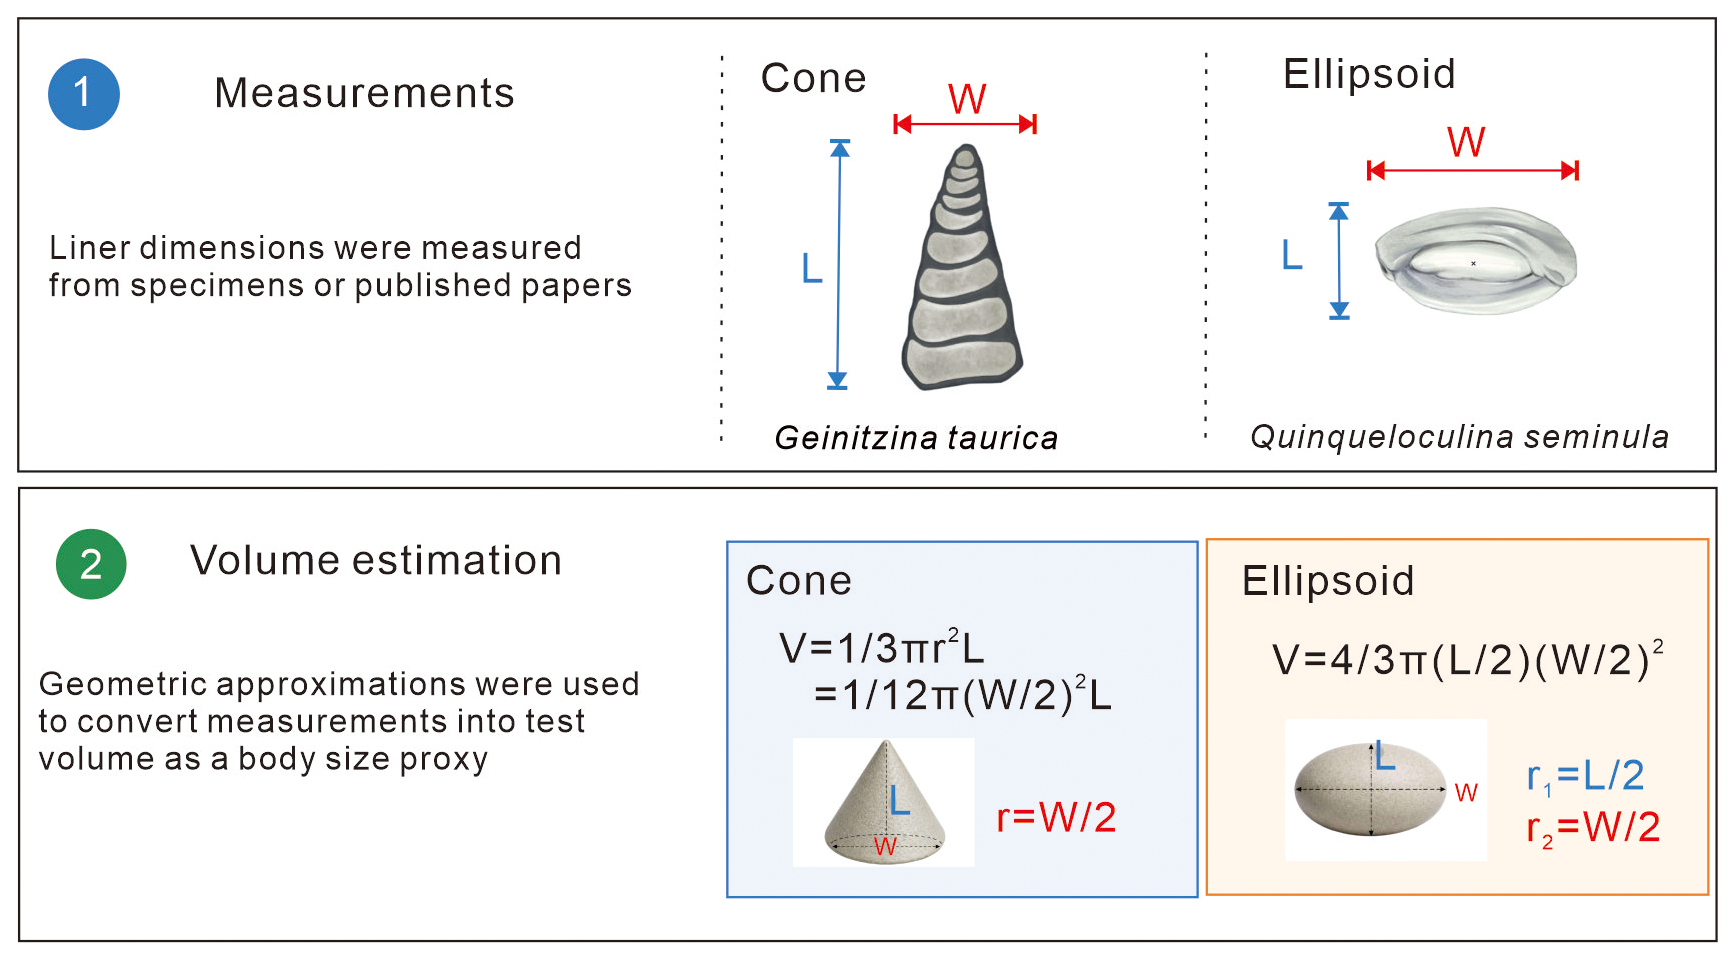
Figure 3Workflow for estimating foraminiferal test volume as a proxy for body size, illustrated with cone-shaped and ellipsoidal foraminiferans. The image of Geinitzina taurica is from Yang et al. (2024), whereas the image of Quinqueloculina seminula is from Dong et al. (2020).
For data sources, the database records both Reference and DOI to ensure that each entry can be traced back to its original publication or database source. Bibliographic information was compiled in a standardized citation format, including author name(s), title, journal, publication year, page numbers, and DOI where available. For records derived from existing databases rather than directly from published articles, the corresponding database source was explicitly indicated. Through this procedure, all entries were linked to identifiable and verifiable sources, thereby improving the transparency and traceability of the dataset.
The taxonomic distribution of the database is shown in Fig. 4. The number of records is unevenly distributed among orders. Fusulinida has the largest number of records, with 31 278 entries, followed by Textulariida (21 382 entries) and Rotaliida (19 788 entries). Lagenida also contributes a substantial proportion of the dataset, with 15 475 records. Globigerinida and Miliolida show intermediate abundances, with 9096 and 8914 records, respectively. In contrast, Involutinida (2252 records) and Robertinida (1477 records) are less well represented, whereas Spirillinida (292 records), Allogromiida (73 records), and Carterinida (21 records) have the fewest entries.
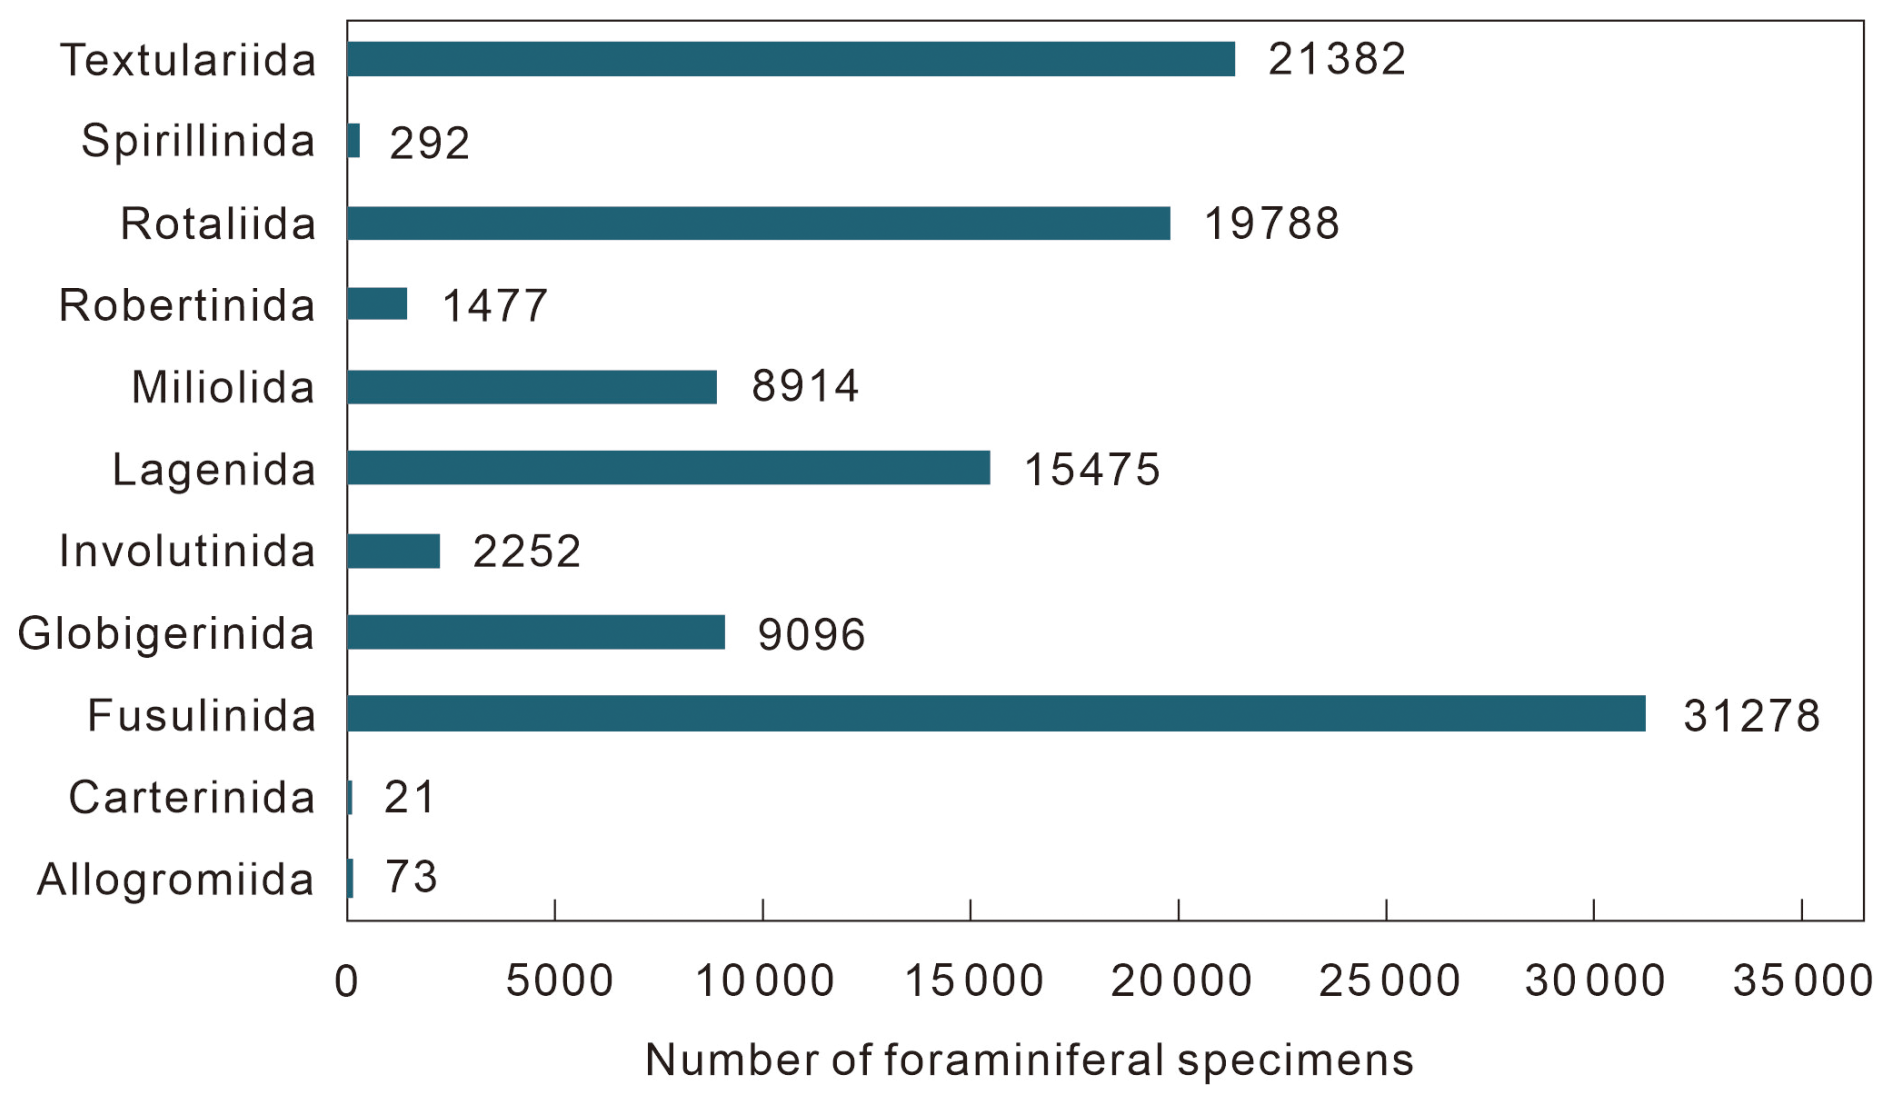
Figure 4Histogram distribution of different orders, arranged according to the chronological order of their first appearance.
To examine the distribution of specimen ages within the Phanerozoic, we divided the records by stage, as shown in Fig. 5. For the Quaternary, however, because of its short duration, records were not further subdivided by stage, but were grouped only into the Pleistocene and Holocene. The distribution is not uniform through time. During the Cambrian and Ordovician, specimen availability is extremely low, with fewer than 100 records in each period. Furthermore, as these records lack stage-level age assignments, they are excluded from subsequent stage-level diversity charts. Among the earliest known foraminiferan is the agglutinated genus Platysolenites, which first appeared in the Furongian of the Cambrian (McIlroy et al., 2001). Specimen availability begins to increase from the Silurian onward and rises markedly through the Carboniferous, reaching a first major concentration in the Carboniferous-Permian interval, coinciding with the diversification and ecological expansion of fusuline foraminiferans (Ueno, 2022). Within the Carboniferous, the Visean represents a local peak (2792 records), whereas the Permian as a whole contains the largest number of specimens in the database (24 652 records). Specimen abundance remains high through much of the Permian but declines sharply at the end-Permian, consistent with the end-Permian mass extinction, during which 91 % of calcareous foraminiferal genera likely became extinct (Groves and Altiner, 2005).
A second major concentration of records occurs from the Jurassic to the Early Cretaceous, with the Toarcian representing a notable peak (6827 records). This pattern likely reflects both intensive research on the early Toarcian, an interval associated with major environmental perturbations, including the Toarcian Oceanic Anoxic Event (Jiang et al., 2020; Reolid et al., 2020; Wang et al., 2025). The middle Paleogene Lutetian (5250 records) shows a pronounced peak, followed by a rapid decline in the subsequent stages. This decline may be partly due to environmental disturbances during this period, such as the Late Lutetian Thermal Maximum (LLTM) (Rivero-Cuesta et al., 2020). Additional peaks are observed in the middle Eocene Lutetian (5250 records), middle Miocene Langhian (3604 records), and Holocene (,386 records). This may be because near-modern samples are abundant, easily accessible, and commonly used in ecological and palaeoenvironmental studies.
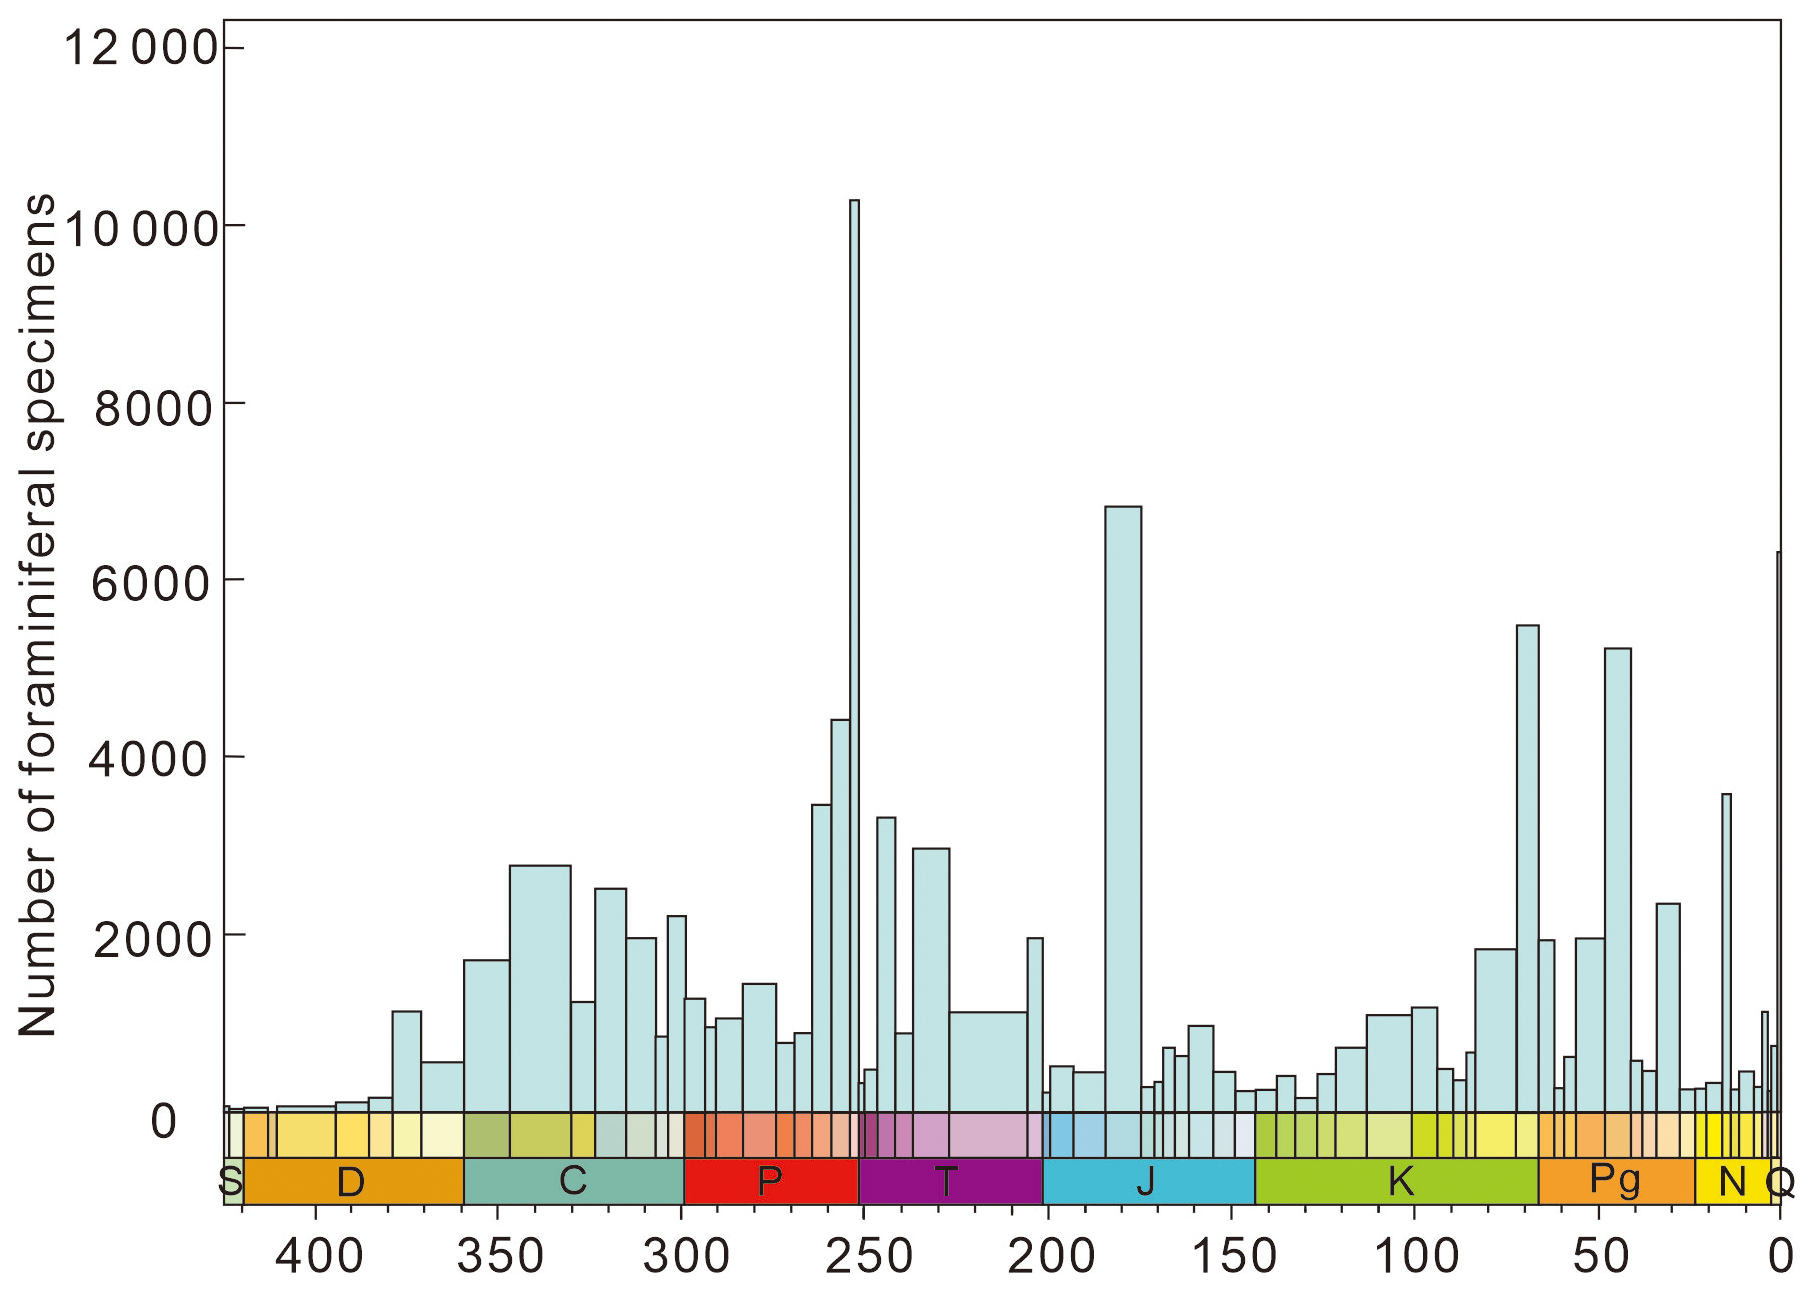
Figure 5Age distribution of Phanerozoic specimens at the stage level. The figure does not show data for Foraminifera before the Late Silurian, because this data is not precise to the stage.
A key feature of this dataset, compared with others, is that it includes quantitative body size data. Therefore, we further visualised the size distributions of different foraminiferal orders within each period (Fig. 6). Early Palaeozoic body size data are sparse, with only one order represented in the Cambrian (Fusulinida) and two orders in the Ordovician (Allogromiida and Textulariida). In the Devonian, body size data become more abundant, covering five foraminiferal orders, with test volumes mainly concentrated between 6.5 and 7.1 log µm3. Fusulinida shows the highest median value (7.11 log µm3), followed by Textulariida (6.73 log µm3). Lagenida, Miliolida, and Rotaliida show broadly comparable median values, mostly between 6.52 and 6.63 log µm3. Body size are generally higher in the Carboniferous. Fusulinida and Rotaliida show the highest median values (7.95 and 7.96 log µm3, respectively. Involutinida, Spirillinida, and Miliolida occupy intermediate size values, with median values around 7.27–7.47 log µm3, whereas Textulariida and Lagenida show relatively lower median values of 6.99 and 6.67 log µm3, respectively. In the Permian, foraminiferal test sizes reach their largest values. Fusulinida is mainly concentrated between 6.86 and 9.58 log µm3, while Miliolida and Rotaliida are mainly concentrated between 7.03–8.34 and 7.57–8.04 log µm3, respectively. Textulariida, Lagenida, and Involutinida are concentrated at relatively smaller ranges of 6.72–7.75, 6.44–7.29, and 6.23–6.99 log µm3, respectively. Spirillinida is also concentrated at larger values, between 9.05 and 9.49 log µm3, although this range is based on only four measurements.
The number of foraminiferal orders increases in the Mesozoic. Nine orders are recorded in the Triassic (Fig. 6). Several orders show a size reduction across Permian-Triassic transition. Fusulinida decrease from 6.86–9.58 log µm3 in the Permian to 6.62–7.62 log µm3 in the Triassic, while Miliolida shift from 7.03–8.34 to 6.00–7.08 log µm3. Rotaliida and Textulariida also show lower size ranges in the Triassic, decreasing from 7.57–8.04 to 6.86–7.66 log µm3, and from 6.72–7.75 to 6.60–7.44 log µm3, respectively. Lagenida remains broadly similar body size (6.18–7.26 log µm3 in the Triassic). In contrast, Involutinida increase from 6.23–6.99 log µm3 in the Permian to 7.00–8.22 log µm3 in the Triassic. It also includes some new orders in the Triassic, such as Globigerinida and Robertinida, which are mainly concentrated within 6.99–7.38 and 6.57–7.19 log µm3, respectively. During the Jurassic, Lagenida, Involutinida, Robertinida, and Rotaliida are mainly found within similar size ranges, with test volumes of 6.80–7.61, 6.45–7.76, 6.59–7.53, and 6.81–7.42 log µm3, respectively. Globigerinida is mainly concentrated between 6.25 and 7.23 log µm3, while Spirillinida is distributed between 5.83 and 7.07 log µm3. Miliolida and Fusulinida are concentrated at smaller size, mainly within 4.83–6.82 and 4.70–5.96 log µm3, respectively, whereas Textulariida shows a broader distribution, mainly within 5.29–7.25 log µm3. In the Cretaceous, Textulariida, Miliolida, Robertinida, and Lagenida all occupy relatively higher size ranges, mainly between 6.83 and 8.75 log µm3. The remaining orders show lower median values: Rotaliida, Fusulinida, Globigerinida, and Involutinida have median test volumes of 7.24, 7.18, 7.17, and 7.02 log µm3, respectively, whereas Spirillinida and Carterinida have lower medians of 6.84 and 5.56 log µm3. In the Paleogene, Miliolida, Textulariida, Rotaliida, and Lagenida occupy larger size ranges, mainly concentrated within 7.27–8.91, 7.13–8.26, 6.72–8.51, and 7.02–8.23 log µm3, respectively. Robertinida and Spirillinida are concentrated within intermediate ranges of 7.02–7.78 and 6.54–8.05 log µm3, whereas Globigerinida is mainly concentrated at 6.62–7.51 log µm3. In the Neogene, Miliolida and Textulariida remain concentrated at higher values, mainly within 7.49–8.64 and 7.50–8.48 log µm3, respectively. Lagenida and Rotaliida are mainly concentrated within 7.00–8.22 and 6.86–7.86 log µm3, while Globigerinida and Robertinida occupy slightly smaller size ranges of 6.63–7.57 and 7.13–7.51 log µm3, respectively. In the Quaternary, Textulariida and Miliolida are mainly concentrated within 6.95–8.59 and 7.06–8.36 log µm3, respectively. Robertinida and Globigerinida are concentrated within 6.85–8.13 and 6.97–7.92 log µm3, whereas Rotaliida, Lagenida, and Spirillinida occupy smaller ranges of 6.62–7.71, 6.23–7.45, and 5.98–7.02 log µm3, respectively.
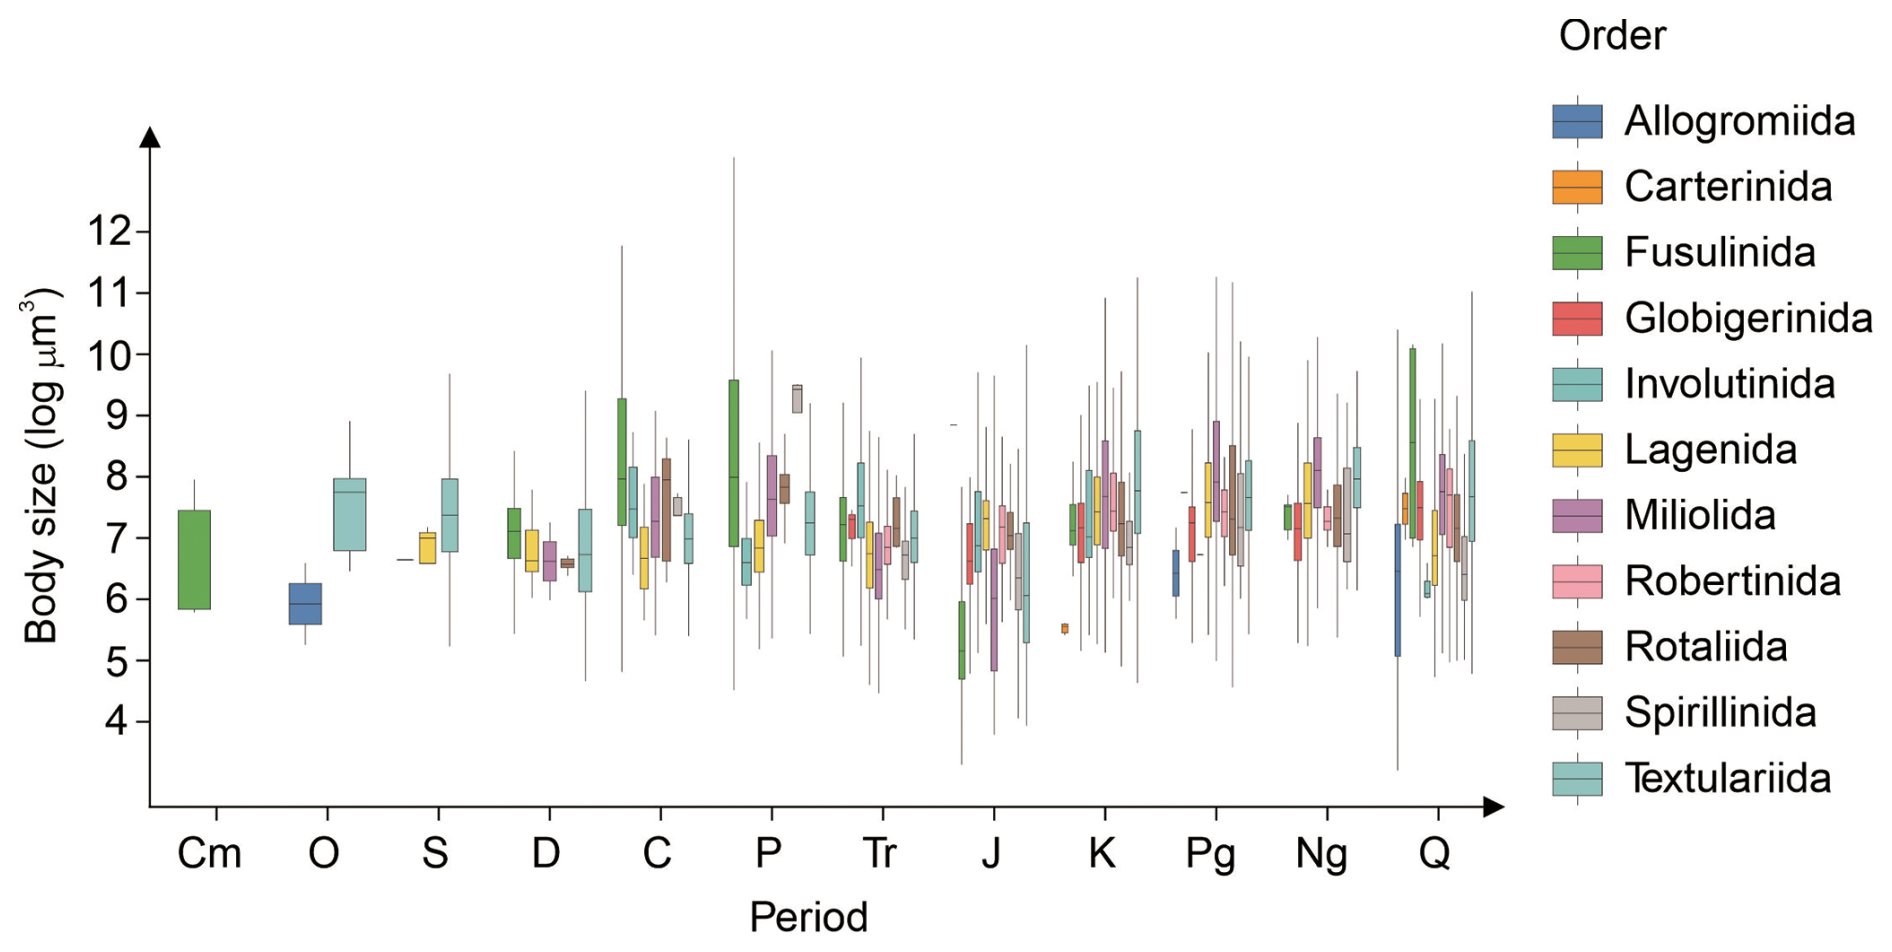
Figure 6Size distributions of foraminiferal orders across periods. Boxplots show test volume for each foraminiferal order in each period. Colors denote different orders. The central line represents the median, and the lower and upper edges of the box represent the first and third quartiles, respectively. Thus, the box indicates the main concentration range of the middle fifty percent of the data. Whiskers extend to the most extreme non-outlier values within one point five times the interquartile range, and points beyond the whiskers are shown as outliers. Period abbreviations are as follows: Cm, Cambrian; O, Ordovician; S, Silurian; D, Devonian; C, Carboniferous; P, Permian; Tr, Triassic; J, Jurassic; K, Cretaceous; Pg, Paleogene; Ng, Neogene; Q, Quaternary.
The global distribution of the database exhibits a pronounced geographic clustering pattern, particularly across the mid-latitudes of the Northern Hemisphere, including North America, East Asia, especially across eastern and southern China, the northern South China Sea, the Japanese archipelago, and the Korean Peninsula (Fig. 7). These latter regions include extensive continental shelves and marginal seas and has long been a major focus of micropalaeontological sampling and research, making it a core area of the database. Several sampling points in this region contain more than 1000 records. Western and central Europe represent another major cluster, particularly around the Mediterranean, North Sea, and Baltic regions, reflecting the long history of palaeontological research and intensive sampling in Europe. In contrast, records are much sparser across most of South America, inland Africa, the Indian Ocean, and large parts of the South Pacific. Polar regions, particularly the Arctic and the area surrounding Antarctica, are almost devoid of records (Fig. 7). Although the database provides broad global coverage across major marine sedimentary regions, record density is spatial heterogeneous, likely reflecting differences in exposure of marine strata, preservation potential, regional research intensity, and sample availability. Similar spatial unevenness has also been documented in other large global compilations, including the DM-SED, GAD, DSMS-NI, BioDeepTime, and BioTIME databases (Dornelas et al., 2018; Smith et al., 2023; Lai et al., 2025; Shu et al., 2025; Du et al., 2026), suggesting that the strong concentration of records in East Asia, Europe, and North America is not unique to the present dataset. Rather, this shared pattern likely reflects common controls such as uneven geological exposure, preservation potential, research intensity, and sample availability (Kidwell and Flessa, 1996; Peters and Foote, 2002).
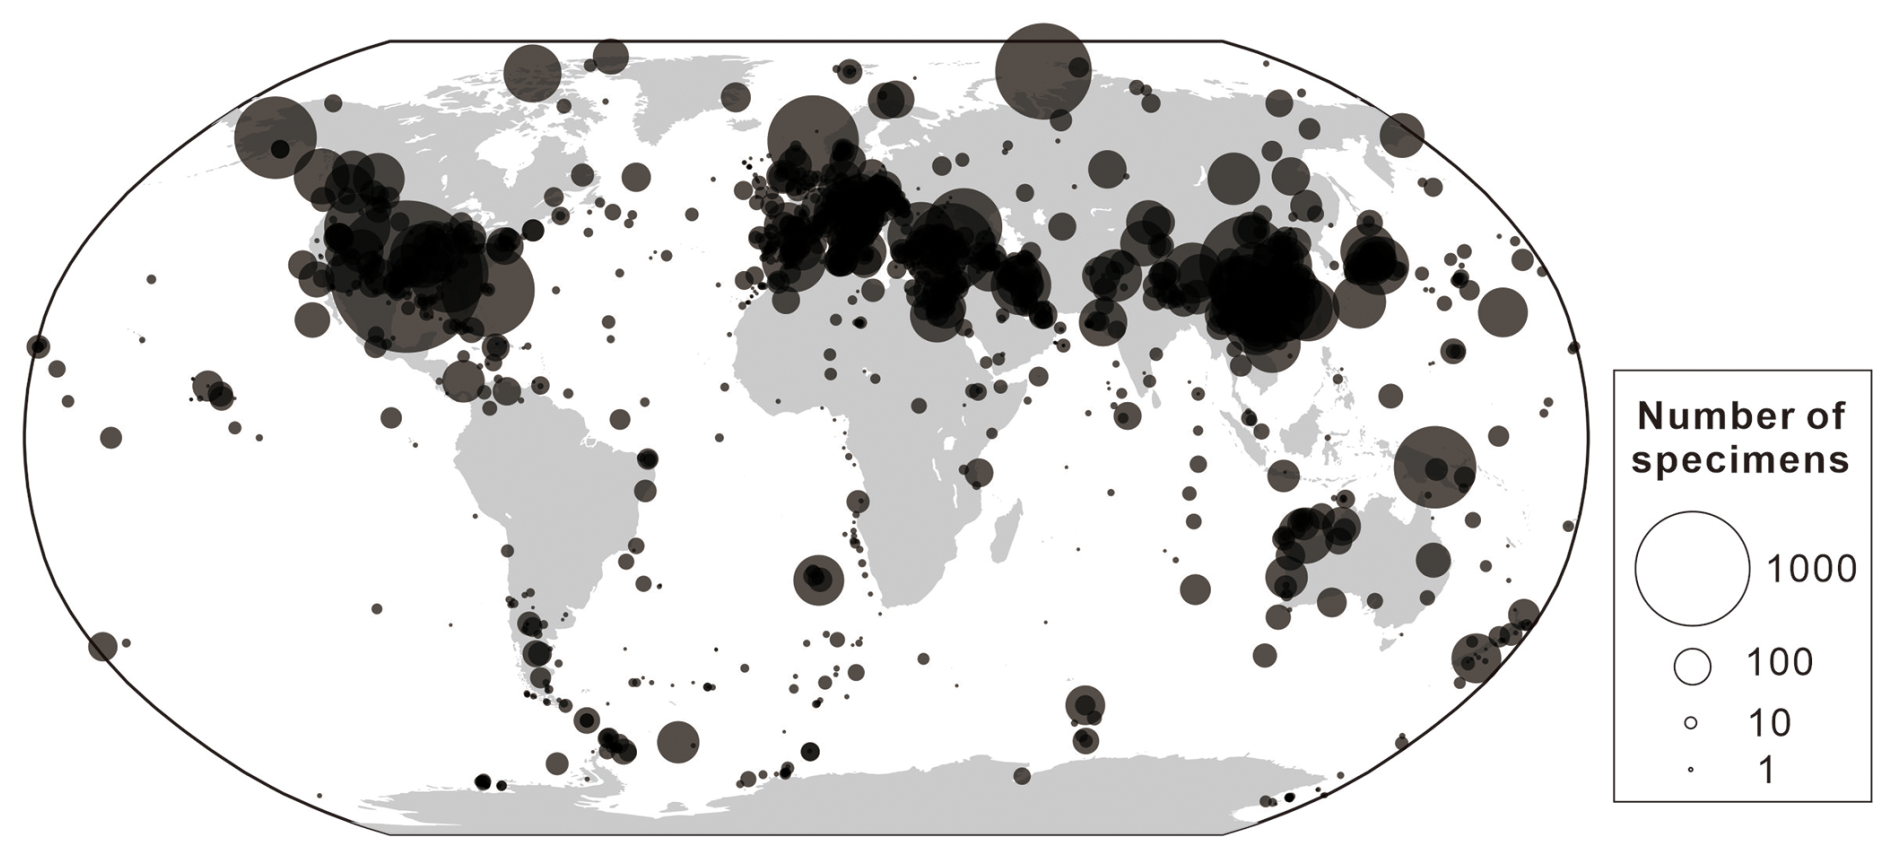
Figure 7Bubble chart of modern geographical distribution and specimen quantities in the database.
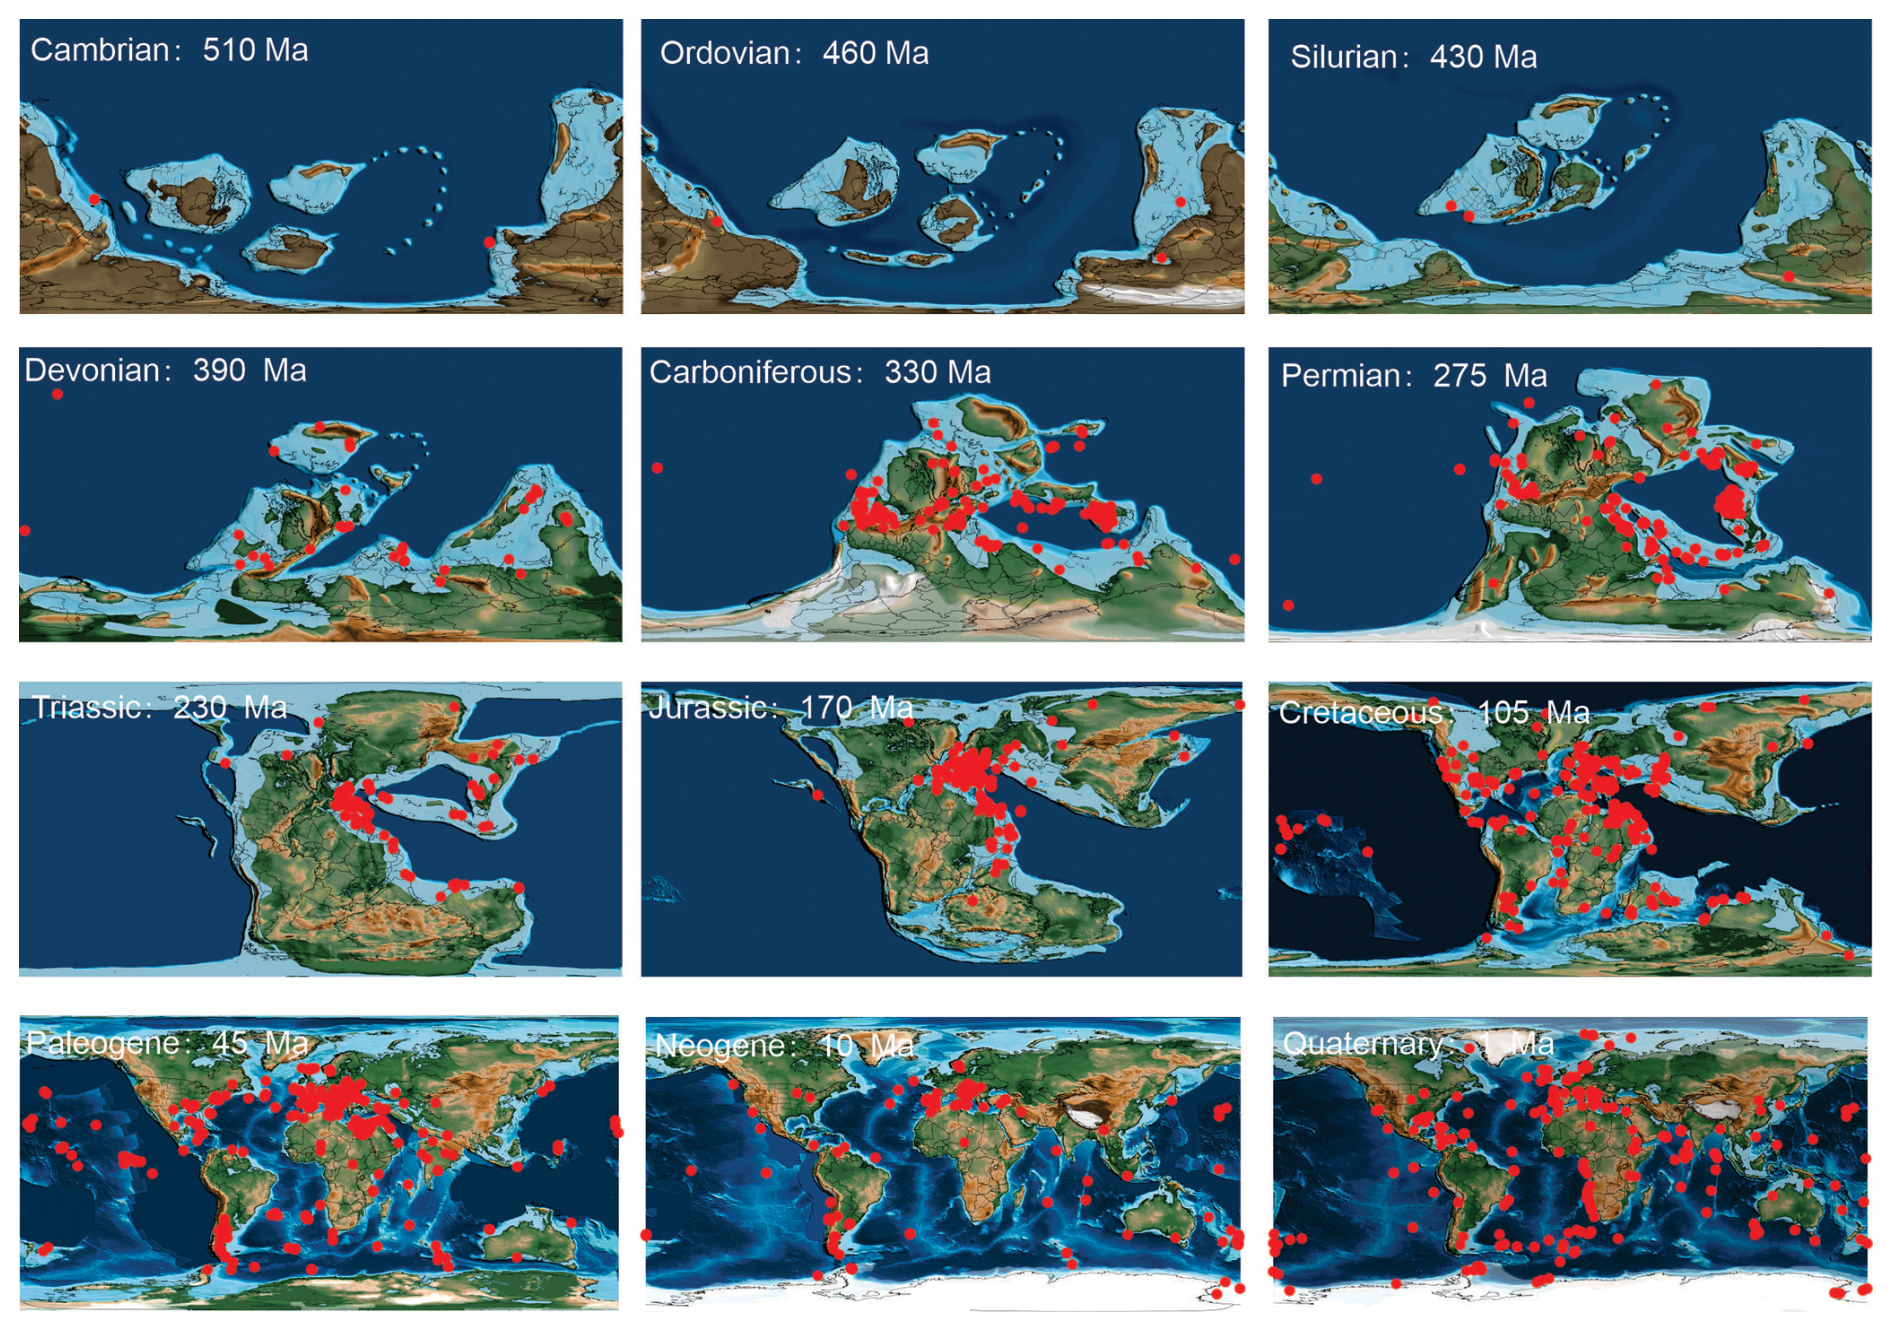
Figure 8The palaeogeographic distribution of specimens' sites in the PhaFos.
We further analysed the palaeogeographic distribution of foraminiferal records through time (Fig. 8). Overall, most records from the Cambrian to the Quaternary are derived from shallow-marine settings and show a clear preference for continental-margin environments. Records from Cambrian (510 Ma), Ordovician (460 Ma), and Silurian (430 Ma) are sparse, and the sampling points in these intervals are mainly distributed in shallow marine environments along the continental shelves of Laurentia and Gondwana in the Southern Hemisphere. Record density increases more substantially from the Devonian (390 Ma) onward. Devonian and Carboniferous (330 Ma) localities are concentrated mainly on Laurussia and the South China Block. By the Permian (275 Ma), the number of records rises sharply, with localities clustered around the Tethyan realm and adjacent low-latitude regions. Triassic (230 Ma) records remain at a moderate density and are still largely associated with shallow-marine along continental margins. Jurassic (170 Ma) and Cretaceous (105 Ma) records increase further and become concentrated mainly along the North America and Europe. From the Paleogene (45 Ma) onward, the palaeogeographic distribution becomes markedly broader. Paleogene, Neogene (10 Ma), and Quaternary records are widely distributed across multiple continental margins and oceanic regions in both hemispheres. Compared with earlier intervals, sampling localities are no longer mainly restricted to low-latitude shelf seas, but extend across a wider latitudinal range and include numerous deep-ocean settings. This broader distribution is particularly evident in the Neogene and Quaternary, and likely reflects the combined influence of large-scale drilling programs such as DSDP, ODP, and IODP, together with the increasing availability of modern and near-modern marine samples.
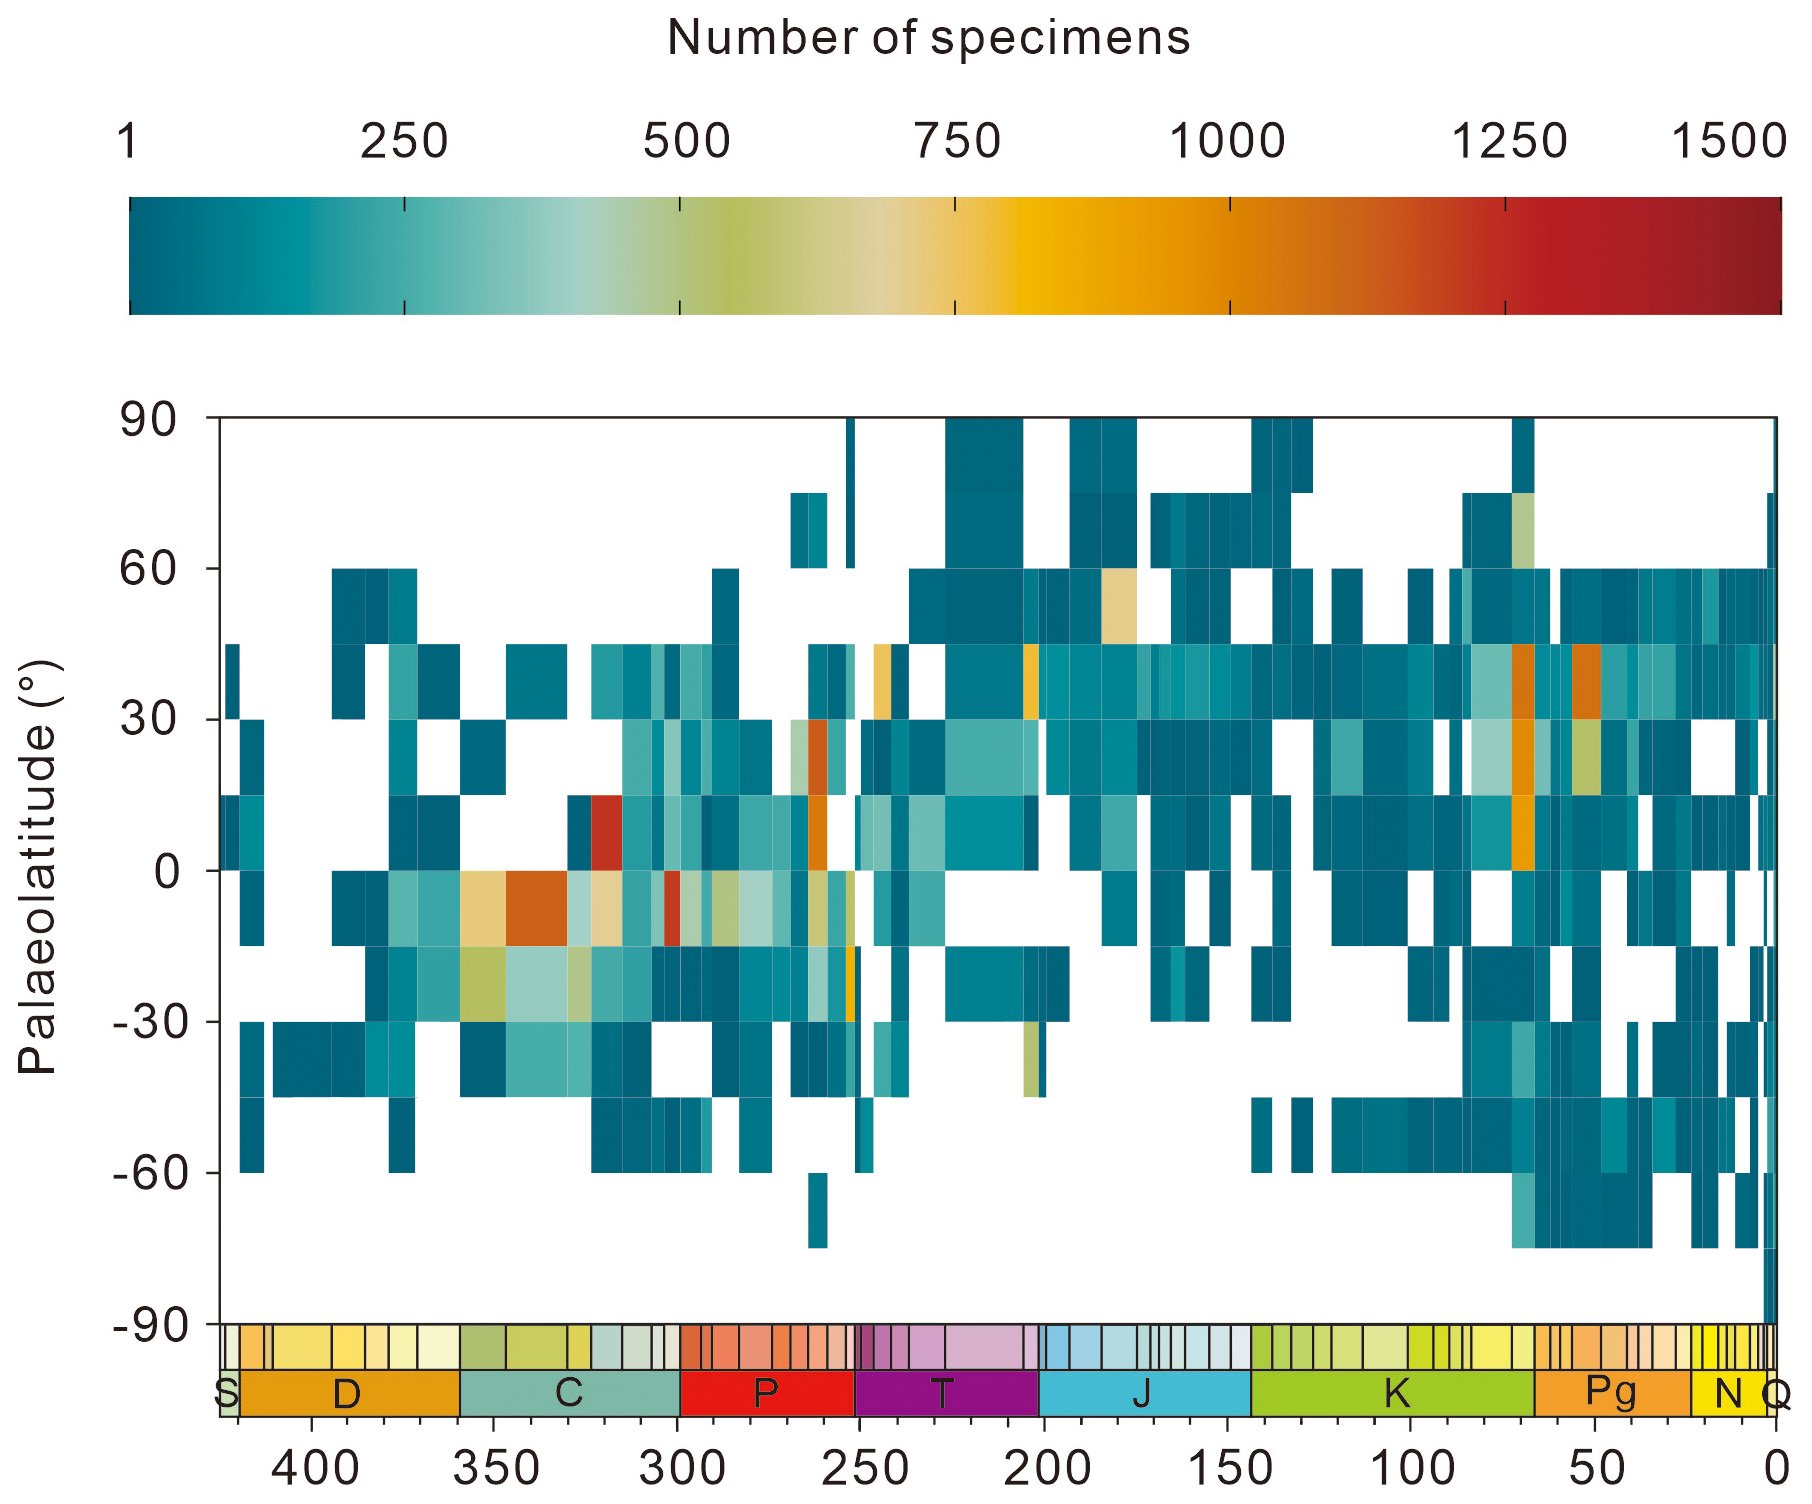
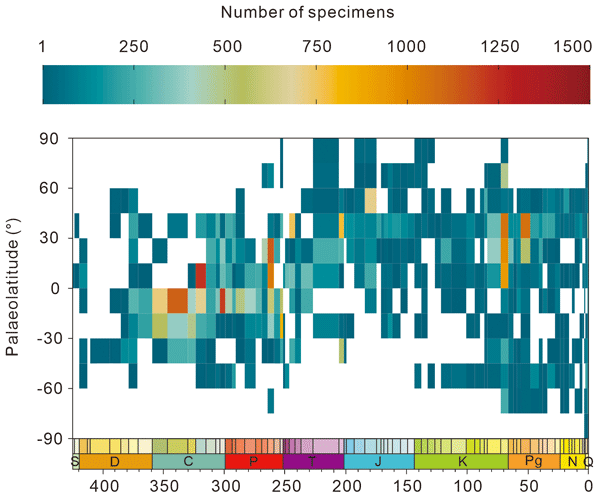
Figure 9The spatiotemporal distributions of sample quantities (categorized temporally by stage and spatially by palaeolatitude intervals of 15°).
When all Phanerozoic records are grouped by stage and grouped into 15° palaeolatitude bins (Fig. 9), the distribution of specimens shows a clear latitudinal bias through time. Paleozoic records are concentrated mainly in tropical to subtropical regions. Silurian records are sparse overall. Records remain limited in the early Devonian, but increase more noticeably from the middle to late Devonian, with the main concentration centred in equatorial to subtropical regions. Carboniferous records are concentrated mainly between 30° S and 15° N, with the highest densities centered in the tropical belt. Permian records remain largely concentrated in equatorial to subtropical regions, mostly between 15° S and 30° N. From the Triassic onward, the latitudinal distribution begins to shift northward. From the Triassic to the Cretaceous, data are mainly concentrated between 0 and 60° N, with particularly dense records in the northern low- to mid-latitudes. In the Paleogene and Neogene, records continue to show a marked bias toward the Northern Hemisphere, especially between 0 and 45° N. This pattern is broadly consistent with other Phanerozoic-scale datasets (Lai et al., 2025; Shu et al., 2025; Du et al., 2026), which also demonstrate significant palaeolatitudinal heterogeneity, concentration of records in the low- to mid-latitude regions, and an underrepresentation of high-latitude regions. The observed northward shift may be related to tectonic plate movement. Since Pangaea formed around 250 million years ago, the Gondwana has gradually fragmented, with its constituent plates drifting progressively northwards and reshaping palaeogeographic patterns and influencing the distribution of biodiversity (Park, 1988). Together, these comparisons suggest that the latitudinal structure observed here reflects not only dataset-specific characteristics, but also broader controls from palaeogeographic evolution through deep time.
All data for PhaFoS (version 0.0.1) can be found on Zenodo: https://doi.org/10.5281/zenodo.20777319 (Feng and Song, 2026).
The software tools and online resources used in this study are available at the following links: GPS Coordinates, which was used to obtain modern latitude and longitude from named collection localities, can be accessed at https://www.gps-coordinates.net/ (last access: 25 June 2026); Time Machine, which was used to convert modern latitude and longitude into palaeolatitude and palaeolongitude based on plate-tectonic reconstructions, can be accessed at https://docs.deeptime.world/ (last access: 25 June 2026); ImageJ, which was used to measure test dimensions from illustrated plates after scale calibration, can be downloaded from https://imagej.net/ij/download.html (last access: 25 June 2026).
The ultimate aim of the PhaFoS database is to provide the palaeontological and geoscience communities with a comprehensive and reusable resource for Phanerozoic foraminiferal body size. By integrating information such as body size of foraminiferal specimens, taxonomy, stratigraphy, and palaeogeography, we can analyse the spatial and temporal trends in foraminiferal diversity and body size variation during the Phanerozoic. All records retain links to their original data sources, including bibliographic information, stratigraphic data, and geographic metadata, thereby ensuring traceability between the compiled database and the primary sources from which the data were derived.
However, our database also has several limitations. First, the temporal resolution is not fully uniform across all records. Although most specimens can be classified within specific stratigraphic stages, there remain some records without precise stage-level resolution. In total, 108 433 records are constrained to a single stage, whereas others can only be assigned to broader stratigraphic intervals spanning multiple stages or, in some cases, only to the epoch level. Second, geographic information is incomplete for many records. Many original sources did not provide precise latitude and longitude coordinates. For these records, modern coordinates were estimated based on locality descriptions, section names, maps, or other geographic information provided in the original publications. Unavoidably, some records exhibit spatial uncertainty, such as those from earlier studies or sources where location details are vague. Third, most illustrated specimens are reported in two-dimensional view only, meaning that one of the three test dimensions is commonly unavailable for direct measurement. In such cases, the missing dimension was estimated on the basis of symmetry assumptions.
Despite our best efforts to standardize taxonomy, morphology, chronology, and geography, some uncertainties and omissions are unavoidable in a compilation of this scale. Future corrections, additions, and updates will further improve the accuracy and completeness of the dataset. Finally, it should be recognised that this database is a compilation of various source datasets. Therefore, when using these data, we recommend citing both PhaFoS and the original data sources to ensure proper attribution.
YF, JL, XS, DC, XL, LHL, YW, YH, and HS participated in the investigation. YF, JL, and XS collected the data. YF prepared the original draft and visualizations. JL, DC, XL, XS, LHL, YW, YH, and HS reviewed and edited the paper. HS and YH supervised the research. HS acquired funding for the project.
The contact author has declared that none of the authors has any competing interests.
Publisher's note: Copernicus Publications remains neutral with regard to jurisdictional claims made in the text, published maps, institutional affiliations, or any other geographical representation in this paper. The authors bear the ultimate responsibility for providing appropriate place names. Views expressed in the text are those of the authors and do not necessarily reflect the views of the publisher.
We are grateful to Xu Dai, Fengyu Wang, Shouyi Jiang, Zhe Li, and Enhao Jia for their help in the field work. We also thank Lirong Yang, Shouyi Jiang, Xin Yang, Xiaoyuan Sun and Yuting Liu for their assistance with data collection.
This study was funded by the State Key R&D Project of China (grant no. 2023YFF0804000), the National Natural Science Foundation of China (grant no. 42372032), the Natural Science Foundation of Hubei (grant no. 2023AFA006), and the Postdoctoral Fellowship Program (Grade B) of China Postdoctoral Science Foundation (grant no. GZB20260099).
This paper was edited by Sabine Schmidt and reviewed by Rossana Martini and Pedro Monarrez.
Abràmoff, M. D., Magalhães, P. J., and Ram, S. J.: Image processing with ImageJ, Biophotonics Int., 11, 36–42, https://imagej.net/ij/docs/pdfs/Image_Processing_with_ImageJ.pdf (last access: 1 June 2026), 2004.
Alroy, J., Marshall, C. R., Bambach, R. K., Bezusko, K., Foote, M., Fürsich, F. T., Hansen, T. A., Holland, S. M., Ivany, L. C., Jablonski, D., Jacobs, D. K., Jones, D. C., Kosnik, M. A., Lidgard, S., Low, S., Miller, A. I., Novack-Gottshall, P. M., Olszewski, T. D., Patzkowsky, M. E., Raup, D. M., Roy, K., Sepkoski, J. J., Sommers, M. G., Wagner, P. J., and Webber, A.: Effects of sampling standardization on estimates of Phanerozoic marine diversification, P. Natl. Acad. Sci. USA, 98, 6261–6266, https://doi.org/10.1073/pnas.111144698, 2001.
Angilletta Jr., M. J. and Dunham, A. E.: The temperature-size rule in ectotherms: simple evolutionary explanations may not be general, Am. Nat., 162, 332–342, https://doi.org/10.1086/377187, 2003.
Armstrong, H. A. and Brasier, M. D.: Foraminifera, in: Microfossils, 2nd Edn., Blackwell Publishing, Oxford, 142–187, https://doi.org/10.1002/9781118685440.ch15, 2004.
Arnold, A. J., Kelly, D. C., and Parker, W. C.: Causality and Cope's Rule: evidence from the planktonic foraminifera, J. Paleont., 69, 203–210, https://doi.org/10.1017/S0022336000034557, 1995.
Benson, R. B. J., Butler, R. J., Close, R. A., Saupe, E. E., and Rabosky, D. L.: Biodiversity across space and time in the fossil record, Curr. Biol., 31, R1225–R1236, https://doi.org/10.1016/j.cub.2021.07.071, 2021.
Benton, M. J.: The history of life: large databases in palaeontology, in: Numerical Palaeobiology: Computer-Based Modelling and Analysis of Fossils and Their Distributions, edited by: Harper, D. A. T., John Wiley & Sons, Chichester, 249–283, https://bpb-eu-w2.wpmucdn.com/blogs.bristol.ac.uk/dist/5/537/files/2019/07/1999numerical.pdf (last access: 1 June 2026), 1999.
Benton, M. J., Wills, M. A., and Hitchin, R.: Quality of the fossil record through time, Nature, 403, 534–537, https://doi.org/10.1038/35000558, 2000.
Bergmann, C.: Ueber die Verhältnisse der Wärmeökonomie der Thiere zu ihrer Grösse, Göttinger Studien, 3, 595–708, 1847.
Blanckenhorn, W. U.: The evolution of body size: what keeps organisms small?, Q. Rev. Biol., 75, 385–407, https://doi.org/10.1086/393620, 2000.
Brummer, G.-J. A. and Kučera, M.: Taxonomic review of living planktonic foraminifera, J. Micropalaeontol., 41, 29–74, https://doi.org/10.5194/jm-41-29-2022, 2022.
Chaabane, S., de Garidel-Thoron, T., Giraud, X., Schiebel, R., Beaugrand, G., Brummer, G.-J., Casajus, N., Greco, M., Grigoratou, M., Howa, H., Jonkers, L., Kucera, M., Kuroyanagi, A., Meilland, J., Monteiro, F., Mortyn, G., Almogi-Labin, A., Asahi, H., Avnaim-Katav, S., Bassinot, F., Davis, C. V., Field, D. B., Hernández-Almeida, I., Herut, B., Hosie, G., Howard, W., Jentzen, A., Johns, D. G., Keigwin, L., Kitchener, J., Kohfeld, K. E., Lessa, D. V. O., Manno, C., Marchant, M., Ofstad, S., Ortiz, J. D., Post, A., Rigual-Hernandez, A., Rillo, M. C., Robinson, K., Sagawa, T., Sierro, F., Takahashi, K. T., Torfstein, A., Venancio, I., Yamasaki, M., and Ziveri, P.: The FORCIS database: A global census of planktonic Foraminifera from ocean waters, Sci. Data, 10, 354, https://doi.org/10.1038/s41597-023-02264-2, 2023.
Chole, H., Woodard, S. H., and Bloch, G.: Body size variation in bees: regulation, mechanisms, and relationship to social organization, Curr. Opin. Insect Sci., 35, 77–87, https://doi.org/10.1016/j.cois.2019.07.006, 2019.
Cohen, K. M., Harper, D. A. T., Gibbard, P. L., and Car, N.: The ICS international chronostratigraphic chart this decade, Episodes, 48, 105–115, https://doi.org/10.18814/epiiugs/2025/025001, 2025.
Cope, E. D.: The Primary Factors of Organic Evolution, Open Court Publishing Company, Chicago, https://doi.org/10.5962/bhl.title.2068, 1896.
Dong, S., Lei, Y., Li, T., and Jian, Z.: Response of benthic foraminifera to pH changes: Community structure and morphological transformation studies from a microcosm experiment, Mar. Micropaleontol., 156, 101819, https://doi.org/10.1016/j.marmicro.2019.101819, 2020.
Dornelas, M., Antao, L. H., Moyes, F., Bates, A. E., Magurran, A. E., Adam, D., Akhmetzhanova, A. A., Appeltans, W., Arcos, J. M., Arnold, H., Ayyappan, N., Badihi, G., Baird, A. H., Barbosa, M., Barreto, T. E., Bassler, C., Bellgrove, A., Belmaker, J., Benedetti-Cecchi, L., Bett, B. J., Bjorkman, A. D., Blazewicz, M., Blowes, S. A., Bloch, C. P., Bonebrake, T. C., Boyd, S., Bradford, M., Brooks, A. J., Brown, J. H., Bruelheide, H., Budy, P., Carvalho, F., Castaneda-Moya, E., Chen, C. A., Chamblee, J. F., Chase, T. J., Collier, L. S., Collinge, S. K., Condit, R., Cooper, E. J., Cornelissen, J. H. C., Cotano, U., Crow, S. K., Damasceno, G., Davies, C. H., Davis, R. A., Day, F. P., Degraer, S., Doherty, T. S., Dunn, T. E., Durigan, G., Duffy, J. E., Edelist, D., Edgar, G. J., Elahi, R., Elmendorf, S. C., Enemar, A., Ernest, S. K. M., Escribano, R., Estiarte, M., Evans, B. S., Fan, T.-Y., Farah, F. T., Fernandes, L. L., Farneda, F. Z., Fidelis, A., Fitt, R., Fosaa, A. M., Franco, G. A. D. C., Frank, G. E., Fraser, W. R., Garcia, H., Gatti, R. C., Givan, O., Gorgone-Barbosa, E., Gould, W. A., Gries, C., Grossman, G. D., Gutierrez, J. R., Hale, S., Harmon, M. E., Harte, J., Haskins, G., Henshaw, D. L., Hermanutz, L., Hidalgo, P., Higuchi, P., Hoey, A., Van Hoey, G., Hofgaard, A., Holeck, K., Hollister, R. D., Holmes, R., Hoogenboom, M., Hsieh, C.-h., Hubbell, S. P., Huettmann, F., Huffard, C. L., Hurlbert, A. H., Ivanauskas, N. M., Janik, D., Jandt, U., Jazdzewska, A., Johannessen, T., Johnstone, J., Jones, J., Jones, F. A. M., Kang, J., Kartawijaya, T., Keeley, E. C., Kelt, D. A., Kinnear, R., Klanderud, K., Knutsen, H., Koenig, C. C., Kortz, A. R., Kral, K., Kuhnz, L. A., Kuo, C.-Y., Kushner, D. J., Laguionie-Marchais, C., Lancaster, L. T., Lee, C. M., Lefcheck, J. S., Levesque, E., Lightfoot, D., Lloret, F., Lloyd, J. D., Lopez-Baucells, A., Louzao, M., Madin, J. S., Magnusson, B., Malamud, S., Matthews, I., McFarland, K. P., McGill, B., McKnight, D., McLarney, W. O., Meador, J., Meserve, P. L., Metcalfe, D. J., Meyer, C. F. J., Michelsen, A., Milchakova, N., Moens, T., Moland, E., Moore, J., Moreira, C. M., Muller, J., Murphy, G., Myers-Smith, I. H., Myster, R. W., Naumov, A., Neat, F., Nelson, J. A., Nelson, M. P., Newton, S. F., Norden, N., Oliver, J. C., Olsen, E. M., Onipchenko, V. G., Pabis, K., Pabst, R. J., Paquette, A., Pardede, S., Paterson, D. M., Pelissier, R., Penuelas, J., Perez-Matus, A., Pizarro, O., Pomati, F., Post, E., Prins, H. H. T., Priscu, J. C., Provoost, P., Prudic, K. L., Pulliainen, E., Ramesh, B. R., Ramos, O. M., Rassweiler, A., Rebelo, J. E., Reed, D. C., Reich, P. B., Remillard, S. M., Richardson, A. J., Richardson, J. P., van Rijn, I., Rocha, R., Rivera-Monroy, V. H., Rixen, C., Robinson, K. P., Rodrigues, R. R., Rossa-Feres, D. de C., Rudstam, L., Ruhl, H., Ruz, C. S., Rybicki, N., Rypel, A., Sal, S., Salgado, B., Sampaio, E. M., Santos, F. A. M., Savassi-Coutinho, A. P., Scanga, S., Schmidt, J., Schooley, R., Setiawan, F., Shao, K.-T., Shaver, G. R., Sherman, S., Sherry, T. W., Sicinski, J., Sievers, C., Silva, A. C. da, Silva, F. R. da, Silveira, F. L., Slingsby, J., Smart, T., Snell, S. J., Soudzilovskaia, N. A., Souza, G. B. G., Souza, F. M., Souza, V. C., Stallings, C. D., Stanforth, R., Stanley, E. H., Sterza, J. M., Stevens, M., Stuart-Smith, R., Suarez, Y. R., Supp, S., Tamashiro, J. Y., Tarigan, S., Thiede, G. P., Thorn, S., Tolvanen, A., Toniato, M. T. Z., Totland, O., Twilley, R. R., Vaitkus, G., Valdivia, N., Vallejo, M. I., Valone, T. J., Van Colen, C., Vanaverbeke, J., Venturoli, F., Verheye, H. M., Vianna, M., Vieira, R. P., Vrska, T., Vu, C. Q., Vu, L. V., Waide, R. B., Waldock, C., Watts, D., Webb, S., Wesolowski, T., White, E. P., Widdicombe, C. E., Wilgers, D., Williams, R., Williams, S. B., Williamson, M., Willig, M. R., Willis, T. J., Wipf, S., Woods, K., Woehler, E. J., Zawada, K., and Zettler, M. L.: BioTIME: A database of biodiversity time series for the Anthropocene, Glob. Ecol. Biogeogr., 27, 760-786, https://doi.org/10.1111/geb.12729, 2018.
Dowding, E. M., Dunne, E. M., Collins, K. S., Cryer, K., De Baets, K., Dimitrijević, D., Edie, S. M., Finnegan, S., Kiessling, W., Lintulaakso, K., Liow, L. H., Little, H., Na, L., Peters, S. E., Renaudie, J., Saupe, E. E., Seuss, B., Sessa, J. A., Smith, J. A., Uhen, M. D., Williams, J. W., and Kocsis, Á. T.: The billion-dollar case for sustaining palaeontology's digital databases, Nat. Ecol. Evol., 10, 594-605, https://doi.org/10.1038/s41559-026-02985-8, 2026.
Dudley, R.: The evolutionary physiology of animal flight: paleobiological and present perspectives, Annu. Rev. Physiol., 62, 135-155, https://doi.org/10.1146/annurev.physiol.62.1.135, 2000.
Dunning Jr., J. B.: CRC handbook of avian body masses, 2nd Edn., CRC Press, Boca Raton, https://doi.org/10.1201/9781420064452, 2007.
Du, Y., Song, H., Algeo, T. J., Zhang, H., Peng, J., Wu, Y., Lai, J., Shu, X., Song, H., Wei, L., Zhang, J., Stüeken, E. E., Grasby, S. E., Dal Corso, J., Liu, X., Chu, D., Tian, L., Liang, Q., Li, X., Yao, H., and Song, H.: The global Deep-time Sediment Nitrogen Isotopes in Marine Systems (DSMS-NI) database, Earth Syst. Sci. Data, 18, 675–690, https://doi.org/10.5194/essd-18-675-2026, 2026.
Fan, J., Zhang, H., Hou, X. D., Wu, S., Shen, S. Z., Yang, Q., Wang, Y., Luo, H., Leng, Q., Zhang, Y. D., Zhan, R. B., and Chen, Q.: Quantitative research trends of palaeobiology and stratigraphy-construction of the Geobiodiversity Database (GBDB) using eScience Technology, Acta Palaeontol. Sin., 50, 141–153, https://doi.org/10.19800/j.cnki.aps.2011.02.001, 2011 (in Chinese with English abstract).
Fan, J. X., Chen, Q., Hou, X. D., Miller, A. I., Melchin, M. J., Shen, S. Z., Wu, S. Y., Goldman, D., Mitchell, C. E., Yang, Q., Zhang, Y. D., Zhan, R. B., Wang, J., Leng, Q., Zhang, H., and Zhang, L. N.: Geobiodiversity Database: a comprehensive section-based integration of stratigraphic and paleontological data, Newslett. Stratigr., 46, 111–136, https://doi.org/10.1127/0078-0421/2013/0033, 2013.
Fan, J. X., Hou, X. D., Chen, Q., Melchin, M. J., Goldman, D., Zhang, L. N., and Chen, Z. Y.: Geobiodiversity Database (GBDB) in stratigraphic, palaeontological and palaeogeographic research: graptolites as an example, GFF, 136, 70–74, https://doi.org/10.1080/11035897.2014.880070, 2014.
Faulkner, K., Lowery, C., Martindale, R. C., Simpson, C., and Fraass, A. J.: Record of Foraminifera test composition throughout the Phanerozoic, P. Roy. Soc. B-Biol. Sci., 292, 20250221, https://doi.org/10.1098/rspb.2025.0221, 2025.
Feng, Y. and Song, H. J.: PhaFoS: A Global Database of Phanerozoic Foraminiferal Size, Version 0.0.1, Zenodo [data set], https://doi.org/10.5281/zenodo.20777319, 2026.
Feng, Y., Song, H. J., and Bond, D. P. G.: Size variations in foraminifers from the early Permian to the Late Triassic: implications for the Guadalupian-Lopingian and the Permian-Triassic mass extinctions, Paleobiology, 46, 511-532, https://doi.org/10.1017/pab.2020.37, 2020.
Feng, Y., Song, H., Song, H., Wu, Y., Li, X., Tian, L., Dong, S., Lei, Y., and Clapham, M. E.: High extinction risk in large foraminifera during past and future mass extinctions, Sci. Adv., 10, eadj8223, https://doi.org/10.1126/sciadv.adj8223, 2024.
Fenton, I. S., Woodhouse, A., Aze, T., Lazarus, D., Renaudie, J., Dunhill, A. M., Young, J. R., and Saupe, E. E.: Triton, a new species-level database of Cenozoic planktonic foraminiferal occurrences, Sci. Data, 8, 160, https://doi.org/10.1038/s41597-021-00942-7, 2021.
Fike, D. A., Grotzinger, J. P., Pratt, L. M., and Summons, R. E.: Oxidation of the Ediacaran ocean, Nature, 444, 744–747, https://doi.org/10.1038/nature05345, 2006.
Flügel, E.: Carbonate depositional environments, in: Microfacies of Carbonate Rocks, Springer, Berlin, Heidelberg, 7–52, https://doi.org/10.1007/978-3-662-08726-8_2, 2004.
Gingerich, P. D.: Rates of evolution: effects of time and temporal scaling, Science, 222, 159–161, https://doi.org/10.1126/science.222.4620.159, 1983.
Groves, J. R. and Altiner, D.: Survival and recovery of calcareous foraminifera pursuant to the end-Permian mass extinction, C. R. Palevol, 4, 487–500, https://doi.org/10.1016/j.crpv.2004.12.007, 2005.
Groves, J. R. and Wang, Y.: Timing and size selectivity of the Guadalupian (Middle Permian) fusulinoidean extinction, J. Paleontol., 87, 183–196, https://doi.org/10.1666/12-076R.1, 2013.
Groves, J. R., Altiner, D., and Rettori, R.: Extinction, survival, and recovery of lagenide foraminifers in the Permian–Triassic boundary interval, central Taurides, Turkey, J. Paleontol., 79, 1–38, https://doi.org/10.1666/0022-3360(2005)79[1:ESAROL]2.0.CO;2, 2005.
Hallock, P.: Why are larger foraminifera large?, Paleobiology, 11, 195–208, https://doi.org/10.1017/S0094837300011507, 1985.
Hallock, P.: Symbiont-bearing Foraminifera, in: Modern Foraminifera, edited by: Sen Gupta, B. K., Kluwer Academic Publishers, Dordrecht, the Netherlands, 123–139, https://doi.org/10.1007/0-306-48104-9_8, 1999.
Heim, N. A., Knope, M. L., Schaal, E. K., Wang, S. C., and Payne, J. L.: Cope's rule in the evolution of marine animals, Science, 347, 867–870, https://doi.org/10.1126/science.1260065, 2015.
Huang, B., Harper, D. A. T., Zhan, R., and Rong, J.: Can the Lilliput Effect be detected in the brachiopod faunas of South China following the terminal Ordovician mass extinction?, Palaeogeogr. Palaeoclim., 285, 277–286, https://doi.org/10.1016/j.palaeo.2009.11.020, 2010.
Huang, Y., Tong, J., Tian, L., Song, H., Chu, D., Miao, X., and Song, T.: Temporal shell-size variations of bivalves in South China from the Late Permian to the early Middle Triassic, Palaeogeogr. Palaeoclim., 609, 111307, https://doi.org/10.1016/j.palaeo.2022.111307, 2023.
Hunt, G. and Roy, K.: Climate change, body size evolution, and Cope's Rule in deep-sea ostracodes, P. Natl. Acad. Sci. USA, 103, 1347–1352, https://doi.org/10.1073/pnas.0510550103, 2006.
Jernvall, J. and Fortelius, M.: Common mammals drive the evolutionary increase of hypsodonty in the Neogene, Nature, 417, 538–540, https://doi.org/10.1038/417538a, 2002.
Jiang, S. Y., Song, H. J., Kemp, D. B., Dai, X., and Liu, X. K.: Two pulses of extinction of larger benthic foraminifera during the Pliensbachian-Toarcian and early Toarcian environmental crises. Palaeogeogr. Palaeoclim., 560, 109998, https://doi.org/10.1016/j.palaeo.2020.109998, 2020.
Keller, G. and Abramovich, S.: Lilliput effect in late Maastrichtian planktic foraminifera: Response to environmental stress, Palaeogeogr. Palaeoclim., 284, 47–62, https://doi.org/10.1016/j.palaeo.2009.08.029, 2009.
Kidwell, S. M. and Flessa, K. W.: The quality of the fossil record: populations, species, and communities, Annu. Rev. Earth Pl. Sci., 24, 433–464, https://doi.org/10.1146/annurev.earth.24.1.433, 1996.
Lai, J., Song, H., Chu, D., Dal Corso, J., Sperling, E. A., Wu, Y., Liu, X., Wei, L., Li, M., Song, H., Du, Y., Jia, E., Feng, Y., Song, H., Yu, W., Liang, Q., Li, X., and Yao, H.: Deep-Time Marine Sedimentary Element Database, Earth Syst. Sci. Data, 17, 1613–1626, https://doi.org/10.5194/essd-17-1613-2025, 2025.
Lazarus, D: Neptune: a marine micropaleontology database, Math. Geol., 26, 817–832, https://doi.org/10.1007/BF02083119, 1994.
Lee, J. J.: Algal symbiosis in larger foraminifera, Symbiosis, 42, 63–75, https://dal.scholaris.ca/server/api/core/bitstreams/fa222591-e067-4c37-855a-1485e8545981/content (last access: 1 June 2026), 2006.
Loeblich Jr., A. R. and Tappan, H.: Foraminiferal Genera and Their Classification, Springer, New York, https://doi.org/10.1007/978-1-4899-5760-3, 1988.
McClain, C. R., Heim, N. A., Knope, M. L., Monarrez, P. M., Payne, J. L., Santos, I. T., and Webb, T. J.: MOBS 1.0: A database of interspecific variation in marine organismal body sizes, Glob. Ecol. Biogeogr., 34, e70062, https://doi.org/10.1111/geb.70062, 2025.
McIlroy, D., Green, O. R., and Brasier, M. D.: Palaeobiology and evolution of the earliest agglutinated Foraminifera: Platysolenites, Spirosolenites and related forms, Lethaia, 34, 13–29, https://doi.org/10.1080/002411601300068170, 2001.
Mikhalevich, V. I.: The phylum Foraminifera d’Orbigny, 1826 – foraminifers, in: Protisty: Rukovodstvo po Zoologii, Part 1, edited by: Alimov, A. F., Nauka, St. Petersburg, 533–623, ISBN 5-02-025864-4, 2000 (in Russian with English summary).
Miller, P. L.: The supply of oxygen to the active flight muscles of some large beetles, J. Exp. Biol., 45, 285–304, https://doi.org/10.1242/jeb.45.2.285, 1966.
Papineau, D., Mojzsis, S. J., and Schmitt, A. K.: Multiple sulfur isotopes from Paleoproterozoic Huronian interglacial sediments and the rise of atmospheric oxygen, Earth Planet. Sc. Lett., 255, 188–212, https://doi.org/10.1016/j.epsl.2006.12.015, 2007.
Park, R. G.: Geological structures and moving plates. Springer Science & Business Media, https://doi.org/10.1007/978-94-017-1685-7, 1988.
Partridge, L. and French, V.: Thermal evolution of ectotherm body size: why get big in the cold?, in: Animals and Temperature: Phenotypic and Evolutionary Adaptation, edited by: Johnston, I. A. and Bennett, A. F., Cambridge University Press, Cambridge, 265–292, https://doi.org/10.1017/CBO9780511721854.012, 1996.
Payne, J. L.: Evolutionary dynamics of gastropod size across the end-Permian extinction and through the Triassic recovery interval, Paleobiology, 31, 269–290, https://doi.org/10.1666/0094-8373(2005)031[0269:EDOGSA]2.0.CO;2, 2005.
Payne, J. L., Boyer, A. G., Brown, J. H., Finnegan, S., Kowalewski, M., Krause, R. A., Lyons, S. K., McClain, C. R., McShea, D. W., Novack-Gottshall, P. M., Smith, F. A., Stempien, J. A., and Wang, S. C.: Two-phase increase in the maximum size of life over 3.5 billion years reflects biological innovation and environmental opportunity, P. Natl. Acad. Sci. USA, 106, 24–27, https://doi.org/10.1073/pnas.0806314106, 2009.
Payne, J. L., Groves, J. R., Jost, A. B., Nguyen, T., Moffitt, S. E., Hill, T. M., and Skotheim, J. M.: Late Paleozoic fusulinoidean gigantism driven by atmospheric hyperoxia, Evolution, 66, 2929–2939, https://doi.org/10.1111/j.1558-5646.2012.01626.x, 2012.
Payne, J. L., Jost, A. B., Wang, S. C., and Skotheim, J. M.: A shift in the long-term mode of foraminiferan size evolution caused by the end-Permian mass extinction, Evolution, 67, 816–827, https://doi.org/10.1111/j.1558-5646.2012.01807.x, 2013.
Peters, R. H.: The Ecological Implications of Body Size, Cambridge University Press, Cambridge, https://doi.org/10.1017/CBO9780511608551, 1983.
Peters, S. E. and Foote, M.: Determinants of extinction in the fossil record, Nature, 416, 420-424, https://doi.org/10.1038/416420a, 2002.
Rao, T. R.: Body size matters in the lives of organisms, Resonance, 26, 61–71, https://doi.org/10.1007/s12045-020-1105-9, 2021.
Raup, D. M. and Sepkoski, J. J.: Mass extinctions in the marine fossil record, Science, 215, 1501–1503, https://doi.org/10.1126/science.215.4539.1501, 1982.
Rego, B. L., Wang, S. C., Altiner, D., and Payne, J. L.: Within- and among-genus components of size evolution during mass extinction, recovery, and background intervals: a case study of Late Permian through Late Triassic foraminifera, Paleobiology, 38, 627–643, https://doi.org/10.1666/11040.1, 2012.
Reolid, M., Mattioli, E., Duarte, L. V., and Marok, A.: The Toarcian oceanic anoxic event and the Jenkyns event (IGCP-655 final report), Episodes, 43, 833-844, https://doi.org/10.18814/epiiugs/2020/020051, 2020.
Rivero-Cuesta, L., Westerhold, T., and Alegret, L.: The Late Lutetian Thermal Maximum (middle Eocene): first record of deep-sea benthic foraminiferal response, Palaeogeogr. Palaeoclim., 545, 109637, https://doi.org/10.1016/j.palaeo.2020.109637, 2020.
Salamon, M. A., Brachaniec, T., Kołbuk, D., Saha, A., and Gorzelak, P.: Shared patterns in body size declines among crinoids during the Palaeozoic extinction events, Sci. Rep., 11, 20351, https://doi.org/10.1038/s41598-021-99789-6, 2021.
Salamon, M. A., Brachaniec, T., Paszcza, K., Kołbuk, D., and Gorzelak, P.: The role of mass extinction events in shaping the body-size dynamics of fossil crinoids, Palaeogeogr. Palaeoclim., 622, 111593, https://doi.org/10.1016/j.palaeo.2023.111593, 2023.
Schmidt, D. N., Thierstein, H. R., and Bollmann, J.: The evolutionary history of size variation of planktic foraminiferal assemblages in the Cenozoic, Palaeogeogr. Palaeoclim., 212, 159-180, https://doi.org/10.1016/j.palaeo.2004.06.002, 2004.
Sen Gupta, B. K. (Ed.): Modern Foraminifera, Springer, Dordrecht, https://doi.org/10.1007/0-306-48104-9, 2003.
Sepkoski, J. J.: A compendium of fossil marine families, Milwaukee Public Mus. Contrib. Biol. Geol., 51, 1–125, 1982.
Shu, X., Song, H., Lei, Y., Chu, D., Dal Corso, J., Liu, X., Ye, Q., Song, H., Wei, L., Jia, E., Feng, Y., Du, Y., Song, H., Yu, W., Liang, Q., Li, X., Yao, H., and Wu, Y.: Global Acritarch Database (> 110 000 occurrences), Earth Syst. Sci. Data, 17, 3567–3582, https://doi.org/10.5194/essd-17-3567-2025, 2025.
Simmons, M. D. and Aretz, M.: Larger benthic foraminifera, in: Fossils and Earth Time, Elsevier, 149–166, https://doi.org/10.1016/B978-0-443-29092-3.00014-5, 2026.
Smith, F. A., Lyons, S. K., Ernest, S. K. M., Jones, K. E., Kaufman, D. M., Dayan, T., Marquet, P. A., Brown, J. H., and Haskell, J. P.: Body mass of Late Quaternary mammals, Ecology, 84, 3403, https://doi.org/10.1890/02-9003, 2003.
Smith, J., Rillo, M. C., Kocsis, Á. T., Dornelas, M., Fastovich, D., Huang, H.-H. M., Jonkers, L., Kiessling, W., Li, Q., Liow, L. H., Margulis-Ohnuma, M., Meyers, S., Na, L., Penny, A. M., Pippenger, K., Renaudie, J., Saupe, E. E., Steinbauer, M. J., Sugawara, M., Tomašovỳch, A., Williams, J. W., Yasuhara, M., Finnegan, S., and Hull, P. M.: BioDeepTime: A database of biodiversity time series for modern and fossil assemblages, Global Ecol. Biogeogr., 32, 1680–1689, https://doi.org/10.1111/geb.13735, 2023.
Song, H., Tong, J., and Chen, Z. Q.: Evolutionary dynamics of the Permian-Triassic foraminifer size: evidence for Lilliput effect in the end-Permian mass extinction and its aftermath, Palaeogeogr. Palaeoclim., 308, 98–110, https://doi.org/10.1016/j.palaeo.2010.10.036, 2011.
Stanley, S. M.: An explanation for Cope's rule, Evolution, 27, 1–26, https://doi.org/10.1111/j.1558-5646.1973.tb05912.x, 1973.
The NOW Community: New and Old Worlds Database of Fossil Mammals (NOW), licensed under CC BY 4.0, Zenodo, https://doi.org/10.5281/zenodo.4268068, 2026.
Twitchett, R. J.: The Lilliput effect in the aftermath of the end-Permian extinction event, Palaeogeogr. Palaeoclim., 252, 132–144, https://doi.org/10.1016/j.palaeo.2006.11.038, 2007.
Ueno, K.: Carboniferous fusuline Foraminifera: taxonomy, regional biostratigraphy, and palaeobiogeographic faunal development, Geol. Soc. London Spec. Publ., 512, 327–496, https://doi.org/10.1144/SP512-2021-107, 2022.
Walker, S. E., Hancock, L. G., and Bowser, S. S.: Diversity, biogeography, body size and fossil record of parasitic and suspected parasitic foraminifera: a review, J. Foram. Res., 47, 34–55, https://doi.org/10.2113/gsjfr.47.1.34, 2017
Wang, F. Y., Finnegan, S., Dal Corso, J., Ye, F. C., Wu, Y. Y, Chen, J., Jiang, S. Y., Tian, L., Dai, X., Chu, D., Song, H. Y., Tong, J. N., and Song, H. J.: Brachiopods and forams reduced calcification costs through morphological simplification during mass extinction events, Nat. Ecol. Evol., 9, 1456–1468, https://doi.org/10.1038/s41559-025-02749-w, 2025.
Yang, L., Dai, X., Liu, X. K., Feng, Y., Jiang, S., Wang, F., Song, H. Y., Tian, L., and Song, H. J.: Foraminiferal extinction and size reduction during the Permian-Triassic transition in southern Tibet, J. Earth Sci., 35, 1799–1809, https://doi.org/10.1007/s12583-023-1847-x, 2024.