the Creative Commons Attribution 4.0 License.
the Creative Commons Attribution 4.0 License.
 | 02 Nov 2026
Ten years of measurements (2012-2022) of the atmospheric composition at Saclay/SIRTA observatory in the Ile de France region as part of ICOS and ACTRIS
Laura Bouillon
Valérie Gros
Morgan Lopez
Nicolas Bonnaire
Carole Philippon
Camille Yver Kwok
Leslie David
Olivier Perrussel
Olivier Sanchez
Simone Kotthaus
Jean-Eudes Petit
Philippe Ciais
Michel Ramonet

Carbon dioxide (CO2)is the main contributor to global warming, and cities now account for more than two-thirds of emissions of this gas. Atmospheric observatories located on the outskirts of cities are therefore important facilities for measuring the impact on atmospheric composition of the emission reductions planned by cities. The Saclay observatory, part of the ICOS and ACTRIS research infrastructures and located 20 km southwest of Paris, has been monitoring greenhouse gases (CO2, methane – CH4), reactive gases (Nitrogen oxides – NOx, Ozone – O3, Carbon monoxide – CO), and carbonaceous aerosols (eBC) since 2012 (https://doi.org/10.57932/5c399263-a317-41b7-8900-184b177c4216, Bouillon and Ramonet, 2025). This study presents 10 years of monitoring of these compounds, characterizing diurnal, seasonal cycles and decadal trends. In order to best characterize the impact of Parisian emissions, we defined two sets of data depending on whether the station is downwind of Paris or, conversely, in background conditions with westerly winds. This strategy allows us to characterize the urban offset in the Saclay measurement series. The results show a significant decrease in the urban offset of compounds mainly linked to traffic emissions: −35.6 %, −52.3 %, and −56.7 % for CO, NOx, and eBClf (equivalent black carbon from liquid fuel). There was also a 15 % decrease in urban offset of CO2 between the 2012–2017 and 2019–2022 periods, a figure consistent with the Airparif inventories' estimate of the decrease in emissions in Paris over the same period.
- Article
(8191 KB) - Full-text XML
- BibTeX
- EndNote


Carbon dioxide (CO2) is a major contributor to global warming which is emitted from various biogenic and anthropogenic sources activities (Friedlingstein et al., 2023; IPCC, 2022). In 2018, almost 55 % (4.2 billion) of the population inhabited in urban areas, and according to urban planning projections, in 2050, almost 68 % (6.6 billion) of the population will be living within cities (United Nations, 2019). As a result, cities now account for an estimated 70 % of global CO2 emissions and contribute to anthropogenic CH4 emissions as well (Mukim, 2023). For this reason, it is becoming increasingly important to quantify those urban emissions, for instance using independent atmospheric observation systems. Long-term measurements of greenhouse gases (GHGs) are relatively rare in urban and peri-urban environments. Atmospheric studies have endeavoured to estimate urban CO2 emissions. In their study (Levin et al., 2011) analyzed CO2 and CH4 measurements in Heidelberg, Germany over a period nearly 15 years to estimate emissions with the so-called Radon Tracer Method. They also used 14CO2 measurements to separate biogenic and anthropogenic contributions to total CO2 emissions.
In another study by Bezyk et al. (2023), CO2 and CH4 concentrations were measured at six stations near the city of Wroclaw in Poland over a year. That study aimed to align a long-term model with a spatial scale granularity for CO2 and CH4 . Isotope measurements were also conducted to differentiate between biospheric (emitted by biological processes such as respiration or photosynthesis) and anthropogenic emissions. In a subsequent study by Sreenivas et al. (2016), CO2 and CH4 concentrations were measured during one year in India to investigate seasonal impacts. NOx and O3 concentrations were also measured to assess the methane sink mechanism. Building upon these earlier findings, Sreenivas et al. (2022) conducted a follow-up study at the exact location, this time over 3 years. The study's primary objective was to examine and contrast inter-annual variations in CO2 and CO concentrations with the aid of modelling. Other studies have been conducted using the eddy covariance (EC) method. In Beijing, in the study by Liu et al. (2020), CO2 and PM2.5 were measured between 2009 and 2017 and subsequently studied using the EC method. A study in Sele, Switzerland, was also conducted over 10 years to study trends between 2005 and 2015 (Schmutz et al., 2016).
The Paris region is France's most densely populated region, with around 12 million inhabitants, i.e. approximately 20 % of the French population over 2 % of the country's surface area. Located in a suburban area 20 km southwest from downtown Paris, the Saclay plateau is suitable for monitoring the impact of urban emissions on the regional atmospheric composition, thanks to two observatories associated to the ICOS and ACTRIS European research infrastructures. The ICOS station measures greenhouse gases such as CO2, CO and CH4 since 2001. The SIRTA observatory (Site Instrumental de Recherche par Télédétection Atmosphérique, Haeffelin et al., 2005) linked to ACTRIS measures atmospheric pollutants such as NOx, eBC and O3 since 2012/2013. This atmospheric monitoring program, fully involved in the two European Research Infrastructures, provides a unique opportunity to study long-term covariations of greenhouse gases, reactive gases and aerosols in the peri-urban environment of the Paris region. The colocation of these atmospheric measurements is particularly valuable to better characterize emission processes since the observed components are often co-emitted by specific sources like traffic or residential heating.
According to the latest inventory, CO2 emissions in the Paris region were estimated to be 33.5 MtCO2 in 2021, representing 8.5 % of the total emissions in France (Airparif, 2024). The primary sources of CO2 emissions in the region are transport (31 %) and the residential sector (18 %) (Airparif, 2024). The main emissions of nitrogen oxides (NOx) are from the traffic sector (47 %), with a smaller contribution from the residential (9 %) and tertiary (8 %) sectors (Airparif, 2024). The primary sources of carbon monoxide (CO) emissions are the residential sector (55 %) and the traffic sector (32 %). These two sectors are also the main sources of black carbon, a particulate pollutant emitted by all types of incomplete combustion (Janssen et al., 2011). Measurement of equivalent black carbon and application of the source apportionment methodology developed by Sandradewi et al. (2008) separate two fractions, the contribution of liquid fuel (eBClf) and the contribution of solid fuel (eBCsf), representative in urban areas for the most part of the traffic and residential sectors respectively (Savadkoohi et al., 2023).
CO2 concentration measurements alone are difficult to interpret because the influences of regional emissions are mixed with those on a larger scale, and the influences of biospheric fluxes are mixed with those of anthropogenic emissions from different sectors. The measurement of other compounds used as process tracers can be used to help discriminate between the different sources of CO2 variability. To identify the regional contribution to the observed CO2 variability, the approach is generally to measure atmospheric gradients between two stations located upstream and downstream of the region to determine a baseline from which large-scale contributions can be isolated. In this study, we have developed an alternative method to the gradient approach. We have defined two geographical sectors based on wind direction and speed: one for the urban sector with winds coming from Paris, and one for the rural sector which can be used as a proxy of the background signal. From the difference of the two time series we calculate the urban offset, representing the excess of concentrations that we attribute to the emissions from the Paris area.
This study presented atmospheric CO2, CH4 , CO, NOx, eBC, and O3 data measurements from 2012 to 2022. In addition to this decade of data, meteorological and boundary layer data and the Airparif inventory for different years were employed. The concentrations are analyzed in the urban and rural sectors (Sect. 3). These analyses encompassed seasonal (Sect. 3.1) and diurnal (Sect. 3.2) variations, culminating in trend analyses across the entire duration of the measurements and the urban offset (Sect. 3.3). The discussion (Sect. 4) involves a comparison of the ratios measured with those calculated using the Airparif inventories.
2.1 Site presentation
The Saclay plateau is located in a peri-urban area of the Île-de-France region, 20 km southwest of Paris (France). Measurements of greenhouse gases and pollutants presented in this study come from three locations, 1.5 km apart. CO2, CO, and CH4 were measured at the Laboratory for Climate and Environmental Sciences (LSCE) site from 2012 to 2015 and then at the ICOS tall tower from 2015; meteorological data were also measured on the tower. These measurements are performed within the ICOS European infrastructure and the consistency of the measurements between the two periods has been checked, as presented in the next section (Sect. 2.2). Measurements of short-lived pollutants (NOx, O3, and BC) were performed at SIRTA in-situ site, located at the LSCE facility. These measurements are part of the ACTRIS (Aerosol, Clouds, and Trace gases Research InfraStructure) European Infrastructure and follow its quality assurance and quality control guidelines (https://actris.eu/, last access: 5 September 2025). Planetary boundary layer height (PBLH) data are issued from measurements at the SIRTA main site, located 5 km from LSCE (Haeffelin et al., 2005; Kotthaus et al., 2023). The measurements between the three sites are consistent because they are located on a plateau and are less than 10 km apart (Table 1). These sites will be referred to as the Saclay site for the remainder of the study.
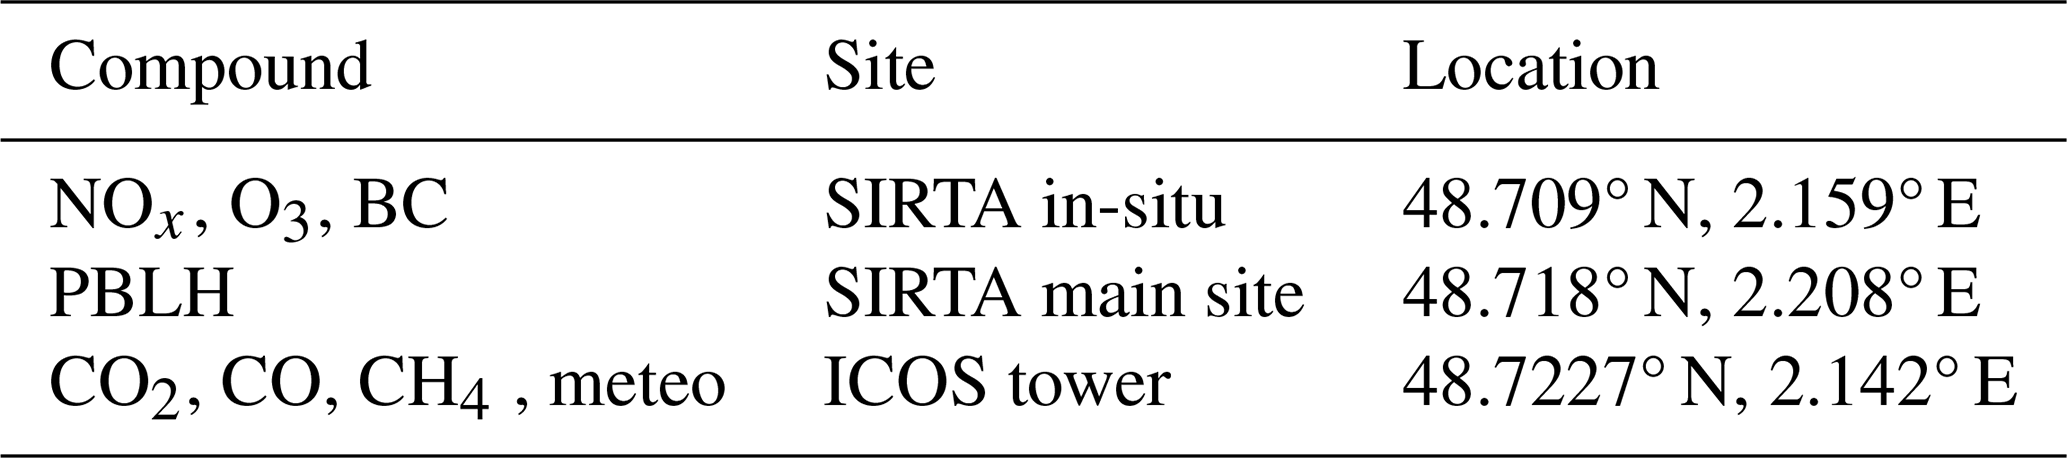
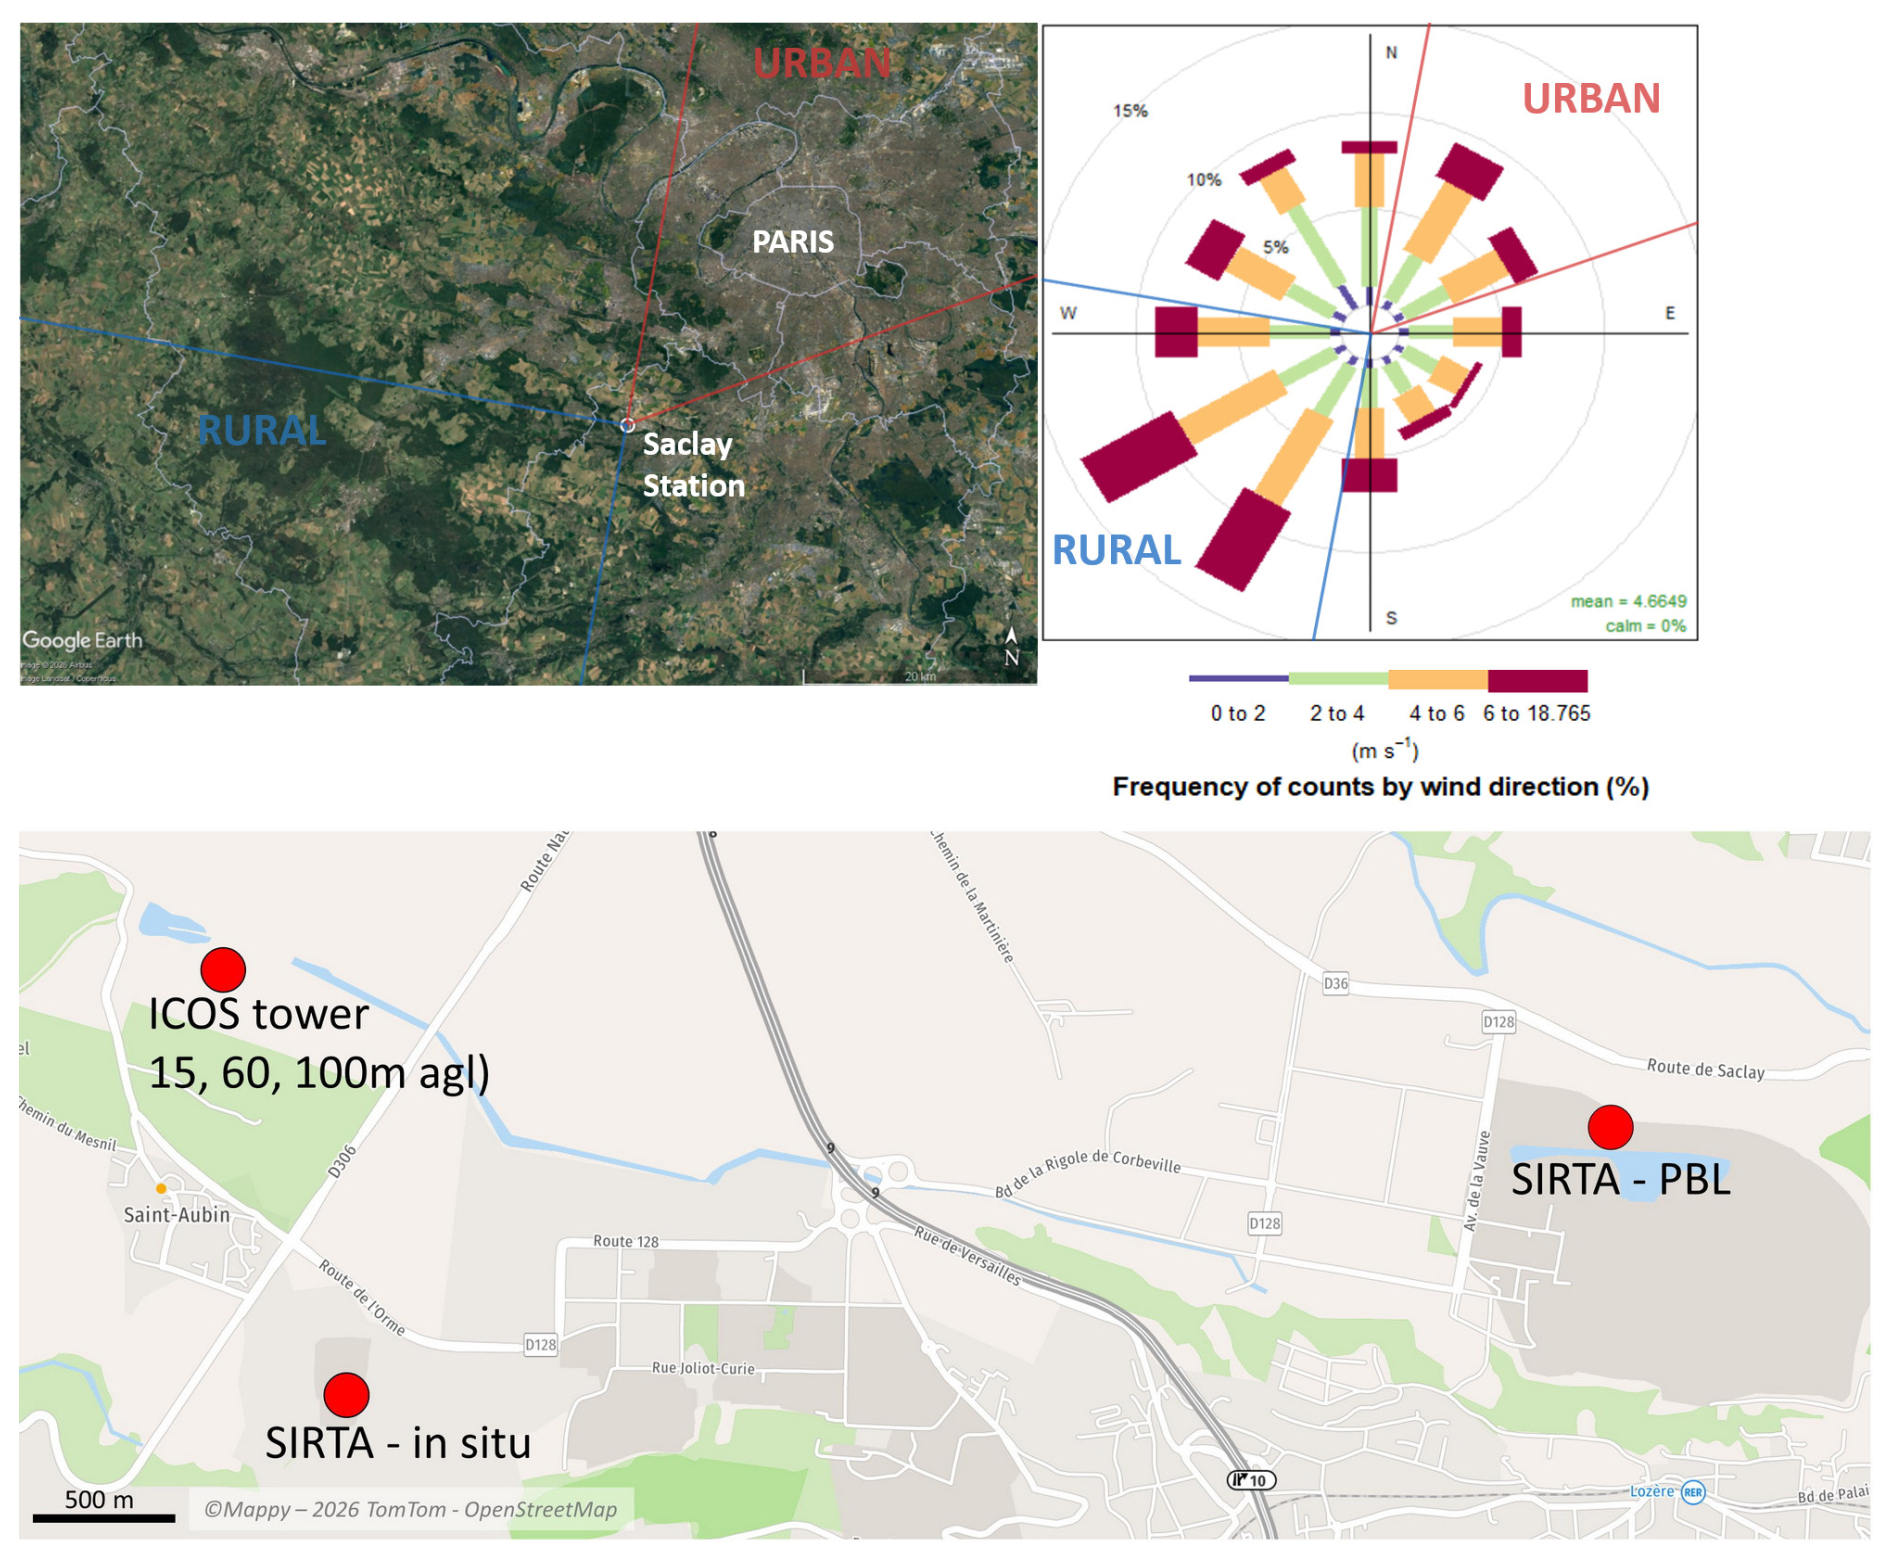
Figure 1Above: Map of the two geographical sectors used for the classification of the Saclay data (Imagery © 2026 Airbus – Landsat/Copernicus © Google Earth). The rural sector is shown in blue and the urban sector in red. The insert shows the wind rose of the dominant wind measured at Saclay. Below: Location of the measurement places described in the manuscript (© Mappy – 2026 TomTom – OpenStreetMap).
2.2 Instrument presentation
CO2, CH4 , and CO measurements were made with two gas chromatographs (GC) described by Schmidt et al. (2014) for CO2 and CH4 and by Yver et al. (2009) for CO. The GC system was first built in 2001 based on the design of Worthy et al. (1998), and optimized for measurements of CO2 and CH4 in flask samples as well as for semi-continuous measurements of ambient air in Saclay. The gas chromatograph used for CO2 and CH4 was an HP6890 until 2013 when an HP-7890 replaced it. The GC was equipped with two sample loops and two detectors to analyze simultaneously CH4 and CO2 with a flame ionization detector (FID) and N2O and SF6with an electron capture detector (ECD). In July 2006, we coupled a second GC (PP1 analyzer, Peak Laboratories) containing a reduction gas detector (RGD) to the existing GC system to analyze simultaneously CO and H2. The measurement time step is 5 min.
After 2015, CO2, CH4 and CO were measured at the ICOS Saclay tall tower by Cavity Ring-down Spectrometers (Picarro G2401 for CO2, CH4 and CO, and a Picarro G5310 was installed in 2019 for more accurate CO measurements). Atmospheric air is alternatively sampled and analyzed from the 100, 60, and 15 m levels in order to get at least one vertical profile per hour, as recommended by the ICOS specifications (ICOS-RI, 2020). All of the sampling lines (Synflex1300, 1.27 cm) are connected to pumps in order to ensure a residence time of less than 1 min. All samples are dried prior to analysis using a Nafion membrane to minimize the water vapor corrections due to spectrometric interferences and atmospheric dilution. The instruments are regularly calibrated against the WMO scales using a set of 4 cylinders bracketing the expected ambient mole fractions. The data quality control is performed by injecting a target gas twice a day to check instrument performance and identify biases. Daily measurement of the target gas makes it possible to assess the repeatability of the measurements. For measurements taken with the GC between 2012 and 2015, the average repeatabilities are 0.06 ppm, 0.9, and 1.2 ppb for CO2, CH4, and CO, respectively. With regard to measurements performed using a CRDS spectrometer, the repeatability values for the 2016–2022 period are 0.03 ppm, 0.3, and 1.6 ppb for CO2, CH4, and CO, respectively. The measurement of the target gases does not provide a comprehensive assessment of uncertainties, particularly the error associated with the water vapor correction, since the target gases are dry. Regular measurements of air samples analyzed as part of ICOS provide an independent assessment. Based on comparisons between in-situ measurements and air samples, the measurement uncertainty can be estimated at 0.1 ppm, 1 and 3 ppb for CO2, CH4, and CO, respectively. To correspond as closely as possible to the GC data measured between 2012 and 2015, CRDS data obtained from the ICOS tall tower at three different heights were compared. The data measured at 15 m is used in this article, in combination with GC data sampled from the roof of the LSCE prior to 2015.
As the CO2, CH4 and CO data come from several different instruments and locations, we checked the consistency of the dataset. For 2015, the R2 results between the GC and Picarro data from the 15 m tower are shown in Fig. A1. The R2 values are between 0.97 and 0.89 for the three compounds, and the slopes are close to 1. In addition, after 2015, during the lockdown period, the data was measured on the roof of the LSCE by Picarro (Fig. A2). For this reason, a correlation was calculated for 2016–2022, with R2 values between 0.96 and 0.84 for the three compounds and slopes also close to 1. The results show good correlations between the instruments over the different periods.
NOx measurements were performed using a chemiluminescence-based instrument equipped with a blue-light converter for converting NO2 into NO (Teledyne Advanced Pollution Instrumentation (API), model T200UP, USA). Calibration of the instrument is performed monthly, using a 10 ppm primary NO calibration gas standard cylinder (National Physics Laboratory, UK), diluted to 30 ppb with a dynamic dilution calibrator (TELEDYNE API, model T700U) and zero air from a high performance zero air system (TELEDYNE API, model 701H). A gas phase titration (GPT) system, is used every 3 months for the control of the NO2 converter efficiency. The instrument is equipped with an internal nafion dryer, to avoid the interferences caused by water vapour. The raw signals are corrected for artefacts caused by ozone (when ambient air enters the inlet line, NO2 photolysis is stopped while the reaction of NO and O3 continues, resulting in an overestimation of NO2 and an under-estimation of NO). Note that these data are not fully compliant with the ACTRIS measurements guidelines for NOx, as they have been corrected for ozone but not for the night-time offset. Nevertheless, this correction would be almost always below 0.2 ppb (Robert Wegener, ACTRIS CiGas data QA/QC workshop) and would not affect significantly the results and conclusions presented here. The ACTRIS CiGas (Centre for Reactive Trace Gases In Situ Measurements) audit conducted at the SIRTA observatory in December 2025 evaluated the performance of NOx measurements, reporting detection limits of 45 ppt for NO and 96 ppt for NO2 (60 s averaging time). An intercomparison with an independent reference instrument brought by the auditor showed excellent agreement: for NO, the slope was 1.03 with a Pearson correlation coefficient of 0.90, while for NO2 the slope was 0.97 with a Pearson correlation coefficient of 0.86 (Robert Wegener, ACTRIS CiGas, personal communication, 2026). The uncertainty for NOx mixing ratios is therefore estimated to be below 10 %.
Ozone measurements were performed with an analyser (Teledyne API, model T400, USA) based on ozone UV absorption (here determined at 254 nm). The instrument has shown a good stability over time and was calibrated at 0 and 100 ppb once a year with a zero-air generator and a calibrator (TELEDYNE API, Model 701H and T700U). The instrument performance has been evaluated in 2017 by an external system from IMT-Douai, giving a value of 0 and 101.1 ppb for zero and calibration respectively. Over the period (2013–2022), the incertitude for O3 mixing ratio is estimated to be below 10 %.
Black Carbon (BC) concentrations were derived from absorption photometer measurements. Single-spot AE31 data were used until February 2013, and compensated using the algorithm presented in Weingartner et al. (2003). Dual-spot AE33 aethalometer has been used since (Drinovec et al., 2015). Harmonized quality control has been applied as provided in Petit et al. (2021). Equivalent BC (eBC) mass concentrations were derived following the recommendations of Savadkoohi et al. (2024), by applying a harmonization factor, which depends on aethalometer model and filter tape used, as well as a Mass Absorption Cross-section (MAC) of 7.8 m2 g−1 at 880 nm. Source apportioned eBC fractions (liquid fuel and solid fuel) were calculated from the methodology of Sandradewi et al. (2008), with values of αsf and αlf of 1.85 and 0.9, respectively (Sandradewi et al., 2008; Petit et al., 2021). The reliability of BC source apportionment results mainly depends on the alpha values used for liquid-fuel and solid-fuel fractions (Favez et al., 2010). Navarro-Barboza et al. (2024) estimated an overall uncertainty not less than 20 %. Given the extensive statistical work carried out at SIRTA regarding BC source apportionment (e.g., Savadkoohi et al., 2025) leading to robust and consistent couple of alpha values, a 20 % uncertainty can be applied for BClf and BCsf. All times mentioned in this article are expressed in UTC.
2.3 Calculation of the urban offset
The Saclay station is exposed to air masses mainly originating from the South-West sector (the dominant wind as shown in Fig. 1), with relatively little urban influence nearby, or to air masses from the North-East that have passed through the highly urbanized Paris region. The hourly measurements in Saclay can thus been classified into two different sectors to analyse the impact of urban contribution on the regional level. The dataset is filtered with meteorological data using wind speed and direction from the top of the Saclay ICOS tower. For the urban sector, the selected wind directions are defined to be between 10 and 70°, corresponding to the north-easterly direction (Figs. 1, A3). The boundaries of the urban area were chosen to include the zone with high densities of anthropogenic emissions, while minimizing as much as possible the inclusion of forested and agricultural areas that would interfere with the anthropogenic signal of interest. The rural sector is defined for wind blowing between 190 and 280°, i.e., south-westerly. In order to avoid the impact of nearby cities, a wind speed selection larger than 4 m s−1 is applied on the rural sector. The value of 4 m s−1 is chosen as the best compromise between data availability and the objective of having representative winds. On average, the data from the urban sector represents 15.7 % of the total, while the data from the rural sector is 33 %. The data coverage is shown for each species and for both rural and urban sector in Fig. A5. We use measurements from the rural sector to represent background conditions for air masses in the Ile-de-France region. The difference between the two datasets represents the influence of the anthropogenic emissions in the Paris region on the air composition. From the hourly data of the two sectors, we smooth the data using the curve-fitting method of Thoning et al. (1989). This includes a trend function, a series of annual harmonics, and a combination of high-pass and low-pass filters to isolate sub-annual and inter-annual variations, respectively. There is no interpolation of the smooth curves for data gaps of more than thirty days. Several scenarios were considered, as shown in Fig. A4. The urban offset is defined as the difference between the fitted curve based on the data selected in the urban sector, minus the fitted curve based on the data selected in the rural sector.
2.4 Airparif emission inventory and sources
Airparif, the air quality monitoring structure for the Paris region, is building an emission inventory for the entire Paris region based on a combination of benchmark emission factors and activity data for about 80 emissions sectors. The latest version of the inventory is available for the years 2005, 2010, 2012, 2015, 2019 and 2022 at a 3 × 3 km resolution and is based on the updated 2023 methodology. A more detailed description of the Airparif emissions inventory can be found in Bréon et al. (2015). Table 2 shows total CO2, CH4, CO and NOx emissions for 2022, as well as the percentages for the main sectors of activity: residential, traffic, waste and energy. There are two main sources of CO2 emissions: road traffic, which accounts for a quarter of emissions, and the residential-tertiary sector, which accounts for a third of emissions, mainly from heating. For NOx, the main emission sector is road traffic, which accounts for almost half of emissions, while for CO, the residential sector accounts for just over half of emissions, and road traffic for a third.
Table 2Contribution of the different emission sectors of compounds in the Ile de FranceParis region according to the Airparif 2022 inventory and total of emissions.
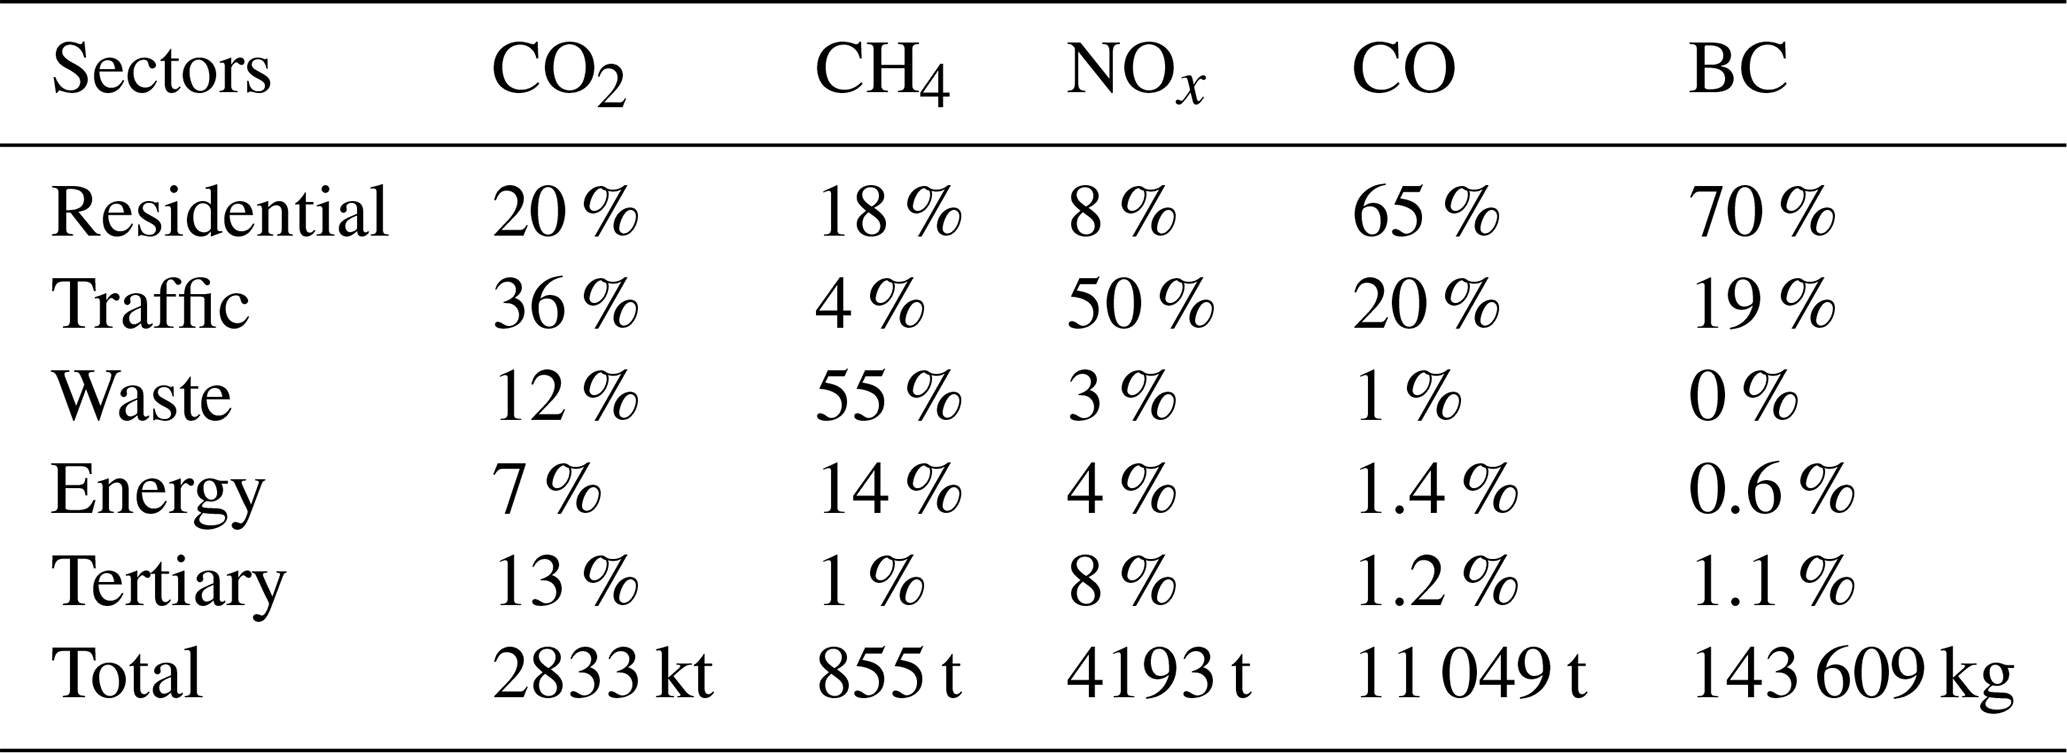
In addition to annual emissions given by sector of activity, Airparif also produces temporal profiles to estimate variations in emissions on a daily, weekly or monthly scale. By combining these temporal profiles, it is possible, for example, to represent typical emissions for winter working days, or summer vacations. Figure 2 shows average diurnal emission profiles for a winter month and a summer month. The road traffic sector unsurprisingly shows strong diurnal variability, for CO2, CO and NOx, with very low emissions at night. Emissions rise rapidly between 4 and 8 h in response to the onset of urban activity. They then fall slightly, with a small rebound in the late afternoon. Finally, traffic emissions fall towards their residual night values between 17 and 23 h. It is interesting to note that estimated traffic emissions differ very little between summer and winter, both in terms of intensity and diurnal profile. The traffic counting loops to estimate this sector, show that traffic is present and significant throughout the year in the IIe de France region. Conversely, the residential sector, mainly associated with heating, is very low in summer. Winter emissions have daytime profiles similar to those of the traffic sector, with the difference that they extend later into the evening, and only start to fall after 18 h. The double-peak morning/evening emission pattern is clearer in the residential sector than in the traffic sector.
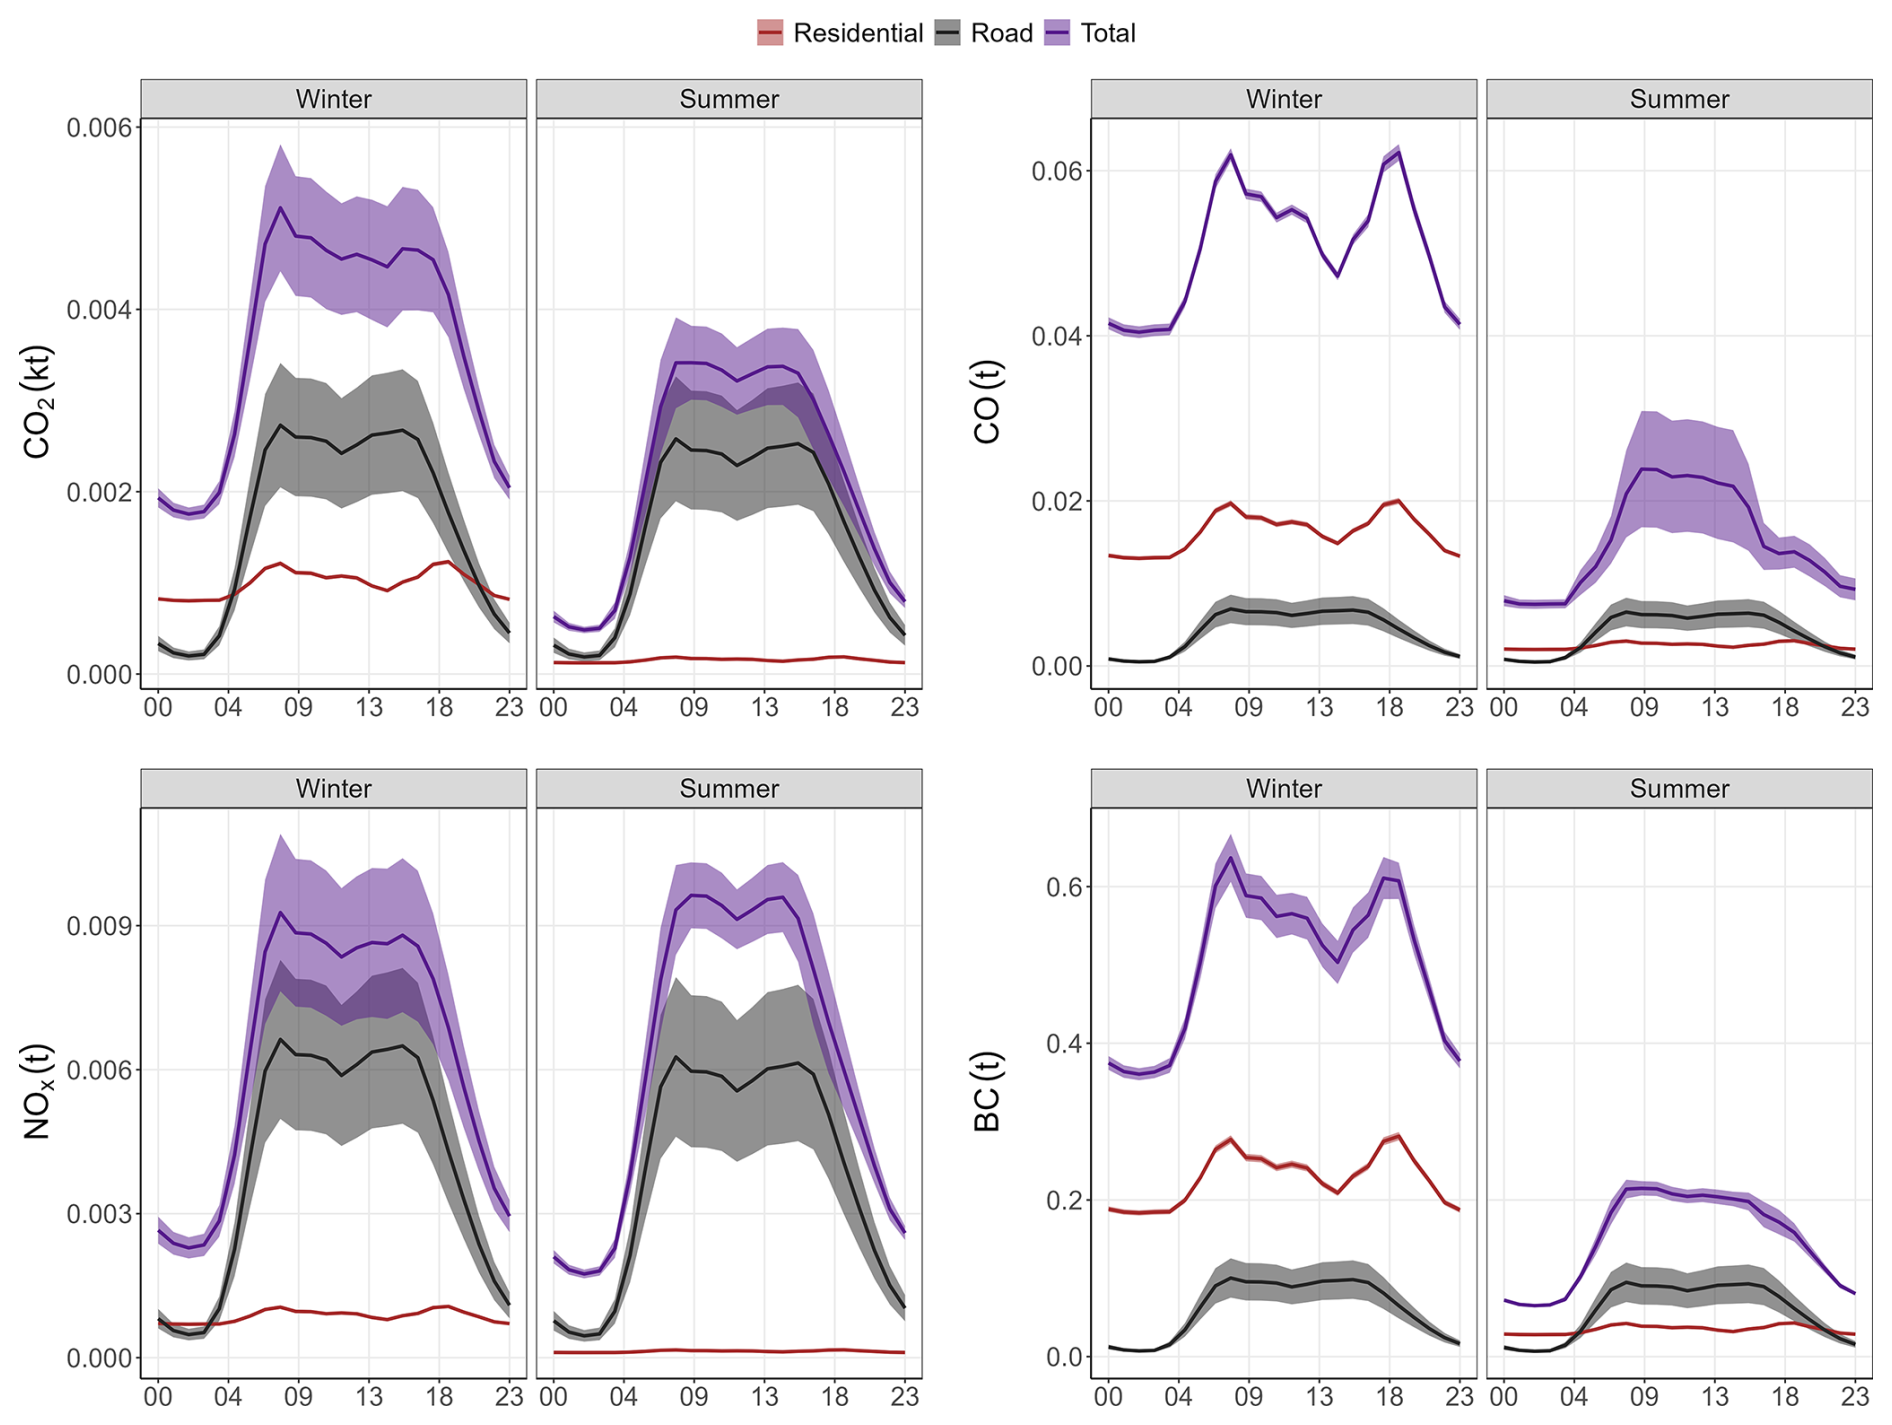
Figure 2Diurnal cycle in summer and winter using data from the 2022 Airparif inventory for the Paris region for CO2, NOx and CO. The purple curve represents the total inventory, the brown curve the residential and the grey curve the transport. The red curves in the lower panels represent the car count.
Figure 3 shows the complete dataset between 2012 and 2022 with the differentiation between urban and rural sectors. NO, NO2 and O3 measurements began in 2013. As expected, concentrations of the compounds mainly emitted by anthropogenic activities (NOx, BC, CO, CO2, CH4) are higher for the urban sector than the rural one due to the influence of the emissions in the Paris region. The variability of those compounds in the urban sector is also more pronounced than for the rural sector. The relatively low concentrations and smaller variability for the rural sector indicates that it represents a good proxy for baseline conditions in Saclay. We note that for O3, a secondary pollutant, the rural sector shows higher concentrations because of the complex mechanics of its formation. Indeed, as the ozone formation depends non-linearly on the interaction between NOx and VOCs and because urban areas are typically NOx-rich but VOC-limited while rural or peri-urban areas are often VOC-rich and NOx-poor, the highest ozone concentrations can frequently occur in rural regions downwind of urban emissions. In the Paris region, these are on average oriented along a northeast – southwest axis, transporting precursors and creating conditions where an optimal ratio enhances photochemical ozone production (Francois Gaie Levrel, Airparif, personal communication, 2026).
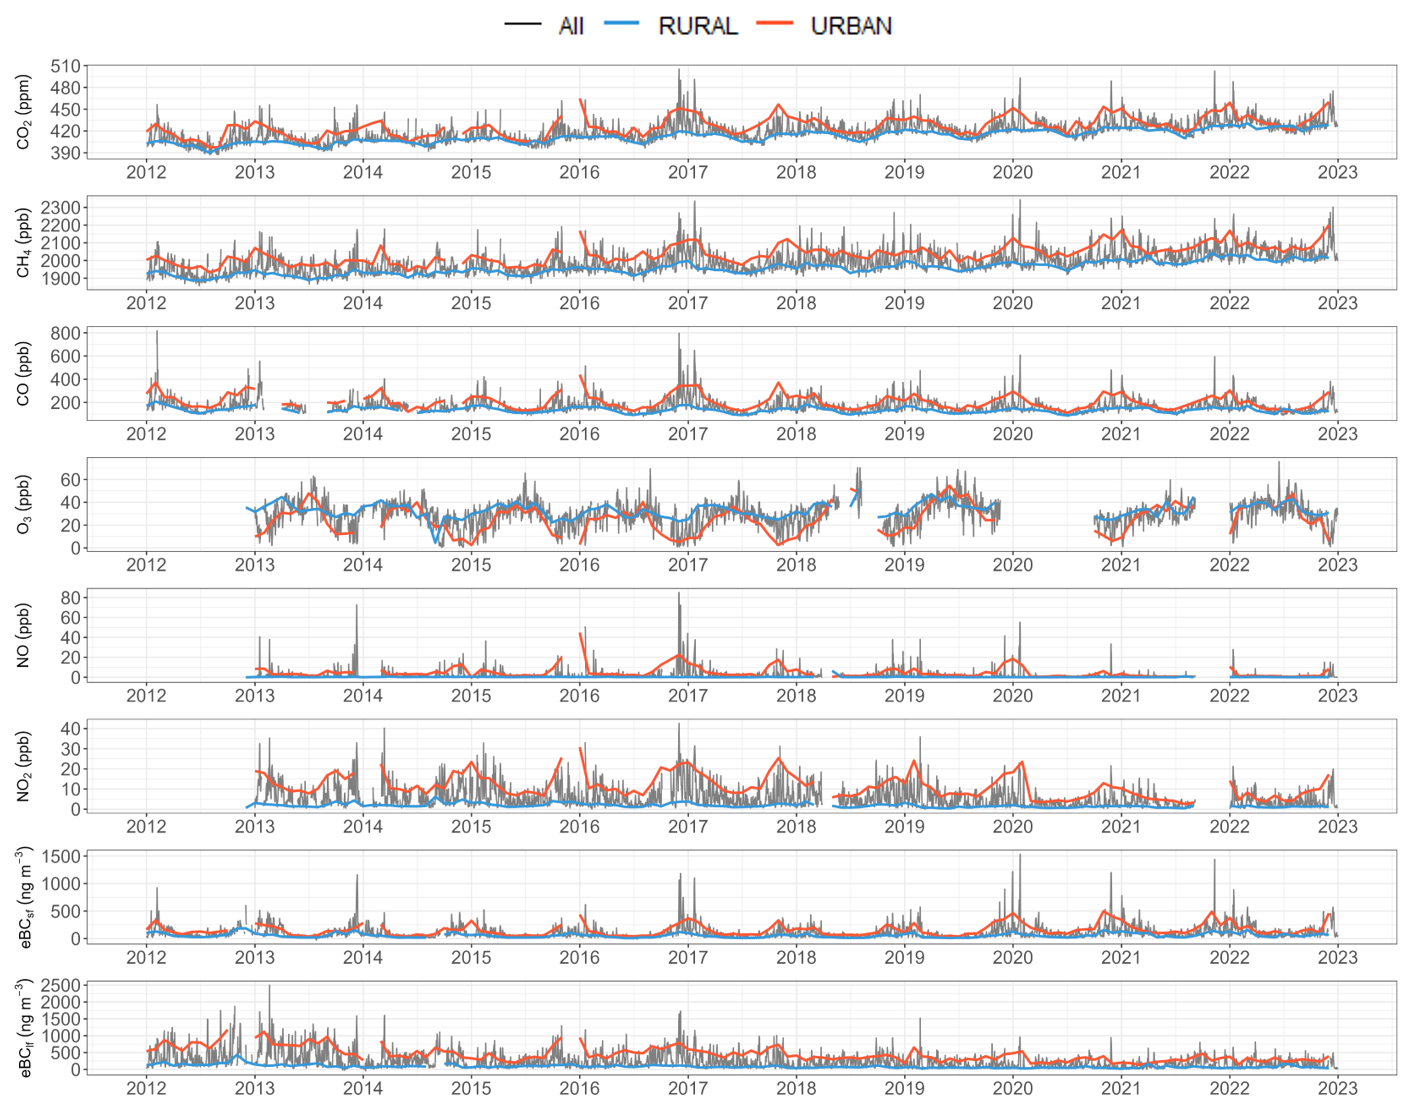
Figure 3Times Series of eBClf, eBCsf, NO2, NO, O3, CO, CH4, CO2. The black curves represent daily data. The red curve represents the monthly average data for the Urban sector. The blue curve represents the monthly average data for the Rural sector.
3.1 Seasonal cycles
The mean seasonal cycles for CO2, CH4 , CO, O3, NO, NO2, eBClf and eBCsf have been calculated separately for the urban and rural sectors (Fig. 4). Concentrations measured in the urban sector are higher than in the rural sector in all seasons and for all compounds, except ozone, which is a secondary pollutant and will be discussed at the end of this section. The differences in concentrations observed between the urban and rural sector depend on emissions and atmospheric dynamics, which change from month to month. The height of the boundary layer is higher in summer, which increases the mixing effect and reduces the measured concentrations at the surface. Conversely, the lower boundary layer concentrates the compounds in winter, increasing the surface concentrations (Foskinis et al., 2024). In addition, emissions from residential heating are higher in winter. According to Kotthaus et al. (2023) boundary layer heights are on average three times higher in summer than in winter at the Saclay site.
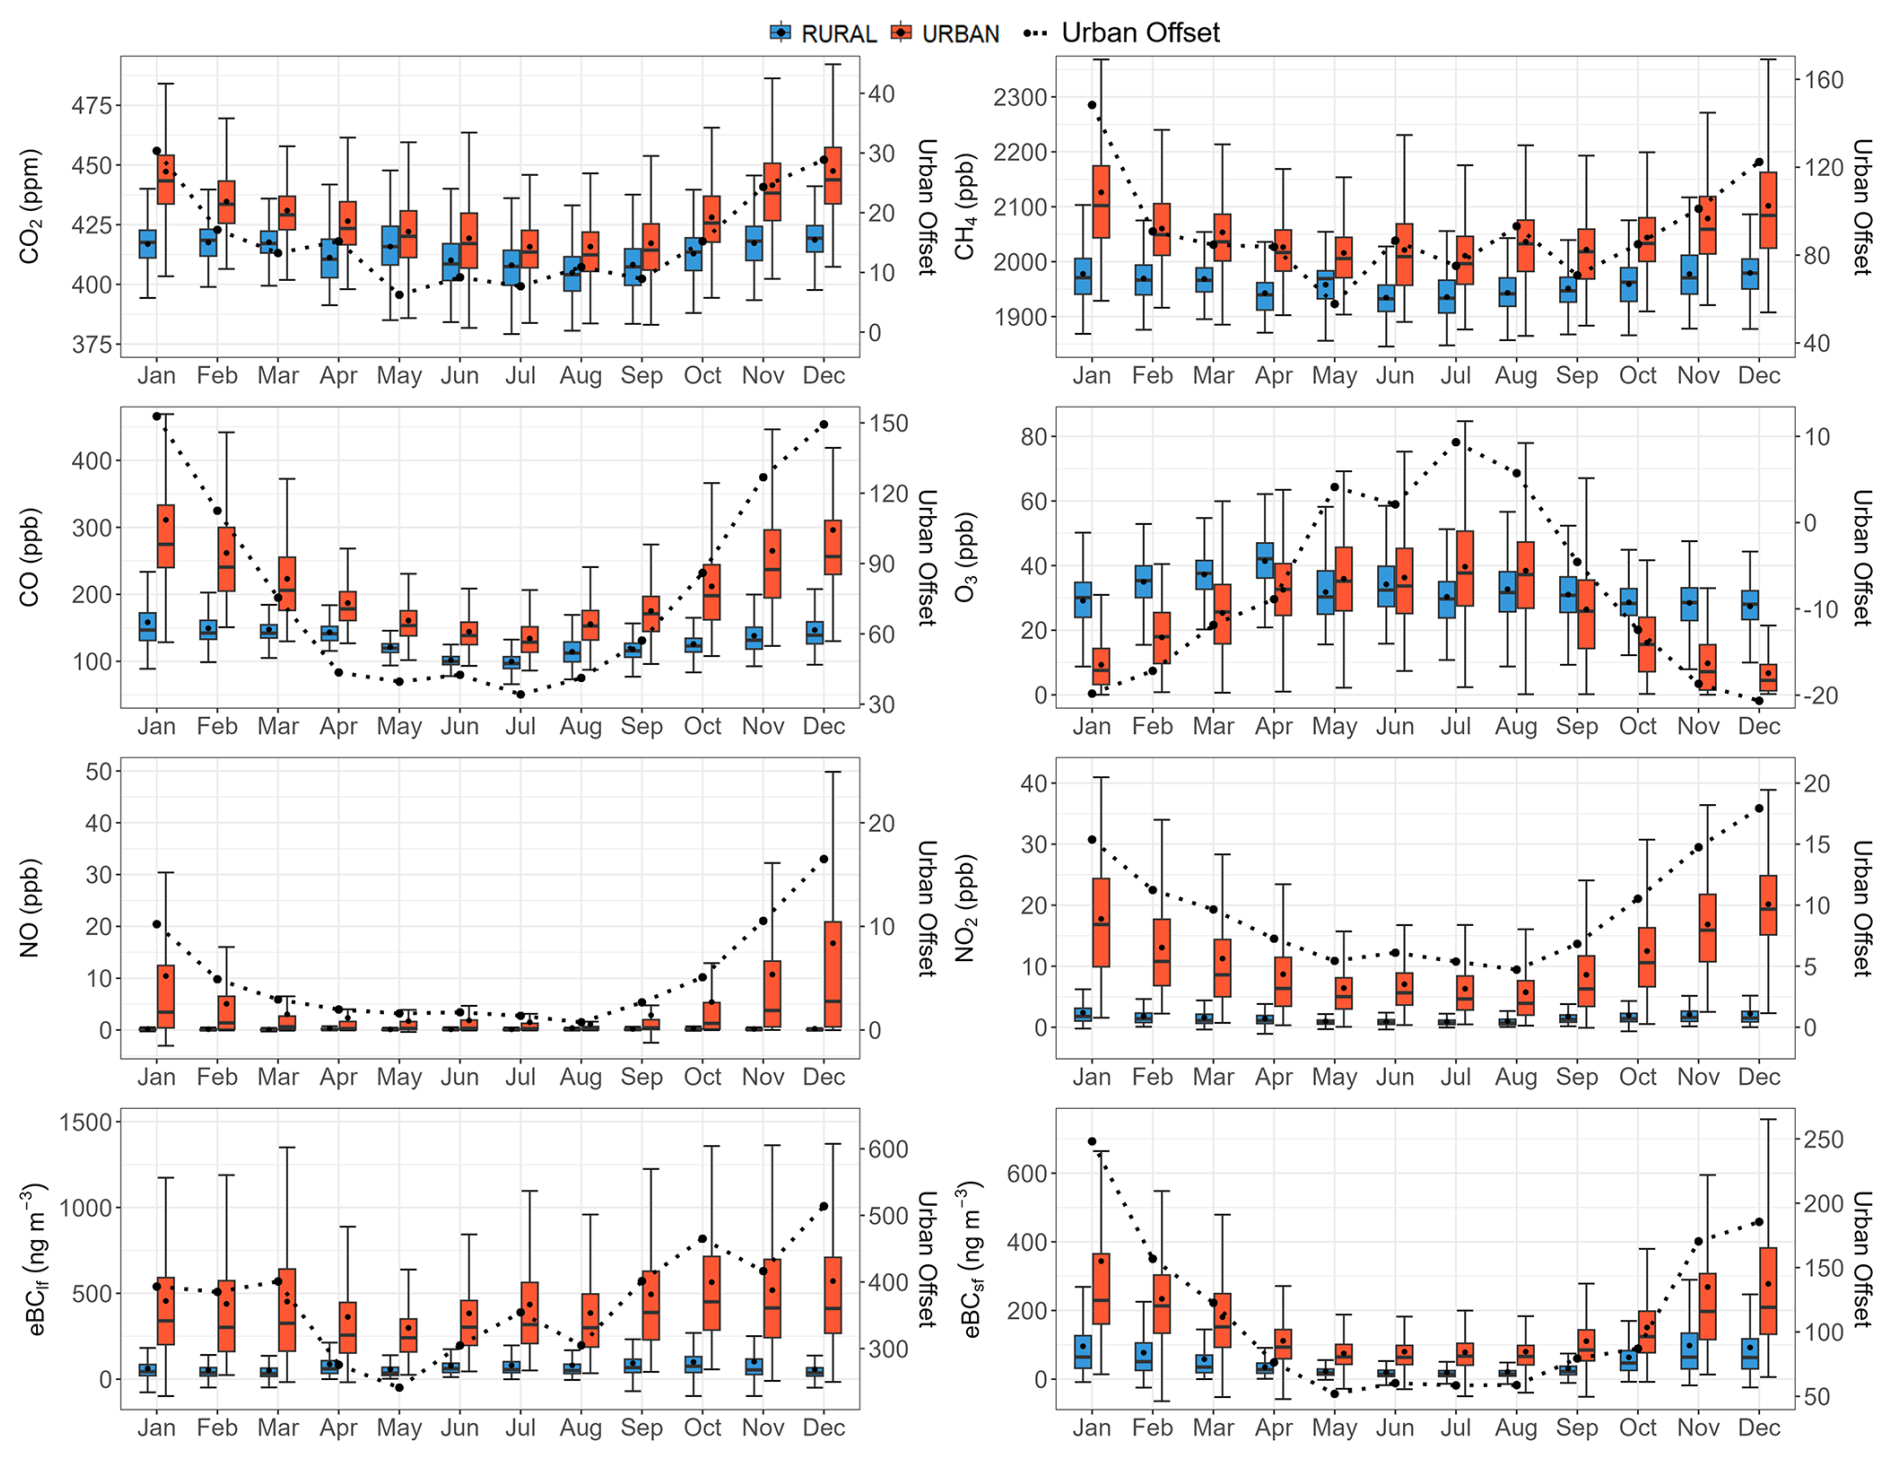
Figure 4Seasonal cycles have been calculated for all years combined. The red boxplot represents the urban sector, the blue boxplot represents the rural sector. The black curve is the average urban offset represented in the same unit as the corresponding compound. The whiskers extend from the 10th percentile (p10) to 90th percentile (p90), the box from the 25th percentile (p25) to 75th percentile (p75), and the median is plotted by the middle line. The black points represent the mean.
The seasonal cycles of CO2, CH4 , and CO have similar behaviour in both urban and rural sectors. The seasonal cycles in the two sectors are characterized for all three species by a winter maximum and a summer minimum. These similarities can be explained by common processes associated with anthropogenic emissions and atmospheric transport (Foskinis et al., 2024; Murthy et al., 2020). While atmospheric transport plays an important role in the phase of seasonal gas cycles measured at Saclay, it is not expected to contribute significantly to the seasonal cycle of the urban offset. In fact, the difference in pollutant dispersion between urban and rural areas is not very high, so the seasonal cycle of this signal should more closely reflect that of emissions which are detailed in the following paragraphs.
Beyond the seasonal impact of atmospheric dispersion, the seasonal CO2 cycle is primarily driven by biogenic fluxes, which explains the drop in concentrations between March and August during the plant growth phase, followed by a rise in atmospheric concentrations in autumn and winter when CO2 respiration by ecosystems exceeds uptake (Watts et al., 2021; Ke et al., 2025). The concentration in the urban sector remains higher due to the influence of the anthropogenic emissions in this sector. The average urban offset is 7 ppm in summer, rising to 25 ppm in winter, giving a ratio of 3.6 between the 2 seasons, which is 20 % higher than the ratio given by the Airparif inventory for Paris city. The average CO urban offset is ranging from 38 ppb in summer to 130 ppb in winter. The winter-to-summer ratio is equal to 3.4, close to the one observed for CO2, and also about 20 % higher than the ratio deduced from the Airparif inventory for Paris city.
The seasonal cycle of atmospheric CH4 is determined by seasonal variations in sources, chemical loss and transport. In contrast to the national picture, where agriculture is a predominant source, in the Paris region it accounts for less than 10 % of CH4 emissions. Natural sources, mainly associated with wetlands, also play a marginal contribution in this region. CH4 sinks and atmospheric transport therefore play a dominant role in the seasonal cycle, the main sink being the reaction with the hydroxyl radical (OH), which is produced photochemically and whose local abundance varies seasonally due to the intensity of UV radiation. However, no significant difference in these two processes is expected between urban and rural areas of the Paris region. The seasonal variability of the urban offset, with a ratio of 1.5 between winter and summer, is actually lower for CH4 than for CO2 and CO. The same ratio is found in atmospheric observations as in the Airparif inventory, which attributes it to the seasonality of the residential source.
As all reactive compounds, the seasonal cycle of atmospheric NOx is determined by seasonal variations in sources, photo-chemistry and dynamics. As expected for these very reactive compounds (lifetime of a few hours), which emissions are mainly derived from vehicular traffic, there is a strong difference between levels and variability observed between the urban and the rural sector (Lange et al., 2022). Levels of NO and NO2 from the rural sector remain below 2.5 ppb the whole year long and show a seasonal variation with a very small amplitude of 0.3 ppb for NO and 1.5 ppb for NO2. On the opposite, NO and NO2 from the urban sector (and therefore the urban offset) present a marked seasonal cycle with values 5.2 and 11.2 ppb (on average for NO and NO2 respectively) higher in winter than in summer. This seasonal cycle can be partly explained by the difference of boundary layer height. Regarding sources, whereas traffic emissions are not associated with significant seasonal variations, residential heating is maximum in winter and contributes to the higher values observed from November to February. The winter/summer atmospheric ratio is 3.7 for NOx. This is almost 50 % higher than the ratio derived from the Airparif inventory for the city of Paris. eBClf is also mainly emitted by traffic related sources, the seasonality of urban offset is not very pronounced except in autumn following the seasonality of its main source. Thus, it depends strongly on the proximity of the source, which explains the differences in concentrations between urban and rural areas. The urban offset for this compound is less marked than for eBCsf. In contrast, eBCsf is a tracer for the residential heating sector (wood-burning), exhibiting large seasonal variations (Savadkoohi et al., 2024). The increase in concentrations for this compound is evident during the winter period, attributable to the pronounced decline in emissions during the summer months. The urban offset seasonality for eBCsf is pronounced, primarily due to the substantial decrease in emissions in summer.
As mentioned above, ozone shows the opposite seasonal pattern to the other compounds, with a maximum in spring/summer and a minimum in winter, in agreement with the seasonal cycle observed in mid-latitudes stations of the northern hemisphere (Schultz et al., 2017). This seasonal variation is mainly driven by the main source of ozone in the lower troposphere, i.e. its photochemical production due to the interplay between precursors (NOx, CH4 , CO, VOC) and oxidants (hydroxyl radical). The annual maximum of the urban sector is observed in summer, whereas the one of the rural sector is more shifted towards spring. This last finding is in agreement with the study of Ansari et al. (2025) which have analysed ozone observations over a large number of rural stations in the world. Concerning western Europe and analysing the period (2014–2018) versus (2000–2004), they have noticed a shift of the ozone seasonal maximum towards spring for the most recent period. They explain this summer drop mainly the decrease of NOx at the national level (due to regulations). Ozone variability associated to the urban sector is more complex to analyse, as it includes local effects (precursors and subsequent photochemistry, ozone titration by NO), see Monks et al. (2015) and references therein. The seasonality of the ozone urban offset is highest in summer (+10 ppb) and lowest in winter (−20 ppb).
3.2 Diurnal cycles
The diurnal cycles of pollutants emitted at the surface are strongly constrained by the dynamics of the atmospheric boundary layer which acts as a key parameter in the dispersion of atmospheric compounds (Foskinis et al., 2024). Consequently, we have analyzed the diurnal cycles of eBClf, eBCsf, NO2, NO, O3, CO, CH4 and CO2 measured at Saclay, in relation to the boundary layer height measured at the SIRTA main site, 5 km away (Kotthaus et al., 2023). The mean diurnal cycles of all compounds were aggregated by hour, for both rural and urban sectors. For winter, we used the months of December, January, and February, and for summer, the months of June, July, and August (Fig. 5).
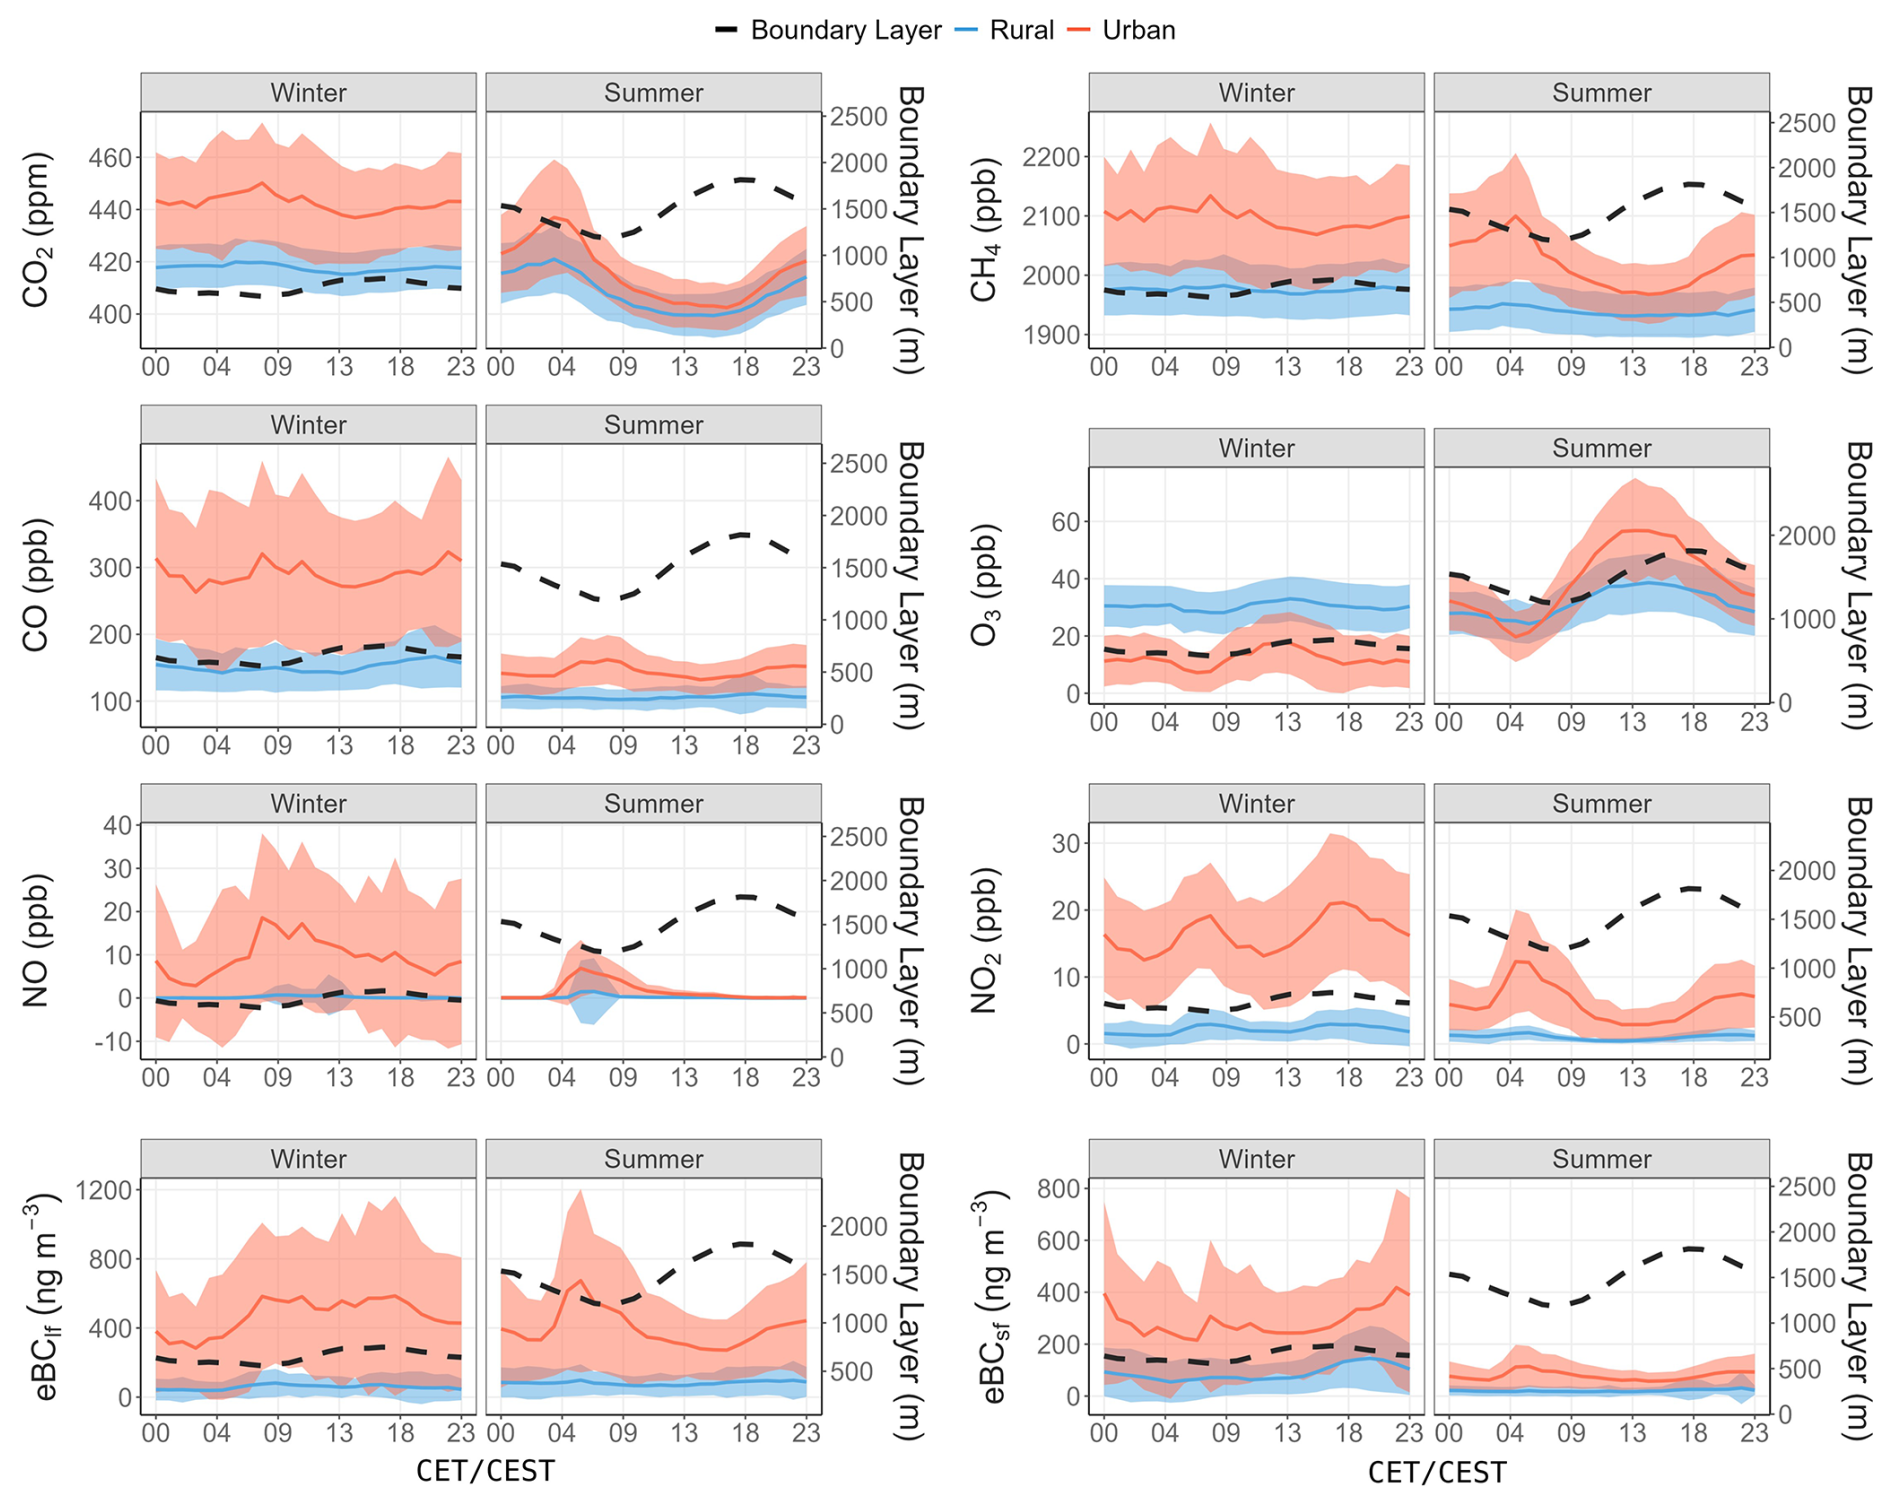
Figure 5Mean diurnal cycles of concentrations calculated over the period 2012–2022 for Winter and Summer. The red curve represents the average for the Urban sector, with the standard deviation. The blue curve represents the average for the Rural sector. The dotted black curve superimposed on each figure, represents the average boundary layer heights measured between 2015 and 2022 at SIRTA (Kotthaus et al., 2023).
The first finding on diurnal cycles is that, with the exception of ozone, average concentrations are higher in the urban sector than in the rural sector at all hours of the day. We also note that, in most cases, diurnal cycles are less pronounced in rural than in urban time series, and also in winter compared to summer time.
CO2 and CH4 show diurnal cycles with similar behaviors, negatively correlated with PBL heights. Concentrations increase as the boundary layer height decreases at night, and conversely, as the boundary layer expands during the day, CO2 and CH4 concentrations decrease. The amplitude of diurnal cycles is more pronounced in summer. It can also be seen that for CH4, the summer diurnal cycle is very flat in rural areas, while for CO2 it is of a similar amplitude to the one in urban areas. This can be explained by the importance of biospheric fluxes in the diurnal CO2 cycle. The summer maximum of the diurnal cycle for CO2 and CH4 in the urban sector is observed between 3 and 5 h. For most other species (NO, NO2, eBClf, eBCsf), the maximum occurs later, between 5 and 6 h, and for CO it is even later, between 6 and 9 h. This period of the day combines the minimum development of the atmospheric boundary layer with the start-up of urban activities and associated emissions, particularly from the urban traffic sector. According to Airparif's emission inventory, CO2, CO and NOx emissions remain high between 6 and 17 h. So the concentration minima observed in summer are largely explained by the dilution effect associated with the development of the boundary layer. In winter, this dilution effect during the day is much less pronounced and does not generate a morning minimum in atmospheric concentrations, and diurnal cycles therefore have a lower amplitude.
In winter all compounds in the urban sector, except O3, show a high value peaking at 08:00 a.m., due to the high traffic emissions in a low boundary layer. As the boundary layer develops in the course of the day, the concentration of short lived compounds (NO and NO2) decrease, while concentrations of less reactive compounds remain quite stable. The late afternoon (once the boundary layer height has decreased) is marked by a second peak of NO2, not observed on NO, this is due to the titration of O3 by NO. The slighly higher peak of NO2 in the late afternoon compared to the one observed in the early morning is due to the larger contribution of secondary photochemically formed NO2, as NO2 is a primary and secondary pollutant. While traffic is the main source controlling the diurnal cycles of NOx and eBClf, the influence of residential heating explains the later evening peak observed on CO and eBCsf.
As mentioned previously, ozone is a secondary pollutant formed by photochemical reactions involving CO, hydrocarbons, NOx and hydroxyl radicals (Monks et al., 2015). Therefore, its diurnal cycle for the urban sector shows a nighttime minimum and an afternoon maximum; with a larger amplitude in summer, when the photochemistry is maximum. For the rural sector, associated with background concentrations of precursors, the measured ozone hardly shows a maximum during the day, as the observed concentration mainly originates from regional transport.
3.3 Concentration and urban offset trends
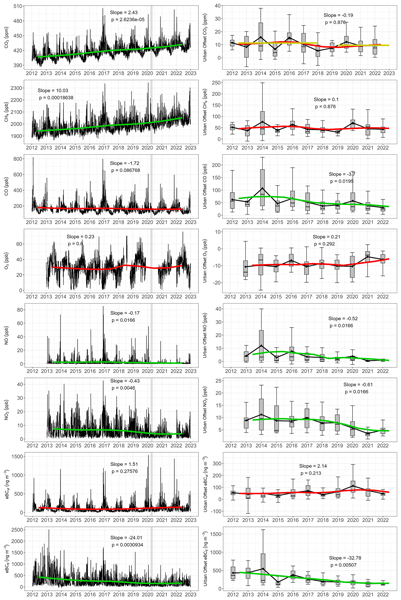
As expected, the monitoring of CO2 and CH4 concentrations at Saclay reflects the overall long term increase in these greenhouse gases observed at all observatories. For CO2, a mean trend of 2.4 ppm yr−1, during the decade 2012–2022, was observed when using all data, representing an increase of 6 % over 10 years. By comparison, the global increase estimated by the National Oceanic and Atmospheric Administration (NOAA) also shows a trend of 2.48 ppm yr−1 between 2012 and 2022. This was calculated from data available on the NOAA site and using the Mann-Kendall method (https://gml.noaa.gov/ccgg/trends/index.html, last access: 17 September 2025). As CO2 data have been available since 2003, the slope calculated using the same method is also significant, with an increase of 2.11 ppm yr−1. By comparison, NOAA data show an increase of 2.27 ppm yr−1 over the same period. For CH4 we observe a mean annual increase of 10.0 ppb yr−1, corresponding to a 5 % rise over the last decade. This trend is also similar to the global value calculated by the NOAA, which recorded an increase of 9.33 ppb yr−1 between 2012 and 2022. Although we do not observe a significant trend for the last decade for CO, it should be noted that CO data have been available since 2003, and a significant trend of −4.26 ppb yr−1 has been calculated when taking into account the whole period (2003–2022). This trend seems consistent with the decrease in anthropogenic emissions over Europe between 2000 and 2017, which is deduced from an inversion of the MOPITT data (Zheng et al., 2019). Concentration of NOx show a decreasing trend (−0.17 and −0.43 ppb yr−1 for NO and NO2 respectively) over the studied period (2013–2022). Satellite observations indicate a decrease of NO2 concentration in cities in developed countries (Erbertseder et al., 2024; Amritha et al., 2024). An overall reduction of NOx emissions by 18 % was also estimated between 2018 and 2023 by a bayesian inversion of TROPOMI NO2 retrievals (Mols et al., 2026). Over the Paris area a decrease of −2 % yr−1 in NO2 levels over the period 1996–2015 was inferred by Erbertseder et al. (2024) and a decrease of 40 % of NO2 has been observed in Paris between 2012 and 2022 (Airparif, 2025). The eBClf presents as well a negative trend, with a decrease of −24 ng m−3 yr−1 for total data. This downward trend in eBClf from liquid fuel combustion, mostly traffic, has been observed during the last decade in several European cities (Savadkoohi et al., 2023). With regard to eBCsf from solid fuel combustion, mainly associated with biomass burning, a slight increase in concentrations has been noted since 2020, which could be driven by an increase in wood-burning emissions due to climate policies and rising energy costs (Savadkoohi et al., 2023). The trend calculated for ozone is not significant, in agreement with the observations and simulations reported in the paper by Ansari et al. (2025) for Western Europe. We note that despite a decrease of its precursors (NOx and VOC), tropospheric ozone is not decreasing.
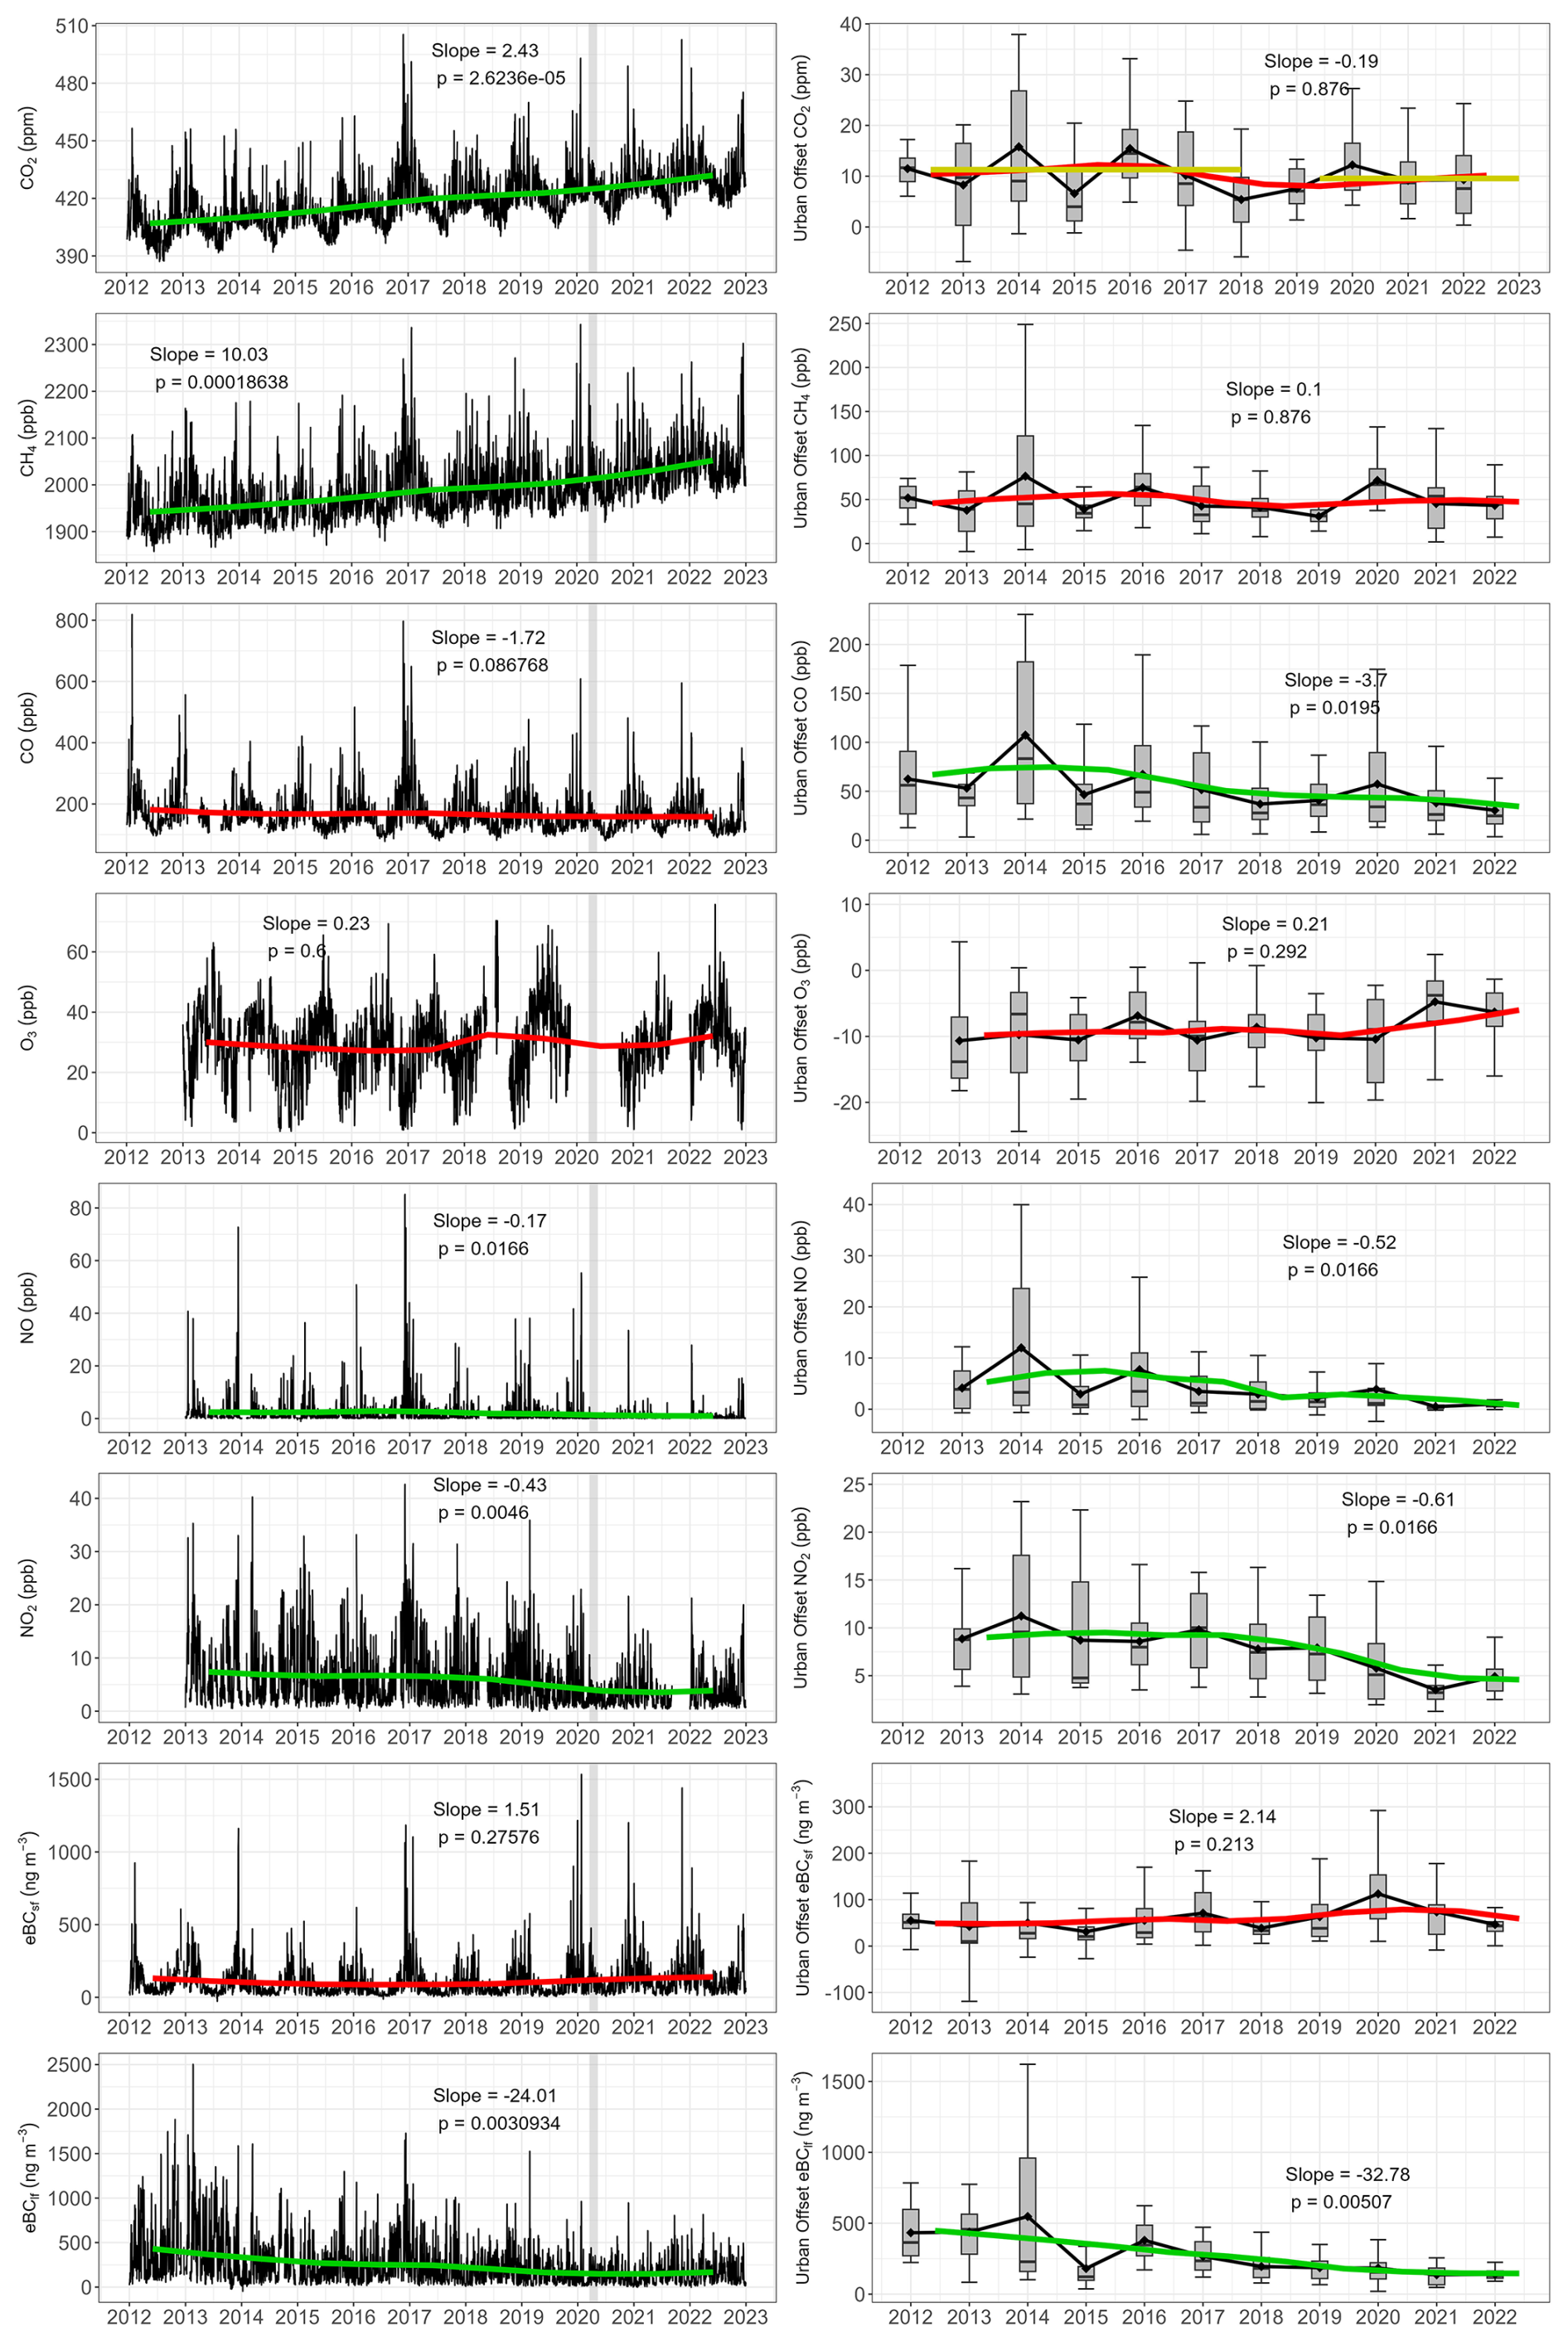
Figure 6Left panels: daily concentrations (black) and trend calculated using the Mann-Kendall method applied to annual means. Right panel: annual means of the urban offset and trends calculated with the same method. Green curves are significant (p< 0.05), and red curves are not significant. The yellow lines for CO2 urban offset represent the mean values calculated between 2012–2017 and 2018–2022. A vertical grey band identifies the period of the first COVID-19 lockdown in Spring 2020.
Table 3Summary of the p-values and the slope of the trends between 2012 and 2022 for all the data and the urban offset. Slopes are not considered significant when p< 0.05.
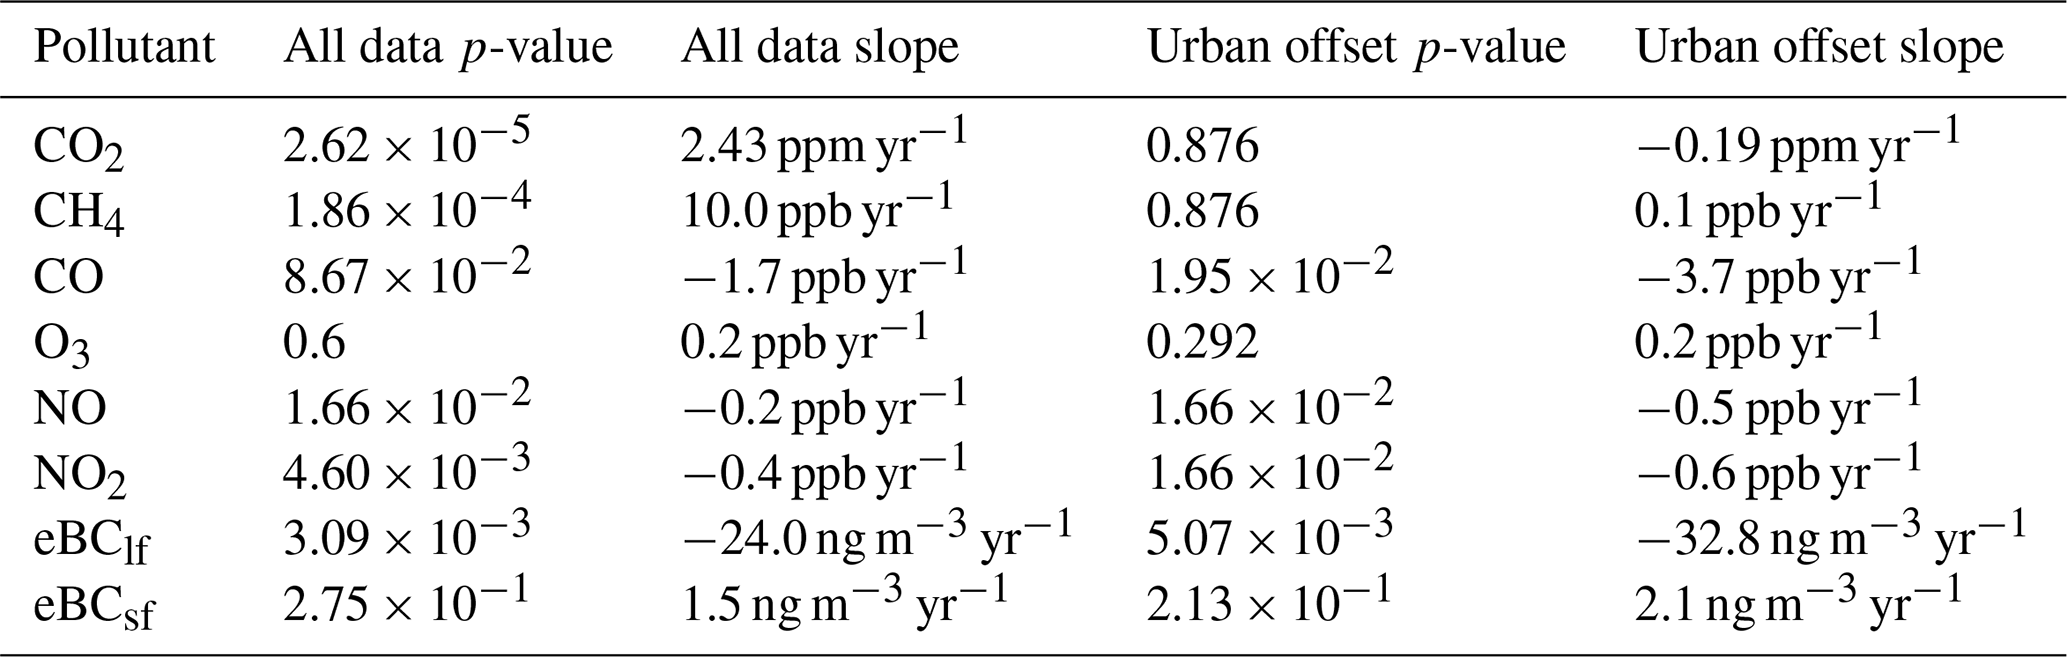
This is due to combined effects of the non-linear chemistry involved in ozone formation, the impact of climate warming and of long-range transport. Concentration trends for long- and medium-lived compounds are representative of a large spatial scale, larger than that of the Paris region. In order to link concentrations time series observed at Saclay to emissions in the Paris region, we also calculated trends in urban offsets. The trend for the urban offset of CO2 is not significant; however, the average concentration decreases over two periods: between 2012 and 2017, the average concentration of urban offset was 11.3 ppm, while between 2019 and 2022, it was 9.6 ppm, which represents a 15 % reduction. These two periods were chosen because there appears to be a break between the average values for these two periods. The urban offset of CO, NOx, and eBClf shows significant negative trends of −3.7 ppb yr−1 for CO, −0.5 ppb yr−1 for NO, −0.6 ppb yr−1 for NO2, and −32.8 ng m−3 yr−1 for eBClf. All those decreasing trends, deduced from the urban offset, and consequently more representative of the Paris region, are higher than the trends calculated directly with all the concentrations. If we compare the average values of offsets over the periods 2012–2017 and 2019–2022, we have decreases of −35.6 %, −52.3 % and −56.7 % for CO, NOx and eBClfrespectively. In contrast, eBCsf indicates a 45.7 % increase. According to Airparif inventories, the emissions of CO and NOx have been reduced respectively by −26 % and −40 % from 2012 to 2021, with a reduction of −50 % of the traffic sector for both gases. We do not have the estimates for black carbon. The urban offset calculated from atmospheric measurements in Saclay indicates a higher decrease than the Airparif emission inventory, but with consistency between CO and NOx. The reduction ratio for these 2 species measured at Saclay is 0.68, close to the ratio of 0.63 for the proportion of traffic in total emissions of these same species (29.4 % for CO, 46.9 % for NOx).
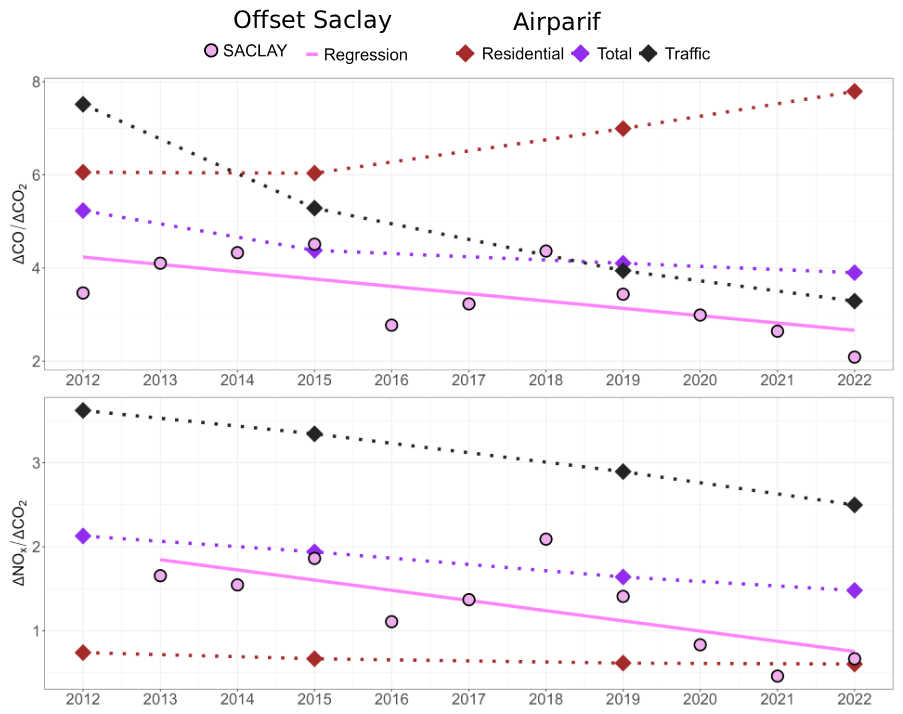
Figure 7Ratio of emissions in IDF (diamond) and concentrations (circles) of CO and CO2 (top), and NOx and CO2 (bottom). NOx and CO (t) and CO2 (kt).
Atmospheric CO2 shares common combustion sources with other compounds like CO, NOx and eBC, so ratios of measured atmospheric concentrations can help characterize combustion-related CO2 emissions (Ammoura et al., 2014; Park et al., 2022). In this study, we compared and NO ratios inferred from atmospheric records to ratios of the same compounds deduced from emission inventories. We have characterized the decadal trends in the ratios between these co-emitted species, as seen from Airparif inventories, and from the measurement of the urban offset of these compounds in Saclay. For the Airparif inventory, we used the 2025 update, which provides emissions estimates for reference years 2012, 2015, 2019, and 2022, based on the 2023 methodology. We analyse the residential and traffic emission sectors, as well as total emissions of CO2 , NOx and CO for the Paris area. As far as atmospheric concentrations are concerned, we take into account the urban offsets calculated as described in Sect. 2.3.
Airparif's inventories, updated every 3 to 5 years, show important decreasing trends of the ratios associated to the traffic sector between 2012 and 2022 (Fig. 7). Thus, the ratios of and NO for traffic-related emissions are declining respectively by 56 % and 31 %. This reduction is mainly due to the renewal of the vehicle fleet with lower emissions vehicles (following improvements in engine combustion efficiency, in line with Euro standards) and, to a lesser extent, to the reduction in traffic volume following the introduction of some circulation restrictions (Airparif, 2025) . For the residential sector, NO ratios decrease by 19 %, while ratios increase by 29 % (Airparif, 2021). In terms of total emissions ratios, this translates into a slight drop of 25 % for and a drop of 31 % for NO , linked almost exclusively to the traffic sector.
Figure 7 shows that atmospheric ratios of the urban offset are lower than the ratio deduced from the inventory, both for and NO ratios. We cannot rule out the possibility that this difference may be partly attributable to inventory errors for one or the other of the compounds. In the absence of information on inventory uncertainties, it is difficult to explore this hypothesis. On the other hand, the fact that CO2 biosphere fluxes are not accounted for in the inventories, but have a significant impact on the atmospheric CO2 concentrations, inevitably plays a role in the lower and NO ratios of the inventory. Regarding the decadal trend, the atmospheric ratios also show a decline between 2012 and 2022, of 39 % for and 47 % for NO. These decreases are more pronounced than in the inventory, but, like the inventory, show higher values for NO than for . For NO ratios, the annual ratios for the urban offset measured at Saclay are higher than the ratio of emissions from the residential sector, but lower than the ratio of total emissions. The atmospheric ratios are close to the total emissions ratio between 2012 and 2018, and after this period, they are very similar to the emissions from the traffic sector.
For the NO ratio, one might expect atmospheric observations to correspond more closely to the emissions ratio from the transport sector. However, part of the differences can also be explained by the fact that the measurements are based on a calculation (urban offset) linked to the station's peri-urban location, rather than on direct measurements right at the location of the emission. In particular, determining a delta value for reactive compounds such as NOx could lead to underestimating the NOx delta between the emission and the background. Indeed, when comparing the NOx delta measured at Saclay with that measured at Airparif stations located in Paris or closer to Paris, we observe a higher value for the NOx delta at these stations. This suggests that such comparisons should favor long-lived compounds such as CO or stations closer to the urban center.
All data used in this article, except for boundary layer height data, are available in the Easy Data catalogue at https://doi.org/10.57932/5c399263-a317-41b7-8900-184b177c4216 (Bouillon and Ramonet, 2025).
This study analyzes ten years of atmospheric CO2 concentrations, co-located with measurements of various gases and aerosols (CH4, CO, O3, NOx, eBClf and eBCsf) at the peri-urban site of SIRTA/Saclay, in the Paris region. Due to the location of the measurement station, 20 km South-West of Paris, we distinguish rural (representative of background air) and urban sectors and calculated the corresponding urban offset in the atmospheric time series observed at Saclay.
The observed time series were interpreted using diurnal cycles by season, as well as seasonal cycles. Both showed a substantial impact of biogenic emissions on CO2. Consequently, the CO2 data appear to be less correlated with the other compounds, mostly emitted by anthropogenic sources, during the summer when biogenic fluxes are at their maximum. In addition, the height of the boundary layer during this period also significantly impacts the concentrations measured for atmospheric pollutants, with the concentrations measured during this period being lower than in winter. The decadal trends for CO2 and CH4 concentrations show similar increases to other monitoring stations worldwide over the same period. In contrast, some compounds (NOx; eBClf) show decreasing trends when all the data are considered. The analysis of the urban offset allows us to focus more on the impact of activities from the Paris region, since we subtract a background signal, which is particularly required for species with a long lifetime. We found significant downward trends for compounds related to emissions from the traffic sector, namely CO, NOx and eBClf. If we compare the urban offset from the 2012–2017 period to the 2019–2022 period, we observe decreases of −35.6 %, −52.3 % and −56.7 % respectively, for CO, NOx and eBClf. For its part, CO2 offset shows a 15 %, comparable to the decrease in anthropogenic CO2 emissions in the Paris region according to Airparif inventories for the same period. Atmospheric CO2 measurements result from the combined contributions of anthropogenic emissions and biospheric fluxes (uptake and respiration). Therefore, a biospheric contribution to this observed signal cannot be completely ruled out. However, CO2 flux measurements by eddy-covariance taken at the Barbeau ICOS site south of Paris, in the Fontainebleau Forest, do not indicate a significant trend over the 2006–2025 period. A significant variation is observed in 2023, but only due to logging within the tower's footprint (https://meta.icos-cp.eu/objects/FRqdGz1Hn6ANHW8o2e_hsv4c (last access: 10 December 2025)).
A comparison of NO and NO ratios with Airparif inventories reveals similar downward trends, more pronounced in atmospheric observations. The atmospheric ratios of and NO deduced from the urban offset are lower than the ratios deduced from the inventory. This underestimation can probably be partially explained by the role of biospheric fluxes that are not taken into account in the inventory. The NO ratio from the Saclay observatory may also be underestimated, as NOx are reactive species that rapidly transform in the atmosphere. Moreover, it is important to note that the species ratios are not constant over time; they evolve with changes in technology, regulations, and fuel composition. Therefore, using NOx or CO as anthropogenic combustion tracers for atmospheric CO2, requires accounting for these long-term trends to ensure an accurate interpretation.
The long-term monitoring at SIRTA/Saclay observatory is performed within the European Research Infrastructures ICOS and ACTRIS framework. It shows the added value of having co-located measurements of greenhouse gases and pollutants, as they share some familiar sources that help to confirm, for example, the role of the traffic sector in the decrease of CO2 offset.
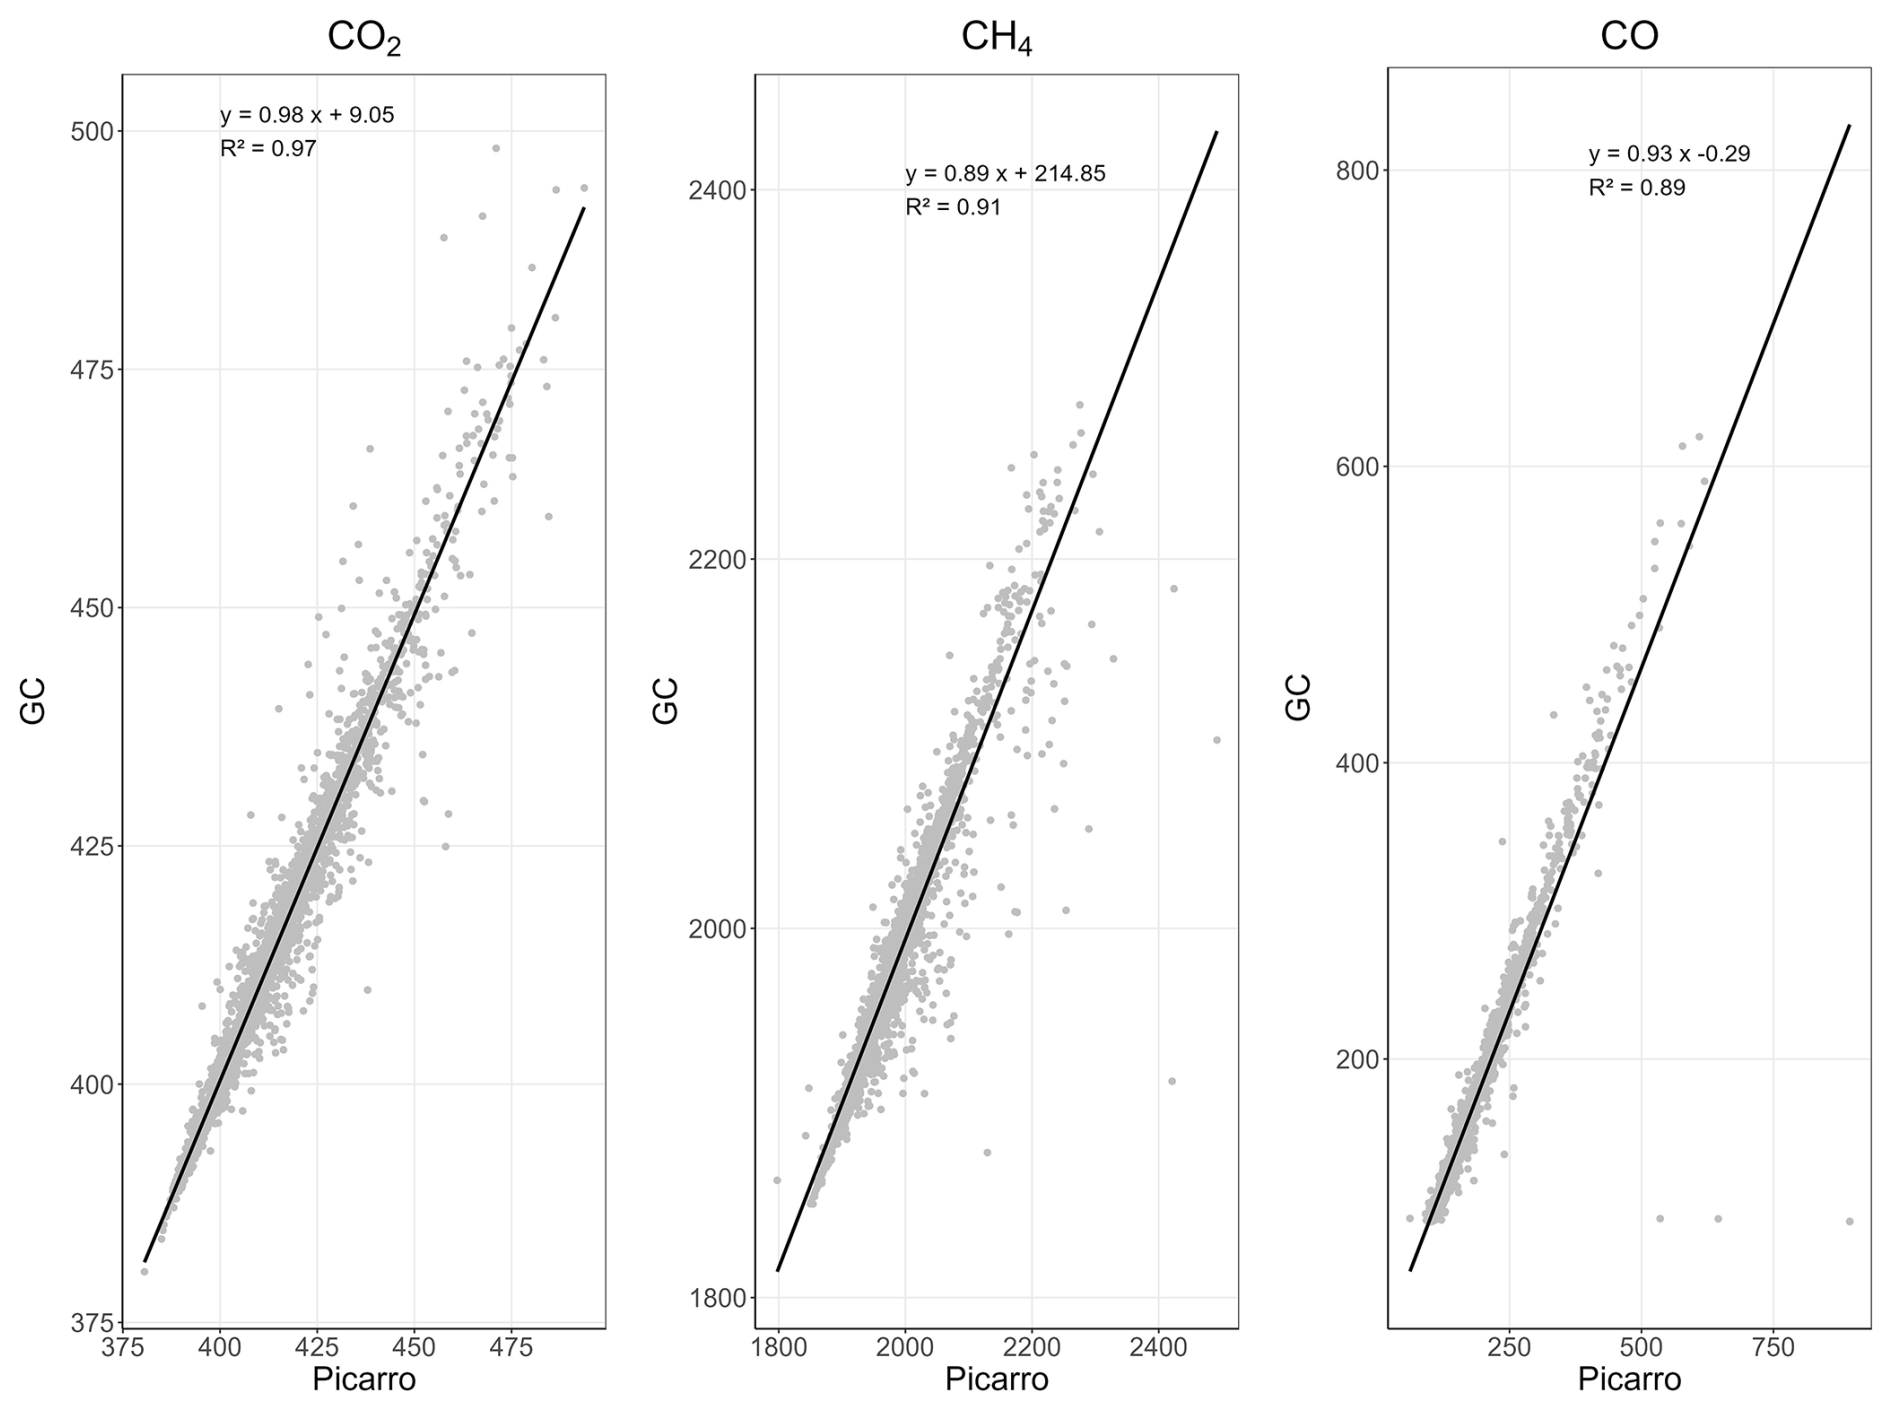
Figure A1Correlation between data measured by the GC located at LSCE and data measured by the Picarro at the Saclay tower at 15 m between 1 January and 31 December 2015.
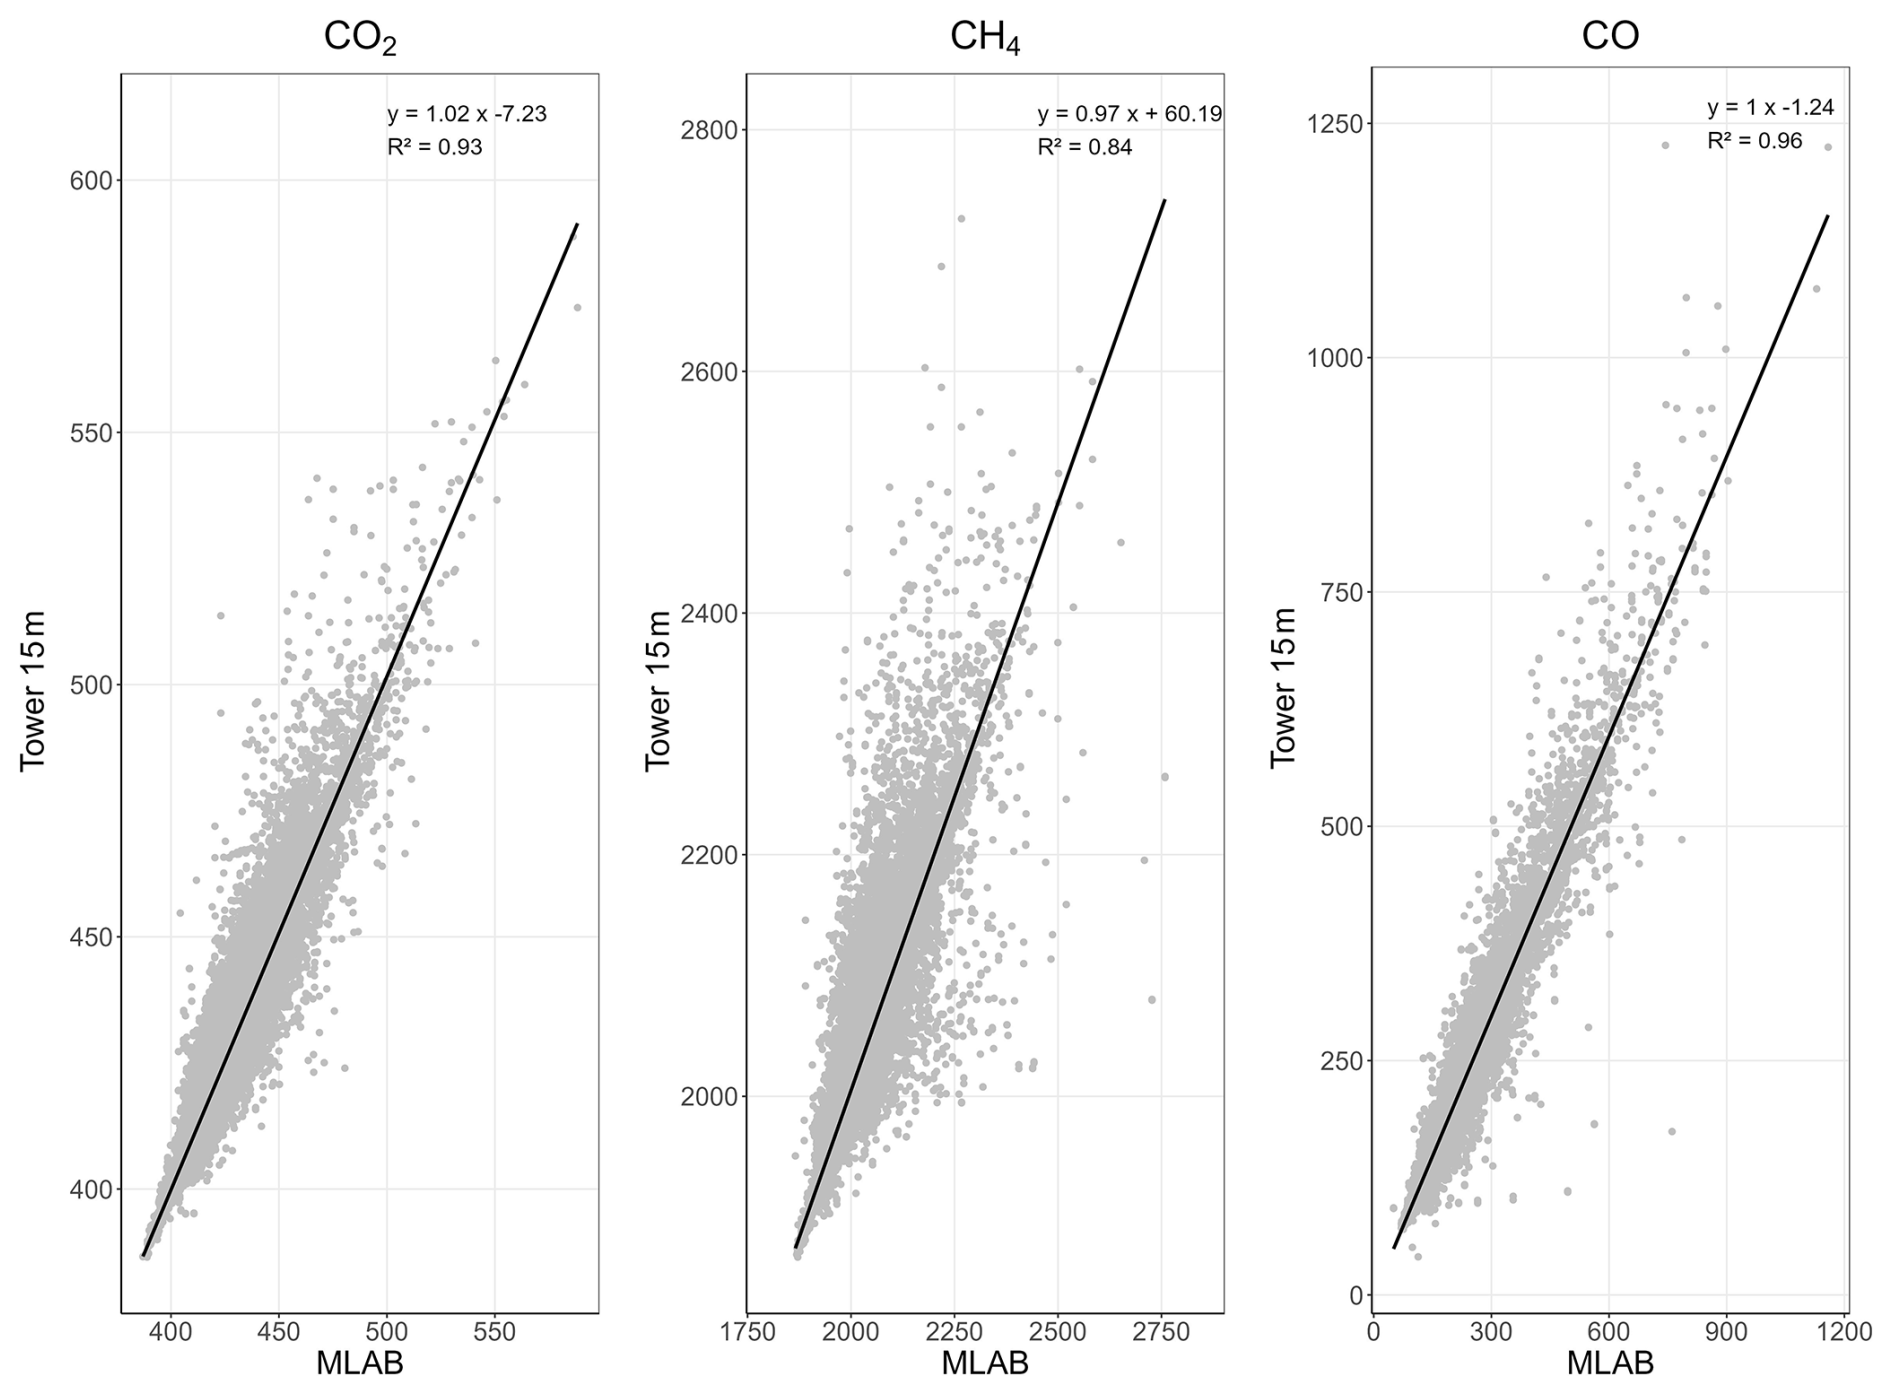
Figure A2Correlation between data measured by the Picarro located at LSCE and data measured by the Picarro at the Saclay tower at 15 m between 1 January 2016 and 31 December 2022.
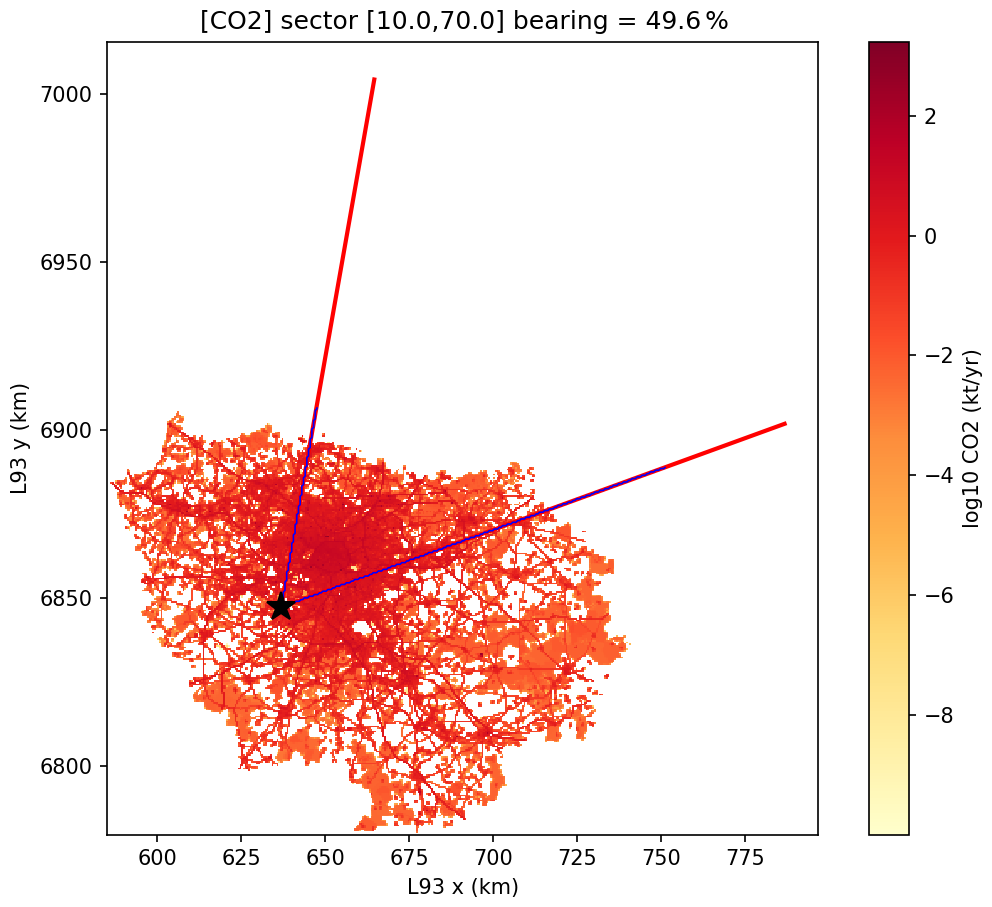
Figure A3Map of anthropogenic CO2 emissions in the Île-de-France region (Airparif, 2024), and the angular sector used to select urban areas.
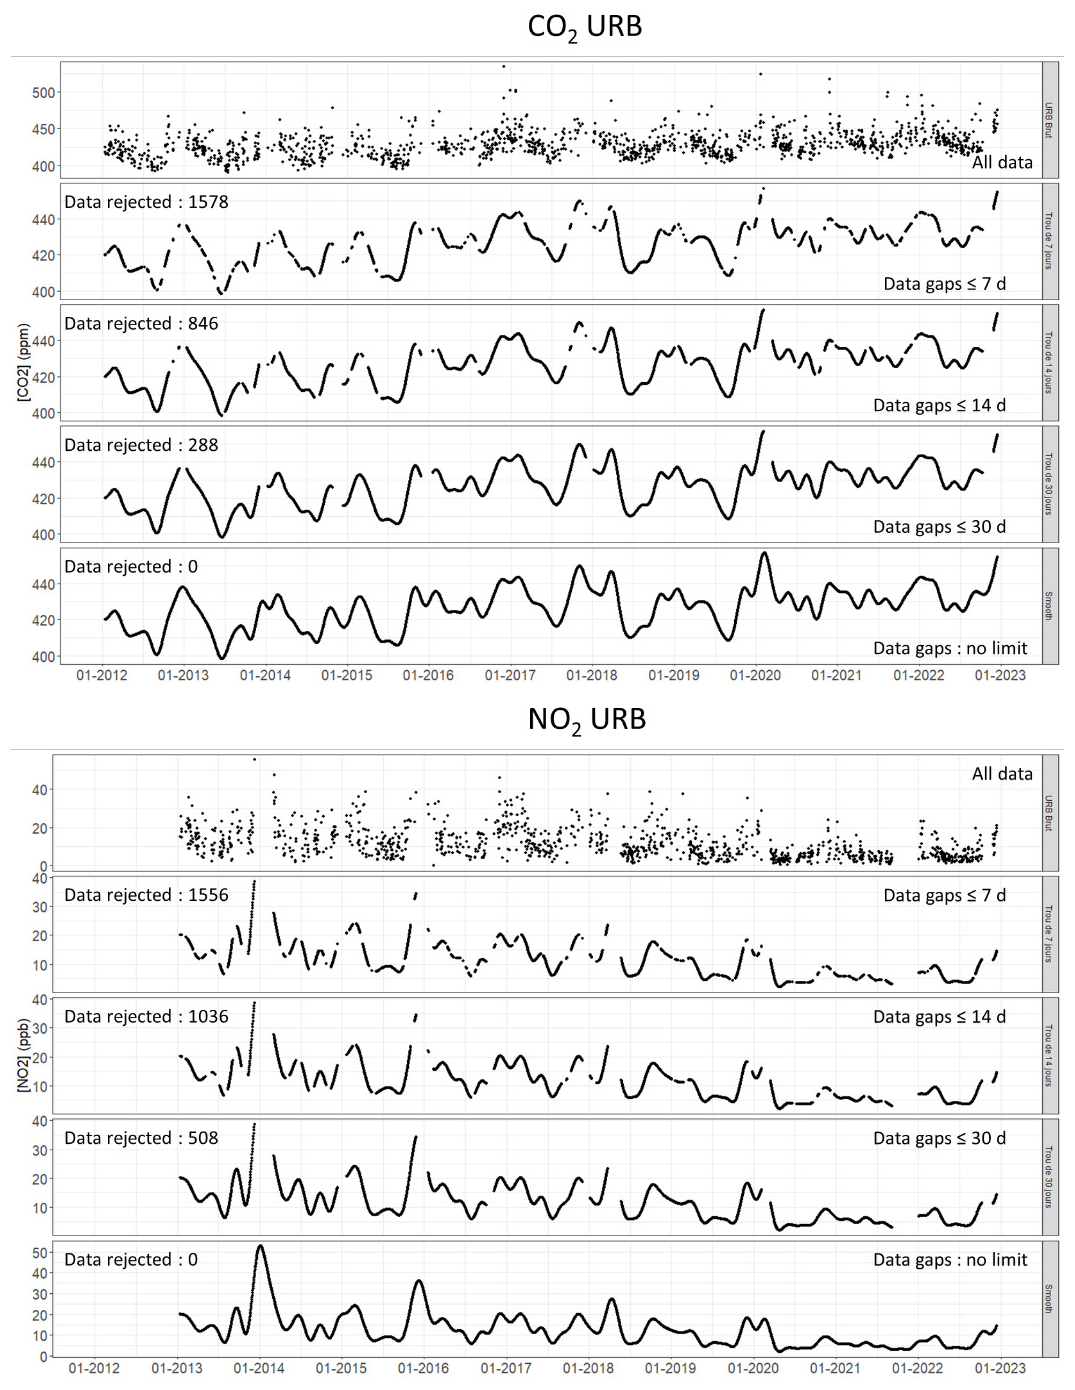
Figure A4Comparison of the fitted curves obtained for NO2 and CO2 in urban sectors, after interpolating all data gaps (lowest panel), or only data gaps less or equal respectively to 30, 14, or 7 d. The total number of days, when interpolating all the data gaps, is 3991 d. The number of days excluded for each case is shown on the left.
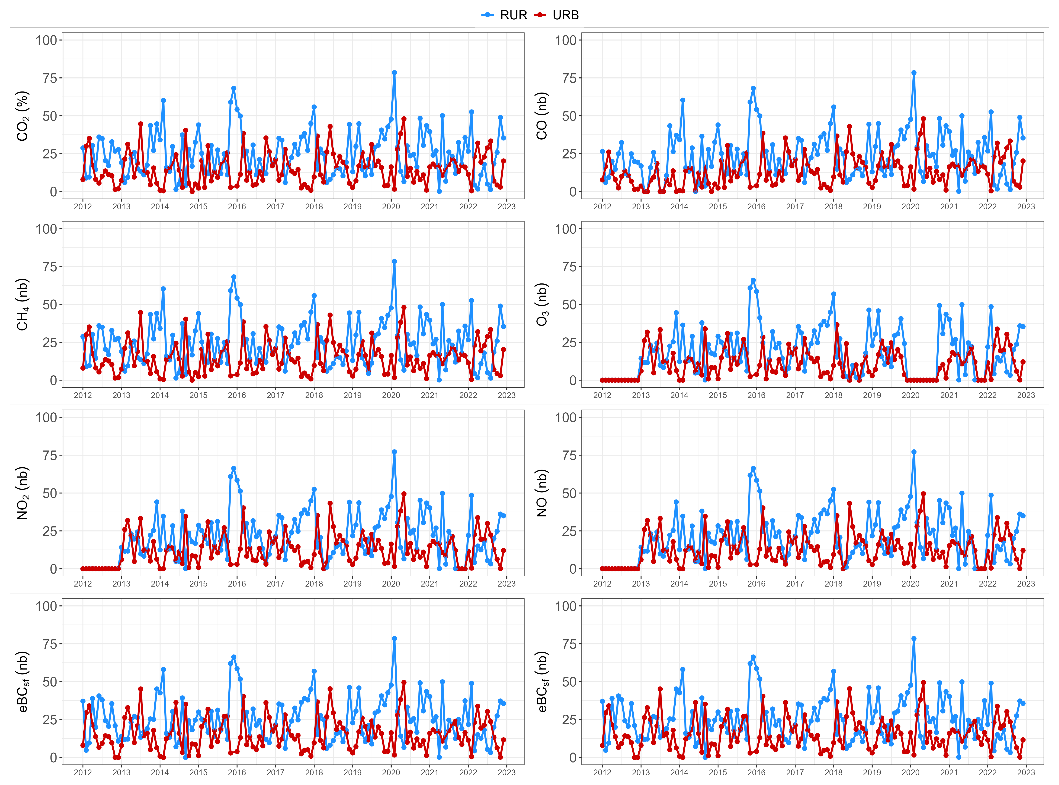
Figure A5Month-by-month percentage of data for different species in rural (blue) and urban (red) sectors.
Methodology, VG and MR; validation, VG and MR; formal analysis, LB; investigation, LB; data curation, CP, CYK, LD, OP, JEP and NB; writing original draft preparation, LB, MR and VG; writing review and editing, all; supervision, VG and MR.
The contact author has declared that none of the authors has any competing interests.
Publisher's note: Copernicus Publications remains neutral with regard to jurisdictional claims made in the text, published maps, institutional affiliations, or any other geographical representation in this paper. The authors bear the ultimate responsibility for providing appropriate place names. Views expressed in the text are those of the authors and do not necessarily reflect the views of the publisher.
The authors would like to thank all persons who initiated/contributed to the measurements and data management at the station, in particular Jean Sciare, Olivier Favez, Vincent Crenn, François Truong, Christophe Boitel, Marc-Antoine Drouin, Martina Schmidt, and the many people from the ICOS-RAMCES and ICOS-ATC teams who maintained the instrumentation at the Saclay tower. We also grateful to Robert Wegener (ACTRIS CIGAS), Véronique Ghersi and Francois Gaie-Levrel (Airparif) for their help.
This work has benefited from the support of the research infrastructures ICOS-FR and ACTRIS-FR, registered on the Roadmap of the French Ministry of Research. This research has been supported by the H2020 PAUL-ICOS Cities project (grant no. 101037319), ACTRIS-2 project (grant no. 654109) and following related projects. The authors also received financial support from CEA, CNRS, UVSQ, and INERIS. This work has also been supported by CNRS-INSU for the measurements performed at the SI-SIRTA and those within the long-term monitoring aerosol program SNO-CLAP, both of which are components of the ACTRIS French Research Instructure and whose data are hosted at the AERIS data center. Greenhouse gases measurements at Saclay were supported by SNO-SIFA, and data are hosted at the ICOS Carbon Portal.
This paper was edited by Guanyu Huang and reviewed by three anonymous referees.
Airparif: Bilan de la qualité de l'air. Année 2020, https://www.airparif.fr/sites/default/files/document_publication/Bilan%202020%20-%20%C3%8Ele-de-France%20-%20partie%201.pdf (last access: 20 October 2026), 2021.
Airparif: Inventaire Air-Climat-Energie: Bilan Paris année 2021, https://www.airparif.fr/sites/default/files/document_publication/bilan_emissions_Paris_2021.pdf (last access: 20 October 2026), 2024.
Airparif: Amélioration de la qualité de l'air à Paris: les facteurs explicatifs. Analyse des évolutions entre 2012 et 2022, https://www.airparif.fr/sites/default/files/document_publication/Rapport%20d%27%C3%A9tude%20Paris%202012-2022_vf_20250825_v2.pdf (last access: 20 October 2026), 2025.
Ammoura, L., Xueref-Remy, I., Gros, V., Baudic, A., Bonsang, B., Petit, J.-E., Perrussel, O., Bonnaire, N., Sciare, J., and Chevallier, F.: Atmospheric measurements of ratios between CO2 and co-emitted species from traffic: a tunnel study in the Paris megacity, Atmos. Chem. Phys., 14, 12871–12882, https://doi.org/10.5194/acp-14-12871-2014, 2014.
Amritha, S., Varikoden, H., Patel, V. K., Kuttippurath, J., and Gopikrishnan, G. S.: Global, regional and city scale changes in atmospheric NO2 with environmental laws and policies, Sustain. Cities Soc., 112, 105617, https://doi.org/10.1016/j.scs.2024.105617, 2024.
Ansari, T., Nalam, A., Lupaşcu, A., Hinz, C., Grasse, S., and Butler, T.: Explaining trends and changing seasonal cycles of surface ozone in North America and Europe over the 2000–2018 period: a global modelling study with NOx and VOC tagging, Atmos. Chem. Phys., 25, 16833–16876, https://doi.org/10.5194/acp-25-16833-2025, 2025.
Bezyk, Y., Górka, M., Sówka, I., Nęcki, J., and Strąpoć, D.: Temporal dynamics and controlling factors of CO2 and CH4 variability in the urban atmosphere of Wroclaw, Poland, Sci. Total Environ., 893, 164771, https://doi.org/10.1016/j.scitotenv.2023.164771, 2023.
Bouillon, L. and Ramonet, M.: Ten years of measurements (2012–2022) of the atmospheric composition at Saclay/SIRTA Observatory in the Ile de France Region as part of ICOS and ACTRIS, Data Terra [data set], https://doi.org/10.57932/5c399263-a317-41b7-8900-184b177c4216, 2025.
Bréon, F. M., Broquet, G., Puygrenier, V., Chevallier, F., Xueref-Remy, I., Ramonet, M., Dieudonné, E., Lopez, M., Schmidt, M., Perrussel, O., and Ciais, P.: An attempt at estimating Paris area CO2 emissions from atmospheric concentration measurements, Atmos. Chem. Phys., 15, 1707–1724, https://doi.org/10.5194/acp-15-1707-2015, 2015.
Drinovec, L., Močnik, G., Zotter, P., Prévôt, A. S. H., Ruckstuhl, C., Coz, E., Rupakheti, M., Sciare, J., Müller, T., Wiedensohler, A., and Hansen, A. D. A.: The “dual-spot” Aethalometer: an improved measurement of aerosol black carbon with real-time loading compensation, Atmos. Meas. Tech., 8, 1965–1979, https://doi.org/10.5194/amt-8-1965-2015, 2015.
Erbertseder, T., Taubenböck, H., Esch, T., Gilardi, L., Paeth, H., and Dech, S.: NO2 Air Pollution Trends and Settlement Growth in Megacities, IEEE J. Sel. Top. Appl., 17, 12058–12076, https://doi.org/10.1109/JSTARS.2024.3419573, 2024.
Favez, O., El Haddad, I., Piot, C., Boréave, A., Abidi, E., Marchand, N., Jaffrezo, J.-L., Besombes, J.-L., Personnaz, M.-B., Sciare, J., Wortham, H., George, C., and D'Anna, B.: Inter-comparison of source apportionment models for the estimation of wood burning aerosols during wintertime in an Alpine city (Grenoble, France), Atmos. Chem. Phys., 10, 5295–5314, https://doi.org/10.5194/acp-10-5295-2010, 2010.
Foskinis, R., Gini, M. I., Kokkalis, P., Diapouli, E., Vratolis, S., Granakis, K., Zografou, O., Komppula, M., Vakkari, V., Nenes, A., Papayannis, A., and Eleftheriadis, K.: On the relation between the planetary boundary layer height and in situ surface observations of atmospheric aerosol pollutants during spring in an urban area, Atmos. Res., 308, 107543, https://doi.org/10.1016/j.atmosres.2024.107543, 2024.
Friedlingstein, P., O'Sullivan, M., Jones, M. W., Andrew, R. M., Bakker, D. C. E., Hauck, J., Landschützer, P., Le Quéré, C., Luijkx, I. T., Peters, G. P., Peters, W., Pongratz, J., Schwingshackl, C., Sitch, S., Canadell, J. G., Ciais, P., Jackson, R. B., Alin, S. R., Anthoni, P., Barbero, L., Bates, N. R., Becker, M., Bellouin, N., Decharme, B., Bopp, L., Brasika, I. B. M., Cadule, P., Chamberlain, M. A., Chandra, N., Chau, T.-T.-T., Chevallier, F., Chini, L. P., Cronin, M., Dou, X., Enyo, K., Evans, W., Falk, S., Feely, R. A., Feng, L., Ford, D. J., Gasser, T., Ghattas, J., Gkritzalis, T., Grassi, G., Gregor, L., Gruber, N., Gürses, Ö., Harris, I., Hefner, M., Heinke, J., Houghton, R. A., Hurtt, G. C., Iida, Y., Ilyina, T., Jacobson, A. R., Jain, A., Jarníková, T., Jersild, A., Jiang, F., Jin, Z., Joos, F., Kato, E., Keeling, R. F., Kennedy, D., Klein Goldewijk, K., Knauer, J., Korsbakken, J. I., Körtzinger, A., Lan, X., Lefèvre, N., Li, H., Liu, J., Liu, Z., Ma, L., Marland, G., Mayot, N., McGuire, P. C., McKinley, G. A., Meyer, G., Morgan, E. J., Munro, D. R., Nakaoka, S.-I., Niwa, Y., O'Brien, K. M., Olsen, A., Omar, A. M., Ono, T., Paulsen, M., Pierrot, D., Pocock, K., Poulter, B., Powis, C. M., Rehder, G., Resplandy, L., Robertson, E., Rödenbeck, C., Rosan, T. M., Schwinger, J., Séférian, R., Smallman, T. L., Smith, S. M., Sospedra-Alfonso, R., Sun, Q., Sutton, A. J., Sweeney, C., Takao, S., Tans, P. P., Tian, H., Tilbrook, B., Tsujino, H., Tubiello, F., van der Werf, G. R., van Ooijen, E., Wanninkhof, R., Watanabe, M., Wimart-Rousseau, C., Yang, D., Yang, X., Yuan, W., Yue, X., Zaehle, S., Zeng, J., and Zheng, B.: Global Carbon Budget 2023, Earth Syst. Sci. Data, 15, 5301–5369, https://doi.org/10.5194/essd-15-5301-2023, 2023.
Haeffelin, M., Barthès, L., Bock, O., Boitel, C., Bony, S., Bouniol, D., Chepfer, H., Chiriaco, M., Cuesta, J., Delanoë, J., Drobinski, P., Dufresne, J.-L., Flamant, C., Grall, M., Hodzic, A., Hourdin, F., Lapouge, F., Lemaître, Y., Mathieu, A., Morille, Y., Naud, C., Noël, V., O'Hirok, W., Pelon, J., Pietras, C., Protat, A., Romand, B., Scialom, G., and Vautard, R.: SIRTA, a ground-based atmospheric observatory for cloud and aerosol research, Ann. Geophys., 23, 253–275, https://doi.org/10.5194/angeo-23-253-2005, 2005.
ICOS-RI: ICOS Atmosphere Station Specifications V2.0, ICOS-ERIC, https://doi.org/10.18160/GK28-2188, 2020.
IPCC: Climate Change 2022: Impacts, Adaptation, and Vulnerability. Contribution of Working Group II to the Sixth Assessment Report of the Intergovernmental Panel on Climate Change, https://doi.org/10.1017/9781009325844, 2022.
Janssen, N. A., Hoek, G., Simic-Lawson, M., Fischer, P., van Bree, L., ten Brink, H., Keuken, M., Atkinson, R. W., Anderson, H. R., Brunekreef, B., and Cassee, F. R.: Black carbon as an additional indicator of the adverse health effects of airborne particles compared with PM10 and PM2.5, Environ. Health Persp., 119, 1691–1699, https://doi.org/10.1289/ehp.1003369, 2011.
Ke, P., Olascoaga, B., Kolari, P., Tahvonen, O., Haapanala, S., Kokkonen, T., Järvi, L., Kulmala, M., and Lintunen, A.: High respiration rates induce net CO2 emissions in an urban allotment garden in Finland, Urban For. Urban Gree., 112, 128945, https://doi.org/10.1016/j.ufug.2025.128945, 2025.
Kotthaus, S., Bravo-Aranda, J. A., Collaud Coen, M., Guerrero-Rascado, J. L., Costa, M. J., Cimini, D., O'Connor, E. J., Hervo, M., Alados-Arboledas, L., Jiménez-Portaz, M., Mona, L., Ruffieux, D., Illingworth, A., and Haeffelin, M.: Atmospheric boundary layer height from ground-based remote sensing: a review of capabilities and limitations, Atmos. Meas. Tech., 16, 433–479, https://doi.org/10.5194/amt-16-433-2023, 2023.
Lange, K., Richter, A., and Burrows, J. P.: Variability of nitrogen oxide emission fluxes and lifetimes estimated from Sentinel-5P TROPOMI observations, Atmos. Chem. Phys., 22, 2745–2767, https://doi.org/10.5194/acp-22-2745-2022, 2022.
Levin, I., Hammer, S., Eichelmann, E., and Vogel, F. R.: Verification of greenhouse gas emission reductions: the prospect of atmospheric monitoring in polluted areas, Philos. T. R. Soc. A., 369, 1906–1924, https://doi.org/10.1098/rsta.2010.0249, 2011.
Liu, Z., Liu, Z., Song, T., Gao, W., Wang, Y., Wang, L., Hu, B., Xin, J., and Wang, Y.: Long-term variation in CO2 emissions with implications for the interannual trend in PM2.5 over the last decade in Beijing, China, Environ. Pollut., 266, 115014, https://doi.org/10.1016/j.envpol.2020.115014, 2020.
Mols, A., Boersma, K. F., Denier van der Gon, H., and Krol, M.: An improved Bayesian inversion to estimate daily NOx emissions of Paris from TROPOMI NO2 observations between 2018–2023, Atmos. Chem. Phys., 26, 1497–1513, https://doi.org/10.5194/acp-26-1497-2026, 2026.
Monks, P. S., Archibald, A. T., Colette, A., Cooper, O., Coyle, M., Derwent, R., Fowler, D., Granier, C., Law, K. S., Mills, G. E., Stevenson, D. S., Tarasova, O., Thouret, V., von Schneidemesser, E., Sommariva, R., Wild, O., and Williams, M. L.: Tropospheric ozone and its precursors from the urban to the global scale from air quality to short-lived climate forcer, Atmos. Chem. Phys., 15, 8889–8973, https://doi.org/10.5194/acp-15-8889-2015, 2015.
Mukim, M.: Thriving: Making Cities Green, Resilient, and Inclusive in a Changing Climate, © World Bank, https://doi.org/10.1596/978-1-4648-1935-3, 2023.
Murthy, B. S., Latha, R., Tiwari, A., Rathod, A., Singh, S., and Beig, G.: Impact of mixing layer height on air quality in winter, J. Atmos. Sol.-Terr. Phy., 197, 105157, https://doi.org/10.1016/j.jastp.2019.105157, 2020.
Navarro-Barboza, H., Pandolfi, M., Guevara, M., Enciso, S., Tena, C., Via, M., Yus-Díez, J., Reche, C., Pérez, N., Alastuey, A., Querol, X., and Jorba, O.: Uncertainties in source allocation of carbonaceous aerosols in a Mediterranean region, Environ. Int., 183, 108252, https://doi.org/10.1016/j.envint.2023.108252, 2024.
Park, J., Kim, D., and Lee, Y.: Experimental study on flameless combustion and NO emission with hydrogen-containing fuels, Int. J. Energ. Res., 46, 2512–2528, https://doi.org/10.1002/er.7324, 2022.
Petit, J.-E., Dupont, J.-C., Favez, O., Gros, V., Zhang, Y., Sciare, J., Simon, L., Truong, F., Bonnaire, N., Amodeo, T., Vautard, R., and Haeffelin, M.: Response of atmospheric composition to COVID-19 lockdown measures during spring in the Paris region (France), Atmos. Chem. Phys., 21, 17167–17183, https://doi.org/10.5194/acp-21-17167-2021, 2021.
Sandradewi, J., Prévôt, A. S. H., Szidat, S., Perron, N., Alfarra, M. R., Lanz, V. A., Weingartner, E., and Baltensperger, U.: Using Aerosol Light Absorption Measurements for the Quantitative Determination of Wood Burning and Traffic Emission Contributions to Particulate Matter, Environ. Sci. Technol., 42, 3316–3323, https://doi.org/10.1021/es702253m, 2008.
Savadkoohi, M., Pandolfi, M., Reche, C., Niemi, J. V., Mooibroek, D., Titos, G., Green, D. C., Tremper, A. H., Hueglin, C., Liakakou, E., Mihalopoulos, N., Stavroulas, I., Artiñano, B., Coz, E., Alados-Arboledas, L., Beddows, D., Riffault, V., De Brito, J. F., Bastian, S., Baudic, A., Colombi, C., Costabile, F., Chazeau, B., Marchand, N., Gómez-Amo, J. L., Estellés, V., Matos, V., van der Gaag, E., Gille, G., Luoma, K., Manninen, H. E., Norman, M., Silvergren, S., Petit, J.-E., Putaud, J.-P., Rattigan, O. V., Timonen, H., Tuch, T., Merkel, M., Weinhold, K., Vratolis, S., Vasilescu, J., Favez, O., Harrison, R. M., Laj, P., Wiedensohler, A., Hopke, P. K., Petäjä, T., Alastuey, A., and Querol, X.: The variability of mass concentrations and source apportionment analysis of equivalent black carbon across urban Europe, Environ. Int., 178, 108081, https://doi.org/10.1016/j.envint.2023.108081, 2023.
Savadkoohi, M., Pandolfi, M., Favez, O., Putaud, J.-P., Eleftheriadis, K., Fiebig, M., Hopke, P. K., Laj, P., Wiedensohler, A., Alados-Arboledas, L., Bastian, S., Chazeau, B., María, Á. C., Colombi, C., Costabile, F., Green, D. C., Hueglin, C., Liakakou, E., Luoma, K., Listrani, S., Mihalopoulos, N., Marchand, N., Močnik, G., Niemi, J. V., Ondráček, J., Petit, J.-E., Rattigan, O. V., Reche, C., Timonen, H., Titos, G., Tremper, A. H., Vratolis, S., Vodička, P., Funes, E. Y., Zíková, N., Harrison, R. M., Petäjä, T., Alastuey, A., and Querol, X.: Recommendations for reporting equivalent black carbon (eBC) mass concentrations based on long-term pan-European in-situ observations, Environ. Int., 185, 108553, https://doi.org/10.1016/j.envint.2024.108553, 2024.
Savadkoohi, M., Gherras, M., Favez, O., Petit, J.-E., Rovira, J., Chen, G. I., Via, M., Platt, S., Aurela, M., Chazeau, B., de Brito, J. F., Riffault, V., Eleftheriadis, K., Flentje, H., Gysel-Beer, M., Hueglin, C., Rigler, M., Gregorič, A., Ivančič, M., Keernik, H., Maasikmets, M., Liakakou, E., Stavroulas, I., Luoma, K., Marchand, N., Mihalopoulos, N., Petäjä, T., Prevot, A. S. H., Daellenbach, K. R., Vodička, P., Timonen, H., Tobler, A., Vasilescu, J., Dandocsi, A., Mbengue, S., Vratolis, S., Zografou, O., Chauvigné, A., Hopke, P. K., Querol, X., Alastuey, A., and Pandolfi, M.: Addressing the advantages and limitations of using Aethalometer data to determine the optimal absorption Ångström exponents (AAEs) values for eBC source apportionment, Atmos. Environ., 349, 121121, https://doi.org/10.1016/j.atmosenv.2025.121121, 2025.
Schmidt, M., Lopez, M., Yver Kwok, C., Messager, C., Ramonet, M., Wastine, B., Vuillemin, C., Truong, F., Gal, B., Parmentier, E., Cloué, O., and Ciais, P.: High-precision quasi-continuous atmospheric greenhouse gas measurements at Trainou tower (Orléans forest, France), Atmos. Meas. Tech., 7, 2283–2296, https://doi.org/10.5194/amt-7-2283-2014, 2014.
Schmutz, M., Vogt, R., Feigenwinter, C., and Parlow, E.: Ten years of eddy covariance measurements in Basel, Switzerland: Seasonal and interannual variabilities of urban CO2 mole fraction and flux, J. Geophys. Res.-Atmos., 121, 8649–8667, https://doi.org/10.1002/2016JD025063, 2016.
Schultz, M. G., Schröder, S., Lyapina, O., Cooper, O. R., Galbally, I., Petropavlovskikh, I., von Schneidemesser, E., Tanimoto, H., Elshorbany, Y., Naja, M., Seguel, R. J., Dauert, U., Eckhardt, P., Feigenspan, S., Fiebig, M., Hjellbrekke, A.-G., Hong, Y.-D., Kjeld, P. C., Koide, H., Lear, G., Tarasick, D., Ueno, M., Wallasch, M., Baumgardner, D., Chuang, M.-T., Gillett, R., Lee, M., Molloy, S., Moolla, R., Wang, T., Sharps, K., Adame, J. A., Ancellet, G., Apadula, F., Artaxo, P., Barlasina, M. E., Bogucka, M., Bonasoni, P., Chang, L., Colomb, A., Cuevas-Agulló, E., Cupeiro, M., Degorska, A., Ding, A., Fröhlich, M., Frolova, M., Gadhavi, H., Gheusi, F., Gilge, S., Gonzalez, M. Y., Gros, V., Hamad, S. H., Helmig, D., Henriques, D., Hermansen, O., Holla, R., Hueber, J., Im, U., Jaffe, D. A., Komala, N., Kubistin, D., Lam, K.-S., Laurila, T., Lee, H., Levy, I., Mazzoleni, C., Mazzoleni, L. R., McClure-Begley, A., Mohamad, M., Murovec, M., Navarro-Comas, M., Nicodim, F., Parrish, D., Read, K. A., Reid, N., Ries, L., Saxena, P., Schwab, J. J., Scorgie, Y., Senik, I., Simmonds, P., Sinha, V., Skorokhod, A. I., Spain, G., Spangl, W., Spoor, R., Springston, S. R., Steer, K., Steinbacher, M., Suharguniyawan, E., Torre, P., Trickl, T., Weili, L., Weller, R., Xiaobin, X., Xue, L., and Zhiqiang, M.: Tropospheric Ozone Assessment Report: Database and metrics data of global surface ozone observations, Elementa: Science of the Anthropocene, 5, 58, https://doi.org/10.1525/elementa.244, 2017.
Sreenivas, G., Mahesh, P., Subin, J., Kanchana, A. L., Rao, P. V. N., and Dadhwal, V. K.: Influence of Meteorology and interrelationship with greenhouse gases (CO2 and CH4) at a suburban site of India, Atmos. Chem. Phys., 16, 3953–3967, https://doi.org/10.5194/acp-16-3953-2016, 2016.
Sreenivas, G., Mahesh, P., Mahalakshmi, D. V., Kanchana, A. L., Chandra, N., Patra, P. K., Raja, P., Sesha Sai, M. V. R., Sripada, S., Rao, P. V. N., and Dadhwal, V. K.: Seasonal and annual variations of CO2 and CH4 at Shadnagar, a semi-urban site, Sci. Total Environ., 819, 153114, https://doi.org/10.1016/j.scitotenv.2022.153114, 2022.
Thoning, K. W., Tans, P. P., and Komhyr, W. D.: Atmospheric carbon dioxide at Mauna Loa Observatory, 2, Analysis of the NOAA GMCC data, 1974, 1985, J. Geophys. Res., 94, 8549–8565, 1989.
United Nations: World Urbanization Prospects 2018: Highlights, ISBN 978-921-004313-7, 2019.
Watts, J. D., Natali, S. M., Minions, C., Risk, D., Arndt, K., Zona, D., Euskirchen, E. S., Rocha, A. V., Sonnentag, O., Helbig, M., Kalhori, A., Oechel, W., Ikawa, H., Ueyama, M., Suzuki, R., Kobayashi, H., Celis, G., Schuur, E. A. G., Humphreys, E., Kim, Y., Lee, B.-Y., Goetz, S., Madani, N., Schiferl, L. D., Commane, R., Kimball, J. S., Liu, Z., Torn, M. S., Potter, S., Wang, J. A., Jorgenson, M. T., Xiao, J., Li, X., and Edgar, C.: Soil respiration strongly offsets carbon uptake in Alaska and Northwest Canada, Environ. Res. Lett., 16, 084051, https://doi.org/10.1088/1748-9326/ac1222, 2021.
Weingartner, E., Saathoff, H., Schnaiter, M., Streit, N., Bitnar, B., and Baltensperger, U.: Absorption of light by soot particles: determination of the absorption coefficient by means of aethalometers, J. Aerosol Sci., 34, 1445–1463, https://doi.org/10.1016/S0021-8502(03)00359-8, 2003.
Worthy, D. E. J., Levin, I., Trivett, N. B. A., Kuhlmann, A. J., Hopper, J. F., and Ernst, M. K.: Seven years of continuous methane observations at a remote boreal site in Ontario, Canada, J. Geophys. Res.-Atmos., 103, 15995–16007, https://doi.org/10.1029/98JD00925, 1998.
Yver, C., Schmidt, M., Bousquet, P., Zahorowski, W., and Ramonet, M.: Estimation of the molecular hydrogen soil uptake and traffic emissions at a suburban site near Paris through hydrogen, carbon monoxide, and radon-222 semicontinuous measurements, J. Geophys. Res., 114, https://doi.org/10.1029/2009jd012122, 2009.
Zheng, B., Chevallier, F., Yin, Y., Ciais, P., Fortems-Cheiney, A., Deeter, M. N., Parker, R. J., Wang, Y., Worden, H. M., and Zhao, Y.: Global atmospheric carbon monoxide budget 2000–2017 inferred from multi-species atmospheric inversions, Earth Syst. Sci. Data, 11, 1411–1436, https://doi.org/10.5194/essd-11-1411-2019, 2019.