the Creative Commons Attribution 4.0 License.
the Creative Commons Attribution 4.0 License.
 | 04 Sep 2026
A Global Surface Turbulence Heat Flux Dataset resolving tropical cyclones
Weixiang Peng
Zhanhong Ma

Deyuan Zhang
Hexin Ye
Jianfang Fei
The Global Surface Turbulence Heat Flux Dataset (GHFD) presents a dataset of surface latent heat flux and sensible heat flux, at spatial resolutions of 0.25° × 0.25° and available daily from 1993 to 2023. The GHFD is generated using the IBTrACS, OISST, CCMP, Copernicus Marine, and ERA5 datasets, with the wind speed field adjusted to incorporate tropical cyclone (TC) information and using the COARE 3.6 algorithm to conduct the heat flux calculations. The GHFD includes seven meteorological elements at the air-sea interface, including surface latent and sensible heat flux, 2 m specific humidity, sea surface temperature, 2 m air temperature, sea surface salinity and 10 m wind speed. A comparison between GHFD and various flux products (J-OFURO 3, OAFlux, ifremerflux) in terms of the fundamental components is conducted with moored observation data, in-situ observation data, and high-resolution simulation data. Results show an improvement of GHFD compared to the other three flux products in resolving TCs. The GHFD dataset in NetCDF format is freely available for download at https://doi.org/10.57760/sciencedb.24400 (Peng et al., 2025).
- Article
(4307 KB) - Full-text XML
-
Supplement
(1910 KB) - BibTeX
- EndNote


Surface turbulence heat flux, in terms of surface latent and sensible heat flux, characterizes the air-sea heat and moisture transport between the atmosphere and ocean (Bourassa et al., 2010; Ma et al., 2015; Roberts et al., 2012). The magnitudes of surface turbulence heat flux are thus central to the energy budget of the Earth system as well as global climate changes (Chou et al., 2003). Tropical cyclones are among the most drastic weather systems that extract large amounts of latent and sensible heat from the ocean into the atmosphere, and disperse it into higher-latitude regions or the land (Mei et al., 2013; Trenberth and Fasullo, 2007). The energy input from the ocean in terms of surface latent and sensible heat flux is the primary energy source of the TC system (Mei et al., 2013; Trenberth and Fasullo, 2007). For the Earth system, the flux transport under TCs is an important component of the global energy cycle (Emanuel, 2001). Thus, accurate knowledge of air-sea flux is crucial for understanding not only TCs themselves but also for global energy transport. Several heat flux products have been constructed in previous work. They mainly come from three sources: numerical weather prediction (NWP) models, voluntary observing ships (VOSs), and remotely sensed data (Bentamy et al., 2013; Yu et al., 2004). These methods represent a significant improvement over the previous decades through improving heat flux accuracy by optimizing inversion algorithms, assimilating various types of data, or optimizing flux calculation algorithms. Following are some representative datasets: the Japanese Ocean Fluxes data sets with the Use of Remote sensing Observations (J-OFURO 3) (Tomita et al., 2019), the Objectively Analysed Air-Sea Fluxes (OAFlux) (Yu and Weller, 2007), the Institute Français pour la Recherche et l'Exploitation de la Mer (ifremer) (Bentamy et al., 2017; Bentamy et al., 2017), the Hamburg Ocean Atmosphere Parameters and Fluxes from Satellite Data (HOAPS) (Andersson et al., 2010), a high-resolution satellite-derived ocean surface flux product (XseaFlux) (Liu et al., 2011), and National Centers Of Environmental Prediction (NCEP) (Kalnay et al., 1996; Kanamitsu et al., 2002). Even though these datasets have improved the information on surface heat flux, there is a commonly huge mismatch of flux magnitude under TCs between these global flux datasets and case-based field observations or high-resolution numerical simulations (Andersen et al., 2013; Song et al., 2021; Xie et al., 2024). Particularly, the flux magnitude under TC conditions has been substantially undermined by those global gridded flux datasets. This large uncertainty is because there is a scarcity of in-situ observational data beneath TCs for calculating latent and sensible heat fluxes. Direct observations using sail drones are also challenging, particularly due to the complex states of the air-sea interface under TC conditions.
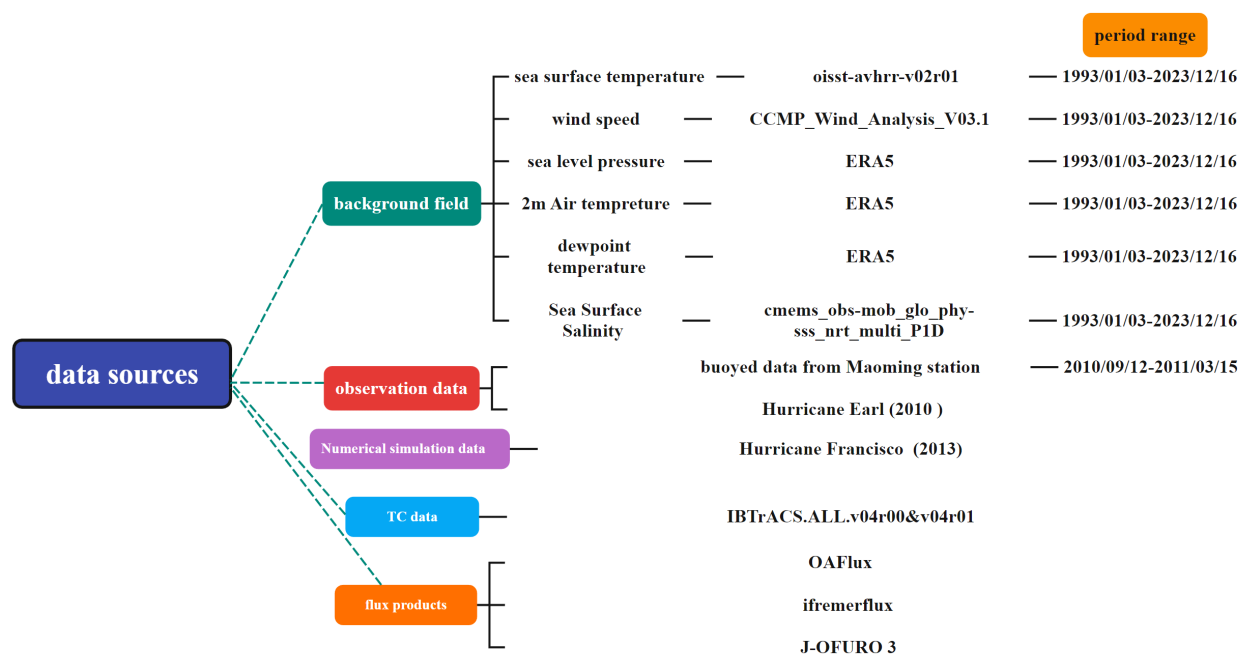
Figure 1Datasets used to create and validate the GHFD product. In particular, five datasets of IBTrACS, OISST, CCMP, Copernicus Marine and ERA5 dataset are used to construct this product. Three variables in terms of sea level pressure, 2 m air temperature, and 2 m dewpoint temperature come from ERA5, the sea surface temperature come from the satellite OISST dataset, sea surface salinity come from Copernicus Marine dataset, and the 10 m wind speed field comes from the TC-wind merged CCMP product. The IBTrACS dataset is used to locate and reconstruct TC wind speed field. The other three flux datasets, observational data and Numerical simulation data are used for comparisons and validations.
To develop an improved surface heat flux product, not only are accurate flux-related surface meteorological variables important, but it is also critical for a good-quality flux bulk algorithm. At present, the bulk algorithm version 3.6 developed from the Coupled Ocean-Atmosphere Response Experiment (COARE) algorithm in the Tropical Ocean-Global Atmosphere (TOGA) program is a state-of-the-art formulation. The COARE has been greatly improved from version 2.5 to version 3.6. The version 2.5 (Fairall et al., 1996) was published in 1996 and the version 3.0 (Fairall et al., 2003) was published at 2003, which has been greatly improved from version 2.5 to fit the high wind speed conditions. Version 3.6 is slightly restructured and built around improvements in the representation of the effects of waves on fluxes compared to COARE 3.5 (Edson et al., 2013). COARE 3.5 was based on Edson's buoy data and was compared to an extensive database (a total of 16 000 h of observations) combining observations from NOAA, WHOI, and U. Miami (Fairall et al., 2011). After several versions of updates and iterations, the COARE 3.6 can better minimize the errors under TC conditions. However, many flux products still use the COARE 3.0 algorithm, such as J-OFURO 3, NOAA-CD, and OAFlux.
In this study, we construct the Global Surface turbulence Heat Flux Dataset (GHFD) on the basis of satellite and reanalysis data, in combination with the International Best Track Archive for Climate Stewardship (IBTrACS) (Gahtan et al., 2024; Knapp et al., 2010) best track data and TC-wind data, and the COARE 3.6 algorithm is used to obtain the surface heat flux.
2.1 Data
The basic elements used to construct GHFD in this study come from the IBTrACS, OISST, Cross-Calibrated Multi-Platform (CCMP), and ERA5 datasets. Numerical simulation data of Typhoon Francisco (2013) (Ma, 2020) and observation data [buoyed data from Maoming station (21.46° N, 111.23° E) and Hurricane Earl (2010)] are used to compare and validate the accuracy of GHFD with three other heat flux products of J-OFURO 3, OAFlux, and ifremerflux (Fig. 1). The sea surface temperature is derived from the NOAA satellite Optimum Interpolation Sea Surface Temperature (OISST) dataset (Huang et al., 2020). The background wind speed field comes from the CCMP reanalysis data (Mears et al., 2022). The sea level pressure, 2 m air temperature, and 2 m dewpoint temperature are from the European Centre for Medium-Range Weather Forecasts atmospheric reanalysis version 5 (ERA5) dataset (Hersbach et al., 2020, 2023). The sea surface salinity is from the Copernicus Marine dataset (Droghei et al., 2018). The IBTrACS (Gahtan et al., 2024; Knapp et al., 2010) is used to locate the TC information and construct the wind field from 1993 to 2023. Specifically, we utilize the WMO-standardized 10 min average maximum wind speed and the radius of maximum wind in IBTrACS dataset, to integrate TC wind speeds into the CCMP dataset.
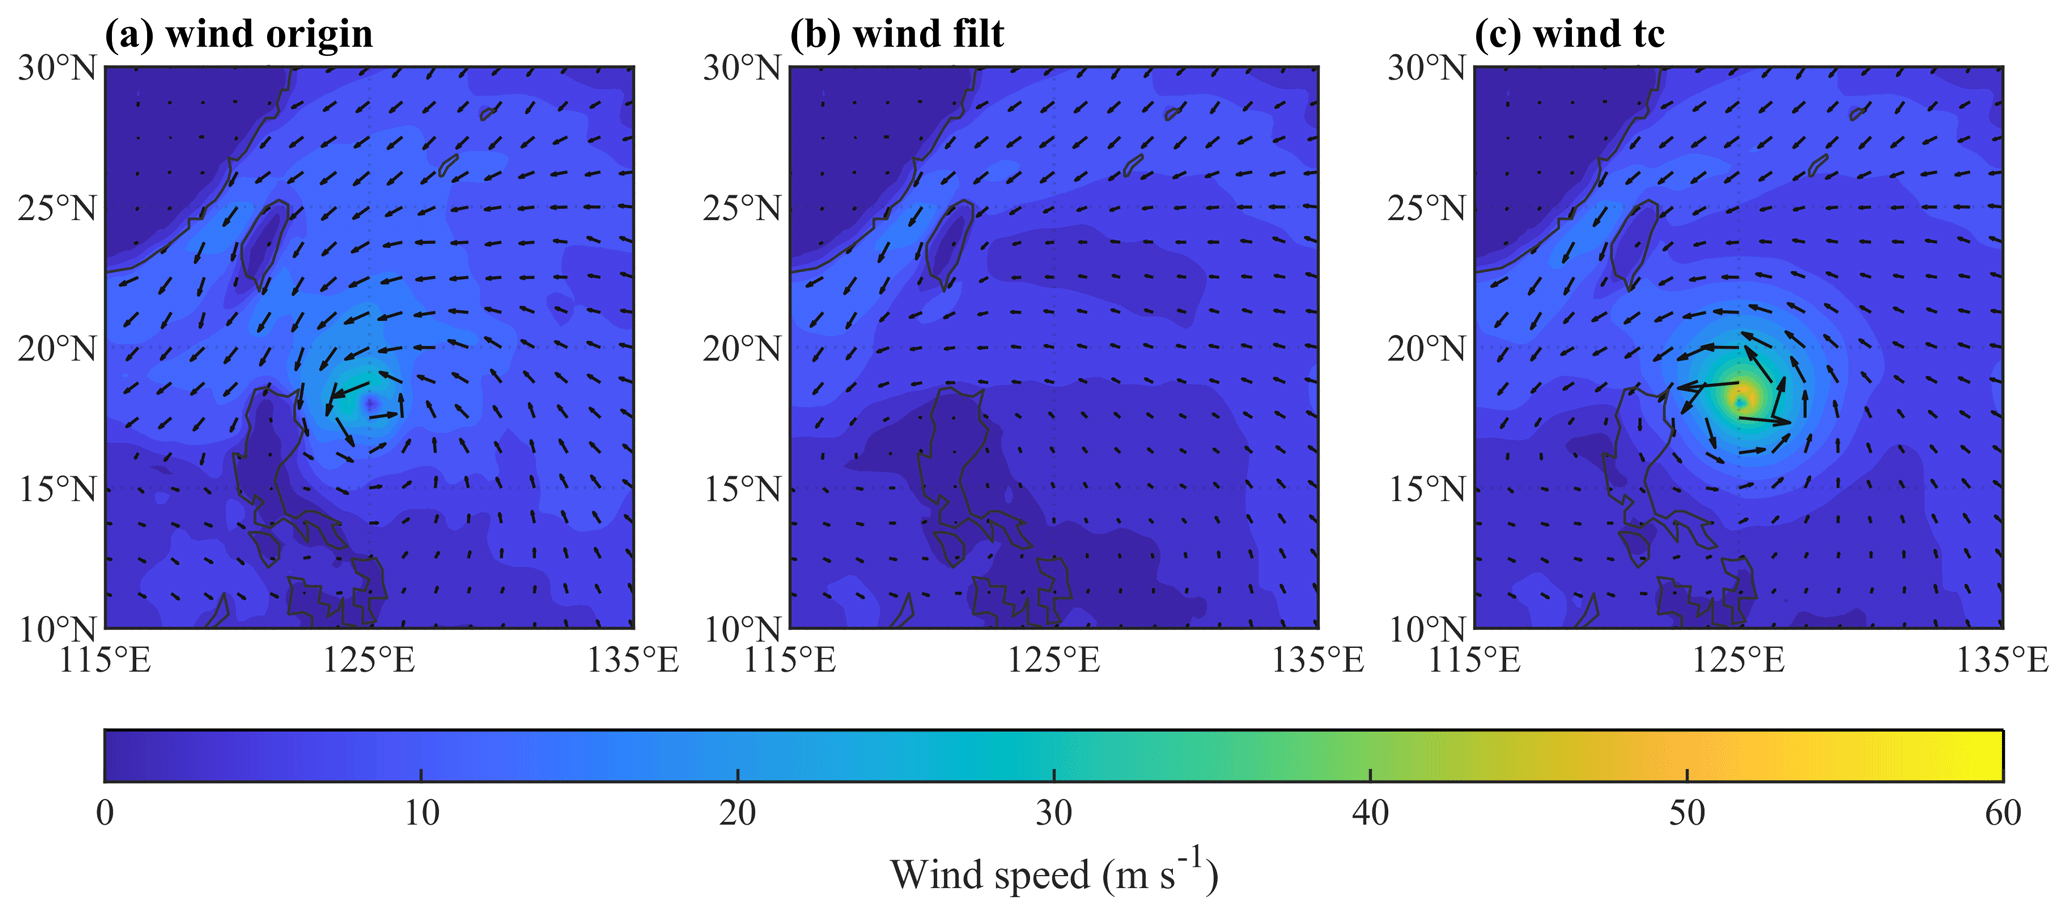
Figure 2Plan views of surface wind speed (m s−1) on Typhoon Megi (17 October 2010) for (a) origin CCMP reanalysis dataset, (b) TC-wind filtered CCMP dataset and (c) IBTrACS TC-wind merged CCMP dataset.
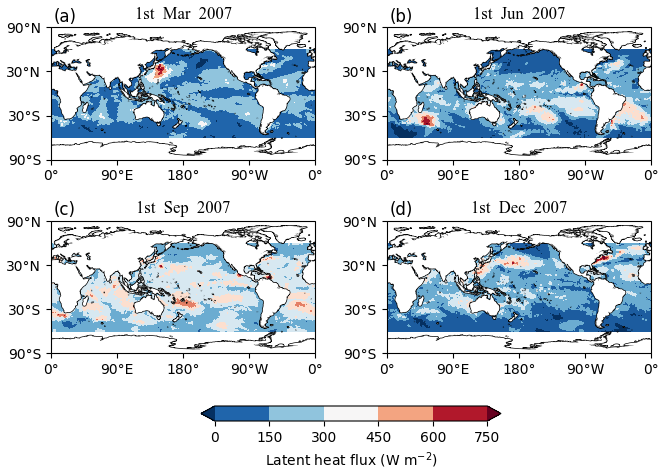
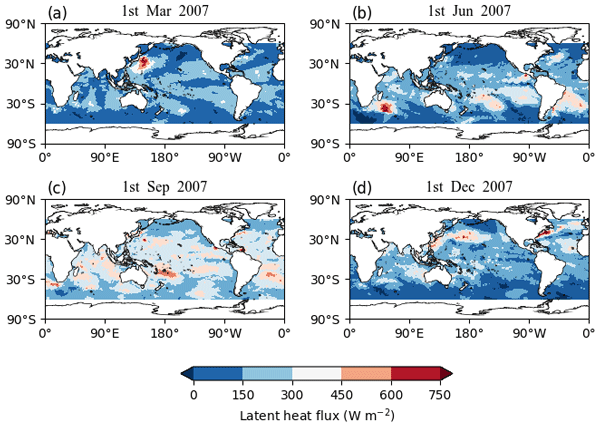
Figure 3The global distribution of the surface latent heat flux (W m−2) from 60° S to 60° N on (a) 1 March 2007, (b) 1 June 2007, (c) 1 September 2007 and (d) 1 December 2007 for GHFD.
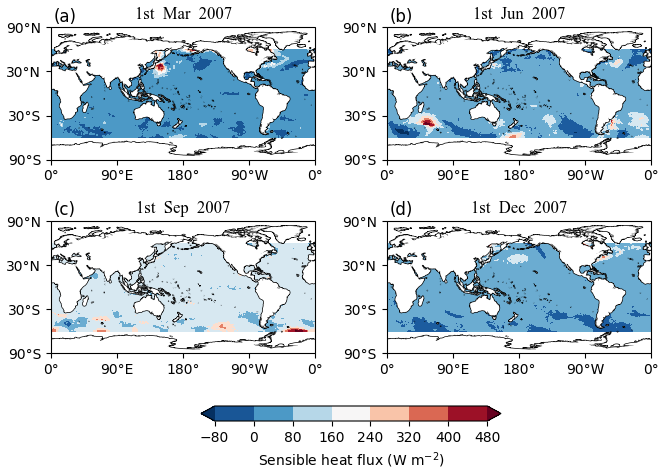
Figure 4The global distribution of the surface sensible heat flux (W m−2) from 60° S to 60° N on (a) 1 March 2007, (b) 1 June 2007, (c) 1 September 2007 and (d) 1 December 2007 for GHFD.
2.2 Methods
The accuracy of wind speed is key to the heat flux product, given its linearly proportional relationship. We reconstruct the wind speed field on the basis of the CCMP reanalysis dataset (Ye et al., 2026). The reconstruction process is divided into two parts. Firstly, the TC information in the original CCMP dataset is filtered using the approach raised by Vincent et al. (2012). Specifically, within 600 km around each TC point, an 11 d running mean is used to filter out TC signatures. A linear transition is specified between 600 and 1200 km. Secondly; the TC wind field is reconstructed using the best-track dataset and the wind pattern of Willoughby et al. (2006). By this method, the ramp functions are used to characterize wind patterns both inside and outside the radius of maximum wind (Willoughby et al., 2006). Following is the ramp function that facilitates the transition across the radius of maximum wind from the inner to outer profiles (Willoughby et al., 2006):
The following are the relevant parameters:
where r is the radial distance from the TC center; V is the wind velocity as a function of r; Vi and Vo are the tangential wind components in the eye and beyond the transition zone, classified by r=R1 and r=R2; Vmax and Rmax are the maximum wind and the RMW, respectively; X1 and X2 are the exponential decay lengths in the outer vortex; A is the coefficient representing the scale of the exponential function related to X1 and X2 (Eq. 2); φ is the latitude of the TC center and n is the exponent for the power law inside the eye. Noting that when , . w is the weighting function, which ramps up from 0 to 1 between R1 and R2, expressed in terms of a nondimensional argument ):
The transition of R2−R1 is specified a priori to be equal to 25 km and X2 is taken as the most rapid decay length of 25 km by Willoughby (1995).
Using Typhoon Megi (2010) case as an example, Fig. 2 shows the original wind speed field from the CCMP, the TC-removed wind speed field, and the wind speed field after TC insertion. The maximum wind speed of Megi in the original dataset is 30.2 m s−1. But after the adjustment of the wind field, the maximum wind speed of Megi (2010) reaches 50.8 m s−1. Compared to the maximal wind magnitude of 56.7 m s−1 in the IBTrACS best track data, the error is reduced from the original 26.5 m s−1 (46.7 %) to 5.9 m s−1 (10.4 %). The notable reduction of error indicates that the accuracy of the wind speed field has been improved, thereby improving the accuracy of heat flux at high wind speed conditions.
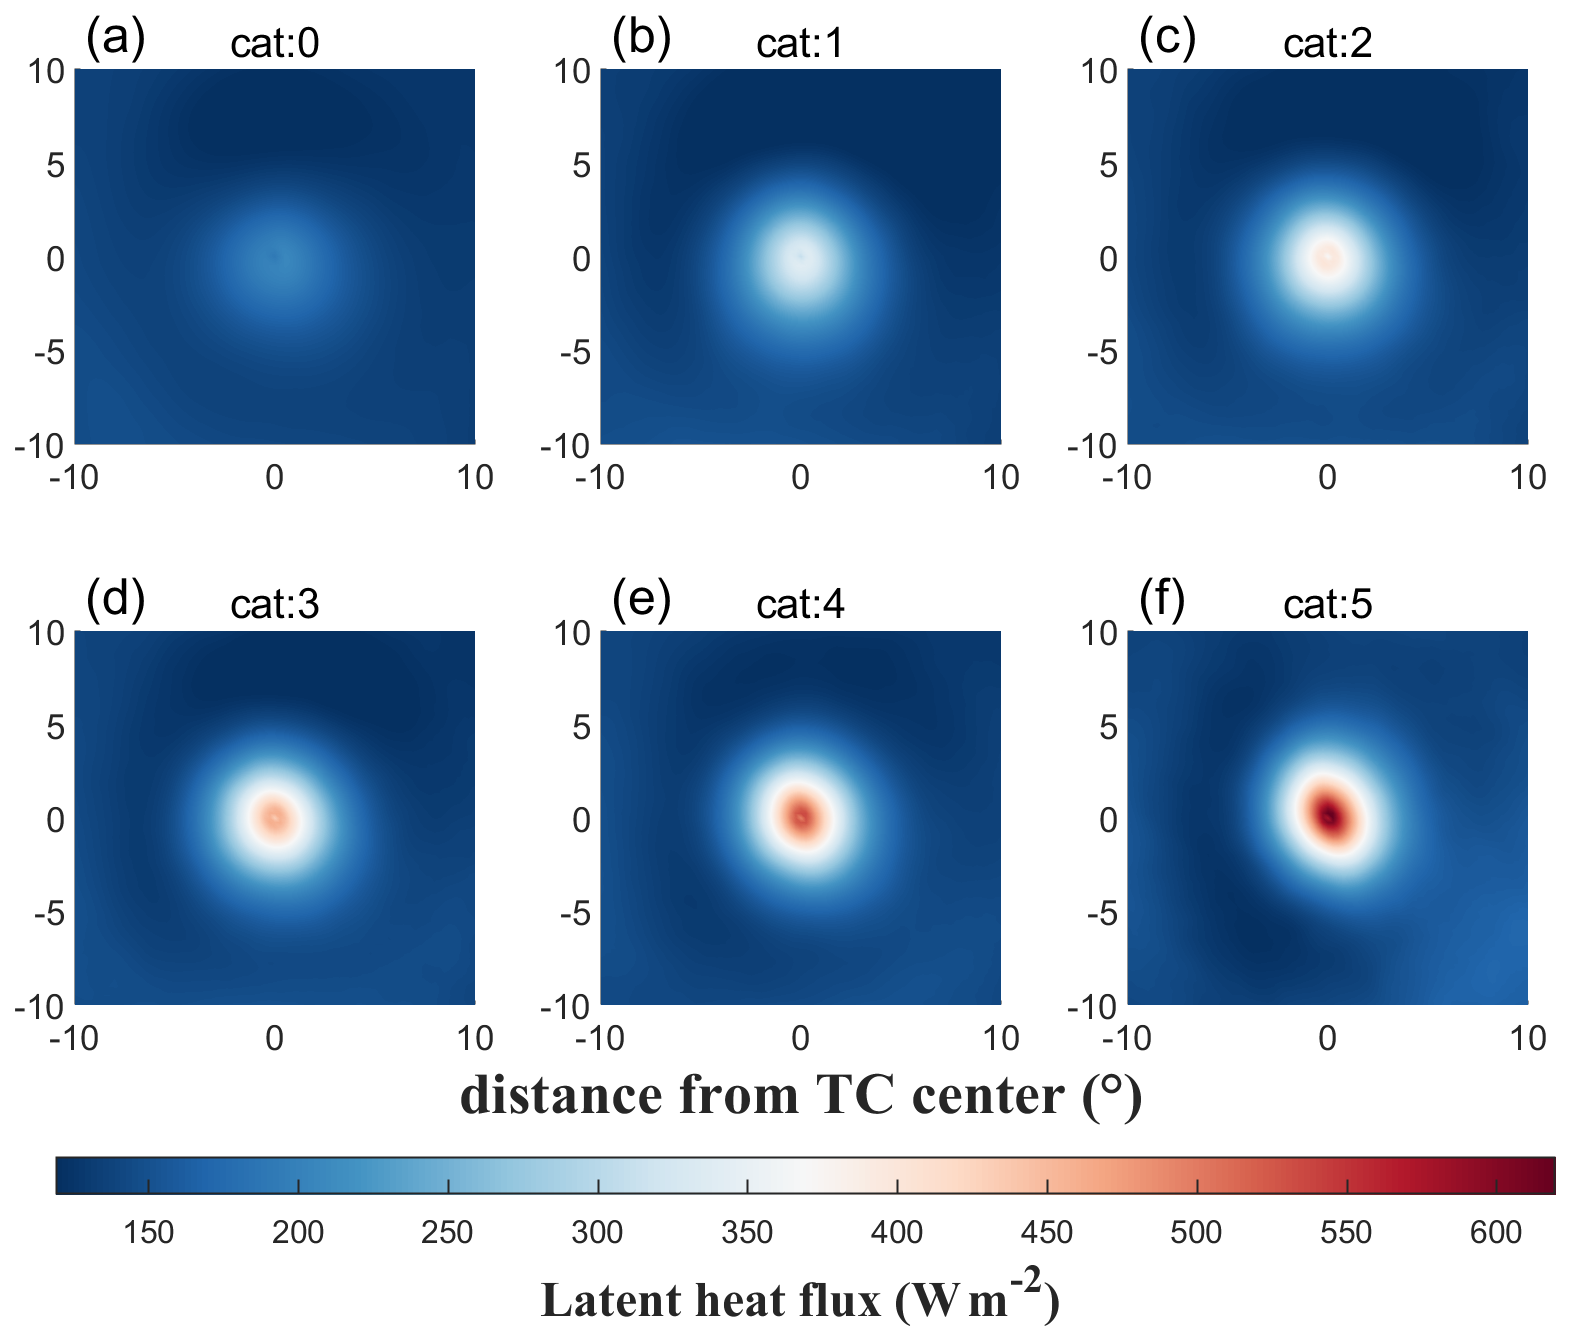
Figure 5Plan views of composite surface latent heat flux (W m−2) centered on TC classified by TC intensity for (a) Cat 0, (b) Cat 1, (c) Cat 2, (d) Cat 3, (e) Cat 4, and (f) Cat 5.
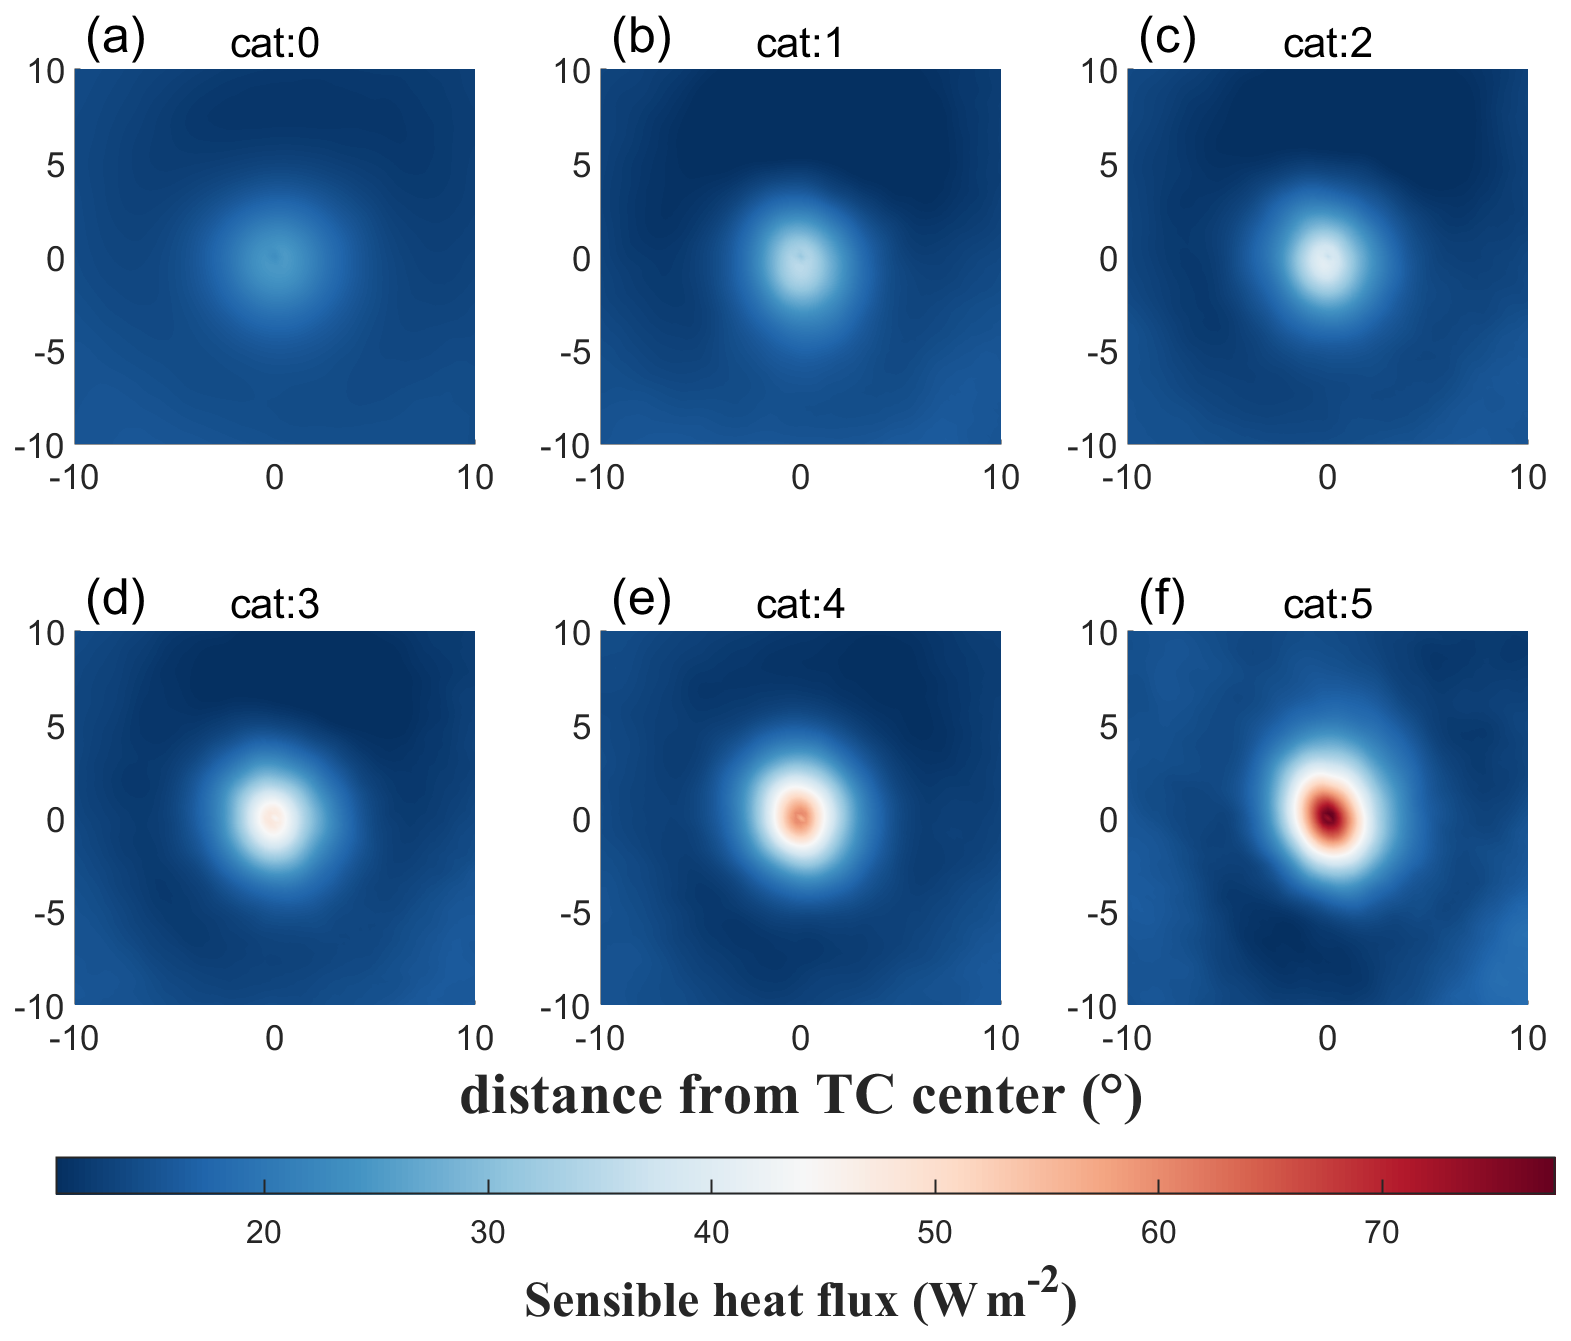
Figure 6Plan views of composite surface sensible heat flux (W m−2) centered on TC classified by TC intensity for (a) Cat 0, (b) Cat 1, (c) Cat 2, (d) Cat 3, (e) Cat 4, and (f) Cat 5.
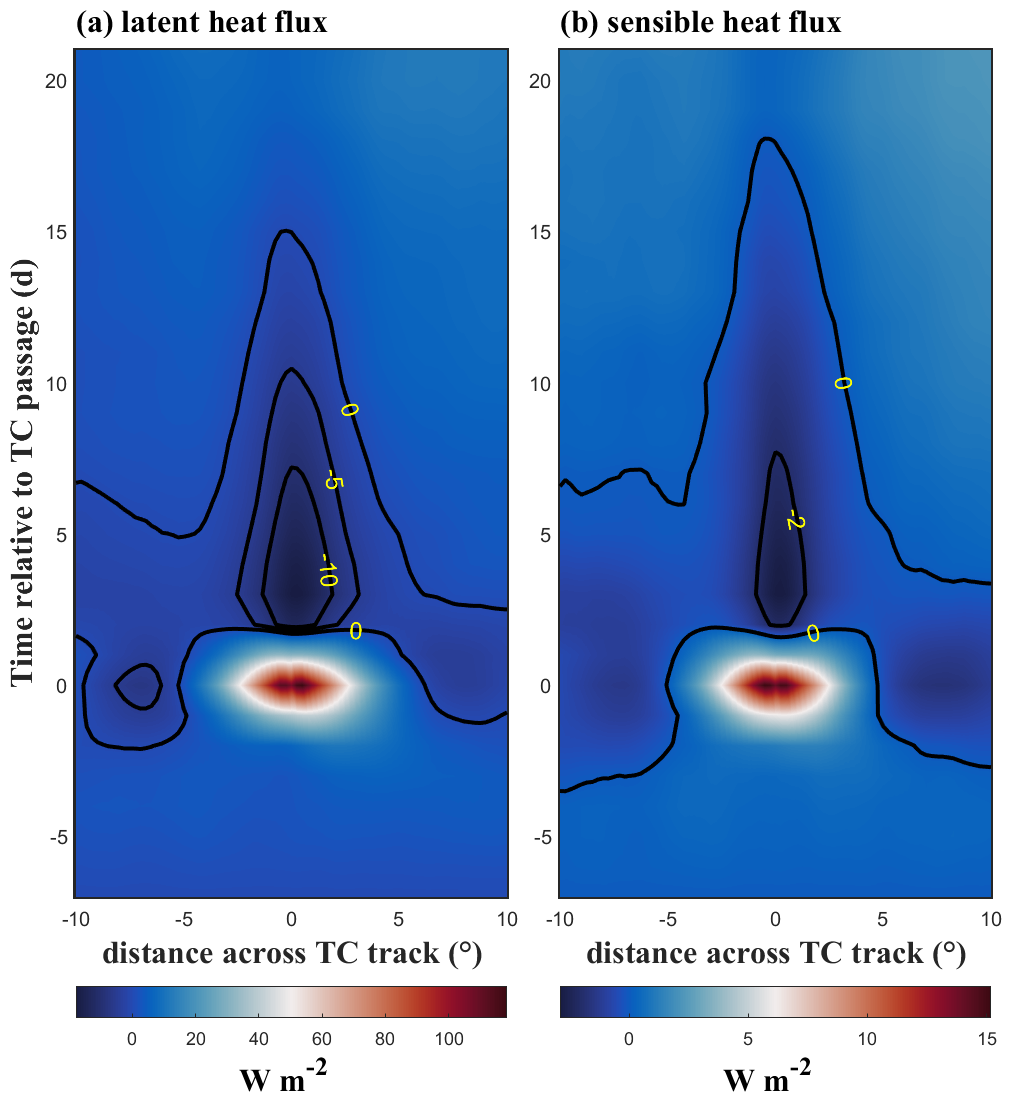
Figure 7Temporal evolution of the along-track-averaged (±0.25°) composite (a) surface latent heat flux anomaly (W m−2) and (b) surface sensible heat flux anomaly (W m−2) across the TC track.
The surface sensible and latent heat flux at the air-sea interface are calculated by the bulk flux algorithm:
where ρ is the density of the air; Lv is the latent heat of vaporization, cp is the specific heat at constant pressure; U is the horizontal wind speed at 10 m; Ch and Cq are surface exchange coefficients of sensible heat and latent heat, respectively; q is the specific humidity; T is the temperature. The subscripts a and s signify the near-surface and surface, respectively.
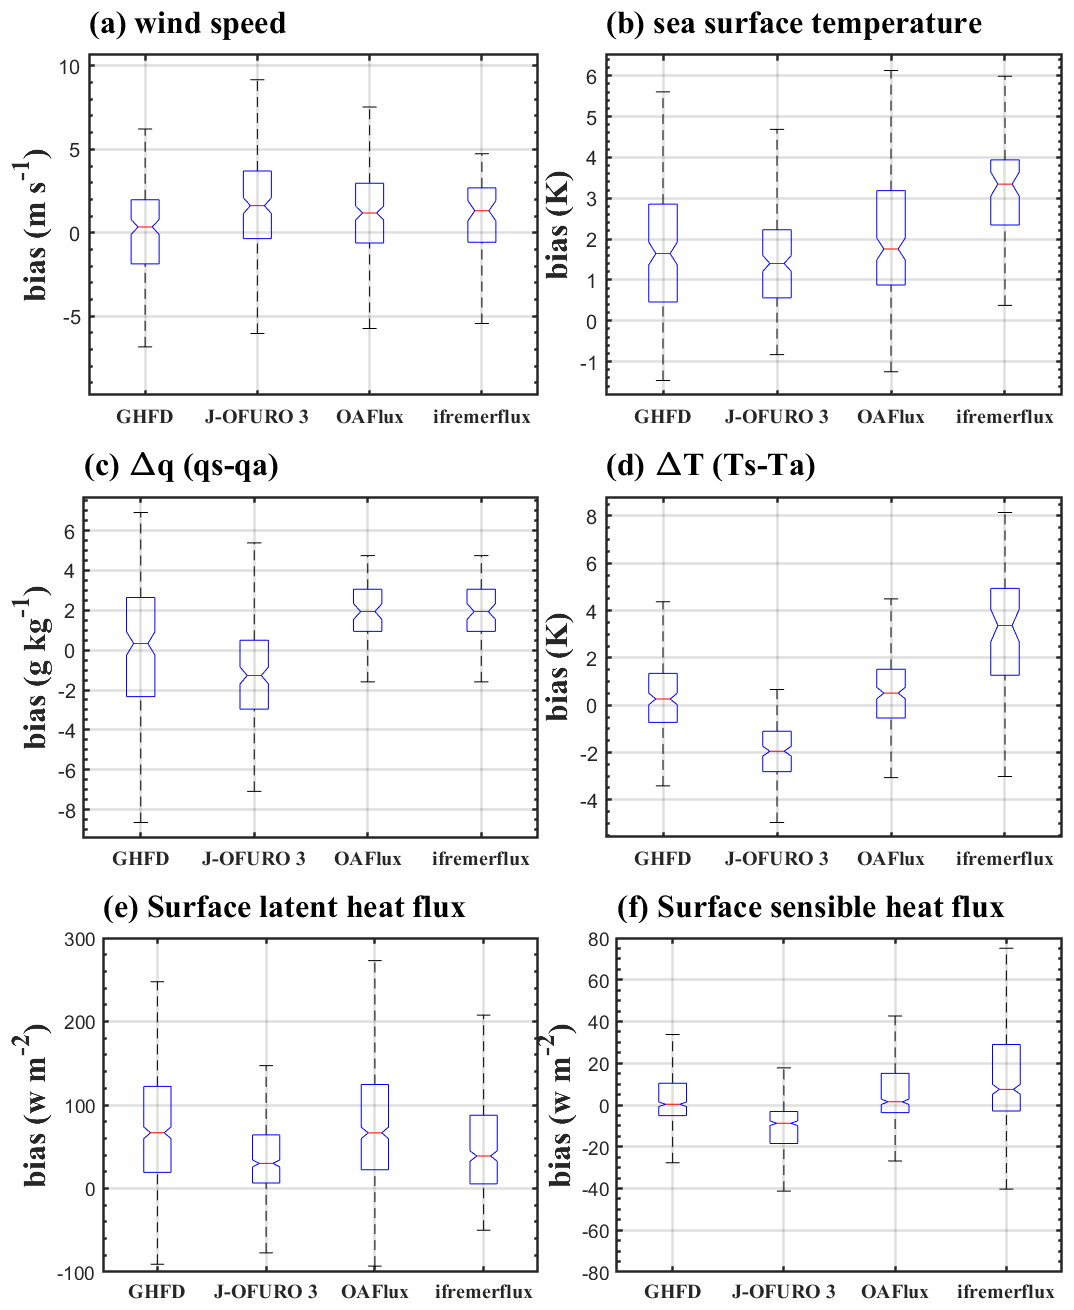
Figure 8Box plots of flux component biases of (a) surface wind speed (m s−1), (b) sea surface temperature (K), (c) qs-qa (2 m; g kg−1), (d) Ts-Ta (2 m; K), (e) surface latent heat flux (W m−2), and (f) surface sensible heat flux (W m−2) for different flux products against the buoy data at the Maoming Station (21.46° N, 111.23° E) over the period of 2010–2011 at daily resolution.
The COARE 3.6 model is used to compute the surface turbulence heat flux. Version 3.6 has been improved in several ways and notably enhances the heat flux for wind speeds exceeding 10 m s−1. In the COARE 3.6 model, surface turbulence heat flux can be obtained from the input 10 m wind speeds, sea surface temperature, sea surface salinity, 2 m air temperature, and 2 m relative humidity. Among these elements, the relative humidity is calculated by following:
where Td is the 2 m dewpoint temperature; T is the 2 m air temperature.
3.1 Validation
Figures 3 and 4 illustrate the global distribution of surface latent and sensible heat flux of GHFD on 1 March, 1 June, 1 September, and 1 December 2007, ranging from 60° S to 60° N. Results show that both surface latent and sensible heat flux are generally larger in the Southern Hemisphere during the summer and fall, while they are more pronounced in the Northern Hemisphere during spring and winter. Additionally, in spring and winter, there are notable regional peaks for both types of heat flux in the western Pacific. The distribution pattern of GHFD over the globe is similar to the distribution of other products (Figs. S1–S6 in the Supplement). Overall, there is minimal difference between GHFD and other products under normal wind conditions.
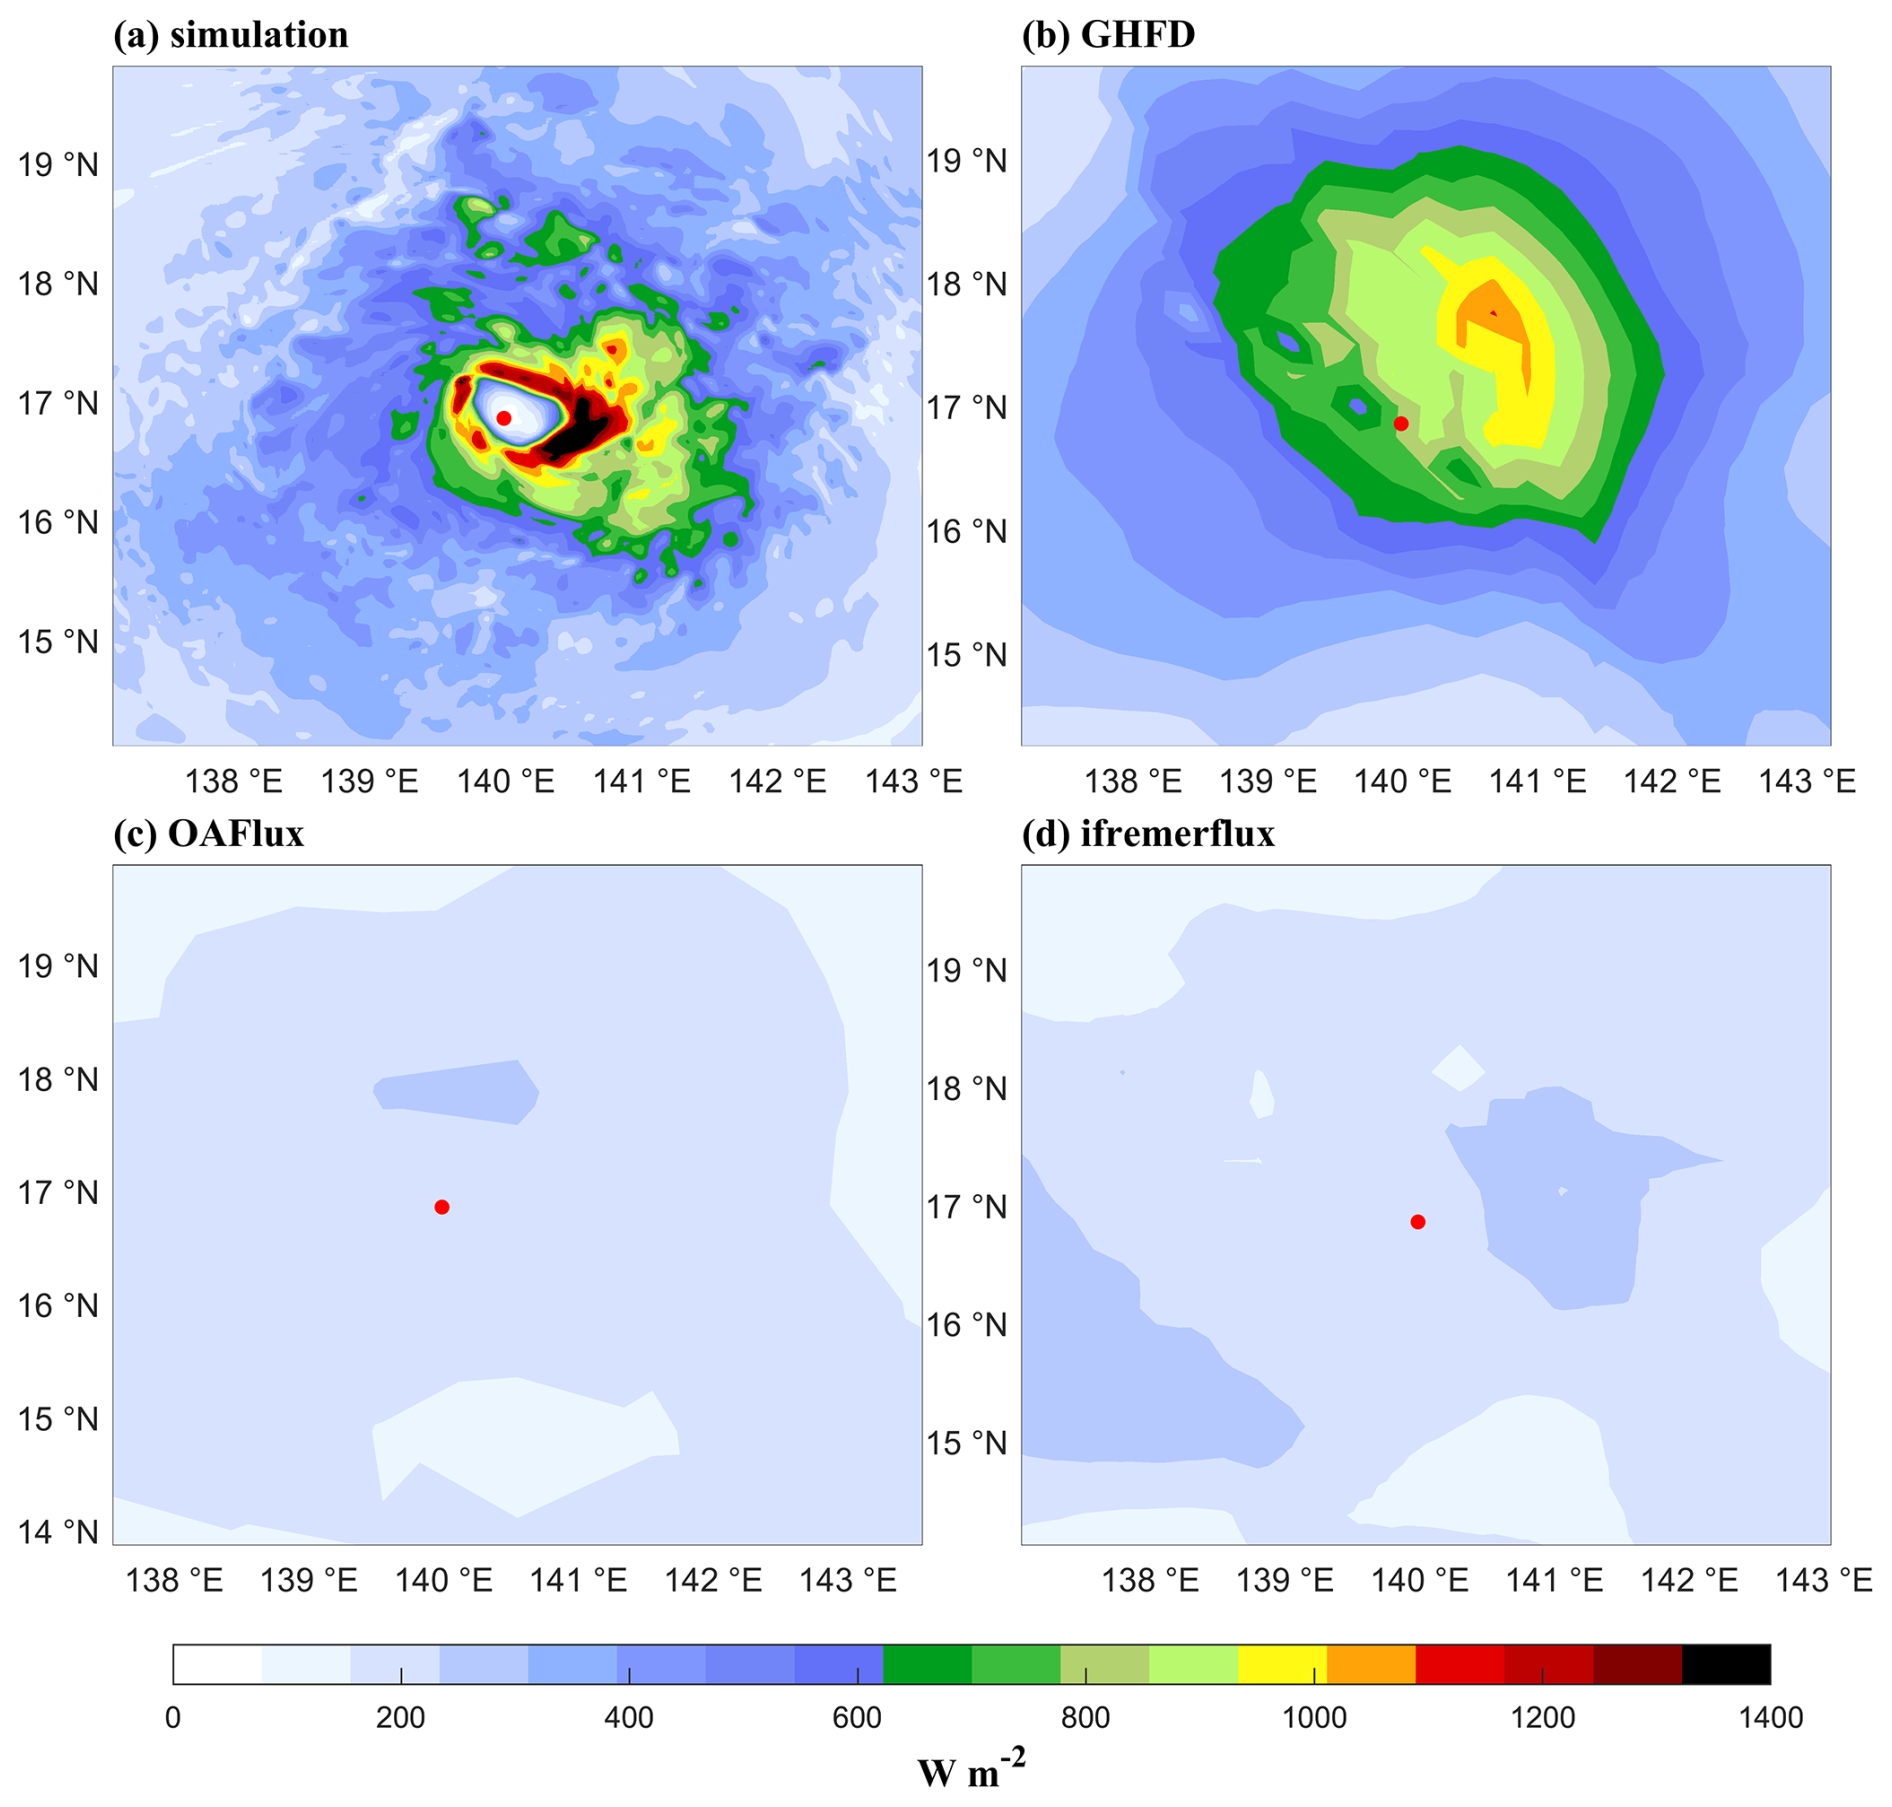
Figure 9Plan views of composite surface latent heat flux (W m−2) centered on Typhoon Francisco (2013) for (a) simulation, (b) GHFD, (c) OAFlux, and (d) ifremerflux. The red point represents the Hurricane's center.
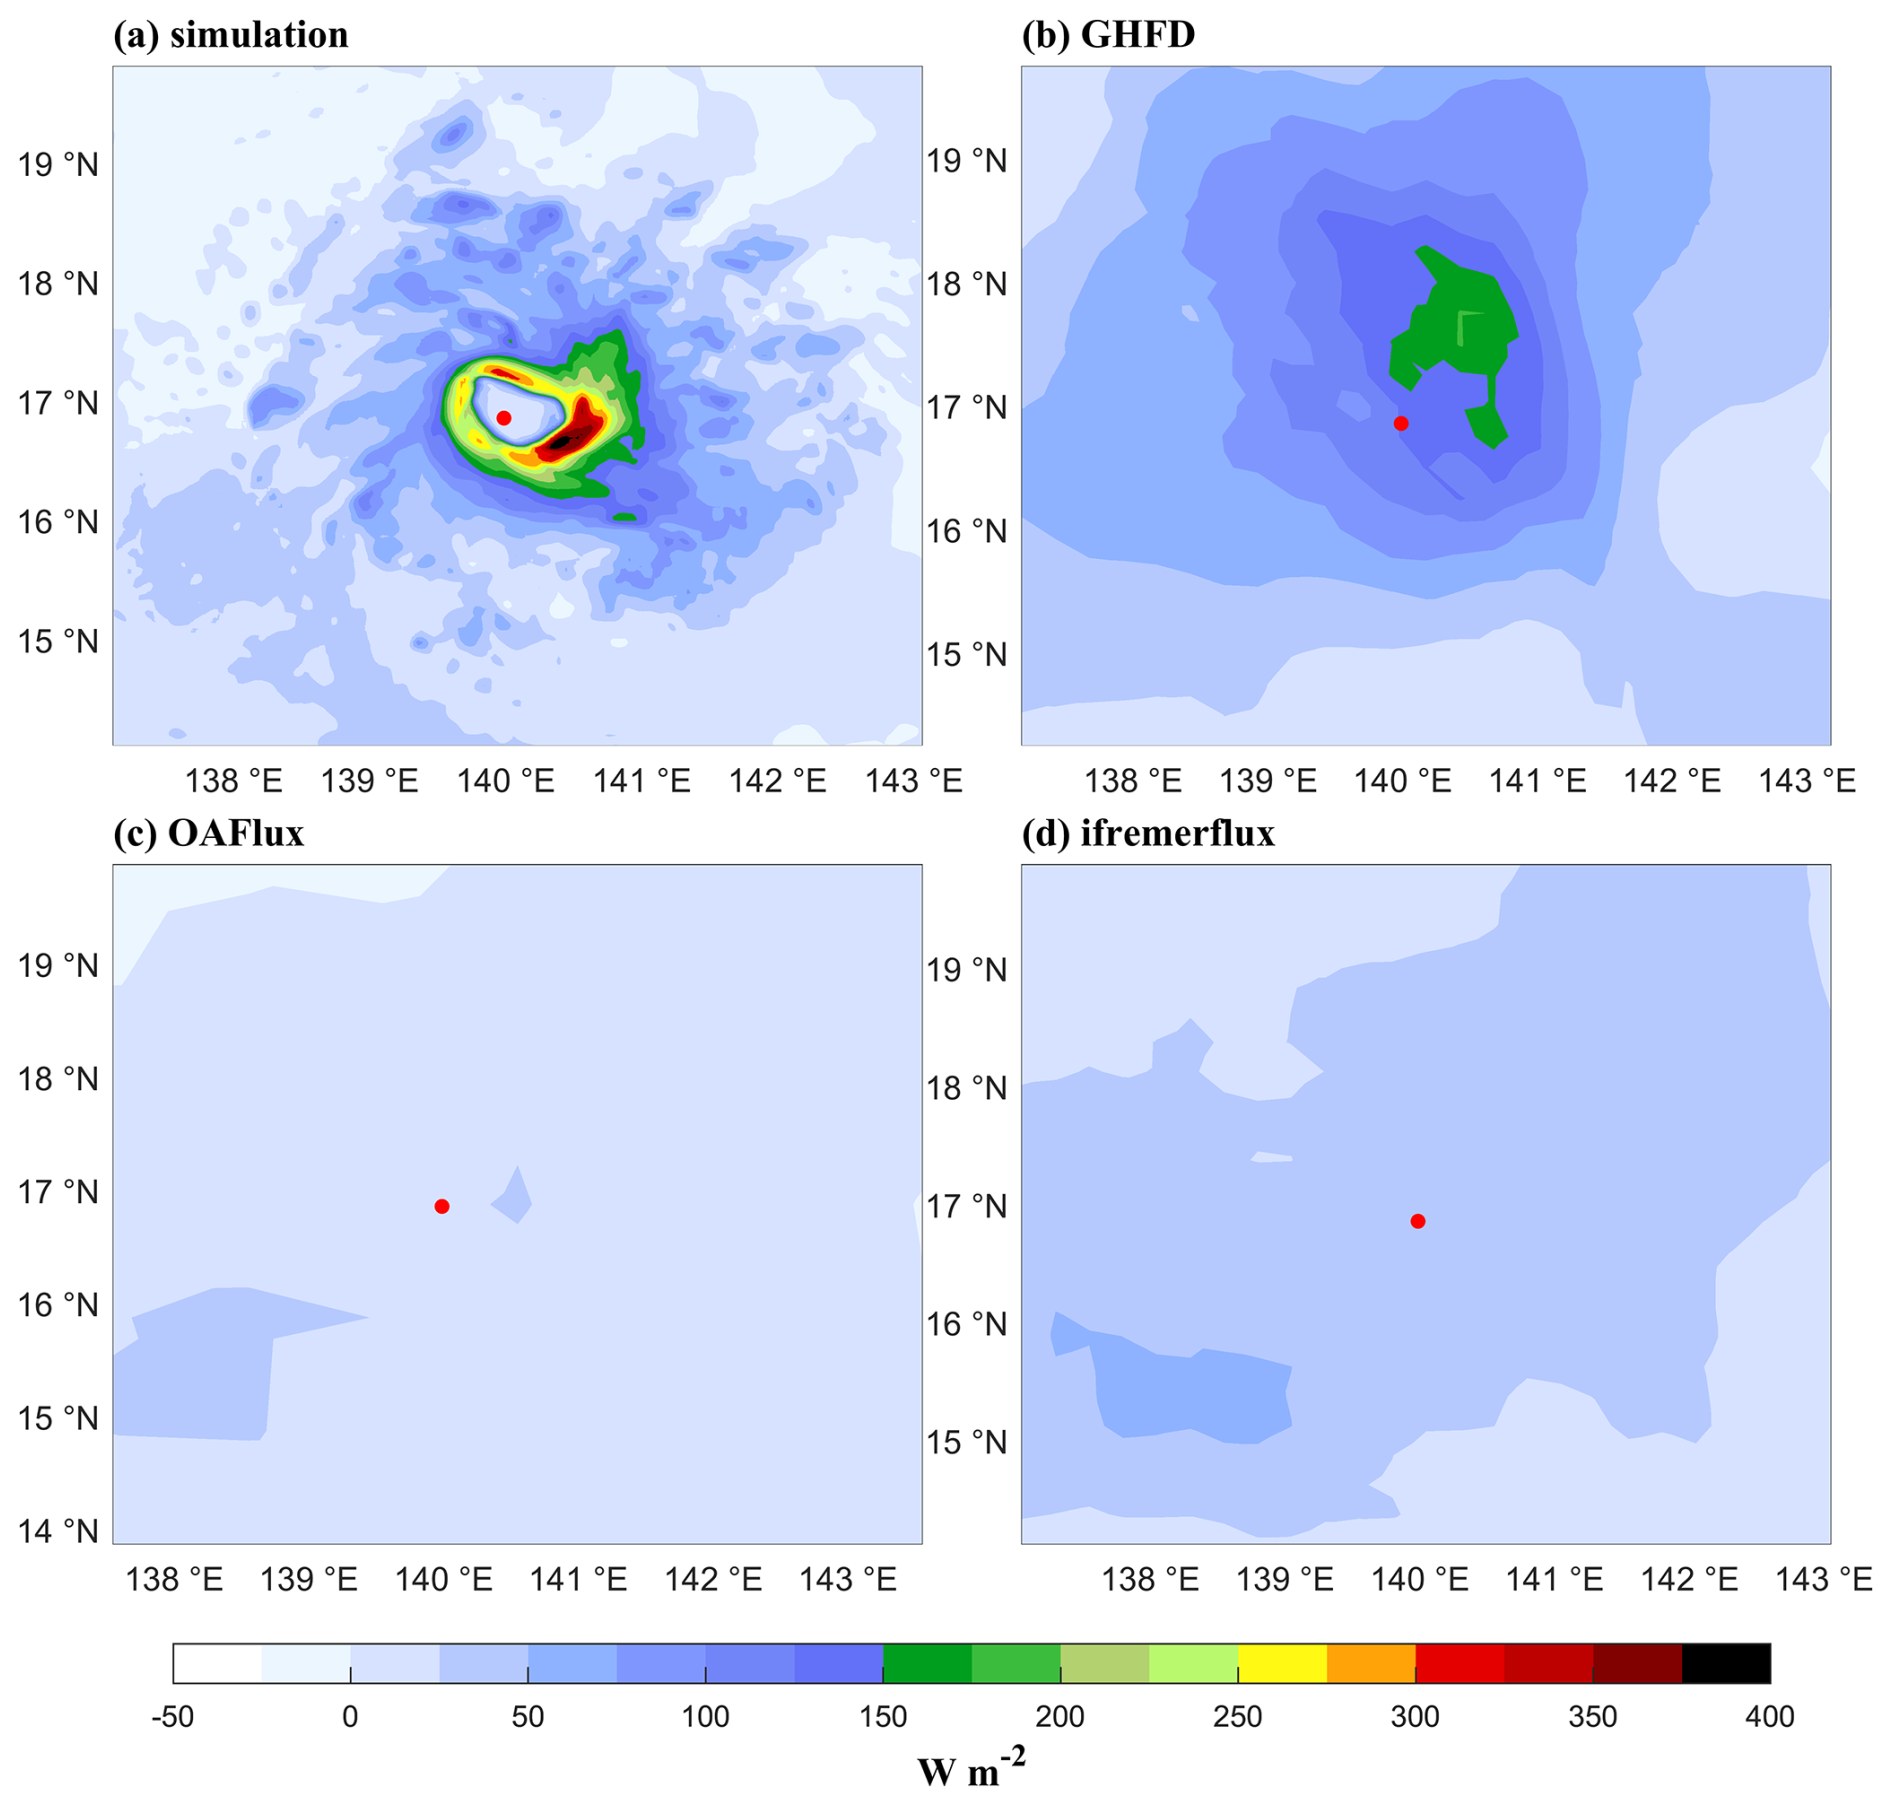
Figure 10Plan views of composite surface sensible heat flux (W m−2) centered on Typhoon Francisco (2013) for (a) simulation, (b) GHFD, (c) OAFlux, and (d) ifremerflux. The red point represents the Hurricane's center.
Figures 5 and 6 show the plan views of surface latent and sensible heat flux centered on TCs with different intensities of GHFD, categorized as follows: cat 0 ( kt), cat 1 (64 kt kt), cat 2 (83 kt kt), cat 3 (96 kt ≤ Vmax < 114 kt), cat 4 (114 kt < 136 kt), and cat 5 ( 136 kt). The data sample sizes in each category are 134 386, 16 806, 8825, 6753, 6058, and 1315, respectively. It is evident that with increasing the intensity of the TCs, both surface latent and sensible heat flux increase significantly, with the peak values being 206.19, 339.96, 401.64, 461.36, 533.60, 619.75 and 25.03, 35.26, 40.75, 48.21, 60.29, 77.77 W m−2 from cat 0 to cat 5, respectively. The magnitudes of heat flux correspond positively to the magnitude of the wind velocity. The peak magnitude of latent heat flux reaches over 600 W m−2 at cat 5 while the magnitude of sensible heat flux reaches 70 W m−2, with the former almost one order of magnitude larger than the latter. For other heat flux products (Figs. S7–S12), the peak magnitude of the surface latent heat flux is approximately 200 W m−2 while the sensible heat flux is 20 to 30 W m−2 at cat 5. The surface heat flux in GHFD is more in line with the theoretical analysis of Trenberth et al. (2007) than the other products in representing TC information. The global mean (60° S–60° N) surface latent heat flux is estimated at 113.4 W m−2 for GHFD, 98.7 W m−2 for J-OFURO 3, 92.4 W m−2 for OAFlux and 90.6 W m−2 for ifremerflux, while the surface sensible heat flux is estimated at 16.6 W m−2 for GHFD, 6.8 W m−2 for J-OFURO 3, 10.4 W m−2 for OAFlux and 19.1 W m−2 for ifremerflux.
Figure 7 displays the temporal evolution of averaged surface latent heat flux and sensible heat flux for TCs from 1993 to 2023, with a total of 163 826 data samples. Both the surface sensible and latent heat flux increase significantly as the TC approaches and reach a maximum on the day of TC arrival. At this time, the averaged surface latent heat flux reaches over 120 W m−2 while the surface sensible heat flux is about 15 W m−2. The GHFD is approximately five times larger than other surface heat flux products (Figs. S13–S15). Following the passage of the TCs, there is a notable cold wake left behind by TCs (Ma et al., 2020). The detection of the cold wake also reflects the accuracy of GHFD to some extent, which remains pronounced 2–3 weeks after the TC departure.
3.2 Component comparisons
The moored data from Maoming station (21.46° N, 111.23° E) is used to validate the flux components at normal wind conditions, along with other three flux products, in terms of wind speed, sea surface temperature, Δq (qs-qa), ΔT (Ts-Ta). Except for the sea surface temperature, all the other moored data of Maoming station are at a height of 20 m. For a fair comparison, the COARE 3.6 algorithm can be employed to compare observations at different heights through the reference height for profile. In this study, we standardize the data to the same height with 10 m of wind speed, 2 m of air temperature and specific humidity for comparison.
Figure 8 displays the box plots of flux component biases against the buoy data at the Maoming Station (21.46° N, 111.23° E). For the surface wind speed, Δq (qs-qa), ΔT (Ts-Ta), the bias of GHFD is the smallest among all the surface heat flux datasets. All of these are the crucial components to compute the heat flux, which can reveal the accuracy of GHFD in basic elements. Among the four datasets, GHFD yields the smallest bias in surface sensible heat flux. As for surface latent heat flux, GHFD performs better than OAFlux, with comparable but marginally larger bias than J-OFURO 3. The results indicate that the accuracy of GHFD product is comparable to that of other products in normal wind conditions.
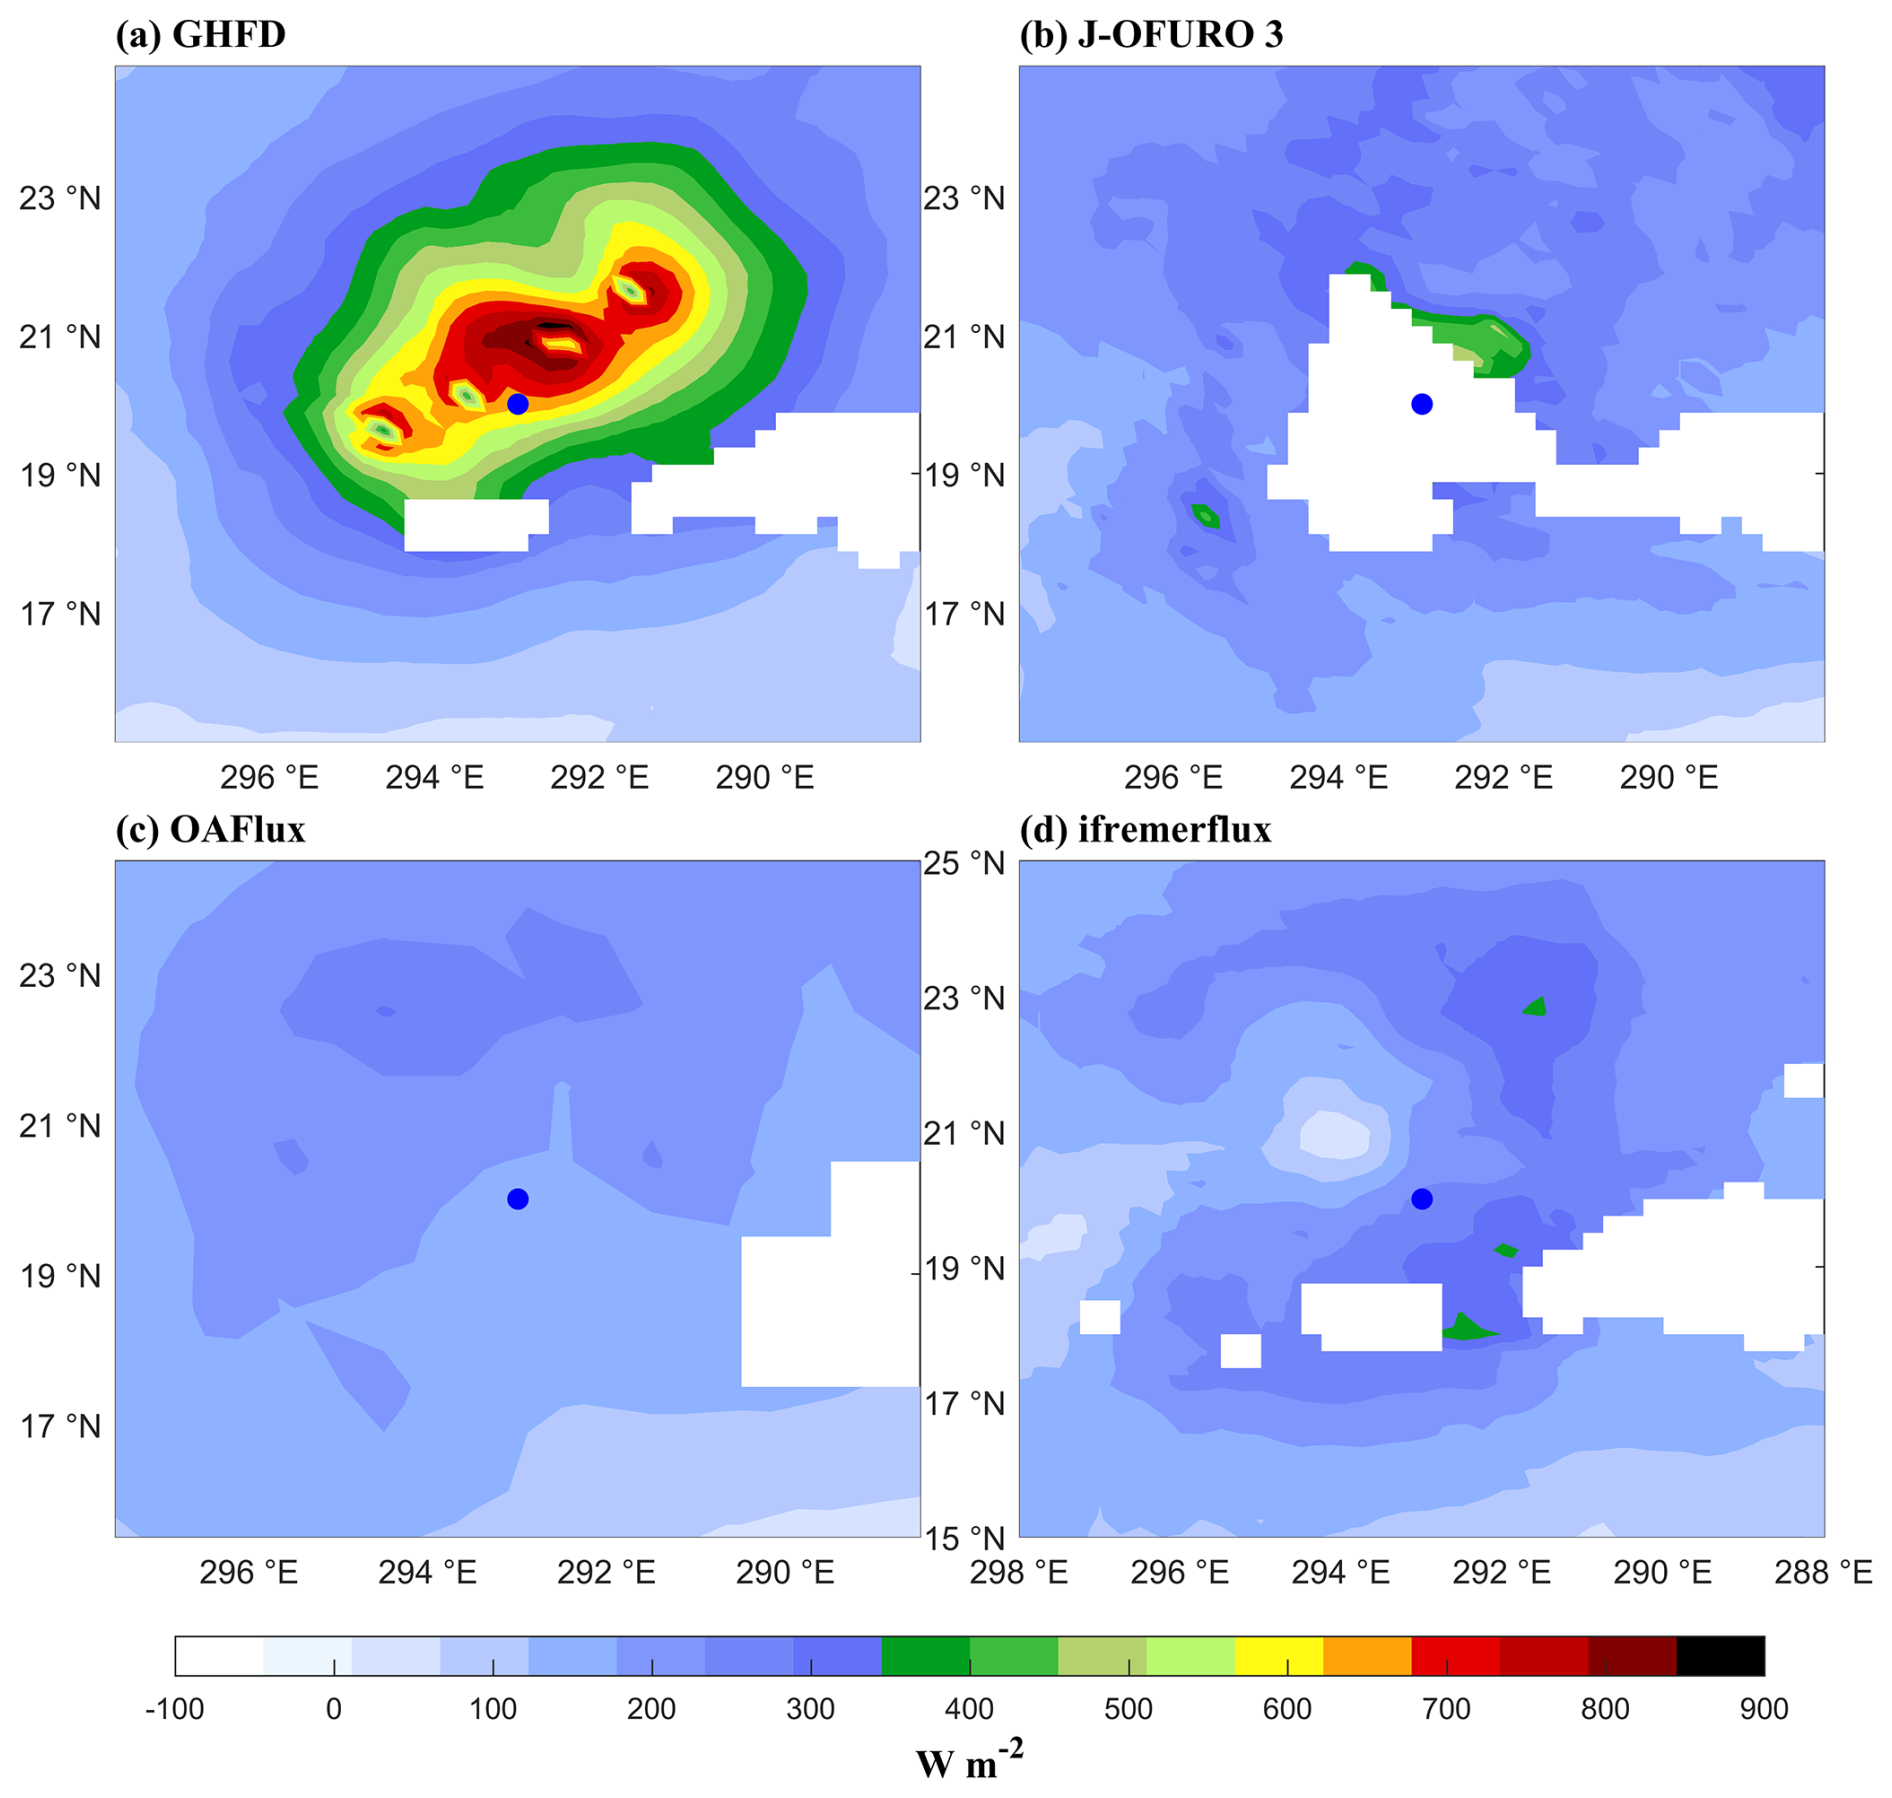
Figure 11Plan views of composite surface latent heat flux (W m−2) centered on Hurricane Earl for (a) new product, (b) J-OFURO 3, (c) OAFlux, and (d) ifremerflux. The white part is land or values that do not exist in the dataset. The blue point represents the Hurricane's center.
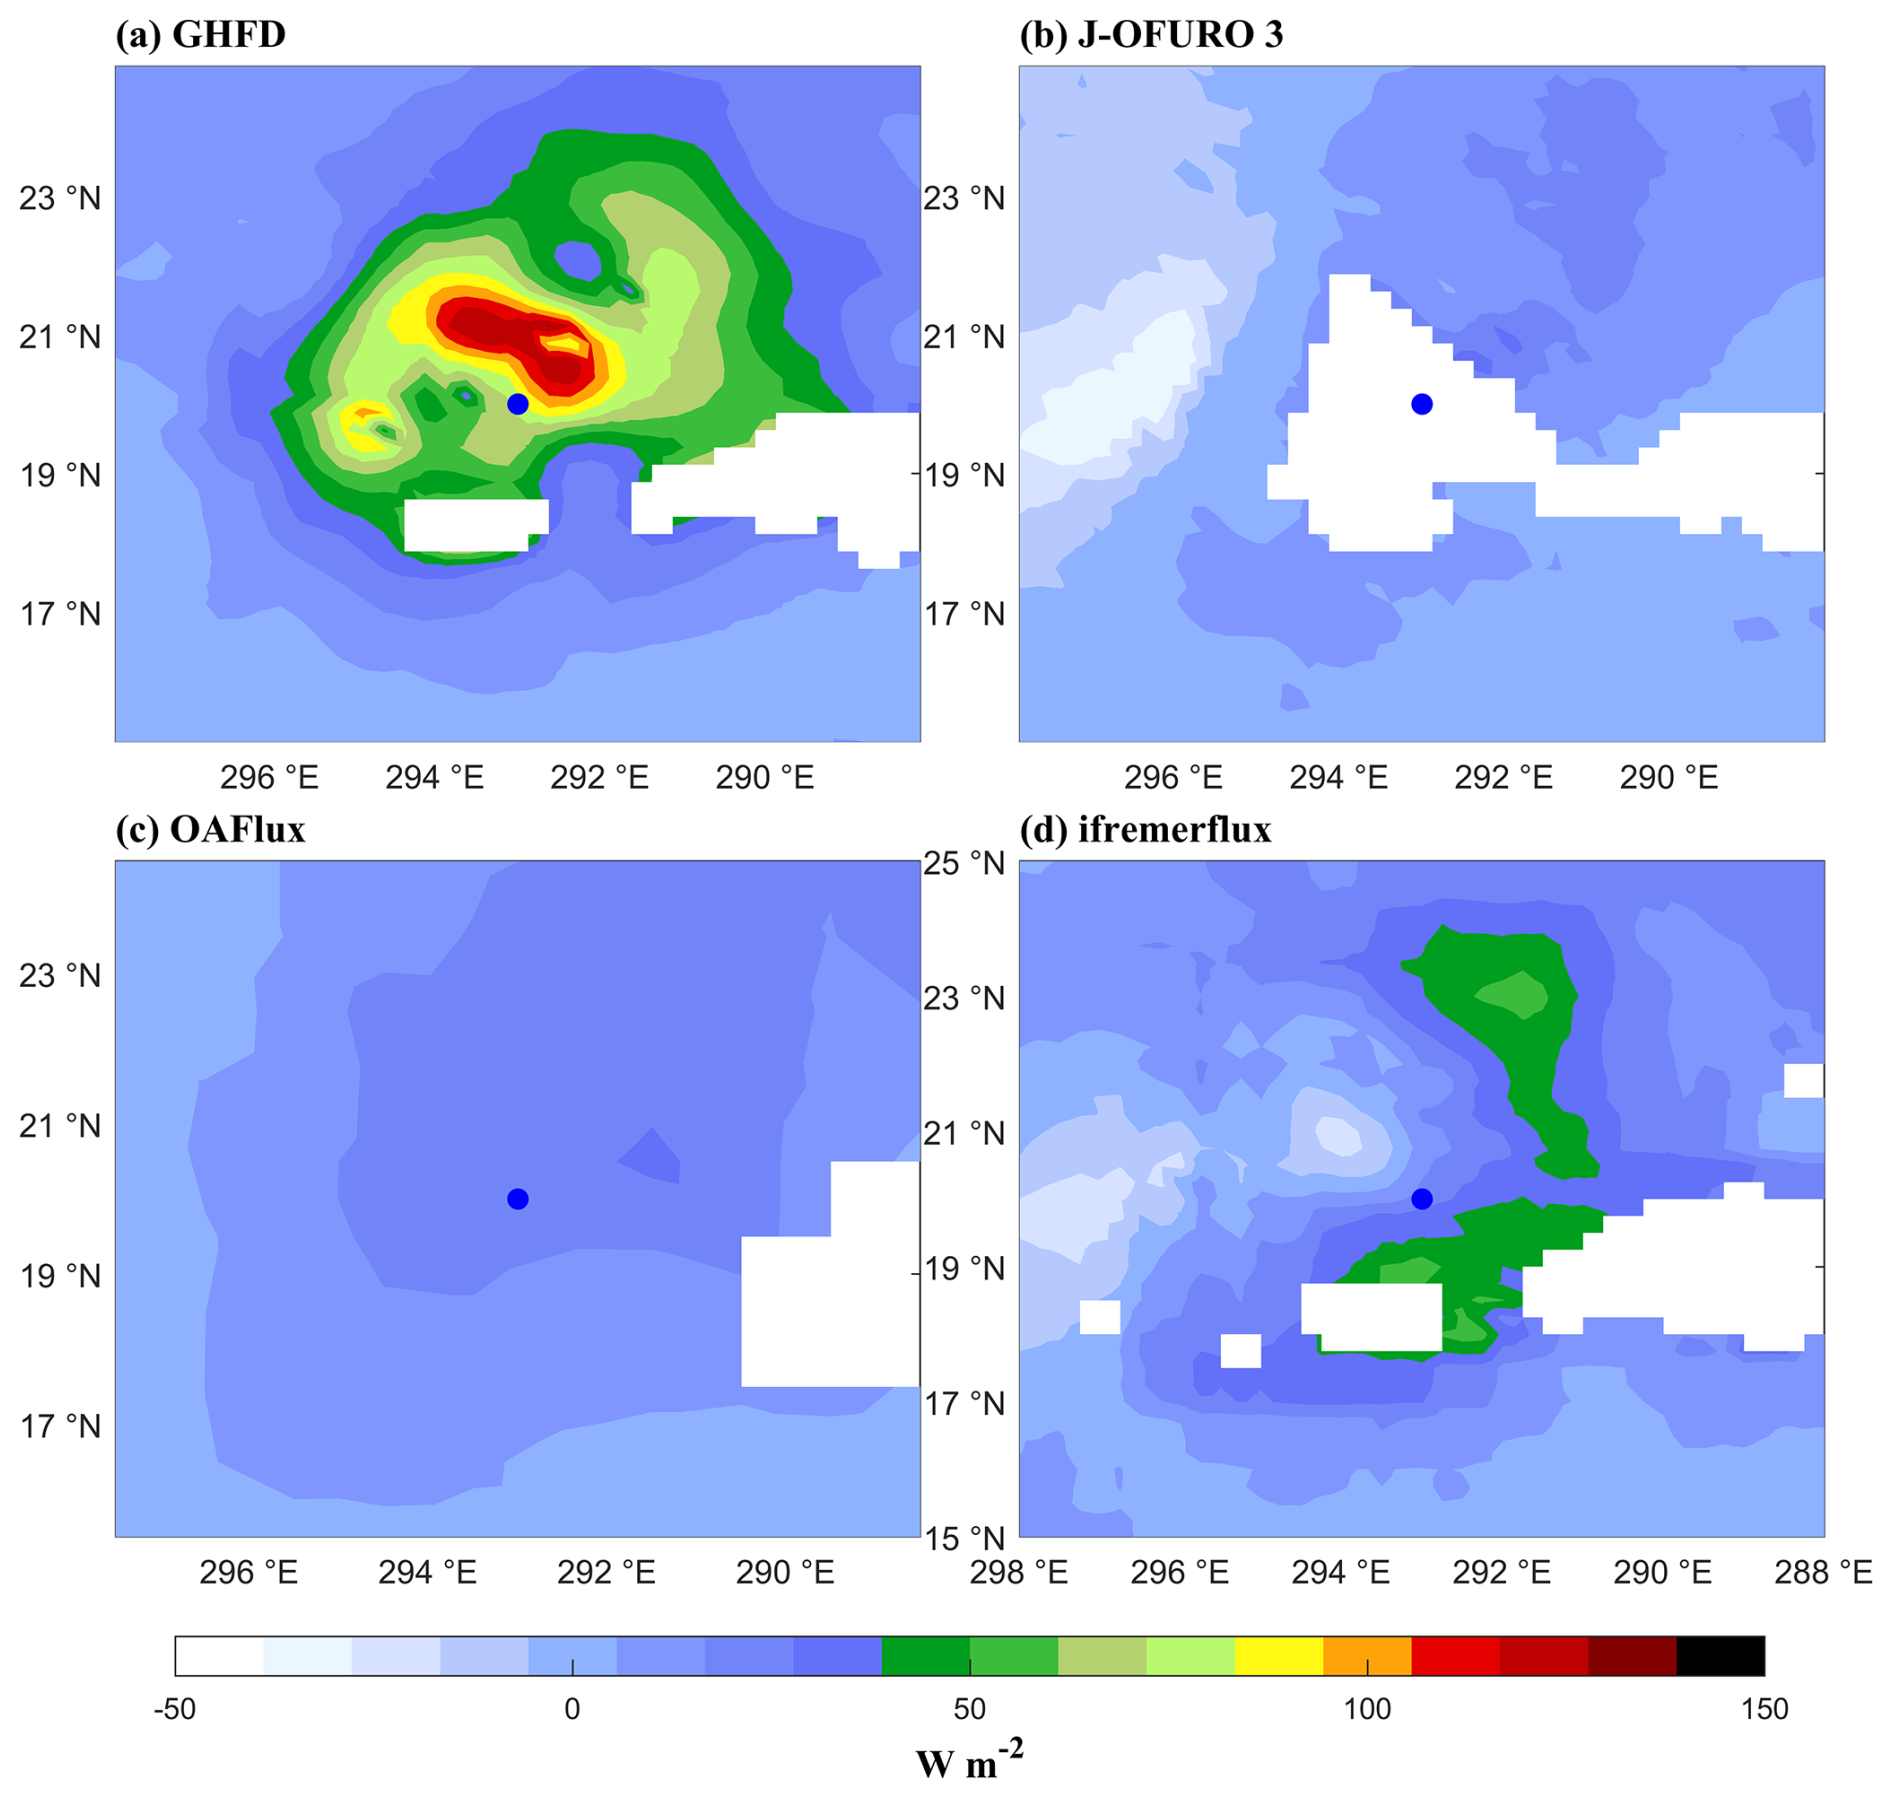
Figure 12Plan views of composite surface sensible heat flux (W m−2) centered on Hurricane Earl for (a) new product, (b) J-OFURO 3, (c) OAFlux, and (d) ifremerflux. The white part is land or values that do not exist in the dataset. The blue point represents the Hurricane's center.
3.3 TC verification
Figures 9 and 10 present the plan views of different flux products and high-resolution case simulation of Typhoon Francisco, based on the simulation results in Ma (2020). The simulations are conducted using the coupled Weather Research and Forecasting (WRF) model with the Stony Brook Parallel Ocean Model (sbPOM). Two domains are configured with dimensions of 350 × 402 and 217 × 217, and horizontal resolutions of 9 and 3 km, respectively. The internal grid moves with the vortex center. In the WRF model, The Yonsei State University (YSU) scheme (Hong et al., 2006) is used to parameterize boundary layer processes. For the surface-layer scheme, the “isftcflx51” option is chosen, ensuring that the surface drag coefficient levels off at hurricane-force wind speeds (33 m s−1) (Donelan et al., 2004). Microphysical processes are parameterized by the Lin scheme (Lin et al., 1983). Radiation schemes are the RRTM longwave scheme (Mlawer et al., 1997) and the Dudhia shortwave (Dudhia, 1989) scheme. The Kain-Fritsch cumulus scheme (Kain, 2004) is utilized in the outermost domain. In the sbPOM model, a total of 40 levels are distributed as default, with 20 levels in the upper 100 m. Note that the J-OFURO 3 is not shown in this region due to its missing data.
Compared to the other two products, GHFD shows a more distinct TC structure, though there is still a gap relative to the high-resolution TC simulation. Meanwhile, the magnitude of surface latent heat flux is much larger than that of surface sensible heat flux. Within the TC region, the magnitude of surface latent heat flux in Fig. 9c and d is below 400 W m−2, while the GHFD is comparable to simulation data with peak values exceeding 1000 W m−2. The behaviors of surface sensible heat flux from differing data are consistent with those of surface latent heat flux (Fig. 10c, d), and both OAFlux and ifremerflux productions reflect smaller values of less than 100 W m−2 compared to that of more than 150 W m−2 in simulation data and GHFD. In addition to heat flux, we also compare the 2 m air temperature, 2 m specific humidity, and 10 m wind speed of the simulation against the corresponding variables in GHFD. As illustrated in Fig. S16, the mean bias is nearly 0.5 K for 2 m air temperature, about 1.6 g kg−1 for 2 m specific humidity, and roughly 5.0 m s−1 for 10 m wind speed.
Figures 11 and 12 present the plan view of Hurricane Earl on 31 August from four surface heat flux products. Jaimes et al. (2015) calculates the surface turbulence heat flux during Earl based on related observation studies (Black et al., 2007; Powell et al., 2003; Zhang et al., 2008) in hurricanes. For Earl, the maximum surface latent heat flux is about 900 W m−2, and the maximum surface sensible heat flux is approximately 250 W m−2 (Fig. 8 of Jaimes et al., 2015). Relative to the other datasets, GHFD exhibits values that are most consistent with those of Earl. The comparison of various flux datasets with the observational field of Earl further reveals that the GHFD has a significant improvement in resolving the surface heat flux under TC conditions. This improvement provides a valuable foundation for understanding air-sea interactions during TC events and an optional dataset for understanding global energy cycle and climate change.
The GHFD dataset in NetCDF format is freely available for download at https://doi.org/10.57760/sciencedb.24400 (Peng et al., 2025). The size of the GHFD is approximately 5.99 GB yr−1 and 185.8 GB for 31 years. They are stored in zip-compressed files, each file per year, named YYYY.zip, where “YYYY” denotes the year. Each daily file is stored in NetCDF format, named “fluxdataset-YYYYMMDD.nc”, where MM denotes the month, DD denotes the date. The GHFD contains 9 values: surface latent heat flux (HLI), surface sensible heat flux (HSI), latitude (lat), longitude (lon), 2 m specific humidity (qa), sea surface temperature (sst), sea surface salinity (sss), 2 m air temperature (ta) and wind speed (wnd).
This study addresses the prominent bias of existing heat flux products under high wind speed conditions, which cannot meet the current needs for quantitative analysis of energy transfer. Therefore, by using the existing reanalysis data products (CCMP) and IBTrACS, adopting the wind speed profile within the TC region proposed by Willoughby et al. (2006), the TC wind speed in CCMP was reconstructed. By comparison, it was found that the reconstructed TC-merged wind speed field is more in line with the observed wind speed of TCs, and thus more accurate. Then, the pre-prepared datasets (sea surface temperature, sea surface salinity, 10 m wind speed, 2 m relative humidity and 2 m temperature) were interpolated to the same spatial and temporal resolution and input into the COARE 3.6 algorithm. We construct a new heat flux dataset GHFD with a spatial resolution of 0.25° × 0.25° and a temporal resolution of one day to meet the need under high wind speed conditions.
Comparing the basic parameters and heat flux of GHFD with other three heat flux products, observational data, the simulated TC (Francisco) and observational data of Earl is conducted. Compared with other products, GHFD shows better performance under TC conditions. A comparison of each parameter indicates that the bias of GHFD is significantly smaller than that of other products. These results indicate that the accuracy of the GHFD product is comparable to that of other flux products in low wind conditions; under TC conditions, the heat flux accuracy is significantly improved in GHFD.
The supplement related to this article is available online at https://doi.org/10.5194/essd-18-6421-2026-supplement.
W.P. conducted all the analysis and drew the figures. Z.M. conceived and designed the work. W.P. and Z.M. wrote the initial draft. D.Z. and H.Y. conducted the wind field construction. All authors discussed and improved the manuscript.
The contact author has declared that none of the authors has any competing interests.
Publisher's note: Copernicus Publications remains neutral with regard to jurisdictional claims made in the text, published maps, institutional affiliations, or any other geographical representation in this paper. The authors bear the ultimate responsibility for providing appropriate place names. Views expressed in the text are those of the authors and do not necessarily reflect the views of the publisher.
This work is supported by the National Natural Science Foundation of China with grant nos. 42475011 and 42192552, and the Innovation Research Foundation of National University of Defense Technology (Innovation Research Foundation of NUDT).
This research has been supported by the National Natural Science Foundation of China (grant nos. 42475011 and 42192552) and the Innovation Research Foundation of National University of Defense Technology (Innovation Research Foundation of NUDT).
This paper was edited by Graciela Raga and reviewed by two anonymous referees.
Andersson, A., Fennig, K., Klepp, C., Bakan, S., Graßl, H., and Schulz, J.: The Hamburg Ocean Atmosphere Parameters and Fluxes from Satellite Data – HOAPS-3, Earth Syst. Sci. Data, 2, 215–234, https://doi.org/10.5194/essd-2-215-2010, 2010.
Andersen, T. K., Radcliffe, D. E., and Shepherd, J. M.: Quantifying surface energy fluxes in the vicinity of Inland-Tracking tropical cyclones, J. Appl. Meteorol. Clim., 52, 2797–2808, https://doi.org/10.1175/JAMC-D-13-035.1, 2013.
Bentamy, A., Grodsky, S. A., Elyouncha, A., Chapron, B., and Desbiolles, F.: Homogenization of scatterometer wind retrievals, Int. J. Climatol., 37, 870–889, https://doi.org/10.1002/joc.4746, 2017.
Bentamy, A., Grodsky, S. A., Katsaros, K., Mestas-Nuñez, A. M., Blanke, B., and Desbiolles, F.: Improvement in air–sea flux estimates derived from satellite observations, Int. J. Remote Sens., 34, 5243–5261, https://doi.org/10.1080/01431161.2013.787502, 2013.
Bentamy, A., Piollé, J. F., Grouazel, A., Danielson, R., Gulev, S., Paul, F., Azelmat, H., Mathieu, P. P., von Schuckmann, K., Sathyendranath, S., Evers-King, H., Esau, I., Johannessen, J. A., Clayson, C. A., Pinker, R. T., Grodsky, S. A., Bourassa, M., Smith, S. R., Haines, K., Valdivieso, M., Merchant, C. J., Chapron, B., Anderson, A., Hollmann, R., and Josey, S. A.: Review and assessment of latent and sensible heat flux accuracy over the global oceans, Remote Sens. Environ., 201, 196–218, https://doi.org/10.1016/j.rse.2017.08.016, 2017.
Black, P. G., D'Asaro, E. A., Drennan, W. M., French, J. R., Niiler, P. P., Sanford, T. B., Terrill, E. J., Walsh, E. J., and Zhang, J. A.: Air–sea exchange in hurricanes: Synthesis of observations from the coupled boundary layer air–sea transfer experiment, B. Am. Meteorol. Soc., 88, 357–374, https://doi.org/10.1175/BAMS-88-3-357, 2007.
Bourassa, M. A., Gille, S. T., Jackson, D. L., Roberts, J. B., and Wick, G. A.: Ocean winds and turbulent Air-Sea fluxes inferred from remote sensing, Oceanography, 23, 36–51, https://doi.org/10.5670/oceanog.2010.04, 2010.
Chou, S., Nelkin, E., Ardizzone, J., Atlas, R. M., and Shie, C.: Surface Turbulent Heat and Momentum Fluxes over Global Oceans Based on the Goddard Satellite Retrievals, Version 2 (GSSTF2), J. Climate, 16, 3256–3273, https://doi.org/10.1175/1520-0442(2003)016<3256:STHAMF>2.0.CO;2, 2003.
Donelan, M. A., Haus, B. K., Reul, N., Plant, W. J., Stiassnie, M., Graber, H. C., Brown, O. B., and Saltzman, E. S.: On the limiting aerodynamic roughness of the ocean in very strong winds, Geophys. Res. Lett., 31, L18306, https://doi.org/10.1029/2004GL019460, 2004.
Droghei, R., Buongiorno Nardelli, B., and Santoleri, R.: A New Global Sea Surface Salinity and Density Dataset From Multivariate Observations (1993–2016), Front. Mar. Sci., 5, 1–13, https://doi.org/10.3389/fmars.2018.00084, 2018.
Dudhia, J.: Numerical study of convection observed during the winter monsoon experiment using a mesoscale two-dimensional model, J. Atmos. Sci., 3077–3107, 1989.
Edson, J., Jampana, V., Weller, R., Bigorre, S., Plueddemann, A., Fairall, C., Miller, S., Mahrt, L., Vickers, D., and Hersbach, H.: On the Exchange of Momentum over the Open Ocean, J. Phys. Oceanogr., 43, 1589–1610, https://doi.org/10.1175/JPO-D-12-0173.1, 2013.
Emanuel, K.: Contribution of tropical cyclones to meridional heat transport by the oceans, J. Geophys. Res.-Atmos., 106, 14771–14781, https://doi.org/10.1029/2000JD900641, 2001.
Fairall, C. W., Bradley, E. F., Hare, J. E., Grachev, A. A., and Edson, J. B.: Bulk parameterization of air–sea fluxes: Updates and verification for the COARE algorithm, J. Climate, 16, 571–591, https://doi.org/10.1175/1520-0442(2003)016<0571:BPOASF>2.0.CO;2, 2003.
Fairall, C. W., Yang, M., Bariteau, L., Edson, J. B., Helmig, D., Mcgillis, W., Pezoa, S., Hare, J. E., Huebert, B., and Blomquist, B.: Implementation of the Coupled Ocean-Atmosphere Response Experiment flux algorithm with CO2, dimethyl sulfide, and O3, J. Geophys. Res.-Oceans, 116, https://doi.org/10.1029/2010JC006884, 2011.
Fairall, C., Bradley, E., Rogers, D., Edson, J., and Young, G.: Bulk parameterization of air-sea fluxes for the Tropical Ocean Global Atmosphere Coupled Ocean-Atmosphere Response Experiment (TOGA-COARE), J. Geophys. Res., 101, 3747–3764, https://doi.org/10.1029/95JC03205, 1996.
Gahtan, J., Knapp, K. R., Schreck, C. J., Diamond, H. J., Kossin, J. P., and Kruk, M. C.: International best track archive for climate stewardship (IBTrACS) project, version 4r01, https://doi.org/10.25921/82ty-9e16, 2024.
Hersbach, H., Bell, B., Berrisford, P., Biavati, G., Horányi, A., Muñoz Sabater, J., Nicolas, J., Peubey, C., Radu, R., Rozum, I., Schepers, D., Simmons, A., Soci, C., Dee, D., and Thépaut, J.-N.: ERA5 hourly data on single levels from 1940 to present, Copernicus Climate Change Service (C3S) Climate Data Store (CDS) [data set], https://doi.org/10.24381/cds.adbb2d47, 2023.
Hersbach, H., Bell, B., Berrisford, P., Hirahara, S., Horányi, A., Muñoz-Sabater, J., Nicolas, J., Peubey, C., Radu, R., Schepers, D., Simmons, A., Soci, C., Abdalla, S., Abellan, X., Balsamo, G., Bechtold, P., Biavati, G., Bidlot, J., Bonavita, M., De Chiara, G., Dahlgren, P., Dee, D., Diamantakis, M., Dragani, R., Flemming, J., Forbes, R., Fuentes, M., Geer, A., Haimberger, L., Healy, S., Hogan, R. J., Hólm, E., Janisková, M., Keeley, S., Laloyaux, P., Lopez, P., Lupu, C., Radnoti, G., de Rosnay, P., Rozum, I., Vamborg, F., Villaume, S., and Thépaut, J.: The ERA5 global reanalysis, Q. J. Roy. Meteor. Soc., 146, 1999–2049, https://doi.org/10.1002/qj.3803, 2020.
Hong, S., Noh, Y., and Dudhia, J.: A new vertical diffusion package with an explicit treatment of entrainment processes, Mon. Weather Rev., 134, 2318–2341, https://doi.org/10.1175/mwr3199.1, 2006.
Huang, B., Liu, C., Banzon, V. F., Freeman, E., Graham, G., Hankins, W., Smith, T. M., and Zhang, H.: NOAA 0.25-degree Daily Optimum Interpolation Sea Surface Temperature (OISST), Version 2.1, https://doi.org/10.25921/RE9P-PT57, 2020.
Jaimes, B., Shay, L. K., and Uhlhorn, E. W.: Enthalpy and momentum fluxes during hurricane earl relative to underlying ocean features, Mon. Weather Rev., 143, 111–131, https://doi.org/10.1175/MWR-D-13-00277.1, 2015.
Kain, J. S.: The Kain-fritsch convective parameterization: An update, J. Appl. Meteorol., 43, 170–181, https://doi.org/10.1175/1520-0450(2004)043<0170:TKCPAU>2.0.CO;2, 2004.
Kalnay, E., Kanamitsu, M., Kistler, R., Collins, W., Deaven, D., Gandin, L., Iredell, M., Saha, S., White, G., Woollen, J., Zhu, Y., Chelliah, M., Ebisuzaki, W., Higgins, W., Janowiak, J., Mo, K. C., Ropelewski, C., Wang, J., Leetmaa, A., Reynolds, R., Jenne, R., and Joseph, D.: the NCEP/NCAR 40-Year reanalysis project, B. Am. Meteorol. Soc., 77, 437–472, https://doi.org/10.1175/1520-0477(1996)077<0437:TNYRP>2.0.CO;2, 1996.
Kanamitsu, M., Ebisuzaki, W., Woollen, J., Yang, S., Hnilo, J. J., Fiorino, M., and Potter, G. L.: NCEP-DOE AMIP-II reanalysis (R-2), B. Am. Meteorol. Soc., 83, 1631–1643, 2002.
Knapp, K. R., Kruk, M. C., Levinson, D. H., Diamond, H. J., and Neumann, C. J.: the international best track archive for climate stewardship (IBTrACS): Unifying tropical cyclone data, B. Am. Meteorol. Soc., 91, 363–376, https://doi.org/10.1175/2009BAMS2755.1, 2010.
Lin, Y., Farley, R. D., and Orville, H. D.: Bulk parameterization of the snow field in a cloud model, J. Appl. Meteorol. Clim., 22, 1065–1092, https://doi.org/10.1175/1520-0450(1983)0222.0.CO;2, 1983.
Liu, J., Curry, J. A., Clayson, C. A., and Bourassa, M. A.: High-Resolution satellite surface latent heat fluxes in north atlantic hurricanes, Mon. Weather Rev., 139, 2735–2747, https://doi.org/10.1175/2011MWR3548.1, 2011.
Ma, Z.: A Study of the Interaction between Typhoon Francisco (2013) and a Cold-Core Eddy. Part I: Rapid Weakening, J. Atmos. Sci., 77, 355–377, https://doi.org/10.1175/JAS-D-18-0378.1, 2020.
Ma, Z., Fei, J., Huang, X., and Cheng, X.: contributions of surface sensible heat fluxes to tropical cyclone. Part i: Evolution of tropical cyclone intensity and structure, J. Atmos. Sci., 72, 120–140, https://doi.org/10.1175/JAS-D-14-0199.1, 2015.
Ma, Z., Fei, J., Lin, Y., and Huang, X.: Modulation of clouds and rainfall by tropical cyclone's cold wakes, Geophys. Res. Lett., 47, https://doi.org/10.1029/2020GL088873, 2020.
Mears, C., Lee, T., Ricciardulli, L., Wang, X., and Wentz, F.: RSS Cross-Calibrated Multi-Platform (CCMP) 6-hourly ocean vector wind analysis on 0.25 deg grid, Version 3.0, Remote Sensing Systems, Version 3.0, Santa Rosa, CA, https://doi.org/10.56236/RSS-uv6h30, 2022.
Mei, W., Primeau, F., Mcwilliams, J. C., and Pasquero, C.: Sea surface height evidence for long-term warming effects of tropical cyclones on the ocean, P. Natl. Acad. Sci. USA, 110, 15207–15210, https://doi.org/10.1073/pnas.1306753110, 2013.
Mlawer, E. J., Taubman, S. J., Brown, P. D., Iacono, M. J., and Clough, S. A.: Radiative transfer for inhomogeneous atmospheres: RRTM, a validated correlated-k model for the longwave, J. Geophys. Res.-Atmos., 102, 16663–16682, 1997.
Peng, W., Ma, Z., Zhang, D., Ye, H., and Fei, J.: A Global Surface Turbulence Heat Flux Dataset resolving tropical cyclones, Science Data Bank [data set], https://doi.org/10.57760/sciencedb.24400, 2025.
Powell, M. D., Vickery, P. J., and Reinhold, T. A.: Reduced drag coefficient for high wind speeds in tropical cyclones, Nature, 422, 279–283, https://doi.org/10.1038/nature01481, 2003.
Roberts, J. B., Robertson, F. R., Clayson, C. A., and Bosilovich, M. G.: Characterization of turbulent latent and sensible heat flux exchange between the atmosphere and ocean in MERRA, J. Climate, 25, 821-838, https://doi.org/10.1175/JCLI-D-11-00029.1, 2012.
Song, X., Ning, C., Duan, Y., Wang, H., Li, C., Yang, Y., Liu, J., and Yu, W.: Observed extreme air–sea heat flux variations during three tropical cyclones in the tropical southeastern indian ocean, J. Climate, 34, 3683–3705, https://doi.org/10.1175/JCLI-D-20-0170.1, 2021.
Tomita, H., Hihara, T., Kako, S. I., Kubota, M., and Kutsuwada, K.: An introduction to J-OFURO3, a third-generation Japanese ocean flux data set using remote-sensing observations, J. Oceanogr., 75, 171–194, https://doi.org/10.1007/s10872-018-0493-x, 2019.
Trenberth, K. E. and Fasullo, J.: Water and energy budgets of hurricanes and implications for climate change, J. Geophys. Res.-Atmos., 112, https://doi.org/10.1029/2006JD008304, 2007.
Trenberth, K. E., Davis, C. A., and Fasullo, J.: Water and energy budgets of hurricanes: Case studies of Ivan and Katrina, J. Geophys. Res.-Atmos., 112, https://doi.org/10.1029/2006JD008303, 2007.
Vincent, E. M., Lengaigne, M., Madec, G., Vialard, J., Samson, G., Jourdain, N. C., Menkes, C. E., and Jullien, S.: Processes setting the characteristics of sea surface cooling induced by tropical cyclones, J. Geophys. Res.-Oceans, 117, https://doi.org/10.1029/2011JC007396, 2012.
Willoughby, H. E.: Normal-Mode initialization of barotropic vortex motion models, J. Atmos. Sci., 52, 4501–4514, https://doi.org/10.1175/1520-0469(1995)052<4501:NMIOBV>2.0.CO;2, 1995.
Willoughby, H. E., Darling, R. W. R., and Rahn, M. E.: parametric representation of the primary hurricane vortex. Part II: A new family of sectionally continuous profiles, Mon. Weather Rev., 134, 1102–1120, https://doi.org/10.1175/MWR3106.1, 2006.
Xie, X., Wei, Z., Wang, B., Chen, Z., Oltmanns, M., and Song, X.: Extreme air–sea turbulent fluxes during tropical cyclone Barijat observed by a newly designed drifting buoy, Fundament. Res., 4, 1225–1234, https://doi.org/10.1016/j.fmre.2022.08.022, 2024.
Ye, H., Ma, Z., Fei, J., Trenberth, K. E., Tanhua, T., and Cheng, L.: Reduction of tropical cyclone-induced ocean carbon outgassing since 1993, Nat. Geosci., 19, 630–638, https://doi.org/10.1038/s41561-026-01985-4, 2026.
Yu, L. and Weller, R. A.: Objectively Analyzed Air–Sea Heat Fluxes for the Global Ice-Free Oceans (1981–2005), B. Am. Meteorol. Soc., 88, 527–540, https://doi.org/10.1175/BAMS-88-4-527, 2007.
Yu, L., Weller, R. A., and Sun, B.: Improving Latent and Sensible Heat Flux Estimates for the Atlantic Ocean (1988–99) by a Synthesis Approach, J. Climate, 17, 373–393, https://doi.org/10.1175/1520-0442(2004)017<0373:ILASHF>2.0.CO;2, 2004.
Zhang, J. A., Black, P. G., French, J. R., and Drennan, W. M.: First direct measurements of enthalpy flux in the hurricane boundary layer: The CBLAST results, Geophys. Res. Lett., 35, https://doi.org/10.1029/2008GL034374, 2008.