the Creative Commons Attribution 4.0 License.
the Creative Commons Attribution 4.0 License.
 | 01 Sep 2026
A global 30 m disturbance-recovery age dataset for young natural and planted forests (1985–2024)
Yan Wang
Hengbin Wang
Chaoran Liang
Xiyi Li
Zhe Liu
Xiaodong Zhang
Shaoming Li
Jinming Yang
Yuanyuan Zhao

Natural and planted forests differ substantially in ecological functions and economic values, with forest age serving as a key indicator of their developmental and carbon dynamics. However, existing global forest age datasets remain limited by coarse spatial resolution and insufficient representation of forest origin differences. In this study, we developed a 30 m global disturbance-recovery age dataset (1985–2024) by integrating Landsat time series with the Continuous Change Detection and Classification (CCDC) algorithm on Google Earth Engine. To account for differences in successional behavior between natural forests (NF) and planted forests (PF), we introduced a type-stratified processing framework. Specifically, a Global Natural and Planted Forest (GNPF) mask was used to guide forest-type-dependent refinement during the post-segmentation stage, where dual-threshold segment fusion rules were applied (> 0.03 for NF and > 0.04 for PF, respectively) to better align spectral recovery trajectories with expected recovery patterns. In addition, we generated a pixel-level Spatial Uncertainty Index (SUI) derived from model residuals to quantify mapping reliability. Validation using extensive reference samples demonstrates good agreement between estimated and observed forest age (R2 = 0.74, RMSE = 7.17 years). Globally, NF displayed contrasting age structures, with older stands prevalent in Europe (84.38 %), South America (82.61 %), and North America (80.62 %), while Australia showed a bimodal distribution reflecting both mature and regenerating forests. PF were generally younger, with young stands concentrated in Australia (Age 1–5: 65.77 %) and relatively older plantations in Europe (Age 36–40: 53.99 %). The dataset provides a spatially explicit characterization of forest age patterns and can support studies of forest carbon dynamics, ecosystem modeling, and global assessments of forest structural changes. The dataset is publicly available at Zenodo (https://doi.org/10.5281/zenodo.22030377, Wang et al., 2026).
- Article
(8607 KB) - Full-text XML
- BibTeX
- EndNote


Forests represent one of the most vital ecosystems on Earth, covering approximately 31 % of the global land surface and providing habitats for most terrestrial species (FAO, 2024). They play a central role in regulating the global carbon cycle, storing nearly 296 billion tons of carbon and contributing to climate stability, hydrological balance, and biodiversity conservation (Murphy et al., 2025; Thompson et al., 2009; Noss, 1999; FAO, 2024). Beyond ecological functions, forests supply wood, fiber, fuel, and food, supporting the livelihoods of billions of people worldwide (Oldekop et al., 2020; Steel et al., 2024). In the context of accelerating climate change and global sustainability challenges, characterizing forest structure and dynamics – particularly forest stand age – has become indispensable for assessing carbon sequestration potential, guiding restoration efforts, and ensuring long-term ecological and social resilience (Tian et al., 2024; Leng et al., 2024; Erdozain et al., 2024; Zhang et al., 2023).
Stand age represents one of the most critical dimensions differentiating NF and PF in terms of spectral recovery characteristics and carbon sequestration capacity (Liang et al., 2022; Köhl et al., 2017). PF typically exhibit uniform age structures, with vegetation and soil carbon storage increasing continuously with age. However, their total carbon accumulation is generally lower and highly dependent on management regimes (Zou and Song, 2023; Cao et al., 2025). In contrast, NF possess longer growth cycles and complex age distributions; their carbon sequestration rate tends to stabilize after maturity, resulting in higher total carbon stocks and richer ecosystem functions (He et al., 2022; Liang et al., 2022; Shi et al., 2022; Liao et al., 2023). These divergent age-carbon relationships introduce significant uncertainties in carbon sink estimation when using models such as the Integrated Terrestrial Ecosystem C-budget (InTEC) model (Chen et al., 2000). Accurate information on both forest type and age can improve the representation of forest dynamics in carbon accounting models (Mo et al., 2024; Cheng et al., 2024b). To fully assess the contribution of both forest types to climate mitigation and biodiversity conservation, mapping their age distributions at the global scale is of paramount importance (Aszalós et al., 2022).
The evolution of forest age estimation has progressed through several stages of remote sensing approaches. Early statistical models and image classification approaches frequently struggled to capture complex nonlinear relationships or faced spectral saturation in heterogeneous landscapes (Reyes-Palomeque et al., 2021). Remote sensing inversion methods, including K-Nearest Neighbor and Random Forest regression, were introduced to better capture these nonlinearities; however, they remain vulnerable to overfitting when applied across diverse and complex ecosystems (Tang et al., 2020). To circumvent these issues, multi-sensor fusion – utilizing synthetic aperture radar's (SAR's) canopy penetration and LiDAR's vertical structural profiling – has provided high-precision regional benchmarks (Trisasongko et al., 2020; Champion et al., 2013; Racine et al., 2014). Nevertheless, the prohibitive costs and sparse temporal coverage of LiDAR, coupled with terrain-induced noise in SAR, have restricted their application for continuous global monitoring. Consequently, with the opening of the Landsat archive, time-series algorithms like LandTrendr and the Continuous Change Detection and Classification (CCDC) have become widely used frameworks. By analyzing pixel-level spectral trajectories, these approaches can track both abrupt disturbances and gradual recovery, offering a trajectory-based characterization of disturbance-recovery dynamics (Li et al., 2024; Du et al., 2022; Xiao et al., 2023).
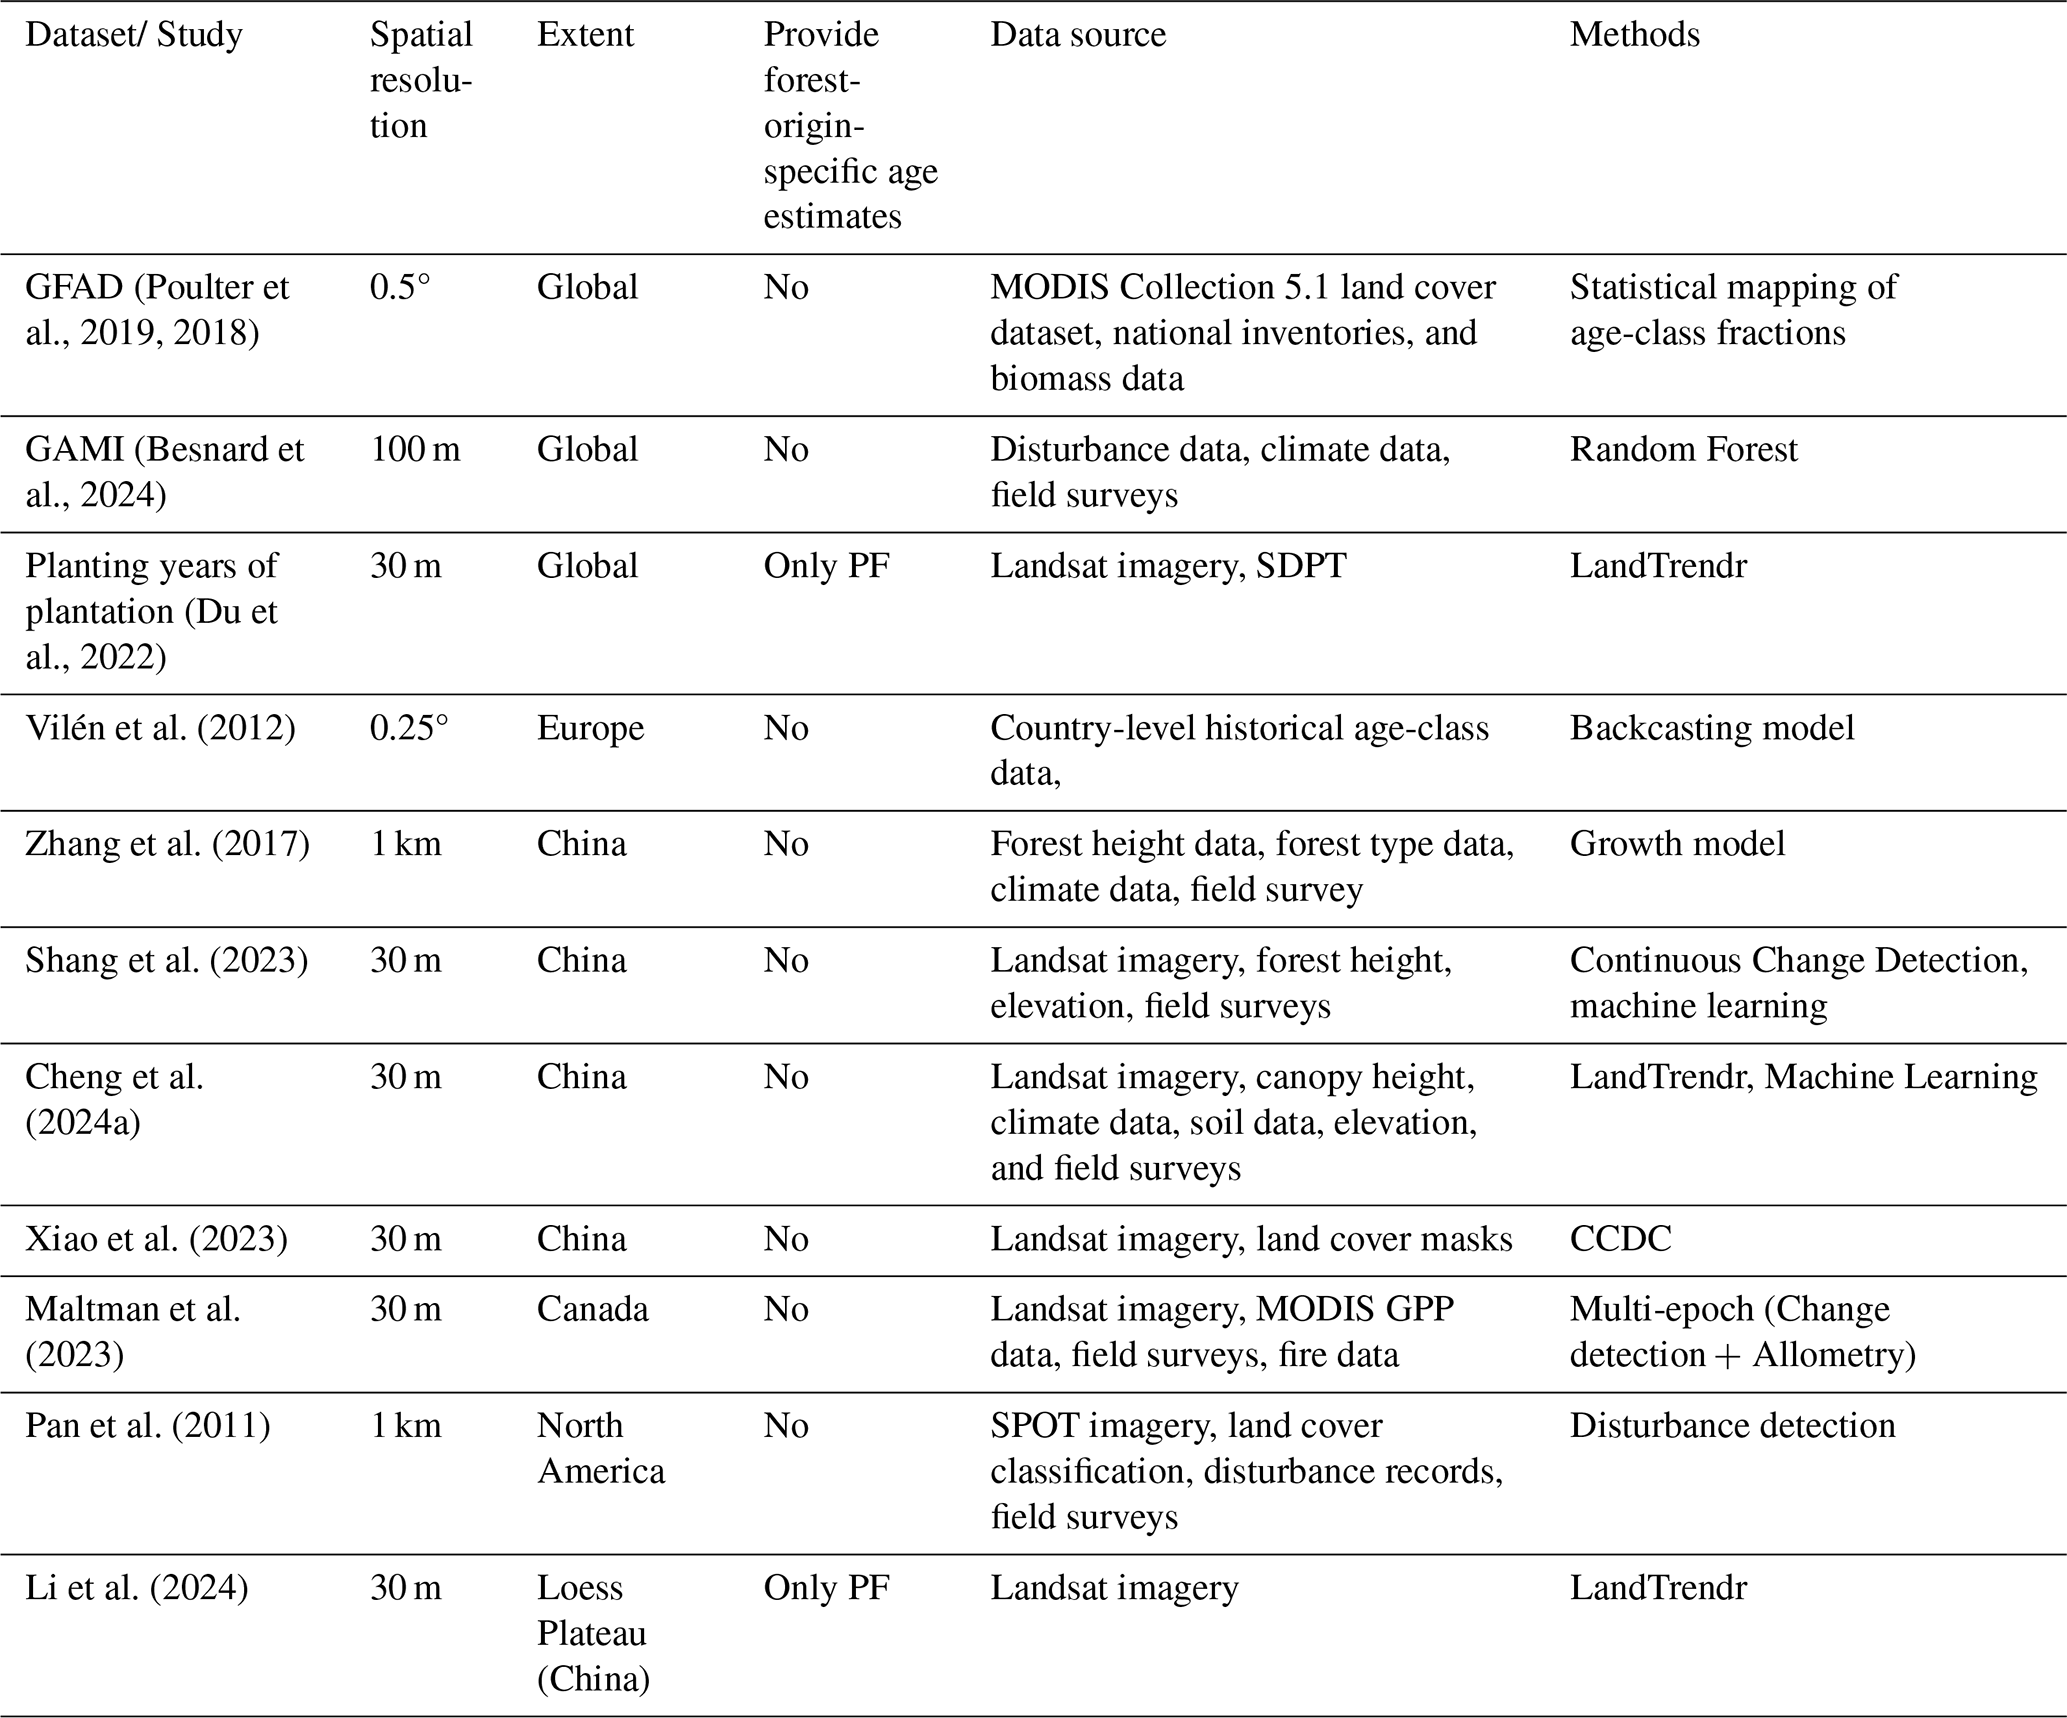
Despite these methodological advancements, a gap exists between global monitoring needs and currently available products. Foundational datasets like the Global Forest Age Dataset (GFAD) rely on national inventories and biomass-age relationships but lack the spatial resolution (0.5°) to capture fragmented forest patches and mosaic landscapes prevalent in the satellite era (Poulter et al., 2018). Subsequent efforts have pushed the resolution boundaries, notably the 1 km global dataset developed by Besnard et al. (2021) and its 100 m successor, the Global Age Mapping Integration (GAMI) (Besnard et al., 2024). However, while GAMI represents a major leap in spatial detail, these products often depend on static snapshots or biomass-inversion rather than explicit, multi-decadal change detection. More recently, Du et al. (2022) created a 30 m resolution global dataset of planting years of plantation (PYP) based on Landsat time-series analysis, offering higher spatial detail but focusing solely on PF. At national scales, 30 m mapping has achieved success in regions like Canada (Maltman et al., 2023), Europe (Vilén et al., 2012), and China (Zhang et al., 2017), yet these efforts are often hindered by disparate inventory standards that prevent global harmonization. Crucially, as summarized in Table 1, existing global and regional forest age products generally estimate forest age without explicitly incorporating forest origin information. As a result, age distributions of natural and planted forests are typically represented as a single undifferentiated forest type, limiting assessments of their contrasting successional trajectories, carbon dynamics, and management histories.
Table 1Comparison of major global and regional forest age products.
While these diverse approaches offer complementary advantages – ranging from the local-scale precision of inversion models to the temporal continuity of time-series algorithms – significant barriers to global, high-resolution forest age mapping remain. First, the majority of extant large-scale datasets lack the spatial resolution necessary to capture fine-scale age heterogeneity in fragmented landscapes (Smolina et al., 2023). Second, the failure to differentiate between NF and PF in most products undermines the reliability of carbon sequestration estimates, given their contrasting age-carbon trajectories (Yu et al., 2024; Su et al., 2023). Third, the geographic or functional confinement of existing 30 m products to specific regions or single forest types limits their applicability for global-scale carbon accounting (Besnard et al., 2021; Huang et al., 2023; Maza et al., 2021; Lu et al., 2025). Consequently, a globally consistent forest age dataset that simultaneously provides high spatial resolution, explicit forest type differentiation, and long-term temporal coverage has not yet been fully achieved worldwide.
To address these limitations, this study develops a globally consistent 30 m forest age dataset (1985–2024) based on Landsat time-series analysis and the CCDC framework, incorporating a forest-type-based stratification strategy to differentiate between natural and planted forests during the post-segmentation refinement stage. In this study, forest age represents disturbance-recovery age derived from Landsat time-series observations. Leveraging the Google Earth Engine (GEE) platform, we implemented the CCDC algorithm on Landsat 4–8 archives (1985–2024) to track pixel-level forest dynamics. A key methodological contribution of our approach is the integration of a prior-informed semantic merging logic. By incorporating forest-type information from the Global Natural and Planted Forests (GNPF) dataset to guide type-specific spectral trajectory refinement, we developed a forest-origin-informed segment fusion strategy to reduce fragmentation of spectrally continuous recovery trajectories caused by premature CCDC segmentation. This refinement improves the representation of disturbance-recovery duration by reducing fragmentation associated with delayed spectral stabilization.
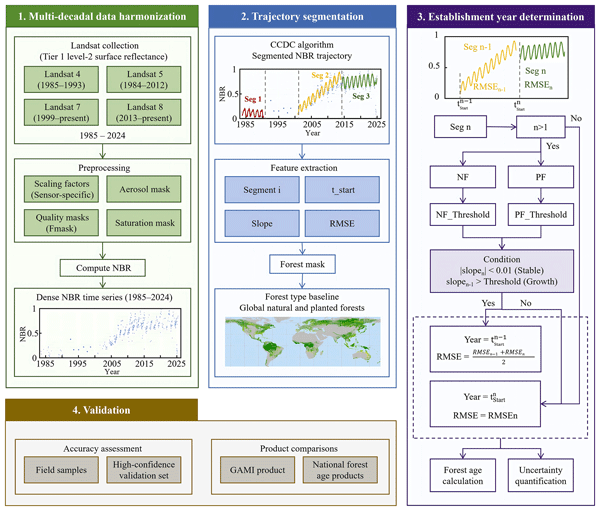
The workflow of this study includes four main stages (Fig. 1). First, a multi-decadal Landsat NBR time series (1985–2024) was constructed and harmonized using the GEE platform. Second, the CCDC algorithm was employed to perform synergistic temporal segmentation, decomposing the spectral trajectories into discrete, homogeneous segments, while the GNPF dataset was integrated to provide thematic baselines. Third, a type-specific segment-fusion logic was implemented to reconcile spectral stabilization lags and back-propagate the establishment year based on the distinct spectral recovery characteristics of each forest type, complemented by a pixel-wise Root Mean Square Error (RMSE) analysis to quantify model uncertainty. Finally, the estimated disturbance-recovery age was rigorously validated using a multi-source evidence synthesis framework.
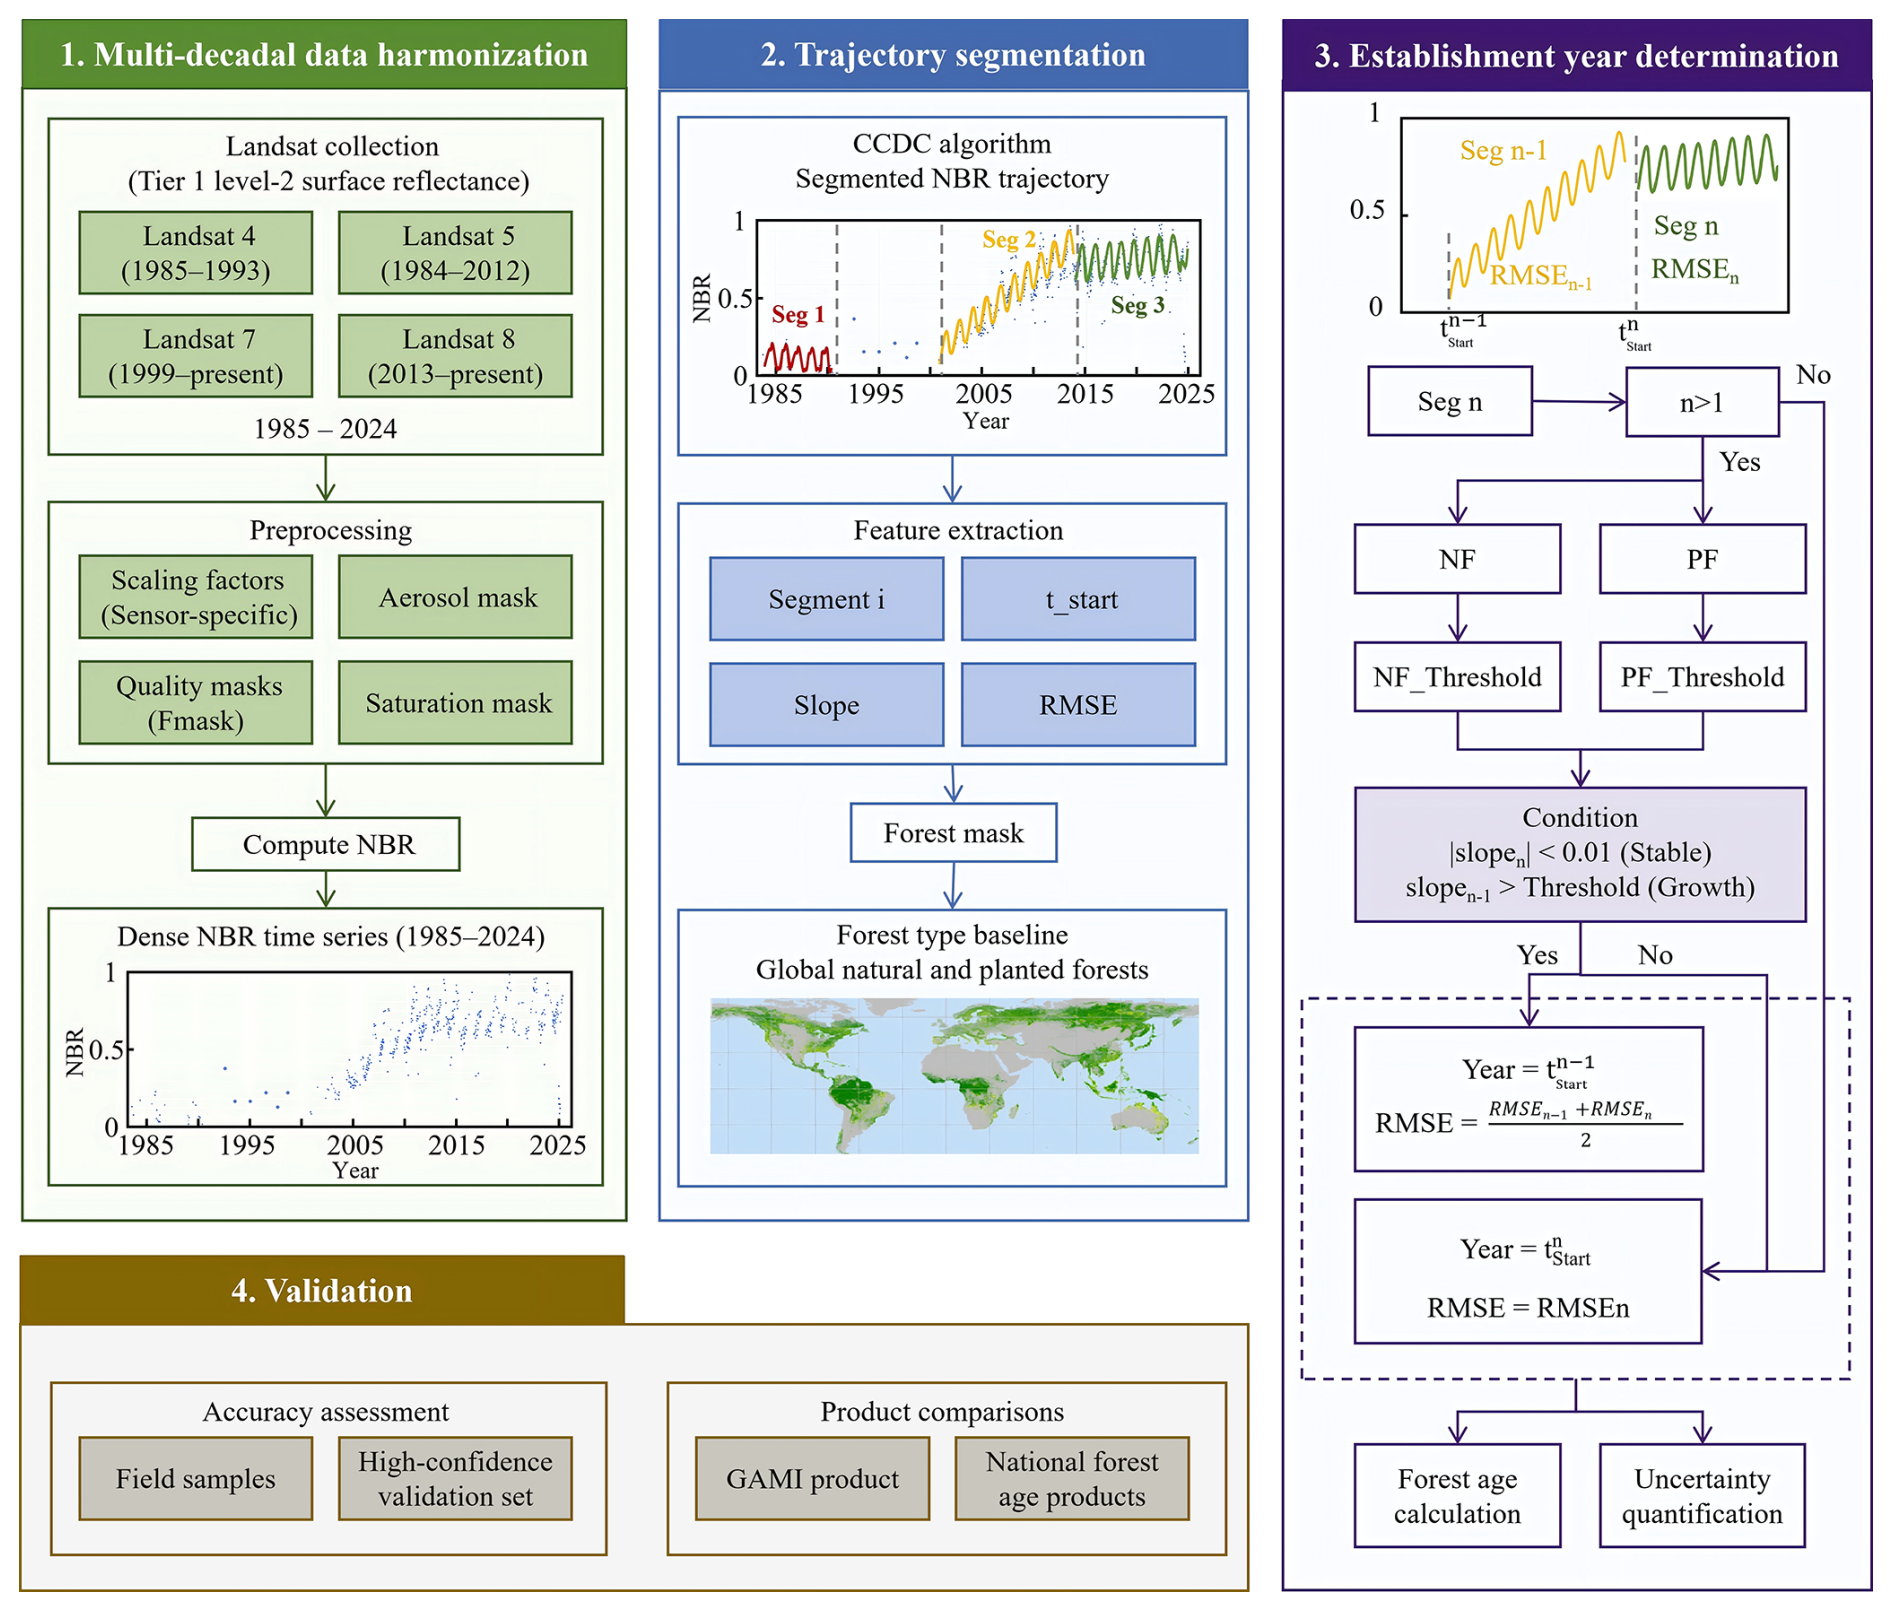
Figure 1Workflow of estimating forest age for global natural and planted forests.
2.1 Global natural and planted forests dataset
The GNPF dataset provides the global distribution of natural and planted forests at 30 m spatial resolution for 2021 (Xiao et al., 2024). Derived from Landsat time-series imagery (1985–2021), the dataset distinguishes forest types based on differences in disturbance frequency, achieving an overall accuracy (OA) of 85 %. The proportions of forest types are consistent with the FAO's Global Forest Resources Assessment 2020, ensuring high thematic reliability. The GNPF dataset was used to generate a forest type mask that separates natural and planted forest pixels. This mask served as a spatial reference for forest age estimation, enabling forest-age characterization for each forest type separately.
2.2 Time series construction and data harmonization
A multi-decadal Landsat time series (1985–2024) was constructed by leveraging the extensive data catalog of the GEE platform. We ingested all available Tier 1 Level-2 surface reflectance products from Landsat 4, 5, 7, and 8 (TM, ETM+, and OLI sensors). These products were preprocessed using the LEDAPS and LaSRC algorithms for radiometric calibration and atmospheric correction (Ju et al., 2012; Vermote et al., 2018). To ensure a high-quality temporal stack, we implemented rigorous quality masking – including QA_PIXEL for cloud and shadow removal, alongside aerosol and saturation filters. Furthermore, to maintain radiometric consistency across generations of sensors, Landsat 8 reflectance values were normalized to match the ETM+ sensor using established scaling factors.
Vegetation indices are sensitive indicators of canopy condition and ecosystem successional dynamics. In this study, the Normalized Burn Ratio (NBR) was selected as the core spectral indicator due to its high responsiveness to both abrupt canopy loss and gradual post-disturbance recovery (Bright et al., 2019; Escuin et al., 2008; Ryu et al., 2018). NBR, calculated from the Near-Infrared (NIR) and shortwave infrared (SWIR2) bands, effectively captures structural and moisture changes in vegetation, making it particularly suitable for detecting forest loss and subsequent spectral recovery following disturbances such as fire or logging. The NBR is calculated as follows:
2.3 Trajectory segmentation and parameter extraction
The CCDC algorithm was executed to decompose the 40-year NBR time series into discrete, chronologically homogeneous segments. This algorithm fits a robust harmonic regression model – incorporating long-term trend and intra-annual seasonal components – via ordinary least squares (OLS) to capture steady-state land surface behavior. Land surface modifications or abrupt disturbances are flagged when a sequence of consecutive observations deviates substantially from the predicted model boundaries beyond a specified statistical threshold (chiSquareProbability = 0.99, Table 2). The mathematical formulation of the CCDC fitting model is expressed as follows:
Where represents the predicted value of the ith band of fitted Julian date x; i represents the ith spectral band; T represents the number of days in each year; a0,i represents the intercept coefficient of the ith Landsat band; a1,i and b1,i represent the coefficient of the intra-annual variation term of the reflectance of the ith band; a2,i and b2,i represent coefficients for inter-annual change for the ith band; N represents the number of years.
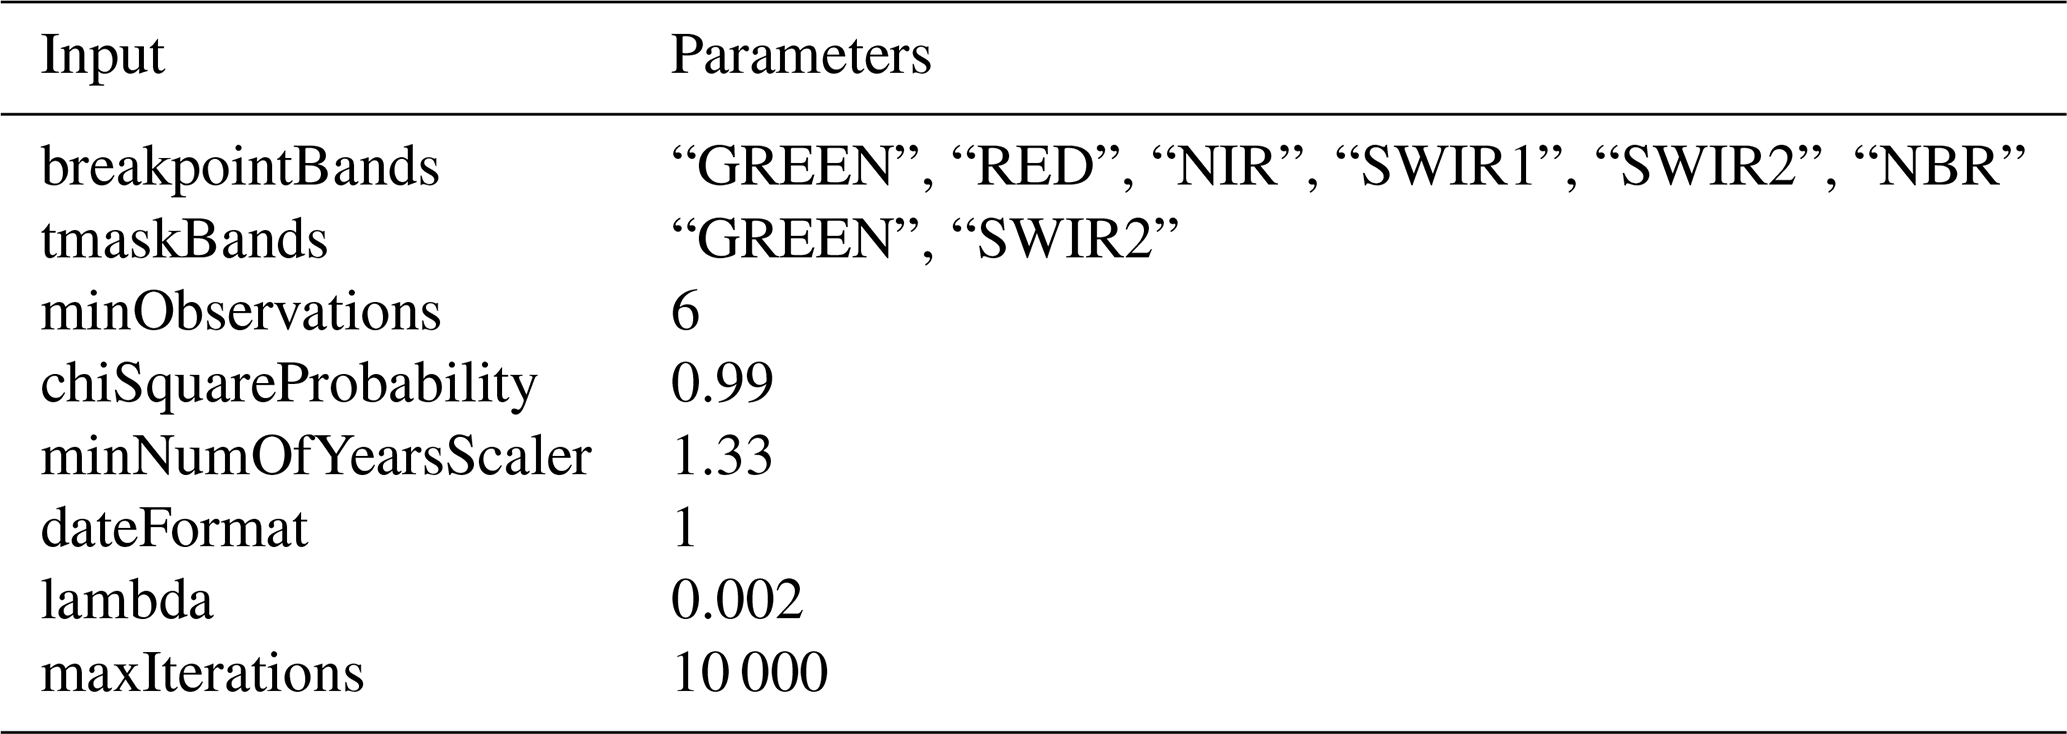
For each successfully initialized model segment, critical temporal attributes were extracted: the model initialization time (tStart), segment end time, the slope (denoting the spectral recovery or degradation rate), and the RMSE. Crucially, tStart represents the starting date of each fitted harmonic model segment after a detected spectral change. For pixels exhibiting zero structural breakpoints across the entire 1985–2024 archive, the entire timeline was cataloged as a single stable segment, establishing the baseline for assigning older forest age classes (≥40 years). The principal execution parameters for CCDC are detailed in Table 2.
2.4 Disturbance-recovery age estimation
2.4.1 Definition of forest age
Forest age in this study is operationally defined as the time elapsed since the most recent detectable disturbance event identified from Landsat time-series observations (Xiao et al., 2023). Because optical time-series methods cannot directly distinguish stand-replacing from non-stand-replacing disturbances, the resulting estimates should be interpreted as disturbance-recovery age rather than inventory-based stand age. In cases where partial disturbances such as selective logging, thinning, insect outbreaks, or low-severity fires generate detectable spectral breakpoints, the estimated age reflects the timing of the disturbance signal rather than the actual age of surviving trees.
2.4.2 Type-specific adaptive segment-fusion logic
Recognizing that these forest types exhibit distinct post-disturbance spectral recovery trajectories, we implemented a dual-threshold segment-fusion logic. This approach utilizes the GNPF mask as a spatial constraint during the algorithmic execution phase, thereby allowing forest-type information to guide the selection of type-specific fusion criteria. The fusion logic was specifically designed to reconcile the systematic lag between the initial disturbance and the stabilization of the subsequent spectral model, as illustrated in Stage 3 of the framework (Fig. 1). To balance model parsimony with regional robustness, the baseline fusion thresholds for each forest type were derived from the statistical distributions of reference samples across major global climate zones. Prior to global implementation, we analyzed the post-disturbance spectral recovery slopes using representative stands from tropical, temperate, arid, and boreal ecosystems. This data-driven calibration revealed distinct spectral recovery regimes between the two forest types, leading to the designation of generalized, scaled thresholds to guide the global segment fusion (detailed in Sect. 3.1.1). Specifically, for NF, the framework identifies the transition from a rapid recovery phase to a stable spectral state; if a terminal stable segment () is preceded by a regrowth segment with a slope exceeding 0.03, the segments are fused to extend the estimated recovery trajectory toward the initial disturbance period. Conversely, for PF, a more stringent regrowth threshold (slope>0.04) is enforced to account for the stronger early-stage spectral recovery signals observed in plantation forests. By tailoring these thresholds to the specific spectral recovery rates of NF and PF, the model reduces age fragmentation caused by premature spectral segmentation during early recovery stages.
2.4.3 Age qualification and reliability mapping
The final disturbance-recovery age was calculated by subtracting the validated disturbance year of the terminal sequence from the reference year (2024). Pixels where the spectral trajectory remained stable throughout the entire 1985–2024 observation window, indicating no stand-replacing disturbances within the Landsat record, were assigned an age class of ≥40 years. To provide a spatially explicit assessment of the product reliability, we generated a pixel-wise uncertainty map based on the RMSE. This metric is dynamically coupled with our segment-fusion logic: for pixels where no fusion occurred, the RMSE of the terminal stable segment was utilized; for pixels where rapid-recovery and steady-state segments were fused, the uncertainty was calculated as the weighted average RMSE across both segments. By linking uncertainty directly to the trajectory fitting quality, we allow users to identify regions where complex sub-pixel dynamics or residual atmospheric noise may impact the precision of the age estimates.
2.4.4 Adaptive grid partitioning across global continents
To ensure computational efficiency and facilitate large-scale processing, an adaptive grid partitioning scheme was developed based on the Large Scale International Boundary (LSIB) dataset from the U.S. Department of State's Office of the Geographer (2017). The dataset, which integrates and simplifies global administrative boundaries while maintaining essential regional distinctions, provides sufficient spatial precision for continental-scale analysis. Using the “Continental Region” layer of the LSIB, the global landmass was divided into spatial units for independent CCDC processing. As the GNPF dataset did not predict any forest cover in the South Atlantic, Antarctica, and Greenland (within the North American region), these areas were excluded from subsequent analyses. This exclusion reduced computational redundancy and prevented interference from invalid grids, thereby enhancing global processing efficiency.
2.5 Generation of validation samples
To rigorously evaluate the accuracy of forest age estimates, we established a validation framework integrating high-resolution imagery with dense spectral time-series trajectories (Fig. 2). The global land surface was first partitioned into 57 559 independent 0.5° × 0.5° grid cells to ensure spatial representativeness. Within each grid, a stratified random sampling strategy was applied to select five samples for each forest type, achieving global spatial uniformity and avoiding clustering.
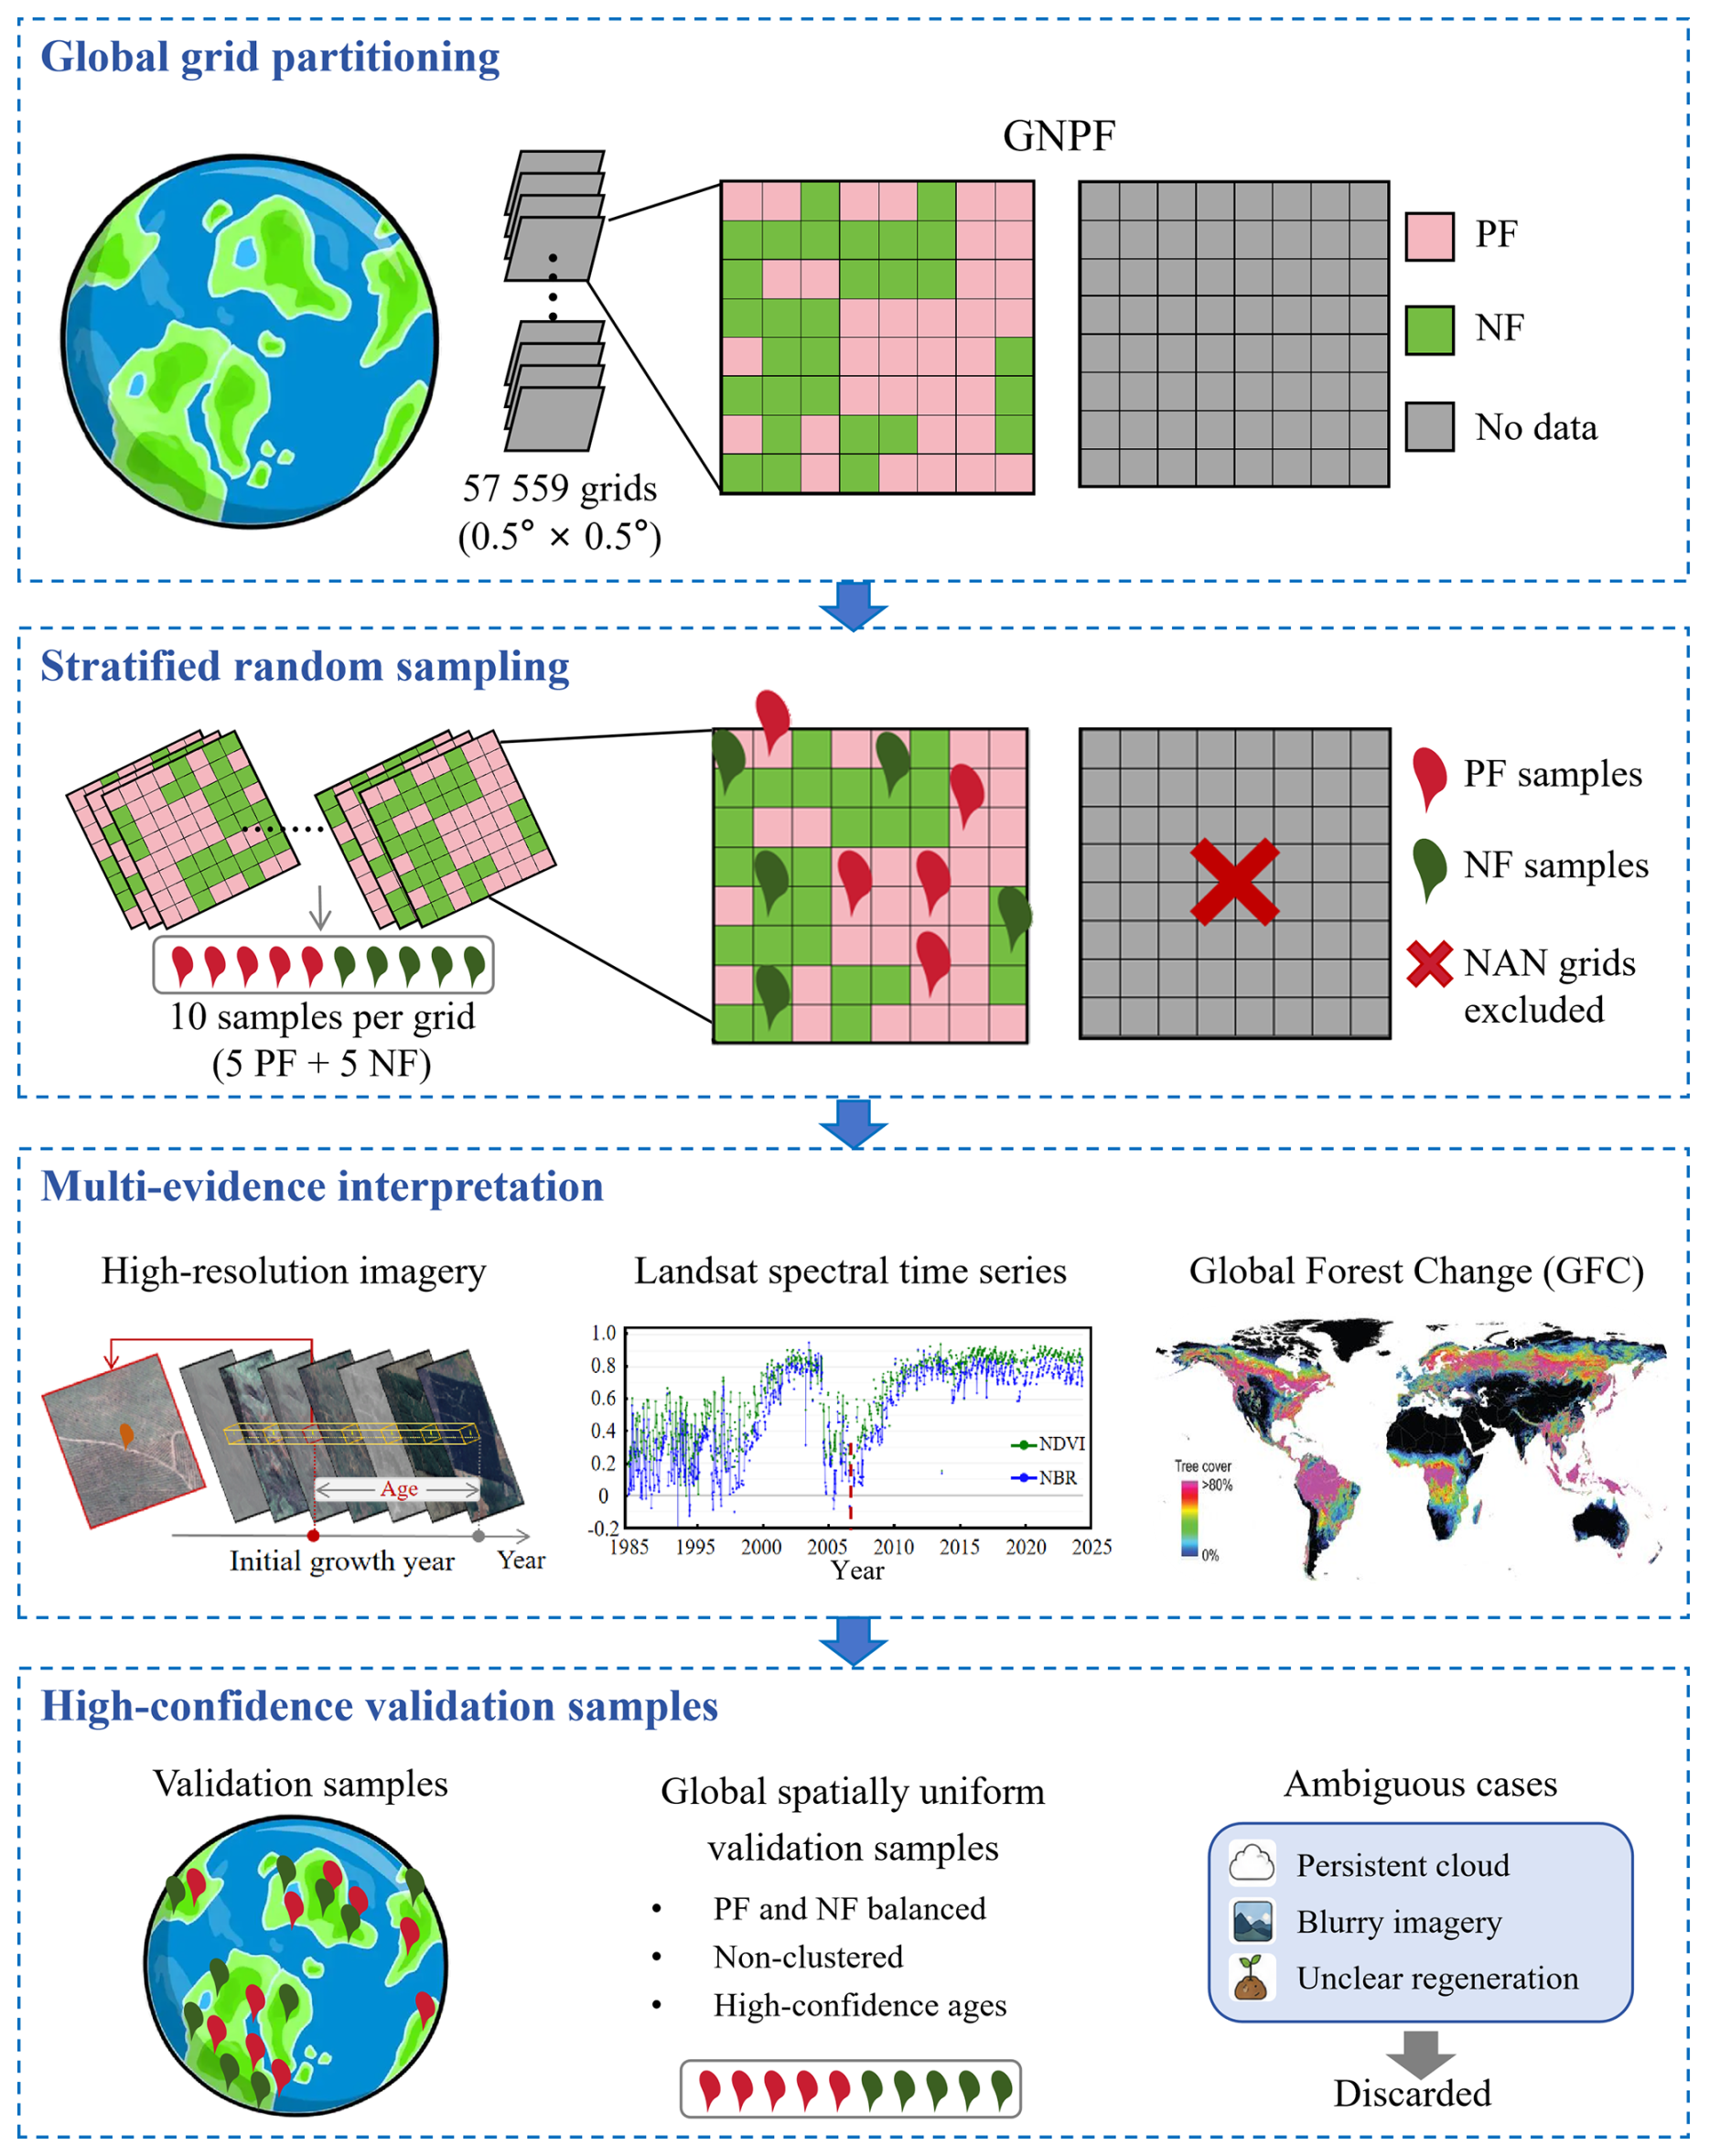
Figure 2Workflow for generating validation samples using global grid-based stratified sampling.
The reference forest age for each sample was determined through a multi-evidence interpretation protocol rather than visual interpretation from a single data source. In this study, forest age was defined as the duration of the current recovery cycle following the most recent detectable major disturbance event. The disturbance timing was primarily constrained using annual Landsat-derived spectral trajectories (NBR and NDVI) and the Global Forest Change (GFC) dataset, while historical high-resolution imagery from Google Earth was used as supplementary evidence to verify canopy conditions and disturbance patterns. In this framework, the GFC loss year provided an independent initial estimate of disturbance timing, which was further evaluated against Landsat spectral breakpoints to identify the onset of the current recovery cycle. To address the limitations of inconsistent image quality and temporal gaps in Google Earth (particularly for the 1985–2000 period), an establishment year was confirmed only when the evidence from spectral trajectories, GFC records, and available spatial imagery reached a consensus. For ambiguous cases – such as pixels with persistent cloud cover, blurry historical snapshots, or unclear natural regeneration signals – the samples were excluded to maintain a high-confidence reference set. Ultimately, we obtained 8085 forest age samples, including 4021 NF samples and 4064 PF samples.
3.1 Forest age accuracy assessment and validation
The performance of the Global 30 m Forest Age Map for Natural and Planted Forests (GFAM-N/P) was evaluated using five complementary validation sources, including global interpretation samples and field observations, regional forest age datasets, a global benchmark product, national forest inventory data, and a pixel-level uncertainty assessment. Together, these datasets provide validation across multiple forest biomes, spatial scales, and methodological frameworks.
3.1.1 Spectral recovery trajectories and calibration of fusion thresholds
From the comprehensive global reference database, pixels were screened using a two-stage spectral trajectory filtering workflow to identify representative post-disturbance recovery sequences. First, the terminal segment of a pixel's trajectory had to represent a steady-state phase, defined by an absolute regression slope of . Second, the framework traced backward to verify that the immediately preceding sequence (the penultimate segment) exhibited a clear post-disturbance recovery trajectory with a positive growth rate (slope>0). Only samples meeting both criteria simultaneously were included in the statistical analysis, thereby filtering out stable non-disturbed forests or ongoing disturbances. This selection yielded a highly refined sample pool representing consistent post-disturbance spectral recovery patterns across major global climate zones.
The statistical extraction of these qualified regrowth slopes revealed a systematic and robust divergence in spectral recovery rates between NF and PF. Across all investigated macro-climates (Tropical, Arid, Temperate, and Boreal), the regrowth slopes of NF clustered tightly within a relatively narrow range of 0.025–0.033, yielding a global baseline average of 0.029. Conversely, PF exhibited stronger early-stage spectral recovery signals, with mean regrowth slopes shifting upward to a range of 0.035 to 0.044 (global baseline average of 0.038), capturing the rapid spectral recovery characteristics commonly observed in managed plantations (Fig. 3).
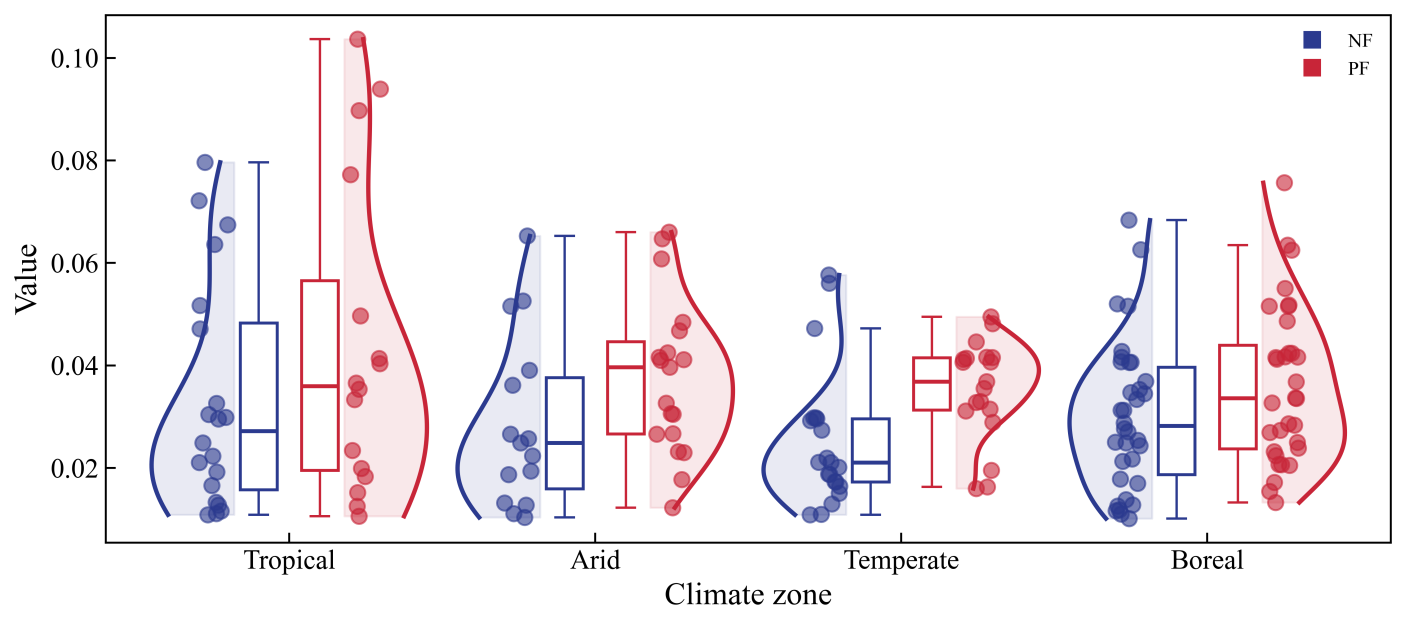
Figure 3Statistical distributions of the post-disturbance spectral recovery slopes for NF and PF across major global climate zones.
Eco-climatic variations exerted a secondary, localized modulation on these spectral recovery trajectories. For instance, favorable year-round environmental conditions in tropical regions elevated the mean regrowth slope of PF to a maximum of 0.044. Despite these regional variations, the statistical boundaries between NF and PF trajectories remained distinct and non-overlapping within each climate zone. Consequently, scaling these empirically derived distributions into generalized thresholds of 0.03 for NF and 0.04 for PF effectively accommodates type-specific spectral recovery variations, establishing a robust empirical foundation for tracking global forest development.
3.1.2 Global accuracy assessment using independent reference samples
To evaluate the accuracy of GFAM-N/P, we compiled a reference database consisting of 8365 samples (Fig. 4a), including 8085 high-confidence interpreted samples generated through our multi-evidence protocol (Sect. 2.5) and 280 independent field survey samples.
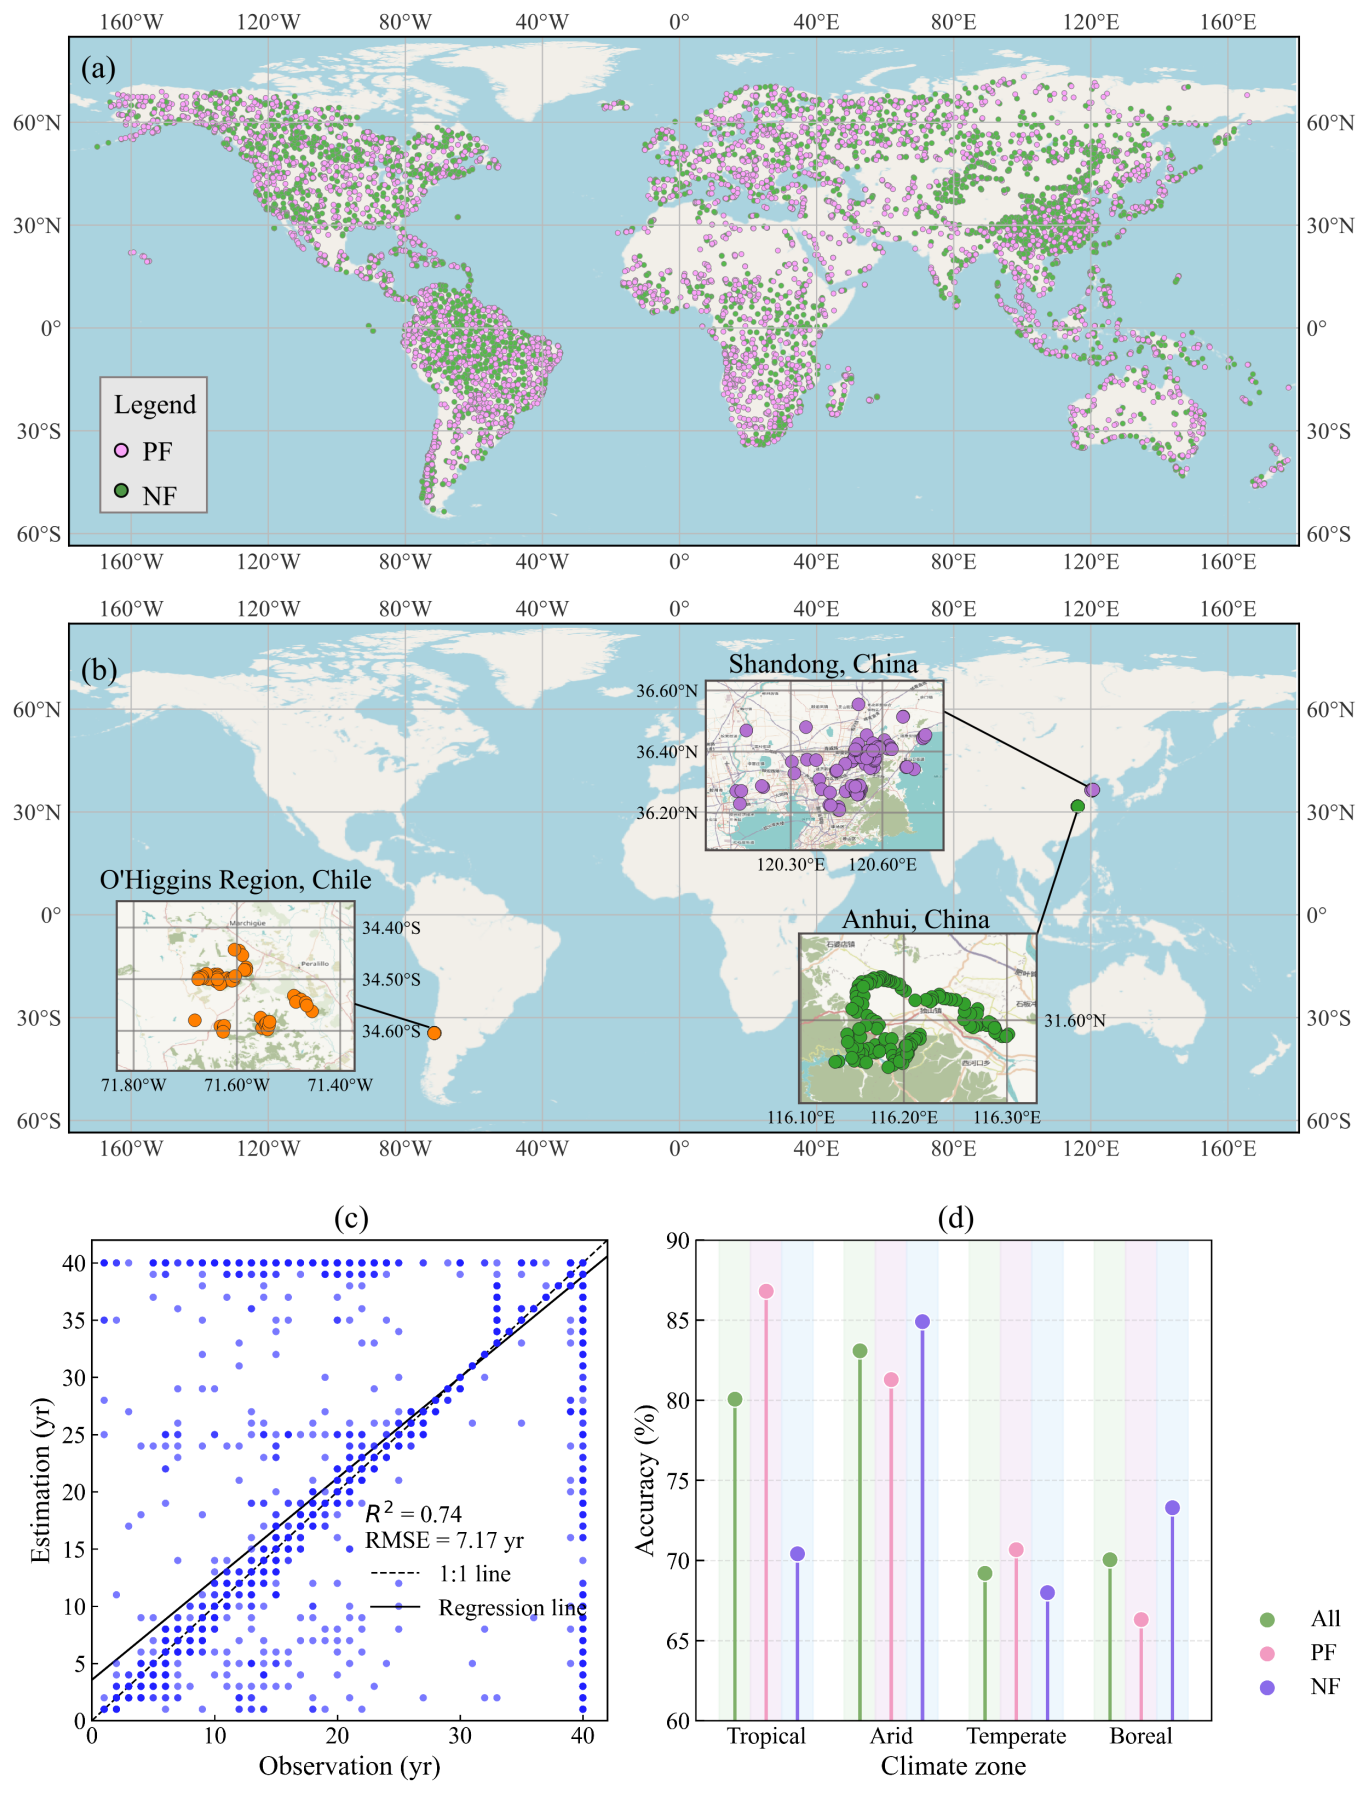
Figure 4Spatial distribution and validation of reference samples for global forest age assessment. (a) The global distribution of all validation samples. (b) The global distribution of field samples. (c) Scatter plot and fitting relationship between observed and predicted forest ages. (d) Accuracy comparison across climate zones and sample types. NF represents natural forest, PF represents planted forest, and All represents the combination of the two types of forests.
At the global scale, GFAM-N/P showed good agreement with the reference data, achieving a coefficient of determination (R2) of 0.74 and an RMSE of 7.17 years (Fig. 4c). Most samples were distributed close to the 1 : 1 line, indicating good consistency between the estimated and reference forest ages. Prediction uncertainty increased gradually with forest age, with a slight underestimation observed for stands older than approximately 25 years (Fig. 4c).
The validation accuracy was further analyzed across different forest origins and climatic zones (Fig. 4d). The product achieved higher accuracy for PF (R2 = 0.78, RMSE = 7.00 years) than for NF (R2 = 0.64, RMSE = 7.34 years). Across climatic zones, the model maintained stable performance in tropical, arid, temperate, and boreal regions, although moderate differences in prediction accuracy were observed among climate zones.
3.1.3 Independent regional benchmark evaluation
Beyond the global reference samples described above, GFAM-N/P was further evaluated using two independently developed regional forest age datasets representing different continents and methodological frameworks.
We first compared GFAM-N/P with the 30 m forest age product (FAP) developed by Xiao et al. (2023) for China. The reference dataset provides forest establishment years from 1990 to 2020, whereas GFAM-N/P covers the period from 1985 to 2024. Despite the different temporal coverage, the two datasets showed good agreement during their overlapping observation period.
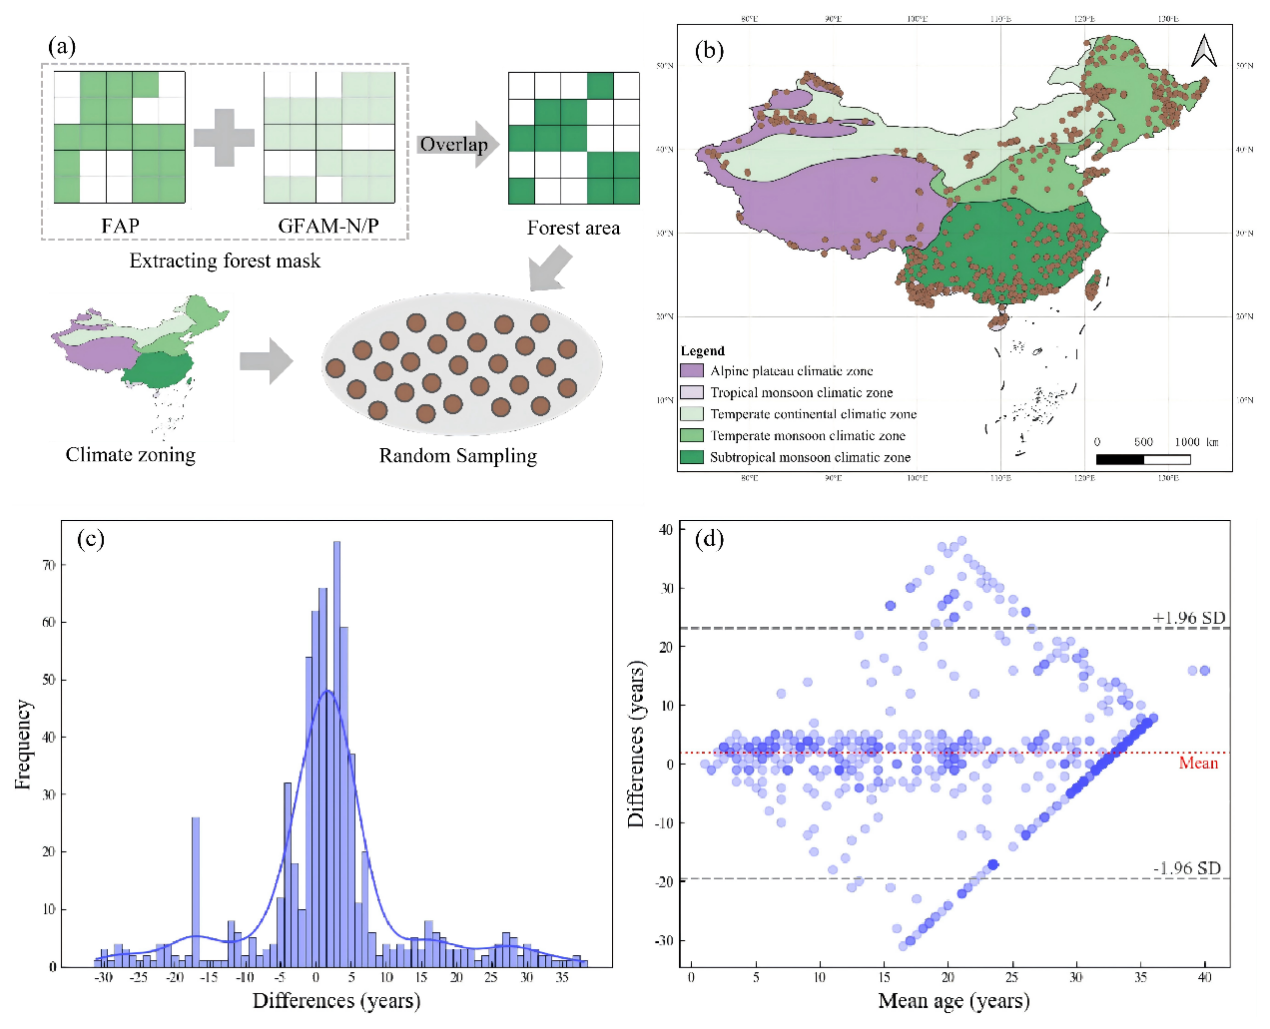
Figure 5Sample generation, distribution and accuracy assessment. (a) Sample generation. (b) Spatial distribution of samples across climatic zones in China. (c) Distribution of forest age differences between the GFAM-N/P and the FAP (difference = GFAM-N/P − FAP). (d) Bland-Altman plot showing the agreement between the two datasets; the central red line represents the mean difference (bias), and the gray dashed lines indicate the standard deviation range (95 % limits of agreement).
To ensure a representative comparison, stratified random sampling was conducted within the overlapping forested area according to China's climatic regionalization (Fig. 5a). Specifically, 100 samples were selected from each of the tropical monsoon, temperate continental, and alpine plateau climate zones, and 200 samples from each of the subtropical monsoon and temperate monsoon climate zones, yielding a total of 700 samples (Fig. 5b). Forest age differences between the two datasets were evaluated using a difference histogram and Bland-Altman analysis (Bunce, 2009). The age differences were narrowly distributed around zero (Fig. 5c), and the Bland-Altman analysis showed that the mean bias was close to zero, with approximately 95 % of the samples falling within the limits of agreement (Fig. 5d). These results indicate strong consistency between GFAM-N/P and the Chinese FAP throughout the overlapping observation period.
To further evaluate the consistency of GFAM-N/P under an independent regional framework, we additionally compared our dataset with the recently published 30 m Canadian forest age product (Maltman et al., 2023). Canada was divided into 100 km grids, within which stratified random sampling was performed for five forest age classes (0–10, 10–20, 20–30, 30–40, and ≥40 years). Up to five samples were randomly selected from each age class within each grid. Pixels without valid forest age values in either dataset were excluded, resulting in 11 092 paired samples (Fig. 6).
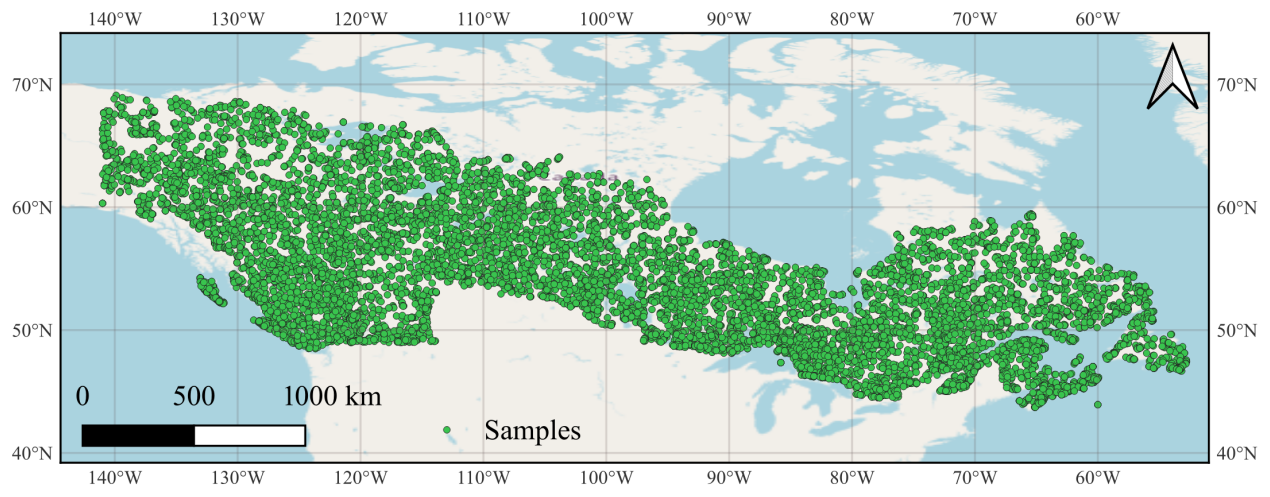
Figure 6Spatial distribution of the samples across Canada.
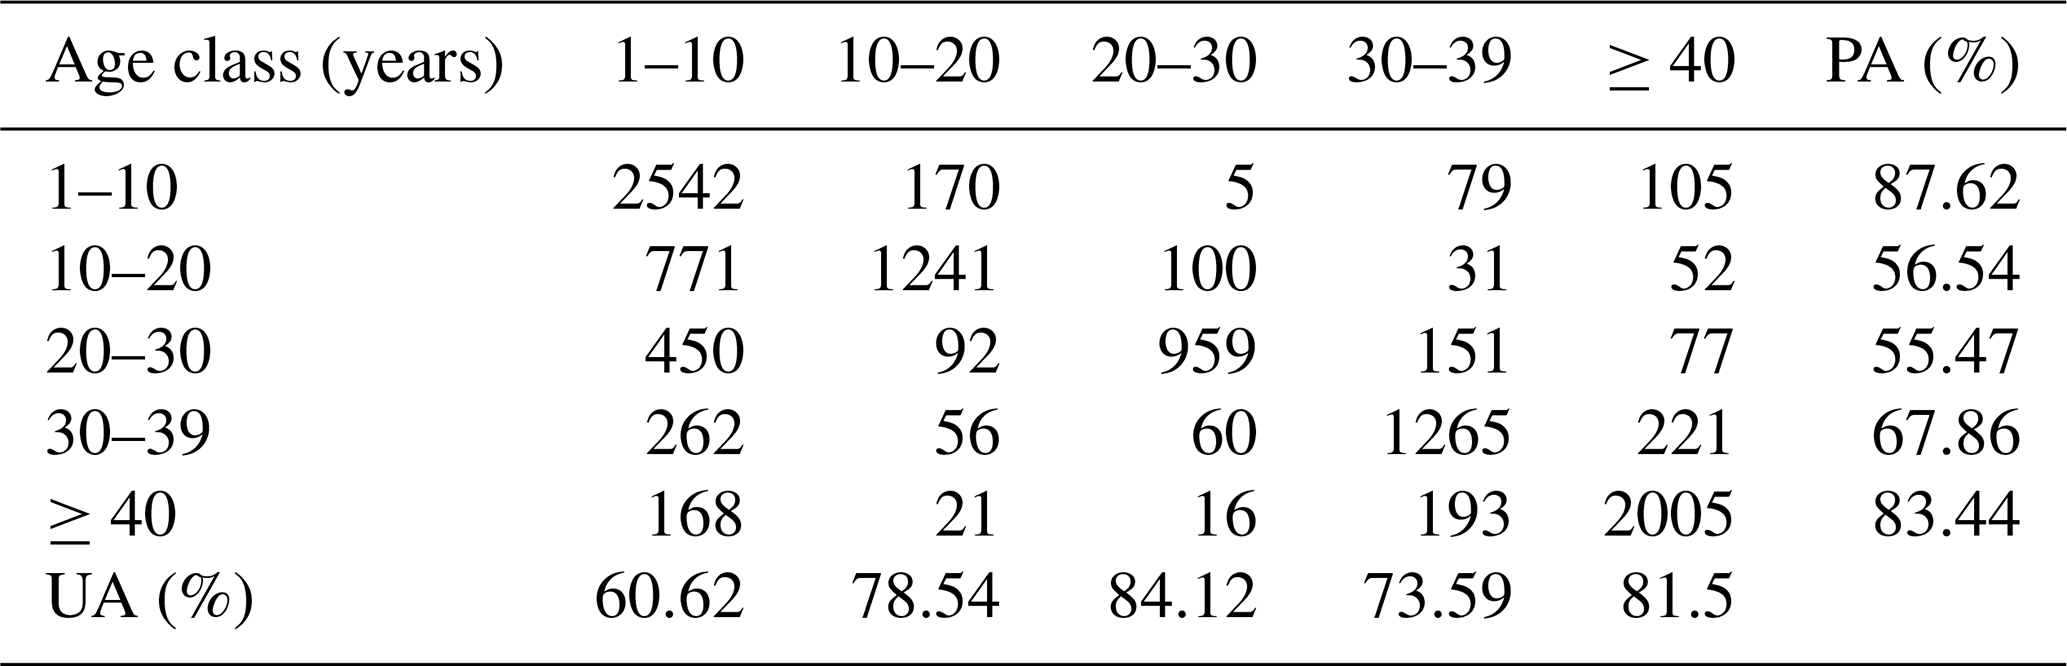
The comparison yielded an OA of 72.23 %, a Kappa coefficient of 0.65, and a weighted F1-score of 0.719, indicating substantial agreement between the two products (Table 3). The 0–10 years and ≥40 years classes showed relatively higher producer's accuracies of 87.62 % and 83.44 %, respectively. The ≥40 years class also achieved the highest F1-score (0.83) and a user's accuracy (UA) of 81.50 %. In comparison, the 10–20 years and 20–30 years classes exhibited lower producer's accuracies (PA) of 56.54 % and 55.47 %, respectively. These results indicate that GFAM-N/P maintains good consistency with an independently developed regional forest age product under different forest conditions.
Table 3Confusion matrix and accuracy assessment between GFAM-N/P and the Canadian forest age product.
3.1.4 Global benchmark product comparison
In addition to the regional benchmark datasets, we further evaluated the global consistency of GFAM-N/P using the recently published GAMI dataset.
We first visually compared GFAM-N/P with the 100 m GAMI dataset developed by Besnard et al. (2024) using three representative regions (Fig. 7). Across the three representative sites, GFAM-N/P consistently resolved finer spatial details and more continuous forest age patterns than GAMI. At Site 1, GFAM-N/P captured fragmented forest patches and fine-scale age gradients that were not fully represented in GAMI. At Site 2, GFAM-N/P provided more complete forest age coverage across extensive forest regions, whereas GAMI contained larger areas without age information. Similar spatial differences were observed at Site 3, where GFAM-N/P exhibited more continuous forest age distributions.
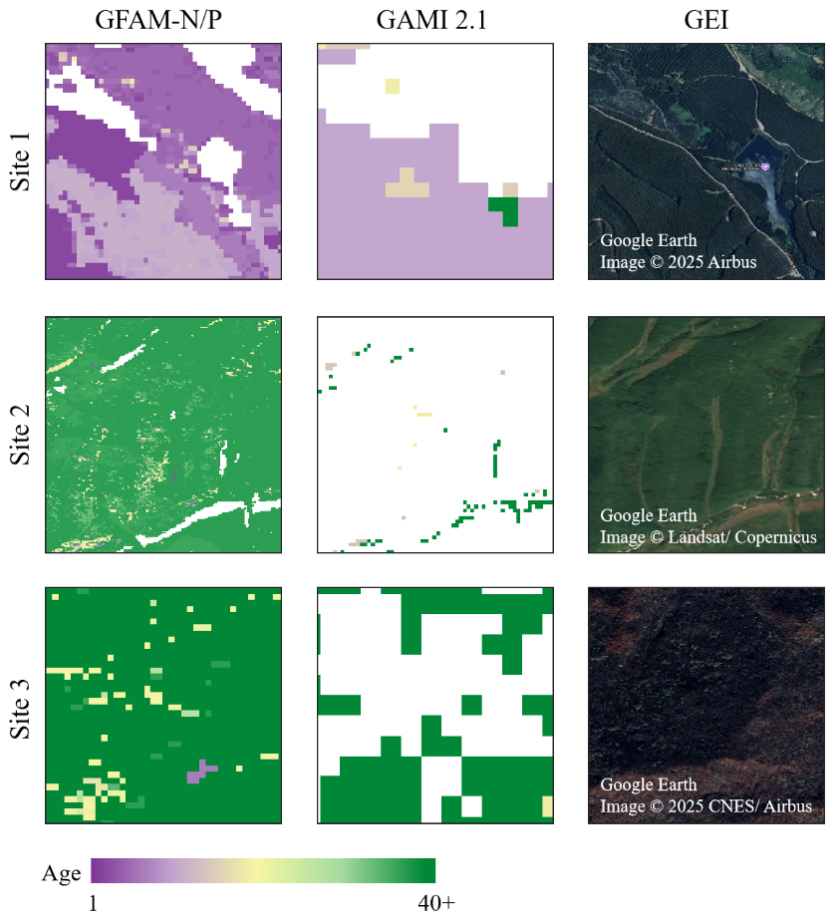
Figure 7Comparison between the GFAM-N/P and the 100 m resolution GAMI 2.1 product across three representative sites. White pixels in the forest age maps represent non-forest areas. High-resolution satellite images are from Google Earth (Site 1: Image © 2026 Airbus; Site 2: Image © 2026 Landsat/Copernicus; Site 3: Image © 2026 CNES/Airbus).
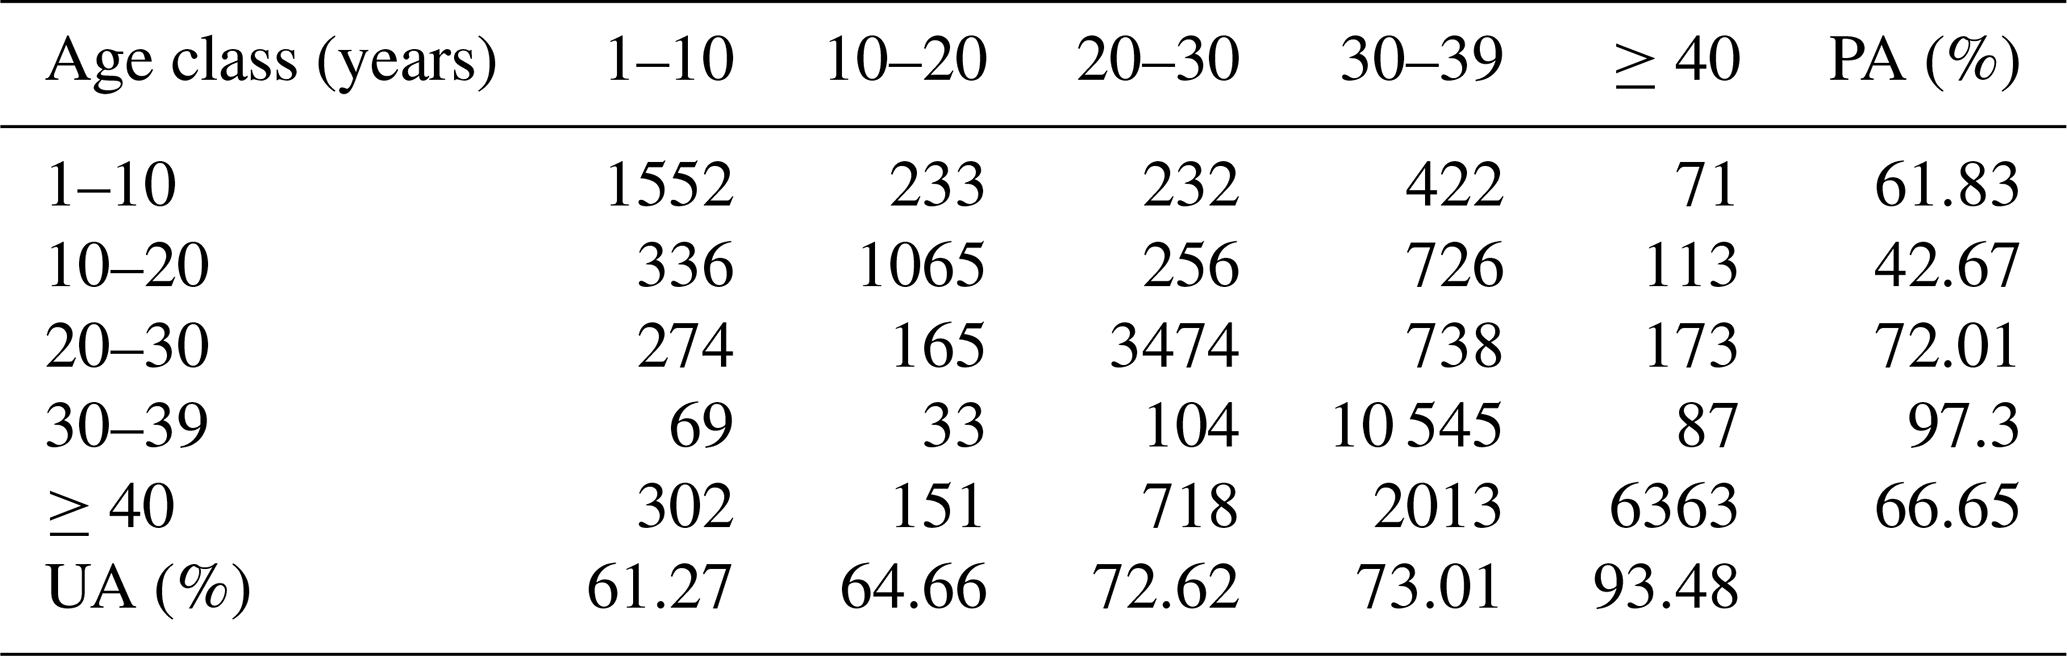
To quantitatively evaluate the consistency between the two products, we performed spatially stratified random sampling across the globe. A total of 50 000 candidate points were generated according to tile area, and a 3 × 3 median filter was applied to GFAM-N/P to reduce potential geolocation mismatches. After removing invalid samples (e.g., NoData or negative values), 30 215 paired observations were retained for analysis. Forest age values from both datasets were grouped into five age classes (1–10, 10–20, 20–30, 30–39, and ≥40 years), and a confusion matrix was constructed for quantitative assessment.
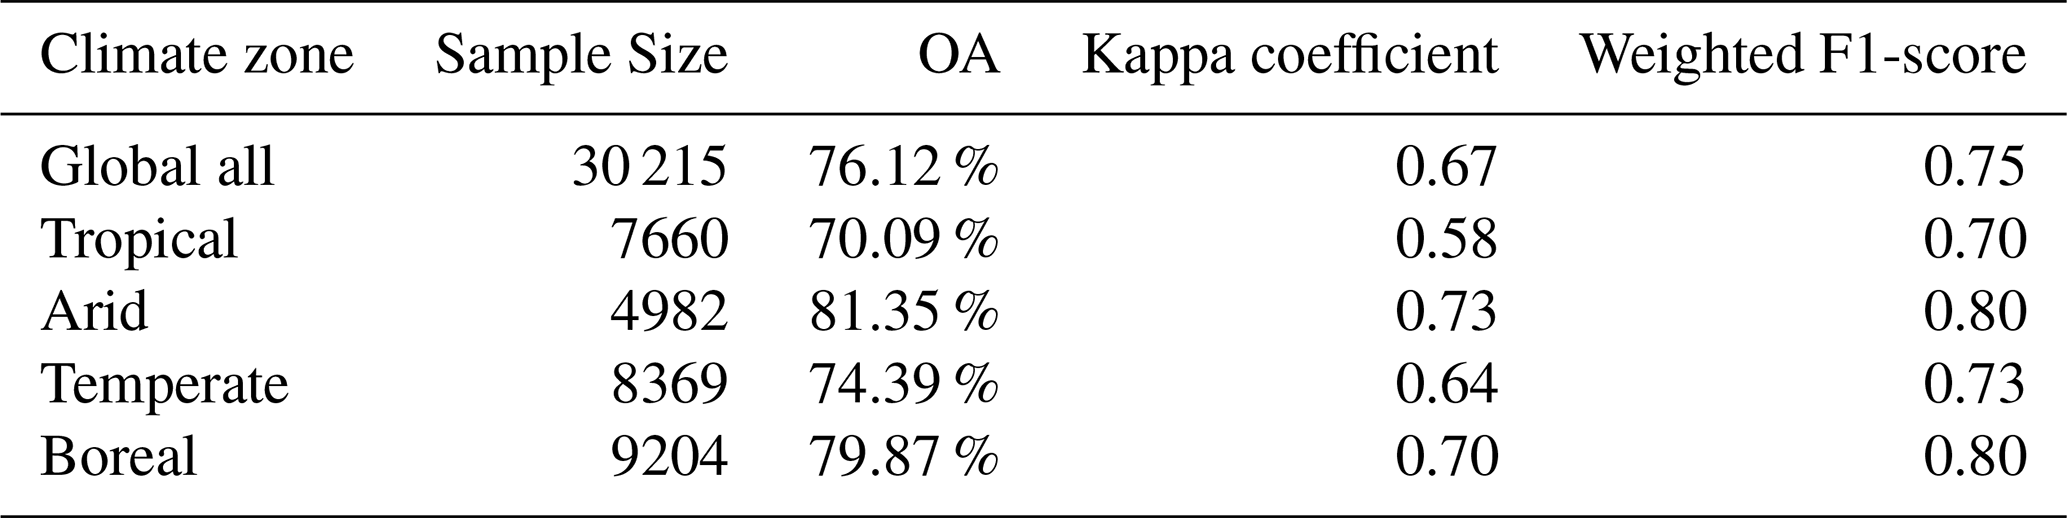
Overall, GFAM-N/P showed strong agreement with GAMI, with an OA of 76.12 %, a Kappa coefficient of 0.67, and a weighted F1-score of 0.75. Agreement was generally higher for older forests. The ≥ 40-year age class achieved the highest UA (93.48 %), while the 30–39-year class showed the highest PA (97.30 %) and an F1-score of 0.83. Most disagreements occurred between adjacent age classes (Table 4), indicating relatively small differences in estimated forest age between the two products.
Table 4Confusion matrix and accuracy assessment between our product and the GAMI product. (Rows represent the reference GAMI data, and columns represent our predicted product. Age class units are in years.)
To further examine regional consistency, we compared GFAM-N/P and GAMI across four major Köppen climate zones (Table 5). Overall agreement ranged from 70.09 % in tropical regions to 81.35 % in arid regions. Across all climate zones, the weighted F1-score ranged from 0.70 to 0.80, indicating consistently good agreement between the two datasets.
Table 5Summary of quantitative consistency metrics across different climate zones.
3.1.5 Independent assessment using forest inventory data
Because stand age recorded in forest inventories differs conceptually from the disturbance-recovery age estimated in this study, the United States Forest Inventory and Analysis (FIA) database (United States Forest Service, 2024) was used to assess age-dependent consistency rather than direct pixel-level accuracy.
Nationally distributed plot information and stand condition records were integrated across all available states by matching unique plot identifiers. To ensure data quality, FIA plots were filtered using three criteria: (1) an exact measurement year of 2024, (2) a pure forest condition status, and (3) valid continuous stand age records. A spatially representative subset of 8000 plots was then randomly selected from the filtered database and grouped into seven observed age classes for comparison with the corresponding GFAM-N/P estimates (Fig. 8).
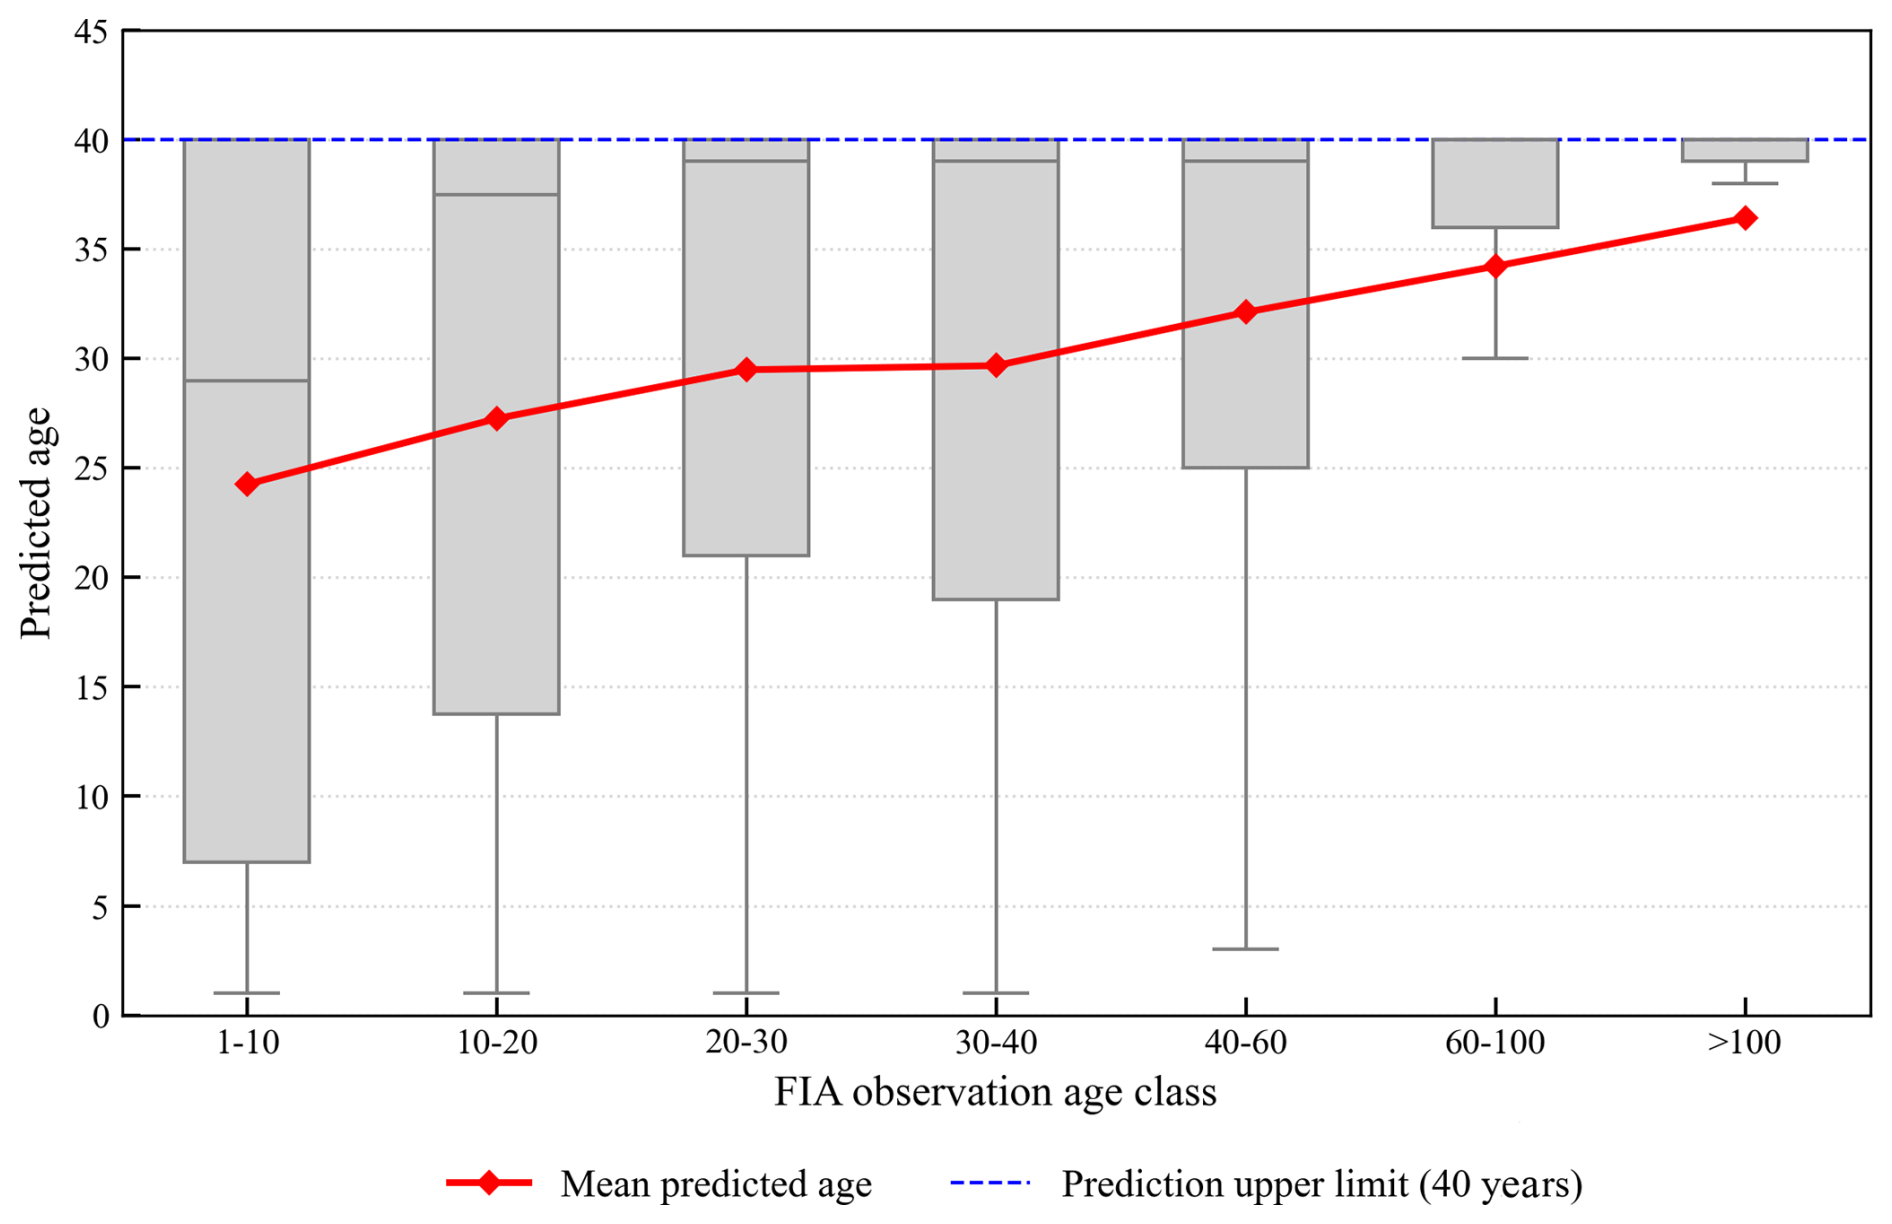
Figure 8Systematic validation of predicted forest age against independent US FIA plot data across distinct age classes.
The box-and-whisker plot demonstrates high linear fidelity within the young and intermediate successional cohorts (Age 1–30). Specifically, the mean predicted age (red line) increased progressively across younger age classes, with relatively narrow interquartile ranges observed in the earliest successional stage (Age 1–10). However, as the observed field stand age surpasses the theoretical observation depth of the multi-decadal Landsat archives (≥40 years), a distinct predictive plateau emerges. Within the mature and older forest classes (Age 40–60, Age 60–100, and Age > 100), the distributions of predicted ages heavily compress and converge immediately below the 40-year maximum threshold (blue dashed line). This pattern indicates that GFAM-N/P effectively captures age variation in young forests, whereas increasing saturation is observed for older stands.
3.1.6 Spatial uncertainty and pixel-level confidence assessment
A pixel-level Spatial Uncertainty Index (SUI) was derived by linearly scaling the RMSE obtained from the CCDC time-series model to characterize spatial variations in forest age estimation uncertainty. The global distribution of the SUI is shown in Fig. 9, where larger SUI values indicate greater uncertainty in the estimated forest age.
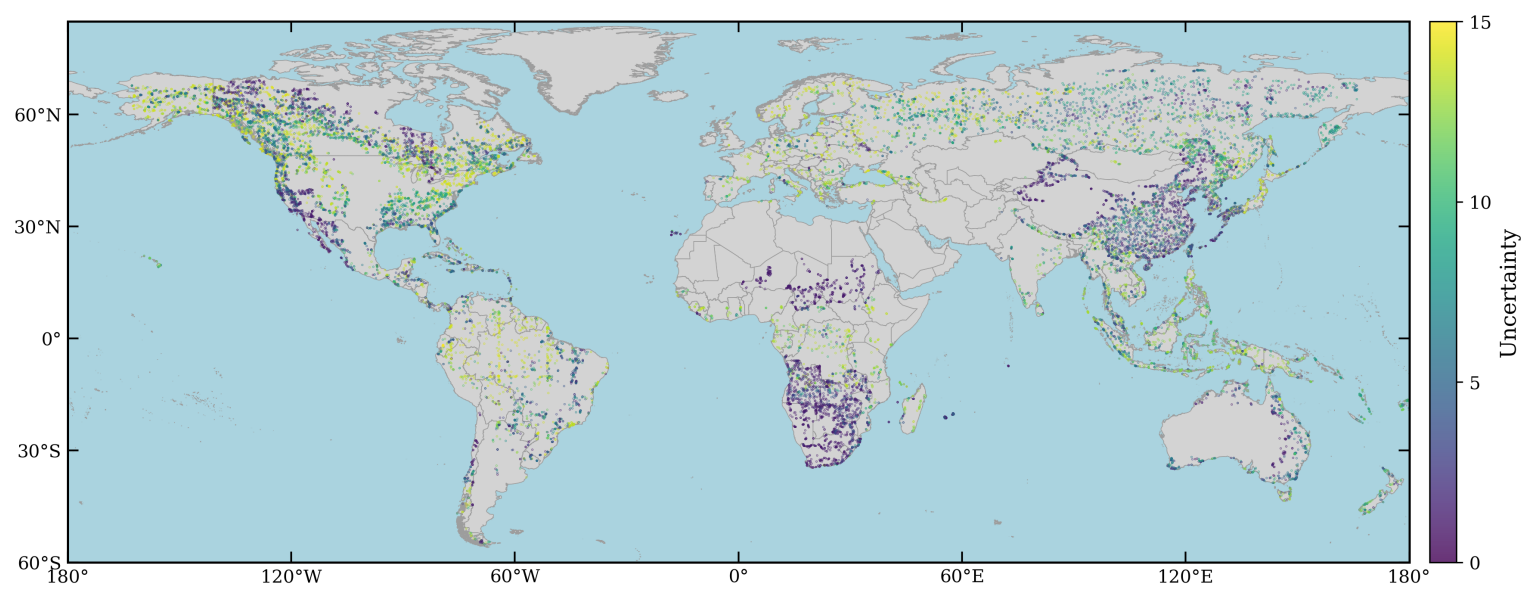
Figure 9Global spatial distribution of the model-derived SUI for forest age estimation. To facilitate global visualization, SUI values are aggregated using spatial averaging.
The geographic patterns exhibit pronounced spatial heterogeneity across the globe. Low uncertainty was mainly distributed in intensively managed forest regions and plantation areas, including southeastern China, the southwestern United States, and parts of southern Africa. In contrast, relatively high uncertainty occurred primarily in tropical forests, particularly in the Amazon Basin and Central Africa, as well as in high-latitude boreal forests of northern North America and northern Eurasia.
To further evaluate the reliability of the uncertainty estimates, the spatial pattern of the SUI was compared with independent validation results across different climate zones. The observed Mean Absolute Error (MAE) ranged from 1.15 years in tropical regions to 3.84 years in boreal forests, showing good consistency with the spatial distribution of the SUI. Moreover, areas with low uncertainty (SUI < 5) exhibited a MAE of 2.32 years, indicating that the SUI provides a reliable representation of the spatial variation in forest age estimation uncertainty.
3.2 Sensitivity of CCDC configurations to spectral inputs and algorithmic parameters
To evaluate the robustness, global applicability, and parameter sensitivity of our CCDC configuration, we conducted systematic sensitivity analyses across four representative Köppen climate zones using a common parameterization framework to assess whether a globally consistent configuration could provide stable performance under different environmental conditions. This evaluation was extended across various forest developmental stages by categorizing forest age into five representative classes (1–10, 10–20, 20–30, 30–39, and ≥40 years), which were subsequently utilized to derive class-wise PA and UA from the resulting confusion matrices.
First, we assessed the sensitivity of the minObservations parameter (Figs. 10a and 11a–b). The results reveal a consistent nonlinear response pattern across all climate zones. When minObservations increases from 5 to 6, both PA and UA exhibit a pronounced improvement, accompanied by a sharp increase in OA. This indicates that a minimum observational constraint is critical for suppressing noise-induced misclassification in the CCDC segmentation process, particularly in regions with frequent cloud contamination such as tropical forests. However, when the threshold increases beyond 6, the improvement becomes marginal and the accuracy metrics tend to stabilize, suggesting that the model reaches a saturation point where additional observations provide limited incremental information. Based on this behavior, a value of 6 is selected as an optimal global compromise between observational robustness and sensitivity to disturbance events.
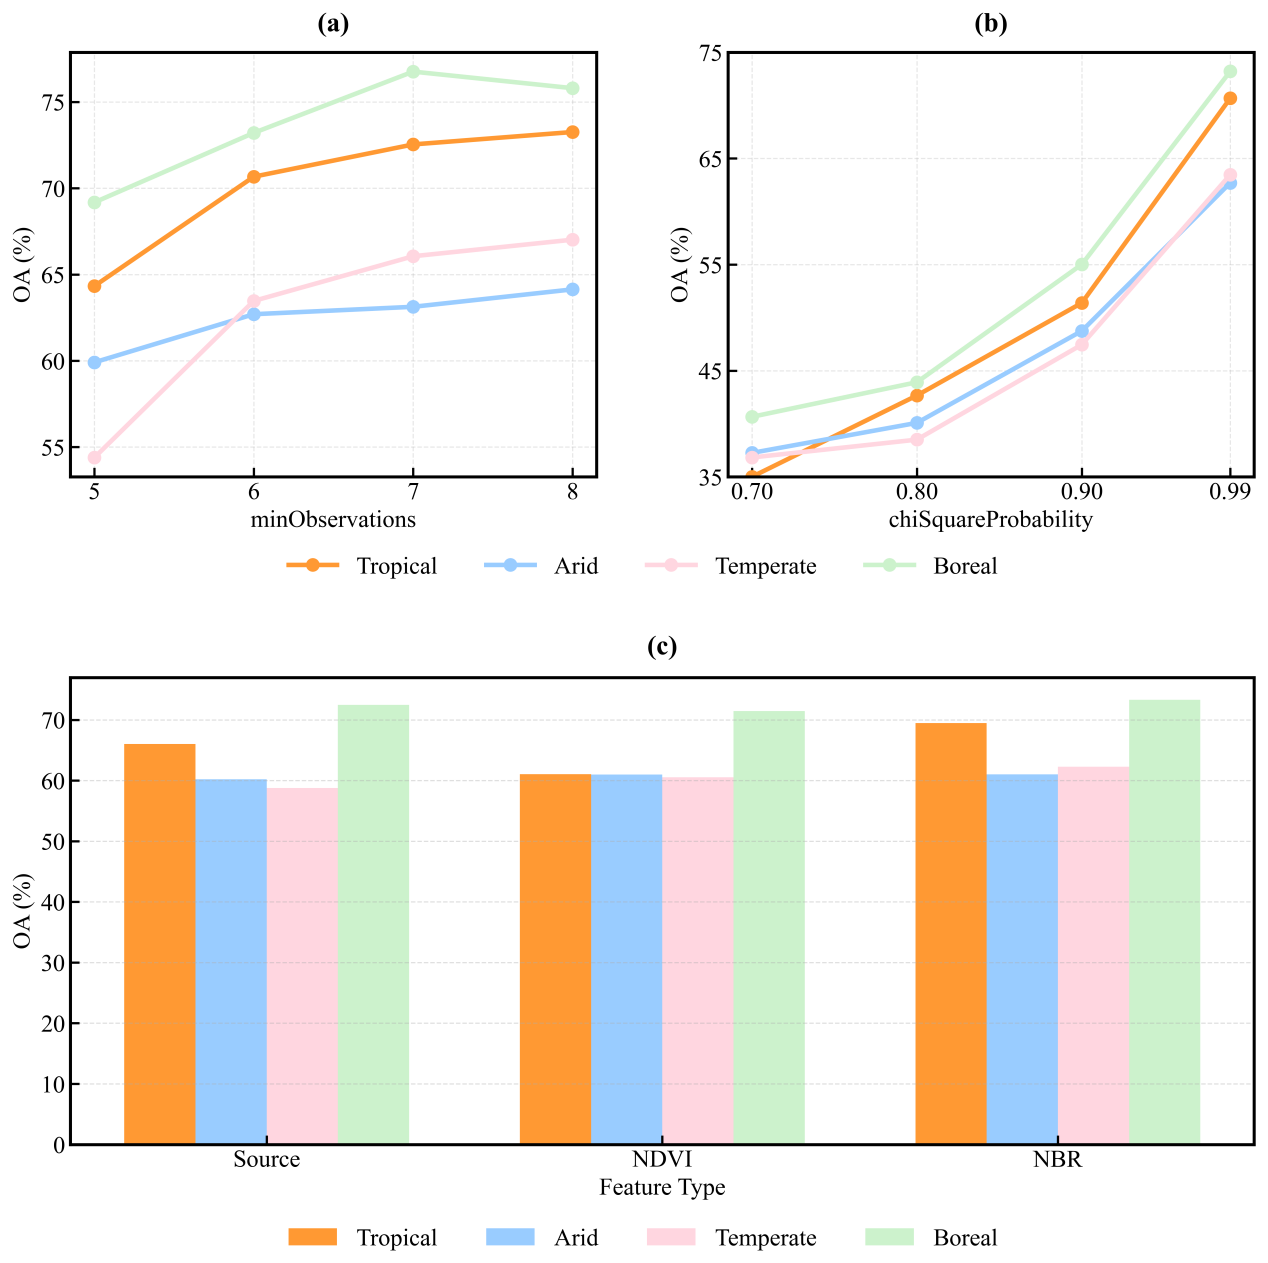
Figure 10Sensitivity analysis of key temporal segmentation parameters and feature configurations across different climate zones. (a) OA sensitivity to minObservations; (b) OA sensitivity to chiSquareProbability under different climate zones; and (c) comparison of OA across feature configurations (Source, NDVI, and NBR) in different climate zones.
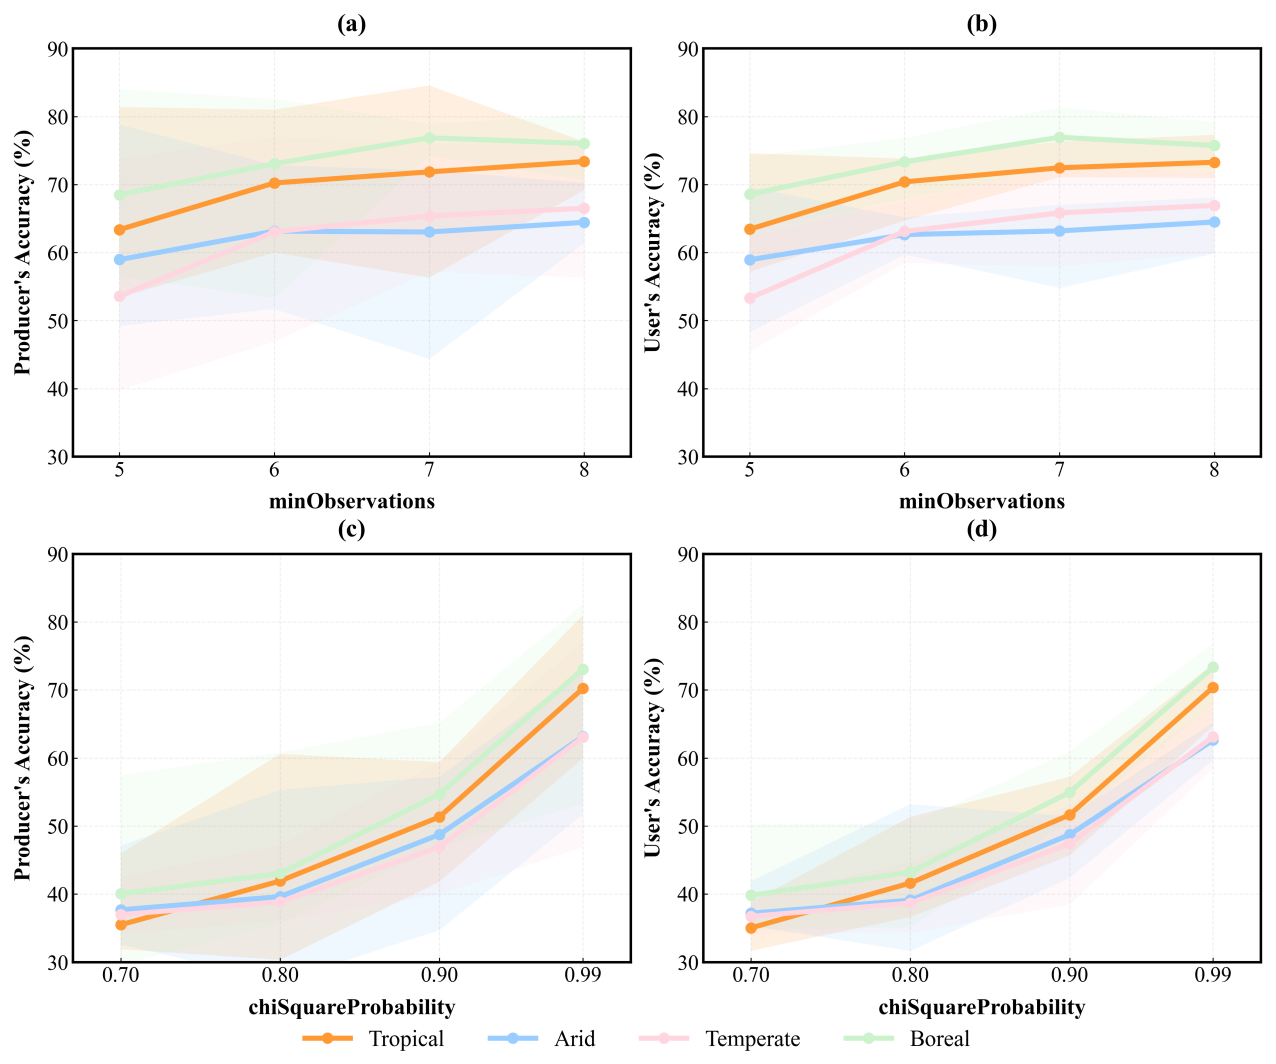
Figure 11Response of PA and UA to variations in (a, b) minObservations and (c, d) chiSquareProbability across four major climate zones. Shaded areas denote the [Min, Max] uncertainty intervals.
Second, the sensitivity to the chiSquareProbability threshold was evaluated (Figs. 10b and 11c–d). At low thresholds (0.7–0.8), both PA and UA remain relatively low and highly variable across age classes, with a pronounced imbalance between omission and commission errors. As the threshold increases to 0.9, classification performance improves moderately but still exhibits residual inconsistencies across climate zones. In contrast, when chiSquareProbability reaches 0.99, all climate zones show a substantial and consistent improvement in both PA and UA, with significantly reduced inter-class variability and improved agreement across age groups. This pattern reflects a transition from an over-segmentation regime, where phenological variability is frequently misclassified as disturbance, to a more conservative detection regime that better preserves estimated forest age structure and reduces systematic misclassification.
Finally, regarding spectral input selection (Fig. 10c), a comparative analysis of various band combinations reveals that the inclusion of the NBR consistently yields the highest OA across all biomes, with gains of 3.4 %–7.8 % over raw reflectance-based models (Source). This demonstrates that NBR effectively enhances the signal-to-noise ratio in identifying stand-replacing disturbances by leveraging the sensitivity of shortwave infrared (SWIR) bands to canopy moisture and structural changes.
3.3 Global forest age spatial distribution characteristics
Globally, forest age exhibits distinct spatial patterns between NF and PF (Fig. 12) (Wang et al., 2026). NF are broadly distributed across tropical, subtropical, and boreal regions, with older stands concentrated in the Amazon Basin, Central Africa, and northern Eurasia. These areas generally correspond to regions with fewer detectable disturbances during the Landsat observation period. In contrast, PF are predominantly distributed in the mid-latitudes, including East Asia, Europe, Australia, and southeastern South America, reflecting intensive forest management and large-scale reforestation efforts over recent decades (Bennett, 2015). The global map reveals a clear latitudinal gradient: younger forests dominate economically developed and actively managed regions (e.g., East Asia, Europe, and parts of North America), while older stands prevail in equatorial and high-latitude zones. Compared with NF, PF exhibit a markedly younger age structure worldwide. Most PF areas fall within the 1–15-year range, particularly in China, Brazil, and the southeastern United States, where short-rotation plantation systems are common. In contrast, NF contain a substantially higher proportion of mature stands (>30 years), especially in remote tropical and Boreal climate zones dominated by natural succession. These spatial contrasts primarily stem from differences in forest management intensity, reforestation policies, and disturbance regimes. Younger PF ages in subtropical and temperate regions correspond to large-scale plantation rotations, whereas older NF age classes in tropical and boreal areas indicate fewer detectable disturbances during the Landsat observation period. Compared with existing coarse-resolution products such as GAMI (100 m), the 30 m forest age map developed in this study provides a more detailed representation of spatial heterogeneity and better captures fine-scale age gradients across fragmented landscapes.
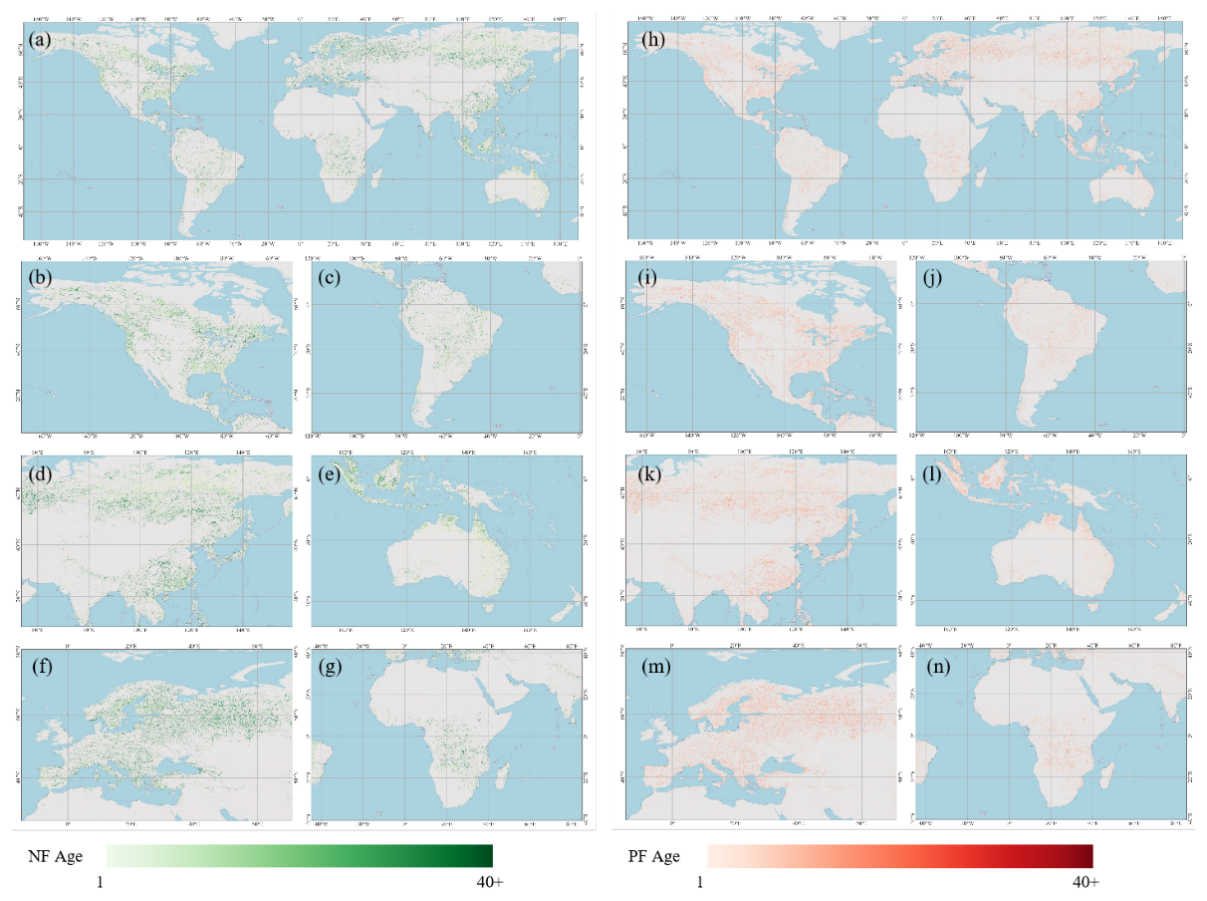
Figure 12The distribution of global forest age. Natural forests (left) and planted forests (right). Panel (a) presents the global spatial pattern of NF ages, with zoomed-in views of key regions including North America (b), South America (c), Asia (d), Australia (e), Europe (f), and Africa (g); (h) displays the global distribution of PF ages, complemented by zoomed-in views of North America (i), South America (j), Asia (k), Australia (l), Europe (m), and Africa (n).
3.4 Regional variations in age structure between planted and natural forests
Building upon the global spatial distribution patterns, we further quantified regional variations in the age structure of NF and PF across six continents – Africa, Asia, Australia, Europe, North America, and South America – to reveal their distinct developmental characteristics and management contexts.
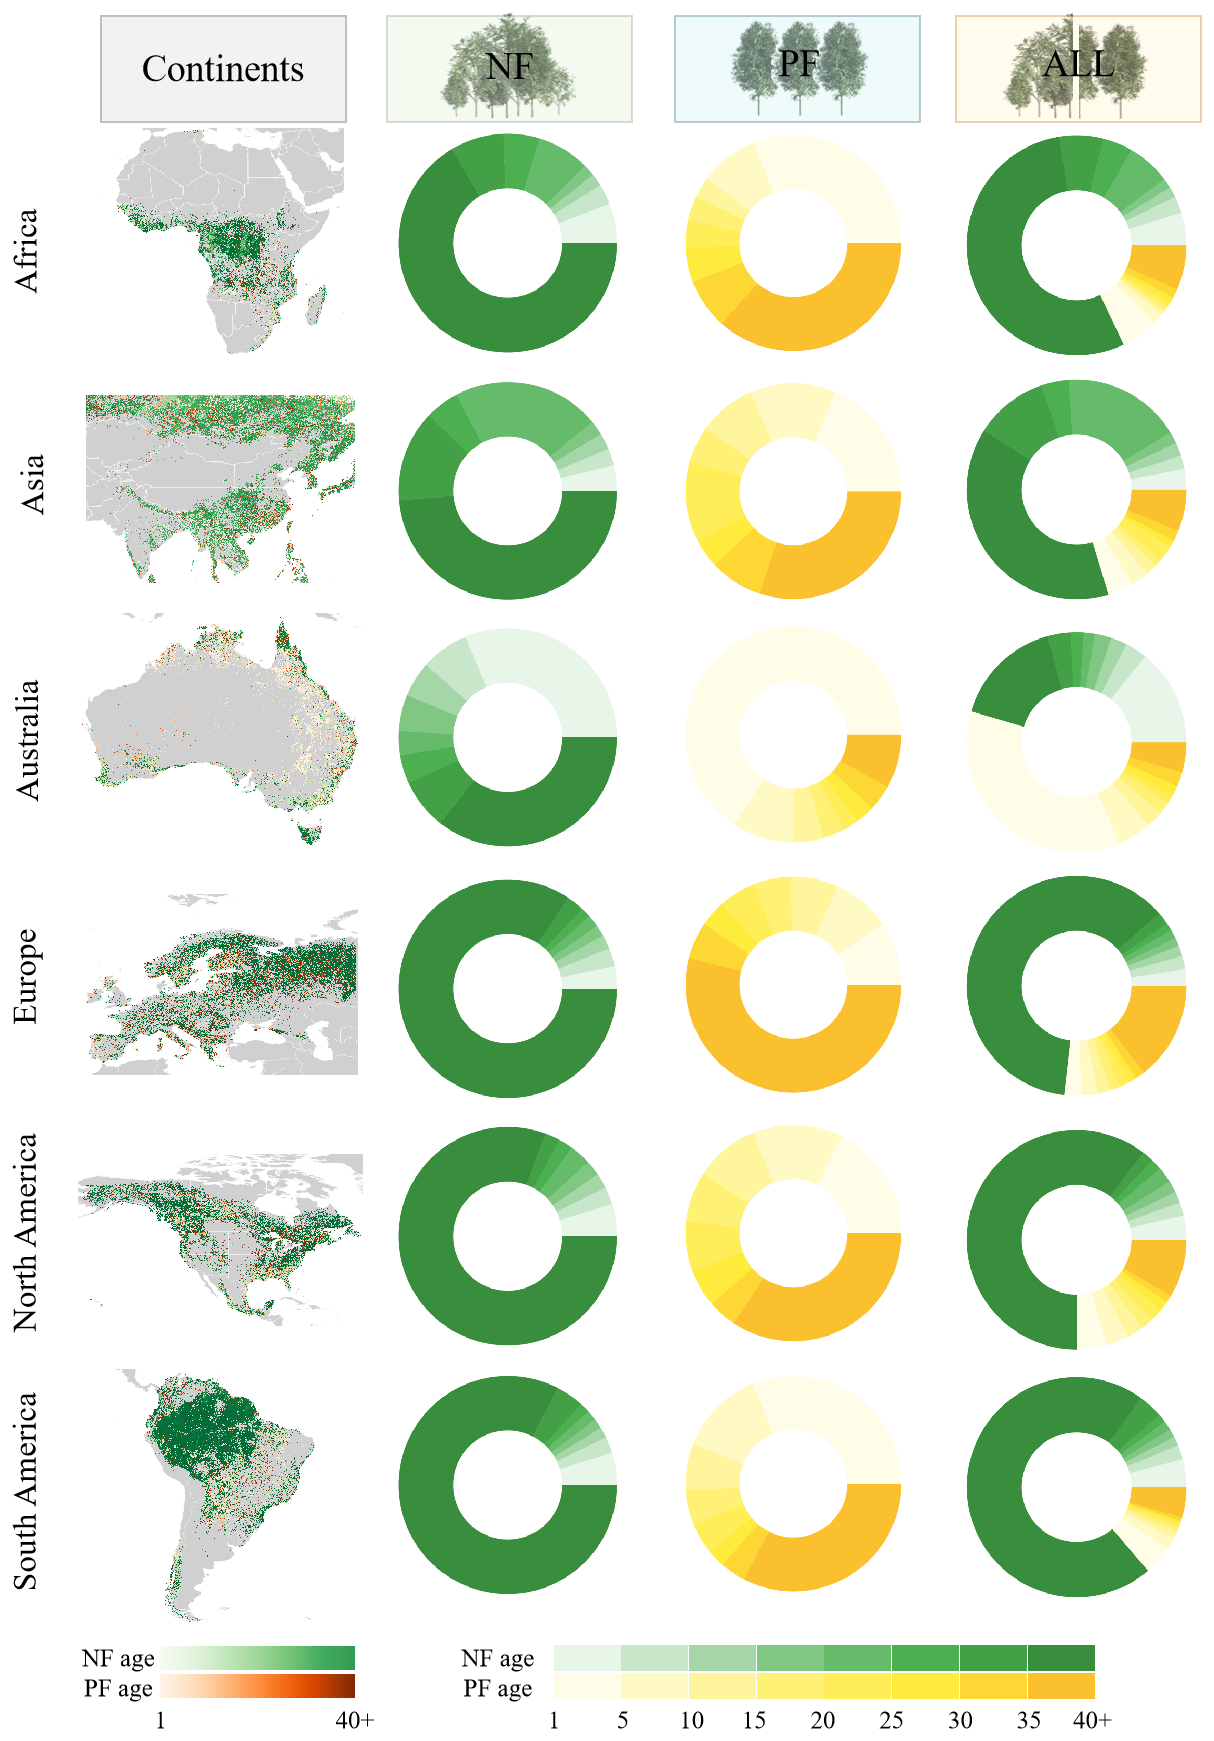
Figure 13Regional age-class distributions of planted and natural forests across six continents. The first column shows the six global regions. The second and third columns depict the proportional distributions of NF and PF, respectively, across eight age classes (1–5 to 36–40 years, in 5-year intervals). The fourth column summarizes the total proportions of NF and PF within each region.
The age structures of NF and PF exhibit pronounced regional contrasts (Fig. 13). For NF, Europe (84.38 %), South America (82.61 %), and North America (80.62 %) show a predominance of the oldest mapped age class (Age 36–40), each typically exceeding 80 %. Africa (66.46 %) and Asia (48.61 %) follow this pattern, whereas Australia exhibits a notable bimodal pattern, with substantial proportions occurring in both the youngest (Age 1–5: 31.36 %) and oldest mapped age classes (Age 36–40: 35.64 %). Except for Australia, young NF stands (Age 1–10) occupy less than 8 % across all other continents. Notably, Asia contains a relatively high proportion of intermediate-age forests (Age 21–25: 21.95 %), indicating a comparatively balanced distribution across different mapped age classes. PF, in contrast, are markedly younger across all continents. In Australia, PF are highly concentrated in the youngest class (Age 1–5: 65.77 %), with only 8.12 % in the oldest (Age 36–40). The dominance of younger age classes in Australian PF is likely associated with intensive plantation management and shorter rotation practices (Strandgard and Béland, 2021). Both Africa and South America exhibit a “bimodal age structure with peaks in young and old classes” structure – Africa (Age 1–5: 31.09 %; Age 36–40: 36.60 %) and South America (Age 1–5: 31.11 %; Age 36–40: 32.59 %). PF in North America (Age 1–5: 17.66 %) and Asia (Age 1–5: 18.58 %) are generally skewed toward younger stands, although the older mapped age classes still account for 34.36 % and 30.09 %, respectively. Europe is the only region where the oldest mapped age class dominates PF (Age 36–40: 53.99 %), while young PF classes remain below 20 %. Regionally, PF in Australia, Asia, and North America are dominated by younger stands, Africa and South America exhibit mixed age compositions, and Europe is characterized by a relatively higher proportion of older mapped plantation age classes.
4.1 Methodological standardization and parameter sensitivity
To evaluate the robustness of the CCDC-based forest age mapping framework, we conducted a systematic sensitivity analysis of two foundational hyperparameters – minObservations and chiSquareProbability – across four major Köppen zones (Arid, Boreal, Temperate, and Tropical). The results indicate that mapping accuracy generally improves with stricter statistical constraints, which enhance stability in breakpoint detection. Among the biomes, the Boreal region consistently yielded the highest overall accuracy, whereas the Arid region exhibited comparatively lower performance, primarily due to its inherently low vegetation cover and high background spectral variability (Almalki et al., 2022). In contrast, the Tropical and Boreal zones demonstrated the highest sensitivity to parameter tuning, implying that dense and structurally heterogeneous forest ecosystems exhibit greater sensitivity to breakpoint detection thresholds (DeVries et al., 2015).
The chiSquareProbability parameter reached the highest overall performance at 0.99 across all zones, indicating that a stringent statistical threshold is essential to suppress spurious breakpoints and minimize commission errors in disturbance detection (Fig. 10). Similarly, increasing minObservations improved model stability below a value of 6, beyond which the performance gains plateaued, identifying a distinct saturation threshold.
Beyond the global optimization of the CCDC baseline hyperparameters, the implementation of the dual-threshold segment-fusion logic directly addresses a long-standing bottleneck in optical time-series forest age estimation: the systematic temporal lag between initial disturbance-related spectral changes and subsequent mathematical model convergence (Tian et al., 2023). Crucially, the tailored spectral recovery slope thresholds of > 0.03 for NF and > 0.04 for PF – were not arbitrarily selected but were empirically derived as the statistical means computed directly from our extensive historical reference sample points. This data-driven differentiation is consistent with the distinct spectral recovery characteristics associated with the two forest origins. For NF, the statistically derived lower mean slope (> 0.03) accommodates the relatively slower and more variable spectral recovery patterns, which are often heavily confounded by heterogeneous canopy conditions and mixed spectral signals that increase trajectory variability (Tian et al., 2015). Conversely, plantation forests often exhibit stronger and more temporally consistent spectral recovery signals following disturbance or harvesting events. By enforcing the more stringent 0.04 threshold for PF, the framework better captures the rapid early-stage recovery characteristics of intensively managed plantations (e.g., Eucalyptus or Pinus) (Deng et al., 2020). This restriction helps avoid premature fusion decisions caused by rapid spectral recovery signals during early plantation development, thereby reducing potential age underestimation. Nevertheless, utilizing a single, globally uniform mean threshold for each forest origin introduces certain geographic limitations. By compressing multi-biome successional dynamics into global average constants, the framework inevitably overlooks intra-type variations driven by macroclimatic gradients. For instance, cold-constrained boreal NF or slow-growing arid plantations may display actual recovery slopes that fall slightly below these statistical means (0.03 or 0.04), potentially leading to localized omissions where recovery segments fail to fuse (Han et al., 2021). Conversely, in hyper-productive wet tropical domains, NF recovery signals might exceed the PF threshold, blurring the algorithmic distinction between NF and PF trajectories. While these generalized thresholds represent an objective trade-off to maintain global comparability and suppress local noise, future studies may further investigate adaptive thresholds that incorporate climatic gradients, forest functional types, and dominant tree species characteristics as complementary approaches for specific regional applications.
Reconciling localized optimization with inter-regional comparability remains a primary challenge in global-scale mapping. Although our sensitivity analysis identified minor regional variations in parameter responses – such as the need for more observations to mitigate cloud interference in tropical domains (Fig. 10a) – we intentionally maintained a uniform parameter framework (Table 2) to ensure spatial consistency and comparability across global forest ecosystems. Although climate-specific parameterization could potentially improve local performance, applying different parameter configurations across climate zones may introduce artificial spatial discontinuities and reduce the consistency of forest age estimates among neighboring regions. As emphasized in seminal large-scale mapping frameworks, employing an internally consistent approach with standardized operational configurations is imperative to filter out geographic definition variations and data input inconsistencies, ensuring that macro-scale characterizations remain robust and comparable across diverse biomes (Hansen et al., 2013). By employing a consistent configuration validated across four distinct biomes, we ensure that the global contrasts in forest age structure revealed in this study primarily reflect regional disturbance histories and management regimes.
4.2 Spatial uncertainty indexing and physical drivers
The spatial heterogeneity exhibited by the SUI (Fig. 9) is deeply coupled with the interactions between regional forest stand structures, environmental dynamics, and the time-series segment-fitting mechanism of the CCDC algorithm.
The exceptionally low uncertainty (SUI < 5) observed in regions like southeastern China can be attributed to the prominence of managed forests and plantation ecosystems. In these zones, large-scale disturbance or planting events generate distinct, sharp spectral breakpoints, allowing the CCDC algorithm to fit subsequent spectral recovery trajectories with minimal residual noise. Meanwhile, the high-confidence cluster in the southwestern United States and subtropical southern Africa is primarily driven by atmospheric and climatic advantages. These arid and semi-arid regions feature persistently clear-sky conditions and sparse cloud cover, which guarantee a continuous and abundant volume of high-quality Landsat observations. The low seasonal complexity and minimal background noise in these dry ecosystems enable the CCDC time-series inversion to maintain exceptionally tight spectral trajectories, thereby minimizing fitting residuals.
Conversely, the moderate-to-high SUI values (8–13) captured across tropical rainforest domains (e.g., the Amazon Basin and Central Africa) and high-latitude zones (e.g., northern North America and northern Eurasia) are driven by contrasting environmental constraints. Persistent cloud cover in the tropics and high atmospheric moisture content often limit the acquisition frequency of noise-free optical data, inflating the fitting residuals. Furthermore, the multi-layered canopy structures and sub-pixel heterogeneity inherent to natural rainforests mean that partial disturbances often cause subtle spectral variations rather than clean resets, leading to elevated SUI values. Crucially, these localized compounding factors – where extreme data scarcity due to cloud contamination overlaps with intense sub-pixel canopy dynamics – further escalate the fitting error, manifesting as the scattered pixel-level hot spots of maximum uncertainty (SUI > 12, appearing as yellow pixels) observed within the core tropical domains.
In higher latitudes, the maximum mapping uncertainty (SUI > 12) is driven by severe winter conditions. Prolonged snow cover, winter freezing, and intense seasonal phenological variations inject substantial baseline noise into the optical time-series data, inherently increasing the standard deviation of the spectral fitting residuals. This algorithmic behavior is further supported by our independent validation data, where the Boreal climate zone exhibited the highest empirical error (MAE = 3.84 years), whereas the Tropical climate zone showed the lowest error (MAE = 1.15 years), indicating that the constrained fitting uncertainty did not substantially affect the final mapping accuracy.
4.3 Systematic biases, conceptual lags, and dataset limitations
A rigorous evaluation of our validation results reveals a nuanced structure of estimation uncertainties across distinct forest developmental stages, as explicitly manifested in the joint plot of continuous estimations and probability densities across different observed age groups (Fig. 14). Contrasting with traditional empirical biomass-to-age models that typically suffer from progressive error expansion in mature cohorts, our CCDC-based framework exhibits highly constrained and narrowly binned probability distributions in the upper-age cohort shown in Fig. 14 (30–40 years). This exceptional convergence at the upper age limit directly corresponds to the high UA (93.48 %) reported in our cross-comparison matrix, demonstrating strong consistency in identifying forests without detectable disturbances during the Landsat observation period.
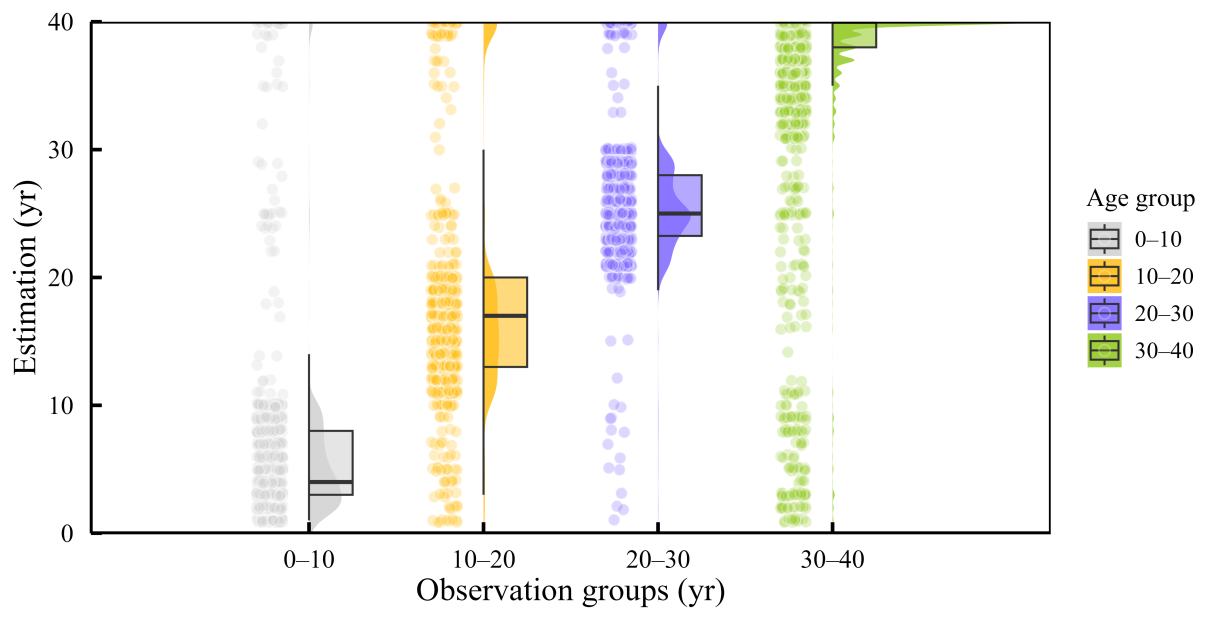
Nevertheless, a minor, vertically scattered trace of data points within this oldest age cohort extends downward toward the baseline (Fig. 14). This trailing underestimation represents a classic algorithmic artifact within long-term time-series segmentation, where anomalous, non-disturbance events – such as extreme localized drought, severe ephemeral frost, or residual cloud-shadow contamination – temporarily distort the spectral trajectory. Even under a stringent statistical constraint (chiSquareProbability = 0.99), these high-magnitude biophysical or radiometric anomalies can occasionally trigger spurious breakpoints, causing the CCDC model to misinterpret an undisturbed mature stand as a newly initiated segment and prematurely reset its estimated age.
Conversely, while the major age cohorts cluster reasonably within their corresponding reference boundaries, the intermediate successional stages – specifically the 10–20 and 20–30 year classes – exhibit relatively higher structural variability and increased downward deviation (Fig. 14). As indicated by the widened interquartile ranges and extended lower tails of the probability density distributions in these middle-aged groups, a proportion of samples show lower estimated ages than the reference observations. The observed downward dispersion in these 10–30 year stands likely reflects the complex spectral responses associated with partial, low-intensity disturbances (e.g., selective logging, surface fires, or insect outbreaks). In young-to-middle-aged natural forests, partial canopy alterations may generate detectable spectral changes without complete stand replacement. Consequently, CCDC may occasionally interpret these spectral variations or subsequent recovery trajectories as new temporal segments, resulting in apparent age resets and increased underestimation uncertainty. These uncertainties should be considered when applying the dataset to analyses involving carbon dynamics and forest structure.
The segment-fusion logic implemented in this study was designed to address the fragmentation of spectrally continuous recovery trajectories during the transition from rapid canopy regrowth to spectral stabilization. In some cases, transient spectral fluctuations during early successional stages may cause CCDC to divide a continuous recovery process into multiple short segments. By merging trajectories with consistent recovery characteristics, the fusion procedure improves the temporal coherence of forest recovery profiles. However, this procedure does not explicitly identify or remove breakpoints induced by non-stand-replacing disturbances. Consequently, partial disturbances remain an important source of uncertainty in the resulting age estimates. In areas affected by selective logging, thinning, insect outbreaks, low-severity fires, or other canopy-altering events, the detected disturbance year may not correspond to complete stand replacement, potentially leading to underestimation of forest age at affected locations. However, the magnitude of this underestimation varies spatially depending on disturbance frequency, intensity, and forest management practices. Therefore, these age biases are not expected to originate from a single parameter configuration but rather from the interaction between disturbance characteristics, spectral recovery trajectories, and the inherent limitations of optical time-series segmentation.
Beyond historical data depth and segment-fitting sensitivities, conceptual and algorithmic lags introduce minor systematic uncertainties. A technical nuance arises from the discrepancy between the tStart and the actual onset of post-disturbance vegetation recovery. Because the GEE implementation of CCDC requires a minimum number of valid observations to initialize a new stable model segment, the estimated tStart inherently reflects the point of model convergence. This introduces a temporal lag whose magnitude depends on regional observation frequency and the availability of valid Landsat observations. Beyond this algorithmic delay, an ecological lag phase exists between disturbance and tree establishment. In many ecosystems, the post-disturbance recovery trajectory includes an initial phase dominated by grasses and shrubs before tree cohorts become spectrally dominant. Therefore, the disturbance-recovery age estimated from Landsat time-series observations may not exactly correspond to the age of dominant tree cohorts. Depending on the timing of spectral breakpoint detection and subsequent vegetation recovery, this temporal discrepancy may result in either slight overestimation or underestimation of tree establishment age. While this ecological lag does not compromise the identified macro-spatial patterns, it should be considered when applying the dataset to analyses involving carbon dynamics, particularly during early successional stages where carbon accumulation rates differ from those of established young forests.
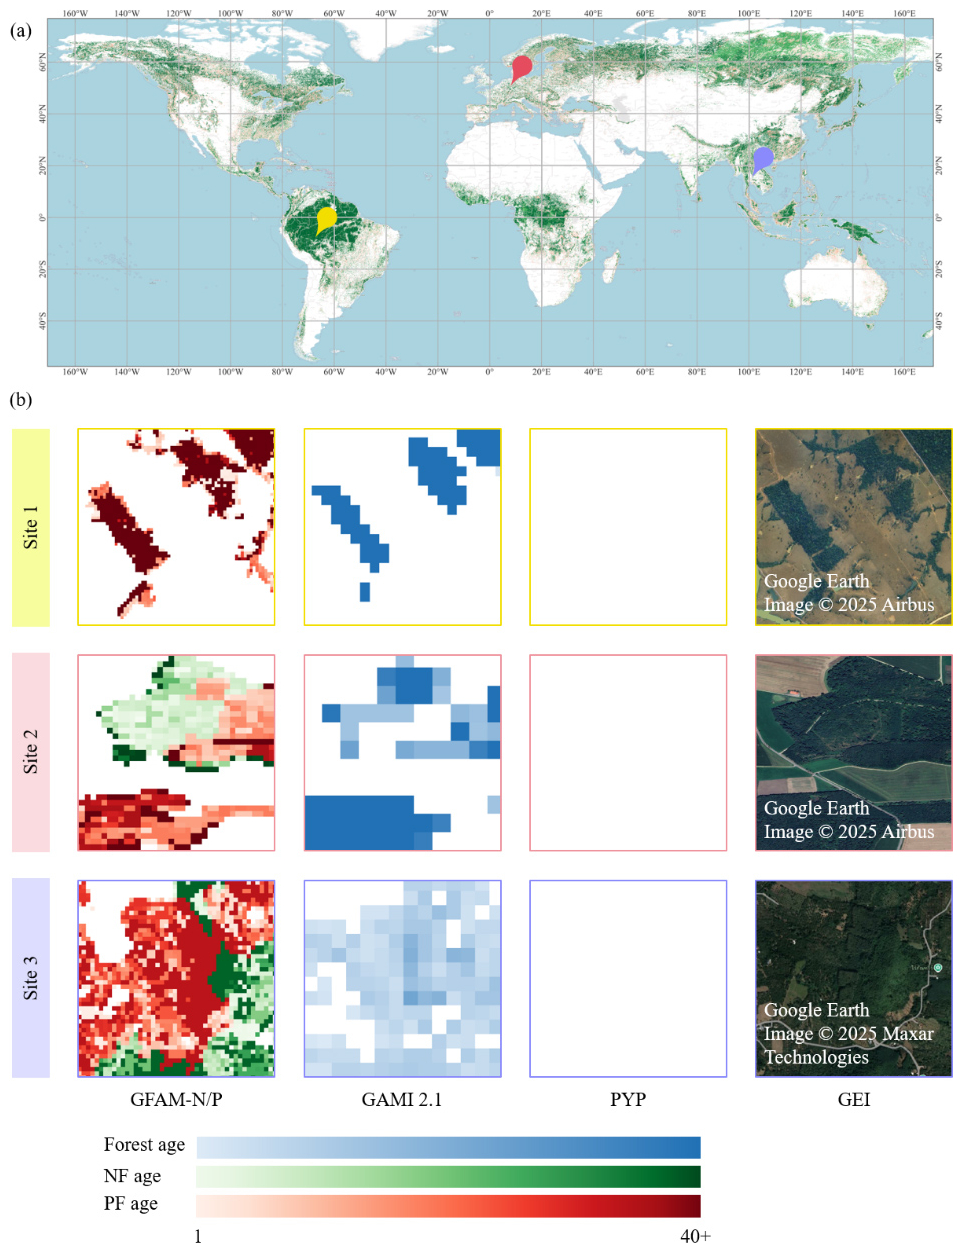
Figure 15Comparison of global forest age products and demonstration of spatial improvements achieved in this study. (a) Global distribution of three representative validation sites used for product comparison. (b) Local comparisons among the GFAM-N/P, the GAMI 2.1 product, the PYP dataset, and high-resolution Google Earth imagery (GEI). The three sites represent heterogeneous forest landscapes across South America (Site 1), Europe (Site 2), and Southeast Asia (Site 3). Blank regions in the PYP column indicate areas with no available data. Note: High-resolution reference images in the GEI column are adapted from Google Earth with original attributions; underlying map material and imagery copyrights are provided and visible in the map (Imagery © 2025 Airbus and © 2025 Maxar Technologies).
Additional localized uncertainties stem from phenological interference and sensor artifacts. In temperate and boreal biomes, the pronounced seasonality of deciduous species produces spectral signals (e.g., natural annual senescence and rapid spring green-up) that intrinsically overlap with the spectral signatures of disturbance and recovery. While the CCDC algorithm's harmonic regression model is designed to isolate these seasonal cycles, it may still struggle with atypical phenological shifts driven by extreme climatic events, leading to spurious breakpoint detections. Furthermore, in dense deciduous stands, rapid canopy closure during the first few growing seasons may saturate spectral indices like NBR before the stand reaches true spectral stabilization. Finally, radiometric inconsistencies, particularly the scan line corrector (SLC)-off gaps in Landsat 7 imagery, locally distort spectral trajectories and introduce minor biases, notably manifested as image banding effects that disrupt time-series signal stability across certain African regions.
4.4 Advances over existing products and strategic management implications
Current global forest age products – such as GFAD, GAMI, and planting year of plantations (PYP) – face inherent limitations in spatial resolution, regional adaptability, and forest-origin-specific age characterization. Most existing datasets operate at coarse spatial resolutions (100 m) and typically do not distinguish forest origin, leading to mixed and often biased age estimates that obscure management-driven differences in forest dynamics. The 30 m GFAM-N/P developed in this study addresses these challenges by offering spatially explicit and origin-specific age estimates for NF and PF. This fine spatial detail enables the detection of subtle regional variations in age structure, particularly across heterogeneous landscapes where natural and planted forests are closely interwoven. Comparative analyses highlight these improvements: our dataset captures fine-scale gradients absent from coarser products, while mitigating data gaps across regions like South America and Europe that are prevalent in biomass-driven or record-limited empirical models (e.g., GAMI and PYP, Fig. 15).
The pronounced spatial heterogeneity and structural contrasts between NF and PF revealed in this study underscore the necessity of shifting from generalized global forestry frameworks to region-specific, precision management strategies. In short-rotation plantation regions (e.g., Australia, parts of Africa, and Southeast Asia) dominated by young PF cohorts (1–15 years), extending rotation cycles and promoting mixed-species configurations could significantly enhance ecological resilience and long-term soil carbon stabilization. Conversely, in regions dominated by mature NF (e.g., Europe and North America), where older forest age classes are prevalent, conservation frameworks should prioritize maintaining natural regeneration, structural diversity, and habitat continuity to support mature forest biodiversity and reduce the risk of carbon losses associated with future disturbances. Asia, characterized by a relatively balanced forest age composition, represents a critical transitional system where protection-oriented and productivity-driven strategies can harmoniously coexist. Ultimately, the high-resolution, origin-specific forest age data provided by GFAM-N/P offer a transparent, reproducible, and robust empirical foundation for optimizing global forest management, improving carbon budget accounting, and informing policy decisions that reconcile climate mitigation with sustainable socio-economic development.
The dataset presented in this study is available on Zenodo at https://doi.org/10.5281/zenodo.22030377 (Wang et al., 2026).
Accurate mapping of forest age is essential for improving global carbon cycle assessment and supporting forest management strategies. Traditional ground-based inventories and existing global forest age products are often limited in spatial resolution and rarely provide a consistent representation of differences between natural and planted forests.
In this study, we developed a 30 m resolution global forest age dataset (GFAM-N/P) using Landsat time-series analysis and the CCDC algorithm within the Google Earth Engine environment. A type-stratified processing framework was introduced by integrating a global forest-type mask with forest-specific segment refinement rules, enabling forest-origin-specific refinement of age estimates according to contrasting spectral recovery patterns. Validation against an extensive network of multi-evidence interpretation samples and field survey plots, our framework demonstrated high predictive accuracy on a global scale, achieving an R2 of 0.74 and an RMSE of 7.17 years. Furthermore, cross-comparison with independent datasets confirmed high spatial consistency, yielding an OA of 76.12 % and a Kappa coefficient of 0.67.
Overall, this dataset provides a harmonized, long-term spatial representation of forest age that can support studies of ecosystem dynamics, carbon accounting, and forest management under changing environmental conditions.
YW: Conceptualization, Methodology, Formal analysis, Investigation, Resources, Sampling, Data Curation, Writing, Visualization.
HW: Formal analysis, Investigation.
CL, XL: Resources, Sampling.
ZL, XZ, SL, JY: Supervision, Project administration.
YZ: Formal analysis, Investigation, Supervision, Project administration.
The contact author has declared that none of the authors has any competing interests.
Publisher's note: Copernicus Publications remains neutral with regard to jurisdictional claims made in the text, published maps, institutional affiliations, or any other geographical representation in this paper. The authors bear the ultimate responsibility for providing appropriate place names. Views expressed in the text are those of the authors and do not necessarily reflect the views of the publisher.
We gratefully acknowledge the Google Earth Engine platform for providing the computational resources required for this study. We also sincerely thank the reviewers for their valuable and constructive comments, which greatly improved the manuscript.
This research was funded by the National Key Research and Development Program of China (grant no. 2024YFD1500605).
This paper was edited by Francesco N. Tubiello and reviewed by two anonymous referees.
Almalki, R., Khaki, M., Saco, P. M., and Rodriguez, J. F.: Monitoring and mapping vegetation cover changes in arid and semi-arid areas using remote sensing technology: A review, Remote Sens., 14, 5143, https://doi.org/10.3390/rs14205143, 2022.
Aszalós, R., Thom, D., Aakala, T., Angelstam, P., Brūmelis, G., Gálhidy, L., Gratzer, G., Hlásny, T., Katzensteiner, K., Kovács, B., Knoke, T., Larrieu, L., Motta, R., Müller, J., Ódor, P., Roženbergar, D., Paillet, Y., Pitar, D., Standovár, T., Svoboda, M., Szwagrzyk, J., Toscani, P., and Keeton, W. S.: Natural disturbance regimes as a guide for sustainable forest management in Europe, Ecol. Appl., 32, e2596, https://doi.org/10.1002/eap.2596, 2022.
Bennett, B. M.: Plantations and Protected Areas: A Global History of Forest Management, MIT Press, Cambridge, MA, https://doi.org/10.7551/mitpress/9780262029933.001.0001, 2015.
Besnard, S., Koirala, S., Santoro, M., Weber, U., Nelson, J., Gütter, J., Herault, B., Kassi, J., N'Guessan, A., Neigh, C., Poulter, B., Zhang, T., and Carvalhais, N.: Mapping global forest age from forest inventories, biomass and climate data, Earth Syst. Sci. Data, 13, 4881–4896, https://doi.org/10.5194/essd-13-4881-2021, 2021.
Besnard, S., Santoro, M., Herold, M., Cartus, O., Gütter, J., Heinrich, V. H. A., Herault, B., Kassi, J., Koirala, S., N'Guessan, A., Neigh, C., Nelson, J. A., Poulter, B., Weber, U., Zhang, T., and Carvalhais, N.: Global Age Mapping Integration (GAMI) (2.1), GFZ Data Services, https://doi.org/10.5880/GFZ.1.4.2023.006, 2024.
Bright, B. C., Hudak, A. T., Kennedy, R. E., Braaten, J. D., and Henareh Khalyani, A.: Examining post-fire vegetation recovery with Landsat time series analysis in three western North American forest types, Fire Ecol., 15, 1–14, 2019.
Bunce, C.: Correlation, agreement, and Bland–Altman analysis: statistical analysis of method comparison studies, Am. J. Ophthalmol., 148, 4–6, 2009.
Cao, Y., Zhong, D., Shang, R., Ke, Q., Zhang, M., Xie, D., Liu, S., Zhao, C., and Wei, R.: Afforestation as a mitigation strategy: countering climate-induced risk of forest carbon sink in China, Carbon Balance and Management, 20, 18, https://doi.org/10.1186/s13021-025-00308-1, 2025.
Champion, I., Germain, C., Da Costa, J. P., Alborini, A., and Dubois-Fernandez, P.: Retrieval of forest stand age from SAR image texture for varying distance and orientation values of the gray level co-occurrence matrix, IEEE Geosci. Remote Sens. Lett., 11, 5–9, 2013.
Chen, W., Chen, J., Liu, J., and Cihlar, J.: Approaches for reducing uncertainties in regional forest carbon balance, Global Biogeochem. Cy., 14, 827–838, 2000.
Cheng, K., Chen, Y., Xiang, T., Yang, H., Liu, W., Ren, Y., Guan, H., Hu, T., Ma, Q., and Guo, Q.: A 2020 forest age map for China with 30 m resolution, Earth Syst. Sci. Data, 16, 803–819, https://doi.org/10.5194/essd-16-803-2024, 2024a.
Cheng, K., Yang, H., Tao, S., Su, Y., Guan, H., Ren, Y., Hu, T., Li, W., Xu, G., Chen, M., Lu, X., Yang, Z., Tang, Y., Ma, K., Fang, J., and Guo, Q.: Carbon storage through China's planted forest expansion, Nat. Commun., 15, 4106, https://doi.org/10.1038/s41467-024-48546-0, 2024b.
Deng, X., Guo, S., Sun, L., and Chen, J.: Identification of short-rotation eucalyptus plantation at large scale using multi-satellite imageries and cloud computing platform, Remote Sensing, 12, 2153, https://doi.org/10.3390/rs12132153, 2020.
DeVries, B., Decuyper, M., Verbesselt, J., Zeileis, A., Herold, M., and Joseph, S.: Tracking disturbance-regrowth dynamics in tropical forests using structural change detection and Landsat time series, Remote Sens. Environ., 169, 320–334, 2015.
Du, Z., Yu, L., Yang, J., Xu, Y., Chen, B., Peng, S., Zhang, T., Fu, H., Harris, N., and Gong, P.: A global map of planting years of plantations, Sci. Data, 9, 141, 2022.
Erdozain, M., Alberdi, I., Aszalós, R., Bollmann, K., Detsis, V., Diaci, J., Đodan, M., Efthimiou, G., Gálhidy, L., Haase, M., Hoffmann, J., Jaymond, D., Johann, E., Jørgensen, H., Krumm, F., Kuuluvainen, T., Lachat, T., Lapin, K., Lindner, M., Madsen, P., Nichiforel, L., Pach, M., Paillet, Y., Palaghianu, C., Palau, J., Pemán, J., Perić, S., Raum, S., Schueler, S., Skrzyszewski, J., Svensson, J., Teeuwen, S., Vacchiano, G., Vandekerkhove, K., Cañellas, I., Menéndez-Miguélez, M., Werden, L. L. K., Àvila, A., and de-Miguel, S.: The Evolution of Forest Restoration in Europe: A Synthesis for a Step Forward Based on National Expert Knowledge, Current Forestry Reports, 11, 4, https://doi.org/10.1007/s40725-024-00235-3, 2024.
Escuin, S., Navarro, R., and Fernández, P.: Fire severity assessment by using NBR (Normalized Burn Ratio) and NDVI (Normalized Difference Vegetation Index) derived from LANDSAT TM/ETM images, Int. J. Remote Sens., 29, 1053–1073, 2008.
FAO: The State of the World's Forests 2024 – Forest-sector innovations towards a more sustainable future, FAO, Rome, https://doi.org/10.4060/cd1211en, 2024.
Han, C., Liu, Y., Zhang, C., Li, Y., Zhou, T., Khan, S., Chen, N., and Zhao, C.: Effects of three coniferous plantation species on plant‐soil feedbacks and soil physical and chemical properties in semi‐arid mountain ecosystems, Forest Ecosystems, 8, 3, https://doi.org/10.1186/s40663-021-00281-4, 2021.
Hansen, M. C., Potapov, P. V., Moore, R., Hancher, M., Turubanova, S. A., Tyukavina, A., Thau, D., Stehman, S. V., Goetz, S. J., and Loveland, T. R.: High-resolution global maps of 21st-century forest cover change, Science, 342, 850–853, 2013.
He, G., Zhang, Z., Zhu, Q., Wang, W., Peng, W., and Cai, Y.: Estimating Carbon Sequestration Potential of Forest and Its Influencing Factors at Fine Spatial-Scales: A Case Study of Lushan City in Southern China, Int. J. Env. Res. Pub. He., 19, 9184, https://doi.org/10.3390/ijerph19159184, 2022.
Huang, Z., Li, X., Du, H., Zou, W., Zhou, G., Mao, F., Fan, W., Xu, Y., Ni, C., and Zhang, B.: An algorithm of forest age estimation based on the forest disturbance and recovery detection, IEEE T. Geosci. Remote Sens., 61, 1–18, 2023.
Ju, J., Roy, D. P., Vermote, E., Masek, J., and Kovalskyy, V.: Continental-scale validation of MODIS-based and LEDAPS Landsat ETM+ atmospheric correction methods, Remote Sens. Environ., 122, 175–184, 2012.
Köhl, M., Neupane, P. R., and Lotfiomran, N.: The impact of tree age on biomass growth and carbon accumulation capacity: A retrospective analysis using tree ring data of three tropical tree species grown in natural forests of Suriname, PLoS One, 12, e0181187, https://doi.org/10.1371/journal.pone.0181187, 2017.
Leng, Y., Li, W., Ciais, P., Sun, M., Zhu, L., Yue, C., Chang, J., Yao, Y., Zhang, Y., Zhou, J., Li, Z., Wang, X., Xi, Y., and Peng, S.: Forest aging limits future carbon sink in China, One Earth, 7, 822–834, https://doi.org/10.1016/j.oneear.2024.04.011, 2024.
Li, P., Li, H., Si, B., Zhou, T., Zhang, C., and Li, M.: Mapping planted forest age using LandTrendr algorithm and Landsat 5–8 on the Loess Plateau, China, Agr. Forest Meteorol., 344, 109795, https://doi.org/10.1016/j.agrformet.2023.109795, 2024.
Liang, B., Wang, J., Zhang, Z., Zhang, J., Zhang, J., Cressey, E. L., and Wang, Z.: Planted forest is catching up with natural forest in China in terms of carbon density and carbon storage, Fundamental Research, 2, 688–696, https://doi.org/10.1016/j.fmre.2022.04.008, 2022.
Liao, W., Ye, D., Yuan, R., Zhang, Y., and Deng, Q.: Financial compensation for natural forest logging ban: Standard calculation based on willingness to accept, Sci. Prog., 106, 368504221145563, https://doi.org/10.1177/00368504221145563, 2023.
Lu, J., Huang, C., Schleeweis, K., Zou, Z., and Gong, W.: Tree age estimation across the US using forest inventory and analysis database, Forest Ecol. Manage., 584, 122603, https://doi.org/10.1016/j.foreco.2025.122603, 2025.
Maltman, J. C., Hermosilla, T., Wulder, M. A., Coops, N. C., and White, J. C.: Estimating and mapping forest age across Canada's forested ecosystems, Remote Sens. Environ., 290, 113529, https://doi.org/10.1016/j.rse.2023.113529, 2023.
Maza, M., Lara, J. L., and Losada, I. J.: Predicting the evolution of coastal protection service with mangrove forest age, Coast. Eng., 168, 103922, https://doi.org/10.1016/j.coastaleng.2021.103922, 2021.
Mo, L., Crowther, T. W., Maynard, D. S., van den Hoogen, J., Ma, H., Bialic-Murphy, L., Liang, J., de-Miguel, S., Nabuurs, G.-J., Reich, P. B., Phillips, O. L., Abegg, M., Adou Yao, Y. C., Alberti, G., Almeyda Zambrano, A. M., Alvarado, B. V., Alvarez-Dávila, E., Alvarez-Loayza, P., Alves, L. F., Amaral, I., Ammer, C., Antón-Fernández, C., Araujo-Murakami, A., Arroyo, L., Avitabile, V., Aymard, G. A., Baker, T. R., Bałazy, R., Banki, O., Barroso, J. G., Bastian, M. L., Bastin, J.-F., Birigazzi, L., Birnbaum, P., Bitariho, R., Boeckx, P., Bongers, F., Boonman, C. C. F., Bouriaud, O., Brancalion, P. H. S., Brandl, S., Brearley, F. Q., Brienen, R., Broadbent, E. N., Bruelheide, H., Bussotti, F., Gatti, R. C., César, R. G., Cesljar, G., Chazdon, R., Chen, H. Y. H., Chisholm, C., Cho, H., Cienciala, E., Clark, C., Clark, D., Colletta, G. D., Coomes, D. A., Valverde, F. C., Corral-Rivas, J. J., Crim, P. M., Cumming, J. R., Dayanandan, S., de Gasper, A. L., Decuyper, M., Derroire, G., DeVries, B., Djordjevic, I., Dolezal, J., Dourdain, A., Engone Obiang, N. L., Enquist, B. J., Eyre, T. J., Fandohan, A. B., Fayle, T. M., Feldpausch, T. R., Ferreira, L. V., Finér, L., Fischer, M., Fletcher, C., Frizzera, L., Gamarra, J. G. P., Gianelle, D., Glick, H. B., Harris, D. J., Hector, A., Hemp, A., Hengeveld, G., Hérault, B., Herbohn, J. L., Herold, M., Hietz, P., Hillers, A., Honorio Coronado, E. N., Hui, C., Ibanez, T., Imai, N., Jagodziński, A. M., Jaroszewicz, B., Johannsen, V. K., Joly, C. A., Jucker, T., Jung, I., Karminov, V., Kartawinata, K., Kearsley, E., Kenfack, D., Kennard, D. K., Kepfer-Rojas, S., Keppel, G., Khan, M. L., Killeen, T. J., Kim, H. S., Kitayama, K., Köhl, M., Korjus, H., Kraxner, F., Kucher, D., Laarmann, D., Lang, M., Lewis, S. L., Li, Y., Lopez-Gonzalez, G., Lu, H., Lukina, N. V., Maitner, B. S., Malhi, Y., Marcon, E., Marimon, B. S., Marimon-Junior, B. H., Marshall, A. R., Martin, E. H., McCarthy, J. K., Meave, J. A., Melo-Cruz, O., Mendoza, C., Mendoza-Polo, I., Miscicki, S., Merow, C., Mendoza, A. M., Moreno, V. S., Mukul, S. A., Mundhenk, P., Nava-Miranda, M. G., Neill, D., Neldner, V. J., Nevenic, R. V., Ngugi, M. R., Niklaus, P. A., Ontikov, P., Ortiz-Malavasi, E., Pan, Y., Paquette, A., Parada-Gutierrez, A., Parfenova, E. I., Park, M., Parren, M., Parthasarathy, N., Peri, P. L., Pfautsch, S., Picard, N., Piedade, M. T. F., Piotto, D., Pitman, N. C. A., Poorter, L., Poulsen, A. D., Poulsen, J. R., Pretzsch, H., Arevalo, F. R., Restrepo-Correa, Z., Richardson, S. J., Rodeghiero, M., Rolim, S. G., Roopsind, A., Rovero, F., Rutishauser, E., Saikia, P., Salas-Eljatib, C., Saner, P., Schall, P., Schelhaas, M.-J., Schepaschenko, D., Scherer-Lorenzen, M., Schmid, B., Schöngart, J., Searle, E. B., Seben, V., Serra-Diaz, J. M., Sheil, D., Shvidenko, A. Z., Da Silva, A. C., Silva-Espejo, J. E., Silveira, M., Singh, J., Sist, P., Slik, F., Sonké, B., Sosinski, E. E., Souza, A. F., Stereńczak, K. J., Svenning, J.-C., Svoboda, M., Swanepoel, B., Targhetta, N., Tchebakova, N., ter Steege, H., Thomas, R., Tikhonova, E., Umunay, P. M., Usoltsev, V. A., Valencia, R., Valladares, F., Van Bodegom, P. M., van der Plas, F., Van Do, T., van Nuland, M. E., Vasquez, R. M., Verbeeck, H., Viana, H., Vibrans, A. C., Vieira, S., von Gadow, K., Wang, H.-F., Watson, J. V., Werner, G. D. A., Wittmann, F., Woell, H., Wortel, V., Zagt, R., Zawiła-Niedźwiecki, T., Zhang, C., Zhao, X., Zhou, M., Zhu, Z.-X., Zo-Bi, I. C., and Zohner, C. M.: The global distribution and drivers of wood density and their impact on forest carbon stocks, Nat. Ecol. Evol., 8, 2195–2212, https://doi.org/10.1038/s41559-024-02564-9, 2024.
Murphy, B. A., Rollinson, C. R., Dietze, M. C., Staudhammer, C. L., VonHedemann, N. R., Schultz, C. A., Kleindl, W. J., and Desai, A. R.: Insights into nature‐based climate solutions: Managing forests for climate resilience and carbon stability, J. Geophys. Res.-Biogeo., 130, e2024JG008391, https://doi.org/10.1029/2024JG008391, 2025.
Noss, R. F.: Assessing and monitoring forest biodiversity: a suggested framework and indicators, Forest Ecol. Manag., 115, 135–146, 1999.
Oldekop, J. A., Rasmussen, L. V., Agrawal, A., Bebbington, A. J., Meyfroidt, P., Bengston, D. N., Blackman, A., Brooks, S., Davidson-Hunt, I., Davies, P., Dinsi, S. C., Fontana, L. B., Gumucio, T., Kumar, C., Kumar, K., Moran, D., Mwampamba, T. H., Nasi, R., Nilsson, M., Pinedo-Vasquez, M. A., Rhemtulla, J. M., Sutherland, W. J., Watkins, C., and Wilson, S. J.: Forest-linked livelihoods in a globalized world, Nat. Plants, 6, 1400–1407, https://doi.org/10.1038/s41477-020-00814-9, 2020.
Pan, Y., Chen, J. M., Birdsey, R., McCullough, K., He, L., and Deng, F.: Age structure and disturbance legacy of North American forests, Biogeosciences, 8, 715–732, https://doi.org/10.5194/bg-8-715-2011, 2011.
Poulter, B., Aragao, L., Adela, N., Bellassen, V., Ciais, P., Kato, T., Lin, X., Nachin, B., Luyssaert, S., Pederson, N., Peylin, P., Piao, S., Saatchi, S., Schepaschenko, D., Schelhaas, M., and Shivdenko, A.: The global forest age dataset (GFADv1.0), PANGAEA, https://doi.org/10.1594/PANGAEA.889943, 2018.
Poulter, B., Aragão, L., Andela, N., Bellassen, V., Ciais, P., Kato, T., Lin, X., Nachin, B., Luyssaert, S., Pederson, N., Peylin, P., Piao, S., Pugh, T., Saatchi, S., Schepaschenko, D., Schelhaas, M., and Shivdenko, A.: The global forest age dataset and its uncertainties (GFADv1.1), PANGAEA [data set], https://doi.org/10.1594/PANGAEA.897392, 2019.
Racine, E. B., Coops, N. C., St-Onge, B., and Bégin, J.: Estimating forest stand age from LiDAR-derived predictors and nearest neighbor imputation, Forest Sci., 60, 128–136, 2014.
Reyes-Palomeque, G., Dupuy, J., Portillo-Quintero, C., Andrade, J., Tun-Dzul, F., and Hernández-Stefanoni, J.: Mapping forest age and characterizing vegetation structure and species composition in tropical dry forests, Ecol. Indic., 120, 106955, https://doi.org/10.1016/j.ecolind.2020.106955, 2021.
Ryu, J.-H., Han, K.-S., Hong, S., Park, N.-W., Lee, Y.-W., and Cho, J.: Satellite-based evaluation of the post-fire recovery process from the worst forest fire case in South Korea, Remote Sens., 10, 918, https://doi.org/10.3390/rs10060918, 2018.
Shang, R., Chen, J. M., Xu, M., Lin, X., Li, P., Yu, G., He, N., Xu, L., Gong, P., Liu, L., Liu, H., and Jiao, W.: China's current forest age structure will lead to weakened carbon sinks in the near future, The Innovation, 4, 100515, https://doi.org/10.1016/j.xinn.2023.100515, 2023.
Shi, X., Wang, T., Lu, S., Chen, K., He, D., and Xu, Z.: Evaluation of China's forest carbon sink service value, Environ. Sci. Pollut. R., 29, 44668–44677, https://doi.org/10.1007/s11356-022-18958-w, 2022.
Smolina, A., Illarionova, S., Shadrin, D., Kedrov, A., and Burnaev, E.: Forest age estimation in northern Arkhangelsk region based on machine learning pipeline on Sentinel-2 and auxiliary data, Sci. Rep., 13, 22167, https://doi.org/10.1038/s41598-023-49207-w, 2023.
Steel, E. A., Hinckley, T. M., Richards, W. H., and D'Amore, D. V.: Chapter 3 – Forests then and now: managing for ecosystem benefits, services to humans, and healthy forests across scales, in: Future Forests, edited by: McNulty, S. G., Elsevier, 49–64, https://doi.org/10.1016/B978-0-323-90430-8.00009-5, 2024.
Strandgard, M. and Béland, M.: Economics of forest biomass for bioenergy: Potential site preparation savings from coarse woody harvesting residue removal in a short-rotation Eucalyptus globulus (Labill.) plantation, Silva Balcanica, 22, 45–55, 2021.
Su, Y., Zhang, C., Ciais, P., Zeng, Z., Cescatti, A., Shang, J., Chen, J. M., Liu, J., Wang, Y.-P., and Yuan, W.: Asymmetric influence of forest cover gain and loss on land surface temperature, Nat. Clim. Change, 13, 823–831, 2023.
Tang, S., Tian, Q., Xu, K., Xu, N., and Yue, J.: Age information retrieval of Larix gmelinii forest using Sentinel-2 data, Natl. Remote Sens. Bull., 24, 1511–1524, 2020.
Thompson, I., Mackey, B., McNulty, S., and Mosseler, A.: Forest resilience, biodiversity, and climate change, Secretariat of the Convention on Biological Diversity (Montreal, Canada), 1–67, https://www.cbd.int/doc/publications/cbd-ts-43-en.pdf (last access: 28 August 2026), 2009.
Tian, H., Zhu, J., Lei, X., Jian, Z., Chen, X., Zeng, L., Huang, G., Liu, C., and Xiao, W.: Models considering the theoretical stand age will underestimate the future forest carbon sequestration potential, Forest Ecol. Manage., 562, 121982, https://doi.org/10.1016/j.foreco.2024.121982, 2024.
Tian, L., Liao, L., Tao, Y., Wu, X., and Li, M.: Forest age mapping using landsat time-series stacks data based on forest disturbance and empirical relationships between age and height, Remote Sens., 15, 2862, https://doi.org/10.3390/rs15112862, 2023.
Tian, X., Van der Tol, C., Su, Z., Li, Z., Chen, E., Li, X., Yan, M., Chen, X., Wang, X., and Pan, X.: Simulation of forest evapotranspiration using time-series parameterization of the Surface Energy Balance System (SEBS) over the Qilian Mountains, Remote Sens., 7, 15822–15843, 2015.
Trisasongko, B., Panuju, D., and Iman, L.: Estimating tree age of rubber stands using spaceborne L-band synthetic aperture radar, IOP Conference Series: Earth and Environmental Science, IPB International Convention Center, Bogor, Indonesia, 012079, https://doi.org/10.1088/1755-1315/418/1/012079, 2020.
United States Forest Service: Forest Inventory and Analysis Database: FIA DataMart, https://research.fs.usda.gov/products/dataandtools/fia-datamart (last access: 1 June 2026), 2024.
U.S. Department of State's Office of the Geographer: LSIB 2017: Large Scale International Boundary Polygons, Simplified, USDOS/LSIB_SIMPLE/2017 [data set], https://developers.google.com/earth-engine/datasets/catalog/USDOS_LSIB_SIMPLE_2017 (last access: 28 August 2026), 2017.
Vermote, E., Roger, J.-C., Franch, B., and Skakun, S.: LaSRC (Land Surface Reflectance Code): Overview, application and validation using MODIS, VIIRS, LANDSAT and Sentinel 2 data's, IGARSS 2018–2018 IEEE International Geoscience and Remote Sensing Symposium, 8173–8176, https://doi.org/10.1109/IGARSS.2018.8517622, 2018.
Vilén, T., Gunia, K., Verkerk, P., Seidl, R., Schelhaas, M.-J., Lindner, M., and Bellassen, V.: Reconstructed forest age structure in Europe 1950–2010, Forest Ecol. Manage., 286, 203–218, 2012.
Wang, Y., Wang, H., Liang, C., Li, X., Liu, Z., Zhang, X., Li, S., Yang, J., and Zhao, Y.: Global Natural and Planted Forest Age dataset, Zenodo [data set], https://doi.org/10.5281/zenodo.22030377, 2026.
Xiao, Y., Wang, Q., Tong, X., and Atkinson, P. M.: Thirty-meter map of young forest age in China, Earth Syst. Sci. Data, 15, 3365–3386, https://doi.org/10.5194/essd-15-3365-2023, 2023.
Xiao, Y., Wang, Q., and Zhang, H. K.: Global Natural and Planted Forests Mapping at Fine Spatial Resolution of 30 m, J. Remote Sens., 4, 0204, https://doi.org/10.34133/remotesensing.0204, 2024.
Yu, Z., Liu, S., Li, H., Liang, J., Liu, W., Piao, S., Tian, H., Zhou, G., Lu, C., and You, W.: Maximizing carbon sequestration potential in Chinese forests through optimal management, Nat. Commun., 15, 3154, https://doi.org/10.1038/s41467-024-47143-5, 2024.
Zhang, J., Zhang, P., Wang, R., Liu, Y., and Lu, S.: Identifying the coupling coordination relationship between urbanization and forest ecological security and its impact mechanism: Case study of the Yangtze River Economic Belt, China, J. Environ. Manage., 342, 118327, https://doi.org/10.1016/j.jenvman.2023.118327, 2023.
Zhang, Y., Yao, Y., Wang, X., Liu, Y., and Piao, S.: Mapping spatial distribution of forest age in China, Earth Space Sci., 4, 108–116, 2017.
Zou, H. and Song, Y.: Influence of forest vegetation restoration on carbon increment after mining, Sci. Rep., 13, 19565, https://doi.org/10.1038/s41598-023-45332-8, 2023.