the Creative Commons Attribution 4.0 License.
the Creative Commons Attribution 4.0 License.
 | 16 Jan 2026
Energy-conservation datasets of global land surface radiation and heat fluxes from 2000–2020 generated by CoSEB
Junrui Wang
Ronglin Tang
Meng Liu
Zhao-Liang Li
Accurately estimating global land surface radiation [including downward shortwave radiation (SWIN), downward longwave radiation (LWIN), upward shortwave radiation (SWOUT), upward longwave radiation (LWOUT) and net radiation (Rn)] and heat fluxes [including latent heat flux (LE), soil heat flux (G) and sensible heat flux (H)] is essential for quantifying the exchange of radiation, heat and water between the land and atmosphere under global climate change. This study presents the first data-driven energy-conservation datasets of global land surface radiation and heat fluxes from 2000 to 2020, generated by our model of Coordinated estimates of land Surface Energy Balance components (CoSEB). The model integrates GLASS and MODIS remote sensing data, ERA5-Land reanalysis datasets, topographic data, CO2 concentration data as independent variables and in situ radiation and heat flux observations at 258 eddy covariance sites worldwide as dependent variables within a multivariate random forest technique to effectively learn the physics of energy conservation. The developed CoSEB-based datasets are strikingly advantageous in that [1] they are the first data-driven global datasets that satisfy both surface radiation balance and heat balance among the eight fluxes, as demonstrated by both the radiation imbalance ratio [RIR, defined as ] and energy imbalance ratio [EIR, defined as ] of 0, [2] the radiation and heat fluxes are characterized by high accuracies, where (1) the RMSEs (R2) for daily estimates of SWIN, SWOUT, LWIN, LWOUT, Rn, LE, H and G from the CoSEB-based datasets at 44 independent test sites were 37.52 W m−2 (0.81), 14.20 W m−2 (0.42), 22.47 W m−2 (0.90), 13.78 W m−2 (0.95), 29.66 W m−2 (0.77), 30.87 W m−2 (0.60), 29.75 W m−2 (0.44) and 5.69 W m−2 (0.44), respectively, (2) the CoSEB-based datasets, in comparison to the mainstream products/datasets (i.e. GLASS, BESS-Rad, BESSV2.0, FLUXCOM, MOD16A2, PML_V2 and ETMonitor) that generally separately estimated subsets of the eight flux components, better agreed with the in situ observations. Our developed datasets hold significant potential for application across diverse fields such as agriculture, forestry, hydrology, meteorology, ecology, and environmental science, which can facilitate comprehensive studies on the variability, impacts, responses, adaptation strategies, and mitigation measures of global and regional land surface radiation and heat fluxes under the influences of climate change and human activities. The CoSEB-based datasets are open access and available through the National Tibetan Plateau Data Center (TPDC) at https://doi.org/10.11888/Terre.tpdc.302559 (Tang et al., 2025a) and through the Science Data Bank (ScienceDB) at https://doi.org/10.57760/sciencedb.27228 (Tang et al., 2025b).
- Article
(20963 KB) - Full-text XML
-
Supplement
(1881 KB) - BibTeX
- EndNote


Land surface radiation balance and heat balance play important roles in Earth's climate system, representing the physical processes by which the surface-atmosphere absorbs and redistributes radiation and heat fluxes (Berbery et al., 1999; Betts et al., 1996; Mueller et al., 2009; Sellers et al., 1997; Xu et al., 2022a), and facilitating the exchange of water, energy, carbon, and other agents essential to climatic and ecological systems and human society (Jia et al., 2013; Wang et al., 2012; Wild, 2009; Wild et al., 2012; Xia et al., 2006). Accurately monitoring the spatial and temporal variations of global land surface radiation [including downward shortwave radiation (SWIN), downward longwave radiation (LWIN), upward shortwave radiation (SWOUT), upward longwave radiation (LWOUT) and net radiation (Rn)] and heat fluxes [including latent heat flux (LE), soil heat flux (G) and sensible heat flux (H)] is indispensable for quantifying the exchange of radiation, heat and water between the land and atmosphere under global climate change (Ersi et al., 2024; Liang et al., 2019; Rios and Ramamurthy, 2022; Tang et al., 2024a; Wang et al., 2021), and for studying solar energy utilization (Tang et al., 2024b; Zhang et al., 2017), hydrological cycle (Huang et al., 2015; Wild and Liepert, 2010), ecosystem productivity (Nemani et al., 2003), agricultural management (De Wit et al., 2005) and ecological protection (Tang et al., 2023). Remote sensing (RS) technology, with its high spatial-temporal resolution and applicability over large areas, is considered to be the most effective and economical means for obtaining global land surface radiation and heat fluxes (Liu et al., 2016; Van Der Tol, 2012; Zhang et al., 2010).
In past decades, numerous RS-based products/datasets of global surface radiation and heat fluxes have significantly advanced, which were generally generated by physical (Li et al., 2023; Mu et al., 2011; Yu et al., 2022) or statistical methods (Jiao et al., 2023; Jung et al., 2019; Peng et al., 2020). However, two key limitations still exist in these products. Firstly, most available products provide only a single component of land surface radiation or heat fluxes, e.g. ETMonitor (Zheng et al., 2022) and MOD16A2 (Mu et al., 2011) only estimating LE, leading to the failure to satisfy surface radiation balance and heat balance when the single radiation or heat flux is utilized in conjunction with products containing other radiation and heat components (Wang et al., 2025), and further posing significant uncertainties to understand the interactions and redistributions of surface radiation and energy in the Earth-atmosphere system. Secondly, a few products, e.g., FLUXCOM (Jung et al., 2019) and GLASS (Jiang et al., 2015; Zhang et al., 2014), generated datasets for multiple components of surface radiation and heat fluxes by using separate estimates from the uncoordinated models, which make them difficult to abide by surface radiation and heat conservation. These energy-imbalanced and radiation-imbalanced estimates among multiple components from previous products/datasets severely limit their in-depth applications in analyzing the spatial and temporal trends, simulating the physical processes of radiation, heat and water cycles as well as revealing the attributions and mechanisms in Earth-surface system under global climate change. It was imperative to develop global datasets of land surface radiation and heat fluxes characterized by high accuracy, radiation balance as well as heat balance, to better meet the requirements in practical applications of various fields.
Our proposed data-driven model/framework of Coordinated estimates of land Surface Energy Balance components (CoSEB) (Wang et al., 2025), which effectively learns the underlying physical interrelations (i.e., surface energy conservation law) among multiple targeted variables, provides an unprecedented opportunity to develop global datasets of land surface radiation and heat fluxes that can not only simultaneously provide high-accuracy estimates of these components but also adhere to surface radiation- and heat-conservation laws.
The objectives of this study are twofold: (1) to develop high-accuracy datasets of global land surface radiation and heat fluxes, which comply with the principles of radiation balance and heat balance, using our CoSEB model renewed based on in situ observations, remote sensing data and reanalysis datasets; (2) to validate the datasets/model estimates against data from in situ observations, mainstream products as well as estimates from uncoordinated random forest (RF) techniques. Section 2 introduces the data resources used in this study. Section 3 briefly describes the method we used to estimate global surface radiation and heat fluxes. Section 4 presents the evaluation of the datasets/model estimates generated by our renewed CoSEB model. Section 5 discusses the superiority, potential applications and uncertainties of the developed datasets. Data availability is given in Sect. 6, and a summary and conclusion is provided in Sect. 7.
2.1 Ground-based observations
In this study, the in situ observations of land surface radiation and heat fluxes at 302 eddy covariance (EC) sites from the networks of AmeriFlux (174 sites, 2000–2020, https://AmeriFlux.lbl.gov/Data/, last access: 6 August 2024), EuroFlux (72 sites, 2000–2020, http://www.europe-fluxdata.eu/, last access: 6 August 2024), OzFlux (5 sites, 2007–2012, https://data.ozflux.org.au/, last access: 6 August 2024), FLUXNET (108 sites, 2000–2014, https://FLUXNET.org/Data/download-Data/, last access: 6 August 2024), JapanFlux (15 sites, 2001–2020, https://ads.nipr.ac.jp/japan-flux2024/, last access: 10 October 2025), ChinaFLUX (5 sites, 2005–2020, http://www.chinaflux.org/, last access: 6 August 2024) and National Tibetan Plateau/Third Pole Environment Data Center (TPDC, 13 sites, 2012–2020, https://Data.tpdc.ac.cn/en/Data, last access: 6 August 2024) were used (Fig. 1), where 37, 48 and 5 sites in FLUXNET were also shared in AmeriFlux, EuroFlux and OzFlux, respectively. These 302 sites were filtered out from all collected 1098 sites by following the quality-assurance and quality-control steps, including: (1) any site with a missing component of any of the SWIN, SWOUT, LWIN, LWOUT, LE, H and G was excluded, reducing the 1098 sites to 472 sites for further analysis; (2) any half-hour period with missing data for any of these components was excluded; (3) the half-hourly ground-based observations with quality-control flag of 2 or 3 (bad quality) were removed but quality-control flag of 0 and 1 (good quality) were maintained; (4) a daily average of the half-hour observations was calculated for each day with greater than 80 % good-quality data, further reducing the 472 sites to 355 sites; (5) the aggregated daily LE and H were corrected for energy imbalance using the Bowen ratio method when the daily energy balance closure [defined as ] varied between 0.2 and 1.8 following Wang et al. (2025) to exclude physically implausible measurements; (6) extreme outliers in the daily evaporative fraction were further removed by excluding values outside the 1st–99th percentile range, a common practice in flux and remote sensing studies (Bartkowiak et al., 2024; Wang et al., 2023), further reducing the 355 sites to 337 sites. Besides, the RS products/datasets involved in this study collocated at the sites should not be missing, finally reducing the 337 sites to 302 sites for analysis. Note that the Rn at these sites used in this study was calculated from the sum of net longwave radiation (LWIN minus LWOUT) and net shortwave radiation (SWIN minus SWOUT), rather than using the observed Rn directly, to ensure surface radiation balance in training datasets.
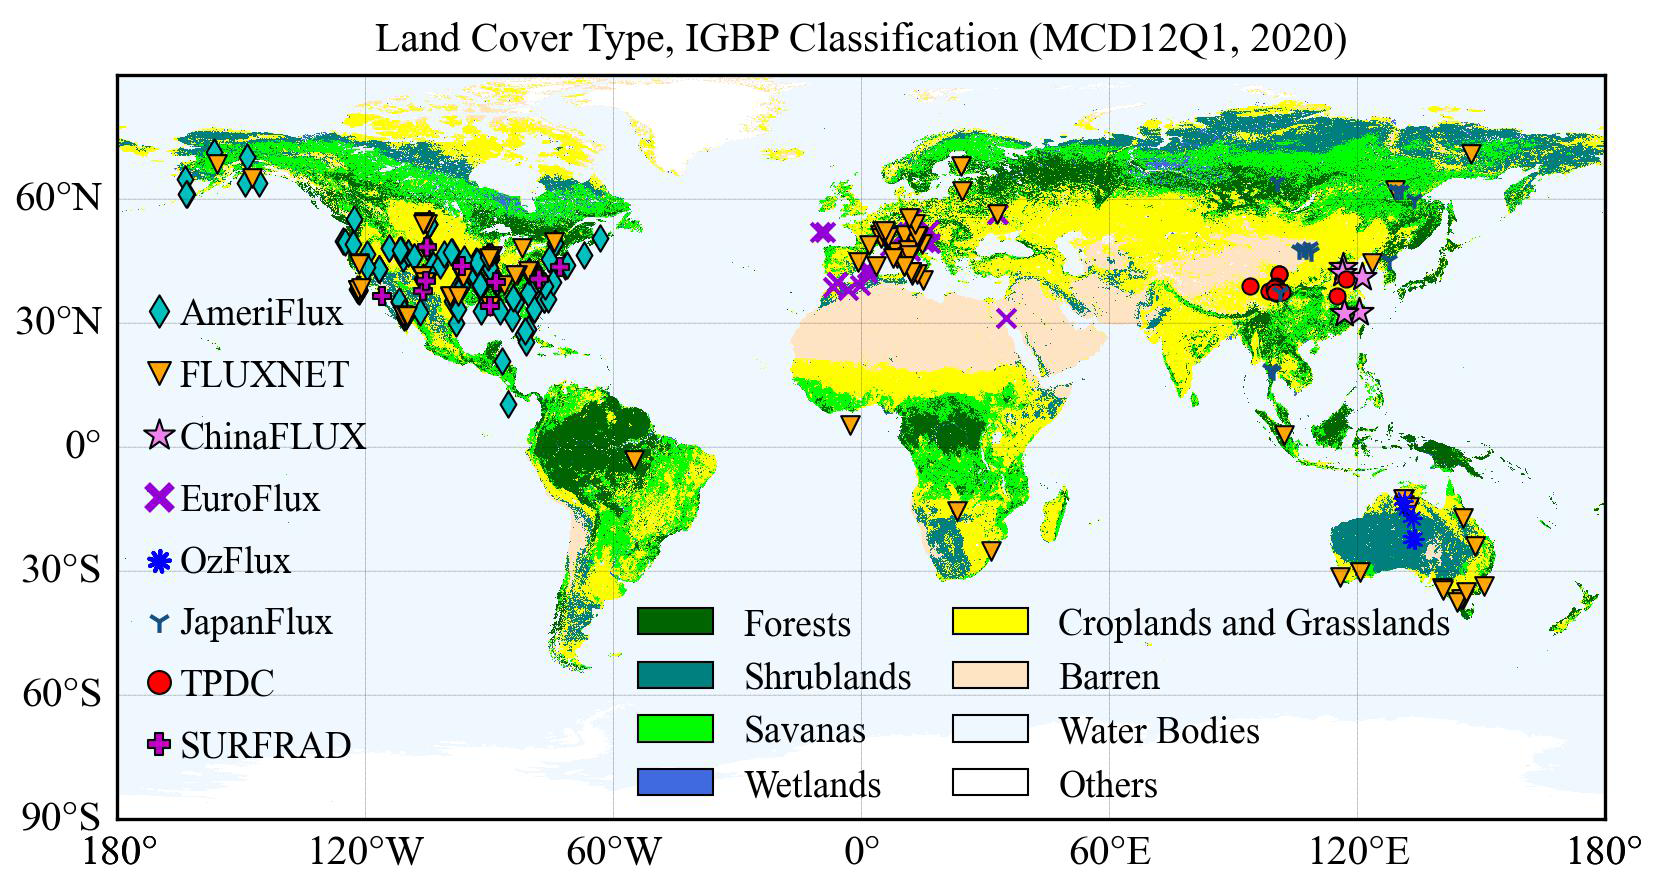
Figure 1Spatial distribution of the 302 eddy covariance sites from AmeriFlux, FLUXNET, EuroFlux, OzFlux, JapanFlux, ChinaFLUX and TPDC, and nine radiation sites from SURFRAD involved for analysis in this study.
These 302 sites used in this study cover a wide range of global climate regimes across 14 land cover types, including (1) evergreen needleleaf forests (ENF, 55 sites); (2) evergreen broadleaf forests (EBF, 12 sites); (3) deciduous needleleaf forests (DNF, 7 sites); (4) deciduous broadleaf forests (DBF, 40 sites); (5) mixed forests (MF, 8 sites); (6) closed shrublands (CSH, 5 sites); (7) open shrublands (OSH, 11 sites); (8) woody savannas (WSA, 6 sites); (9) savannas (SAV, 10 sites); (10) grasslands (GRA, 62 sites); (11) permanent wetlands (WET, 22 sites); (12) croplands (CRO, 59 sites); (13) water bodies (WAT, 1 sites); (14) cropland/natural vegetation mosaics (CVM, 4 sites). Among them, 44 sites (∼15 % of the total, see Table S1 in the Supplement) were isolated to serve as spatially independent sites to test the generated datasets and they did not participate in the development of the model/datasets.
Furthermore, ground-based radiation observations from nine sites that are located in large flat agricultural areas covered by crops and grasses from SURFRAD (https://gml.noaa.gov/, last access: 30 December 2025) were also introduced to validate land surface radiation estimates. Similar to the preprocessing performed on the observations of the 302 EC sites, the SWIN, SWOUT, LWIN, LWOUT and Rn from the SURFRAD were also quality-controlled and aggregated to daily data. Spatial distribution of the 302 EC sites and nine radiation sites from SURFRAD are shown in Fig. 1, with site details (latitude, longitude, land cover types, digital elevation model and temporal coverage) provided in Tables S1 and S2.
2.2 Climate/meteorology and remote sensing data
To generate global datasets of land surface radiation and heat fluxes from 2000 to 2020, five types of climate/meteorology and remote sensing data were used in this study, including:
-
ERA5-Land reanalysis datasets (https://cds.climate.copernicus.eu/, last access: 6 August 2024) with the spatial resolution of ∼9 km from 1950 (Muñoz-Sabater et al., 2021). Following our previous work (Wang et al., 2025), this study used variables from the ERA5-Land datasets to drive the model, including near-surface 2 m air temperature (Ta), soil temperature in layer 1 (0–7 cm, TS1), soil volumetric moisture content in layer 1 (0–7 cm, SM1), solar radiation reaching the surface of the earth (), net thermal radiation at the surface (LWnet), pressure of the atmosphere (PA), 10 m wind speed (WS), precipitation (Pr) and the 2 m dewpoint temperature, daily minimum and maximum air temperature [for calculating relative air humidity (RH)].
-
GLASS datasets (https://glass.bnu.edu.cn/, last access: 6 August 2024), which provide the 500 m 8 d leaf area index (LAI) and fractional vegetation cover (FVC) from February 2000 to December 2021.
-
MOD44B product (https://lpdaac.usgs.gov/, last access: 6 August 2024), which offers yearly 250 m percent tree cover (PTC) since 2000, representing the percentage (0 %–100 %) of a pixel covered by tree canopy.
-
NOAA/GML atmospheric carbon dioxide (CO2) concentration data, providing monthly global marine surface mean data since 1958 (ftp://aftp.cmdl.noaa.gov/products/trends/co2/co2_mm_gl.txt, last access: 6 August 2024).
-
GMTED2010 topographic data (https://topotools.cr.usgs.gov/gmted_viewer/gmted2010_global_grids.php, last access: 6 August 2024), providing 500 m digital elevation model (DEM), slope, and aspect.
The ∼9 km ERA5-Land datasets were spatially interpolated to 500 m using the cubic convolution method, and the 250 m PTC was resampled to 500 m using the arithmetic averaging method.
2.3 Mainstream datasets/products for inter-comparison
Mainstream RS-based datasets/products of moderate-resolution global land surface radiation and heat fluxes were collected for inter-comparison (Table 1), including (1) the daily 0.05° GLASS SWIN, LWIN, LWOUT and Rn products from 2000 to 2018 (https://glass.bnu.edu.cn/, last access: 6 August 2024), (2) the daily 0.05° Breathing Earth System Simulator Radiation (BESS-Rad) SWIN products from 2000 to 2020 (https://www.environment.snu.ac.kr/bess-rad, last access: 30 December 2025), (3) the daily 0.05° BESS Version2.0 (BESSV2.0) Rn and LE products from 2000 to 2020 (https://www.environment.snu.ac.kr/bessv2, last access: 30 December 2025), (4) the 8 d 0.0833° FLUXCOM Rn, LE and H products from 2001 to 2020 (https://fluxcom.org/, last access: 6 August 2024), (5) the daily 1 km ETMonitor LE product from 2000 to 2020 (https://data.casearth.cn/, last access: 6 August 2024), (6) the 8 d 500 m Penman-Monteith-Leuning Version2 (PML_V2, https://www.tpdc.ac.cn/, last access: 6 August 2024) LE product from 2000 to 2020; and (7) the 8 d 500 m MOD16A2 (https://lpdaac.usgs.gov/, last access: 6 August 2024) LE product from 2000 to 2020.
Table 1Summary of mainstream datasets/products for inter-comparison used in this study.
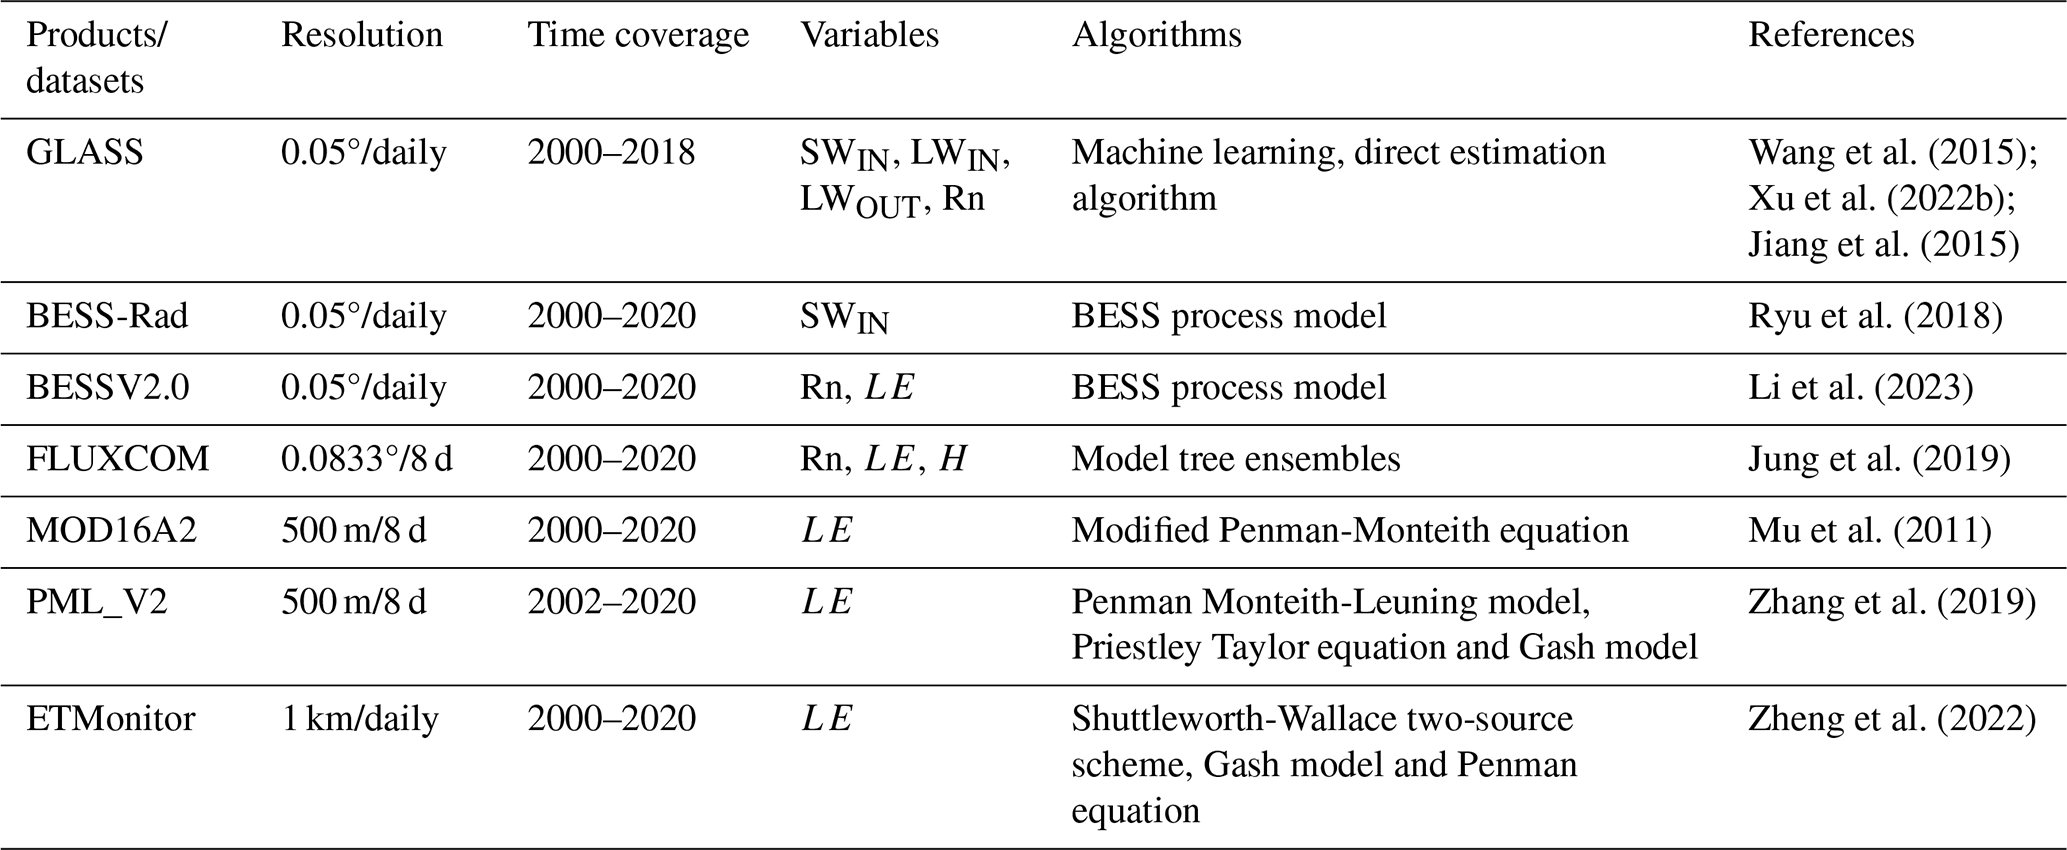
The GLASS SWIN products are derived from a combination of the GLASS broadband albedo product and the surface shortwave net radiation estimates, where the surface shortwave net radiation is estimated using linear regression with MODIS top-of-atmosphere (TOA) spectral reflectance (Wang et al., 2015). The GLASS LWIN and LWOUT products are generated using densely connected convolutional neural networks, incorporating Advanced Very High-Resolution Radiometer (AVHRR) TOA reflectance and ERA5 near-surface meteorological data (Xu et al., 2022b). The GLASS Rn products are estimated from the meteorological variables from MERRA2 and surface variables from GLASS using the multivariate adaptive regression splines model (Jiang et al., 2015). The BESS-Rad and BESSV2.0 estimate SWIN and Rn using a radiative transfer model (i.e., Forest Light Environmental Simulator, FLiES) with an artificial neural network based on MODIS and MERRA2 reanalysis datasets, and using FLiES based on MODIS products and NCEP/NCAR reanalysis data, respectively (Li et al., 2023; Ryu et al., 2018). Moreover, the BESSV2.0 (Li et al., 2023), MOD16A2 (Mu et al., 2011), PML_V2 (Zhang et al., 2019) and ETMonitor (Zheng et al., 2022) generated global LE by physical models, such as Penman-Monteith equation, Priestley-Taylor equation and/or Shuttleworth-Wallace two-source scheme. The FLUXCOM Rn, LE and H datasets are obtained through multiple machine learning methods based on in situ observations from FLUXNET and remote sensing and meteorological data (Jung et al., 2019). For better consistency, RF-based 8 d 0.0833° Rn and Bowen ratio-corrected LE and H for the periods of 2000 to 2020 from the FLUXCOM were used in this study.
The method used to generate global datasets of land surface radiation and heat fluxes is based on the CoSEB model/framework, which was developed by our previously published work (Wang et al., 2025), to coordinately estimate global land surface energy balance components (including Rn, LE, H and G) using the multivariate random forest technique, with a combination of MODIS and GLASS products, ERA5-Land reanalysis datasets, and in situ observations at 336 EC sites. The CoSEB model was demonstrated to be able to produce high-accuracy estimates of land surface energy components, with the RMSE of <17 W m−2 and R2 of >0.83 for estimating 4 d Rn, LE and H, and the RMSE of <5 W m−2 and R2 of 0.55 for estimating 4 d G. The most praiseworthy superiority of the CoSEB model lies in its ability to balance the land surface energy components, with an energy imbalance ratio [EIR, defined as ] of 0.
To coordinately estimate land surface radiation and heat fluxes that comply with both radiation balance and heat balance, one of the key procedures in the construction of the CoSEB model was to prepare training datasets that satisfy surface radiation and heat balance. For this purpose, the energy-imbalance corrections on daily in situ observed LE and H were conducted by the most widely applied Bowen ratio method [, , where Hcorr and LEcorr represent the sensible heat flux and latent heat flux after energy-imbalance correction, respectively] with the aid of Rn and G observations, and the in situ Rn was calculated from the sum of in situ observed net longwave radiation (LWIN minus LWOUT) and net shortwave radiation (SWIN minus SWOUT). The input variables to renew the CoSEB model include: (1) climate/meteorology: Ta, , LWnet, WS, PA, Pr, RH, CO2 concentration; (2) vegetation and soil: LAI, FVC, PTC, TS1, SM1; (3) topography data: DEM, Slope and Aspect, in addition to longitude (Lon), latitude (Lat), and inverse relative distance from the Earth to the Sun (dr), in which the dr was calculated as , where DOY represents the day of year. Considering that the footprint of the site-based measurements of turbulent heat fluxes is generally at a scale of hundreds of meters, to reduce the effect of differences of spatial scales between ground-based measurements (dependent variables) and remotely sensed/reanalysis datasets (independent variables), we renewed the CoSEB model at a spatial scale of 500 m for coordinately estimating global daily land surface radiation and heat fluxes, which can be expressed as follows:
To enhance model generalization, the renewed CoSEB model was reoptimized using random and grid search methods, resulting in different hyperparameters of 281 decision trees, a maximum depth of 21, and minimum samples split and leaf of 8 from those of Wang et al. (2025). Site-based 10-fold cross-validation was employed to evaluate the transferability and generalization of the CoSEB model by randomly dividing all sites into ten folds, where the samples from each fold of sites in turn served as validation datasets while the remaining folds were used as training datasets, ensuring that the validation was conducted on sites spatially independent from the training data. Furthermore, to benchmark the coordinated estimates from the renewed CoSEB model, eight RF-based uncoordinated models were constructed, each separately estimating one of SWIN, SWOUT, LWIN, LWOUT, Rn, LE, H or G using the same inputs as those in the renewed CoSEB model. Figure 2 illustrates the flowchart for generating global datasets of land surface radiation and heat fluxes by the CoSEB model.
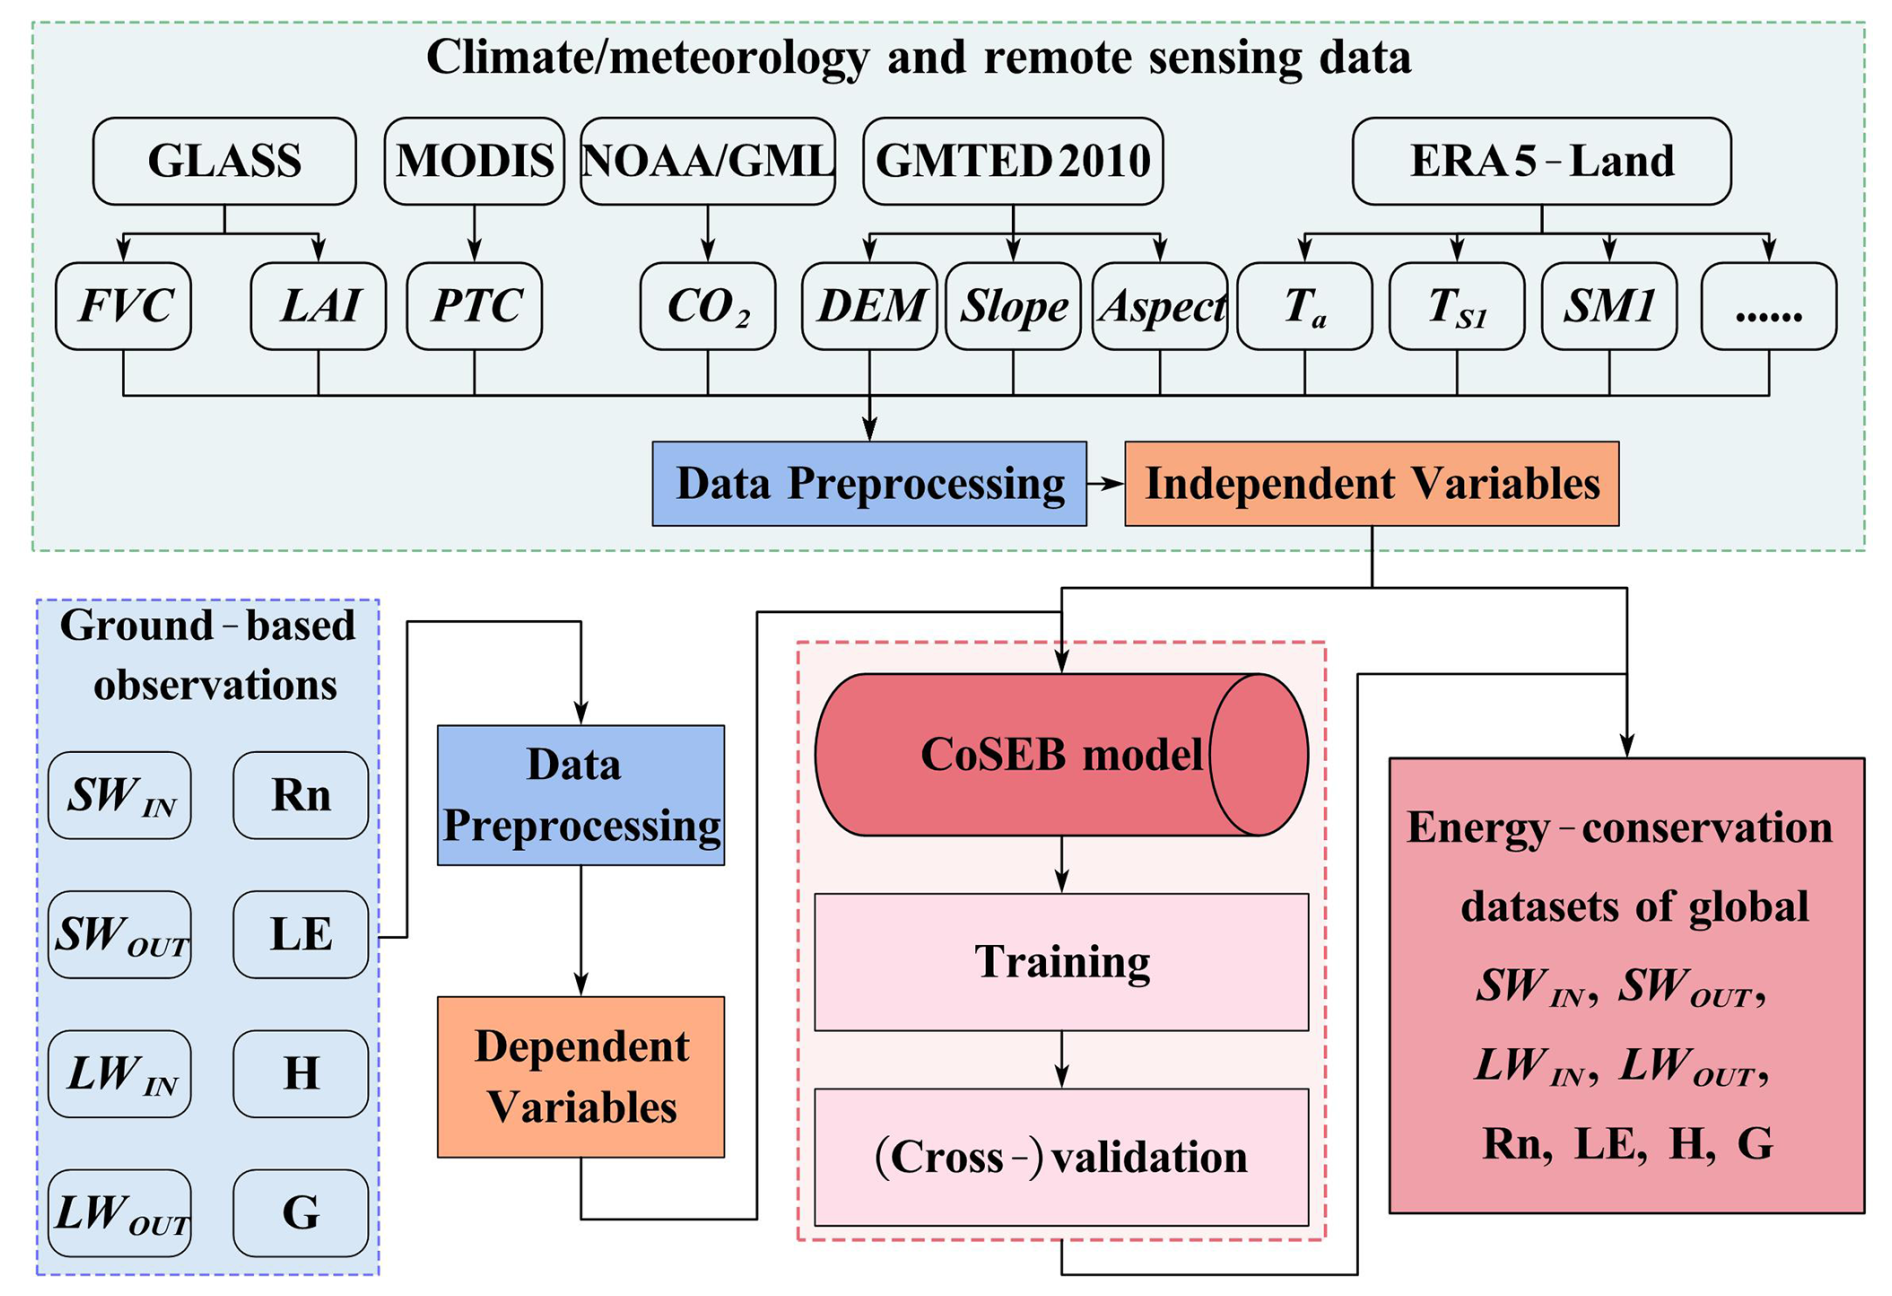
Figure 2Flowchart for generating energy-conservation datasets of global land surface radiation [including downward shortwave radiation (SWIN), downward longwave radiation (LWIN), upward shortwave radiation (SWOUT), upward longwave radiation (LWOUT) and net radiation (Rn)] and heat fluxes [including latent heat flux (LE), soil heat flux (G) and sensible heat flux (H)] by the CoSEB model renewed from in situ observations at 258 sites worldwide and collocated remote sensing and reanalysis datasets.
4.1 Validation of the CoSEB model
4.1.1 Site-based 10-fold cross-validations at 258 EC sites
Figures 3 and 4 present the scatter density plots of the site-based 10-fold cross-validation of daily SWIN, LWIN, SWOUT, LWOUT, Rn, LE, H and G estimated from the renewed CoSEB model and the RF-based uncoordinated models, respectively, by using the validation datasets collected at 258 EC sites worldwide. Results indicated that the estimates from both the CoSEB model and the RF-based uncoordinated models agreed well with the in situ observations, with the coefficient of determination (R2) varying between 0.80 and 0.95 for SWIN, LWIN, LWOUT and Rn, and between 0.59 and 0.67 for SWOUT, LE and H. The CoSEB model, with the root mean square error (RMSE) of 26.82 to 34.25 W m−2 and mean absolute error (MAE) of 18.83 to 24.49 W m−2 for SWIN, Rn, LE and H, the RMSE of 12.24 to 17.75 W m−2 and the MAE of 8.39 to 13.70 W m−2 for SWOUT, LWIN and LWOUT, demonstrated comparable accuracies to the RF-based models, with the RMSE of 27.07 to 33.34 W m−2 and MAE of 19.29 to 23.64 W m−2 for SWIN, Rn, LE and H, the RMSE of 12.12 to 16.93 W m−2 and the MAE of 8.68 to 12.99 W m−2 for SWOUT, LWIN and LWOUT. In the validation of daily G, both the CoSEB and RF-based models yielded RMSEs below 7 W m−2. Comparisons with the corresponding training results (Table S3) indicated that although the CoSEB model performed better on the training datasets, its overall performance remained stable, suggesting that the CoSEB model was not affected by overfitting.
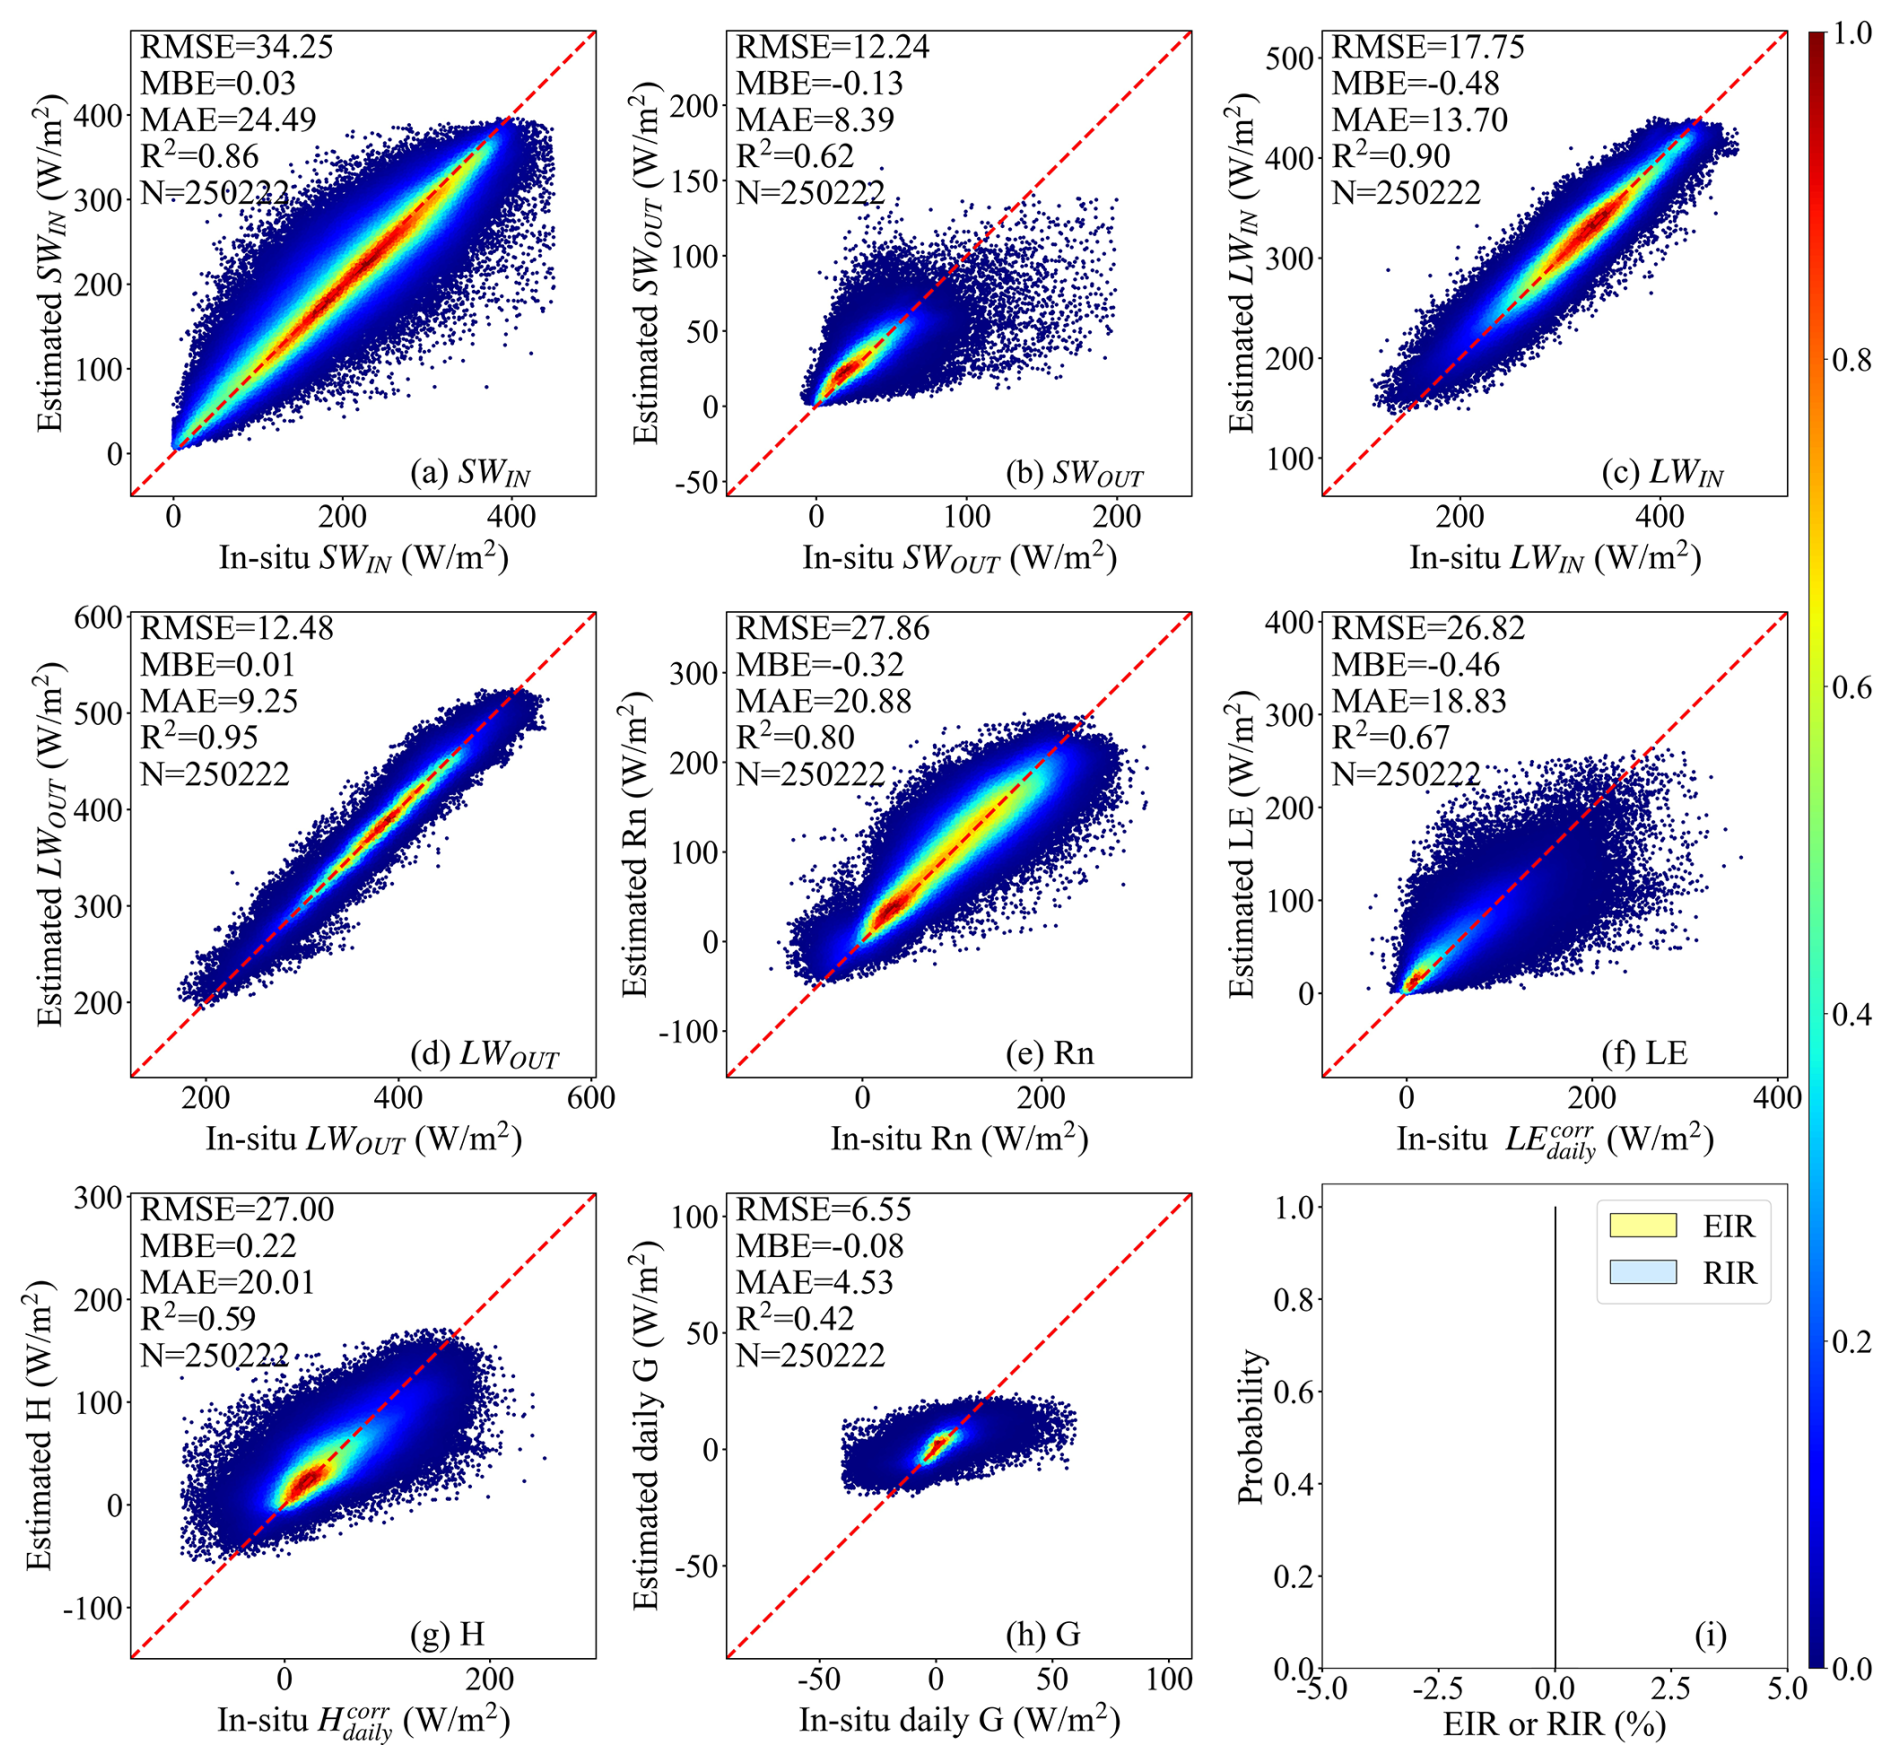
Figure 3Scatter density plots of the site-based 10-fold cross-validation of daily downward shortwave and longwave radiation (SWIN and LWIN), upward shortwave and longwave radiation (SWOUT and LWOUT), net radiation (Rn), soil heat flux (G), latent heat flux (LE) and sensible heat flux (H) derived by the CoSEB model against in situ observed SWIN, LWIN, SWOUT, LWOUT, Rn, G, and energy imbalance-corrected LE () and H (). The EIR and RIR in the subfigure (i) represent the energy imbalance ratio and radiation imbalance ratio, which are defined as and , respectively. The colorbar represents the normalized density of data points.
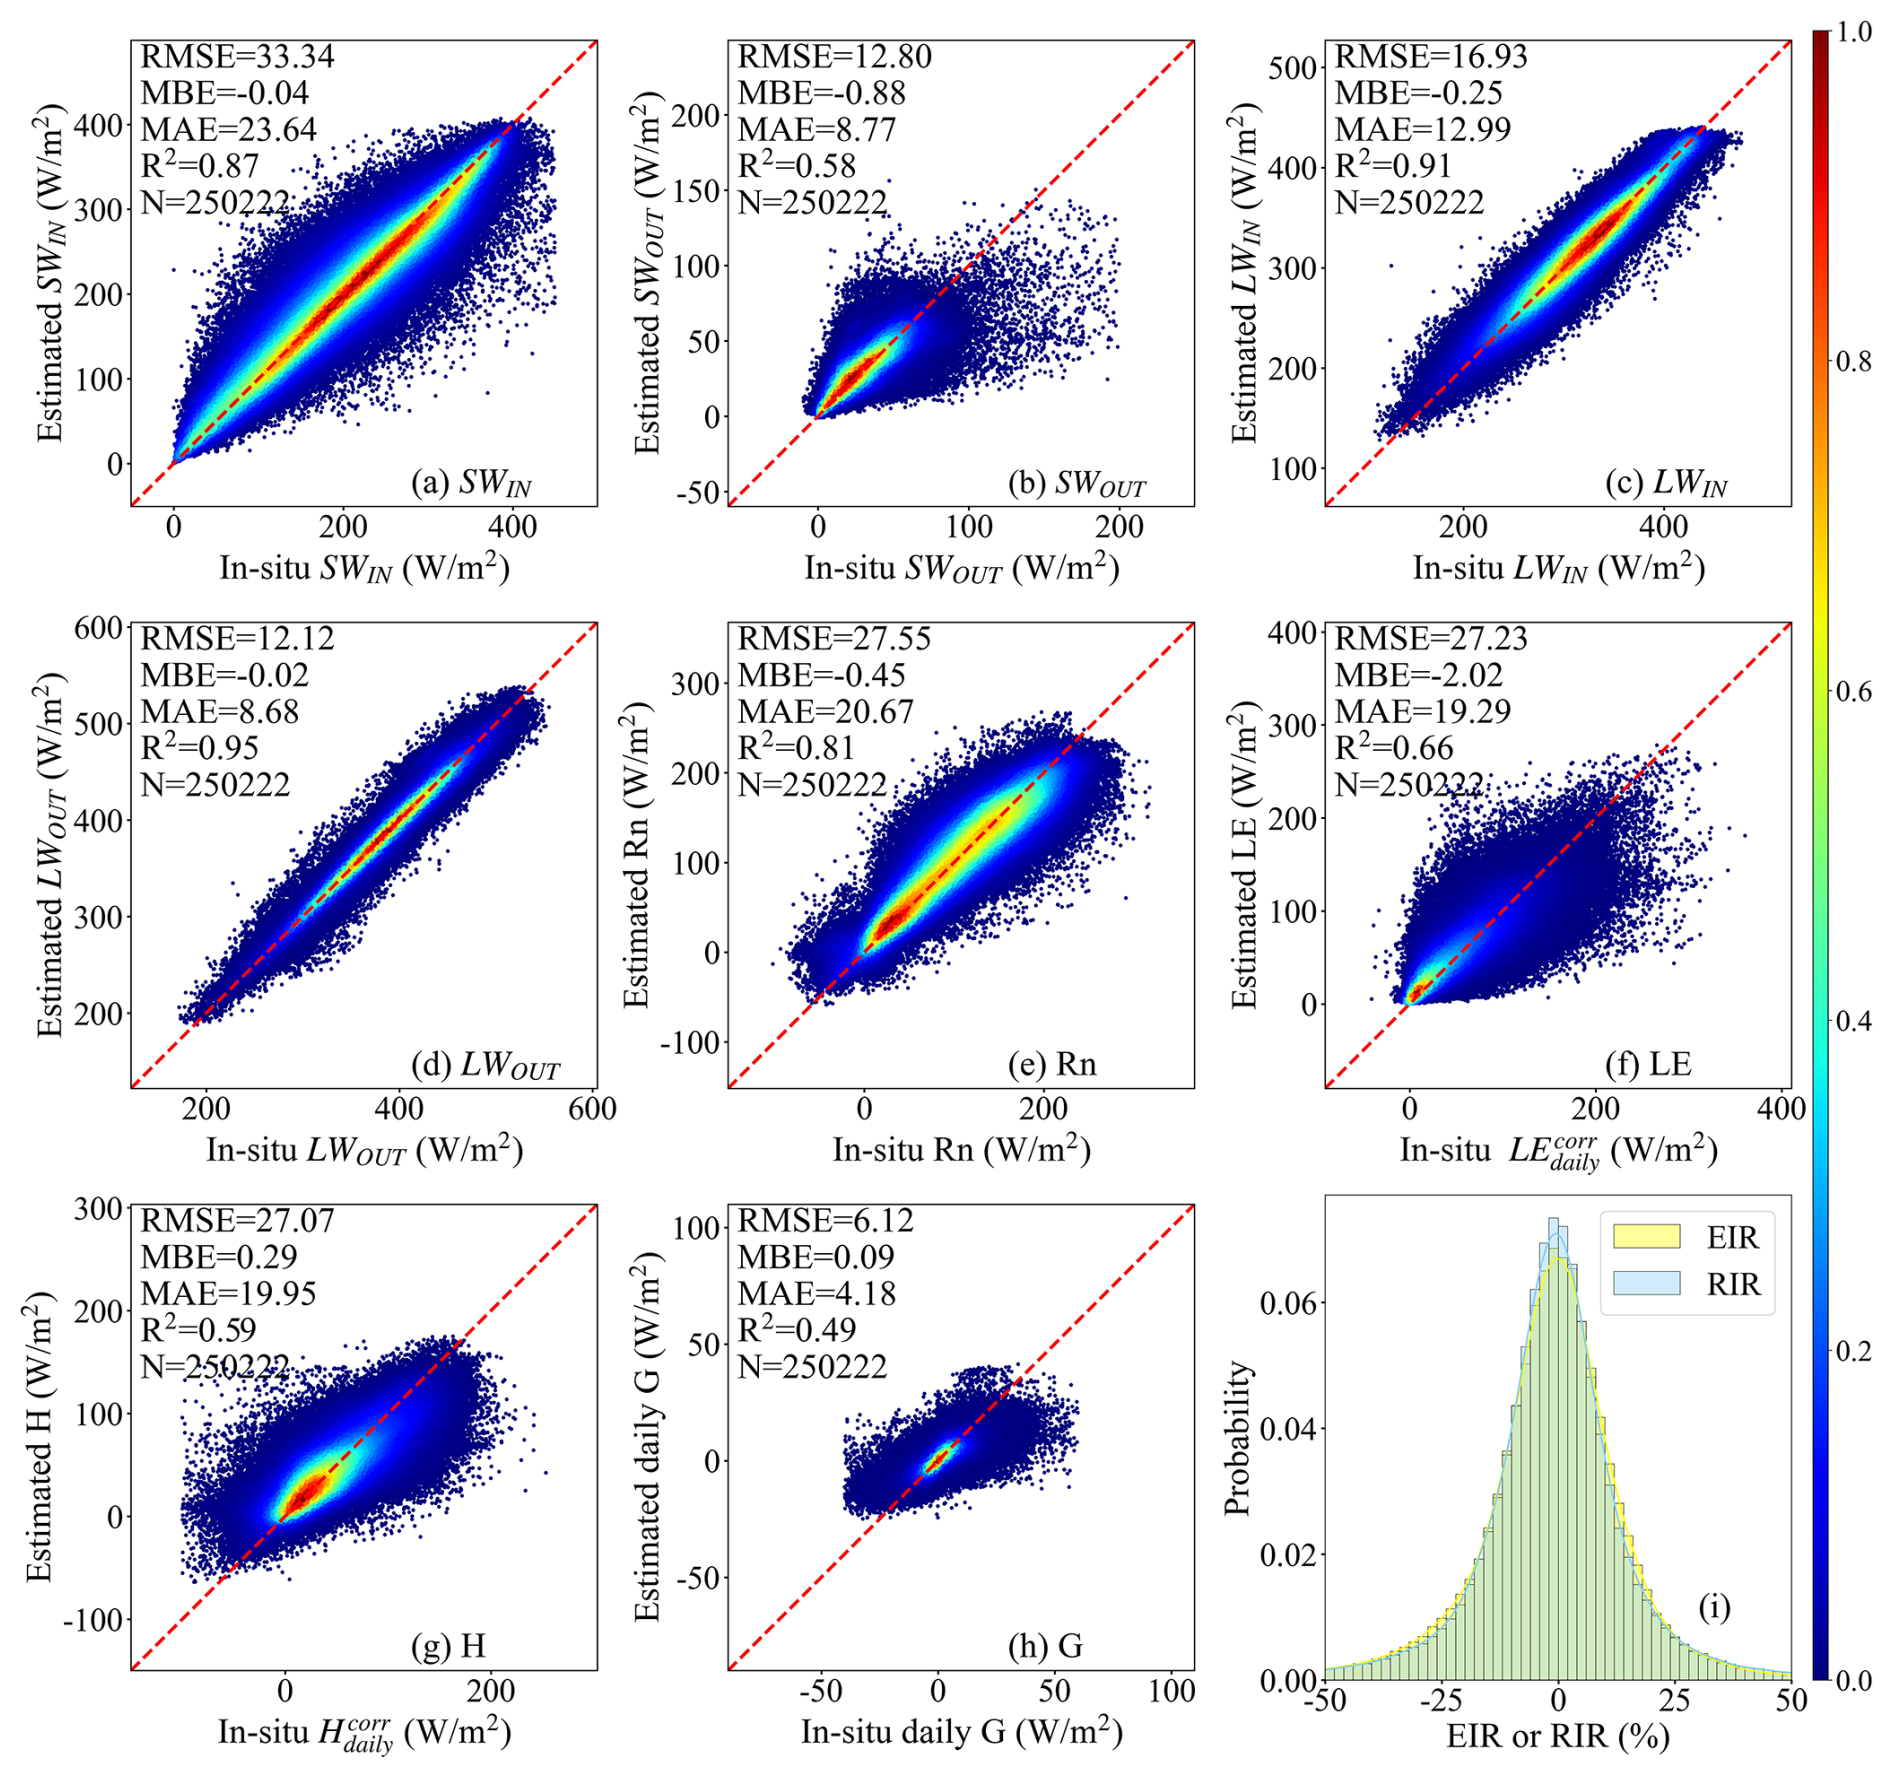
Strikingly, the CoSEB model exhibited large superiority in balancing the surface radiation and heat fluxes, with the radiation imbalance ratio [RIR, defined as ] and energy imbalance ratio [EIR, defined as ] of 0, while the RF-based uncoordinated models showed substantial imbalances of the surface radiation and heat fluxes, with RIR and EIR that were approximately normally distributed, having absolute mean values of 38.84 % and 31.22 %, respectively, and reaching as high as 50 % in some cases. Furthermore, the RIR as well as EIR tended to be higher under lower solar radiation, air temperature, or FVC, with more frequent low values of these three variables leading to a broader and less peaked distribution of RIR and EIR (see Fig. S1).
4.1.2 Validation at nine radiation sites from SURFRAD
To further illustrate the generality and transferability of the renewed CoSEB model, the validation of estimates of the five radiation components (including SWIN, SWOUT, LWIN, LWOUT, Rn) derived from both the CoSEB model and RF-based uncoordinated models against observations at nine radiation sites from SURFRAD was performed, as shown in Fig. 5. The results showed that both the CoSEB model and the RF-based models achieved high accuracy in estimating daily SWIN, SWOUT, LWIN, LWOUT and Rn, with the RMSE of ∼30 W m−2 for SWIN, ∼14 W m−2 for SWOUT and LWIN, ∼12 W m−2 for LWOUT and ∼24 W m−2 for Rn, with the R2>0.9 for SWIN, LWIN and LWOUT, ∼0.65 for SWOUT and ∼0.85 for Rn. Compared to the results of the site-based 10-fold cross-validation at 258 EC sites, the performances at nine radiation sites showed slight improvements, with the RMSE decreasing by 0.74 to 4.54 W m−2 for SWIN, LWIN, LWOUT and Rn in the CoSEB model, but a slight degradation with the RMSE increasing by ∼1.05 W m−2 for SWOUT, suggesting the robust performance of the CoSEB model. Furthermore, the CoSEB model demonstrated a large superiority in maintaining surface radiation balance among the five radiation components, with the RIR of 0, in contrast to the RF-based models, which failed to meet this balance, exhibiting significant RIR exceeding 50 %.
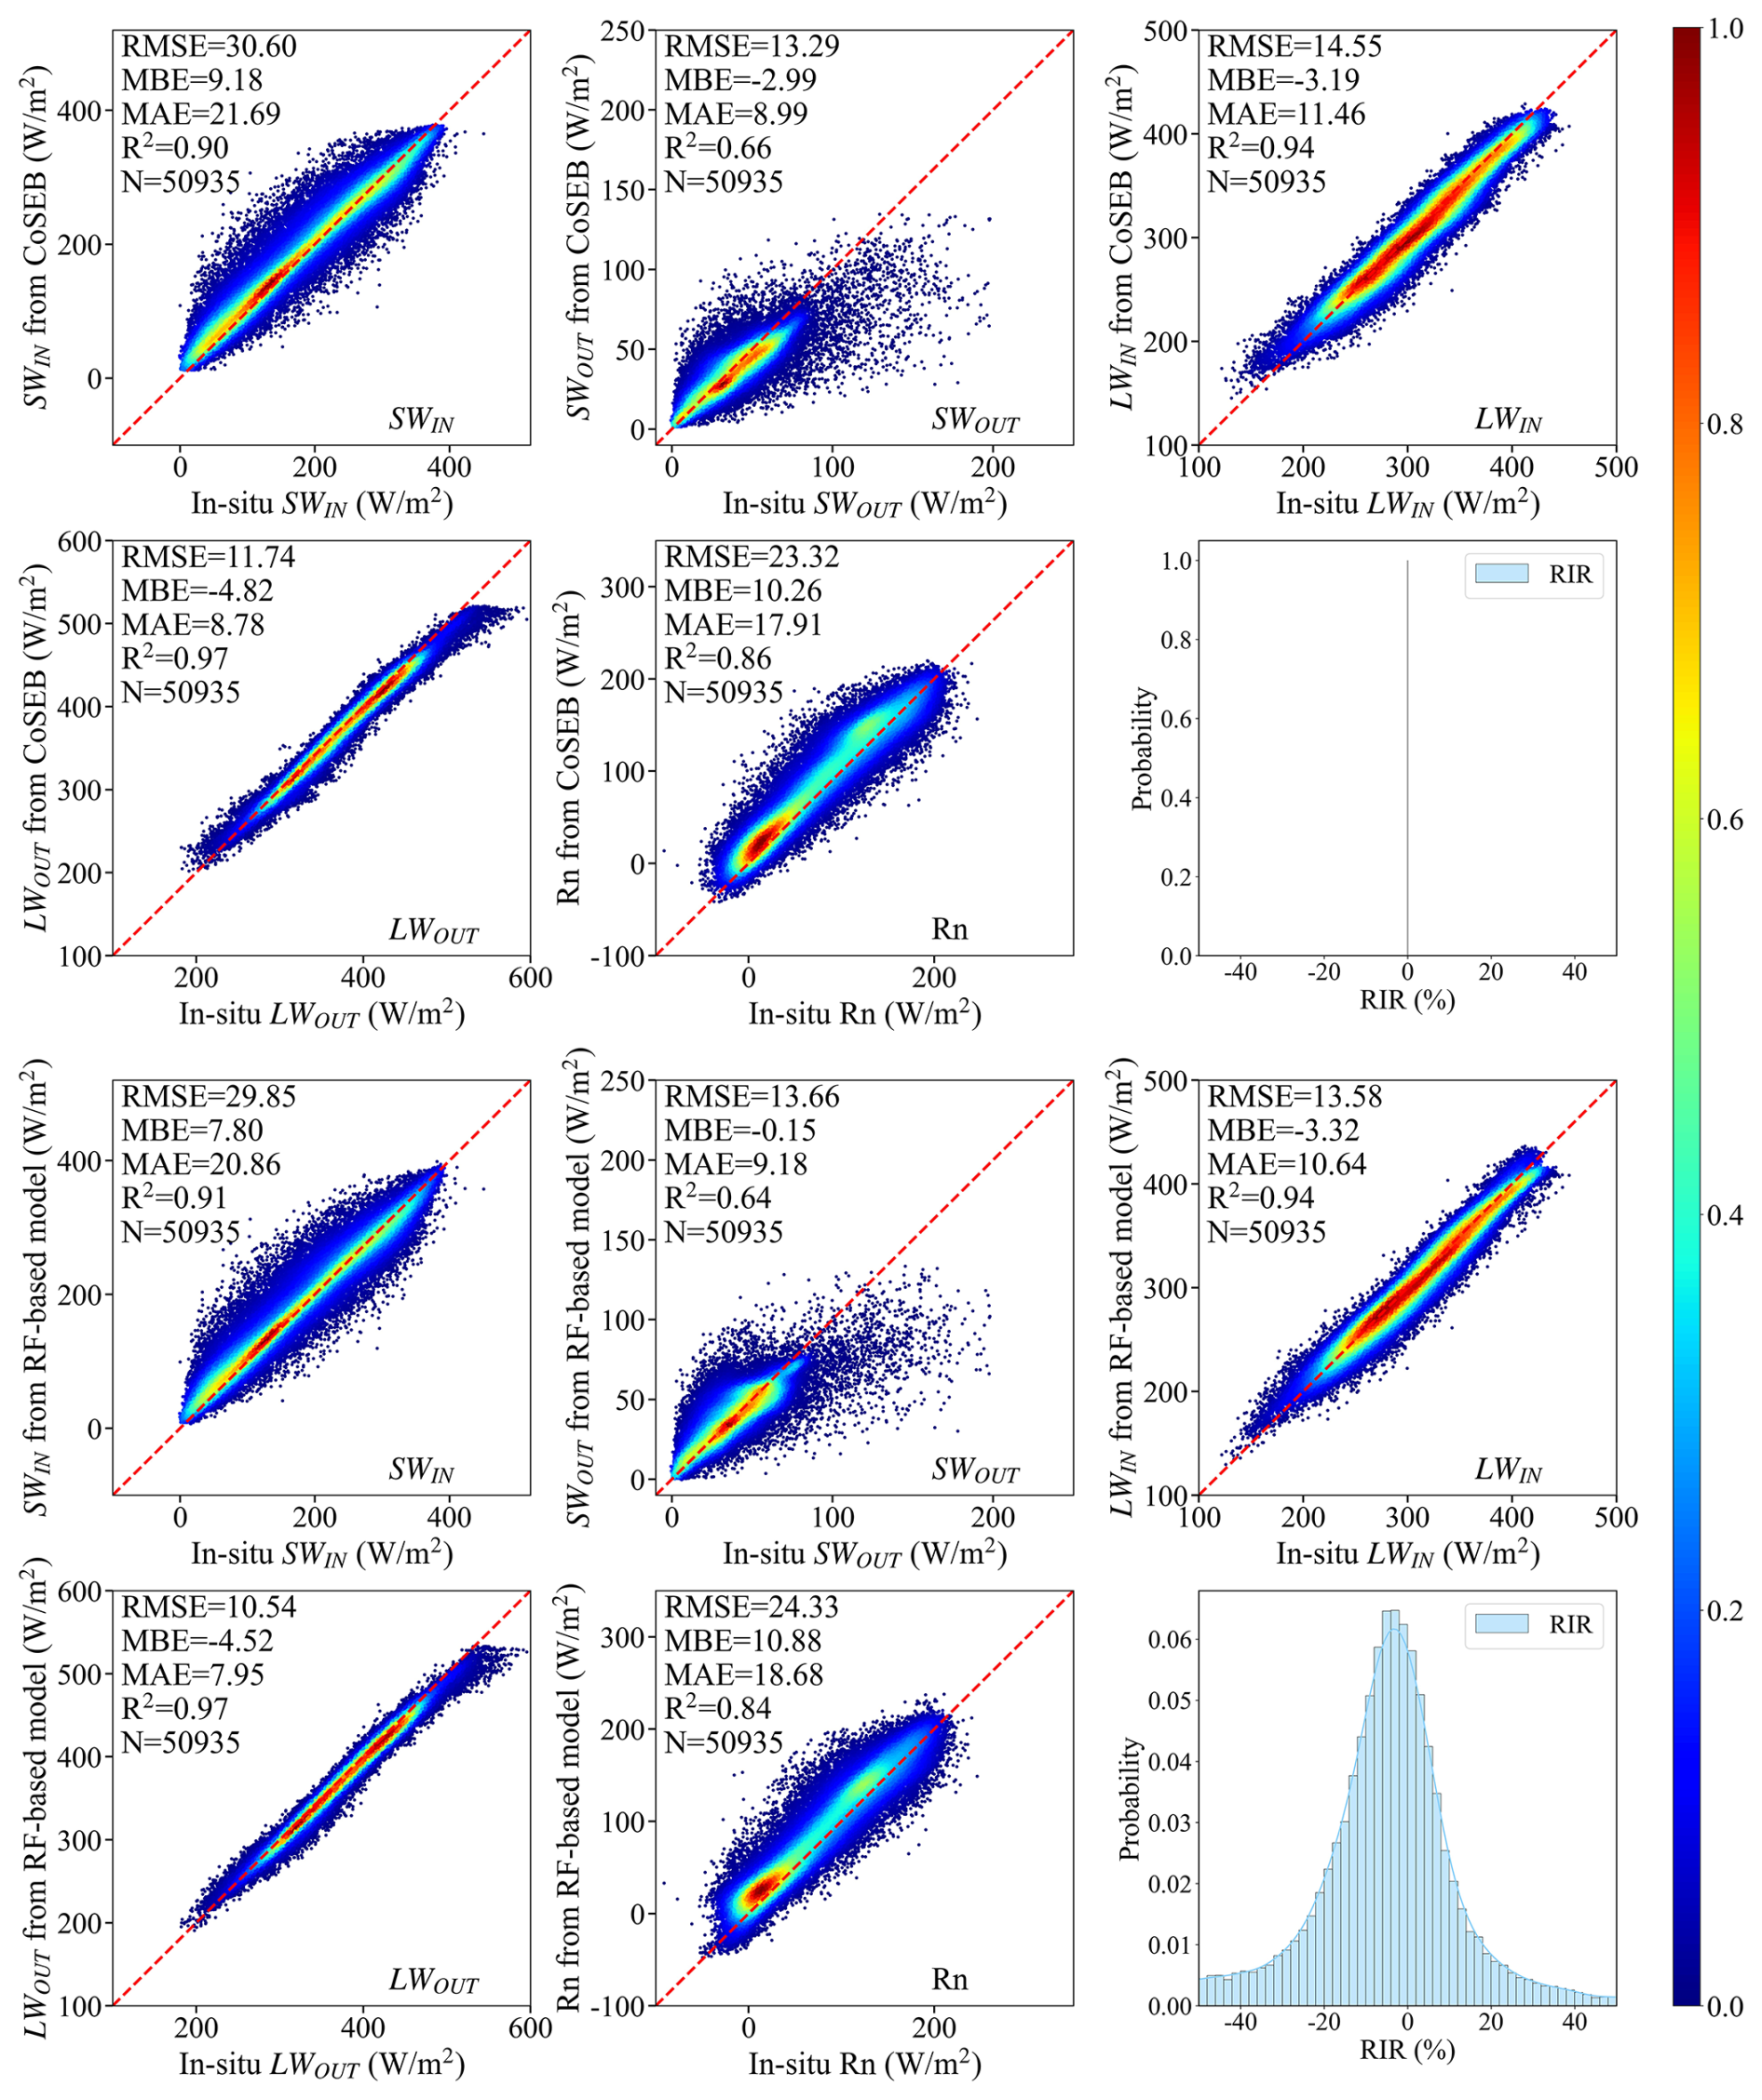
Figure 5Scatter density plots of the validation of daily downward shortwave and longwave radiation (SWIN and LWIN), upward shortwave and longwave radiation (SWOUT and LWOUT) and net radiation (Rn) from the renewed CoSEB model (upper two rows) and RF-based uncoordinated models (lower two rows) against in situ observations at nine radiation sites from SURFRAD. The RIR represents the radiation imbalance ratio, defined as . The colorbar represents the normalized density of data points.
4.2 Validation and inter-comparisons of the CoSEB-based datasets
As demonstrated in Sect. 4.1, the renewed CoSEB model with a spatial scale of 500 m achieved comparable accuracies to the RF-based uncoordinated models but outperformed them in balancing surface radiation and heat fluxes. Evidenced by the validation for its superiority, the renewed CoSEB model was then applied to the spatially aggregated input datasets to generate our developed global daily datasets with a spatial resolution of 0.05°. To further assess the performance of the developed CoSEB-based datasets, in situ observations from another 44 spatially independent test sites (see Sect. 2.1), which were not involved in model construction and datasets generation, were used for validation. Mainstream products (i.e. GLASS, BESS-Rad, BESSV2.0, FLUXCOM, PML_V2, MOD16A2 and ETMonitor) were also involved for inter-comparison at the 44 test sites.
Note that due to the lack of moderate-resolution global RS-based products/datasets of daily and/or 8 d SWOUT, H and G, the intercomparison between different products/datasets was impossible. Instead, we conducted a validation of these components from the CoSEB-based datasets against in situ observations at 44 test sites, as shown in Figs. S2 and S3. Results indicated that the CoSEB-based datasets could provide good estimates of SWOUT, H and G, with the RMSEs (R2) of 14.20 W m−2 (0.42), 29.75 W m−2 (0.44) and 5.69 W m−2 (0.44) at daily scale, respectively, and the RMSE (R2) of 12.19 W m−2 (0.39) and 4.60 W m−2 (0.47) for 8 d SWOUT and G, respectively.
Figures 6 and 7 present the comparison of daily SWIN, LWIN and LWOUT, as well as Rn and LE from the CoSEB-based datasets and mainstream products/datasets (including GLASS, BESS-Rad, BESSV2.0 and ETMonitor), with in situ observations at 44 test sites, respectively. Overall, the estimates from the CoSEB-based datasets exhibited a closer agreement with in situ observations than those from mainstream products/datasets, where the CoSEB-based datasets reduced the RMSE by 0.01 to 4.58 W m−2 and increased the R2 by 0.01 to 0.09 compared to mainstream products. Specifically, the RMSE for the SWIN, LWIN, and LWOUT increased from 37.52, 22.47 and 13.78 W m−2 in the CoSEB-based datasets to 37.53, 23.37 and 16.46 W m−2 in the GLASS, respectively, and for SWIN from 37.52 W m−2 in the CoSEB-based datasets to 40.87 W m−2 in the BESS-Rad. Likewise, the RMSEs for daily Rn and LE were 29.66 and 30.87 W m−2 in the CoSEB-based datasets, which were lower than those of 34.24 and 34.36 W m−2 in BESSV2.0, respectively, as well as those of 30.60 W m−2 for Rn in GLASS and 33.62 W m−2 for LE in ETMonitor.
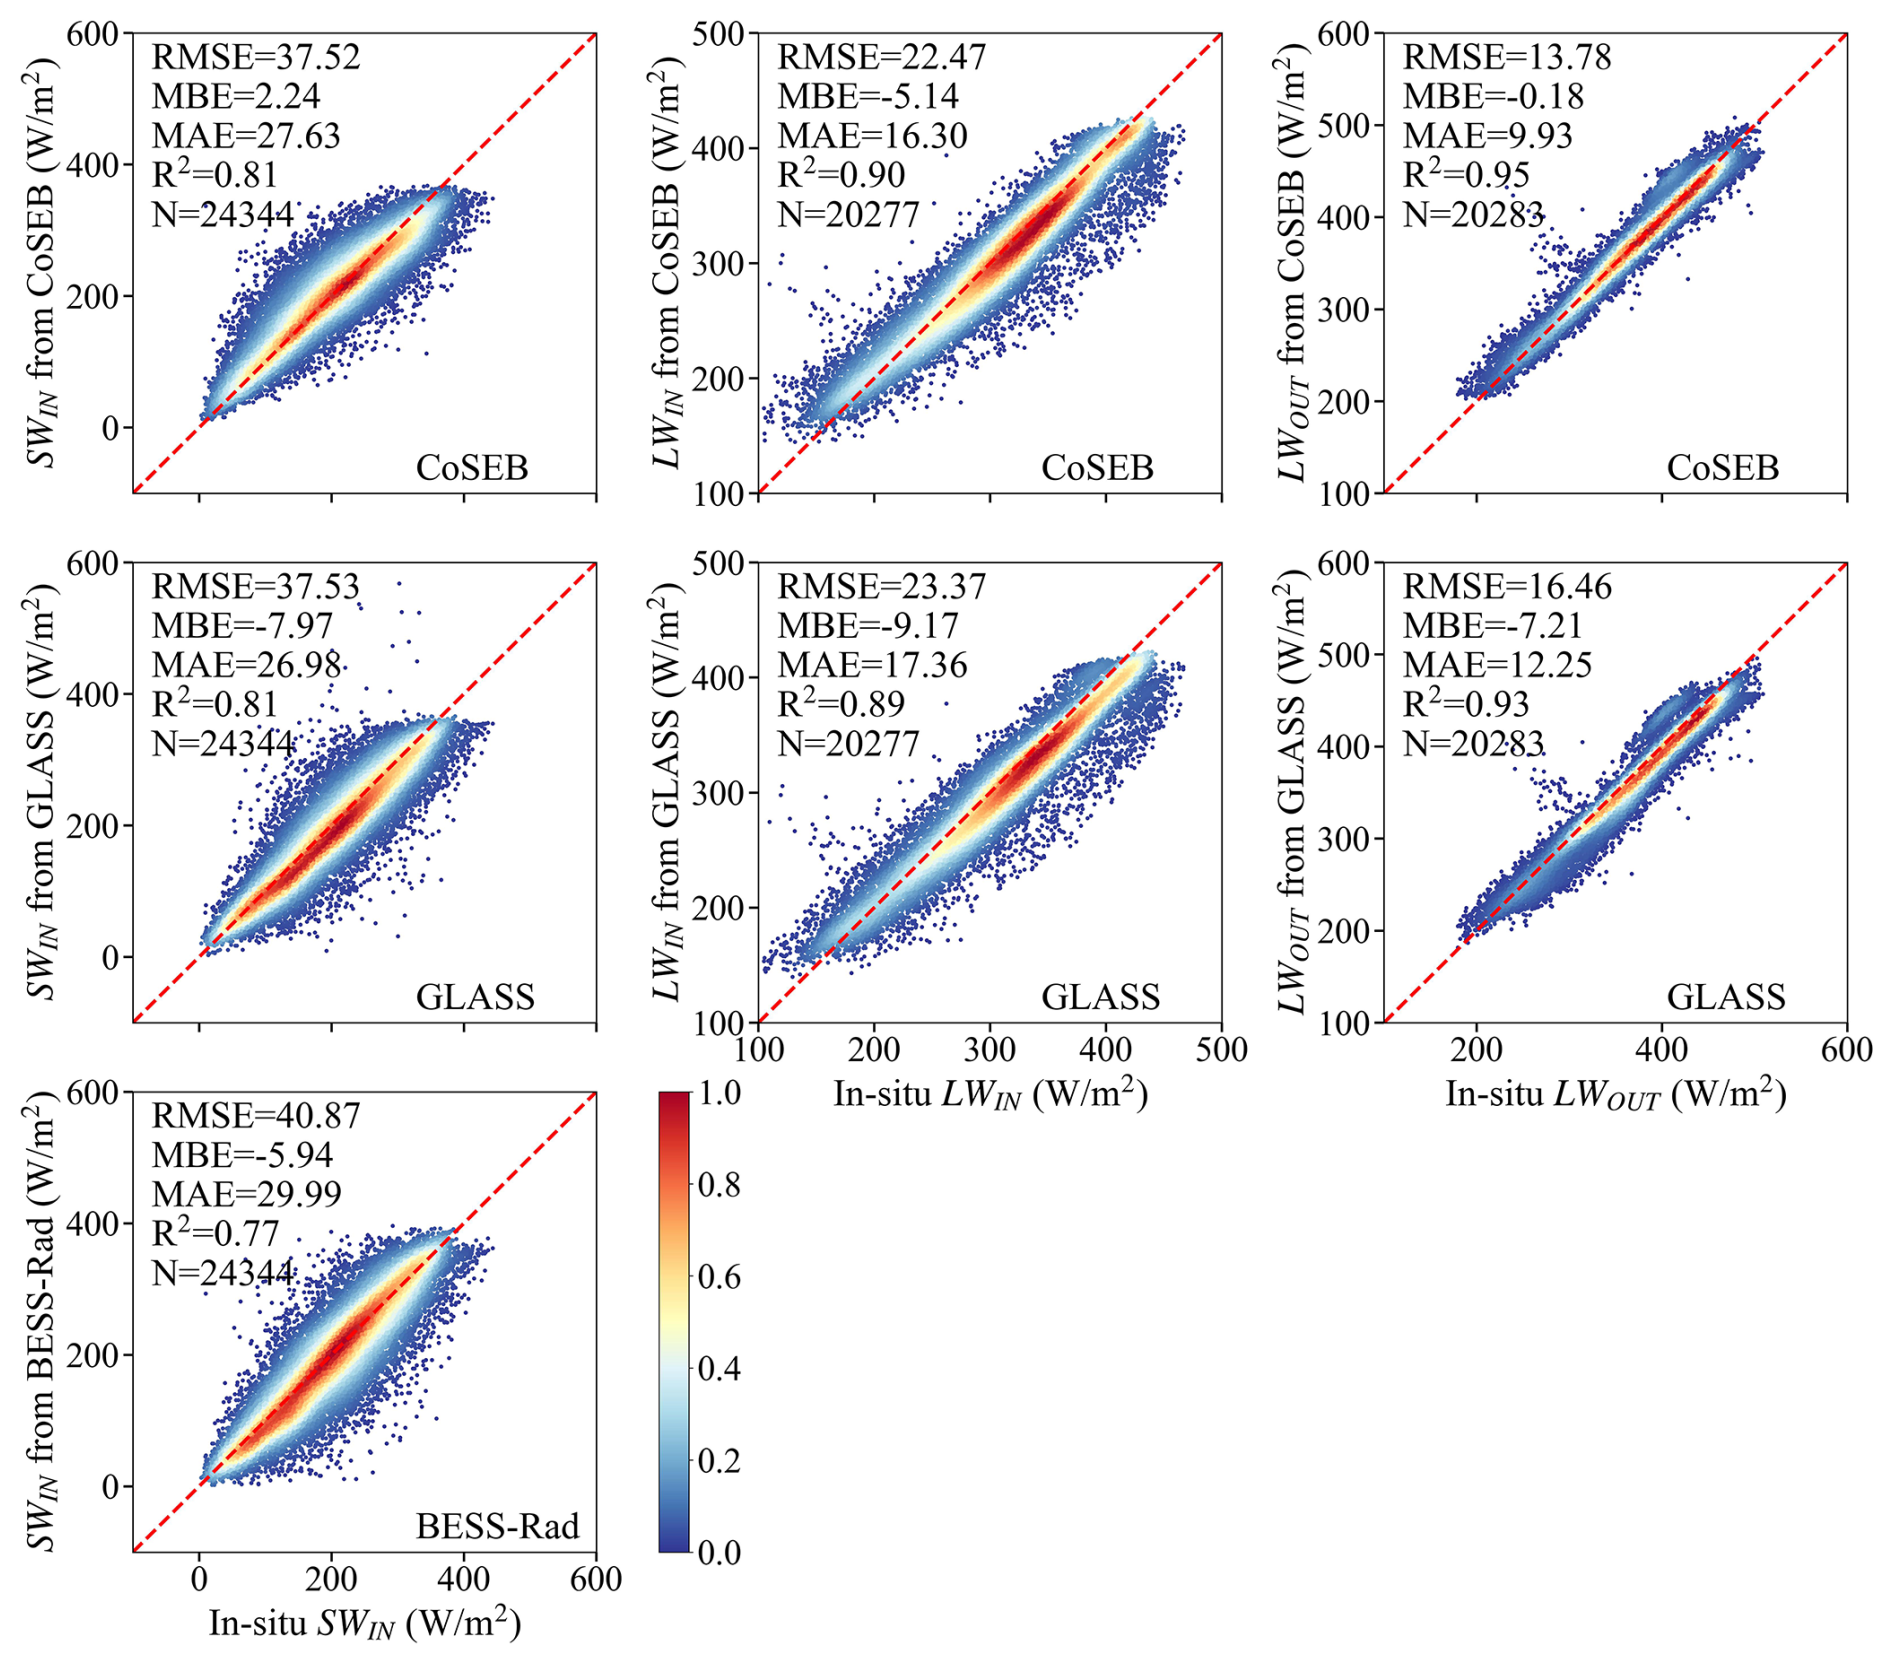
Figure 6Comparison of the daily downward shortwave radiation (SWIN, the first column), downward longwave radiation (LWIN, the second column) and upward longwave radiation (LWOUT, the third column) from the CoSEB-based datasets, GLASS and BESS-Rad with the in situ observed SWIN, LWIN and LWOUT at 44 test sites. The colorbar represents the normalized density of data points.
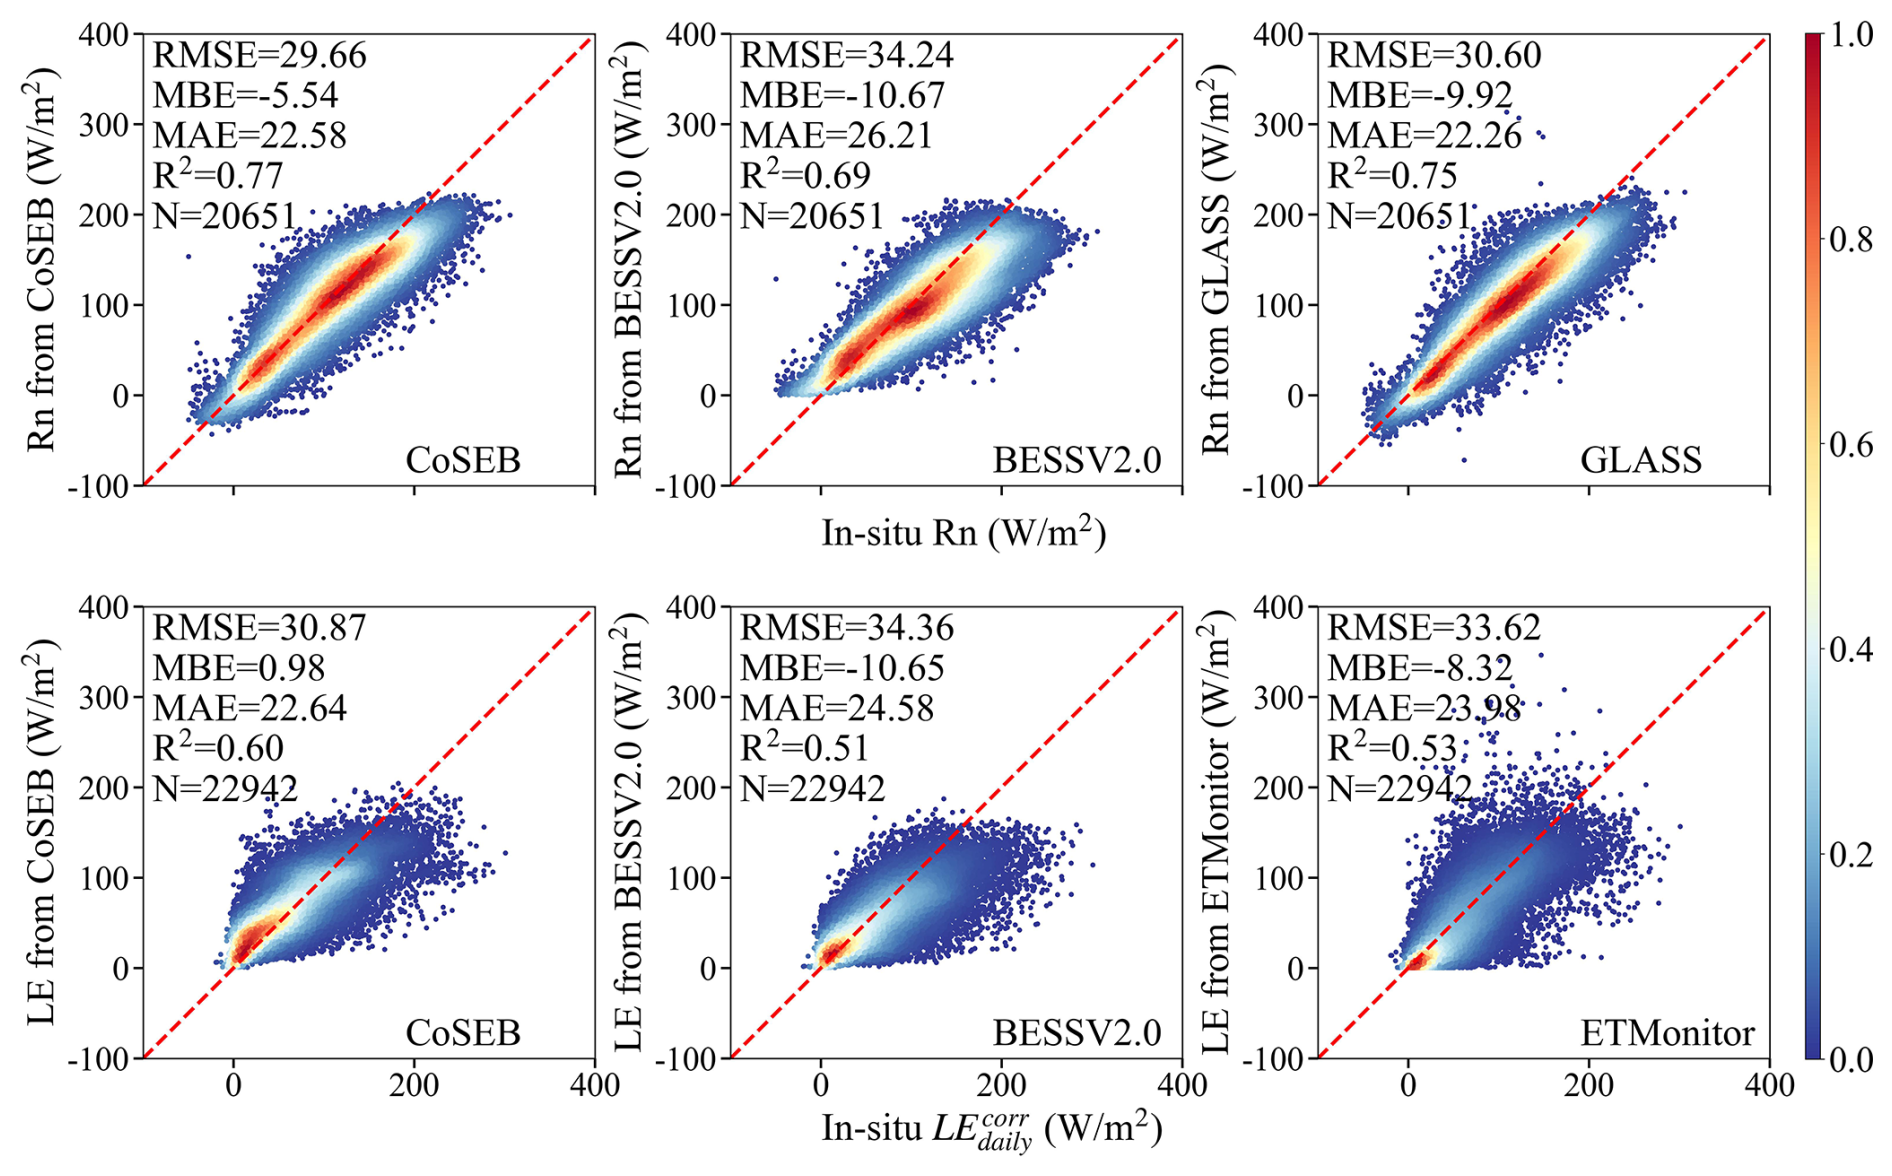
Figure 7Comparison of the daily net radiation (Rn, the upper row) and latent heat flux (LE, the lower row) from the CoSEB-based datasets, BESSV2.0, GLASS and ETMonitor with the in situ observed Rn, and energy imbalance-corrected LE () at 44 test sites. The colorbar represents the normalized density of data points.
Figures 8–10 compare the 8 d SWIN, LWIN and LWOUT, Rn and LE, as well as H from the CoSEB-based datasets and mainstream products, with in situ observations at 44 test sites, respectively. Overall, the CoSEB-based datasets outperformed the mainstream products/datasets for all surface radiation and heat fluxes, where the CoSEB-based datasets reduced the RMSE by 0.24 to 10.48 W m−2 and increased the R2 by 0.01 to 0.38 compared to mainstream products. Specifically, for SWIN, LWIN and LWOUT, the RMSE increased from 18.54, 18.50 and 9.41 W m−2 in the CoSEB-based datasets to 21.35, 20.39 and 14.48 W m−2 in the GLASS, respectively, and for SWIN from 18.54 W m−2 in the CoSEB-based datasets to 18.78 W m−2 in the BESS-Rad. For Rn, the RMSE increased from 19.12 W m−2 in the CoSEB-based datasets to ∼23 W m−2 in the FLUXCOM and GLASS and to >27 W m−2 in the BESSV2.0, while the R2 decreased from 0.82 in the CoSEB-based datasets to 0.75 in the FLUXCOM and GLASS and to 0.62 in the BESSV2.0. Likewise, for LE, the RMSE increased from 22.31 W m−2 in the CoSEB-based datasets to ∼25 W m−2 in the FLUXCOM, PML_V2, BESSV2.0 and ETMonitor, and to >32 W m−2 in MOD16A2, while the R2 decreased from 0.67 in the CoSEB-based datasets to ∼0.60 in the FLUXCOM, PML_V2, BESSV2.0 and ETMonitor, and to <0.3 in the MOD16A1. For H, the RMSE increased from 21.63 W m−2 in the CoSEB-based datasets to 22.64 W m−2 in the FLUXCOM.
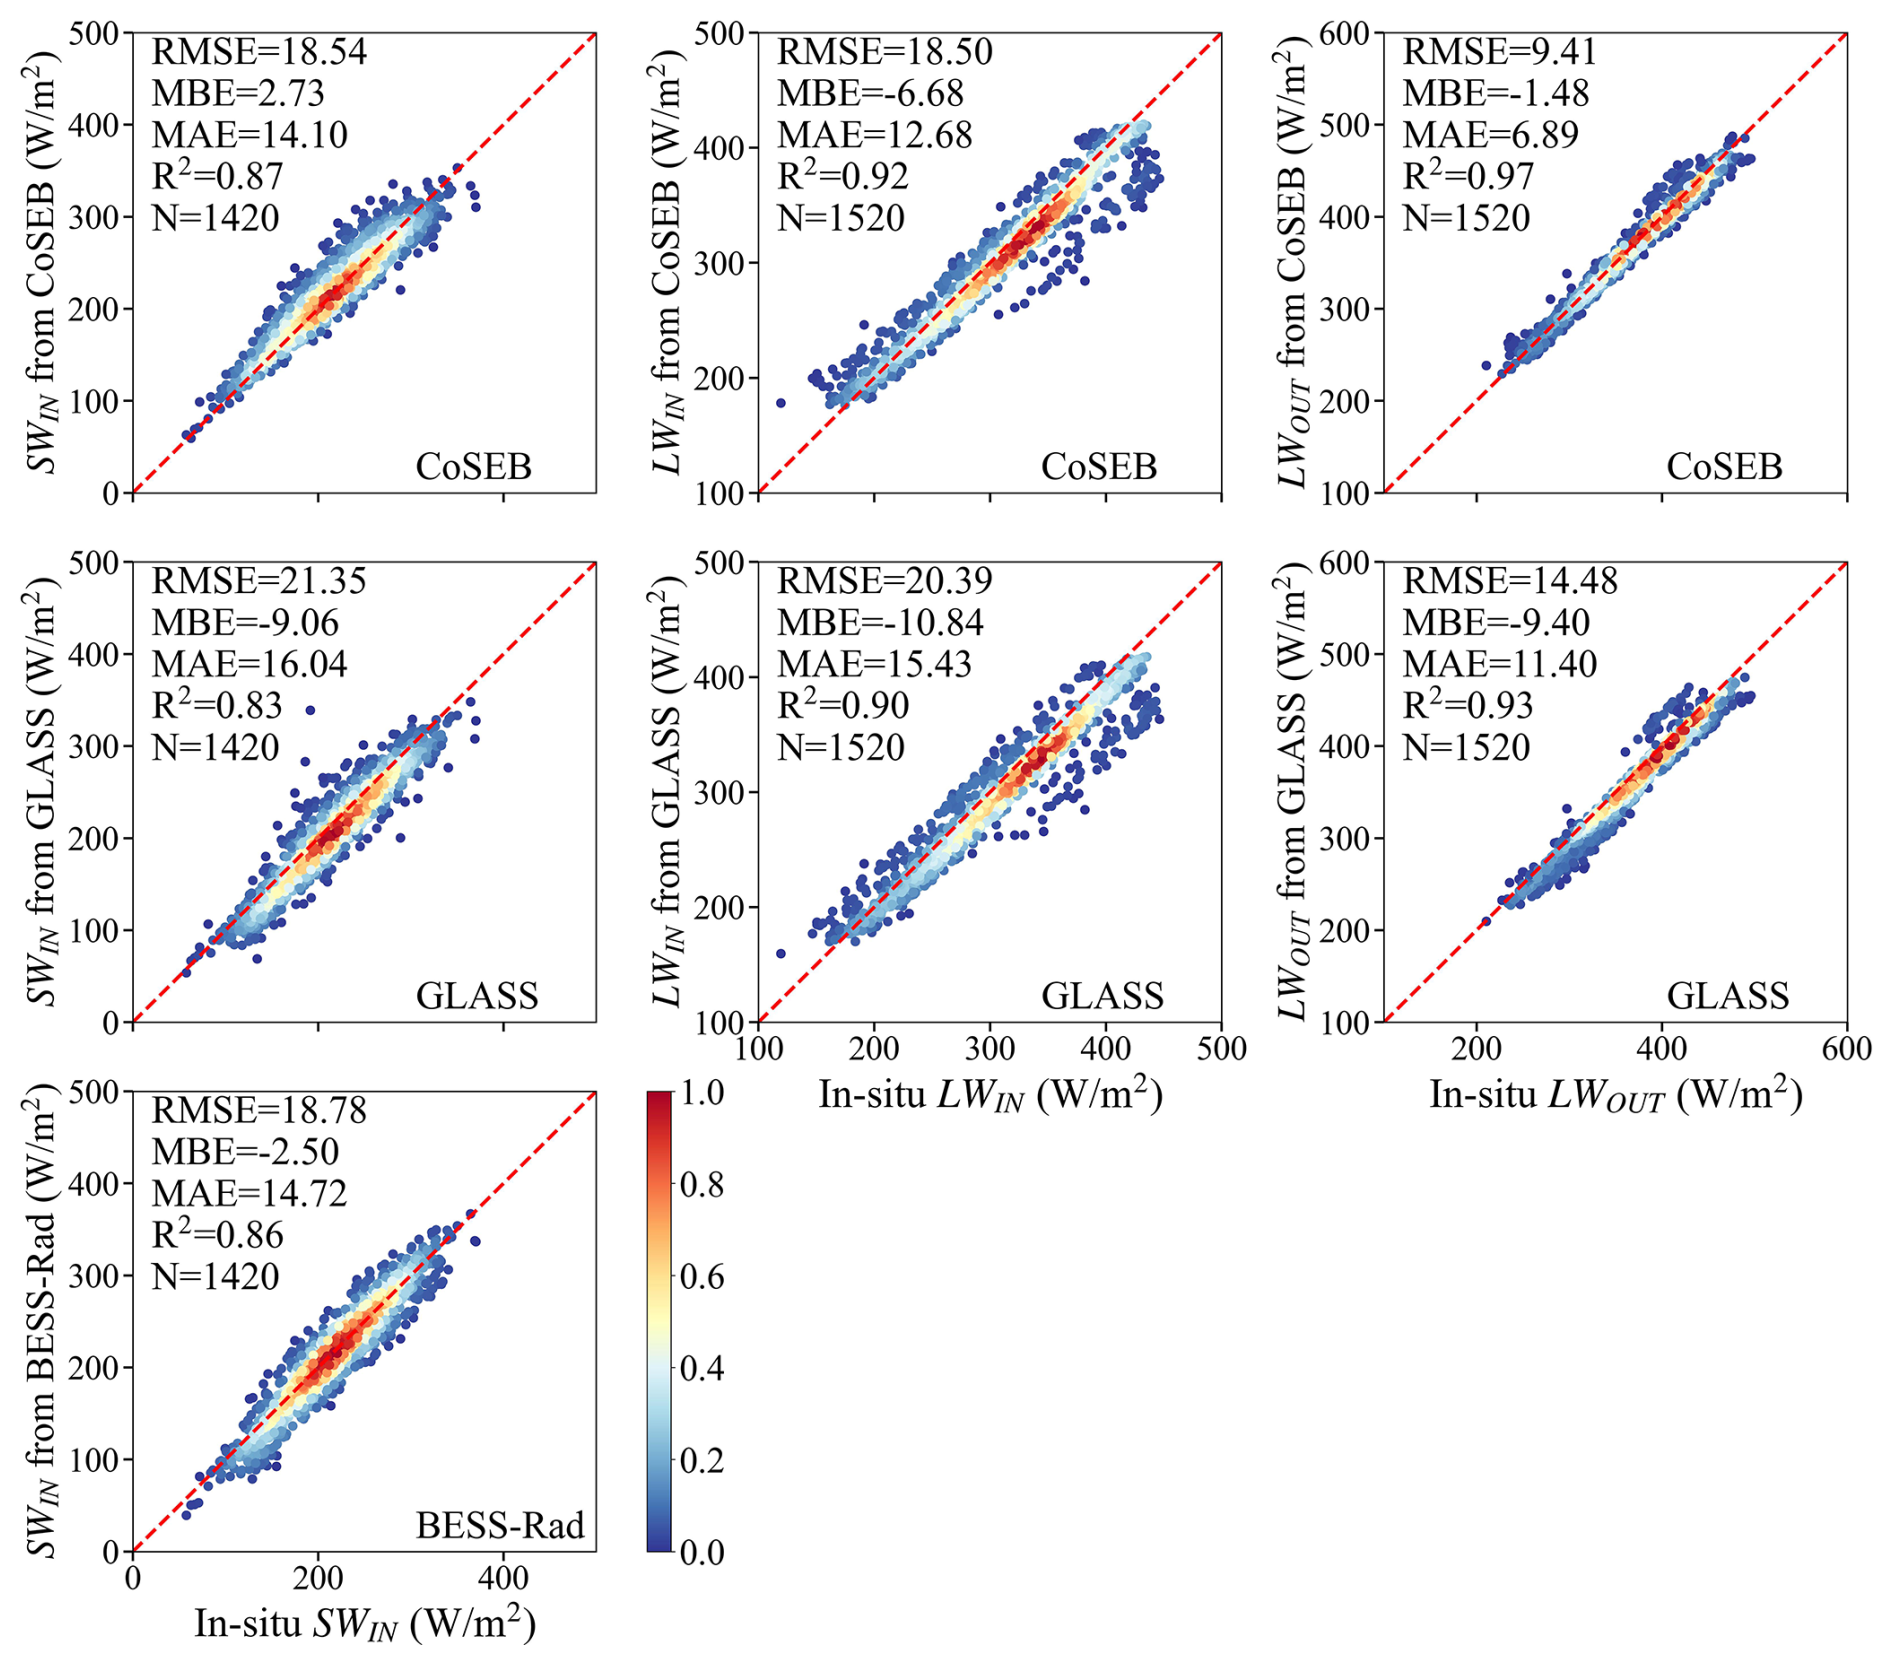
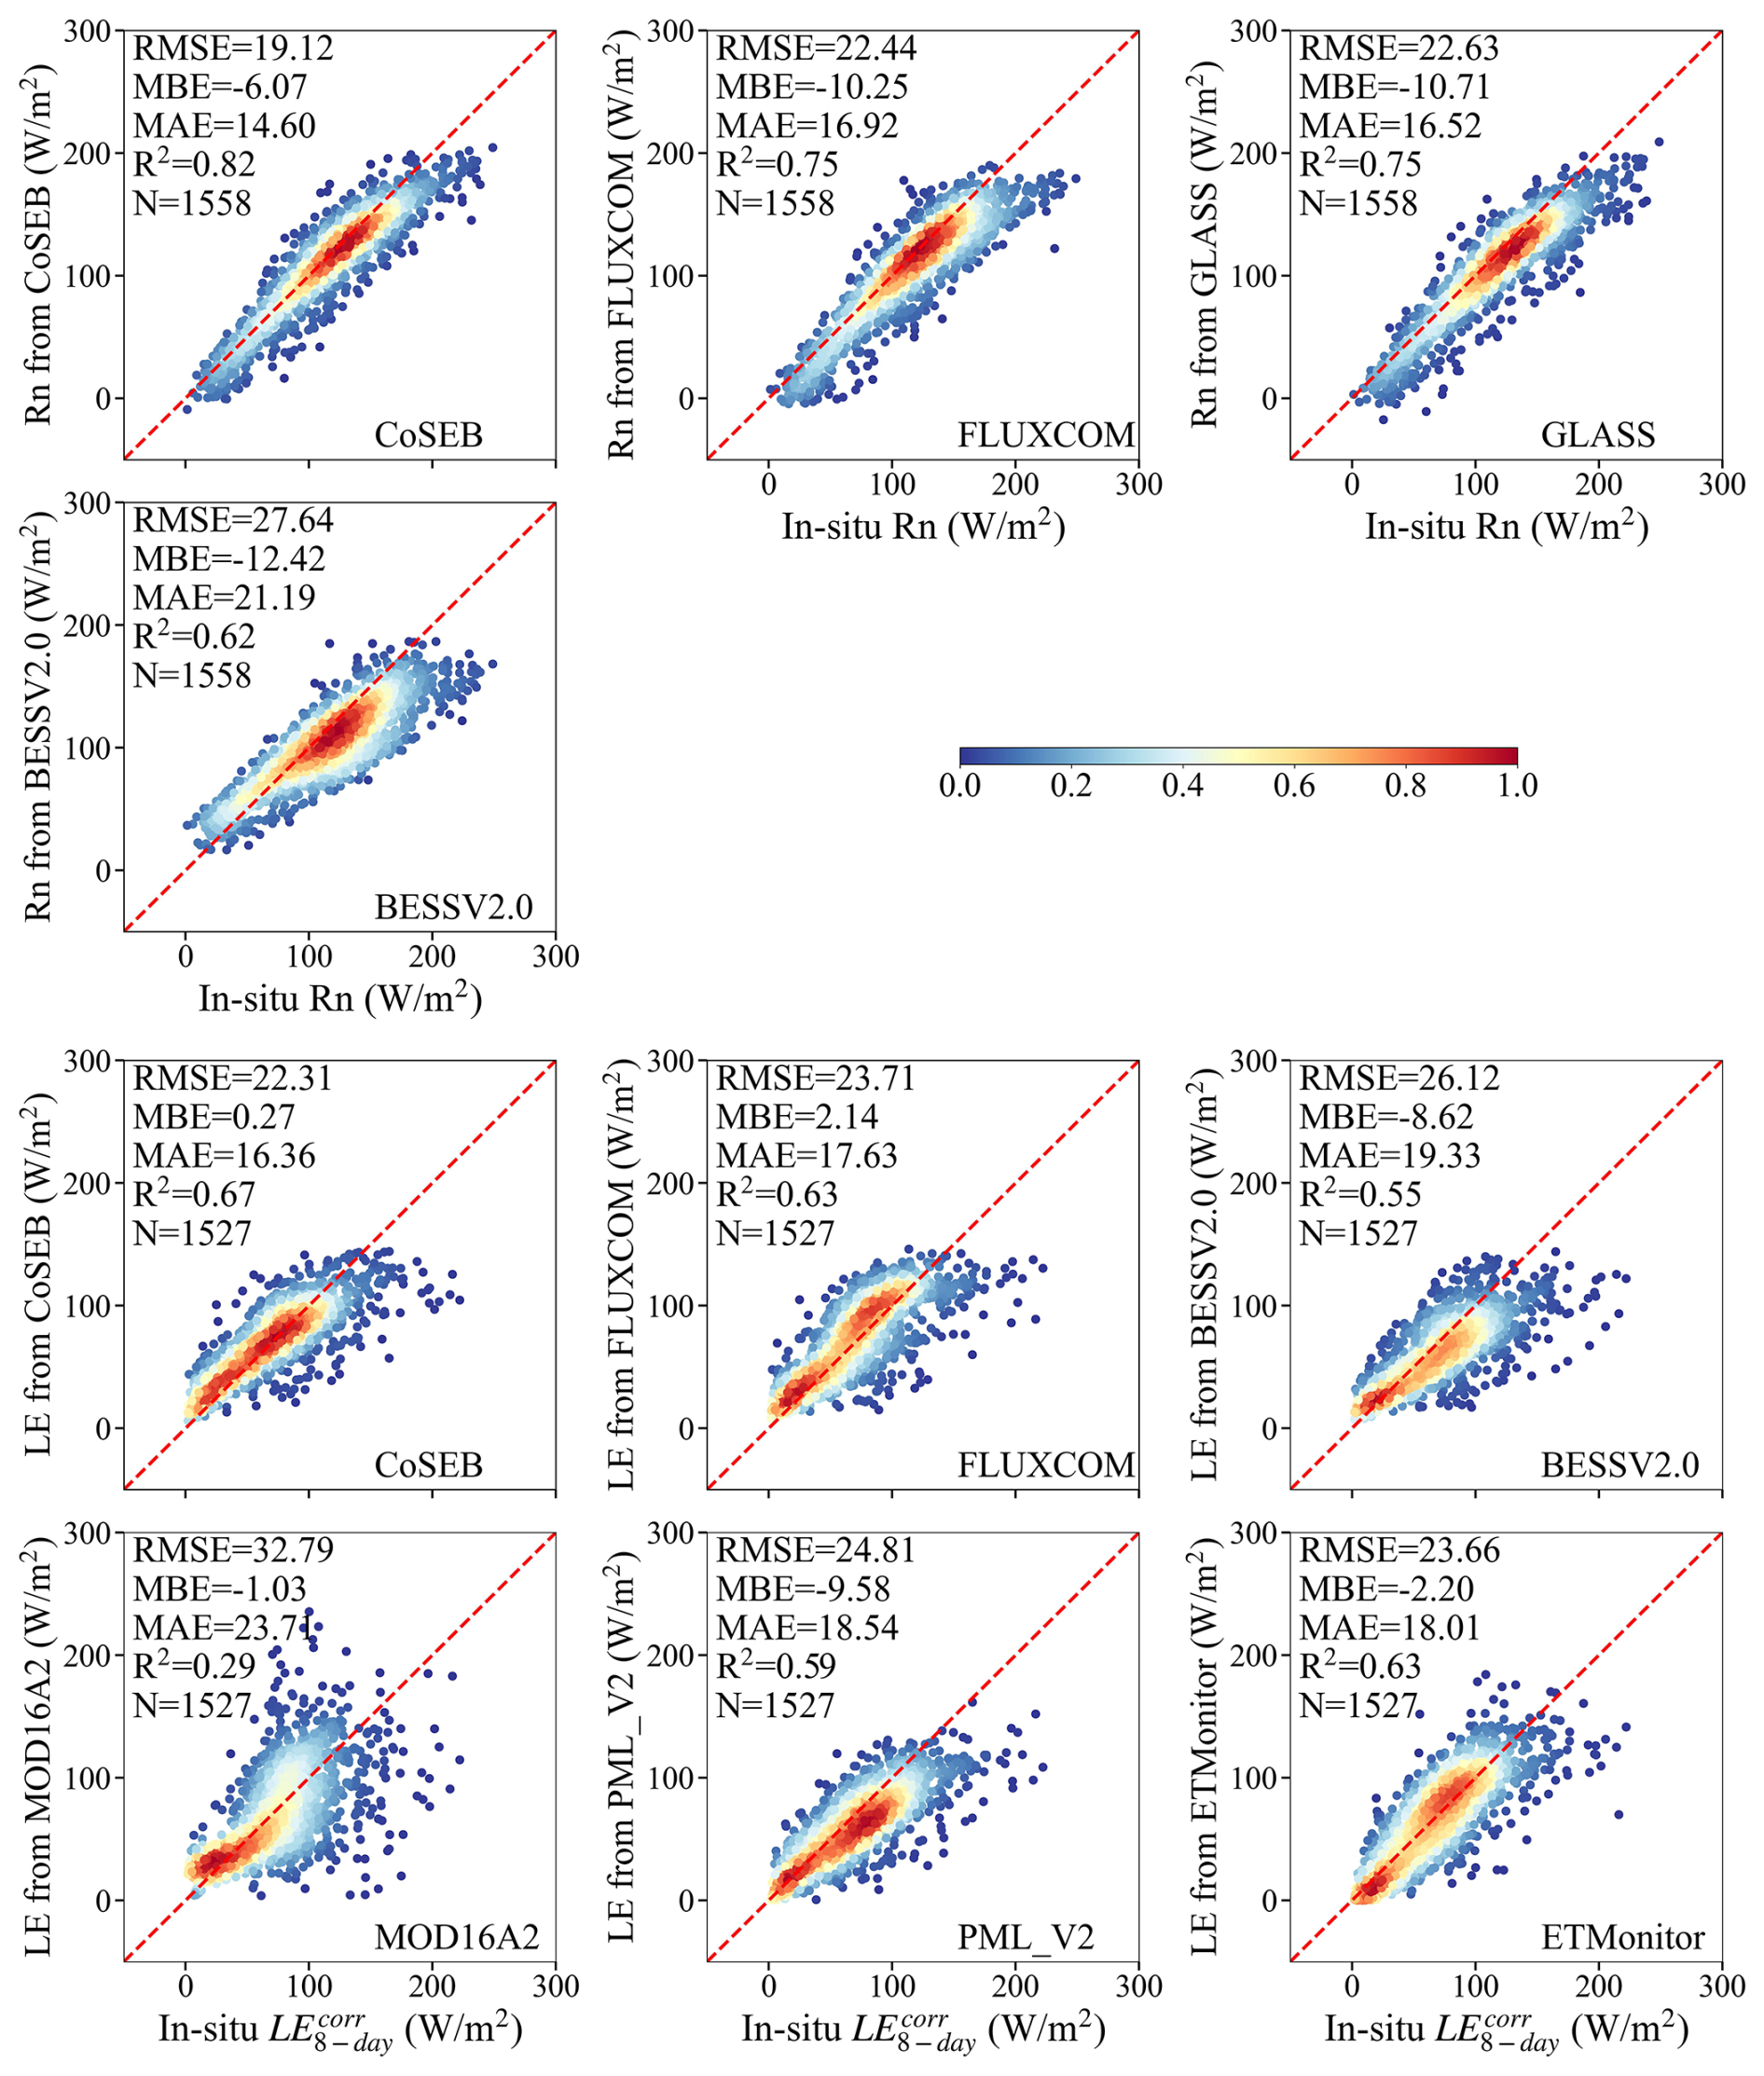
Figure 9Comparison of the 8 d net radiation (Rn, the upper two rows) and latent heat flux (LE, the lower three rows) from the CoSEB-based datasets, FLUXCOM, BESSV2.0, GLASS, MOD16A2, PML_V2 and ETMonitor with in situ observed Rn, and energy imbalance-corrected LE () at 44 test sites. The colorbar represents the normalized density of data points.
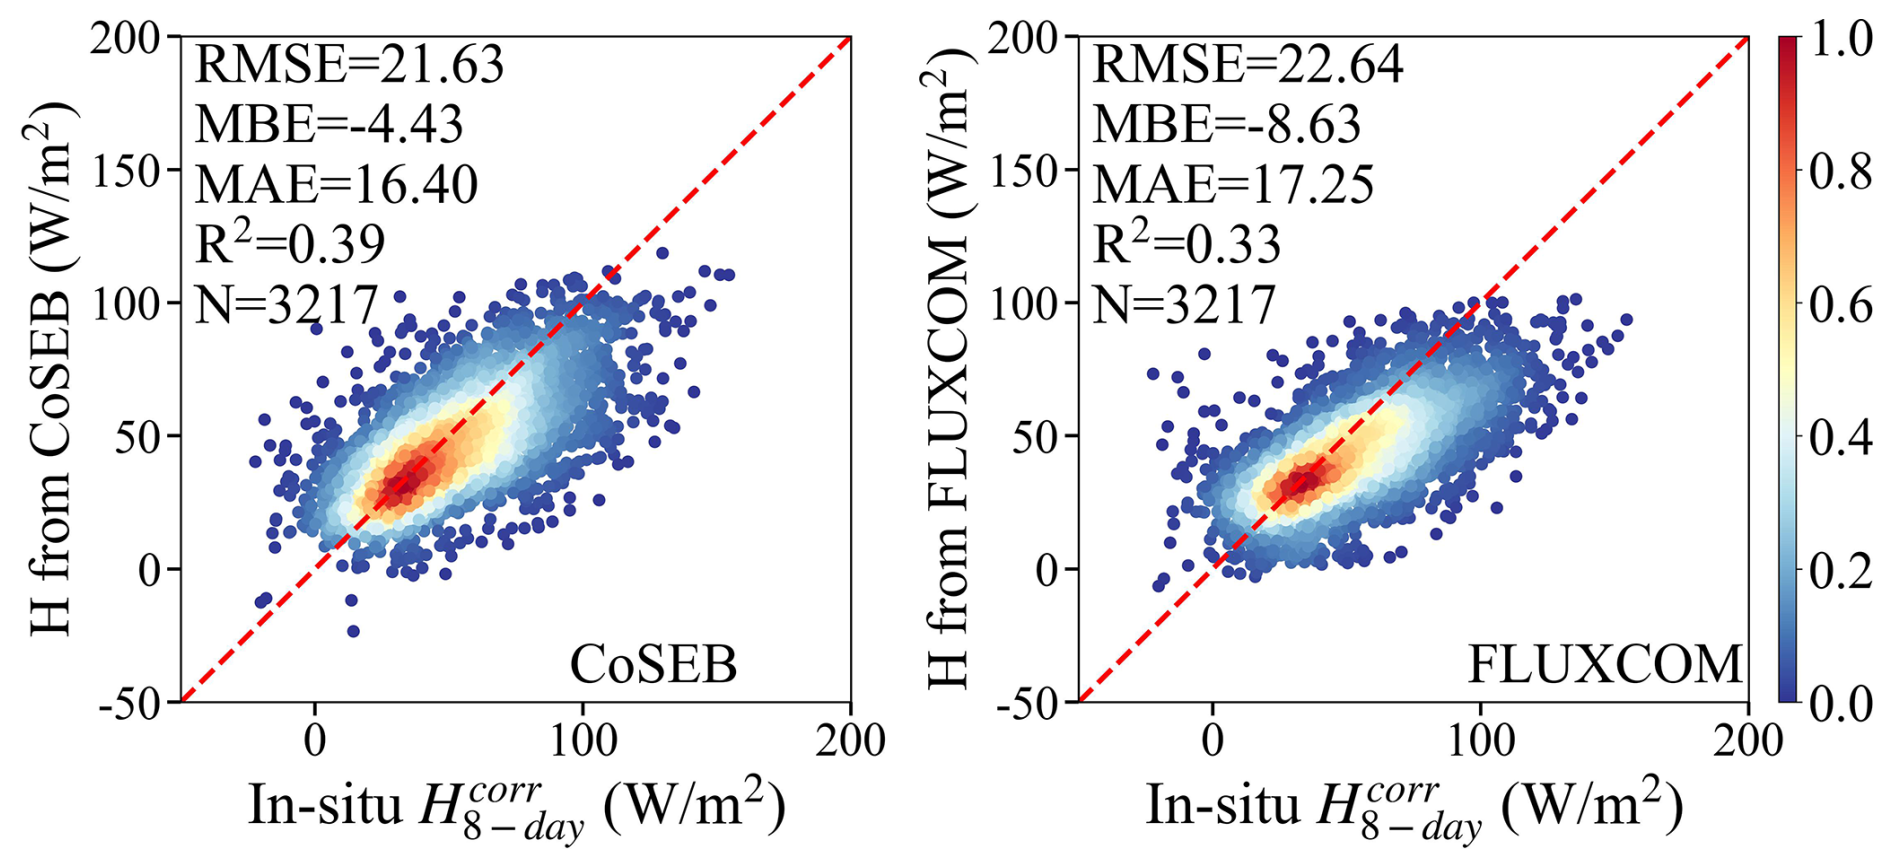
Figure 10Comparison of the 8 d sensible heat flux (H) from the CoSEB-based datasets and the FLUXCOM with the in situ energy imbalance-corrected H () at 44 test sites. The colorbar represents the normalized density of data points.
The differences between the estimates from the CoSEB-based datasets and mainstream datasets are likely multifactorial, arising from the simplification and parameterization uncertainties in physics-based models, as well as the lack of physical constraints, limited training samples, and incomplete consideration of influencing factors in other machine-learning-based models.
4.3 Spatial-temporal patterns of global land surface radiation and heat fluxes
In addition to the validation and inter-comparison of the CoSEB-based datasets at the site scale, we further inter-compared the estimates of land surface radiation and heat fluxes from the CoSEB-based datasets and the mainstream products/datasets, in terms of their global spatial and temporal patterns.
Figures 11–13 show the spatial distributions (excluding Greenland, Antarctic continent, deserts, water bodies and permanent snow) and latitudinal profiles of the global 0.05° mean annual SWIN, LWIN and LWOUT, Rn and LE, as well as H from 2001 to 2018, respectively, as derived from the CoSEB-based datasets and mainstream products/datasets [i.e. GLASS, BESS-Rad, BESSV2.0, FLUXCOM, MOD16A2, PML_V2 and ETMonitor, resampled to 0.05° using arithmetic averaging method or cubic convolutional method if necessary]. Overall, the spatial patterns of the estimates from the CoSEB-based datasets aligned well with those observed in these mainstream products/datasets, though regional discrepancies were present. Specifically, the mean annual LWIN, LWOUT, Rn, and LE generally exhibited decreasing trends from the equator towards higher latitudes, peaking in regions such as the Amazon Rainforest, Congo Rainforest, and the Malay Archipelago. In contrast, the higher mean annual SWIN and H were mainly found in the Tibetan Plateau, southwestern U.S., mid-west Australia, Sahel and Southern Africa, while the lower values were found in high-latitude regions of >50° N. In the region with high values, the mean annual estimates of SWIN from the CoSEB-based datasets were higher than those from GLASS but lower than those from BESS-Rad, the estimates of LWIN and LWOUT from the CoSEB-based datasets were both higher than those from GLASS, the estimates of Rn from the CoSEB-based datasets were significantly higher than those from BESSV2.0, and comparable to or slightly higher than those from FLUXCOM and GLASS, the estimates of LE from the CoSEB-based datasets were close to those from BESSV2.0 and PML_V2, but slightly lower than those from FLUXCOM, MOD16A2 and ETMonitor. Besides, the estimates of H from the CoSEB-based datasets were higher than those from FLUXCOM in regions with high values, while lower than those from FLUXCOM in regions with low values.
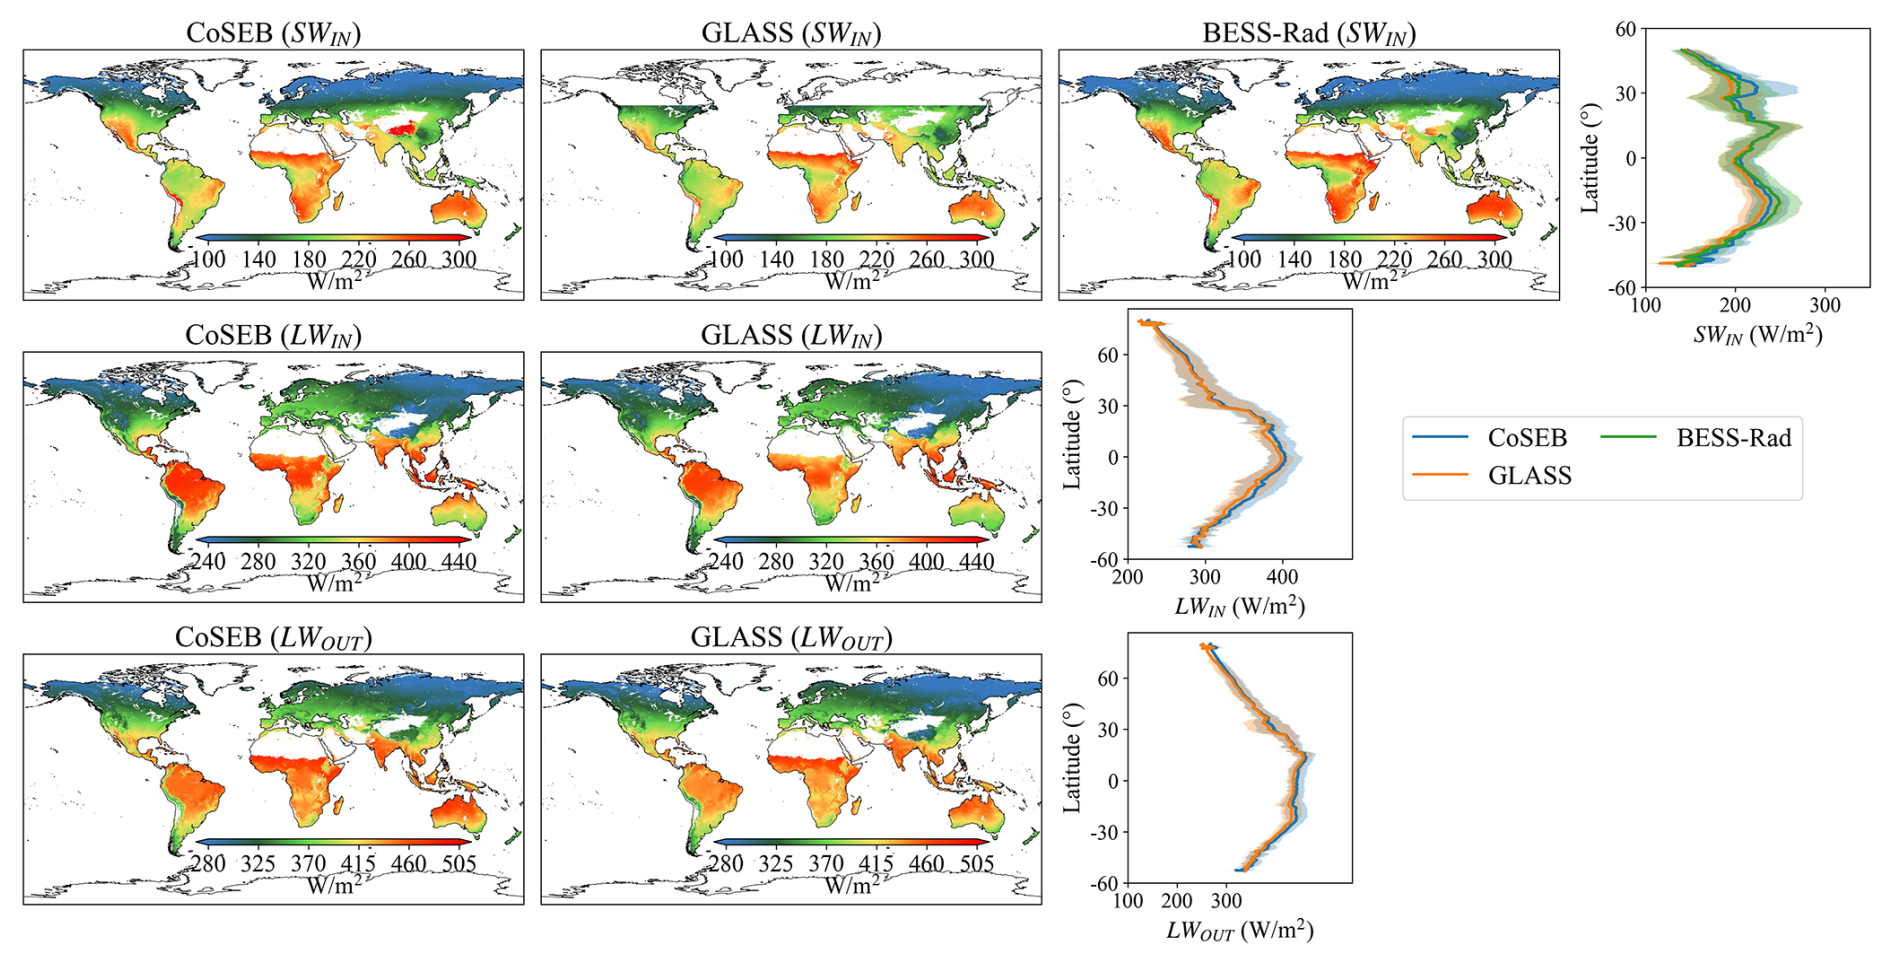
Figure 11Spatial patterns of global mean annual downward shortwave radiation (SWIN, the first row), downward longwave radiation (LWIN, the second row) and upward longwave radiation (LWOUT, the third row) from 2001 to 2018 by CoSEB-based datasets, GLASS and BESS-Rad. The rightmost subfigure of each row represents the latitudinal profiles of mean annual SWIN, LWIN and LWOUT from CoSEB-based datasets, GLASS and BESS-Rad, where the shaded area represents the variation of standard deviation for each product.
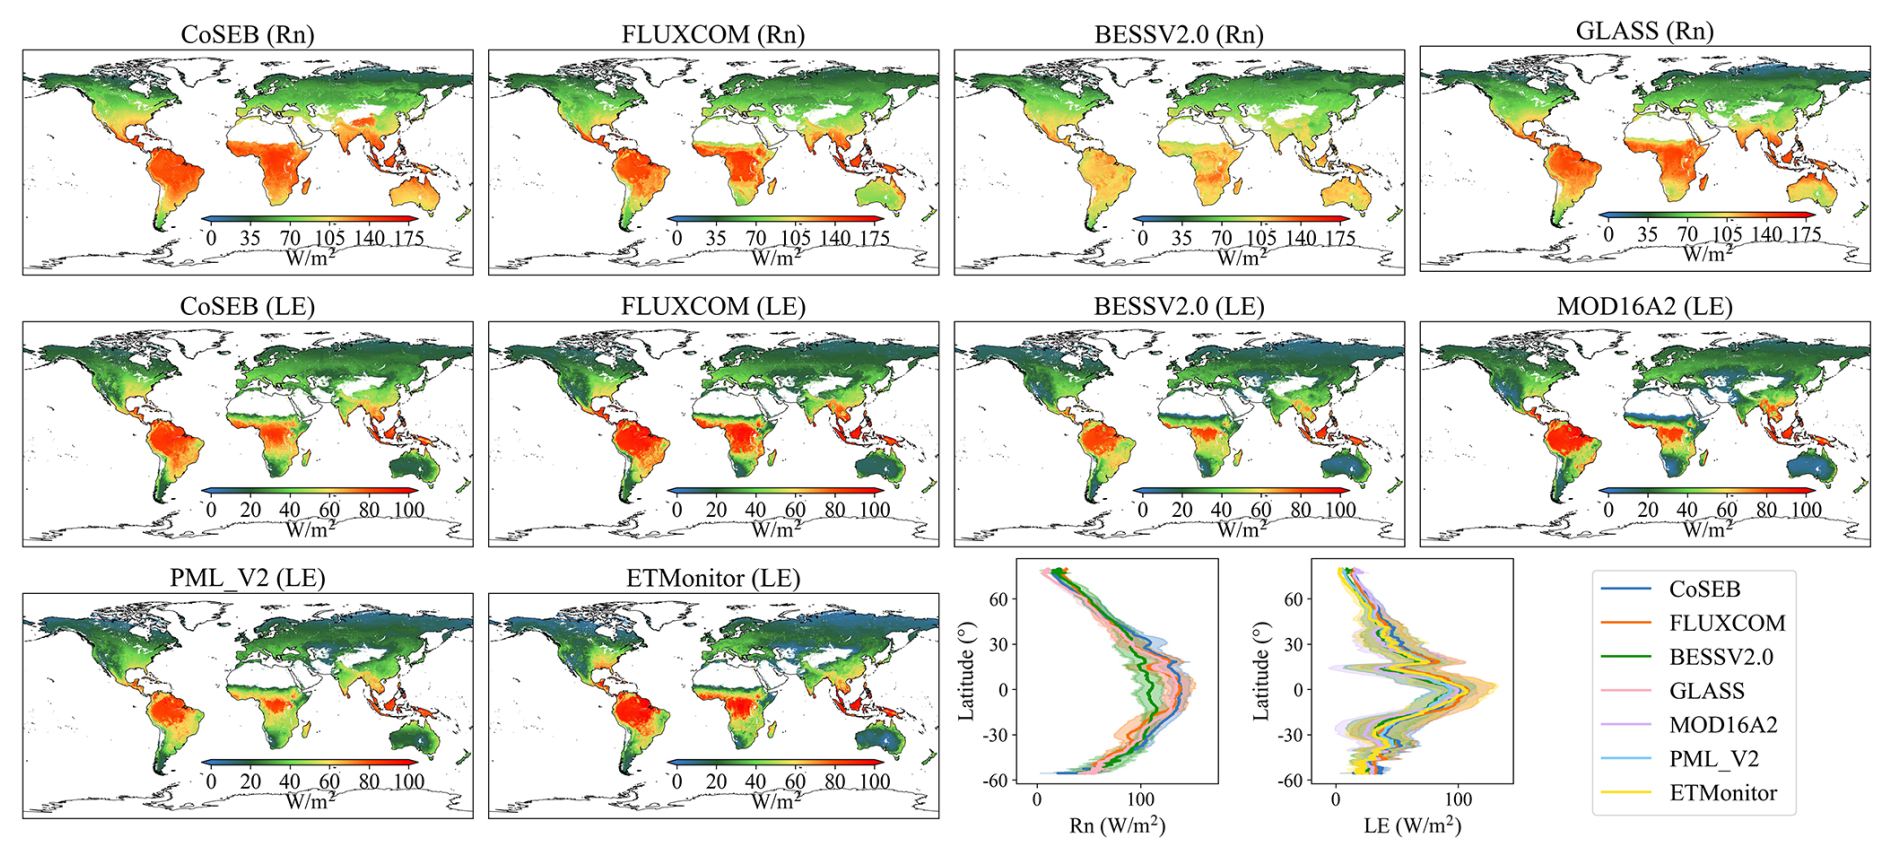
Figure 12Spatial patterns of global mean annual net radiation (Rn, the first row) and latent heat flux (LE, the second and third rows) from 2001 to 2018 by CoSEB-based datasets, FLUXCOM, BESSV2.0, MOD16A2, PML_V2, ETMonitor and GLASS. The last two subfigures of the third row represent the latitudinal profiles of mean annual Rn and LE from CoSEB-based datasets and these mainstream products/datasets, where the shaded area represents the variation of standard deviation for each product.
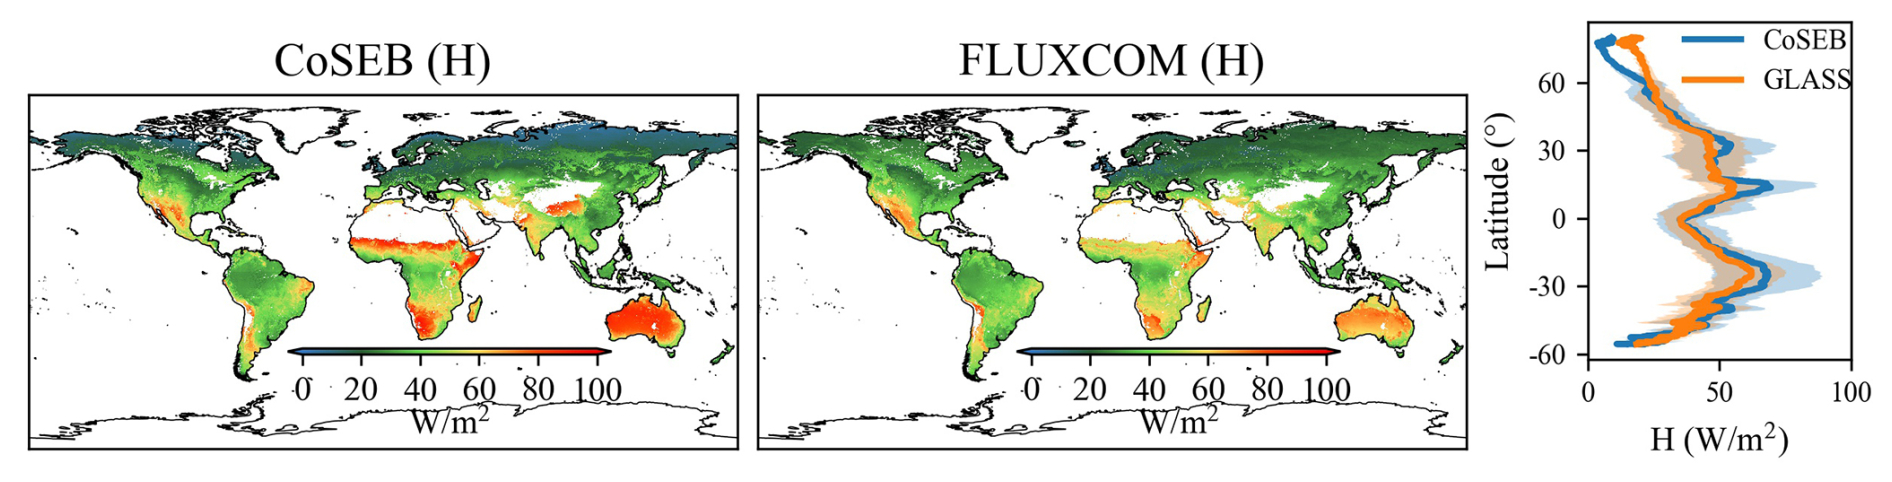
Figure 13Spatial patterns of global mean annual sensible heat flux (H) from 2001 to 2018 by CoSEB-based datasets and FLUXCOM. The rightmost subfigure represents the latitudinal profiles of mean annual H from CoSEB-based datasets and FLUXCOM, where the shaded area represents the variation of standard deviation for each product.
The temporal evolutions of the global (excluding Greenland, Antarctic continent, deserts, water bodies and permanent snow) land surface radiation and heat fluxes derived from the CoSEB-based datasets and mainstream products/datasets from 2001 to 2018 were also investigated, as shown in Fig. 14. The results indicated that the temporal variation of each flux from the CoSEB-based datasets generally agreed well with those from mainstream products/datasets. The global annual mean estimates using area weighting average by the CoSEB-based datasets from 2001 to 2018 varied between ∼185.22 and ∼189.50 W m−2 with the mean of ∼187.23 W m−2 for SWIN, between ∼32.67 and ∼33.20 W m−2 with the mean of ∼32.96 W m−2 for SWOUT, between ∼330.24 and ∼334.14 W m−2 with the mean of ∼331.50 W m−2 for LWIN, between ∼387.25 and ∼390.82 W m−2 with the mean of ∼388.81 W m−2 for LWOUT, between ∼95.41 and ∼99.39 W m−2 with the mean of 97.11 W m−2 for Rn, between ∼53.24 and ∼56.37 W m−2 with the mean of ∼54.53 W m−2 for LE, between ∼40.44 and ∼41.96 W m−2 with the mean of ∼41.29 W m−2 for H, and between ∼1.22 and ∼1.52 W m−2 with the mean of ∼1.33 W m−2 for G. For each radiation or heat flux, the annual mean estimates from the CoSEB-based datasets were overall higher than those from the mainstream products/datasets. In particular, the annual mean Rn estimates from the CoSEB-based datasets were higher than those from FLUXCOM, GLASS and BESSV2.0 sequentially, and the annual mean LE estimates from the CoSEB-based datasets were marginally higher than those from FLUXCOM, but substantially exceeded those from ETMonitor, PML_V2, MOD16A2 and BESSV2.0 sequentially. The anomaly-based analyses (Fig. S4) reveal clear and coherent temporal trends of these radiation and heat fluxes, which respond well to global climate change, such as increasing atmospheric CO2 and rising air temperatures.
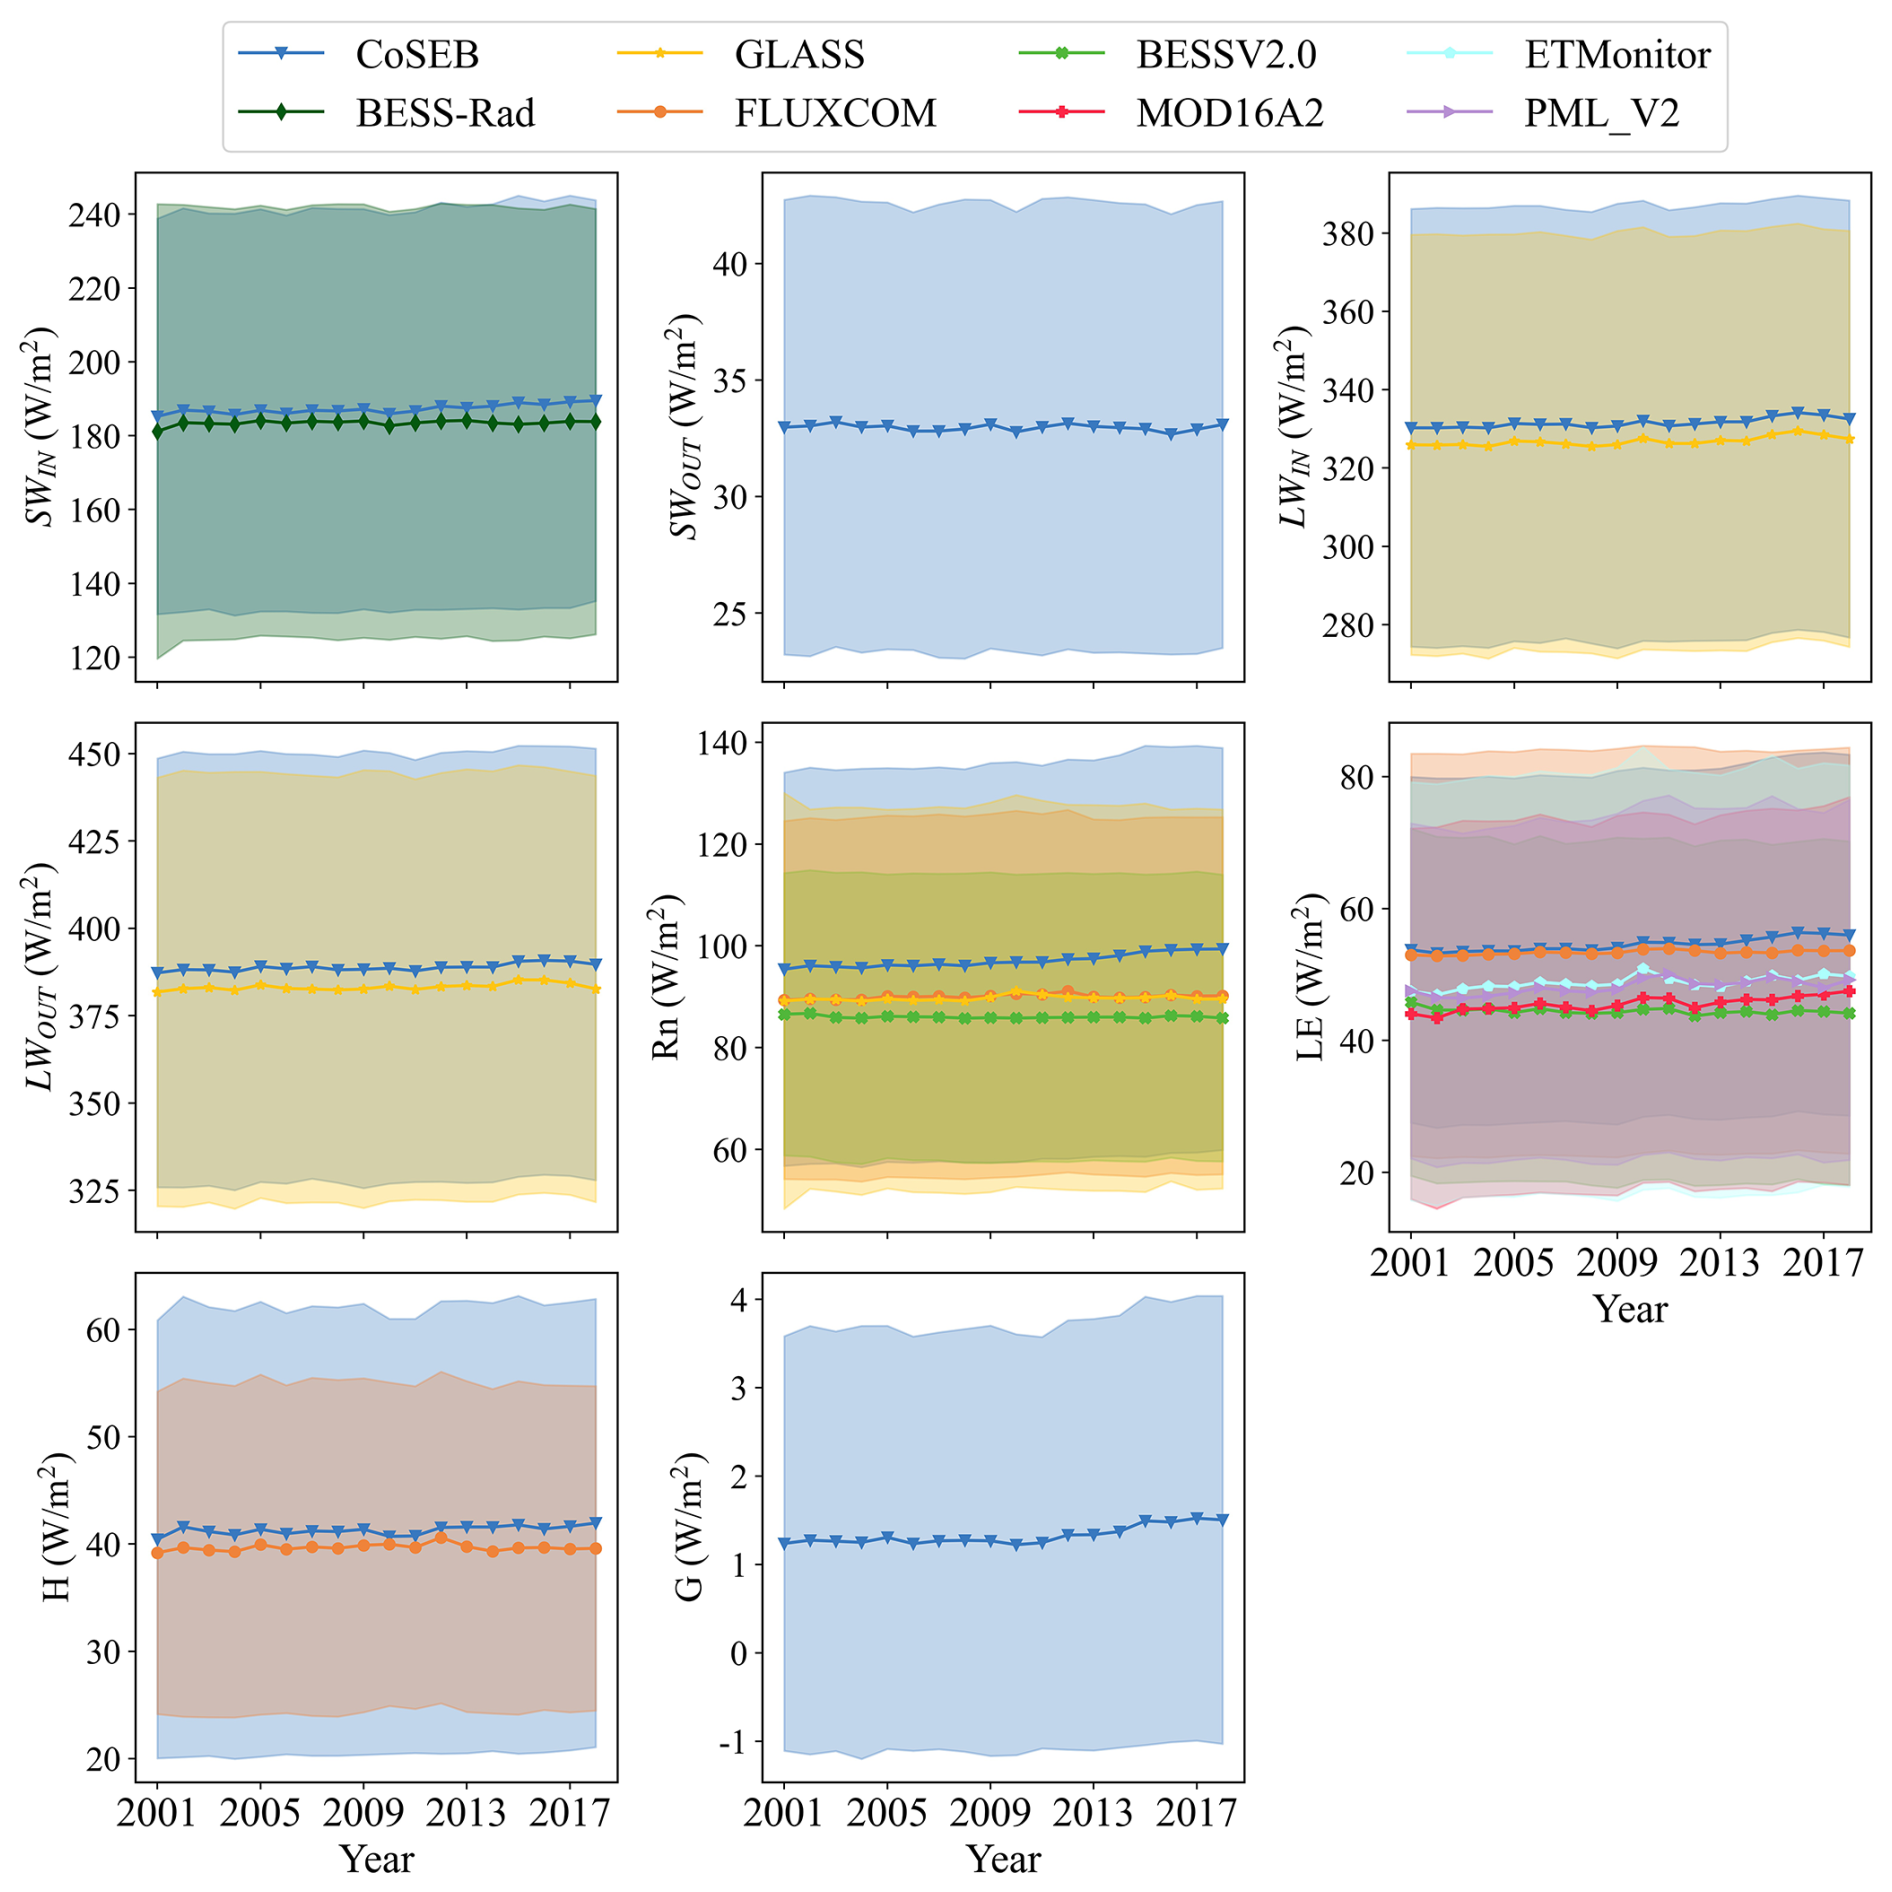
Figure 14Temporal variation of annual mean downward shortwave radiation (SWIN), upward shortwave radiation (SWOUT), downward longwave radiation (LWIN), upward longwave radiation (LWOUT), net radiation (Rn), latent heat flux (LE), sensible heat flux (H) and soil heat flux (G) from 2001 to 2018 from the CoSEB-based datasets, BESS-Rad, GLASS, FLUXCOM, BESSV2.0, PML_V2, MOD16A2 and ETMonitor. The shaded area represents the variation of the standard deviation for each product.
Figures 15–17 show the spatial patterns (excluding Greenland, Antarctic continent, deserts, water bodies and permanent snow) of interannual variability of SWIN, LWIN and LWOUT, Rn and LE, as well as H from 2001 to 2018, respectively, derived from the CoSEB-based datasets and mainstream products/datasets. In general, the estimates from the CoSEB-based datasets displayed similar interannual variability in space with those from the mainstream products/datasets. Specially, the estimates of SWIN from the CoSEB-based datasets, BESS-Rad, and GLASS exhibited a significant interannual variability mainly in northeastern Australia, eastern South America, Southeast China, and Southwest North America. The interannual variability of LWIN and LWOUT by the CoSEB-based datasets and GLASS displayed high values primarily at middle-to-high latitudes of the Northern Hemisphere and parts of Africa and Australia. The interannual variability of Rn observed by the CoSEB-based datasets was generally lower than that of GLASS, but higher than that of BESSV2.0 and FLUXCOM. The CoSEB-based datasets missed the strong interannual variability of LE as observed in MOD16A2, PML_V2 and ETMonitor in parts of Africa, Australia and eastern South America. Furthermore, FLUXCOM exhibited the weakest interannual variability of LE in almost all regions. The interannual variability of H derived from the CoSEB-based datasets was higher than that from FLUXCOM, with stronger interannual variabilities mainly observed in parts of eastern South America, southern Africa, and northeastern Australia.
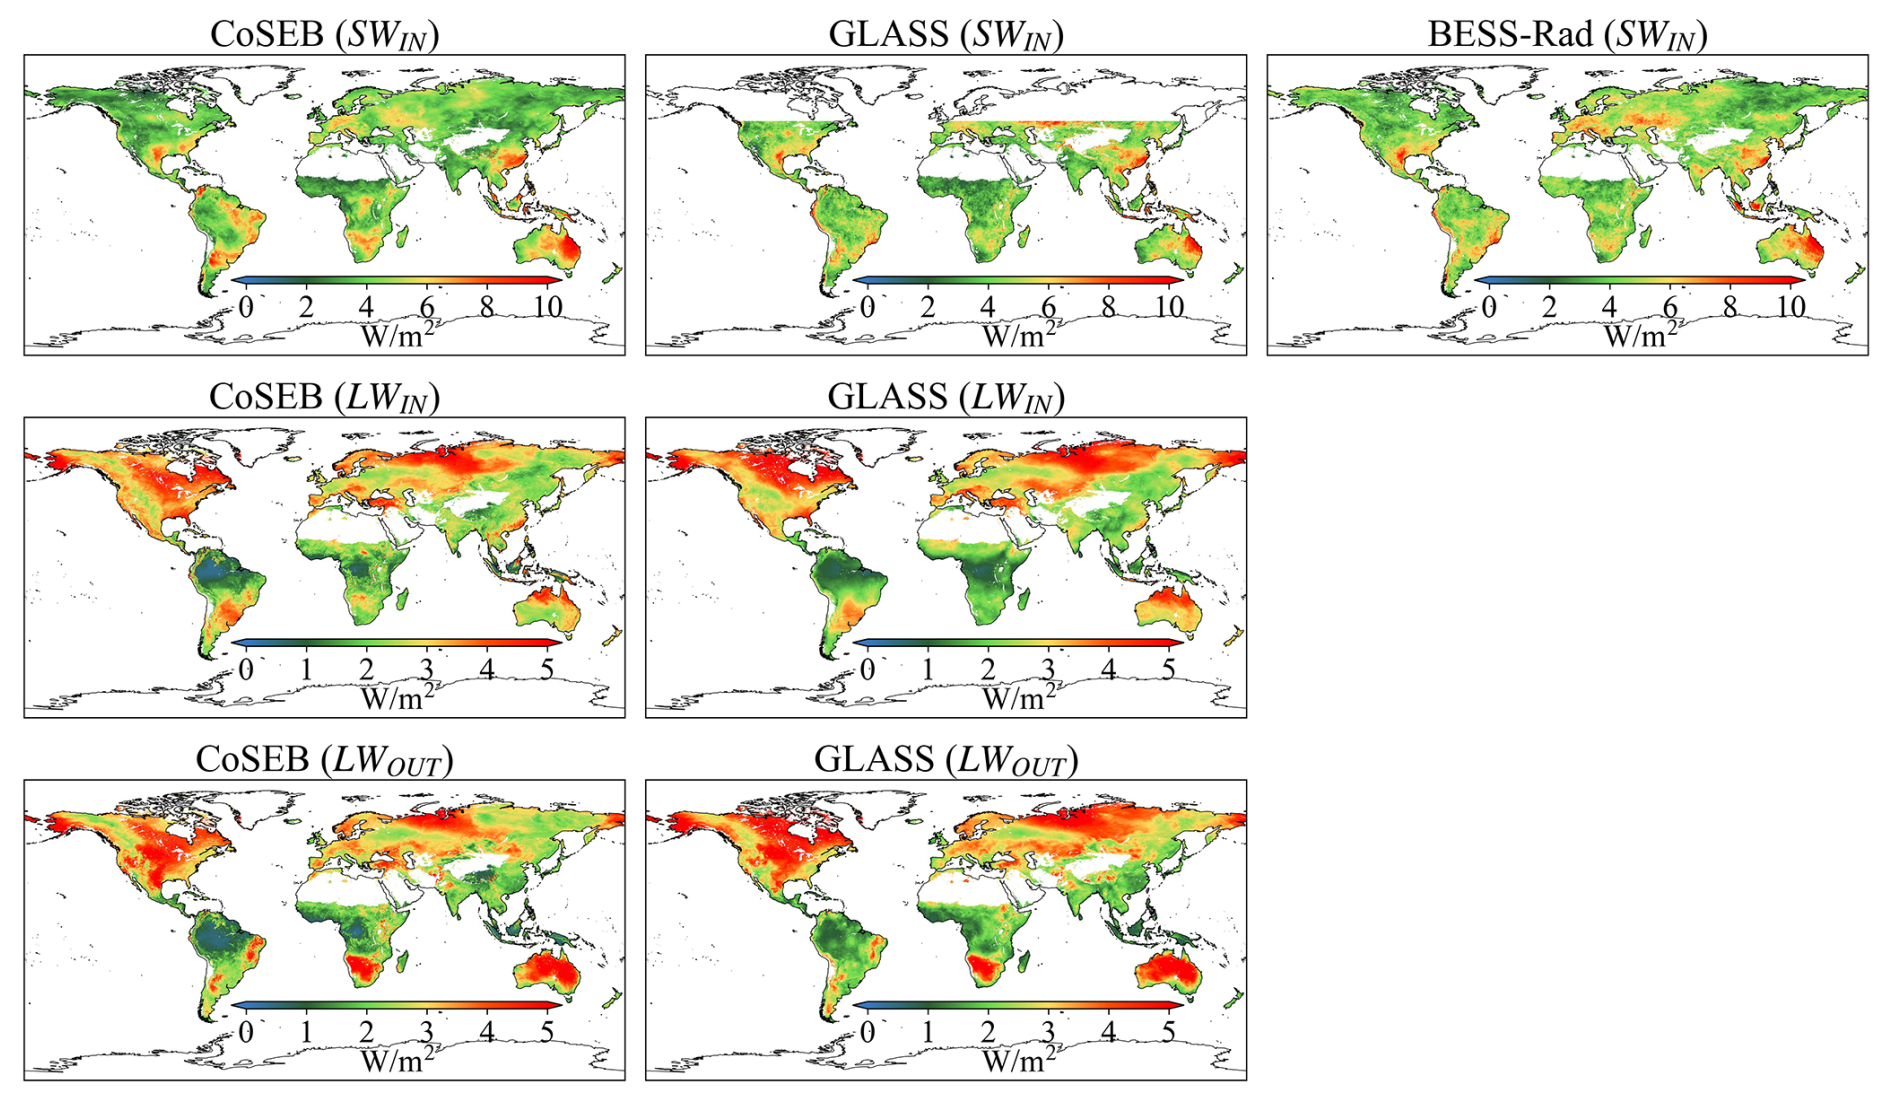
Figure 15Spatial distribution of interannual variability (standard deviation) of downward shortwave radiation (SWIN, the first row), downward longwave radiation (LWIN, the second row) and upward longwave radiation (LWOUT, the third row) from 2001 to 2018 by the CoSEB-based datasets, GLASS and BESS-Rad.
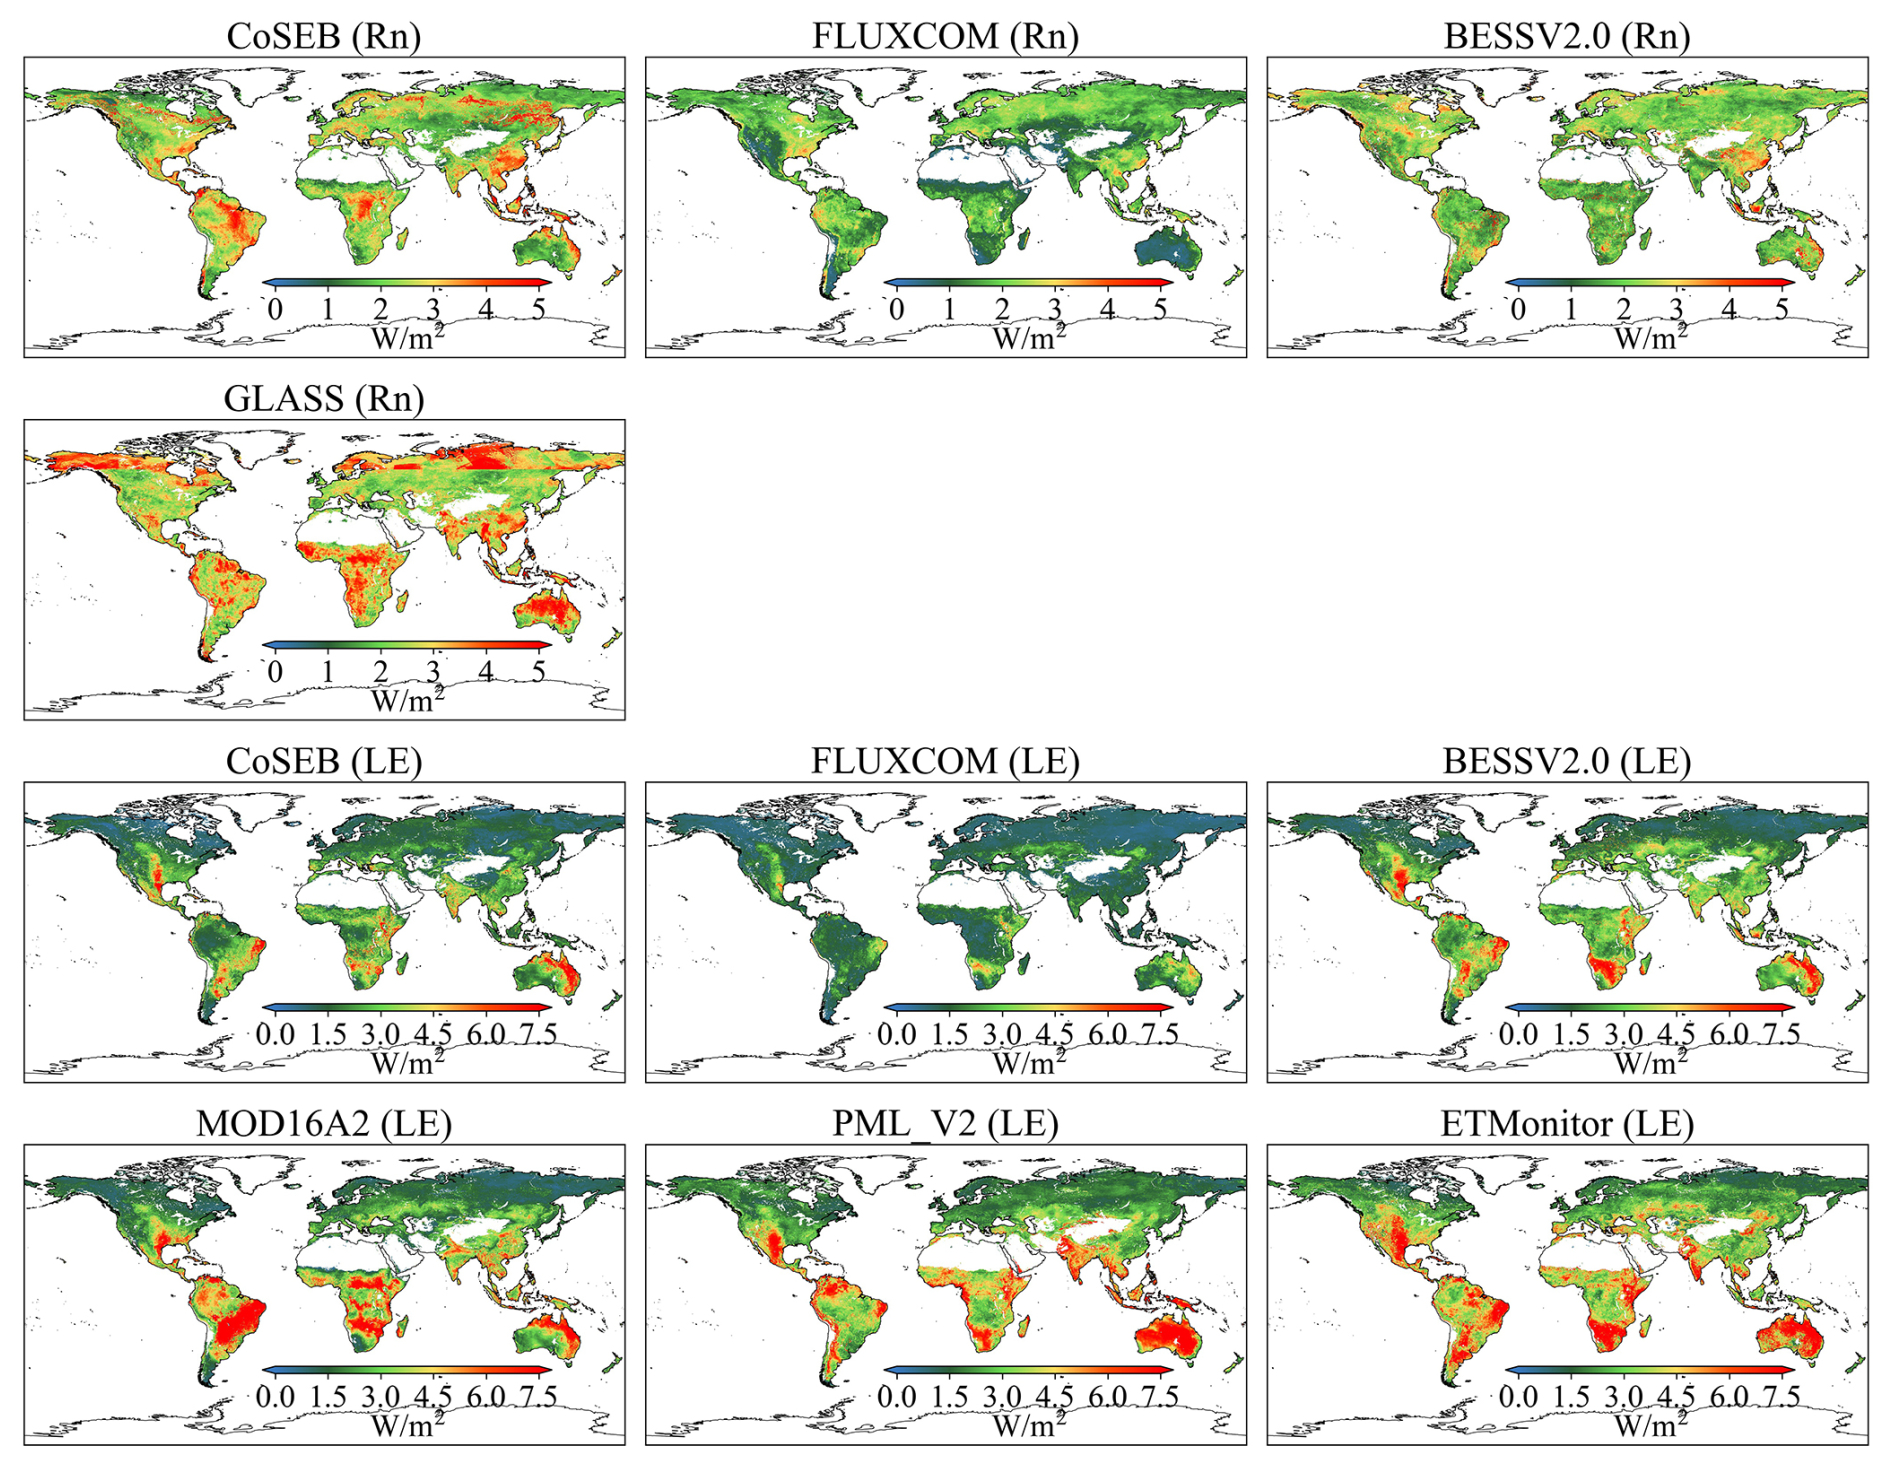
Figure 16Spatial distribution of interannual variability (standard deviation) of net radiation (Rn, the first and second rows) and latent heat flux (LE, the third and fourth rows) from 2001 to 2018 by the CoSEB-based datasets, FLUXCOM, BESSV2.0, MOD16A2, PML_V2, ETMonitor and GLASS.
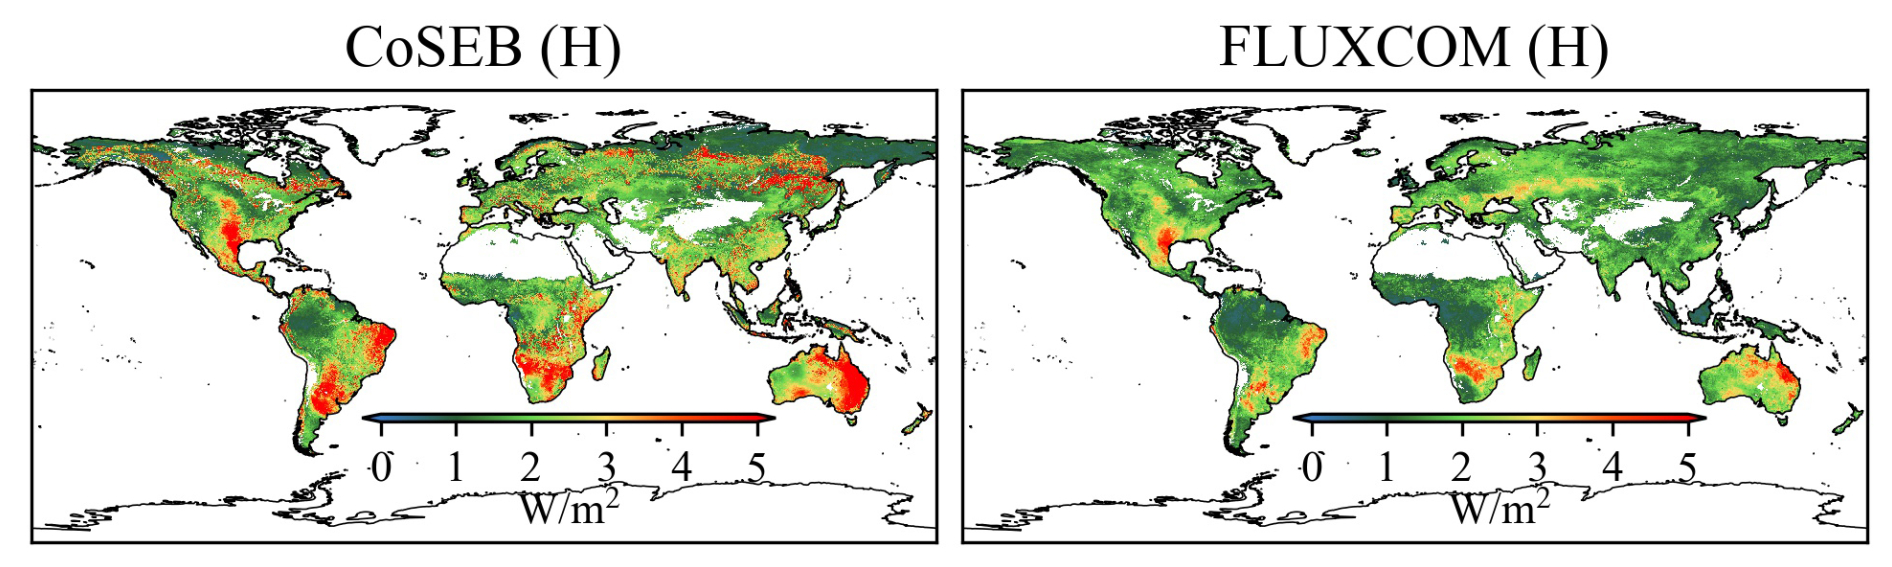
Figure 17Spatial distribution of interannual variability (standard deviation) of sensible heat flux (H) from 2001 to 2018 by the CoSEB-based datasets and FLUXCOM.
Accurately monitoring the spatial and temporal variations of global land surface radiation and heat fluxes is crucial for quantifying the exchange of radiation, heat and water between the land and atmosphere under global climate change (Chen et al., 2020; Du et al., 2024; Kim et al., 2023; Liang et al., 2006; Wang et al., 2020). However, although numerous global RS-based products/datasets of land surface radiation and heat fluxes have been developed using physical and/or statistical methods, they typically provide either merely a single flux or multiple fluxes (see Table 1) that are estimated separately from uncoordinated models (Huang et al., 2024; Jung et al., 2019; Sun et al., 2023; Tang et al., 2019), leading to noticeable radiation imbalance and/or heat imbalance when these products are combined for practical applications. To address these limitations, we generated high-accuracy global datasets of land surface radiation and heat fluxes from 2000 to 2020 that adhere to both radiation and heat conservation laws, using our proposed CoSEB model (Wang et al., 2025).
Our CoSEB model, integrating underlying physical principles of training datasets into machine learning technique to effectively learn the interrelations among multiple targeted outputs, was originally designed for coordinating estimates of global land surface energy balance components (Rn, LE, H and G) to satisfy the energy conservation (Wang et al., 2025). Inspired by the idea of constructing the original CoSEB model, we further incorporated land surface radiation fluxes into our model to simultaneously consider the physical constraints of both surface radiation and heat conservation principles, by renewing the CoSEB using multiple remote sensing and reanalysis datasets, as well as in-situ observations of SWIN, SWOUT, LWIN, LWOUT, Rn, LE, H and G. In selecting the 19 input variables to accommodate the additional target variables, prior knowledge derived from previous studies was employed to identify factors that exert significant influence on surface radiation and heat flux while maintaining relative inter-independence as much as possible (Jung et al., 2019; Mohan et al., 2020; Wang et al., 2021; Xian et al., 2024). This practice is commonly adopted in data-driven models for estimating land surface water, energy, and carbon fluxes (Bai et al., 2024; Elghawi et al., 2023; Han et al., 2023; O and Orth, 2021). The importance scores of the 19 different feature variables are exhibited in Table S4, and downward solar radiation, the primary source of the energy at the earth surface, is the most important input variable, consistent with the results from our previous study (Wang et al., 2025). Although some of the selected variables may exhibit a certain degree of multi-collinearity, each contributes unique and physically meaningful information, supporting the inclusion of all variables in model construction. Note that the variable importance, derived from the built-in method of the random forests and potentially affected by multicollinearity among the input variables, is presented only as a reference. Retaining all 19 feature variables ensures the model's flexibility and generalization capability, enabling future incorporation of additional representative ground-based observations for further training and improvement. Besides, to investigate the impact of lagged effects of input variables on model performance, experiments were also conducted by adding lagged variables (e.g., the air temperature of the previous day) to the 19 input features. The results (Fig. S5) showed almost no improvement in model accuracy, suggesting that lagged effects on model performance were negligible within the CoSEB framework for estimates of daily surface radiation and heat fluxes. Furthermore, to better illustrate the effect of including additional radiation components (SWIN, SWOUT, LWIN and LWOUT) in the renewed CoSEB model compared with the original version by Wang et al. (2025), we have tested the performance of a reconstructed model that estimated only Rn, LE, H and G using the same independent variables and samples as those in the renewed CoSEB model. The results (Fig. S6) showed no significant differences in accuracy compared with those of the renewed CoSEB model, indicating the expansion of radiation components did not compromise model performance.
The main advantages of our CoSEB-based datasets of land surface radiation and heat fluxes lie in that [1] they are the first data-driven global datasets that satisfy both surface radiation balance () and heat balance () among the eight fluxes, as demonstrated by both the RIR and EIR of 0, [2] the radiation and heat fluxes are characterized by high accuracies when validated against in-situ measurements at 44 independent test sites (see the second paragraph in Sect. 2.1), where (1) the RMSEs for daily estimates of SWIN, SWOUT, LWIN, LWOUT, Rn, LE, H and G from the CoSEB-based datasets were 37.52, 14.20, 22.47, 13.78, 29.66, 30.87, 29.75 and 5.69 W m−2, respectively, as well as for 8 d estimates were 18.54, 12.19, 18.50, 9.41, 19.12, 22.31, 21.63 and 4.60 W m−2, respectively, (2) the CoSEB-based datasets, in comparison to the mainstream RS-based products/datasets (i.e. GLASS, BESS-Rad, FLUXCOM, BESSV2.0, MOD16A2, PML_V2 and ETMonitor), better agreed with the in situ observations at the 44 test sites, showing the RMSE reductions ranging from 0.01 to 4.58 W m−2 for SWIN, LWIN, LWOUT, Rn and LE at daily scale, and 0.24 to 10.48 W m−2 for SWIN, LWIN, LWOUT, Rn, LE and H at 8 d scale. Furthermore, the CoSEB-based datasets outperformed the ERA5-Land reanalysis datasets in estimating surface energy fluxes (where SWOUT, LWOUT, Rn and G for the ERA5-Land were inferred from surface radiation balance and heat balance), particularly for SWOUT, H and G, with RMSE reductions of 0.13–8.15 W m−2 when validated against in situ observations at the 44 test sites (Figs. S7 and S8). Preliminary analysis indicates that the CoSEB-based datasets exhibit spatial patterns consistent with those of mainstream RS-based datasets and Earth system model outputs (see Fig. S9), suggesting that the CoSEB-based datasets (or CoSEB framework) more broadly, are capable of reproducing the large-scale spatial features of Earth system models. This capability would be a great benefit to the community given the limitations associated with the high computational cost and long execution time of Earth system models. More detailed analysis about their similarities and differences can be further conducted in future work.
Our developed datasets could be potentially applied in many fields, including but not limited to (1) exploring the spatial-temporal patterns of global land surface radiation and heat flux (es) and their driving mechanisms over the past decades under global change (e.g., rising CO2 concentration, greening land surface and increasing air temperature), (2) investigating the variability of land surface radiation and heat fluxes caused by extreme events and human activities, e.g. afforestation or deforestation, wildfire, air pollution, weather extremes and urbanization, (3) assessing the resources of solar energy, geothermal energy, surface and ground water at regional and global scales, (4) monitoring natural hazards, e.g. drought in agriculture and forestry.
The uncertainties of our datasets are relevant to (1) the data preprocessing, and (2) the application of the CoSEB model across different spatial scales. Specifically, daily averages of surface radiation and heat fluxes for each day were obtained for analysis from good-quality half-hourly observations when the fraction of these good-quality half-hourly observations was greater than 80 % in a day, due to the lack of consensus on the method for aggregating gapped half-hourly observations to daily data (Tang et al., 2024a; Yao et al., 2017; Zheng et al., 2022). Simple temporal interpolation of half-hourly in situ observations, which could therefore introduce substantial uncertainties, was not applied, because surface radiation and heat fluxes are sensitive to short-term variations in meteorological conditions and their intraday dynamics are often complex. Likewise, since there was no agreement on how to correct for the energy imbalance of turbulent heat fluxes, we adopted the most widely applied Bowen ratio method to enforce energy closure between Rn−G and LE+H (Castelli et al., 2018; Twine et al., 2000; Zhang et al., 2021). Another potential source of uncertainty arises from differences in meteorological reanalysis data caused by spatial downscaling, which, as demonstrated in our previous study (Wang et al., 2025, the last paragraph of Sect. 5.1), has a relatively small impact on model estimates by the machine-learning-based CoSEB model combined with finer-resolution surface-related variables that partially compensate for the spatial heterogeneity and localized variations not captured by the coarse-resolution datasets. These data preprocessing had an effect on the construction of the renewed CoSEB model, which may further affect the global datasets. Moreover, the renewed CoSEB model was constructed at the spatial scale of 500 m to match the footprints of the in situ EC observations, but applied at the spatial resolution of 0.05° to generate global datasets, mainly limited by the computing and storage capabilities of our personal computers. However, the CoSEB-based datasets have also been validated and inter-compared at 44 independent test sites to demonstrate that the difference in spatial scale would not much affect the performance of the datasets. Note that the 302 sites used for training, validation, and testing are predominantly located in the Northern Hemisphere, reflecting the inherent uneven distribution of the global flux networks. Although these sites cover a wide range of land cover types and climate regimes, thereby providing substantial heterogeneity for model development, the limited representation of the Southern Hemisphere may introduce uncertainties in the estimation of surface radiation and heat fluxes for certain ecosystems and soil types. In the future, enhancing the flux observation network coverage in the Southern Hemisphere, particularly in South America and Africa, and incorporating these observations into the CoSEB framework would help further improve the accuracy of surface radiation and heat flux estimates in these regions. Furthermore, the radiation and heat balance in this study refers specifically to the conservation among the eight variables (i.e., SWIN, LWIN, SWOUT, LWOUT, Rn, LE, G, H), which constitute the major components of the surface energy budget, and does not account for energy introduced by disturbance-related processes such as wildfires and volcanic eruptions. Despite these uncertainties, it is worth emphasizing that our work was the first attempt to innovatively develop data-driven energy-conservation datasets of global land surface radiation and heat fluxes with high accuracies.
The energy-conservation datasets of global land surface radiation and heat fluxes generated by the CoSEB model with spatial-temporal resolutions of daily and 0.05° from 26 February 2000 to 31 December 2020 are freely available through the National Tibetan Plateau Data Center at https://doi.org/10.11888/Terre.tpdc.302559 (Tang et al., 2025a) and through the Science Data Bank (ScienceDB) at https://doi.org/10.57760/sciencedb.27228 (Tang et al., 2025b).
This study for the first time developed data-driven energy-conservation datasets of global land surface radiation and heat fluxes using our CoSEB model renewed based on GLASS and MODIS products, ERA5-Land reanalysis datasets, topographic data, CO2 concentration data, and observations at 258 EC sites worldwide.
The CoSEB-based datasets of land surface radiation and heat fluxes are the first data-driven global datasets that satisfy both surface radiation balance () and heat balance () among the eight fluxes. Meanwhile, the CoSEB-based datasets outperformed the mainstream products/datasets in accuracy. Specifically, at 44 independent test sites, the RMSEs (R2) for daily estimates of SWIN, SWOUT, LWIN, LWOUT, Rn, LE, H and G from the CoSEB-based datasets were 37.52 W m−2 (0.81), 14.20 W m−2 (0.42), 22.47 W m−2 (0.90), 13.78 W m−2 (0.95), 29.66 W m−2 (0.77), 30.87 W m−2 (0.60), 29.75 W m−2 (0.44) and 5.69 W m−2 (0.44), respectively, as well as for 8 d estimates were 18.54 W m−2 (0.87), 12.19 W m−2 (0.39), 18.50 W m−2 (0.92), 9.41 W m−2 (0.97), 19.12 W m−2 (0.82), 22.31 W m−2 (0.67), 21.63 W m−2 (0.39) and 4.60 W m−2 (0.47), respectively. Moreover, the estimates from the CoSEB-based datasets in comparison to those from the mainstream products/datasets reduced the RMSE by 0.01 to 4.58 W m−2 and increased the R2 by 0.01 to 0.09 for SWIN, LWIN, LWOUT, Rn and LE at daily scale, and reduced the RMSE by 0.24 to 10.48 W m−2 and increased the R2 by 0.01 to 0.38 for SWIN, LWIN, LWOUT, Rn, LE and H at 8 d scale, when these estimates were validated against in situ observations at 44 independent test sites. Furthermore, the CoSEB-based datasets effectively captured the spatial-temporal variability of global land surface radiation and heat fluxes, aligning well with those from the mainstream products.
Our developed datasets hold significant potential for application across diverse fields such as agriculture, forestry, hydrology, meteorology, ecology, and environmental science. They can facilitate comprehensive studies on the variability, impacts, responses, adaptation strategies, and mitigation measures of global and regional land surface radiation and heat fluxes under the influences of climate change and human activities. These datasets will provide valuable insights and data support for scientific research, policy-making, and environmental management, advancing global solutions to address climate change.
The supplement related to this article is available online at https://doi.org/10.5194/essd-18-443-2026-supplement.
JW: Writing – original draft, Visualization, Software, Formal analysis, Data curation. RT: Writing – original draft, Validation, Supervision, Methodology, Funding acquisition, Formal analysis, Conceptualization. ML: Writing – review and editing, Validation. ZLL: Writing – review and editing.
The contact author has declared that none of the authors has any competing interests.
Publisher's note: Copernicus Publications remains neutral with regard to jurisdictional claims made in the text, published maps, institutional affiliations, or any other geographical representation in this paper. The authors bear the ultimate responsibility for providing appropriate place names. Views expressed in the text are those of the authors and do not necessarily reflect the views of the publisher.
We thank the work from the AmeriFlux, FLUXNET, EuroFlux, OzFlux, ChinaFLUX, the National Tibetan Plateau/Third Pole Environment Data Center and SURFRAD for providing in situ measurements. We would also like to thank Dr. Martin Jung and Dr. Ulrich Weber for providing the FLUXCOM Bowen ratio-corrected products.
This research has been supported by the Strategic Priority Research Program of the Chinese Academy of Sciences (grant no. XDB0740202), and the National Natural Science Foundation of China (grant no. 42271378).
This paper was edited by Fan Mei and reviewed by three anonymous referees.
Bai, Y., Mallick, K., Hu, T., Zhang, S., Yang, S., and Ahmadi, A.: Integrating machine learning with thermal-driven analytical energy balance model improved terrestrial evapotranspiration estimation through enhanced surface conductance, Remote Sens. Environ., 311, 114308, https://doi.org/10.1016/j.rse.2024.114308, 2024.
Bartkowiak, P., Ventura, B., Jacob, A., and Castelli, M.: A Copernicus-based evapotranspiration dataset at 100 m spatial resolution over four Mediterranean basins, Earth Syst. Sci. Data, 16, 4709–4734, https://doi.org/10.5194/essd-16-4709-2024, 2024.
Berbery, E. H., Mitchell, K. E., Benjamin, S., Smirnova, T., Ritchie, H., Hogue, R., and Radeva, E.: Assessment of land-surface energy budgets from regional and global models, J. Geophys. Res.-Atmos., 104, 19329–19348, https://doi.org/10.1029/1999jd900128, 1999.
Betts, A. K., Ball, J. H., Beljaars, A. C. M., Miller, M. J., and Viterbo, P. A.: The land surface-atmosphere interaction: A review based on observational and global modeling perspectives, J. Geophys. Res.-Atmos., 101, 7209–7225, https://doi.org/10.1029/95jd02135, 1996.
Castelli, M., Anderson, M. C., Yang, Y., Wohlfahrt, G., Bertoldi, G., Niedrist, G., Hammerle, A., Zhao, P., Zebisch, M., and Notarnicola, C.: Two-source energy balance modeling of evapotranspiration in Alpine grasslands, Remote Sens. Environ., 209, 327–342, https://doi.org/10.1016/j.rse.2018.02.062, 2018.
Chen, J., He, T., Jiang, B., and Liang, S.: Estimation of all-sky all-wave daily net radiation at high latitudes from MODIS data, Remote Sens. Environ., 245, 111842, https://doi.org/10.1016/j.rse.2020.111842, 2020.
de Wit, A. J. W., Boogaard, H. L., and van Diepen, C. A.: Spatial resolution of precipitation and radiation: The effect on regional crop yield forecasts, Agric. For. Meteorol., 135, 156–168, https://doi.org/10.1016/j.agrformet.2005.11.012, 2005.
Du, Y., Wang, T., Zhou, Y., Letu, H., Li, D., and Xian, Y.: Towards user-friendly all-sky surface longwave downward radiation from space: General scheme and product, Bull. Amer. Meteorol. Soc., 105, E1303–E1319, https://doi.org/10.1175/bams-d-23-0126.1, 2024.
ElGhawi, R., Kraft, B., Reimers, C., Reichstein, M., Körner, M., Gentine, P., and Winkler, A. J.: Hybrid modeling of evapotranspiration: inferring stomatal and aerodynamic resistances using combined physics-based and machine learning, Environ. Res. Lett., 18, 034039, https://doi.org/10.1088/1748-9326/acbbe0, 2023.
Ersi, C., Sudu, B., Song, Z., Bao, Y., Wei, S., Zhang, J., Tong, Z., Liu, X., Le, W., and Rina, S.: The potential of NIRvP in estimating evapotranspiration, Remote Sens. Environ., 315, 114405, https://doi.org/10.1016/j.rse.2024.114405, 2024.
Han, Q., Zeng, Y., Zhang, L., Wang, C., Prikaziuk, E., Niu, Z., and Su, B.: Global long term daily 1 km surface soil moisture dataset with physics informed machine learning, Sci. Data, 10, 101, https://doi.org/10.1038/s41597-023-02011-7, 2023.
Huang, J., Yu, H., Guan, X., Wang, G., and Guo, R.: Accelerated dryland expansion under climate change, Nat. Clim. Chang., 6, 166–171, https://doi.org/10.1038/nclimate2837, 2015.
Huang, L., Luo, Y., Chen, J. M., Tang, Q., Steenhuis, T., Cheng, W., and Shi, W.: Satellite-based near-real-time global daily terrestrial evapotranspiration estimates, Earth Syst. Sci. Data, 16, 3993–4019, https://doi.org/10.5194/essd-16-3993-2024, 2024.
Jia, B., Xie, Z., Dai, A., Shi, C., and Chen, F.: Evaluation of satellite and reanalysis products of downward surface solar radiation over East Asia: Spatial and seasonal variations, J. Geophys. Res.-Atmos., 118, 3431–3446, https://doi.org/10.1002/jgrd.50353, 2013.
Jiang, B., Zhang, Y., Liang, S., Wohlfahrt, G., Arain, A., Cescatti, A., Georgiadis, T., Jia, K., Kiely, G., Lund, M., Montagnani, L., Magliulo, V., Ortiz, P. S., Oechel, W., Vaccari, F. P., Yao, Y., and Zhang, X.: Empirical estimation of daytime net radiation from shortwave radiation and ancillary information, Agric. For. Meteorol., 211–212, 23–36, https://doi.org/10.1016/j.agrformet.2015.05.003, 2015.
Jiao, B., Su, Y., Li, Q., Manara, V., and Wild, M.: An integrated and homogenized global surface solar radiation dataset and its reconstruction based on a convolutional neural network approach, Earth Syst. Sci. Data, 15, 4519–4535, https://doi.org/10.5194/essd-15-4519-2023, 2023.
Jung, M., Koirala, S., Weber, U., Ichii, K., Gans, F., Camps-Valls, G., Papale, D., Schwalm, C., Tramontana, G., and Reichstein, M.: The FLUXCOM ensemble of global land-atmosphere energy fluxes, Sci. Data, 6, 74, https://doi.org/10.1038/s41597-019-0076-8, 2019.
Kim, Y., Park, H., Kimball, J. S., Colliander, A., and McCabe, M. F.: Global estimates of daily evapotranspiration using SMAP surface and root-zone soil moisture, Remote Sens. Environ., 298, 113803, https://doi.org/10.1016/j.rse.2023.113803, 2023.
Li, B., Ryu, Y., Jiang, C., Dechant, B., Liu, J., Yan, Y., and Li, X.: BESSv2.0: A satellite-based and coupled-process model for quantifying long-term global land–atmosphere fluxes, Remote Sens. Environ., 295, 113696, https://doi.org/10.1016/j.rse.2023.113696, 2023.
Liang, S., Zheng, T., Liu, R., Fang, H., Tsay, S. C., and Running, S.: Estimation of incident photosynthetically active radiation from Moderate Resolution Imaging Spectrometer data, J. Geophys. Res.-Atmos., 111, D15208, https://doi.org/10.1029/2005jd006730, 2006.
Liang, S., Wang, D., He, T., and Yu, Y.: Remote sensing of earth's energy budget: synthesis and review, Int. J. Digit. Earth, 12, 737–780, https://doi.org/10.1080/17538947.2019.1597189, 2019.
Liu, S., Xu, Z., Song, L., Zhao, Q., Ge, Y., Xu, T., Ma, Y., Zhu, Z., Jia, Z., and Zhang, F.: Upscaling evapotranspiration measurements from multi-site to the satellite pixel scale over heterogeneous land surfaces, Agric. For. Meteorol., 230, 97–113, https://doi.org/10.1016/j.agrformet.2016.04.008, 2016.
Mohan, M. M. P., Kanchirapuzha, R., and Varma, M. R. R.: Review of approaches for the estimation of sensible heat flux in remote sensing-based evapotranspiration models, J. Appl. Remote Sens., 14, 041501, https://doi.org/10.1117/1.Jrs.14.041501, 2020.
Mu, Q., Zhao, M., and Running, S. W.: Improvements to a MODIS global terrestrial evapotranspiration algorithm, Remote Sens. Environ., 115, 1781–1800, https://doi.org/10.1016/j.rse.2011.02.019, 2011.
Mueller, R. W., Matsoukas, C., Gratzki, A., Behr, H. D., and Hollmann, R.: The CM-SAF operational scheme for the satellite based retrieval of solar surface irradiance – A LUT based eigenvector hybrid approach, Remote Sens. Environ., 113, 1012–1024, https://doi.org/10.1016/j.rse.2009.01.012, 2009.
Muñoz-Sabater, J., Dutra, E., Agustí-Panareda, A., Albergel, C., Arduini, G., Balsamo, G., Boussetta, S., Choulga, M., Harrigan, S., Hersbach, H., Martens, B., Miralles, D. G., Piles, M., Rodríguez-Fernández, N. J., Zsoter, E., Buontempo, C., and Thépaut, J.-N.: ERA5-Land: a state-of-the-art global reanalysis dataset for land applications, Earth Syst. Sci. Data, 13, 4349–4383, https://doi.org/10.5194/essd-13-4349-2021, 2021.
Nemani, R. R., Keeling, C. D., Hashimoto, H., Jolly, W. M., Piper, S. C., Tucker, C. J., Myneni, R. B., and Running, S. W.: Climate-driven increases in global terrestrial net primary production from 1982 to 1999, Science, 300, 1560–1563, https://doi.org/10.1126/science.1082750, 2003.
O, S. and Orth, R.: Global soil moisture data derived through machine learning trained with in-situ measurements, Sci. Data, 8, 170, https://doi.org/10.1038/s41597-021-00964-1, 2021.
Peng, Z., Letu, H., Wang, T., Shi, C., Zhao, C., Tana, G., Zhao, N., Dai, T., Tang, R., Shang, H., Shi, J., and Chen, L.: Estimation of shortwave solar radiation using the artificial neural network from Himawari-8 satellite imagery over China, Journal of Quantitative Spectroscopy and Radiative Transfer, 240, 106672, https://doi.org/10.1016/j.jqsrt.2019.106672, 2020.
Rios, G. and Ramamurthy, P.: A novel model to estimate sensible heat fluxes in urban areas using satellite-derived data, Remote Sens. Environ., 270, 112880, https://doi.org/10.1016/j.rse.2021.112880, 2022.
Ryu, Y., Jiang, C., Kobayashi, H., and Detto, M.: MODIS-derived global land products of shortwave radiation and diffuse and total photosynthetically active radiation at 5 km resolution from 2000, Remote Sens. Environ., 204, 812–825, https://doi.org/10.1016/j.rse.2017.09.021, 2018.
Sellers, P. J., Dickinson, R. E., Randall, D. A., Betts, A. K., Hall, F. G., Berry, J. A., Collatz, G. J., Denning, A. S., Mooney, H. A., Nobre, C. A., Sato, N., Field, C. B., and Henderson-Sellers, A.: Modeling the Exchanges of Energy, Water, and Carbon Between Continents and the Atmosphere, Science, 275, 502–509, https://doi.org/10.1126/science.275.5299.502, 1997.
Sun, S., Bi, Z., Xiao, J., Liu, Y., Sun, G., Ju, W., Liu, C., Mu, M., Li, J., Zhou, Y., Li, X., Liu, Y., and Chen, H.: A global 5 km monthly potential evapotranspiration dataset (1982–2015) estimated by the Shuttleworth–Wallace model, Earth Syst. Sci. Data, 15, 4849–4876, https://doi.org/10.5194/essd-15-4849-2023, 2023.
Tang, R., Peng, Z., Liu, M., Li, Z.-L., Jiang, Y., Hu, Y., Huang, L., Wang, Y., Wang, J., Jia, L., Zheng, C., Zhang, Y., Zhang, K., Yao, Y., Chen, X., Xiong, Y., Zeng, Z., and Fisher, J. B.: Spatial-temporal patterns of land surface evapotranspiration from global products, Remote Sens. Environ., 304, 114066, https://doi.org/10.1016/j.rse.2024.114066, 2024a.
Tang, R., Wang, J., Liu, M., and Li, Z.-L.: Energy-conservation datasets of global land surface radiation and heat fluxes from 2000–2020 generated by CoSEB, National Tibetan Plateau/Third Pole Environment Data Center [data set], https://doi.org/10.11888/Terre.tpdc.302559, 2025a.
Tang, R., Wang, J., Liu, M., and Li, Z.-L.: Energy-conservation datasets of global land surface radiation and heat fluxes from 2000–2020 generated by CoSEB, Science Data Bank: Science Data Bank [data set], https://doi.org/10.57760/sciencedb.27228, 2025b.
Tang, W., Yang, K., Qin, J., Li, X., and Niu, X.: A 16 year dataset (2000–2015) of high-resolution (3 h, 10 km) global surface solar radiation, Earth Syst. Sci. Data, 11, 1905–1915, https://doi.org/10.5194/essd-11-1905-2019, 2019.
Tang, W., He, J., Qi, J., and Yang, K.: A dense station-based, long-term and high-accuracy dataset of daily surface solar radiation in China, Earth Syst. Sci. Data, 15, 4537–4551, https://doi.org/10.5194/essd-15-4537-2023, 2023.
Tang, W., He, J., Shao, C., Song, J., Yuan, Z., and Yan, B.: Constructing a long-term global dataset of direct and diffuse radiation (10 km, 3 h, 1983–2018) separating from the satellite-based estimates of global radiation, Remote Sens. Environ., 311, 114292, https://doi.org/10.1016/j.rse.2024.114292, 2024b.
Twine, T. E., Kustas, W. P., Norman, J. M., Cook, D. R., Houser, P. R., Meyers, T. P., Prueger, J. H., Starks, P. J., and Wesely, M. L.: Correcting eddy-covariance flux underestimates over a grassland, Agric. For. Meteorol., 103, 279–300, https://doi.org/10.1016/S0168-1923(00)00123-4, 2000.
van der Tol, C.: Validation of remote sensing of bare soil ground heat flux, Remote Sens. Environ., 121, 275–286, https://doi.org/10.1016/j.rse.2012.02.009, 2012.
Wang, D., Liang, S., He, T., and Shi, Q.: Estimation of Daily Surface Shortwave Net Radiation From the Combined MODIS Data, IEEE Trans. Geosci. Remote Sensing, 53, 5519–5529, https://doi.org/10.1109/tgrs.2015.2424716, 2015.
Wang, D., Liang, S., Li, R., and Jia, A.: A synergic study on estimating surface downward shortwave radiation from satellite data, Remote Sens. Environ., 264, 112639, https://doi.org/10.1016/j.rse.2021.112639, 2021.
Wang, J., Tang, R., Liu, M., Jiang, Y., Huang, L., and Li, Z.-L.: Coordinated estimates of 4 d 500 m global land surface energy balance components, Remote Sens. Environ., 326, 114795, https://doi.org/10.1016/j.rse.2025.114795, 2025.
Wang, K. C., Dickinson, R. E., Wild, M., and Liang, S.: Atmospheric impacts on climatic variability of surface incident solar radiation, Atmos. Chem. Phys., 12, 9581–9592, https://doi.org/10.5194/acp-12-9581-2012, 2012.
Wang, T., Shi, J., Ma, Y., Letu, H., and Li, X.: All-sky longwave downward radiation from satellite measurements: General parameterizations based on LST, column water vapor and cloud top temperature, ISPRS-J. Photogramm. Remote Sens., 161, 52–60, https://doi.org/10.1016/j.isprsjprs.2020.01.011, 2020.
Wang, Y., Hu, J., Li, R., Song, B., and Hailemariam, M.: Remote sensing of daily evapotranspiration and gross primary productivity of four forest ecosystems in East Asia using satellite multi-channel passive microwave measurements, Agric. For. Meteorol., 339, 109595, https://doi.org/10.1016/j.agrformet.2023.109595, 2023.
Wild, M.: Global dimming and brightening: A review, J. Geophys. Res.-Atmos., 114, D00D16, https://doi.org/10.1029/2008jd011470, 2009.
Wild, M. and Liepert, B.: The Earth radiation balance as driver of the global hydrological cycle, Environ. Res. Lett., 0, 025203, https://doi.org/10.1088/1748-9326/5/2/025203, 2010.
Wild, M., Folini, D., Schär, C., Loeb, N., Dutton, E. G., and König-Langlo, G.: The global energy balance from a surface perspective, Clim. Dyn., 40, 3107–3134, https://doi.org/10.1007/s00382-012-1569-8, 2012.
Xia, X. A., Wang, P. C., Chen, H. B., and Liang, F.: Analysis of downwelling surface solar radiation in China from National Centers for Environmental Prediction reanalysis, satellite estimates, and surface observations, J. Geophys. Res.-Atmos., 111, D09103, https://doi.org/10.1029/2005jd006405, 2006.
Xian, Y., Wang, T., Leng, W., Letu, H., Shi, J., Wang, G., Yan, X., and Yuan, H.: Can Topographic Effects on Solar Radiation Be Ignored: Evidence From the Tibetan Plateau, Geophys. Res. Lett., 51, e2024GL108653, https://doi.org/10.1029/2024gl108653, 2024.
Xu, J., Liang, S., and Jiang, B.: A global long-term (1981–2019) daily land surface radiation budget product from AVHRR satellite data using a residual convolutional neural network, Earth Syst. Sci. Data, 14, 2315–2341, https://doi.org/10.5194/essd-14-2315-2022, 2022a.
Xu, J., Liang, S., Ma, H., and He, T.: Generating 5 km resolution 1981–2018 daily global land surface longwave radiation products from AVHRR shortwave and longwave observations using densely connected convolutional neural networks, Remote Sens. Environ., 280, 113223, https://doi.org/10.1016/j.rse.2022.113223, 2022b.
Yao, Y., Liang, S., Li, X., Chen, J., Liu, S., Jia, K., Zhang, X., Xiao, Z., Fisher, J. B., Mu, Q., Pan, M., Liu, M., Cheng, J., Jiang, B., Xie, X., Grünwald, T., Bernhofer, C., and Roupsard, O.: Improving global terrestrial evapotranspiration estimation using support vector machine by integrating three process-based algorithms, Agric. For. Meteorol., 242, 55–74, https://doi.org/10.1016/j.agrformet.2017.04.011, 2017.
Yu, L., Qiu, G. Y., Yan, C., Zhao, W., Zou, Z., Ding, J., Qin, L., and Xiong, Y.: A global terrestrial evapotranspiration product based on the three-temperature model with fewer input parameters and no calibration requirement, Earth Syst. Sci. Data, 14, 3673–3693, https://doi.org/10.5194/essd-14-3673-2022, 2022.
Zhang, C., Long, D., Zhang, Y., Anderson, M. C., Kustas, W. P., and Yang, Y.: A decadal (2008–2017) daily evapotranspiration data set of 1 km spatial resolution and spatial completeness across the North China Plain using TSEB and data fusion, Remote Sens. Environ., 262, 112519, https://doi.org/10.1016/j.rse.2021.112519, 2021.
Zhang, J., Zhao, L., Deng, S., Xu, W., and Zhang, Y.: A critical review of the models used to estimate solar radiation, Renew. Sust. Energ. Rev., 70, 314–329, https://doi.org/10.1016/j.rser.2016.11.124, 2017.
Zhang, K., Kimball, J. S., Nemani, R. R., and Running, S. W.: A continuous satellite-derived global record of land surface evapotranspiration from 1983 to 2006, Water Resour. Res., 46, W09522, https://doi.org/10.1029/2009wr008800, 2010.
Zhang, X., Liang, S., Zhou, G., Wu, H., and Zhao, X.: Generating Global LAnd Surface Satellite incident shortwave radiation and photosynthetically active radiation products from multiple satellite data, Remote Sens. Environ., 152, 318–332, https://doi.org/10.1016/j.rse.2014.07.003, 2014.
Zhang, Y., Kong, D., Gan, R., Chiew, F. H. S., McVicar, T. R., Zhang, Q., and Yang, Y.: Coupled estimation of 500 m and 8 d resolution global evapotranspiration and gross primary production in 2002–2017, Remote Sens. Environ., 222, 165–182, https://doi.org/10.1016/j.rse.2018.12.031, 2019.
Zheng, C., Jia, L., and Hu, G.: Global land surface evapotranspiration monitoring by ETMonitor model driven by multi-source satellite earth observations, J. Hydrol., 613, 128444, https://doi.org/10.1016/j.jhydrol.2022.128444, 2022.