the Creative Commons Attribution 4.0 License.
the Creative Commons Attribution 4.0 License.
 | 15 Jan 2026
Remapping carbon storage change in retired farmlands on the Loess Plateau in China from 2000–2021 in high spatiotemporal resolution
Bingqian Guo
Mingjie Fang
Leilei Yang
Tao Guo
Chuang Ma
Xiangyun Hu
Zhaoxiang Guo
Zemeng Ma
Qiang Li
Zhaoli Wang
Weiguo Liu
The soil organic carbon pool is a crucial component of carbon storage in terrestrial ecosystems, playing a key role in regulating the carbon cycle and mitigating atmospheric CO2 concentration increases. To combat soil degradation and enhance soil organic carbon on the Loess Plateau, the Grain-for-Green Program (GFGP) has been implemented. Accurately quantifying change in soil organic carbon stock (ΔSOC) resulting from farmland retirement is essential for informing land use management. In this study, the spatial and temporal distribution of retired farmlands on the Loess Plateau was analyzed using Landsat imagery from 1999–2021. To assess the effects of the years since retirement, climate, soil properties, elevation, and other factors on ΔSOC, climate-zone-specific multivariable linear regression models were developed based on field-sampled soil data. These models were then used to map ΔSOC across the retired farmlands. Results indicated that a total of 39 065 km2 of farmland was retired over the past two decades, with 45.61 % converted to grasslands, 29.75 % to shrublands, and 24.64 % to forestlands. The years since retirement showed a significant positive correlation with ΔSOC, and distinct models were developed for different climatic zones to achieve high-resolution (30 m) ΔSOC mapping. The total ΔSOC from retired farmland on the Loess Plateau was estimated at 21.77 Tg in carbon equivalent, with grasslands contributing 81.10 %, followed by forestlands (11.16 %) and shrublands (7.74 %). The associated datasets are freely available at 30 m resolution from 2000 to 2021 (Yang, 2025, https://doi.org/10.6084/m9.figshare.28785971).
- Article
(4104 KB) - Full-text XML
-
Supplement
(1240 KB) - BibTeX
- EndNote


Soil organic carbon (SOC), as the largest terrestrial ecosystem carbon pool, plays a crucial role in regulating climate change (Mir et al., 2023). Global SOC was estimated at approximately 1400–1500 Pg C, about four times the organic carbon pool of terrestrial plants (Scharlemann et al., 2014). The high SOC is essential to support multiple ecological benefits, such as purifying water, increasing crop yields and maintaining primary productivity (Paustian et al., 2019). Currently, soil in the world is degraded, causing many socioeconomic (e.g., unemployment, poverty, immigration) and environmental (e.g., desertification, ecosystem degradation, biodiversity loss) issues (Ferreira et al., 2022; Ouyang et al., 2016). The large area of degraded soil also released more than 50 Pg carbon annually into the atmosphere which conflicts with the decarbonization target for mitigating global warming (Prăvălie et al., 2021). Therefore, restoring degraded soil is urgently needed for sustainable development and environment security.
Ecological restoration by nature alone is a lengthy process. Under the urgent need for restoring degraded soils and mitigating climate change, scientific management measures are necessary to accelerate the ecosystem restoration process (Lengefeld et al., 2020; Pape, 2022; Wang et al., 2021a). Many large-scale ecological restoration strategies around the world have showed encouraging ecological benefits. Brazil's Atlantic Forest Restoration Pact (AFRP) was established in 2009, and Argentina and Paraguay joined the impressive project in 2018, forming the Atlantic Forest Restoration Tri-national Network (Calmon et al., 2011). Hundreds of organizations have been actively involved in this decade-long efforts to protect and restore the forests, which recovered about 7000 km2 forests and enhanced regional biodiversity (De Oliveira Faria and Magrini, 2016). Forests established by restoration in this project between 2010 and 2015 would have sequestered 1.75 Pg carbon if they were not re-cut (Piffer et al., 2022). The Development Project “Green Great Wall” in Africa was launched by the African Union in 2007, aiming at restoring savannahs, grasslands and farmlands across Africa to help biodiversity cope with climate change and desertification. The goals of the project are to restore 1 million km2 forests in 2030 and sequester 250 Tg C (Graham, 2022; Macia et al., 2023). China has started ecological restoration practices and researches since the 1970s, and has implemented six national key ecological restoration projects (Cui et al., 2021). Among the projects, the Grain-for-Green Program (GFGP) is one of the most ambitious projects in the world with the highest investment and the largest implemented area (Xu et al., 2022). From 1999–2019, the GFGP implemented in 25 provinces and exceeded 0.343 million km2 land area with 49 Tg sequestered carbon, indicating a significant potential of SOC stock by ecological restoration (Lu et al., 2018). Based on Deng et al.'s (2017) study, the total carbon stock in the GFGP implemented area was 682 Tg C in 2010, and projected to 1697 Tg C in 2020.
One of the primary area of the GFGP is the Loess Plateau, because the long-term indiscriminate cultivation and logging on the Loess Plateau has caused over 40 % of the total area (about 270 000 km2) in severe soil erosion and a significant loss of SOC (Shao et al., 2022). As the implementation of the GFGP, 96.1 Tg C was sequestered from 2000–2008 on the Loess Plateau (Feng et al., 2013; Xiao, 2014). Nonetheless, current estimations of SOC stock still have large uncertainties due to the technology and data limits (Zhang et al., 2022). On the Loess Plateau, the accumulation of SOC can be affected by many untested factors, such as ecosystem types and years since retirement. Moreover, most of the studies fail to differentiate the carbon sequestration between retired and currently cultivated farmlands, and caused an overestimate of SOC stock. Therefore, a more reliable estimation should be reached to quantify the benefit in SOC stock of the retired farmlands with the consideration of those issues (Deng et al., 2017; Sun et al., 2016).
While previous studies have confirmed the overall increasing trend of SOC changes following farmland retirement, significant uncertainties persist due to limited spatial resolution and insufficient temporal coverage. Existing datasets fail to provide the continuous spatiotemporal dynamics of retired farmland distribution on the Loess Plateau (Xu et al., 2018; Yang and Huang, 2021; Bai et al., 2024). Furthermore, existing SOC assessments (Li et al., 2020; Yi et al., 2023) lack the capacity to quantify fine-scale differences in SOC stock between retired and cultivated farmlands (ΔSOC). They also fail to capture the year-by-year dynamics of retired farmlands and SOC accumulation in high resolution by considering the heterogeneity of the Loess Plateau. To address these gaps, this study aims to: (1) reconstruct annual farmland retirement patterns (2000–2021) using multi-source remote sensing data; (2) develop a high-resolution ΔSOC model integrating terrain, climate and vegetation covariates based on the difference in SOC stock between retired and adjacent cultivated farmlands; and (3) generate 30 m resolution ΔSOC maps to quantify the impact of GFGP on carbon sequestration. Our spatially explicit approach provides unprecedented insights for optimizing ecological restoration strategies in heterogeneous landscapes.
2.1 Study Area
The Loess Plateau ( E, N) is located in the north central part of China (Fig. 1a), in the middle reaches of the Yellow River, with a sensitive and fragile ecological environment, belonging to the warm temperate continental monsoon climate, characterized by dry and cold in spring and winter, warm and hot in summer and autumn. The average annual temperature is 3.6–14.3 °C. The average annual precipitation is 400–600 mm, of which is concentrated between July and September, and decreases from east to west and south to north (Zhou et al., 2016). The annual evaporation is 1400–2100 mm, with a trend of low in the south and east, high in the north and west. The elevation is 800–3000 m, and the original surface vegetation mostly is grassland, shrubland, deciduous broadleaf forest, and mixed broadleaf-conifer forest (Zhou et al., 2016). The total area of the Loess Plateau is 635 000 km2, including Shanxi, Ningxia, Shaanxi, Gansu, Qinghai, Inner Mongolia, Henan provinces. The main terrain is hilly and gully, with soft loessial soil texture.
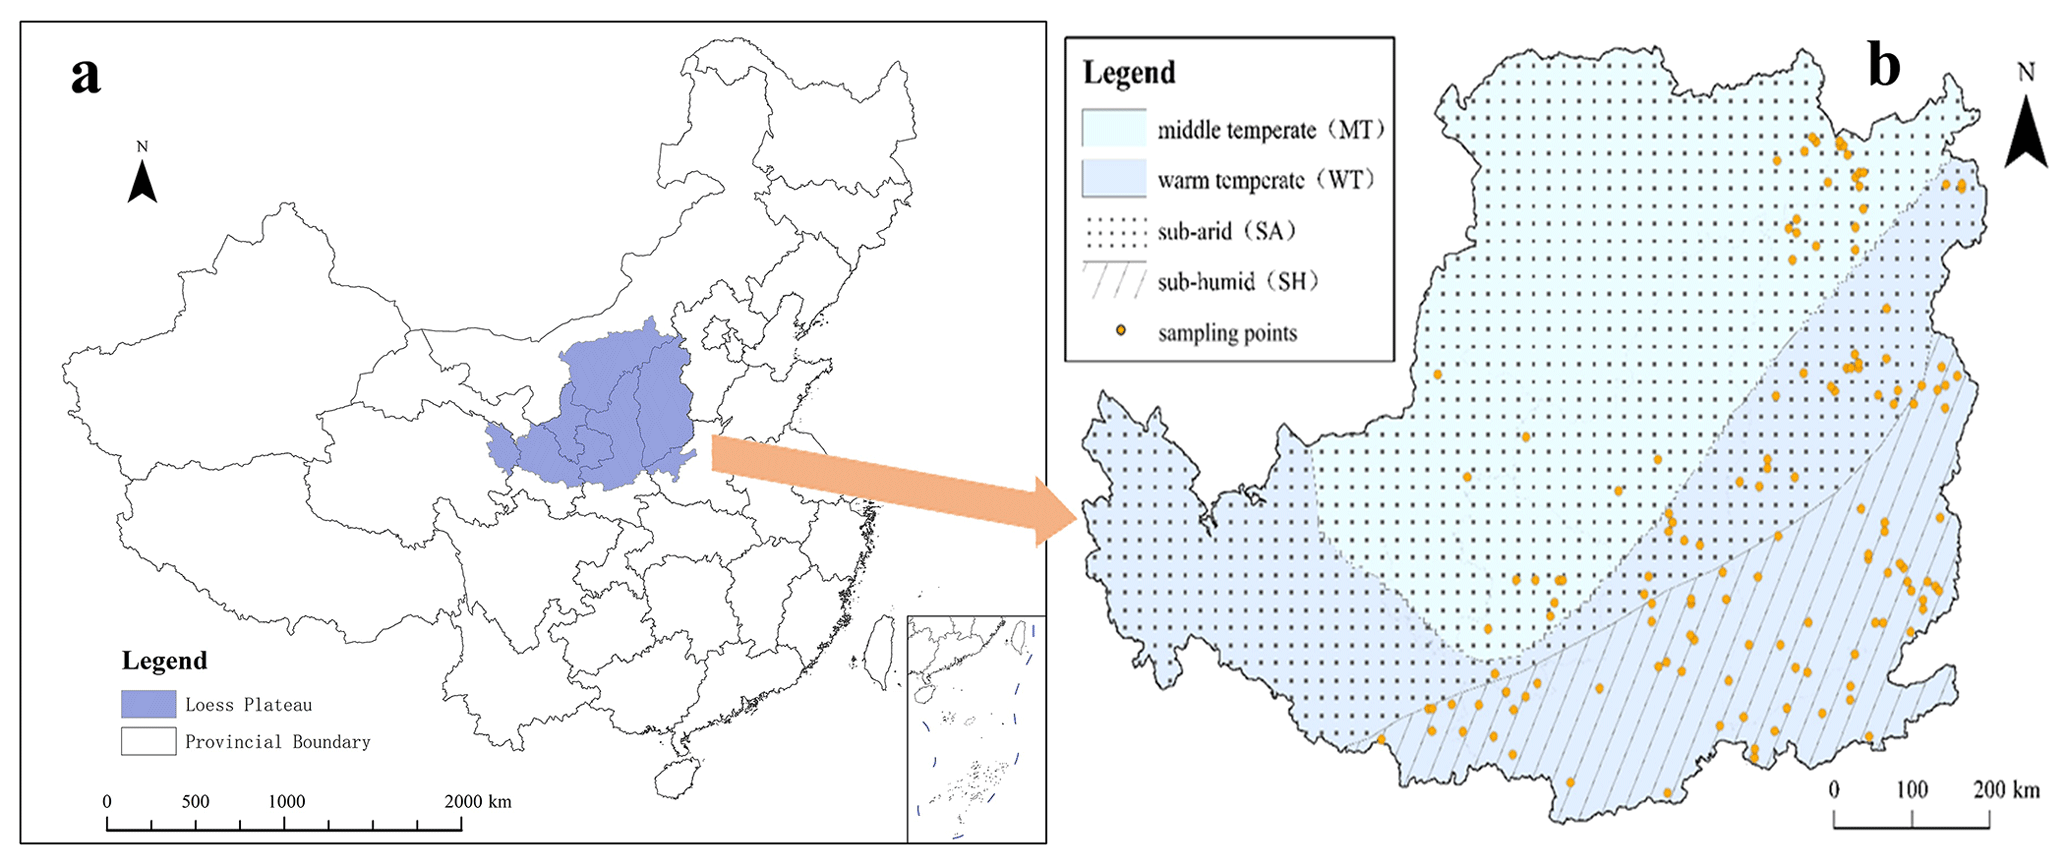
Figure 1The map of the study area, (a) location, (b) soil sampling sites and climatic zones.
2.2 Identifying Retired Farmlands
To identify and confirm the spatial range of the annual retired farmlands on the Loess Plateau, Landsat remote sensing images (30 m resolution) from 1999–2021 were downloaded from the United States Geological Survey (USGS, https://EarthExplorer.usgs.gov, last access: 20 August 2022). The images with less cloud (lower than 10 %) in growing season (from May to September) were selected for further analysis. Those images were processed by the standard steps recommended by ArcGIS Pro 2.8 (Environmental Systems Research Institute, Inc., ESRI), including preprocessing, image classification and validation. To improve image readability, remote sensing images were first preprocessed in ENVI 5.3, including radiometric calibration, FLAASH (Fast Line-of-sight Atmospheric Analysis of Spectral Hypercubes) atmospheric correction, gram-schmidt pan sharpening, seamless mosaic and subset data from ROIs (regions of interest). The image classification was then performed in ArcGIS Pro 2.8. In this study, we used the support vector machine (SVM) supervised classification method to classify the land cover types into the following seven categories: farmland, forestland, grassland, shrubland, water body, building land, and bare land. Training samples were selected through visual interpretation of high-resolution imageries and systematically managed using a training sample manager. A total of 23 100 ROI samples were used for model training, with an additional 6930 independent ROIs reserved for validation. During the accuracy assessment phase, the classification performance over the study period consistently achieved kappa coefficients ranging from 0.76–0.90 and overall accuracy values between 0.80 and 0.91. The average accuracies for different land cover types were as follows: farmland (0.71), forestland (0.87), grassland (0.86), shrubland (0.92), water body (0.97), building land (0.92), and bare land (0.87).
2.3 Field Sampling and SOC Measurements
To determine the ΔSOC in ecosystems established on retired farmlands, we implemented a systematic sampling design based on spatial proximity principles. Initial sample sites were systematically generated at 5 km intervals across the retired farmland distribution map (Fig. 1b), forming a comprehensive grid framework. For each retired farmland point, we identified the nearest long-term cultivated farmland counterpart to create a spatially paired sampling site. The sampling strategy incorporated stratification across different ecosystems, climatic zones, and years since retirement. To minimize human interference, we pre-screened all potential sites using ultra-high resolution imagery (0.5 m) to exclude areas near roads, villages, or irrigation ditches. Additional considerations included accessibility and sampling feasibility, leading to the exclusion of 133 site pairs from initial design to field implementation. Finally, 2430 soil samples from 135 sample sites were collected from fields. Nine soil samples (three 10 cm layers from top 30 cm soil in 3 sample points) were collected for every sample site, and nine soil samples from the nearest farmlands were also collected similarly. Each soil sample was individually bagged, labeled, and stored in cold storage for lab measurement. After drying and grinding through a sieve at 0.25 mm, SOC of each soil sample was measured by potassium dichromate external heating method. The difference in total SOC stock of the top 30 cm soil layer between retired farmlands and the nearest cultivated farmlands was defined as ΔSOC that contributed by the GFGP.
2.4 Model Development and ΔSOC Mapping on the Loess Plateau
ΔSOC is influenced by both natural environmental conditions and human activities, leading to variations across different climatic conditions of the Loess Plateau. Therefore, we developed different models based on the relationships between ΔSOC and variables such as years since retirement, geographic location, elevation, soil bulk density (BD), and 19 bioclimatic factors. Years since retirement were obtained from the annual spatial distribution data in retired farmlands on the Loess Plateau (Sect. 2.2). The data sources for climate information can be found in Sect. 2.5. The 19 bioclimatic factors were derived by following the formula in WorldClim (https://worldclim.org/data/index.html, last access: 12 January 2022). For every grid cell of retired farmlands, the bioclimatic factors were calculated as the average of the years since retirement. All the variables were extracted to the sample sites by the Kriging interpolation and prepared for model development.
Based on the factors introduced above, we combined ANOVA, single-factor regression, all subset regression and stepwise regression to select variables for multivariate linear models of ΔSOC. The steps included: data preprocessing, univariate analysis, multivariate analysis, model evaluation, and diagnostic checks. Finally, several key variables that co-occurred were selected. In consideration of wide climatic range on the Loess Plateau and different possible response of ΔSOC to the factors among climatic conditions (Zhang et al., 2018), we divided the Loess Plateau into different climatic zones for different ecosystem types (e.g., forestland, shrubland, grassland) based on climate regionalization in China–Climatic zones and climatic regions (GB/T 17297-1998) and climate data (Sect. 2.5). As Fig. 1b shows, we obtained middle temperature zone (MT, <8 °C) and warm temperate zone (WT, >8 °C) by the annual average temperature, and semi-arid zone (SA, <400 mm) and sub-humid zone (SH, >400 mm) by annual precipitation. In addition, five combined climatic zones were obtained: MT-SA (same as MT), WT-SA, WT-SH (same as SH), WT, and SA. A multivariate linear regression model was developed specifically for each ecosystem types in each climatic zone. Before regression analysis, diagnosis of multicollinearity is conducted, and the threshold is generally set at 10 to detecting correlations between the independent variables and identify those independent variables that were incorrectly included in the same regression model. The regression models were evaluated and validated by residual analysis, significance level (p-value), coefficient of determination (R2), root mean square error (RMSE) and mean absolute error (MAE), and the robustness of the models were validated by leave one out-cross-validation. Statistical power analysis indicates that the current stratified sampling design provides adequate power for detecting medium to large effects, though sensitivity for detecting small effects remains limited. Model robustness under this design is rated as “acceptable”.
Based on the results of model evaluation, the final selected models were used to estimate the overall ΔSOC of retired farmlands on the Loess Plateau. With the final selected multivariate linear regression models, the ΔSOC in the top 30 cm soil layer were mapped by raster calculation in different climatic zones and ecosystem types at 30 m resolution. And the total ΔSOC on the Loess Plateau contributed by the GFGP was obtained by summing up the ΔSOC in all the retired farmlands without recultivation within the study period.
2.5 Data Sources
The air temperature and precipitation data to calculate the 19 bioclimatic factors were from the China Meteorological Data Service Center (CMDC, http://www.geodata.cn, last access: 13 July 2023). Elevation data of every grid cell were from the Digital Elevation Model database (https://e4ftl01.cr.usgs.gov/MEASURES/, last access: 14 July 2023). Soil properties were retrieved from Harmonized World Soil Database (HWSD, https://www.fao.org/soils-portal/soil-survey/soil-maps-and-databases/harmonized-world-soil-database-v12/en/, last access: 14 July 2023), and the boundary of the Loess Plateau was downloaded from the Resource and Environment Science and Data Center (https://www.resdc.cn/, last access: 15 January 2022). All the raster data were resampled to 30 m resolution.
3.1 Distribution of Retired Farmlands
From 1999–2021, the final retired farmlands without recultivation on the Loess Plateau was 39 065 km2 (Fig. 2a). The final retired farmlands were less than the area by summing up annually retired farmlands because of frequent recultivation (Fig. 3a). The annual area of retired farmlands has been fluctuating throughout the study period with no significant trend (Figs. 2a–f and 3b). The least amount of retired farmlands occurred in 2002 (28 003 km2; 4.41 % of the whole studied area), and the most was 78 653 km2 in 2016 (12.39 % of the whole studied area). The retired farmlands were converted to different vegetation types, including forestlands, shrublands and grasslands. The ratios of different vegetation types in every year were in the ranges of 10.65 %–38.60 %, 14.63 %–47.70 % and 17.02 %–64.98 % for forestlands, shrublands and grasslands, respectively (Fig. 3b). Within the studied period in average, most of the retired farmlands were converted to grasslands (45.61 %) and shrublands (29.75 %).
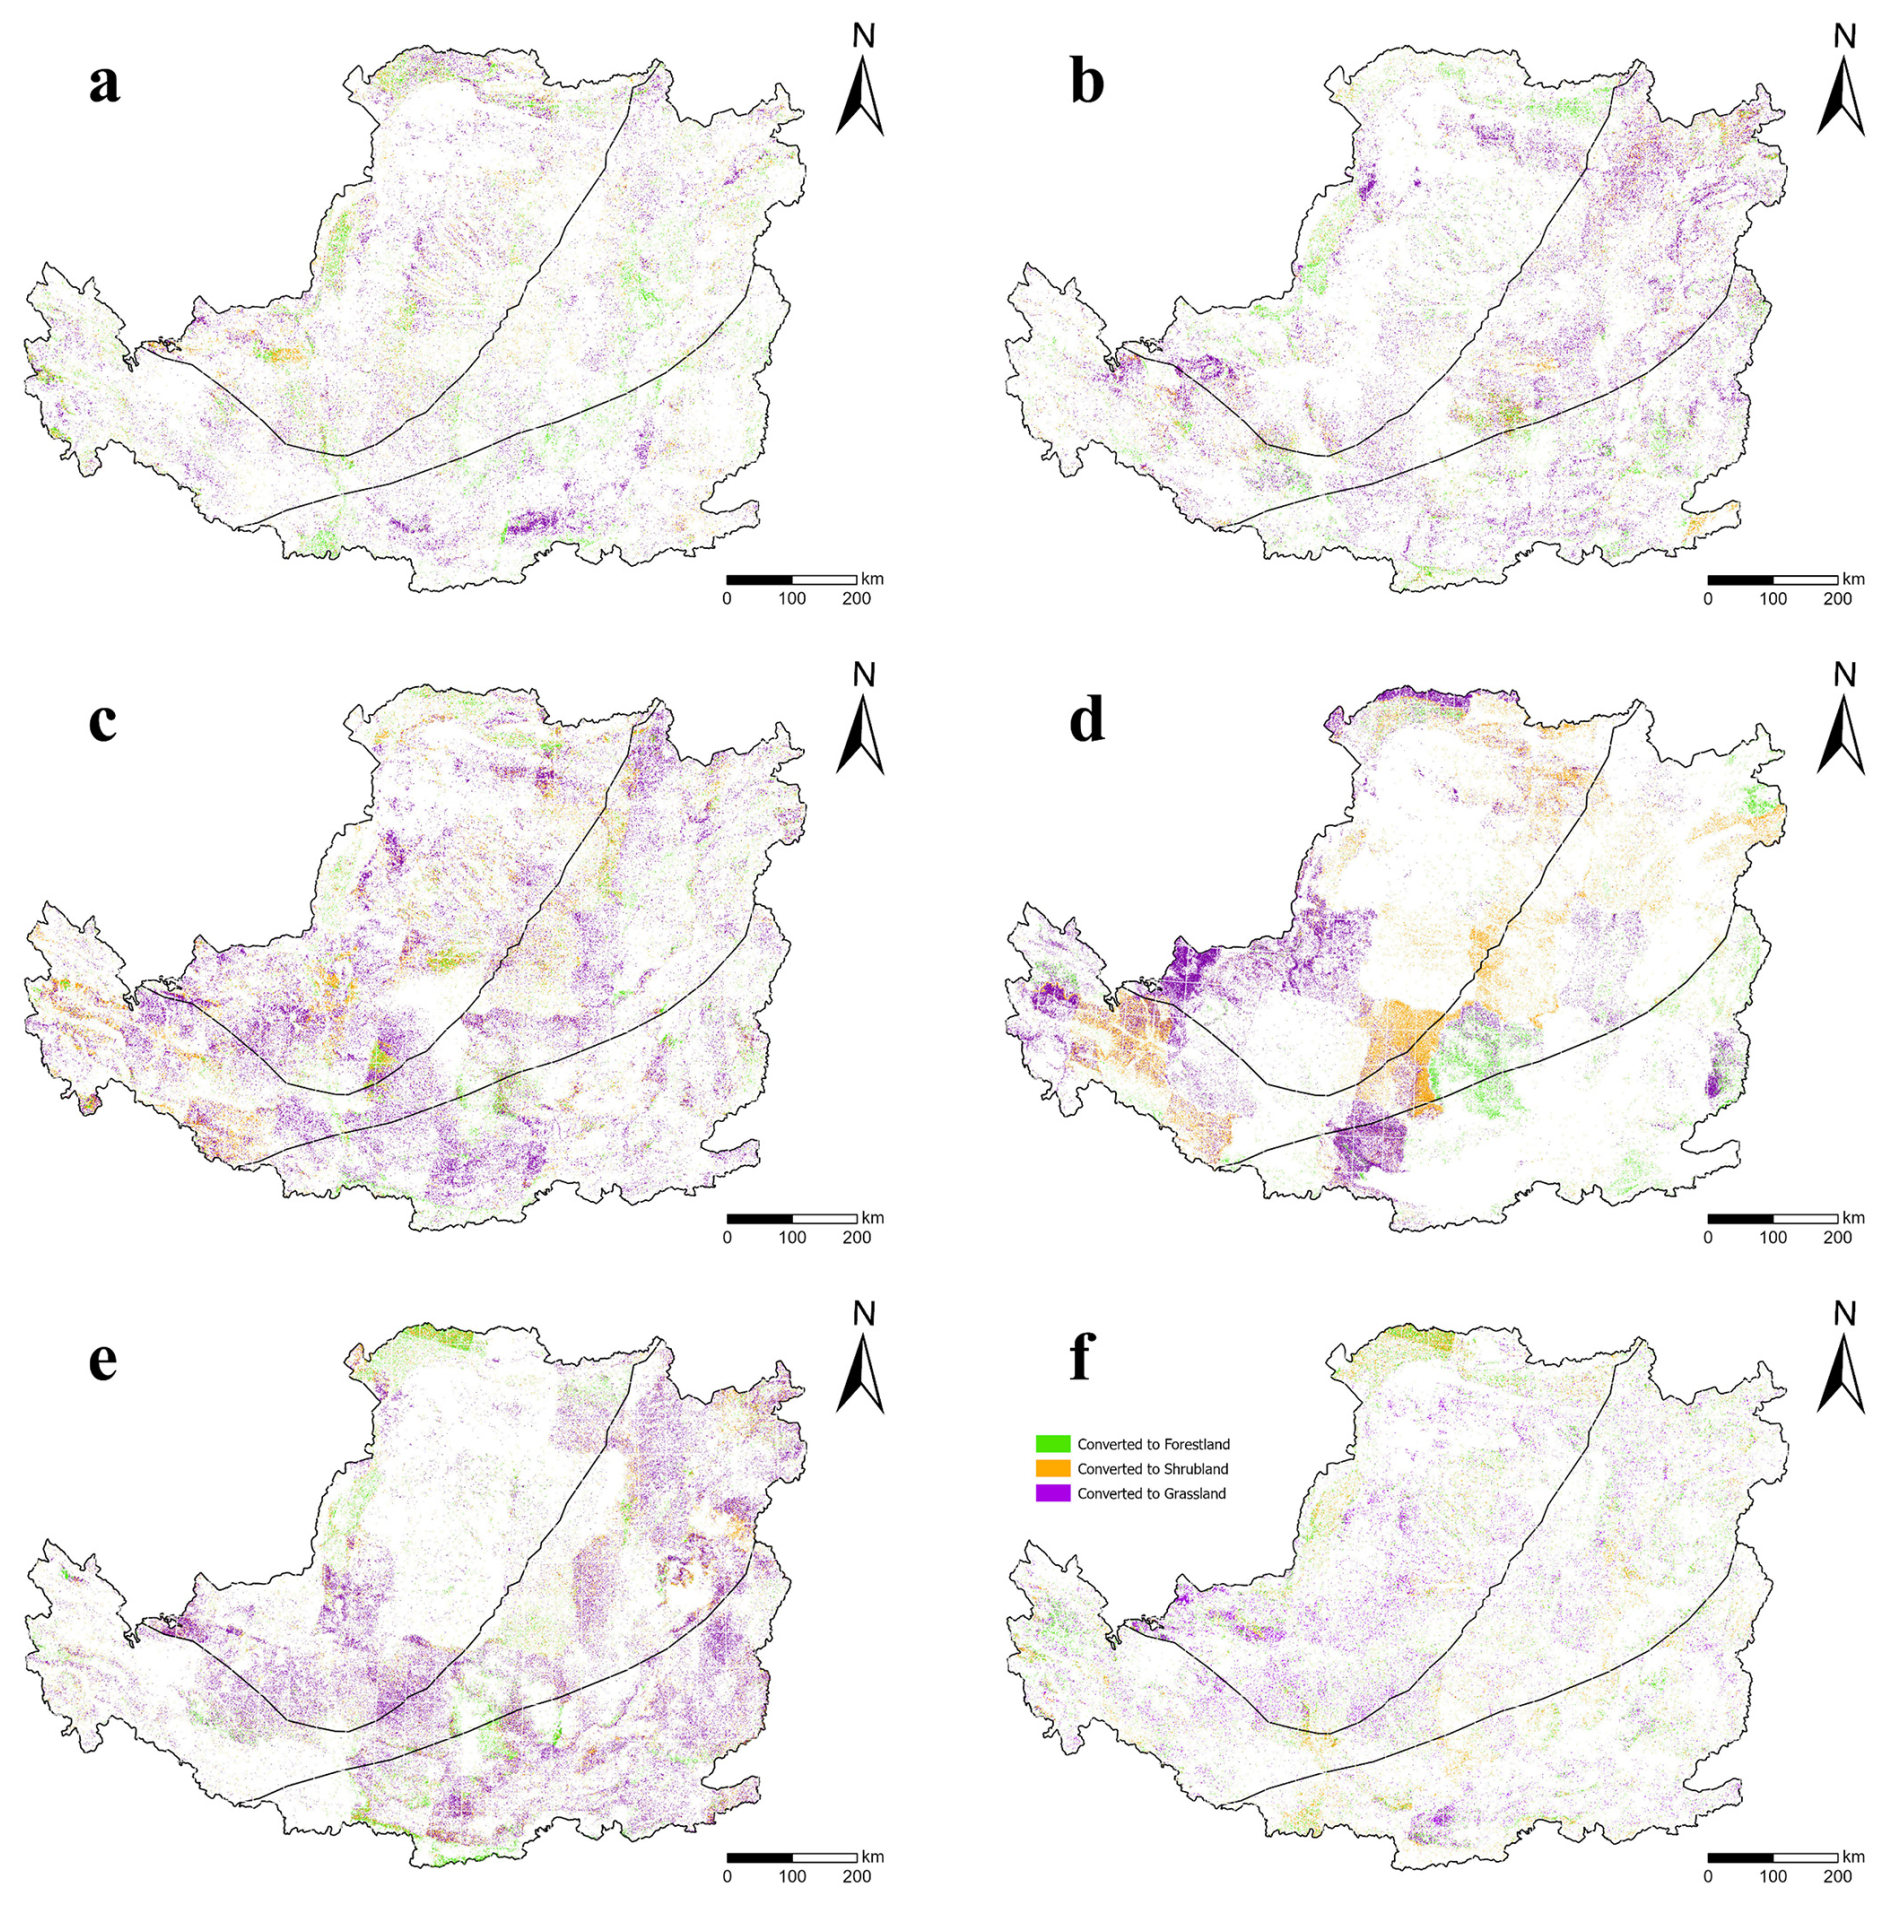
Figure 2Spatial distribution of annually retired farmlands on the Loess Plateau in (a) 2000, (b) 2005, (c) 2010, (d) 2015, (e) 2021, and (f) cumulative retired farmlands from 1999–2021.
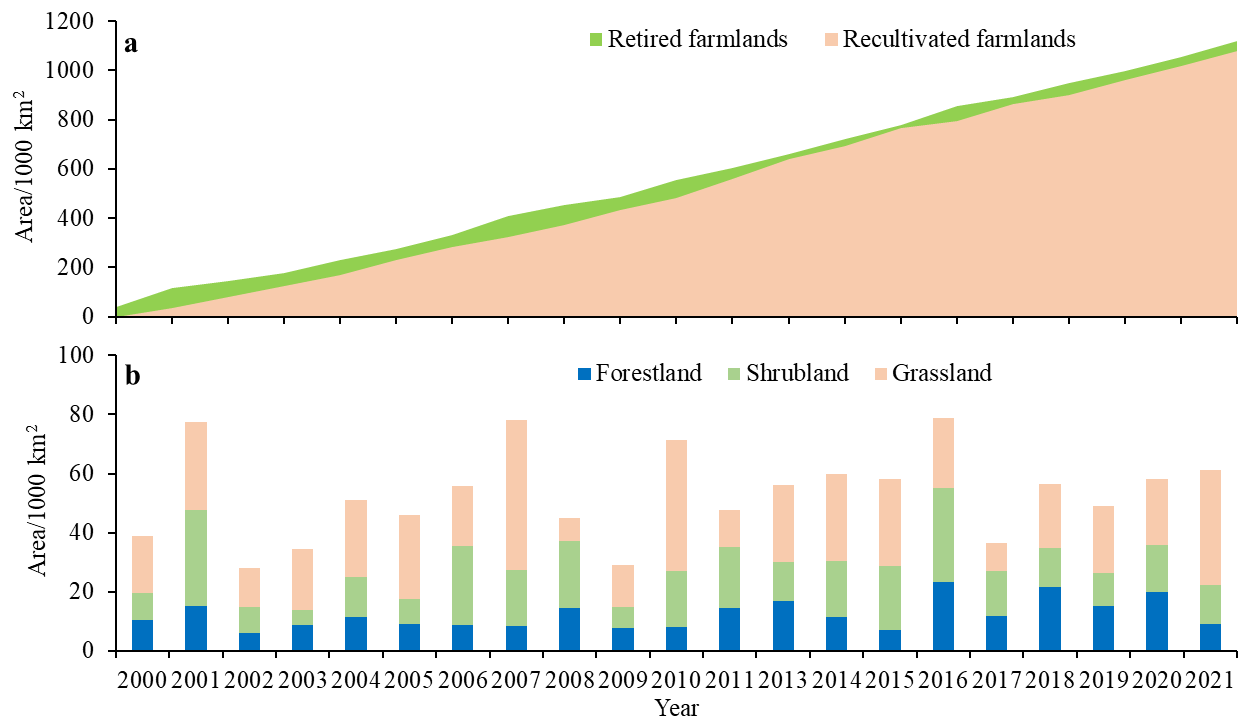
Figure 3(a) Cumulative retired farmlands and recultivated farmlands and (b) Annual area of different vegetation types from retired farmlands from 2000–2021.
The annual retired farmlands were unevenly distributed among different climatic zones (Fig. 2a–f). The annual retired farmlands in the other years can be found in Fig. S1a–p in the Supplement. For the final retired farmlands, the area in MT-SA, WT-SA and WT-SH were 20 299, 10 572 and 8194 km2, respectively. In the MT-SA zone, the dominant ecosystem type from retired farmlands was grasslands which had 9705 km2 (47.81 %), and followed by shrublands (5887 km2, 29.00 %) and forestlands (4707 km2, 23.19 %). In the WT-SA zone, grasslands were also the dominant ecosystem type which accounted for 4925 km2 (46.59 %), and forestlands accounted the least (2384 km2, 22.55 %). In the WT-SH zone, the percentages of different ecosystem types were 30.96 %, 30.16 % and 38.88 % for forestlands, shrublands and grasslands, respectively.
Among different years (Figs. 2a–f and S1), the highest areas for each ecosystem type were forestlands in the WT-SH zone in 2016 (12 846 km2), shrublands in the MT-SA zone in 2001 (15 441 km2), and grasslands in the MT-SA zone in 2007 (26 171 km2). The lowest areas were found in 2019 for forestlands in the WT-SA zone (813 km2), in 2013 for shrublands in the WT-SH zone (271 km2), and in 2013 for grasslands in the WT-SH zone (806 km2).
Among provinces, the retired farmlands in different years had significant differences (Table S1 in the Supplement), where Shanxi Province had the most in 2016 (30 912 km2) and Qinghai Province had the least in 2017 (438 km2). The final retired farmlands from 1999–2021 was the most in Inner Mongolia Province (8626 km2) and the least in Henan Province (739 km2). More forestlands could be found in warmer and wetter regions. The largest forestlands (15 073 km2) were found in Shanxi Province in 2016, while the least were found in Qinghai Province in 2016 (34 km2).
3.2 Analysis of Soil Samples
The results of soil samples showed that the SOC stock were 2.19–62.70 g C kg−1 in retired farmlands, and 2.25–63.83 g C kg−1 in adjacent cultivated farmlands. The average SOC were the highest in forestlands (4.84–62.70 g C kg−1), followed by shrublands (2.62–54.72 g C kg−1) and grasslands (2.19–21.83 g C kg−1). The average ΔSOC of the all sample points was 2.86 g C kg−1, with a standard error of 1.17 g C kg−1, and a 95 % confidence interval of [0.56, 5.15] g C kg−1. The findings indicated that the farmland retirement had significantly increased the SOC stock. To facilitate the ΔSOC estimation by area, we converted the SOC stock to area based content by soil bulk density. The highest value of ΔSOC after retirement was from forestlands in the SH zone (26.52 kg C m−2) and the lowest value was from sample in grasslands in the WT zone (0.91 kg C m−2). Forestlands and shrublands had significantly increased the SOC stock by 48.53 % and 20.34 %, respectively (p<0.05, Fig. 4a). Among different climatic zones (Fig. 4b), forestlands in the SA zone had the biggest increase (58.80 %), and followed by forestlands in the SH zone (44.53 %) and shrublands in the MT-SA zone (26.74 %).

Figure 4SOC stocks in farmlands and retired farmlands (kg C m−2), (a) Comparison of SOC stocks on the Loess Plateau in farmlands retired to different ecosystem types (forestland, shrubland, grassland) with those in adjacent cultivated farmlands, and letters a and b are labeled to indicate significant differences in the ANOVA. (b) Comparison of different climatic zones are emphasized.
Note: 1-forestlands in the SH zone, 2-forestlands in the SA zone, 3-shrublands in the WT-SH zone, 4-shrublands in the WT-SA zone, 5-shrublands in MT-SA the zone, 6-grasslands in the WT zone, and 7-grasslands in the MT zone; Letters a, b and ab are labeled to indicate significant differences in the ANOVA, for same ecosystem in Fig. 1a and for same climatic zone combination Fig. 1b.
The ΔSOC of different ecosystem types in different climatic zones had significant relationship to the years since retirement (Fig. 5). The ΔSOC was negative in the first few years and significantly increased as the years since retirement increases, except forestlands in the SA zone and shrublands in the MT-SA zone. Most of the relationships indicated constant increase in ΔSOC except ΔSOC in grasslands in the MT zone which had a saturation point after 15 yrs of retirement.
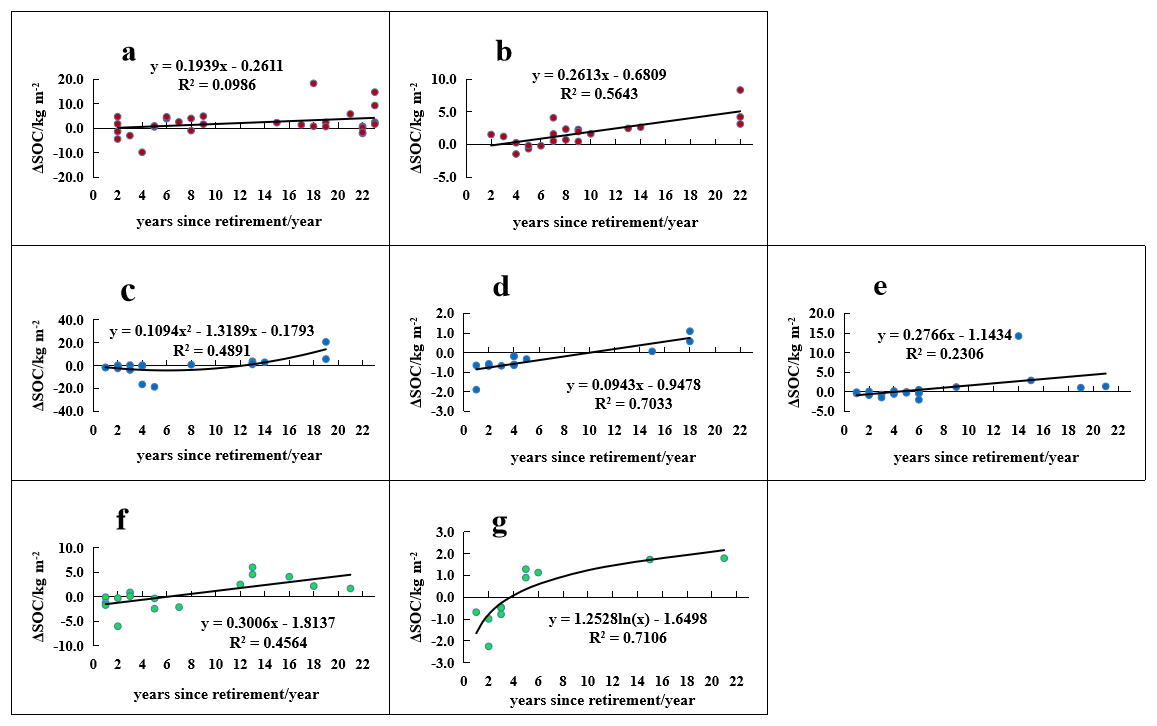
Figure 5Relationship between years since retirement and ΔSOC, (a) forestlands in the SH zone, (b) forestlands in the SA zone, (c) shrublands in the WT-SH zone, (d) shrublands in the WT-SA zone, (e) shrublands in the MT-SA zone, (f) grasslands in the WT zone, (g) grasslands in the MT zone.
3.3 Models of ΔSOC
Samples for different ecosystem types were divided by different combinations of climatic zones to find the final selected models by Backward Stepwise Regression. All variance inflation factor (VIF) diagnostic results were below the threshold of 10, including years since retirement, latitude, longitude, elevation, soil bulk density, and bioclimatic variables BIO1 to BIO19. The final selected models of ΔSOC in different ecosystem types were shown in Table 1 based on the results of evaluation and validation. In this table, t is the years since retirement, lat is latitude, ele is elevation, BD is soil bulk density, and BIO1–BIO19 are 19 bioclimatic factors, n is sample sizes at each level.
The analysis showed that seven regression equations were the final acceptable representative for the ΔSOC on the Loess Plateau when the study area was divided into SH and SA zones for forestlands, WT-SH, WT-SA and MT-SA zones for shrublands, and WT and MT zones for grasslands. The coefficients of determination (R2) ranged from 0.476–0.830 with p<0.05, The models with the highest R2 were obtained for grasslands (0.830 in the WT zone and 0.790 in the MT zone), and the model with the lowest R2 was for shrublands in the MT zone (0.476).
Table 1Models of the ΔSOC in retired farmlands on the Loess Plateau.

3.4 Mapping ΔSOC
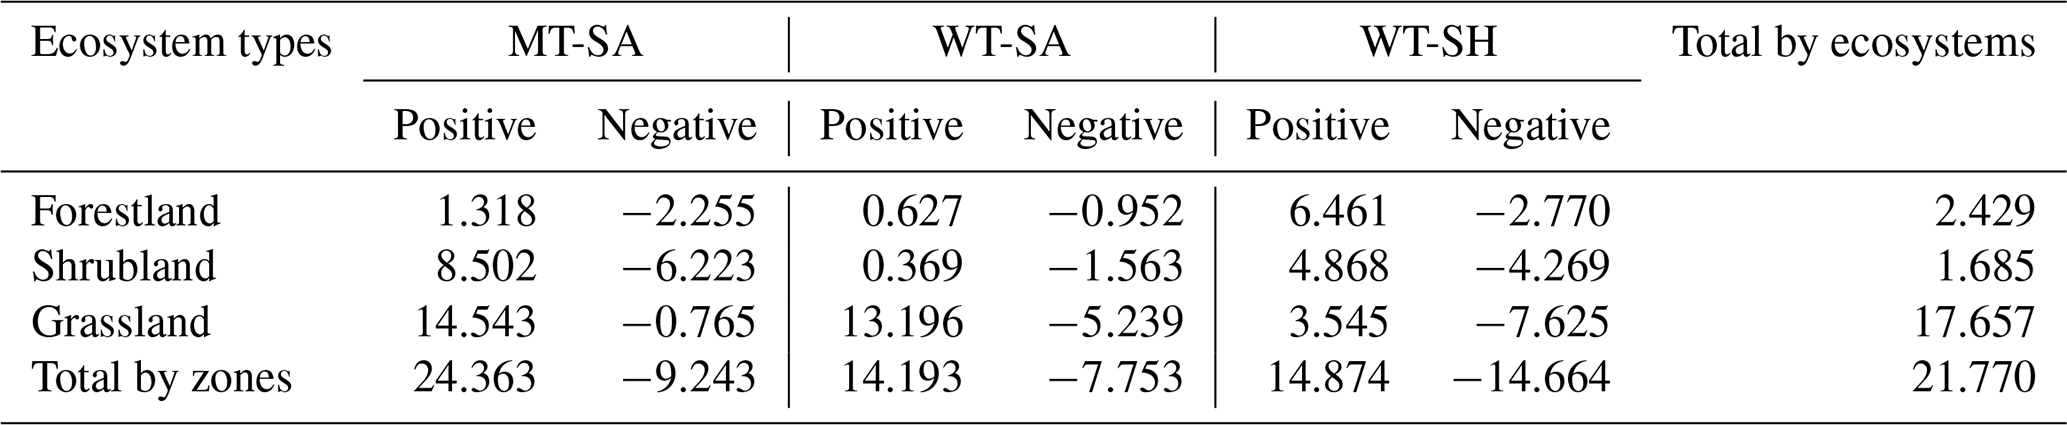
According to the regression models for ΔSOC and the distribution of retired farmlands, the ΔSOC in the retired farmlands on the Loess Plateau was quantified throughout the GFGP implementation period, excluding recultivated farmlands (Fig. 6a). The total benefit in ΔSOC on the Loess Plateau till 2021 was 21.77 Tg C with a range between −26.52 and 31.91 kg C m−2 at 30 m raster level. Significant variations in ΔSOC were observed across different ecosystem types (Fig. 6b and Table 2). To provide detailed and vegetation-specific insights, Table 2 presents ΔSOC values for three climatic zone combinations associated with each vegetation type. Grasslands contributed the most ΔSOC increment (17.657 Tg C). Among the different climatic zones for grasslands, MT zone contributed the most (78.04 %, ), followed by WT zone (21.96 %, ). Forestlands contributed the second largest ΔSOC (2.429 Tg C) with 151.96 % from SH zone (), and −51.96 % from SA zone (). The shrublands only contributed 7.74 % of the total benefit in ΔSOC (1.685 Tg C) with 78.04 % from MT-SA zone (), 45.07 % from WT-SA zone () and −23.11 % from WT-SH zone ().
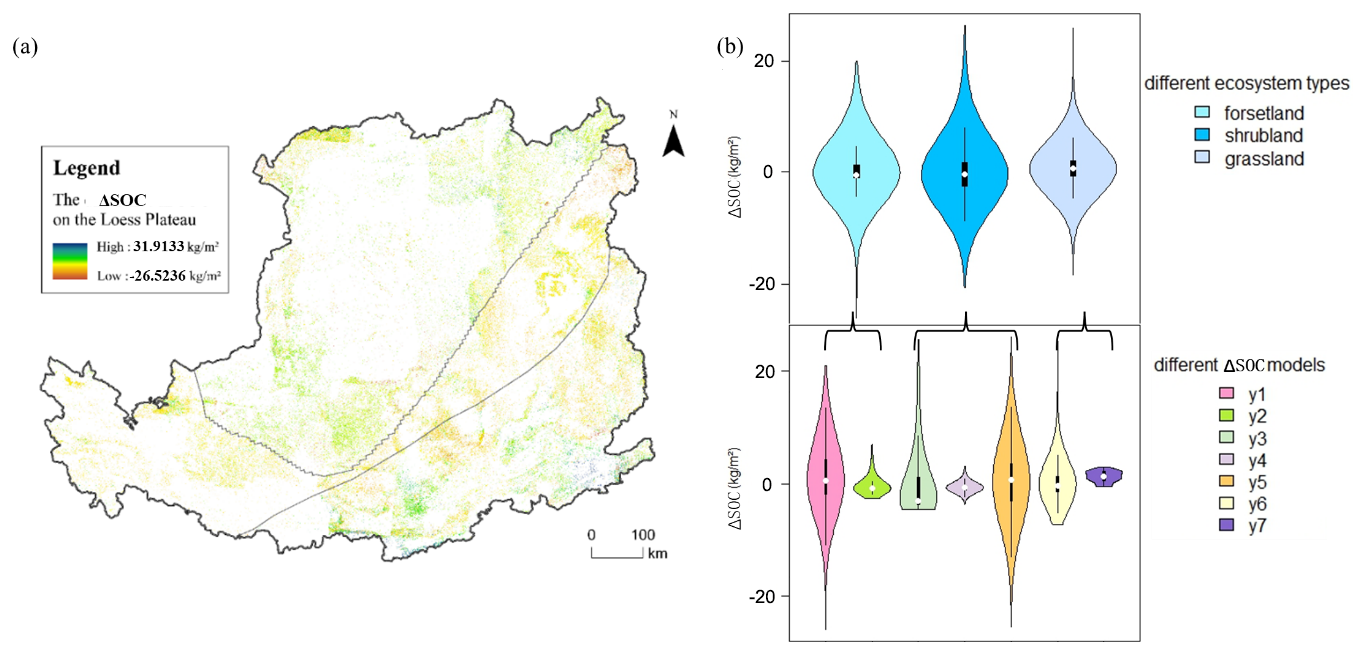
Figure 6Spatial distribution of the ΔSOC, (a) the distribution in the whole study area, and (b) raster level frequency of ΔSOC.
Table 2The ΔSOC (positive and negative portion) in retired farmlands in different ecosystem types in different climatic zones (Tg C).
The potential ΔSOC by different provinces also changed significantly, but the potential ΔSOC in different ecosystem types by the same provinces were evenly changed (Table S3 in the Supplement). ΔSOC increased more in Shanxi and Shaanxi provinces, followed by Henan, Gansu, Inner Mongolia and Ningxia, and less in Qinghai province.
4.1 Distribution of Retired Farmlands
In consideration of the topographic complexity and vegetational variation on the retired farmlands, a large-scale retrieve of retired farmland information from remote sensing images is challenging (Wei et al., 2021). For instance, farmlands and grasslands have similar spectrum characteristics in spring and summer seasons and can be easily confounded (Estel et al., 2015), which lead to inaccuracy in remote sensing image classification. The inaccuracy can be minimized by comparing with multi-source high-resolution remote sensing images (Yan et al., 2023). In this study, although different vegetation types were involved on the retired farmlands (e.g., forestland, shrubland and grassland), the accuracy in identifying retired farmlands could high to 90 % by combining visual interpretation of Landsat dataset, field observation, globeland30 database, and ultra-high resolution images from Google Earth.
Farmland retirement is the main land use change driver on the Loess Plateau. As classified in this study, retired farmlands on the Loess Plateau from 2000–2021 are unevenly distributed across different climatic zones, because of the significant hilly and gully terrain in the study area (Huang et al., 2007; Wen et al., 2015). We focused on forestlands, shrublands and grasslands from retired farmlands, and noticed that most forestlands were distributed in the SH zone due to higher precipitation than the SA zone. Grasslands were more distributed in the MT zone than in the WT zone, due to the temperature in the MT zone being more favorable for grasses than in the WT zone, and people may be more engaged in pastoral activities in the WT zone. Shrublands were more distributed in the MT-SA zone than in the WT-SH zone because the WT-SH zone is more suited to forest growth, thus having high percentage of tree cover and relatively low distribution of shrub. In this study, grasslands accounted for a large proportion in retired farmlands on the Loess Plateau, but the increase in forestlands were more significant.
The spatial–temporal patterns of farmland retirement varied significantly across years, primarily driven by policy orientation and farmers' participation willingness. During the study period, the Chinese central government implemented two phases of GFGP: the first from 1999–2013, and the second from 2014 onward. High rates of retirement were observed at the beginning of every phase due to promising subsides. High retirement rates were observed at the launch of each phase, largely due to attractive subsidy schemes. However, participation willingness declined afterward, as falling grain prices reduced the relative value of subsidies, leading some farmers to recultivate retired land (Xie et al., 2023). Additionally, population growth between 2000 and 2020 escalated local food demand, further motivating recultivation. Some abandoned farmland-induced misclassification also could introduce bios into the spatial analysis of retired farmlands. These dynamics are consistent with the findings of Wang et al. (2013), who reported a rapid decline in farmland area from 1999–2003 during the first GFGP phase, followed by a rebound due to recultivation and subsequent stabilization.
4.2 Model development for ΔSOC
Land use change due to GFGP can strongly affect SOC, and SOC tend to be lower in farmlands (Deng et al., 2014), which was proved in this study by comparing retired and adjacent cultivated farmlands. The increase in ΔSOC in retired farmlands shows a strong relationship with the years since retirement, although a slight decrease in SOC may occur during the early stages of land use change (Deng et al., 2017). During the study period, all vegetation types exhibited a consistent increasing trend in SOC after the initial few years. However, the accumulation tends to approach an upper limit as the ecosystem matures and stabilizes, as observed in grasslands that follow a logarithmic growth pattern. Some retired farmlands with decreasing SOC were found, which could be explained by interchange of recultivation and retirement (Qiu et al., 2018), but the deeper mechanism is still need to be explored. Moreover, the high SOC in adjacent farmlands due to good agricultural practice could also offset the benefit of ΔSOC from the GFGP (negative ΔSOC was mostly found in farmland with high SOC).
Based on the statistical analysis (Fig. 4), the range of the ΔSOC in grasslands was significantly smaller than that in forestlands and shrublands. This indicates the accumulation rate of SOC in grasslands was lower than that in forestlands and shrublands due to the low primary productive and the fine quality of grass litter for decomposition (Lukina et al., 2020), whereas woody litter contains more lignin and decomposes slowly (Xiao et al., 2022). Therefore, different models were developed according to vegetation types and climatic zones. Based on the models, the climatic factors had significant effect on ΔSOC besides the years since retirement. Among the climatic factors, the models showed that ΔSOC were more sensitive to precipitation-based bioclimatic factors (e.g., BIO12–BIO19). This is because most of the Loess Plateau is located in semi-arid and arid area with limited precipitation (Zhang et al., 2015). Moreover, increased precipitation and temperatures can enhance the decomposition of surface litter (Sharma and Sharma, 2022), and in turn reduce ΔSOC.
4.3 Benefits in ΔSOC on the Loess Plateau
Under climate change, ecological restoration is an urgent need to improve the healthiness of degraded ecosystems (Liu et al., 2023; Yang et al., 2023). As a major benefit from ecological restoration, ΔSOC brings a lot of interests due to SOC is the major carbon pool in the ecosystems. To illustrate ΔSOC from ecological restoration, only a comparison of restored and adjacent unrestored ecosystems should be persuasive (Francaviglia et al., 2019). Numbers of studies focusing on ΔSOC in retired farmlands has been conducted on the Loess Plateau, and found an increasing ΔSOC as a result of GFGP (Wang et al., 2021b), and the national SOC sequestration caused by retirement was estimated to be 14.46 Tg yr−1 (Zhao et al., 2013). But they failed to make comparison with the adjacent farmlands. In this study, we analyzed the ΔSOC of retired farmlands and adjacent cultivated farmlands, and confirmed that the GFGP can provide significant amount of ΔSOC on the Loess Plateau, although negative ΔSOC was found in some areas.
Recently, studies have shown that SOC stocks in the GFGP region on the Loess Plateau increased by 20.18 Tg C between 1982 and 2017 (Li et al., 2022). The total ΔSOC (21.77 Tg C) of retired farmlands on the Loess Plateau estimated in this study was slightly higher than that value, which proved that the results of this study are reliable. The mechanisms driving ΔSOC vary across vegetation restoration types and climatic zones. While warmer and more humid regions generally exhibit higher carbon sequestration rates – owing to enhanced photosynthesis and plant growth under favorable temperature and precipitation regimes – these conditions also accelerate SOC turnover, potentially limiting long-term storage benefits compared to arid and semi-arid regions (Sierra et al., 2017). Therefore, selecting appropriate vegetation types is critical to prevent slow SOC accumulation and early saturation. Moreover, sustainable management practices – such as controlled grazing and systematic harvesting – are essential to maintain ecosystem health and maximize long-term soil carbon storage, thereby strengthening the role of retired farmlands in climate change mitigation.
4.4 Limitations and Uncertainties
Remote sensing images are widely used in studies of land use change because of their accuracy and timeliness. In this study, the use of Landsat dataset has practical feasibility to provide reliable distribution of retired farmlands. However, the Loess Plateau has a large spatial area, and has a fragmented and complex topography, which increases the difficulty of land use classification. Therefore, the 30 m resolution images can result in misclassification (e.g., abandoned farmlands vs. retired farmlands), although we obtained acceptable accuracy (80 %–91 %). Recently, the availability of ultra-high resolution images (sub-meter resolution) allows a more accurate classification, but lacks of long period records.
In this study, the direct comparison of retired farmlands and adjacent cultivated farmlands reflected a more persuasive ΔSOC. The multivariate linear regression models that developed for estimating ΔSOC can effectively reduce estimation errors by accounting for the spatial heterogeneity of the Loess Plateau. Increasing the number of sample points would further enhance model flexibility, allowing the incorporation of additional factors – such as slope, elevation, and soil properties – to stratify the study area into more representative subzones. Furthermore, establishing permanent observation points to monitor both retired and adjacent cultivated farmlands would provide reliable pairwise comparisons essential for robust model calibration. To more accurately project the future soil carbon sequestration potential of retired farmlands, the integration of process-based ecosystem models could be a more reliable approach, such as DLEM (Dynamic Land Ecosystem Model, (Tian et al., 2003)), LPJ–GUESS (Lund Potsdam Jena General Ecosystem Simulator, (Smith et al., 2001)), and CENTURY (Parton et al., 1987).
The associated datasets “The 30 m resolution distribution of retired farmlands and their carbon sequestration on the Loess Plateau in China from 2000 to 2021” are available at Figshare (https://doi.org/10.6084/m9.figshare.28785971, Yang, 2025), including distribution of retired farmlands from 2000–2021, years since retirement, and high resolution ΔSOC from the retired farmlands.
Farmland retirement is an effective strategy to restore degraded ecosystems and increase carbon storage on the Loess Plateau. In this study, we found the total area of retired farmlands on the Loess Plateau during the study period was 39 065 km2. The dominant ecosystem type was grasslands, followed by shrublands and forestlands. The area of retired farmlands showed significant interannual changes without a specific trend, and the retired farmlands varied in different climatic zones. Area of retired farmlands in the MT-SA zone were significantly higher than WT-SA zone and WT-SH zone. Based on soil samples, we found that ΔSOC increased with the years since retirement, and developed seven regression models for ΔSOC by years since retirement, temperature, precipitation, soil bulk density, latitude and longitude, and ecosystem types. According to the models, the total benefits in ΔSOC from retired farmlands on the Loess Plateau were estimated to be 21.77 Tg C, with the variation ranged from −26.52 to 31.91 kg C m−2 at grid cell level. The most ΔSOC were contributed by retired farmlands in the MT-SA zone (15.120 Tg C), followed by WT-SA zone (6.440 Tg C) and WT-SH zone (0.210 Tg C). Therefore, Long-term implementation of GFGP brought significant impacts on increasing soil carbon sinks on the Loess Plateau, which contributed significantly in mitigating climate changes and promoting sustainability in the studied area.
The supplement related to this article is available online at https://doi.org/10.5194/essd-18-429-2026-supplement.
BG: data curation, investigation, methodology, formal analysis, validation and visualization; MF: investigation, formal analysis and validation; LY: data curation; TG, CM, XH, ZG, ZM: resources and visualization; QL: funding acquisition and conceptualization; ZW: resources; WL: Conceptualization, methodology, project administration and supervision. BG and WL: Writing – original draft preparation; All authors: Writing – review and editing.
The contact author has declared that none of the authors has any competing interests.
Publisher's note: Copernicus Publications remains neutral with regard to jurisdictional claims made in the text, published maps, institutional affiliations, or any other geographical representation in this paper. The authors bear the ultimate responsibility for providing appropriate place names. Views expressed in the text are those of the authors and do not necessarily reflect the views of the publisher.
The authors would like to thank all the reviewers who participated in the review.
This research has been supported by the National Key Research and Development Program of China (grant no. 2022YFF1302200).
This paper was edited by Hao Shi and reviewed by two anonymous referees.
Bai, R., Wang, X., Li, J.,Yang, F., Shangguan, Z., and Deng, L. Area Datasets of “Grain for Green” Project in Counties of the Loess Plateau from 1999 to 2020 [DS/OL], V1, Science Data Bank, https://cstr.cn/31253.11.sciencedb.j00001.00820 (last access: 12 December 2023), 2024.
Calmon, M., Brancalion, P. H., Paese, A., Aronson, J., Castro, P., da Silva, S. C., and Rodrigues, R. R.: Emerging threats and opportunities for large-scale ecological restoration in the Atlantic Forest of Brazil, Restor. Ecol., 19, 154–158, https://doi.org/10.1111/j.1526-100X.2011.00772.x, 2011.
Cui, W., Liu, J., Jia, J., and Wang, P.: Terrestrial ecological restoration in China: identifying advances and gaps, Environ. Sci. Eur., 33, 1–14, https://doi.org/10.1186/s12302-021-00563-2, 2021.
de Oliveira Faria, C. and Magrini, A.: Biodiversity Governance from a Cross-Level and Cross-Scale Perspective: The case of the Atlantic Forest biome in Brazil, Environm. Policy Govern., 26, 468–481, https://doi.org/10.1002/eet.1728, 2016.
Deng, L., Liu, G. B., and Shangguan, Z. P.: Land-use conversion and changing soil carbon stocks in China's “Grain-for-Green” Program: a synthesis, Glob. Change Biol., 20, 3544–3556, https://doi.org/10.1111/gcb.12508, 2014.
Deng, L., Liu, S., Kim, D. G., Peng, C., Sweeney, S., and Shangguan, Z.: Past and future carbon sequestration benefits of China's grain for green program, Global Environm. Change, 47, 13–20, https://doi.org/10.1016/j.gloenvcha.2017.09.006, 2017.
Estel, S., Kuemmerle, T., Alcántara, C., Levers, C., Prishchepov, A., and Hostert, P.: Mapping farmland abandonment and recultivation across Europe using MODIS NDVI time series, Remote Sens. Environ., 163, 312–325, https://doi.org/10.1016/j.rse.2015.03.028, 2015.
Feng, X., Fu, B., Lu, N., Zeng, Y., and Wu, B.: How ecological restoration alters ecosystem services: an analysis of carbon sequestration in China's Loess Plateau, Sci. Rep., 3, 2846, https://doi.org/10.1038/srep02846, 2013.
Ferreira, C. S., Seifollahi-Aghmiuni, S., Destouni, G., Ghajarnia, N., and Kalantari, Z.: Soil degradation in the European Mediterranean region: Processes, status and consequences, Sci. Total Environ., 805, 150106, https://doi.org/10.1016/j.scitotenv.2021.150106, 2022.
Francaviglia, R., Álvaro-Fuentes, J., Di Bene, C., Gai, L., Regina, K., and Turtola, E.: Diversified arable cropping systems and management schemes in selected European regions have positive effects on soil organic carbon content, Agriculture, 9, 261, https://doi.org/10.3390/agriculture9120261, 2019.
Graham, F.: Daily briefing: How to shore up Africa's Great Green Wall, Nature, https://doi.org/10.1038/d41586-022-01247-4, 2022.
Huang, M., Gong, J., Shi, Z., Liu, C., and Zhang, L.: Genetic algorithm-based decision tree classifier for remote sensing mapping with SPOT-5 data in the HongShiMao watershed of the loess plateau, China, Neural. Comput. Appl., 16, 513–517, https://doi.org/10.1007/s00521-007-0104-z, 2007.
Lengefeld, E., Metternicht, G., and Nedungadi, P.: Behavior change and sustainability of ecological restoration projects, Restor. Ecol., 28, 724–729, https://doi.org/10.1111/rec.13159, 2020.
Li, B., Li, P., Yang, X., Xiao, H., Xu, M., and Liu, G.: Land-use conversion changes deep soil organic carbon stock in the Chinese Loess Plateau [J], Land Degrad. Dev., 32, 505–517, https://doi.org/10.1002/ldr.3644, 2020.
Li, H., Wu, Y., Liu, S., Zhao, W., Xiao, J., Winowiecki, L. A., Vågen, T.-G., Xu, J., Yin, X., and Wang, F.: The Grain-for-Green project offsets warming-induced soil organic carbon loss and increases soil carbon stock in Chinese Loess Plateau, Sci. Total Environ., 837, 155469, https://doi.org/10.1016/j.scitotenv.2022.155469, 2022.
Liu, C., Jia, X., Ren, L., Zhao, C., Yao, Y., Zhang, Y., and Shao, M. A.: Cropland-to-shrubland conversion reduces soil water storage and contributes little to soil carbon sequestration in a dryland area, Agric. Ecosyst. Environ., 354, 108572, https://doi.org/10.1016/j.agee.2023.108572, 2023.
Lu, F., Hu, H., Sun, W., Zhu, J., Liu, G., Zhou, W., Zhang, Q., Shi, P., Liu, X., and Wu, X.: Effects of national ecological restoration projects on carbon sequestration in China from 2001 to 2010, Proc. Nat. Acad. Sci., 115, 4039–4044, https://doi.org/10.1073/pnas.1700294115, 2018.
Lukina, N., Kuznetsova, A., Tikhonova, E., Smirnov, V., Danilova, M., Gornov, A., Bakhmet, O., Kryshen, A., Tebenkova, D., and Shashkov, M.: Linking forest vegetation and soil carbon stock in Northwestern Russia, Forests, 11, 979, https://doi.org/10.3390/f11090979, 2020.
Macia, E., Allouche, J., Sagna, M. B., Diallo, A. H., Boëtsch, G., Guisse, A., Sarr, P., Cesaro, J.-D., and Duboz, P.: The Great Green Wall in Senegal: questioning the idea of acceleration through the conflicting temporalities of politics and nature among the Sahelian populations, Ecol. Society, 28, 31, https://doi.org/10.5751/ES-13937-280131, 2023.
Mir, Y. H., Ganie, M. A., Shah, T. I., Aezum, A. M., Bangroo, S. A., Mir, S. A., Dar, S. R., Mahdi, S. S., Baba, Z. A., and Shah, A. M.: Soil organic carbon pools and carbon management index under different land use systems in North western Himalayas, PeerJ, 11, e15266, https://doi.org/10.7717/peerj.15266, 2023.
Ouyang, Z., Zheng, H., Xiao, Y., Polasky, S., Liu, J., Xu, W., Wang, Q., Zhang, L., Xiao, Y., and Rao, E.: Improvements in ecosystem services from investments in natural capital, Science, 352, 1455–1459, https://doi.org/10.1126/science.aaf2295, 2016.
Pape, T.: Futuristic restoration as a policy tool for environmental justice objectives, Restor. Ecol., 30, e13629, https://doi.org/10.1111/rec.13629, 2022.
Parton, W. J., Schimel, D. S., Cole, C. V., and Ojima, D. S.: Analysis of factors controlling soil organic matter levels in Great Plains grasslands, Soil Sci. Soc. Am. J., 51, 1173–1179, https://doi.org/10.2136/sssaj1987.03615995005100050015x, 1987.
Paustian, K., Collier, S., Baldock, J., Burgess, R., Creque, J., DeLonge, M., Dungait, J., Ellert, B., Frank, S., and Goddard, T.: Quantifying carbon for agricultural soil management: from the current status toward a global soil information system, Carbon Manage., 10, 567–587, https://doi.org/10.1080/17583004.2019.1633231, 2019.
Piffer, P. R., Calaboni, A., Rosa, M. R., Schwartz, N. B., Tambosi, L. R., and Uriarte, M.: Ephemeral forest regeneration limits carbon sequestration potential in the Brazilian Atlantic Forest, Glob. Change Biol., 28, 630–643, https://doi.org/10.1111/gcb.15944, 2022.
Prãvãlie, R., Patriche, C., Borrelli, P., Panagos, P., Roca, B., Dumitracu, M., Nita, I.-A., Sãvulescu, I., Birsan, M.-V., and Bandoc, G.: Arable lands under the pressure of multiple land degradation processes. A global perspective, Environ. Res., 194, 110697, https://doi.org/10.1016/j.envres.2020.110697, 2021.
Qiu, B., Zou, F., Chen, C., Tang, Z., Zhong, J., and Yan, X.: Automatic mapping afforestation, cropland reclamation and variations in cropping intensity in central east China during 2001–2016, Ecol. Indic., 91, 490–502, https://doi.org/10.1016/j.ecolind.2018.04.010, 2018.
Scharlemann, J. P., Tanner, E. V., Hiederer, R., and Kapos, V.: Global soil carbon: understanding and managing the largest terrestrial carbon pool, Carbon Manage., 5, 81–91, https://doi.org/10.4155/cmt.13.77, 2014.
Shao, M., Adnan, M., Zhang, L., Liu, P., Cao, J., and Qin, X.: Carbonate mineral dissolution and its carbon sink effect in Chinese loess, Land, 12, 133, https://doi.org/10.3390/land12010133, 2022.
Sharma, G. and Sharma, L.: Climate change effect on soil carbon stock in different land use types in eastern Rajasthan, India, Environm. Dev. Sustain., 24, 4942–4962, https://doi.org/10.1007/s10668-021-01641-4, 2022.
Sierra, C. A., Malghani, S., and Loescher, H. W.: Interactions among temperature, moisture, and oxygen concentrations in controlling decomposition rates in a boreal forest soil, Biogeosciences, 14, 703–710, https://doi.org/10.5194/bg-14-703-2017, 2017.
Smith, B., Prentice, I. C., and Sykes, M. T.: Representation of vegetation dynamics in the modelling of terrestrial ecosystems: comparing two contrasting approaches within European climate space, Glob. Ecol. Biogeogr., 621–637, https://doi.org/10.1046/j.1466-822X.2001.t01-1-00256.x, 2001.
Sun, Y., Zhu, J., Yan, Q., Hu, Z., and Zheng, X.: Changes in vegetation carbon stocks between 1978 and 2007 in central Loess Plateau, China, Environ. Earth Sci., 75, 1–16, https://doi.org/10.1007/s12665-015-5199-4, 2016.
Tian, H., Melillo, J. M., Kicklighter, D. W., Pan, S., Liu, J., McGuire, A. D., and Moore III, B.: Regional carbon dynamics in monsoon Asia and its implications for the global carbon cycle, Glob. Planet. Change, 37, 201–217, https://doi.org/10.1016/S0921-8181(02)00205-9, 2003.
Wang, B., Liu, G., Zhang, G., and Yang, Y.: Effects of Grain for Green Project on Food Security on Loess Plateau, Bulletin of Soil and Water Conservation, 33, 241–245, https://doi.org/10.13961/j.cnki.stbctb.2013.03.059, 2013, (in Chinese with English abstract).
Wang, J., Liu, Z., Gao, J., Emanuele, L., Ren, Y., Shao, M., and Wei, X.: The Grain for Green project eliminated the effect of soil erosion on organic carbon on China's Loess Plateau between 1980 and 2008, Agric., Ecosyst. Environ., 322, 107636, https://doi.org/10.1016/j.jclepro.2021.128161, 2021a.
Wang, L., Li, Z., Wang, D., Chen, J., Liu, Y., Nie, X., Zhang, Y., Ning, K., and Hu, X.: Unbalanced social-ecological development within the Dongting Lake basin: Inspiration from evaluation of ecological restoration projects, J. Cleaner Prod., 315, 128161, https://doi.org/10.1016/j.agee.2021.107636, 2021b.
Wei, Z., Gu, X., Sun, Q., Hu, X., and Gao, Y.: Analysis of the spatial and temporal pattern of changes in abandoned farmland based on long time series of remote sensing data, Remote Sens., 13, 2549, https://doi.org/10.3390/rs13132549, 2021.
Wen, W., Wang, Y., Yang, L., Liang, D., Chen, L., Liu, J., and Zhu, A.-X.: Mapping soil organic carbon using auxiliary environmental covariates in a typical watershed in the Loess Plateau of China: a comparative study based on three kriging methods and a soil land inference model (SoLIM), Environ. Earth Sci., 73, 239–251, https://doi.org/10.1007/s12665-014-3518-9, 2015.
Xiao, J.: Satellite evidence for significant biophysical consequences of the “Grain for Green” Program on the Loess Plateau in China, J. Geophys. Res.: Biogeosci., 119, 2261–2275, https://doi.org/10.1002/2014JG002820, 2014.
Xiao, Y., Huang, Z., Ling, Y., Cai, S., Zeng, B., Liang, S., and Wang, X.: Effects of forest vegetation restoration on soil organic carbon and its labile fractions in the Danxia landform of China, Sustainability, 14, 12283, https://doi.org/10.3390/su141912283, 2022.
Xie, Y., Ma, Z., Fang, M., Liu, W., Yu, F., Tian, J., Zhang, S., and Yan, Y.: Analysis of Net Primary Productivity of Retired Farmlands in the Grain-for-Green Project in China from 2011 to 2020, Land, 12, 1078, https://doi.org/10.3390/land12051078, 2023.
Xu, C., Jiang, Y., Su, Z., Liu, Y., and Lyu, J.: Assessing the impacts of Grain-for-Green Programme on ecosystem services in Jinghe River basin, China, Ecol. Indic., 137, 108757, https://doi.org/10.1016/j.ecolind.2022.108757, 2022.
Xu, X., Liu, J., Zhang, S., Li, R., Yan, C., and Wu, S.: China Multi-Temporal Land Use Remote Sensing Monitoring Dataset (CNLUCC), Resource and Environment Science Data Platform, https://doi.org/10.12078/2018070201, 2018.
Yan, X., Li, J., Smith, A. R., Yang, D., Ma, T., and Su, Y.: Rapid land cover classification using a 36 year time series of multi-source remote sensing data, Land, 12, 2149, https://doi.org/10.1016/j.ecolind.2022.108757, 2023.
Yang, L.: The 30-meter resolution distribution of retired farmlands and their carbon sequestration on the Loess Plateau in China from 2000 to 2021, figshare [data set], https://doi.org/10.6084/m9.figshare.28785971.v5, 2025.
Yang, J. and Huang, X.: The 30 m annual land cover dataset and its dynamics in China from 1990 to 2019, Earth Syst. Sci. Data, 13, 3907–3925, https://doi.org/10.5194/essd-13-3907-2021, 2021.
Yang, Y., Sun, H., Zhang, P., Wu, F., Qiao, J., Li, T., Wang, Y., and An, S.: Review of managing soil organic C sequestration from vegetation restoration on the Loess Plateau, Forests, 14, 1964, https://doi.org/10.3390/f14101964, 2023.
Yi, P., Wu, H., Hu, B., Wen, X., Han, H., and Cheng, X.: Variation characteristics and influencing factors of soil organic carbon storage after returning farmland to forest on the Loess Plateau. Acta Ecologica Sinica, 43, 10054–10064, https://doi.org/10.20103/j.stxb.202306241340, 2023, (in Chinese with English abstract).
Zhang, F., Li, C., Wang, Z., Glidden, S., Grogan, D. S., Li, X., Cheng, Y., and Frolking, S.: Modeling impacts of management on farmland soil carbon dynamics along a climate gradient in Northwest China during 1981–2000, Ecol. Modell., 312, 1–10, https://doi.org/10.1016/j.ecolmodel.2015.05.006, 2015.
Zhang, K., Yihe, L., Bojie, F., and Ting, L.: The effects of restoration on vegetation trends: spatiotemporal variability and influencing factors, Earth Environ. Sci. Trans. R. Soc. Edinburgh, 109, 473–481, https://doi.org/10.1017/S1755691018000518, 2018.
Zhang, Q., Lu, J., Xu, X., Ren, X., Wang, J., Chai, X., and Wang, W.: Spatial and temporal patterns of carbon and water use efficiency on the loess plateau and their influencing factors, Land, 12, 77, https://doi.org/10.3390/land12010077, 2022.
Zhao, F., Chen, S., Han, X., Yang, G., Feng, Y., and Ren, G.: Policy-guided nationwide ecological recovery: Soil carbon sequestration changes associated with the Grain-to-Green Program in China, Soil Sci., 178, 550–555, https://doi.org/10.1097/SS.0000000000000018, 2013.
Zhou, R., Pan, X., Wei, H., Xie, X., Wang, C., Liu, Y., Li, Y., and Shi, R.: Soil organic carbon stocks in terrestrial ecosystems of China: revised estimation on three-dimensional surfaces, Sustainability, 8, 1003, https://doi.org/10.3390/su8101003, 2016.