the Creative Commons Attribution 4.0 License.
the Creative Commons Attribution 4.0 License.
 | 08 May 2026
CropSight-US: an object-based crop type ground truth dataset using street view and Sentinel-2 satellite imagery across the contiguous United States, 2013–2023
Zhijie Zhou
Chunyuan Diao
Accurate and scalable crop type maps are vital for supporting food security, as they provide critical information on the specific crops cultivated in a given area to inform agricultural decision-making and enhance crop productivity. The generation of these maps depends on high-quality crop type ground truth data, which are essential for developing remote sensing–based crop type classification models applicable across varying spatial and temporal contexts. Yet existing crop type ground truth datasets often focus on specific crop types of limited spatial and temporal ranges, constrained by the high cost and labor intensity of traditional field surveys. This limitation hinders their applicability to large-scale and multi-year applications, such as nationwide crop monitoring and long-term yield forecasting. Additionally, most existing crop type ground truth datasets contain only pixel-level labels without explicit field boundaries, impeding the extraction of field-level texture and structure information needed for accurate crop type mapping in heterogeneous agricultural landscapes. Collectively, these limitations hinder the development of scalable crop type mapping workflows and reduce the precision and reliability of resulting crop type maps for agricultural monitoring and decision support. In this study, we introduce CropSight-US, a novel national scale, object-based crop type ground truth dataset for the contiguous United States (CONUS) derived from street view and satellite imagery. This dataset spans the years 2013 to 2023 and includes over 100 000 crop type ground truth objects across 17 major crops and 294 Agricultural Statistics Districts, offering broad spatial and temporal coverage and high representativeness at field level. Each crop type ground truth object is accompanied by an uncertainty score that quantifies the confidence in its crop type identification, enabling users to filter or weight samples according to their specific reliability requirements. The crop type ground truthing framework of CropSight-US innovatively integrates crop labels derived from Google Street View imagery with field boundaries delineated from Sentinel-2 imagery to produce object-based crop type ground truth data. This scalable framework offers a valuable alternative to traditional field surveys by replacing in-person observations with virtual audits, significantly improving the efficiency, scalability, and cost-effectiveness of ground truth data collection. This framework achieves 97.2 % overall accuracy in crop type identification and 98.0 % F1 score in cropland field boundary delineation using the reference dataset. By delivering high-resolution, standardized, and reproducible reference data, CropSight-US establishes a new benchmark for crop type ground truthing and supports more informed agricultural research, monitoring, and decision-making. CropSight-US is available at https://doi.org/10.5281/zenodo.15702414 (Zhou et al., 2025).
- Article
(15776 KB) - Full-text XML
- BibTeX
- EndNote


Food security will face increasing pressure in the coming decades due to climate change, population growth, and limited resources. In response to these growing pressures, a variety of agricultural policies have been developed to promote more efficient crop management practices (e.g., crop rotation and intensification) and to boost crop productivity. Accurate crop type maps play a central role in guiding these policy decisions by providing detailed information on the specific crops cultivated in a given area. In recent years, advances in remote sensing, coupled with machine learning and deep learning techniques, have enabled the efficient generation of crop type maps (Cai et al., 2018; Weiss et al., 2020; You and Sun, 2022; Koukos et al., 2024). As essential training data for remote sensing-based classification models, crop type ground truth plays a critical role in crop type mapping by providing labeled examples of various crop species. These crop labels enable models to accurately classify crop types across large geographic regions by capturing the distinctive remote sensing signatures (e.g., spectral characteristics, phenological patterns, row or canopy structures, and harvesting timelines) associated with each crop type. Therefore, high-quality crop type ground truth datasets are essential for ensuring the accuracy of crop type maps and supporting a wide array of downstream agricultural applications (e.g., crop phenology monitoring, irrigation planning, and crop yield forecasting).
Existing crop type ground truth datasets generally fall into two categories. The first category encompasses the crop type labels collected directly through field surveys. As the most traditional approach, field surveys provide highly accurate crop type information through in-person observation. However, these field-collected ground truth datasets are often sparse, geographically uneven, and infrequently updated due to the high costs and labor demands of field data collection (Liu et al., 2012; Jolivot et al., 2021). In addition, field collection efforts typically capture only the dominant crop types within defined surveyed areas and time frames, often overlooking less prevalent crops or cultivation cycles that may be common in neighboring regions or fall outside the surveyed cultivation windows. These constraints limit the utility of such datasets in supporting the development of remote sensing–based crop classification models that generalize across different regions and growing seasons (Wang et al., 2022; Wu et al., 2022; McNairn and Jiao, 2024). The second category of crop type ground truth data is the crop type labels derived from existing crop type products, such as the Cropland Data Layer (CDL) for the United States (USDA, 2025a; Boryan et al., 2011) and EUCROPMAP for European countries (d'Andrimont et al., 2021; Ghassemi et al., 2022, 2024). With their wide spatial and temporal coverage, these crop type products supply proxy labels that stand in for costly field surveys and are increasingly used to train and validate crop classification models (Whitcraft et al., 2019; Tran et al., 2022; Becker-Reshef et al., 2023). This strategy enables the rapid generation of spatially extensive and temporally consistent ground truth data to support agricultural monitoring across diverse regions and growing seasons, which is advantageous in regions or periods with limited field observations. However, the accuracy and representativeness of these product-based “ground truth” data can vary considerably across crop types, regions, and years. Their quality depends on the reliability of the original field-based crop observations, the resolution and consistency of remote sensing inputs, and the robustness of the classification models used to produce the maps (Chivasa et al., 2017; Nowakowski et al., 2021). In addition, their utility is limited by delayed release schedules. Since existing crop type maps are typically generated using year-round satellite observations to capture complete phenological cycles (Wu et al., 2022; Yang et al., 2023, 2024), the “ground truth” for a given year often becomes available in following years (e.g., CDL is often released in the subsequent year). This delay limits their applicability for near-real-time crop mapping and subsequent time-sensitive applications such as in-season yield forecasting, pest and disease monitoring, or early warning systems that require more concurrent crop type information (Stehman and Foody, 2019; Wu et al., 2022; Liu et al., 2024).
In the practice of crop type mapping, object-based crop type ground truth data (e.g., at field- or parcel-level) is typically created by associating crop labels with delineated field boundaries to support more accurate and robust crop type classification. Compared to pixel-based labels, object-based labels provide a more detailed and spatially coherent representation of agricultural fields. By enabling the characteristics of both within-field features (e.g., spectral, textural, and shape attributes) and between-field relationships (e.g., connectivity, contiguity, proximity, and directional patterns), object-based crop type labels enhance the spatial context available to classification models and improve crop type mapping performance (Duro et al., 2012; Ok et al., 2012; Kussul et al., 2016; Li et al., 2016; Zhang et al., 2018; Waldner and Diakogiannis, 2020). In addition, for large-scale crop mapping with remote sensing technique, aggregating pixel-level information within object-based boundaries could help mitigate cloud contamination by increasing the availability of valid observations at the field level. However, the generation of object-based crop type ground truth dataset remains challenging due to the lack of explicitly defined field boundaries in most available datasets. Field survey-based datasets, typically collected through Global Positioning System-referenced observations, are generally coordinate-based and provide point-level crop type labels without associated field geometries (McNairn and Jiao, 2024). Crop product-based datasets, which are derived by sampling pixel-level crop type labels from existing crop type maps, similarly lack cropland field boundary delineations. Transforming either category into object-based ground truth requires extensive post-processing, such as reconciling point- or pixel-level labels with external field boundary datasets, a process that is often time- and resource-intensive, limiting the production of high-quality dataset across diverse regions. Alternatively, object-based products can be generated by aggregating classified pixels into polygons based on spatial and spectral similarity, as implemented in datasets such as the Crop Sequence Boundary (CSB) (Boryan et al., 2011; Abernethy et al., 2023; Hunt et al., 2024). However, these automated methods may introduce boundary uncertainties and misalignment with actual management units, particularly in heterogeneous landscapes. Consequently, both approaches still demand substantial computational resources and rigorous quality control to ensure reliability, complicating the scalable mapping of agricultural systems.
In this paper, we introduce CropSight-US, a novel national scale, object-based crop type ground truth dataset that provides representative and extensive crop type information across multiple years for the contiguous United States (CONUS). Covering 17 major crop types from 2013 to 2023 across 294 Agricultural Statistics Districts (ASDs) in CONUS, CropSight-US is generated using our proposed crop type ground truthing framework, which integrates crop type labels identified from Google Street View (GSV) imagery with field boundary information derived from high-resolution Sentinel-2 imagery. This novel framework enables the efficient collection of high-quality, object-based crop type ground truth information at large spatial and temporal scales by replacing the in-person field observations required in traditional surveys with virtual audits. With its built-in uncertainty quantification design, the collected CropSight-US dataset incorporates uncertainty information to support quality assessment and informed model development. Its object-based structure, which includes both crop type labels and delineated field boundaries, facilitates the training of crop type classification models that leverage field-level characteristics. As a major global agricultural production region, CONUS serves as a critical reference area for agricultural research and remote sensing applications. Its diverse cropping systems, shaped by a wide range of climates, soils, and management practices, make it an ideal setting for systematically building representative ground truth dataset of a diversity of crop types. This rich variability allows CropSight-US to support the development of generalizable crop classification models capable of robust mapping across diverse agricultural landscapes and effective transfer to data-scarce regions (Hao et al., 2020; Nowakowski et al., 2021; Koukos et al., 2024; Mai et al., 2025). Together, these features position CropSight-US as a foundational resource for advancing scalable, transferable, and reliable crop type mapping in practical and operational agricultural applications (e.g., precision agriculture practice, compliance monitoring systems).
The remainder of this paper is organized as follows: Sect. 2 introduces the study area and describes the CropSight-US data sources. Section 3 presents the four components of the crop type ground truthing framework used to develop the dataset, including (1) operational cropland field-view GSV metadata collection, (2) reference dataset (CropGSV-Ref) building, (3) crop type identification, (4) cropland field boundary delineation, along with the framework evaluation methods and production of the CropSight-US dataset. Section 4 evaluates the performance of the crop type ground truthing framework. Section 5 provides a comprehensive overview of the dataset, including its spatial and temporal coverage, crop type composition, and a Google Earth Engine (GEE)-enabled interface for user access. Section 6 concludes with a discussion of CropSight-US' merits, current limitations, future directions for improvement, and potential avenues for extending the dataset and its ground truthing framework.
2.1 Study Area
Our study focuses on CONUS, a globally significant agricultural production region. With its wide range of agroecological zones, climate regimes, and cropping systems, CONUS serves as a valuable reference area for agricultural research and remote sensing applications. CONUS' diverse environmental and agricultural management conditions have shaped the regional variation in dominant crops, such as corn and soybean prevalent in the Midwest, cotton and sorghum in the South, and a mix of specialty crops in parts of the West and Southeast (Fig. 1). This broad spectrum of cultivation practices and environmental conditions makes CONUS an ideal testbed for building operational ground truth datasets at large spatial and temporal scales. Our study period spans from 2013 to 2023, based on the availability and quality of street view imagery used for crop type ground truth collection.

Figure 1Major Crop Types in the Agricultural Statistics Districts (ASDs) of Contiguous United States (CONUS), visualized using the 2024 USDA Cropland Data Layer (CDL) product.
2.2 Data
The primary data source used for crop type ground truth collection in this study is Google Street View (GSV) imagery, accessed through the Google Maps platform (Anguelov et al., 2010). Since its launch in 2008, GSV has expanded its coverage extensively across CONUS, offering a rich archive of high-resolution, georeferenced 360° panoramic images. These images are captured by camera-equipped vehicles that travel along public roads. Each GSV panoramic image is accompanied by rich metadata attributes, including the Pano ID, heading, latitude, longitude, month, and year. The Pano ID serves as a unique identifier for each panorama, while the heading indicates the direction the camera-equipped vehicle is facing when capturing the image. The latitude, longitude, month, and year associated with each panorama provide geographic and temporal context, which we used to filter, sample, and acquire the representative GSV imagery for subsequent crop type ground truth collection. GSV metadata and imagery are both retrieved using Google Street View Static API (https://developers.google.com/maps/documentation/streetview/overview, last access: 28 February 2026).
To support crop type ground truth collection, we integrate multiple datasets to collect GSV imagery from agricultural regions, with unobstructed view of croplands, under different irrigation regimes, and during optimal growing periods. First, we use the 10 m WorldCover land cover product (Zanaga et al., 2022) to identify GSV images falling within areas labelled as “cropland” or “tree cover,” which are more likely to capture agricultural landscapes. Derived from Sentinel-1 and Sentinel-2 imagery, WorldCover offers consistent 10 m global land cover information suitable for large-scale filtering. Second, road network data from OpenStreetMap (Haklay and Weber, 2008) are used to exclude GSV collected along U.S. primary roads and at major intersections, reducing the likelihood of visual obstructions such as overpasses or interchanges in the corresponding GSV imagery. Third, to ensure that the collected crop type ground truth reflects both irrigated and rainfed systems, we incorporate the Landsat-based Irrigation Dataset (LANID) (Xie et al., 2021) to guide the collection of GSV imagery, enabling the collection of representative samples under different irrigation management strategies. Lastly, we use USDA's Crop Progress Reports (CPRs) to guide the selection of GSV imagery collected during the region-specified crop growing seasons. CPRs (USDA, 2025b) offer weekly updates on crop development stages at the state level across the U.S., enabling us to define region-specific planting-to-harvest windows. Focusing on GSV imagery captured within these tailored windows helps exclude those images more likely to depict barren fields or off-season conditions, thereby streamlining the labeling process and improving the overall accuracy of crop type ground truth collection.
We use cloud-free, visible bands (RGB) of Sentinel-2 imagery to extract field boundaries that correspond to the crop labels identified from GSV imagery. Each GSV imagery captures crop conditions during a specific month of a given year. To correctly delineate the corresponding field boundary for that same period, we need satellite imagery that is both temporally aligned and cloud free. Sentinel-2's 10 m spatial resolution, combined with its frequent revisit times, enables the capture of field conditions that align with the timing of GSV collection, while also providing visually distinct boundary details to support accurate field delineation. When cloud cover, missing data, or seasonal mismatches limit the availability of suitable Sentinel-2 imagery, or for GSV imagery captured prior to full Sentinel-2 availability (before 2017), we supplement with high-resolution aerial photographs from the National Agriculture Imagery Program (NAIP) via Google Earth Engine (USDA, 2003). NAIP images, typically at 1 m resolution, are captured during the agricultural growing season across the U.S. and are selected based on acquisition dates closest to the corresponding GSV images.
The CSB dataset is used as a benchmark product for evaluating our crop type ground truthing framework due to its nationwide coverage and object-level crop type labels. CSB is generated from pixel-level Cropland Data Layer (CDL) data through a vectorization process that leverages multiple years of CDLs to delineate homogeneous field objects (Boryan et al., 2011; Abernethy et al., 2023; Hunt et al., 2024). With its object-based crop type information, CSB has been widely used in applications that track crop rotations and require stable field boundaries over time (Castle et al., 2025; Renwick et al., 2025; Sohl et al., 2025).
This section outlines the methodological workflow for generating CropSight-US, a nationwide object-based crop type ground truth dataset spanning 2013 to 2023. The workflow consists of three main components: the development of the crop type ground truthing framework, its evaluation, and the subsequent production of the CropSight-US dataset (Fig. 2). The crop type ground truthing framework contains four major components: (1) Operational Cropland Field-View GSV Metadata Collection (Sect. 3.1.1): This component collects the metadata information of all historical geotagged cropland field-view GSV images that are suitable for crop type ground truth retrieval at large scales in an operational fashion. (2) Object-based Reference Dataset Building (Sect. 3.1.2): This step constructs a high-quality object-based reference dataset (CropGSV-Ref) to support the development of crop type identification and cropland field boundary delineation models. To ensure the reference dataset captures a wide range of farming conditions, samples are selected from collected cropland field-view GSV metadata across different regions, with stratification based on the extent of cropland/tree cover and irrigated land. The finalized CropGSV-Ref dataset contains cropland field-view GSV imagery with manually labeled crop types and corresponding Sentinel-2 imagery with annotated field boundaries. (3) Crop Type Identification (Sect. 3.1.3): An uncertainty-aware crop type classification model, CONUS-UncertainFusionNet, is developed to identify crop types from field-view GSV imagery using the labeled field-view GSV imagery from CropGSV-Ref. The model combines Vision Transformer (ViT-B16) and ResNet-50 to capture both global patterns and local plant details in field-view GSV imagery, and incorporates a Bayesian design to generate crop type predictions along with uncertainty estimates; (4) Cropland Field Boundary Delineation (Sect. 3.1.4): Segment Anything Model (SAM) is adopted and fine-tuned using field boundary annotations from CropGSV-Ref and applied to extract cropland field boundaries from Sentinel-2 imagery corresponding to each cropland field-view GSV imagery. Leveraging SAM's prompt-based design, geotagged coordinates from each cropland field-view GSV imagery serve as spatial prompts to guide boundary delineation specific to each field-view location. The performance of the crop type ground truthing framework (Sect. 3.2) is evaluated from three perspectives, including the accuracy in crop type classification from cropland field-view GSV imagery, the effectiveness in delineating cropland field boundaries using Sentinel-2 imagery, and the reliability of the collected object-based crop type information in comparison with that from the CSB benchmark product. Finally, the CropSight-US dataset (Sect. 3.3) is generated by applying the developed crop type ground truthing framework across CONUS. The resulting product provides object-based crop type information including crop type labels associated with classification uncertainty and delineated cropland field boundaries.

Figure 2Methodological workflow for generating the object-based crop type ground truth dataset CropSight-US across CONUS. Map data © 2024 Google. GSV images are from Imagery © 2024 Google Maps, and Sentinel-2 imagery thumbnails are from Imagery © 2024 European Union/ESA/Copernicus Sentinel-2, processed via Google Earth Engine.
3.1 Crop Type Ground Truthing Framework
3.1.1 Operational Cropland Field-View GSV Metadata Collection
The operational collection method is designed to systematically extract cropland field-view metadata from the extensive GSV database to enable large-scale crop type labeling. Firstly, raw GSV metadata across CONUS are collected by dividing the region into 10 km grid cells and querying available GSV metadata within each grid cell. This grid-based batch processing approach streamlines the acquisition of large volumes of raw GSV metadata and facilitates efficient data management. Each raw GSV metadata record includes the geographic coordinates, month-year of imagery capture, and heading information for the vehicle which collects the GSV imagery. Secondly, to ensure that the collected GSV metadata accurately correspond to cropland field-view GSV imagery suitable for crop type identification, a series of spatial and temporal filters are applied. For spatial filtering, raw GSV metadata located along U.S. primary roads or near road junctions are removed based on road network information from OpenStreetMap, as such locations often include roadway medians, signage, or traffic infrastructure that obstruct clear views of adjacent fields. In addition, since each raw GSV metadata is collected on the roads and linked to a panoramic image capturing views on both sides of the road, the image coordinates are offset by 50 m in both roadside directions to approximate the actual cropland field-view locations (Liu et al., 2024). These offset coordinates are then filtered using the WorldCover land cover map to ensure that the corresponding GSV imagery depicts agricultural landscapes (i.e., cropland field-view GSV imagery). Specifically, a 100 m-radius buffer is applied around each location, and those lacking cropland or tree cover pixels within the buffer are excluded from the dataset. For temporal filtering, crop-specific crop progress calendars from the USDA are referenced to define regional crop growth windows at the state level, and only raw GSV metadata captured within these crop-specific growing seasons are retained, ensuring that their corresponding GSV imagery are temporally aligned with periods when vegetation is present and crop type is visually distinguishable with its unique features and cultivation patterns. The final cropland field-view GSV metadata contain in-field location coordinates, acquisition month and year, and the heading direction of each cropland field-view GSV imagery ready to be retrieved. Section 5.1 summarizes the overall spatial and temporal distribution of the collected cropland field-view metadata. Access to GSV imagery through the Google Maps Platform and Static Street View API end points incur modest and transparent costs. Static Street View image requests are billed at USD 7 per 1000 requests for usage up to 100 000 requests and USD 5.60 per 1000 requests for usage between 100 001 and 500 000 requests, following a monthly free quota of 10 000 requests per user. In contrast, Street View Metadata requests are free of charge and not subject to usage limits.
3.1.2 Object-based Reference Dataset Building
To support the development of the crop type ground truthing framework, we manually construct a high-quality reference dataset CropGSV-Ref with object-based crop type information. This reference dataset consists of geotagged cropland field-view GSV imagery paired with crop type labels (i.e., the GSV component), along with corresponding Sentinel-2 imagery linked to annotated cropland field boundary polygons (i.e., the field boundary component).
First, we select a subset of cropland field-view GSV metadata using a stratified, spatially adaptive sampling strategy to ensure broad geographic coverage and capture agricultural diversity. The core idea of this strategy is to determine the sample size for each ASD by accounting for two key factors: the extent of cultivated land and the distribution of irrigation practices. The sampling density is increased in regions with intensive agricultural activities to ensure sufficient representation, while the sampling strategy also captures variability in land management practices across the CONUS. We begin by setting a total sample size of 150 000 images to balance broad spatial coverage with computational feasibility. This total is proportionally distributed across ASDs based on their share of cultivated land, estimated using the fraction of cropland pixels in the WorldCover land cover product. The result is a target number of samples for each ASD, ensuring that regions with more extensive agricultural activities are more heavily represented. To further reflect differences in management practices, we stratify each ASD's sample target into irrigated and rainfed components. The relative allocation between these components is derived from the LANID dataset, using the estimated proportion of irrigated and rainfed cropland within each ASD. Following stratification, we implement a fishnet-based adaptive grid sampling method to ensure spatial diversity and reduce sample clustering within both irrigated and rainfed categories. Clustering is particularly likely in areas with dense road networks or uneven GSV coverage, where cropland field-view GSV metadata tend to be concentrated. To enable this stratified sampling, we first assign irrigation status to each cropland field-view GSV metadata by analyzing LANID values within a 50 m semi-circular buffer oriented along the GSV heading. This allows us to associate each cropland field-view GSV metadata with the dominant irrigation condition of the field it represents and classify it into either the irrigated or rainfed stratum. Sampling is then conducted independently for irrigated and rainfed strata. A uniform 10 km grid is first overlaid on each ASD, and the grid cell size is iteratively adjusted until the number of cells containing at least one valid cropland field-view GSV metadata aligns with the stratified sample target for the irrigated or rainfed stratum. From each qualifying grid cell, one cropland field-view GSV metadata is randomly selected. By explicitly linking sample allocation to cropland extent, irrigation distribution, and spatial coverage, this strategy yields a robust, well-distributed, and management-aware set of cropland field-view GSV metadata. These sampled cropland field-view GSV metadata are then used to retrieve cropland field-view GSV imagery via the Google Street View API to build the CropGSV-Ref dataset.
After retrieving the sampled cropland field-view GSV imagery, we construct the GSV component of the CropGSV-Ref dataset through a systematic manual labeling process. Crop type annotations are conducted with guidance from a plant biologist and supported by external resources such as iNaturalist (Van Horn et al., 2018). The resulting dataset includes 17 dominant crop type classes (Fig. 3), including soybean, corn, sorghum, alfalfa, cotton, peanut, sunflower, almond, grape, orange, pistachio, walnut, potato, sugarbeet, (small-grain) cereal, canola, sugarcane, along with an “others” category depicting non-agricultural scenes, rare crops or those lacking identifiable crop features. Given the visual similarity of small-grain cereals in field-view imagery, we group rice, wheat, and other cereals (e.g., millet, rye, triticale) into a single category to reduce labeling ambiguity (Huang et al., 2022; Peña-Barragán et al., 2011). For each crop type, we label up to 2500 high-quality GSV images. Images are excluded from the dataset if they show poor lighting, motion blur, or occlusion features. This labeling protocol ensures that the crop type annotations used in model training and evaluation are both visually interpretable and agronomically meaningful across diverse U.S. cropping systems.

Figure 3Examples of the GSV component of the CropGSV-Ref reference dataset showcasing the cropland field-view GSV images of 17 crop types (GSV images are from Imagery © 2024 Google Maps).
To build the field boundary component of CropGSV-Ref, we collect corresponding satellite imagery for each GSV image labeled with a crop type. For each labeled GSV image, we identified the highest quality, least cloudy Sentinel 2 L2A scene within a ±1 month window around the GSV capture month (based on GSV Month–Year metadata) to ensure temporal alignment and consistent vegetation conditions. We then extract the corresponding 512 × 512 pixel image tile centered on the GSV's in-field location coordinate. When Sentinel-2 imagery is unavailable or compromised by cloud cover or seasonal mismatch, we supplement with NAIP aerial imagery, selecting acquisitions closest in date to maintain phenological consistency. To reduce manual effort in field boundary delineation, we apply the base SAM model using the coordinates of the cropland field-view imagery as point prompts to generate initial boundary predictions. These preliminary outputs are manually refined to ensure spatial accuracy and consistency. During manual boundary delineation, we focus on productive boundaries, which are the divisions between different crop types that may exist within a single field. This approach ensures that delineation reflects crop-specific management practices rather than relying solely on visible physical separations. In cases of unclear boundaries due to mixed cropping or low contrast, multi-temporal imagery from the growing season is used to verify field extents.
Each annotated sample in the CropGSV-Ref dataset includes a geotagged cropland field-view GSV image, an assigned crop type label, the corresponding acquisition date (year and month), a linked Sentinel-2 satellite image, and a digitized cropland field boundary polygon. With extensive spatial coverage and accurate semantic labeling, the reference dataset supports robust development and assessment of the object-based crop type ground truthing framework throughout CONUS. CropGSV-Ref is partitioned into three splits: training (60 %), validation (20 %), and testing (20 %). The training and validation splits are used to develop the two key components of the framework: CONUS-UncertainFusionNet for crop type classification (Sect. 3.1.3) and the fine-tuned SAM model for cropland field boundary delineation (Sect. 3.1.4). The testing split is used to evaluate the overall performance of the framework in collecting object-based crop type ground truth information (Sect. 3.2).
3.1.3 Crop Type Identification
To retrieve the crop type labels from cropland field-view imagery, we develop CONUS-UncertainFusionNet, an uncertainty-aware crop type classification model tailored for the CONUS region. This model extends the original UncertainFusionNet crop type identification model by incorporating a broader range of crop types from CropGSV-Ref and extending its applicability from regional to nation-wide scale (Liu et al., 2024). UncertainFusionNet was selected for its ability to fuse multi-scale visual features, combining fine-grained textures and global spatial patterns while explicitly modeling prediction uncertainty. Unlike standard deterministic classifiers, it provides not only accurate predictions but also confidence estimates, which are crucial in heterogeneous agricultural landscapes where mixed cropping, visual ambiguity, or suboptimal imagery may challenge conventional models. Its Bayesian formulation enables uncertainty quantification at the image level, improving interpretability, guiding downstream decision-making, and supporting the construction of more reliable datasets across diverse agricultural environments.
CONUS-UncertainFusionNet comprises two primary components: (1) a feature fusion module, and (2) a Bayesian classification module (Fig. 4). The feature fusion module is designed to extract rich visual representations from field-view GSV imagery by integrating two complementary backbones, namely ResNet-50 and ViT-B16. ResNet-50 (He et al., 2016), a convolutional neural network with residual connections, is employed to extract hierarchical visual features, e.g., texture, edge patterns, and spatial structures at the field level, which are important cues for distinguishing crop types (Wang et al., 2019). In parallel, ViT-B16 (Dosovitskiy et al., 2021) can capture global spatial relationships by encoding the image as a sequence of linearly embedded non-overlapping patches. The outputs from these two backbone networks are concatenated to form a unified feature representation to integrate both fine-grained visual cues and broader spatial context, enabling more comprehensive characterization of the input imagery, which are critical for accurate crop type classification in heterogeneous agricultural landscapes. This fused representation is then passed to the Bayesian classification module, which consists of two fully connected layers, each followed by dropout. Rather than producing a single deterministic output, the module estimates a predictive distribution over crop type classes by aggregating output probabilities, , across the posterior distribution of model parameters (Eq. 1). Specifically, each forward pass through the network yields class-wise probabilities via a softmax activation (Bridle, 1990), which transforms the model's raw outputs into a normalized probability distribution over crop type classes, and multiple stochastic passes (enabled by dropout) are used to approximate the posterior predictive distribution.
where x* denotes an input image, and y* denotes the corresponding output of the neural network model constructed with the training data X and Y (label). y* is a vector comprising elements , with in this vector denoting the probability of class c, obtained through the softmax function. θ represents the set of weight parameters of the trained neural network model.

Figure 4Architecture of CONUS-UncertainFusionNet, featuring dual-branch feature fusion (ResNet-50 and ViT-B16) and a Bayesian classifier for crop type prediction with uncertainty estimation (entropy and variance). The GSV image shown for architecture illustration is from Imagery © 2024 Google Maps.
To estimate the predictive distribution, Monte Carlo (MC) dropout (Gal and Ghahramani, 2016) is employed to approximate Bayesian inference by performing multiple stochastic forward passes. Each pass samples a different set of active neurons due to dropout, effectively simulating a different model instance. This process yields a set of class probability vectors (via the softmax function), which are then aggregated to approximate the predictive distribution over crop type classes (Eq. 2).
where T is the number of stochastic forward pass predictions, and θt denotes sampled model weights.
Based on this predictive distribution, we quantify uncertainty in crop type identification using two statistical measures: entropy and variance (Abdar et al., 2021; Gour and Jain, 2022; Arco et al., 2023; Liu et al., 2024). Entropy H quantifies the degree of disorder or ambiguity in the class probability vector, with higher entropy indicating more unpredictability in the model's outputs. Variance σ2 captures the variability of predicted probabilities across the T predictions, providing a measure of the model's output stability. To filter out predictions with high uncertainty, CONUS-UncertainFusionNet applies thresholds to both entropy and variance (Abdar et al., 2021; Gour and Jain, 2022; Arco et al., 2023). These thresholds are determined by analyzing the intersection points of uncertainty metrics' density distributions for both correctly and wrongly identified predictions across all classes during CONUS-UncertainFusionNet training process (Fig. 4). This approach ensures an optimal tradeoff between classification accuracy and the number of field-view images retained for ground truth collection. The filtering rule is expressed with an indicator function (Eq. 3).
where an output of 1 signifies that a prediction has relatively high confidence and should be retained. An output of 0 indicates that a prediction has relatively high uncertainty and should be removed.
To enhance uncertainty-awareness of CONUS-UncertainFusionNet, we adopt a composite loss function (Eq. 4) combining cross-entropy with predictive entropy. This loss guides the training process by encouraging confident predictions for well-classified samples while maintaining uncertainty for ambiguous cases, ultimately improving the separability of uncertainty distributions between correct and incorrect classifications.
where tic is 1 when c is the index of correct class for the ith cropland field-view GSV image, otherwise it is 0. denotes the model's predicted probability that the ith field-view image belongs to class c. N is the total number of all field-view images, and C is the number of classes.
CONUS-UncertainFusionNet is trained on the training split of GSV component of CropSight-Ref dataset, covering diverse crop types across CONUS (Fig. 3). Both ResNet-50 and ViT-B16 within the feature fusion module are initialized with ImageNet pre-trained weights to leverage transferable visual representations. Model hyperparameters, including network architecture, learning rate, and number of training epochs, are selected by optimizing performance on the validation split, to ensure robustness and generalizability. Specifically, the network is optimized using stochastic gradient descent (SGD) with a learning rate of 0.001, momentum of 0.9, batch size of 18, and trained for 150 epochs with early stopping based on validation loss (Gupta et al., 2021; Gour and Jain, 2022; Liu et al., 2024). To ensure uncertainty metrics provide a consistent confidence standard across different agricultural contexts, we determine global thresholds using the validation split. By plotting the density distributions of entropy and variance for correctly and incorrectly classified samples aggregated across all crop types (Fig. 5), we identify the intersection points as the optimal high-confidence thresholds (entropy < 0.032187, variance < 0.000128) are determined using the validation split of the GSV component in CropGSV-Ref. This approach defines a mathematically absolute equilibrium where the metrics are directly comparable between classes; for example, a specific entropy value represents the same level of model ambiguity whether the input is a corn or soybean field, facilitating uniform data filtering for downstream applications. All experiments are conducted on the Illinois Campus Cluster Program (ICCP) at the University of Illinois Urbana–Champaign. The computational infrastructure consists of dual AMD EPYC 7763 processors, 512 GB of system memory, and four NVIDIA A100 GPUs with 80 GB of GPU memory each, connected through 25G high speed networking nodes.

Figure 5Distributions of uncertainty scores for correctly (blue) and incorrectly (orange) classified samples produced by the CONUS-UncertainFusionNet model. The uncertainty threshold is determined at the intersection point of the two density curves, representing the optimal separation between high- and low-confidence predictions.
3.1.4 Cropland Field Boundary Delineation
In parallel, to obtain object-based crop type ground truth, the Segment Anything Model (SAM) is fine-tuned to delineate cropland field boundaries corresponding to the crop type labels extracted from the cropland field-view GSV imagery. SAM is chosen for its flexibility and strong performance and generalization capabilities across diverse segmentation tasks, making it a promising foundation for adapting to satellite imagery (Osco et al., 2023). SAM consists of three main components (Fig. 6): an image encoder that extracts high-dimensional visual features (image embedding), a prompt encoder that embeds user-provided inputs (in our case, using the coordinate of each cropland field-view GSV as the point prompt), and a mask decoder that generates segmentation masks via two-way cross-attention (Kirillov et al., 2023). While SAM performs well on natural images, its effectiveness on satellite imagery is limited due to weaker spectral contrast at field boundaries and increased scene complexity (Osco et al., 2023; Ferreira et al., 2025; Sumesh et al., 2025). To address this limitation, we fine-tune SAM's mask decoder using the training split of the field boundary component of CropGSV-Ref, while keeping the image and prompt encoders frozen. This decoder-only adaptation allows SAM to recalibrate its boundary representations to Sentinel-2 imagery, effectively bridging the resolution and spectral domain gap without requiring full model retraining. Prior studies have shown that this approach is a computationally efficient strategy that significantly improves SAM's performance on cropland field boundary segmentation (Liu et al., 2024; Pu et al., 2025).

Figure 6Structure of the SAM with cropland field-view GSV location coordinate as the point prompt for cropland field boundary delineation from Sentinel-2 imagery (© 2024 European Union/ESA/Copernicus Sentinel-2, processed via Google Earth Engine).
Fine-tuning of SAM is conducted using a novel loss function (Eq. 7) that integrates the confidence score loss and the Dice score loss (Milletari et al., 2016). The confidence score loss calculates the mean squared error between SAM's estimated Intersection over Union (IoU) and the actual IoU (Eq. 5), to quantify mask overlap accuracy. The Dice score loss measures the degree of overlap between predicted and ground truth cropland field boundary masks by computing the average difference between 1 and the Dice score (Eq. 6) for all cropland boundary masks. Combining these two losses allows the model to simultaneously improve segmentation accuracy and its ability to estimate prediction reliability, an approach supported by recent studies that highlight the benefits of multi-loss strategies for balancing competing objectives in deep learning segmentation tasks (Terven et al., 2025). IoU is the ratio of the area of overlap between the predicted and ground truth masks to the area covered by the union of both masks. We determine the hyperparameters using the validation split of the field boundary component of CropGSV-Ref, optimizing with the Adam using a learning rate of and a weight decay of 0.01. Fine-tuning is conducted with a batch size of 1 for up to 50 epochs, with early stopping based on the performance on the validation split to prevent overfitting.
where P is the predicted cropland field boundary mask, G is the annotated ground truth cropland field boundary mask from the field boundary component of CropGSV-Ref, |P∩G| is the area of intersection between the predicted and ground truth masks, |P∪G| is the area of their union, and N represents the number of ground truth cropland field boundaries.
3.2 Evaluation of the Crop Type Ground Truthing Framework
To assess the reliability of the crop type ground truthing framework, we evaluate its performance using the testing split of CropGSV-Ref in comparison with benchmark models and products from three perspectives: (1) the accuracy of crop type identification from cropland field-view GSV imagery is assessed using the GSV component of CropGSV-Ref; (2) the effectiveness of cropland field boundary delineation from Sentinel-2 imagery is assessed using the field boundary component of CropGSV-Ref; (3) the extracted object-based crop type information is evaluated using the CropGSV-Ref as object-based crop type ground truth.
To assess the efficacy of CONUS-UncertainFusionNet in identifying crop types from cropland field-view imagery, we compare it against three benchmark models: ResNet-50, ViT-B16, and CONUS-FusionNet. ResNet-50 and ViT-B16 serve as strong single-backbone baselines representing advanced convolution-based and transformer-based feature extraction modeling approaches, respectively. To ensure a fair comparison, both ResNet-50 and ViT-B16 are initialized with ImageNet pre-trained parameters and fine-tuned on the training and validation splits of the GSV component of CropGSV-Ref. CONUS-FusionNet shares the same dual-backbone architecture as CONUS-UncertainFusionNet but excludes uncertainty modeling, relying solely on cross-entropy loss and deterministic predictions without MC dropout. We evaluate all models using standard classification accuracy metrics: precision, recall, F1-score, and overall accuracy on the testing split of the GSV component of CropGSV-Ref. Precision (Eq. 8) is the ratio of true positives (TP) to the sum of TP and false positives (FP), reflecting the model's ability to avoid false crop-type assignments. Recall (Eq. 9) is the ratio of TP to the sum of TP and false negatives (FN), indicating how well the model captures all relevant instances of each crop type. The F1-score (Eq. 10), the harmonic mean of precision and recall, balances these two aspects. We compute these metrics per crop type and report both individual and average crop type metric values. Overall accuracy (Eq. 11) measures the proportion of all correct predictions, providing a general assessment of model performance across all crop types. Together, these metrics offer a robust assessment of the models' ability in classifying crop types from cropland field-view GSV imagery.
To evaluate the fine-tuned SAM model's ability to delineate cropland boundaries from Sentinel-2 images, we compare its performance in field boundary delineation against the base SAM model and the field boundary polygons from the CSB dataset. We evaluate the field boundaries extracted with the base SAM, CSB, and fine-tuned SAM models using the testing split of the field boundary component of CropGSV-Ref. Performance is assessed at the object level using precision (Eq. 8), recall (Eq. 9), and F1 score (Eq. 10), based on the spatial overlap between predicted and ground truth cropland boundaries. An IoU threshold of 0.50 is used to determine whether a predicted object is correctly identified (Eq. 5) (He et al., 2017, 2022; Stewart et al., 2020; Braga et al., 2020; Li et al., 2021; Jong et al., 2022; Mei et al., 2022; Gan et al., 2023; Shao et al., 2024). Specifically, predictions with IoU > 0.5 are considered true positives (TP); predictions with 0 < IoU ≤ 0.5 are classified as false positives (FP) due to partial but incorrect overlap; and predictions with IoU = 0 are treated as false negatives (FN), indicating complete detection failure.
To assess the reliability of our crop type ground truthing framework, we evaluate the object-based crop type information it produces in comparison with those from the CSB dataset using the testing split of the CropGSV-Ref. Performance is measured using overall accuracy across all crop types. A crop type object is considered correctly matched only when both the crop type label is accurate (the predicted crop type, CropTypepred, corresponds to the ground truth crop type, CropTypetrue), and the cropland field boundary delineation meets the IoU threshold of 0.5 (Eq. 12). To quantify object-level performance, we calculate the percentage of matched objects (labeled as 1 for a correct match and 0 otherwise) for both crop type ground truthing framework and the CSB dataset, with respect to the testing split of the CropGSV-Ref.
3.3 Production of CropSight-US Dataset
To generate the CropSight-US dataset, we apply the developed crop type ground truthing framework across the entire CONUS. To ensure that the resulting dataset provides broad spatial coverage and captures the diversity of agricultural conditions nationwide, we implement an automated dataset production pipeline to process all available cropland field-view GSV metadata from 2013 to 2023. Since GSV panoramic imagery is typically captured at short spatial intervals (approximately every 10 m), multiple metadata records may correspond to the same agricultural field. To reduce redundancy and prevent repeated ground truthing of the same field, we first spatially link each cropland field-view GSV metadata to cropland field boundaries defined in the CSB dataset. Then, within each CSB-identified field, one cropland field-view GSV metadata is randomly selected to serve as its representative, ensuring spatial uniqueness. Next, to guide the sampling process across crop types, we quantify their spatial distribution by counting the number of retained cropland field-view GSV metadata associated with CSB-identified fields labeled with that crop type. This provides a proxy for evaluating crop street view imagery availability and geographic spread across ASDs. We compute the average amount of metadata per ASD per crop type to establish a baseline for balanced representation, which takes into account crop GSV availability, cultivated extent, and irrigation practices for each ASD. For each crop type and year, all metadata are retained in ASDs with fewer samples than the ASD-average amount of metadata. In ASDs exceeding the average, we retain the baseline number plus a proportionally sampled subset of additional metadata, based on the total number of CSB-linked records for that crop type within the ASD. Finally, to ensure representation of irrigation practices, we stratify the retained samples within each ASD by irrigation status. Specifically, we calculate the proportion of irrigated and non-irrigated fields and set the selection targets for each ASD accordingly, preserving the relative distribution of irrigation types within each crop-ASD combination. The crop-wise cultivated area and irrigation information inform ASD-level sampling targets for each crop type in the final application dataset. Based on these targets, we apply the spatially adapted sampling strategy (Sect. 3.1.2) to select specific cropland field-view GSV to be retrieved and processed, with crop type label identified by CONUS-UncertainFusionNet with uncertainty information, and cropland field boundary delineated by our fine-tuned SAM. Through this approach, the CropSight-US dataset achieves broad and evenly distributed spatial coverage while maintaining scalability and crop-type balance for nationwide agricultural monitoring. To ensure these distances reflect functional management units rather than classification artifacts, we dissolved adjacent CSB polygons sharing the same 2023 crop type label prior to sampling. This analysis allowed us to assess CropSight-US' representativeness across diverse landscape configurations and field accessibility conditions throughout the CONUS.
For each selected cropland field-view GSV metadata, we retrieve the corresponding field-view GSV image, and the least cloudy Sentinel-2 image in or closest to the month of GSV acquisition. We predict the crop type label from the field-view GSV image with associated uncertainty metrics using the CONUS-UncertainFusionNet model and delineate the cropland field boundary from the Sentinel-2 or NAIP (as substitute when high quality, least-cloud Sentinel-2 imagery is not available) imagery using the fine-tuned SAM model. Each entry in the generated CropSight-US ground truth dataset includes the predicted crop type, the associated confidence metrics (entropy, variance, and confidence level), the delineated cropland field boundary, and the year and month when the original GSV image is captured. Section 5.2 summarizes the spatial distribution, temporal coverage, and crop-type composition of the CropSight-US dataset.
4.1 Crop Type Identification
CONUS-UncertainFusionNet outperforms all other benchmark models on the test split of the GSV component of the CropGSV-Ref (Table 1), with a precision of 97.24 %, recall of 97.17 %, F1-score of 97.18 %, and overall accuracy of 97.22 %. Compared to its backbone architectures, ResNet-50 and ViT-B16, it achieves approximately 4 % higher scores across all evaluation metrics. This improvement demonstrates a more robust characterization of the structured and heterogeneous visual patterns in cropland field-view GSV imagery, by combining ResNet's strength in capturing fine-grained local features with ViT's capacity for modeling long-range spatial relationships. Compared to CONUS-FusionNet, CONUS-UncertainFusionNet shows an approximate 2 % improvement across all evaluation metrics, highlighting the benefits of incorporating uncertainty estimation in the crop type classification pipeline. By explicitly modeling prediction uncertainty, it more effectively handles challenging scenarios common in GSV imagery, such as occlusions, indistinct field boundaries, poor image quality, and visually similar crop types, ultimately improving classification robustness under real-world conditions.
Table 1Performance evaluation of CONUS-UncertainFusionNet and benchmark models (i.e., ResNet-50, ViT-B16, CONUS-FusionNet) based on the test split of the GSV component of the CropGSV-Ref dataset. The bold font indicates the best-performing model for each metric.

As shown in the class-wise evaluation (Fig. 7), CONUS-UncertainFusionNet consistently outperforms all benchmark models in crop type classification across nearly all categories. It achieves precision, recall, and F1-scores above 0.95 for most crop types, demonstrating strong robustness and generalizability under diverse agricultural conditions. All models perform well on crops such as corn, soybean, cereal, grape, and sorghum, likely due to their distinct visual characteristics and consistent field patterns, which facilitate reliable identification. ViT-B16 and ResNet-50, however, show significant drops in performance for relatively less represented crops like canola, potato, and sunflower, with F1-scores falling below 0.88. This decline is likely due to overlapping visual features and subtle spectral or textural differences, which complicate classification. CONUS-UncertainFusionNet maintains high accuracy on these challenging classes, frequently achieving F1-scores above 0.95. Its robustness is attributed to the integration of uncertainty-aware design, which enables the model to flag and discard low-confidence predictions, reducing misclassifications in ambiguous scenarios. CONUS-FusionNet, while generally effective, shows slightly lower accuracy on visually confounding crop types due to the absence of uncertainty modeling. These results underscore the superior labeling ability of CONUS-UncertainFusionNet across both common and difficult-to-classify crop types, demonstrating its reliability and robustness in operational crop identification tasks.

Figure 7Class-wise performance evaluation of CONUS-UncertainFusionNet and benchmark models (ResNet-50, ViT-B16, and CONUS-FusionNet) in classifying 17 crop types and one “others” class across the CONUS region. Evaluation metrics include F1-score, precision, and recall, calculated using the test split of the GSV component from the CropGSV-Ref reference dataset.
4.2 Cropland Field Boundary Delineation
As shown in Table 2, the fine-tuned SAM significantly outperforms both the base SAM and the CSB benchmark in cropland field boundary delineation, achieving the highest precision (0.9601), mean IoU (0.9452), and F1 score (0.9801). Among the three methods, the base SAM yields the lowest performance, with a precision of 0.6564 and an F1 score of 0.7926. This lower performance is largely due to the base SAM's original design for general-purpose segmentation of natural images, which is not tailored to distinguish subtle differences between adjacent agricultural parcels in satellite imagery. The CSB benchmark shows slightly better performance than the base SAM, with the F1 score of 0.8375, but still falls short of the fine-tuned SAM. The superior performance of the fine-tuned SAM can be attributed to the domain-specific fine-tuning and task-adapted prompt design. Fine-tuning enables the model to better capture the structural and texture characteristics unique to agricultural landscapes, while the use of strategically placed point prompts near probable field boundaries guides the model's attention to critical spatial discontinuities (e.g., linear edges and subtle textural contrasts) that are frequently overlooked by models trained on general-purpose datasets.
Table 2Performance of fine-tuned SAM and benchmark models/products in cropland field boundary delineation. The evaluation excludes the “Others” class (500 samples in the test split of CropGSV-Ref), as this category includes non-agricultural landscapes such as forests or built-up areas in the GSV component of CropGSV-Ref, which are not always associated with distinct cropland boundaries.

Visual comparison reveals distinct differences in cropland field boundary delineation quality among the boundaries from CSB and those generated by the base and fine-tuned SAM models (Fig. 8). The fine-tuned SAM produces cohesive and complete field boundaries that closely align with ground truth annotations. In contrast, the base SAM frequently generates incomplete or imprecise boundaries when applied directly to satellite imagery without fine-tuning. This limitation stems from its original design for natural image segmentation, which leads to over-segmentation in agricultural imagery by misinterpreting subtle field edges or texture variations as distinct object boundaries. The boundaries retrieved from the CSB product are more variable. In some cases, they are smaller than the actual field extent, while in others, they appear overly generalized. This variability likely arises from the CSB's boundary generation strategy, which relies on multi-year CDL composites and rule-based vectorization techniques. Such an approach can introduce spatial mismatches with current field configurations due to temporal averaging and generalized assumptions about field boundaries. In summary, both accuracy metrics and visual comparisons consistently demonstrate that the fine-tuned SAM more effectively captures cropland field boundaries corresponding to the cultivated crops identified from the cropland field-view GSV images, outperforming both the base SAM and the CSB benchmark.

Figure 8Examples of annotated crop field boundaries and boundary delineation outputs overlaid on Sentinel-2 satellite imagery (Imagery © 2024 European Union/ESA/Copernicus Sentinel-2, processed via Google Earth Engine). The visualizations include reference ground truth delineations (from the field boundary component of CropGSV-Ref) alongside boundary delineation results from the base SAM, Crop Sequence Boundary (CSB) benchmark and the fine-tuned Segment Anything Model (SAM), illustrating typical segmentation performance across diverse field conditions.
4.3 Evaluation of Crop Type Ground Truthing Framework and Benchmark CSB Product
As shown in Fig. 9, the object-based crop type information produced by the crop type ground truthing framework consistently demonstrates superior performance compared to that from the CSB benchmark, across all three evaluation metrics: F1-score for crop type identification, F1-score for cropland field boundary delineation, and object-level accuracy. The framework achieves crop type label F1-scores exceeding 0.95 for the majority of crop types, with improvements over CSB up to 11 %. In terms of boundary delineation, the framework also exhibits a notable advantage, with F1-score gains ranging from 5 %–18 %. These differences reflect the fundamentally distinct crop information retrieval strategies underlying the two systems. The crop type ground truthing framework leverages cropland field-view GSV imagery in combination with satellite observations to generate object-level crop type information, whereas the benchmark CSB product relies on pixel-based classifications derived from multi-year CDL composites, which are then converted into field boundaries through rule-based vectorization to produce the object-based crop type information (Boryan et al., 2011; Abernethy et al., 2023; Hunt et al., 2024). The most substantial differences are observed in object-level accuracy, which integrates both semantic correctness of crop type labels and geometric precision of field boundaries. The crop type ground truthing framework consistently achieves object-level accuracy around 0.95, indicating that approximately 95 % of the delineated objects simultaneously meet both labeling and boundary delineation accuracy criteria. Compared to CSB, the object-level accuracy of the crop type ground truthing framework is improved by 15 % to 25 % across crop types. These improvements are particularly pronounced for cereal, corn, and sunflower, where CSB exhibits relatively low performance in both crop classification and boundary delineation. Overall, the CSB benchmark exhibits large variability in performance across crop types, whereas the crop type ground truthing framework maintains consistently high accuracy. The object-based crop type information generated by our framework more reliably captures both the correct crop type and the corresponding field geometry, in contrast to the CSB benchmark, which often introduces errors in one or both aspects (Fig. 10). This consistency indicates robustness of our framework across diverse cropping systems and underscores the framework's suitability for reliable object-based crop type ground truthing.

Figure 9Object-level comparison between object-based crop type information retrieved using the crop type ground truthing framework and Crop Sequence Boundary (CSB) benchmark, including the F1-score for crop type identification, the F1-score for cropland field boundary delineation, and object-based accuracy.
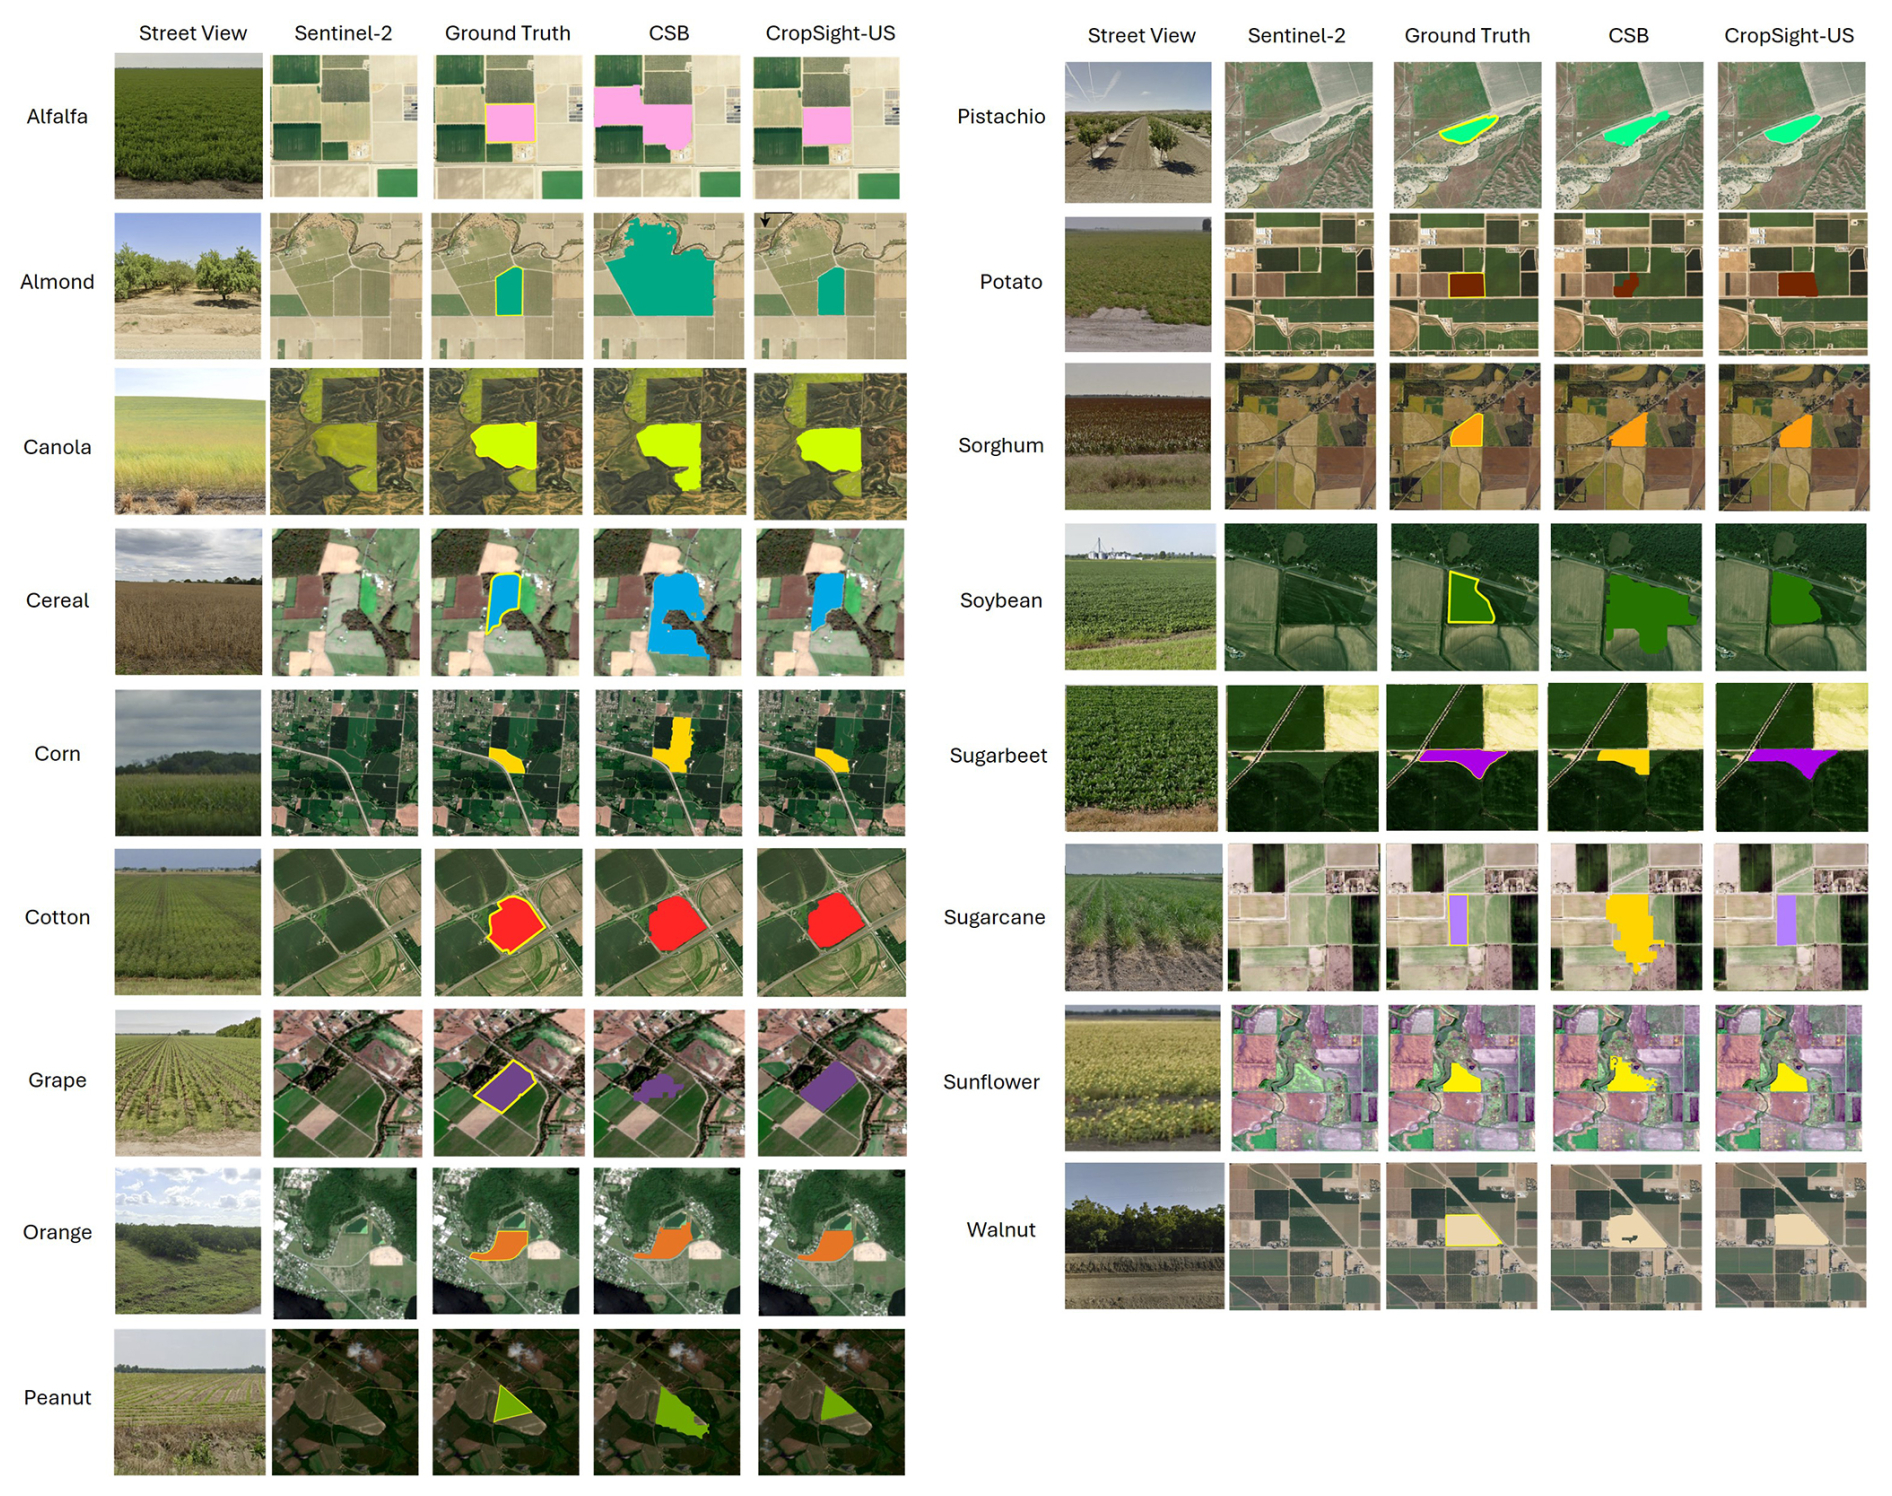
Figure 10Examples across the 17 crop types showcasing roadside field-view GSV imagery, corresponding Sentinel-2 satellite imagery, object-based crop type ground truth, and object-based crop type information generated by Crop Sequence Boundary (CSB) and our ground-truthing framework developed to produce the CropSight-US dataset. GSV images are from © 2024 Google Maps, and Sentinel-2 imagery thumbnails are from © 2024 European Union/ESA/Copernicus Sentinel-2, processed via Google Earth Engine.
5.1 Operational Cropland Field-view GSV Metadata Collection
We compile all cropland field-view GSV metadata across CONUS using our proposed operational field-view GSV metadata collection method. From billions of GSV records available between 2013 and 2023, this process identifies approximately 1.9 million records, which serve as candidates for constructing the CropSight-US dataset. As shown in Fig. 11a, the spatial distribution of collected cropland field-view GSV metadata varies widely across the CONUS, with high concentrations across diverse agricultural regions such as the California Central Valley, Pacific Northwest, the northern Corn Belt, and the Southeast. The number of available cropland field-view GSV metadata varies substantially across ASDs, ranging from several hundred thousand in some regions to only a few hundred or fewer in others. This variation is likely due to the differences in cropland coverage and the update frequency of GSV across regions. Figure 11b presents the temporal distribution of the collected cropland field-view GSV metadata. The cropland field-view GSV metadata spans from 2013 to 2023, with the majority captured between March and September in alignment with key growth stages of dominant crops in the U.S. Midwest. A substantial increase in cropland field-view GSV metadata availability has been observed in more recent years.

Figure 11Spatiotemporal availability of cropland field-view GSV metadata across CONUS. (a) shows the spatial distribution per Agricultural Statistics District (ASD) (© USDA). (b) presents the temporal distribution by month from 2013 to 2023.
5.2 CropSight-US
From the millions of cropland field-view GSV metadata collected, we generate CropSight-US object-based crop type ground truth dataset, consisting of 124 419 records. These object-based crop type ground truth polygons (crop type ground truth objects) span a wide geographic range across ASDs (Fig. 12) and cover the period from 2013 to 2023 (Table 3). Therefore, CropSight-US could mostly capture conditions representative of typical agricultural field configurations in CONUS. The dataset exhibits considerable variation across both crop types and years. Corn is by far the most prominent crop, with 54 069 ground truth objects, and maintains consistent presence throughout the dataset's time span. Other major crops such as soybean (24 628), cereal (10 210), and alfalfa (8203) also contribute substantially to the dataset. A noticeable drop in collected ground truth is observed in 2017 and 2020. The decline in 2020 is likely due to reduced data collection by pandemic-related restrictions, while the drop in 2017 may be attributed to changes in data collection and release delays, or camera hardware updates (Pina, 2024). In recent years, soybean and almond show upward trends in sample counts, indicating either expanded spatial coverage or evolving sampling priorities for those regions with such crops in the GSV acquisition process. Several less widely cultivated crops, such as canola, sunflower, pistachio, and sugarbeet, remain sparsely represented throughout the entire period. Overall, the dataset captures both extensive temporal and spatial variation while also reflecting class imbalance across crop types and years. These characteristics should be considered carefully in downstream modeling and analysis to ensure robust and generalizable outcomes.
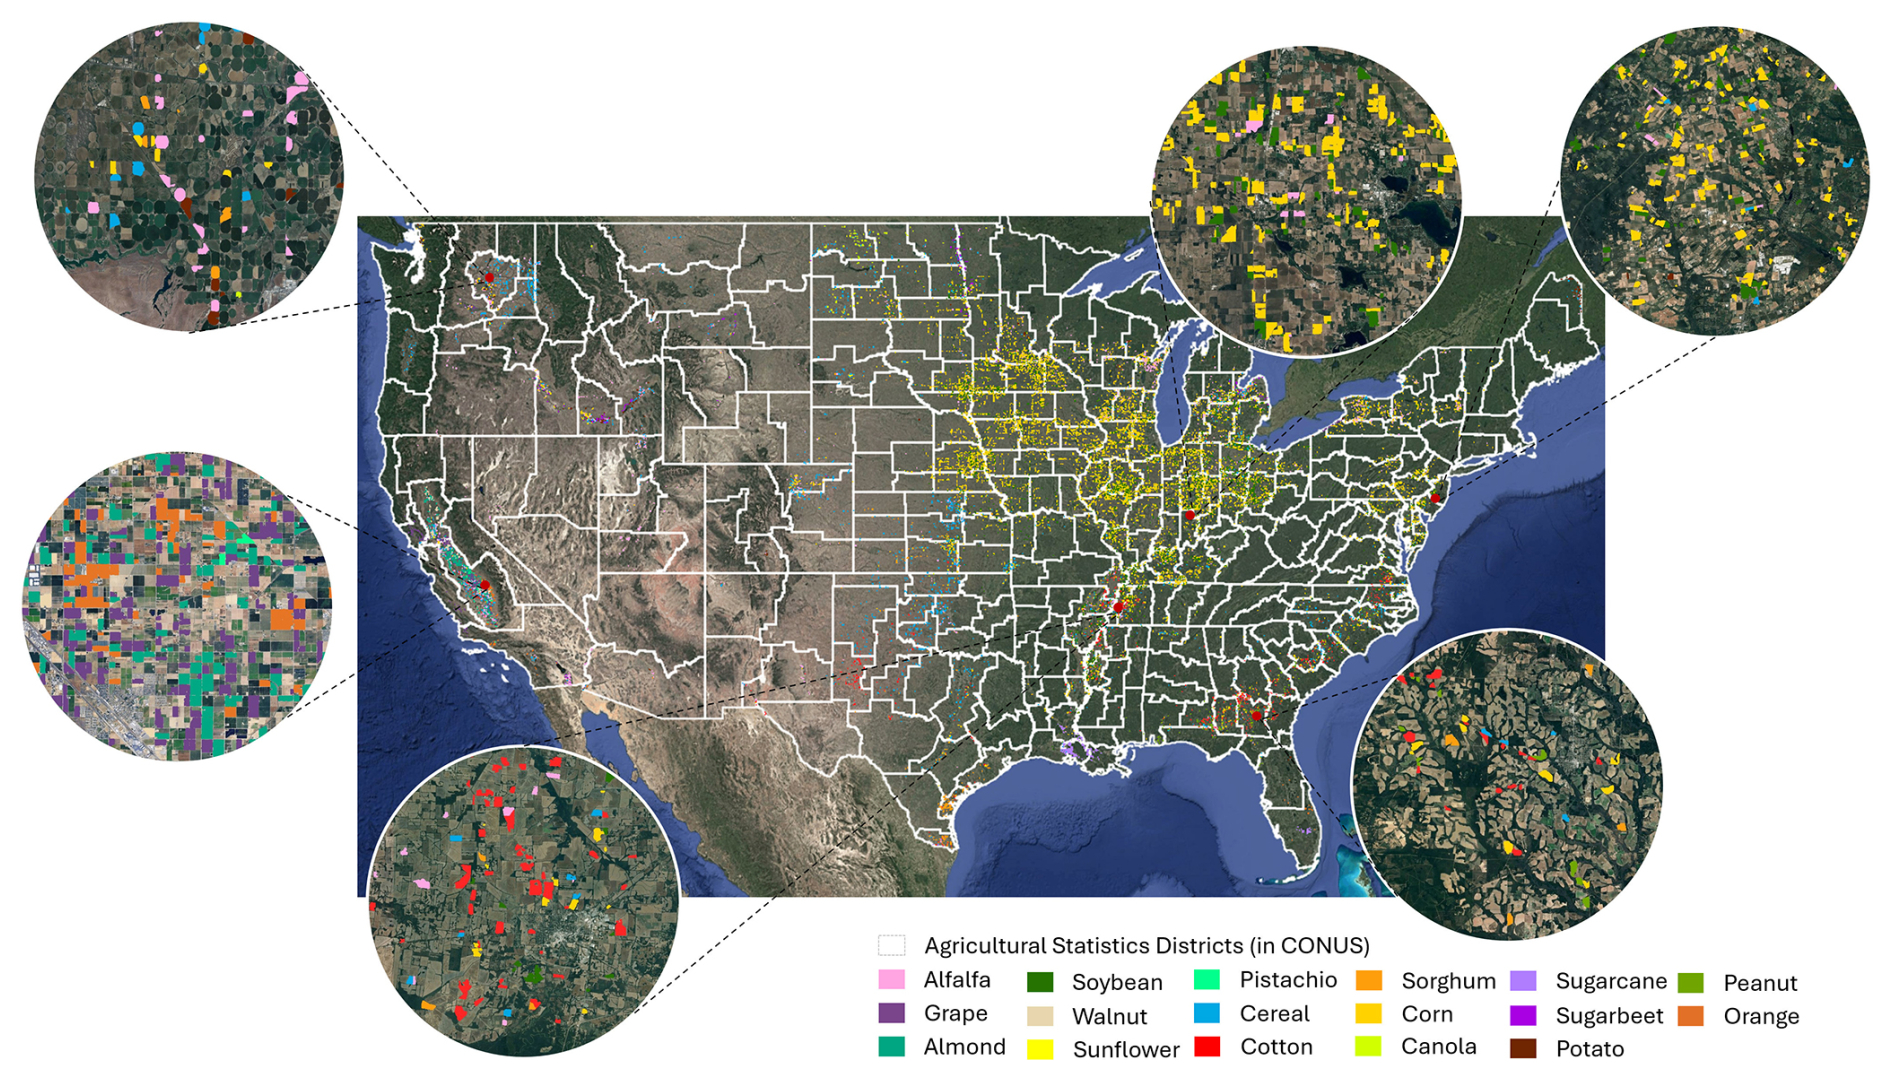
Figure 12Overview and example zoom-in visualizations of the CropSight-US object-based crop type ground truth dataset over the Agricultural Statistics Districts (ASD) from USDA. Satellite base map Imagery © 2026 NASA, accessed via Google Earth Engine.
Table 3Crop type ground truth counts by year for CropSight-US.

The monthly distribution of object-based crop type ground truth polygons in the CropSight-US dataset reveals distinct seasonal trends across the 17 dominant crop types in CONUS (Fig. 13). Most row crops (e.g., corn, soybean) reach peak sample availability between June and September, aligning with the core growing season and periods of optimal visibility in street-view imagery. In contrast, crops with more regionally concentrated cultivation, such as almond, orange, grape, and sugarcane peak earlier in the year, typically from February to May, reflecting regional differences in crop phenology and seasonal GSV availability. This temporal coverage across multiple months supports applications requiring seasonally aligned ground truth data for training and validating in-season crop classification models.

Figure 13Monthly availability of object-based CropSight-US ground truth by crop type across CONUS.
Figure 14 provides a comprehensive overview of the spatial, categorical, and temporal distribution of high confidence crop type ground truth objects in the CropSight-US dataset, revealing key patterns in model-based confidence across ASDs (a), crop types (b), years (c), and months (d). Spatially, high-confidence ground truth objects are concentrated in major production areas such as the Corn Belt and California's Central Valley, where consistent cropping systems and field patterns likely simplify classification and improve label reliability. This spatial concentration improves the dataset's utility for model training and validation in key agricultural zones. Categorically, crops with geographically limited distributions, such as grape, orange, almond, sugarcane, and peanuts, tend to exhibit higher proportions of high-confidence ground truths. This likely reflects more uniform environmental conditions and consistent crop characteristics within their localized growing regions. Meanwhile, crops that are more widely distributed across different regions, such as alfalfa, corn, soybean, cotton, sorghum, and cereal, show a lower share of high-confidence ground truths. This is probably due to greater variability in cultivar types, management practices, and regional conditions, which lead to more diverse field appearances and increase classification challenges. Temporally, the CropSight-US dataset maintains extensive coverage of crop type labels from 2013 to 2023, with high-confidence predictions comprising around 30 %–50 % of total labels in most years or across months, which supports reliable year-to-year comparisons, long-term trend analysis, and the training of temporally aware models using quality-assured data. In 2013, the dataset contains the highest number of ground truths, with over 25 000 records. Except for 2017 and 2020, which have limited data, all other years contribute around or more than 10 000 ground truth samples each. In terms of monthly distribution, the data is highly concentrated during the peak growing season (July to September), with over 80 000 ground truths collected during this period. Collectively, the confidence metrics support the filtering or weighting of training samples, enable targeted model improvement, and guide additional data collection efforts to strengthen classification performance across underrepresented or uncertain regions and crop types.

Figure 14Overview of high confidence (confidence being 1) crop type labels in CropSight-US aggregated by (a) ASD (© USDA), (b) Crop Type, (c) Year and (d) Month across CONUS.
An interactive web-based viewer, hosted on Google Earth Engine (GEE), provides public access to the CropSight-US ground truth dataset and supports visualization of both national-scale crop distributions and field-level observations from 2013 to 2023 (Fig. 15). Each object in the dataset includes the crop type, observation month and year, geographic coordinates, classification uncertainty, and cropland field boundary. The interface allows filtering by year and crop type for user's convenience and further analysis. This tool enhances the dataset's usability for remote sensing research, agricultural monitoring, and geospatial modeling workflows.
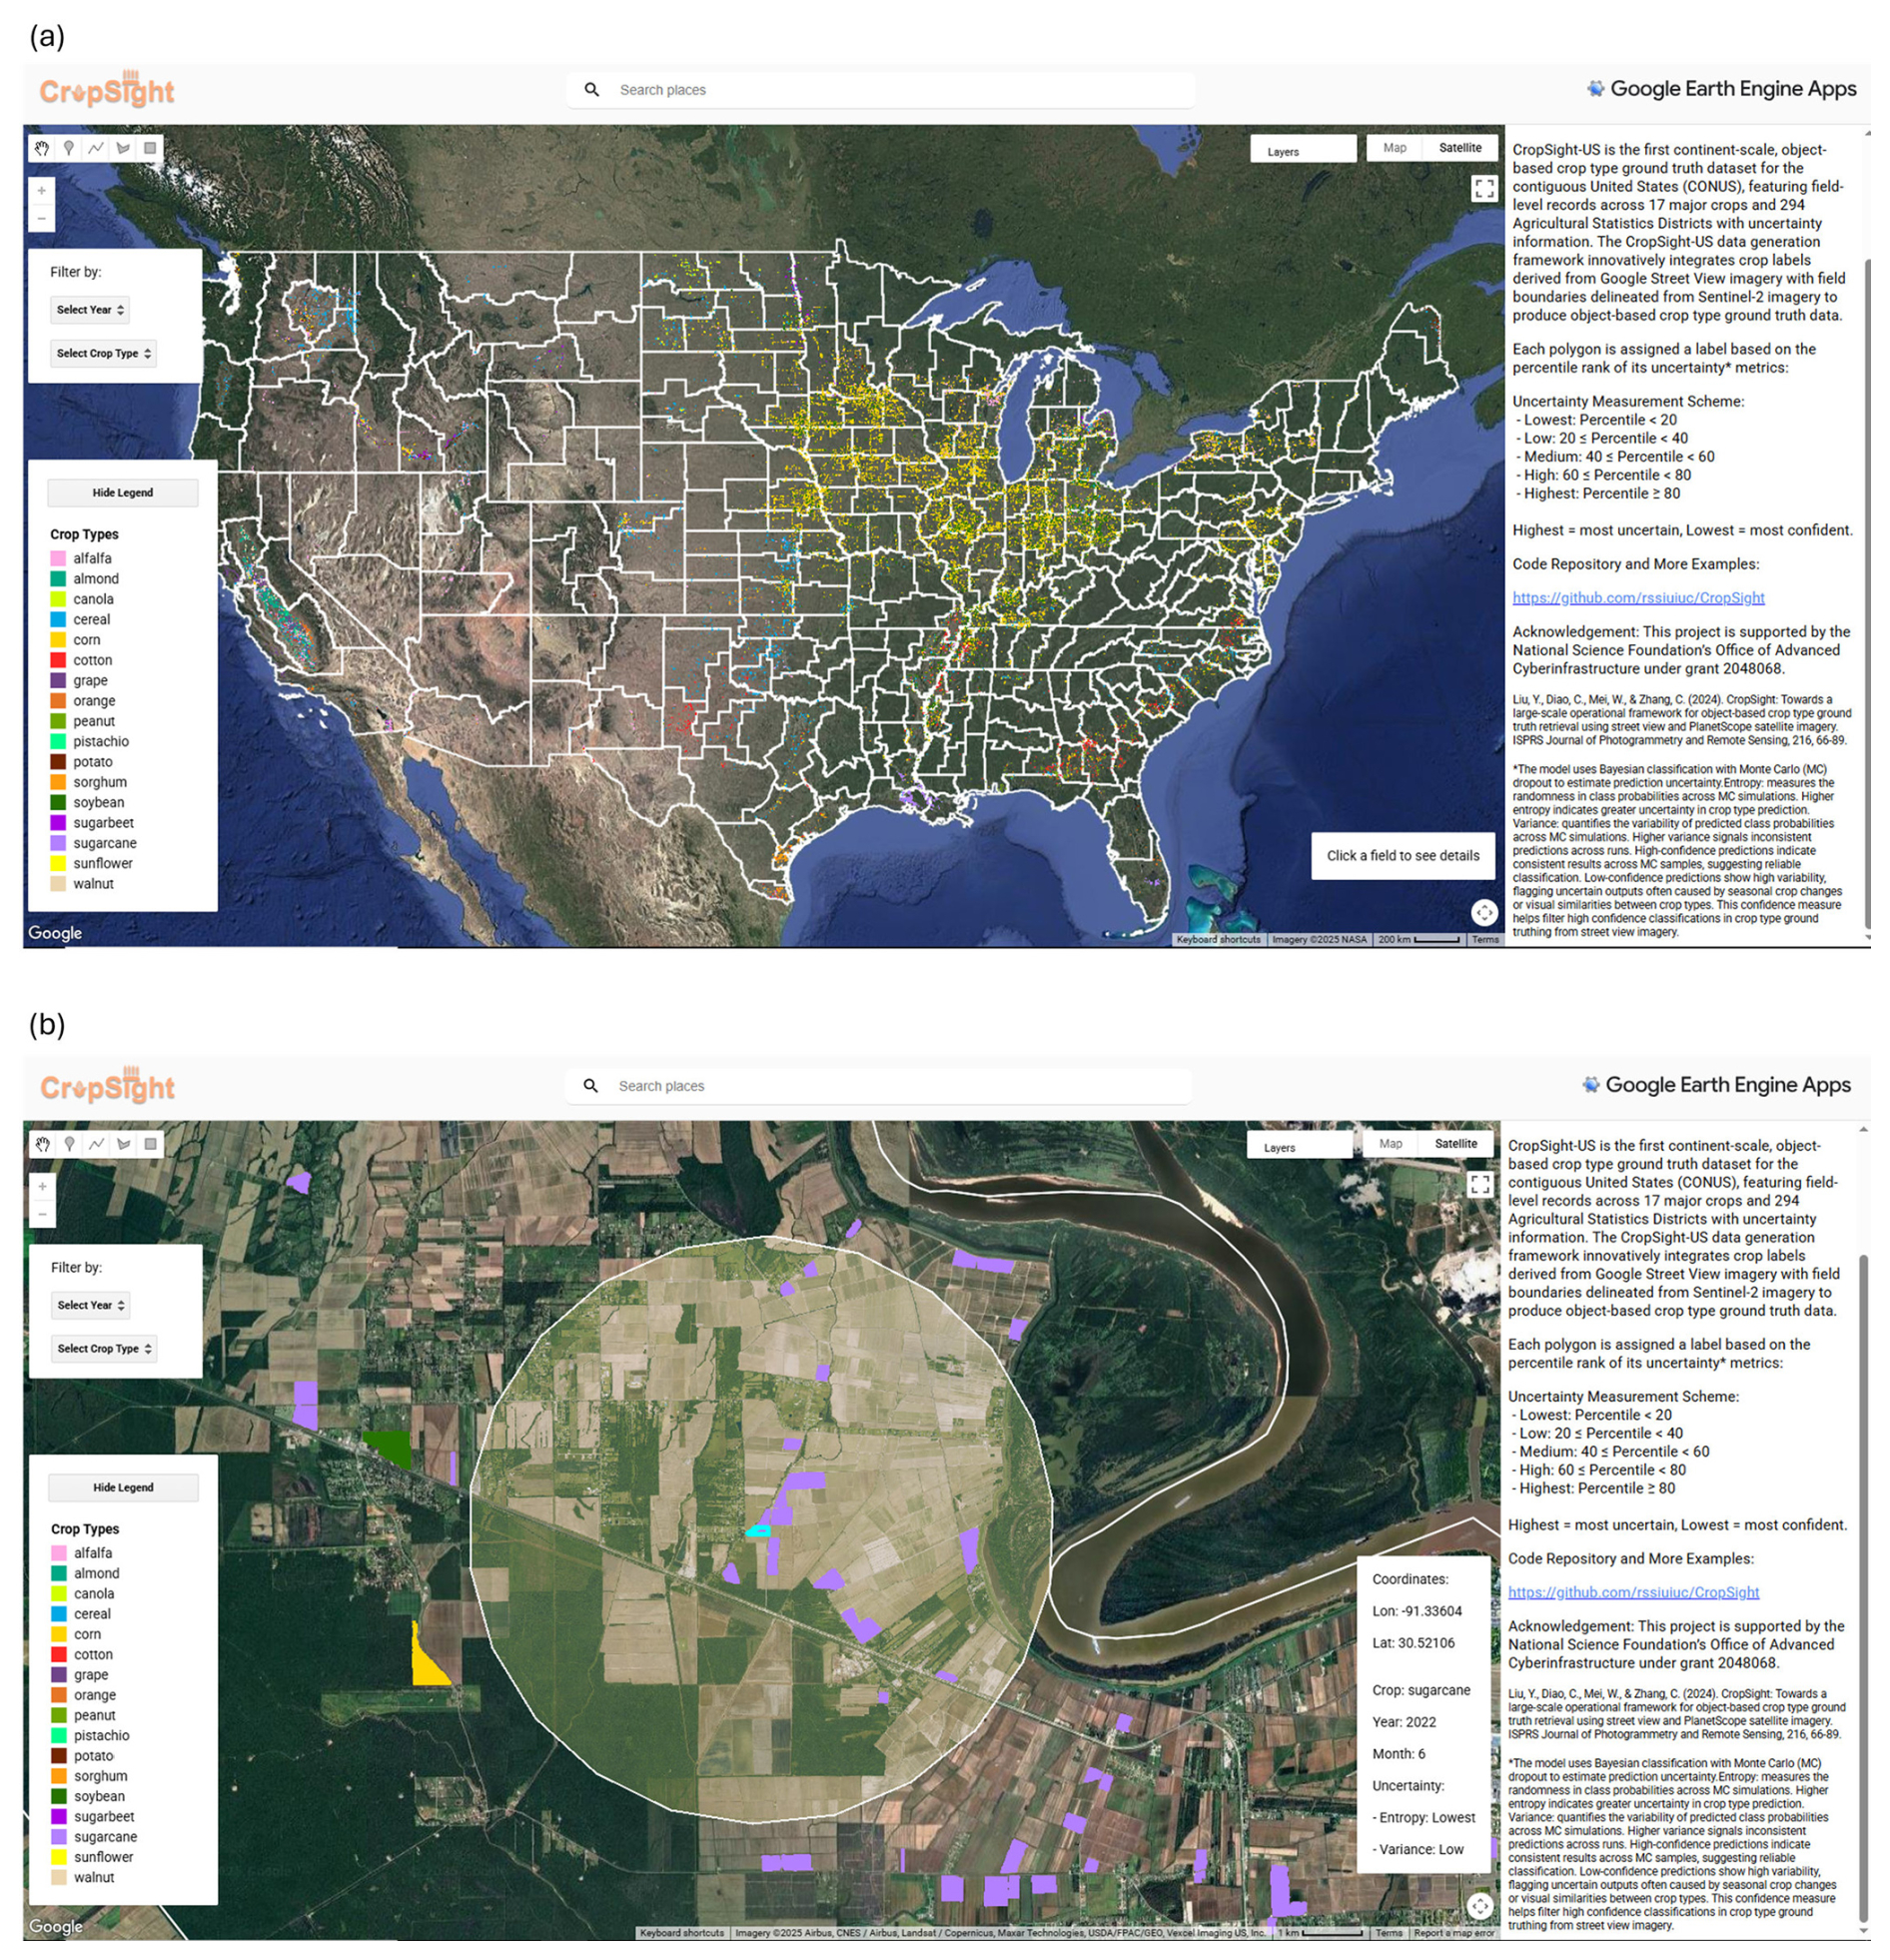
Figure 15CropSight-US viewer within the Google Earth Engine application interface. (A) Overview of the complete ground truth dataset for each Agricultural Statistics Districts (ASD) © USDA. (B) An example of zoomed-in view of a sugarcane field with the nearest-year NAIP imagery (Imagery © 2025 NASA, Airbus, CNES/Airbus, Landsat/Copernicus, Maxar Technologies, USDA/FPAC/GEO, Vexcel Imaging US, Inc.) overlay, accessed via Google Earth Engine. The viewer application is available at https://ee-azzhou249.projects.earthengine.app/view/cropsight-us (last access: 15 December 2025).
Our object-based crop type ground truth dataset CropSight-US, including crop types with uncertainty information, their associated crop field boundaries, and metadata, can be accessed via Zenodo: https://doi.org/10.5281/zenodo.15702414 (Zhou et al., 2025). The CropSight-US dataset does not include any GSV imagery or metadata information that can be used to directly trace back to the original GSV. Access to GSV imagery remains subject to the Google Maps Platform Terms of Service and must be obtained independently by users.
A GEE viewer application of the spatiotemporal distribution of the CropSight-US dataset is available at: https://ee-azzhou249.projects.earthengine.app/view/cropsight-us (last access: 19 April 2026).
We introduce CropSight-US, the first national scale, object-based crop type ground truth dataset across the CONUS. Generated through a novel deep learning framework that integrates GSV and Sentinel-2 imagery, the dataset provides high-quality crop type labels precisely aligned with field boundaries. This dataset fills a critical gap by supplying large-scale, reliable reference data to support agricultural remote sensing model training and benchmark operational crop type mapping at the national scale. The underlying crop type ground truth framework also offers a scalable, timely, and resource-efficient alternative to traditional field surveys and visual interpretations, facilitating broader adoption in both research and operational agricultural application settings.
To support accurate, scalable, and transferable crop type mapping, CropSight-US provides several key advantages that enhance its effectiveness across diverse agricultural conditions. First, CropSight-US provides extensive spatial and temporal coverage of 17 major crop types of varying agricultural landscapes in the United States. This large-scale and high-quality dataset offers a strong foundation for training models capable of accurately mapping a broad range of dominant crops (Jolivot et al., 2021; Van Tricht et al., 2023; Taesiri et al., 2023; Ye et al., 2024). Its broad representativeness across cropping systems, climate zones, and management practices also makes it well suited for few-shot and zero-shot transfer learning applications (Polak et al., 2024; Zhang and Wang, 2024; Wu et al., 2025). This wide exposure to diverse cropping patterns and environmental conditions supports the development of models with richer prior knowledge, enabling more effective adaptation to regions with limited or no available ground truth data (Hao et al., 2020; Nowakowski et al., 2021). Second, CropSight-US provides high-quality, object-based crop type ground truth data, with crop type labels precisely aligned to field boundaries that closely reflect actual cropland parcels (98 % F1 score). Compared to other object-based crop type datasets such as the CSB, which derive boundaries by vectorizing pixel-based crop type classification maps, CropSight-US offers more accurate and geometrically consistent delineations. This improvement results from the use of an advanced prompt-based segmentation method (i.e., SAM), which enables precise boundary delineation for each cropland parcel corresponding to crop type locations identified through cropland field-view GSV imagery. These detailed and accurately delineated field-level annotations are well-suited for training crop type classification models that incorporate field-level characteristics. They also provide high-quality inputs for tasks such as semantic segmentation and object detection, which rely on precise parcel geometry (d'Andrimont et al., 2018; Zheng et al., 2023; Rufin et al., 2024). Third, CropSight-US includes uncertainty information for each crop type label, derived from the CONUS-UncertainFusionNet model. These uncertainties quantify prediction confidence, enabling users to assess label reliability and tailor data usage to specific application needs (Rocchini et al., 2013; Weiss et al., 2020; Khan et al., 2024; Wang et al., 2025). For instance, users may prioritize high-confidence samples for model training or filter out labels based on uncertainty metrics to reduce potential errors in downstream mapping. This additional layer of information strengthens both the robustness and interpretability of large-scale agricultural mapping workflows. Fourth, the ground truthing framework of CropSight-US can acquire within-season crop type ground truth objects. With our devised framework, CropSight-US can be rapidly updated during the growing season whenever new GSV imagery becomes available in the Google Maps database. This enables in-season crop type mapping, supporting timely agricultural monitoring and informed decision-making (Defourny et al., 2019; Gao et al., 2023; Yang et al., 2024). Together, these features position CropSight-US as a valuable resource for a wide range of downstream tasks, including transfer learning for crop type classification in new regions, semantic segmentation for precise field boundary delineation, and object detection for identifying and labeling individual agricultural parcels in high-resolution imagery. Its large spatial and temporal extent, object-level precision, and associated geospatial metadata also make it well-suited for training geo-aware foundation models that learn across spatial, temporal, and semantic dimensions for scalable agricultural monitoring (Yordanov et al., 2023; Xie et al., 2023; Li et al., 2024; Mai et al., 2024; Zhou and Ryo, 2025). While the CropSight-US dataset offers robust, object-based crop type ground truth labels, two key limitations remain that could impact its effectiveness for large-scale crop type monitoring. First, CropSight-US has limited coverage in regions where GSV imagery is sparse, especially in remote or rural farming areas. This imbalance may lead to geographic bias in the collected crop type ground truth dataset and limit the ability of models trained on it to generalize across diverse agricultural regions not yet covered. To improve spatial coverage, future updates to CropSight-US could incorporate imagery from open-source platforms (e.g., KartaView, Mapillary) or other commercial platforms (e.g., Baidu TotalView), to support crop type ground truthing beyond the current cropland field-view GSV coverage. Second, CropSight-US currently groups crop species within certain families, such as small grains (e.g., wheat, rye, and triticale, into a single category, which may limit its usefulness for applications requiring species-level differentiation. This grouping is due to the difficulty of distinguishing these crops using street view imagery, as they often share similar field-level appearances. To address this limitation, future evolution of the crop type ground truthing framework could incorporate phenological dynamics derived from temporal satellite imagery to complement street view observations (Diao, 2020; Diao et al., 2021; Yan and Ryu, 2021; Boyd et al., 2022; Fatchurrachman et al., 2022; d'Andrimont et al., 2022; Wang and Gong, 2022). This integration may improve the ability to differentiate crop species and cultivars within the same family by leveraging temporal growth patterns that are not discernible from static, ground-level imagery alone. In particular, rice production occurs in hydrologically distinct environments characterized by surface flooding and water management infrastructure, whereas wheat and other small grains occupy exhibit fundamentally different moisture and energy regimes. Because GSV imagery captures only a static, ground level perspective, these hydrological differences are not consistently visible, creating the possibility of hydrological mixing when rice and non rice cereals are combined into one class. To mitigate this limitation, we recommend that users conducting rice focused analyses apply auxiliary water related metrics (e.g., Normalized Difference Water Index [NDWI]) or moisture sensitive satellite products to further filter or subset samples associated with flooded conditions. Lastly, CropSight-US provides unprecedented temporal and spatial scale for object-based labels, but its reliance on road-accessible GSV imagery introduces a inherent proximity bias. Much of the U.S. cropland landscape, particularly in the Midwest, is organized under the Public Land Survey System (PLSS), which establishes a regular one-mile grid of section lines along which rural roads are commonly constructed (Abreu et al., 2017). This grid-based infrastructure results in a high proportion of agricultural management units being road-adjacent, thereby enhancing the spatial coverage and practical representativeness of roadside imagery relative to regions with more irregular road networks. We admit that reliance on road-accessible GSV imagery may constrain the spatial representativeness of the GSV-derived ground-truth dataset, particularly in heterogenous agricultural regions characterized by sparse road networks. Accordingly, CropSight-US is best suited for applications that prioritize label reliability and field-level accuracy over complete spatial coverage, such as model training, benchmarking, and transfer learning, rather than for direct wall-to-wall crop type mapping in road-sparse regions.
The CropSight-US dataset also presents numerous opportunities for further expansion, supported by its adaptable and transferable crop type ground truthing framework. This framework has strong potential to collect crop type ground truth information beyond the CONUS region, wherever street-level imagery is available globally (Goel et al., 2018; Ringland et al., 2019; Wu et al., 2021; Hou and Biljecki, 2022; Laguarta Soler et al., 2024). By leveraging additional open-source or commercial street view imagery sources, the framework could be scaled to support global crop type mapping and contribute to more comprehensive food security assessments worldwide. The framework design links ground-level observations with overhead satellite imagery, providing a practical use case for cross-view learning, which relates observations from different viewing perspectives in order to learn consistent and transferable representations (Wu et al., 2024; Zhao et al., 2024; Liu et al., 2025; Zhang et al., 2025). It could be used as a foundation for developing and evaluating cross-view learning models in agricultural applications. Additionally, integrating imagery from autonomous vehicles into the crop type ground truthing framework could significantly enhance the timeliness and scalability of ground truth data collection. As these vehicles become more prevalent, they may provide a continuous stream of high-resolution, geotagged field-view imagery, enabling real-time acquisition of crop type ground truth. This advancement would support more responsive, cost-effective ground truth generation and strengthen the foundation for downstream agricultural monitoring and food security assessments (Gao and Zhang, 2021; Jiang et al., 2023; Yang et al., 2023, 2024; Liu et al., 2024).
In conclusion, the CropSight-US dataset marks a significant step forward in crop type mapping by providing accurate, object-based crop type ground truth data of 17 major crop types across the CONUS from 2013 to 2023. By identifying crop types from visual cues in GSV imagery and delineating corresponding field boundaries using Sentinel-2 data, CropSight-US demonstrates substantial improvements in spatial and temporal coverage, label quality, and object-level accuracy. These enhancements enable scalable and in-season crop type mapping, offering detailed spatial context critical for diverse agricultural applications including crop phenology monitoring (Gao and Zhang, 2021; Liu et al., 2023), irrigation planning (Karthikeyan et al., 2020; Paolini et al., 2022), and yield forecasting (Karthikeyan et al., 2020; Zhang and Diao, 2023). The robust and transferable crop type ground-truthing framework behind CropSight-US shows strong potential for large-scale expansion through integration with additional street view imagery sources and autonomous vehicle imagery. Together, the CropSight-US dataset and framework offer a powerful foundation for advancing precision agriculture, supporting food security, and generating actionable insights at a global scale.
ZZ, YL and CD conceptualized the study and developed the methodology. ZZ and YL conducted data curation and formal analysis, implemented the software, and generated the visualizations. CD secured funding, managed the project, provided supervision and resources, and contributed to writing – review and editing. ZZ and YL prepared the original draft with contributions and revisions from all co-authors.
The contact author has declared that none of the authors has any competing interests.
Publisher's note: Copernicus Publications remains neutral with regard to jurisdictional claims made in the text, published maps, institutional affiliations, or any other geographical representation in this paper. The authors bear the ultimate responsibility for providing appropriate place names. Views expressed in the text are those of the authors and do not necessarily reflect the views of the publisher.
This research uses the TGI RAILs advanced compute and data resource which is supported by the National Science Foundation (award OAC-2232860) and the Taylor Geospatial Institute, and is supported in part by the Illinois Computes project which is supported by the University of Illinois Urbana-Champaign and the University of Illinois System.
We received funding partly by the National Science Foundation (grant no. 2048068), partly by the National Aeronautics and Space Administration (grant no. 80NSSC21K0946), and partly by the United States Department of Agriculture (grant no. 2021-67021-33446).
This paper was edited by Peng Zhu and reviewed by three anonymous referees.
Abdar, M., Fahami, M. A., Chakrabarti, S., Khosravi, A., Pławiak, P., Acharya, U. R., Tadeusiewicz, R., and Nahavandi, S.: BARF: A new direct and cross-based binary residual feature fusion with uncertainty-aware module for medical image classification, Inform. Sciences, 577, 353–378, https://doi.org/10.1016/j.ins.2021.07.047, 2021.
Abernethy, J., Beeson, P., Boryan, C., Hunt, K., and Sartore, L.: Preseason crop type prediction using crop sequence boundaries, Comput. Electr. Agr., 208, 107768, https://doi.org/10.1016/j.compag.2023.107768, 2023.
Abreu, A., Lawson, L. A., Hyman, M., Hardin, R., and Gerling, M.: Collecting data from a permanent grid sampling frame via a mobile mapping instrument, NASS Res. Rep., 322824, United States Department of Agriculture, National Agricultural Statistics Service, https://doi.org/10.22004/ag.econ.322824, 2017.
Anguelov, D., Dulong, C., Filip, D., Frueh, C., Lafon, S., Lyon, R., Ogale, A., Vincent, L., and Weaver, J.: Google Street View: Capturing the world at street level, Computer, 43, 32–38, https://doi.org/10.1109/MC.2010.170, 2010.
Arco, J. E., Ortiz, A., Ramírez, J., Martínez-Murcia, F. J., Zhang, Y.-D., and Górriz, J. M.: Uncertainty-driven ensembles of multi-scale deep architectures for image classification, Inform. Fusion, 89, 53–65, https://doi.org/10.1016/j.inffus.2022.08.010, 2023.
Becker-Reshef, I., Barker, B., Whitcraft, A., Oliva, P., Mobley, K., Justice, C., and Sahajpal, R.: Crop type maps for operational global agricultural monitoring, Sci. Data, 10, 172, https://doi.org/10.1038/s41597-023-02047-9, 2023.
Boryan, C., Yang, Z., Mueller, R., and Craig, M.: Monitoring US agriculture: the US Department of Agriculture, National Agricultural Statistics Service, Cropland Data Layer program, Geocarto Int., 26, 341–358, https://doi.org/10.1080/10106049.2011.562309, 2011.
Boyd, D. S., Crudge, S., and Foody, G.: Towards an automated approach for monitoring tree phenology using vehicle dashcams in urban environments, Sensors, 22, 7672, https://doi.org/10.3390/s22197672, 2022.
Braga, J. R. G., Peripato, V., Dalagnol, R., Ferreira, M. P., Tarabalka, Y., Aragão, L. E. O. C., de Campos Velho, H. F., Shiguemori, E. H., and Wagner, F. H.: Tree crown delineation algorithm based on a convolutional neural network, Remote Sens., 12, 1288, https://doi.org/10.3390/rs12081288, 2020.
Bridle, J. S.: Probabilistic Interpretation of Feedforward Classification Network Outputs, with Relationships to Statistical Pattern Recognition, in: Neurocomputing: Algorithms, Architectures and Applications, Springer, Berlin, Heidelberg, 227–236, https://doi.org/10.1007/978-3-642-76153-9_28, 1990.
Cai, Y., Guan, K., Peng, J., Wang, S., Seifert, C., Wardlow, B., and Li, Z.: A high-performance and in-season classification system of field-level crop types using time-series Landsat data and a machine learning approach, Remote Sens. Environ., 210, 35–47, https://doi.org/10.1016/j.rse.2018.02.045, 2018.
Castle, S. E., Miller, D. C., and Wardropper, C. B.: Mapping the social-ecological suitability of agroforestry in the US Midwest, Environ. Res. Lett., 20, 024041, https://doi.org/10.1088/1748-9326/adab09, 2025.
Chivasa, W., Mutanga, O., and Biradar, C.: Application of remote sensing in estimating maize grain yield in heterogeneous African agricultural landscapes: a review, Int. J. Remote Sens., 38, 6816–6845, https://doi.org/10.1080/01431161.2017.1365390, 2017.
d'Andrimont, R., Lemoine, G., and Van der Velde, M.: Targeted grassland monitoring at parcel level using Sentinels, street-level images and field observations, Remote Sens., 10, 1300, https://doi.org/10.3390/rs10081300, 2018.
d'Andrimont, R., Verhegghen, A., Lemoine, G., Kempeneers, P., Meroni, M., and Van der Velde, M.: From parcel to continental scale – A first European crop type map based on Sentinel-1 and LUCAS Copernicus in-situ observations, Remote Sens. Environ., 266, 112708, https://doi.org/10.1016/j.rse.2021.112708, 2021.
d'Andrimont, R., Yordanov, M., Martinez-Sanchez, L., and Van der Velde, M.: Monitoring crop phenology with street-level imagery using computer vision, Comput. Electr. Agr., 196, 106866, https://doi.org/10.1016/j.compag.2022.106866, 2022.
Defourny, P., Bontemps, S., Bellemans, N., Cara, C., Dedieu, G., Guzzonato, E., and Koetz, B.: Near real-time agriculture monitoring at national scale at parcel resolution: Performance assessment of the Sen2-Agri automated system in various cropping systems around the world, Remote Sens. Environ., 221, 551–568, https://doi.org/10.1016/j.rse.2018.11.007, 2019.
Diao, C.: Remote sensing phenological monitoring framework to characterize corn and soybean physiological growing stages, Remote Sens. Environ., 248, 111960, https://doi.org/10.1016/j.rse.2020.111960, 2020.
Diao, C., Yang, Z., Gao, F., Zhang, X., and Yang, Z.: Hybrid phenology matching model for robust crop phenological retrieval, ISPRS J. Photogramm., 181, 308–326, https://doi.org/10.1016/j.isprsjprs.2021.09.011, 2021.
Dosovitskiy, A., Beyer, L., Kolesnikov, A., Weissenborn, D., Zhai, X., Unterthiner, T., Dehghani, M., Minderer, M., Heigold, G., Gelly, S., Uszkoreit, J., and Houlsby, N.: An Image is Worth 16 × 16 Words: Transformers for Image Recognition at Scale, in: ICLR, 2021, arXiv [preprint], https://doi.org/10.48550/arXiv.2010.11929, 2021.
Duro, D. C., Franklin, S. E., and Dubé, M. G.: A comparison of pixel-based and object-based image analysis with selected machine learning algorithms for the classification of agricultural landscapes using SPOT-5 HRG imagery, Remote Sens. Environ., 118, 259–272, https://doi.org/10.1016/j.rse.2011.11.020, 2012.
Fatchurrachman, R., Rudiyanto, Soh, N. C., Shah, R. M., Giap, S. G. E., Setiawan, B. I., and Minasny, B.: High-resolution mapping of paddy rice extent and growth stages across Peninsular Malaysia using a fusion of Sentinel-1 and -2 time series data in Google Earth Engine, Remote Sens., 14, 1875, https://doi.org/10.3390/rs14081875, 2022.
Ferreira, L. B., Martins, V. S., Aires, U. R., Wijewardane, N., Zhang, X., and Samiappan, S.: FieldSeg: A scalable agricultural field extraction framework based on the Segment Anything Model and 10-m Sentinel-2 imagery, Comput. Electr. Agr., 232, 110086, https://doi.org/10.1016/j.compag.2025.110086, 2025.
Gal, Y. and Ghahramani, Z.: Dropout as a Bayesian Approximation: Representing Model Uncertainty in Deep Learning, Proc. Mach. Learn. Res., 48, 1050–1059, https://proceedings.mlr.press/v48/gal16.html (last access: 15 December 2025), 2016.
Gan, Y., Wang, Q., and Iio, A.: Tree crown detection and delineation in a temperate deciduous forest from UAV RGB imagery using deep learning approaches: Effects of spatial resolution and species characteristics, Remote Sens., 15, 778, https://doi.org/10.3390/rs15030778, 2023.
Gao, F. and Zhang, X.: Mapping crop phenology in near real-time using satellite remote sensing: challenges and opportunities, J. Remote Sens., 2021, 8379391, https://doi.org/10.34133/2021/8379391, 2021.
Gao, F., Jennewein, J., Hively, W. D., Soroka, A., Thieme, A., Bradley, D., Keppler, J., Mirsky, S., and Akumaga, U.: Near real-time detection of winter cover crop termination using harmonized Landsat and Sentinel-2 (HLS) to support ecosystem assessment, Sci. Remote Sens., 7, 100073, https://doi.org/10.1016/j.srs.2022.100073, 2023.
Ghassemi, B., Dujakovic, A., Żółtak, M., Immitzer, M., Atzberger, C., and Vuolo, F.: Designing a European-wide crop type mapping approach based on machine learning algorithms using LUCAS field survey and Sentinel-2 data, Remote Sens., 14, 541, https://doi.org/10.3390/rs14030541, 2022.
Ghassemi, B., Izquierdo-Verdiguier, E., Verhegghen, A., Yordanov, M., Lemoine, G., Moreno Martínez, Á., De Marchi, D., van der Velde, M., Vuolo, F., and d'Andrimont, R.: European Union crop map 2022: Earth observation's 10-meter dive into Europe's crop tapestry, Sci. Data, 11, 1048, https://doi.org/10.1038/s41597-024-03884-y, 2024.
Goel, R., Garcia, L. M. T., Goodman, A., Johnson, R., Aldred, R., Murugesan, M., Brage, S., Bhalla, K., and Woodcock, J.: Estimating city-level travel patterns using street imagery: A case study of using Google Street View in Britain, PLOS One, 13, e0196521, https://doi.org/10.1371/journal.pone.0196521, 2018.
Gour, M. and Jain, S.: Uncertainty-aware Convolutional Neural Network for COVID-19 X-ray Images Classification, Comput. Biol. Med., 140, 105047, https://doi.org/10.1016/j.compbiomed.2021.105047, 2022.
Gupta, A., Ramanath, R., Shi, J., and Keerthi, S. S.: Adam vs. SGD: Closing the Generalization Gap on Image Classification, in: OPT2021: 13th Annual Workshop on Optimization for Machine Learning, December 2021, 7 pp., https://www.opt-ml.org/papers/2021/paper53.pdf (last access: 15 December 2025), 2021.
Hao, P., Di, L., Zhang, C., and Guo, L.: Transfer learning for crop classification with Cropland Data Layer data (CDL) as training samples, Sci. Total Environ., 733, 138869, https://doi.org/10.1016/j.scitotenv.2020.138869, 2020.
Haklay, M. and Weber, P.: OpenStreetMap: User-generated street maps, IEEE Pervas. Comput., 7, 12–18, https://doi.org/10.1109/MPRV.2008.80, 2008.
He, H., Xu, H., Zhang, Y., Gao, K., Li, H., Ma, L., and Li, J.: Mask R-CNN based automated identification and extraction of oil well sites, Int. J. Appl. Earth Obs., 112, 102875, https://doi.org/10.1016/j.jag.2022.102875, 2022.
He, K., Zhang, X., Ren, S., and Sun, J.: Deep Residual Learning for Image Recognition, Proc. IEEE Conf. Comput. Vis. Pattern Recognit. (CVPR), 770–778, https://doi.org/10.1109/CVPR.2016.90, 2016.
He, K., Gkioxari, G., Dollár, P., and Girshick, R.: Mask R-CNN, in: Proc. IEEE Int. Conf. Comput. Vis. (ICCV), 2961–2969, https://doi.org/10.1109/ICCV.2017.322, 2017.
Hou, Y. and Biljecki, F.: A comprehensive framework for evaluating the quality of street view imagery, Int. J. Appl. Earth Obs., 115, 103094, https://doi.org/10.1016/j.jag.2022.103094, 2022.
Huang, X., Fu, Y., Wang, J., Dong, J., Zheng, Y., Pan, B., Skakun, S., and Yuan, W: High-resolution mapping of winter cereals in Europe by time series Landsat and Sentinel images for 2016–2020, Remote Sens., 14, 2120, https://doi.org/10.3390/rs14092120, 2022.
Hunt, K. A., Abernethy, J., Beeson, P., Bowman, M., Wallander, S., and Williams, R.: Crop Sequence Boundaries (CSB): Delineated fields using remotely sensed crop rotations, USDA-NASS [data set], https://www.nass.usda.gov/Research_and_Science/Crop-Sequence-Boundaries/index.php (last access: 15 December 2025), 2024.
Jiang, C., Guan, K., Huang, Y., and Jong, M.: A vehicle imaging approach to acquire ground truth data for upscaling to satellite data: A case study for estimating harvesting dates, Remote Sens. Environ., 300, 113894, https://doi.org/10.1016/j.rse.2023.113894, 2024.
Jolivot, A., Lebourgeois, V., Leroux, L., Ameline, M., Andriamanga, V., Bellón, B., Castets, M., Crespin-Boucaud, A., Defourny, P., Diaz, S., Dieye, M., Dupuy, S., Ferraz, R., Gaetano, R., Gely, M., Jahel, C., Kabore, B., Lelong, C., le Maire, G., Lo Seen, D., Muthoni, M., Ndao, B., Newby, T., de Oliveira Santos, C. L. M., Rasoamalala, E., Simoes, M., Thiaw, I., Timmermans, A., Tran, A., and Bégué, A.: Harmonized in situ datasets for agricultural land use mapping and monitoring in tropical countries, Earth Syst. Sci. Data, 13, 5951–5967, https://doi.org/10.5194/essd-13-5951-2021, 2021.
Jong, M., Guan, K., Wang, S., Huang, Y., and Peng, B.: Improving field boundary delineation in ResUNets via adversarial deep learning, Int. J. Appl. Earth Obs., 112, 102877, https://doi.org/10.1016/j.jag.2022.102877, 2022.
Karthikeyan, L., Chawla, I., and Mishra, A. K.: A review of remote sensing applications in agriculture for food security: Crop growth and yield, irrigation, and crop losses, J. Hydrol., 586, 124905, https://doi.org/10.1016/j.jhydrol.2020.124905, 2020.
Khan, M. S., Moallemi, E. A., Thiruvady, D., Nazari, A., and Bryan, B. A.: Machine learning-based surrogate modelling of a robust, sustainable development goal (SDG)-compliant land-use future for Australia at high spatial resolution, J. Environ. Manage., 363, 121296, https://doi.org/10.1016/j.jenvman.2024.121296, 2024.
Kirillov, A., Mintun, E., Ravi, N., Mao, H., Rolland, C., Gustafson, L., Xiao, T., Whitehead, S., Berg, A. C., Lo, W. Y., and Dollár, P: Segment anything, in: Proceedings of the IEEE/CVF International Conference on Computer Vision (ICCV), IEEE, 4015–4026, https://doi.org/10.1109/iccv51070.2023.00371, 2023.
Koukos, A., Jo, H.-W., Sitokonstantinou, V., Tsoumas, I., Kontoes, C., and Lee, W.-K.: Towards global crop maps with transfer learning, in: IGARSS 2024 – 2024 IEEE Int. Geosci. Remote Sens. Symp., 1540–1545, https://doi.org/10.1109/IGARSS53475.2024.10641793, 2024.
Kussul, N., Lemoine, G., Gallego, F. J., Skakun, S. V., Lavreniuk, M., and Shelestov, A. Y.: Parcel-based crop classification in Ukraine using Landsat-8 data and Sentinel-1A data, IEEE J. Sel. Top. Appl., 9, 2500–2508, https://doi.org/10.1109/JSTARS.2016.2560141, 2016.
Laguarta Soler, J., Friedel, T., and Wang, S.: Combining deep learning and street view imagery to map smallholder crop types, Proceedings of the AAAI Conference on Artificial Intelligence, 38, 22202–22212, https://doi.org/10.1609/aaai.v38i20.30225, 2024.
Li, J., Xu, M., Xiang, L., Chen, D., Zhuang, W., Yin, X., and Li, Z.: Foundation models in smart agriculture: basics, opportunities, and challenges, Comput. Electr. Agr., 222, 109032, https://doi.org/10.1016/j.compag.2024.109032, 2024.
Li, M., Ma, L., Blaschke, T., Cheng, L., and Tiede, D.: A systematic comparison of different object-based classification techniques using high spatial resolution imagery in agricultural environments, Int. J. Appl. Earth Obs., 49, 87–98, https://doi.org/10.1016/j.jag.2016.01.011, 2016.
Li, Y., Xu, W., Chen, H., Jiang, J., and Li, X.: A novel framework based on Mask R-CNN and histogram thresholding for scalable segmentation of new and old rural buildings, Remote Sens., 13, 1070, https://doi.org/10.3390/rs13061070, 2021.
Liu, X., Biagioni, J., Eriksson, J., Wang, Y., Forman, G., and Zhu, Y.: Mining large-scale, sparse GPS traces for map inference: Comparison of approaches, Proceedings of the 18th ACM SIGKDD International Conference on Knowledge Discovery and Data Mining, 18, 669–677, https://doi.org/10.1145/2339530.2339637, 2012.
Liu, Y., Diao, C., and Yang, Z.: CropSow: An integrative remotely sensed crop modeling framework for field-level crop planting date estimation, ISPRS J. Photogramm., 202, 334–355, https://doi.org/10.1016/j.isprsjprs.2023.06.012, 2023.
Liu, Y., Diao, C., Mei, W., and Zhang, C.: CropSight: Towards a large-scale operational framework for object-based crop type ground truth retrieval using street view and PlanetScope satellite imagery, ISPRS J. Photogramm., 216, 66–89, https://doi.org/10.1016/j.isprsjprs.2024.07.025, 2024.
Liu, Z., Zhang, F., Jiao, J., Lao, N., and Mai, G.: GAIR: Improving multimodal geo-foundation models with geo-aligned implicit representations, arXiv [preprint], https://doi.org/10.48550/arXiv.2503.16683, 20 March 2025.
Mai, G., Huang, W., Sun, J., Song, S., Mishra, D., Liu, N., Gao, S., Liu, T., Cong, G., Hu, Y., and Cundy, C.: On the opportunities and challenges of foundation models for GeoAI (vision paper), ACM Trans. Spatial Algorithms Syst., 10, 1–46, https://doi.org/10.1145/3653070, 2024.
Mai, J., Feng, Q., Fu, S., Wang, R., Zhang, S., Zhang, R., and Liang, T.: Enhancing crop type mapping in data-scarce regions through transfer learning: A case study of the Hexi Corridor, Remote Sens., 17, 1494, https://doi.org/10.3390/rs17091494, 2025.
McNairn, H. and Jiao, X.: Crop Survey – Ground Truth for Crop Mapping and Monitoring, IEEE Dataport [data set], https://doi.org/10.21227/x38x-3h75, 2024.
Mei, W., Wang, H., Fouhey, D., Zhou, W., Hinks, I., Gray, J. M., Van Berkel, D., and Jain, M.: Using deep learning and very-high-resolution imagery to map smallholder field boundaries, Remote Sens., 14, 3046, https://doi.org/10.3390/rs14133046, 2022.
Milletari, F., Navab, N., and Ahmadi, S.-A.: V-net: Fully convolutional neural networks for volumetric medical image segmentation, in: Proc. 4th Int. Conf. 3D Vision (3DV), IEEE, 565–571, https://doi.org/10.1109/3DV.2016.79, 2016.
Nowakowski, A., Mrziglod, J., Spiller, D., Bonifacio, R., Ferrari, I., Mathieu, P. P., and Kim, D. H.: Crop type mapping by using transfer learning, Int. J. Appl. Earth Obs., 98, 102313, https://doi.org/10.1016/j.jag.2021.102313, 2021.
Peña-Barragán, J. M., Ngugi, M. K., Plant, R. E., and Six, J.: Object-based crop identification using multiple vegetation indices, textural features and crop phenology, Remote Sens. Environ., 115, 1301–1316, https://doi.org/10.1016/j.rse.2011.01.009, 2011.
Ok, A. O., Akar, O., and Gungor, O.: Evaluation of random forest method for agricultural crop classification, Eur. J. Remote Sens., 45, 421–432, https://doi.org/10.5721/EuJRS20124535, 2012.
Osco, L. P., Wu, Q., De Lemos, E. L., Gonçalves, W. N., Ramos, A. P. M., Li, J., and Junior, J. M.: The Segment Anything Model (SAM) for Remote Sensing Applications: From Zero to One Shot, Int. J. Appl. Earth Obs., 124, 103540, https://doi.org/10.1016/j.jag.2023.103540, 2023.
Paolini, G., Escorihuela, M. J., Merlin, O., Pamies Sans, M., and Bellvert, J.: Classification of different irrigation systems at field scale using time-series of remote sensing data, IEEE J. Sel. Top. Appl., 15, 10055–10072, https://doi.org/10.1109/JSTARS.2022.3222884, 2022.
Pina, D.: Issues regarding historical Gen 4 2017 imagery, https://support.google.com/maps/thread/309842390/issues-regarding-historical-gen-4-2017-imagery?hl=en (last access: 7 July 2025), 25 November 2024.
Polak, P., Prusa, J. D., and Khoshgoftaar, T. M.: Low-shot learning and class imbalance: a survey, J. Big Data, 11, https://doi.org/10.1186/s40537-023-00851-z, 2024.
Pu, X., Jia, H., Zheng, L., Wang, F., and Xu, F.: Classwise-sam-adapter: Parameter efficient fine-tuning adapts Segment Anything to SAR domain for semantic segmentation, IEEE J. Sel. Top. Appl., https://doi.org/10.1109/JSTARS.2025.3532690, 2025.
Renwick, K. M., Woodall, C. W., Mihiar, C., Murray, L. T., Lewis, R., Beeson, P. C., and Coulston, J.: Evaluating the current status of agriculture-driven deforestation across jurisdictional scales in the United States using foundational, federal datasets, Environ. Res. Lett., 20, 074002, https://doi.org/10.1088/1748-9326/addc83, 2025.
Ringland, J., Bohm, M., Baek, S. R., and Eichhorn, M.: Automated survey of selected common plant species in Thai homegardens using Google Street View imagery and a deep neural network, Earth Sci. Inform., 14, 179–191, https://doi.org/10.1007/s12145-020-00557-3, 2021.
Rocchini, D., Foody, G. M., Nagendra, H., Ricotta, C., Anand, M., He, K. S., Amici, V., Kleinschmit, B., Förster, M., Schmidtlein, S., and Feilhauer, H.: Uncertainty in ecosystem mapping by remote sensing, Comput. Geosci., 50, 128–135, https://doi.org/10.1016/j.cageo.2012.05.022, 2013.
Rufin, P., Wang, S., Lisboa, S. N., Hemmerling, J., Tulbure, M. G., and Meyfroidt, P.: Taking it further: leveraging pseudo-labels for field delineation across label-scarce smallholder regions, Int. J. Appl. Earth Obs., 134, 104149, https://doi.org/10.1016/j.jag.2024.104149, 2024.
Shao, Y., Guan, X., Xuan, G., Liu, H., Li, X., Gu, F., and Hu, Z.: Detection of straw coverage under conservation tillage based on an improved Mask Regional Convolutional Neural Network (Mask R-CNN), Agronomy, 14, 1409, https://doi.org/10.3390/agronomy14071409, 2024.
Sohl, T., Schleeweis, K., Herold, N., Lang, M., La Puma, I., Wickham, J., Mueller, R., Rigge, M., Dewitz, J., Brown, J., Ingebritsen, J., Ellenwood, J., Wengert, E., Rowe, J., Flanagan, P., Kachergis, E., Garthwaite, I., and Wu, Z.: An interagency perspective on improving consistency and transparency of land use and land cover mapping, U.S. Geol. Surv. Circ., 47 pp., https://doi.org/10.3133/cir1549, 2025.
Stehman, S. V. and Foody, G. M.: Key issues in rigorous accuracy assessment of land cover products, Remote Sens. Environ., 231, 111199, https://doi.org/10.1016/j.rse.2019.05.018, 2019.
Sumesh, K. C., Aryal, J., and Ryu, D.: A Novel Architecture for Automated Delineation of the Agricultural Fields Using Partial Training Data in Remote Sensing Images, Comput. Electr. Agr., 234, 110265, https://doi.org/10.1016/j.compag.2025.110265, 2025.
Stewart, C., Lazzarini, M., Luna, A., and Albani, S.: Deep learning with open data for desert road mapping, Remote Sens., 12, 2274, https://doi.org/10.3390/rs12142274, 2020.
Taesiri, M. R., Nguyen, G., Habchi, S., Bezemer, C.-P., and Nguyen, A.: ImageNet-Hard: The hardest images remaining from a study of the power of zoom and spatial biases in image classification, arXiv [preprint], https://doi.org/10.48550/arXiv.2304.05538, 8 October 2023.
Terven, J., Cordova-Esparza, D.-M., Romero-González, J.-A., Ramírez-Pedraza, A., and Chávez-Urbiola, E. A.: A comprehensive survey of loss functions and metrics in deep learning, Artif. Intell. Rev., 58, 195, https://doi.org/10.1007/s10462-025-11198-7, 2025.
Tran, K. H., Zhang, H. K., McMaine, J. T., Zhang, X., and Luo, D.: 10 m crop type mapping using Sentinel-2 reflectance and 30 m cropland data layer product, Int. J. Appl. Earth Obs., 107, 102692, https://doi.org/10.1016/j.jag.2022.102692, 2022.
U.S. Department of Agriculture, Farm Production and Conservation – Business Center, Geospatial Enterprise Operations: National Agriculture Imagery Program (NAIP) imagery, U.S. Department of Agriculture, Farm Production and Conservation – Business Center [data set], https://naip-usdaonline.hub.arcgis.com/ (last access: 15 December 2025), 2003.
U.S. Department of Agriculture, National Agricultural Statistics Service: Cropland Data Layer – Metadata, U.S. Department of Agriculture, National Agricultural Statistics Service [data set], https://www.nass.usda.gov/Research_and_Science/Cropland/metadata/meta.php (last access: 15 December 2025), 2025a.
U.S. Department of Agriculture, National Agricultural Statistics Service: National Crop Progress Report (CPR), http://www.nass.usda.gov/Publications/National_Crop_Progress/, last access: 30 June 2025b.
Van Horn, G., Mac Aodha, O., Song, Y., Cui, Y., Sun, C., Shepard, A., Adam, H., Perona, P., and Belongie, S.: The iNaturalist species classification and detection dataset, Proc. IEEE Conf. Comput. Vis. Pattern Recognit., 8769–8778, https://doi.org/10.1109/CVPR.2018.00914, 2018.
Van Tricht, K., Degerickx, J., Gilliams, S., Zanaga, D., Battude, M., Grosu, A., Brombacher, J., Lesiv, M., Bayas, J. C. L., Karanam, S., Fritz, S., Becker-Reshef, I., Franch, B., Mollà-Bononad, B., Boogaard, H., Pratihast, A. K., Koetz, B., and Szantoi, Z.: WorldCereal: a dynamic open-source system for global-scale, seasonal, and reproducible crop and irrigation mapping, Earth Syst. Sci. Data, 15, 5491–5515, https://doi.org/10.5194/essd-15-5491-2023, 2023.
Waldner, F. and Diakogiannis, F. I.: Deep learning on edge: Extracting field boundaries from satellite images with a convolutional neural network, Remote Sens. Environ., 245, 111741, https://doi.org/10.1016/j.rse.2020.111741, 2020.
Wang, H. and Gong, F.-Y.: Quantifying city- and street-scale urban tree phenology from Landsat-8, Sentinel-2, and PlanetScope images: a case study in downtown Beijing, Remote Sens., 16, 2351, https://doi.org/10.3390/rs16132351, 2024.
Wang, M., Zhang, X., Niu, X., Wang, F., and Zhang, X.: Scene classification of high-resolution remotely sensed image based on ResNet, J. Geovisual. Spatial Anal., 3, 16, https://doi.org/10.1007/s41651-019-0039-9, 2019.
Wang, M., Wander, M., Mueller, S., Martin, N., and Dunn, J. B.: Evaluation of survey and remote sensing data products used to estimate land use change in the United States: Evolving issues and emerging opportunities, Environ. Sci. Policy, 129, 68–78, https://doi.org/10.1016/j.envsci.2021.12.021, 2022.
Wang, Z., Ngo, T. D., Zoraghein, H., Lucas, B., and Karimzadeh, M.: Integrating spatiotemporal features in LSTM for spatially informed COVID-19 hospitalization forecasting, Int. J. Geogr. Inf. Sci., 1–38, https://doi.org/10.1080/13658816.2025.2527266, 2025.
Weiss, M., Jacob, F., and Duveiller, G.: Remote sensing for agricultural applications: A meta-review, Remote Sens. Environ., 236, 111402, https://doi.org/10.1016/j.rse.2019.111402, 2020.
Whitcraft, A. K., Becker-Reshef, I., Justice, C. O., Gifford, L., Kavvada, A., and Jarvis, I.: No pixel left behind: Toward integrating Earth Observations for agriculture into the United Nations Sustainable Development Goals framework, Remote Sens. Environ., 235, 111470, https://doi.org/10.1016/j.rse.2019.111470, 2019.
Wu, B., Zhang, M., Zeng, H., Tian, F., Potgieter, A. B., Qin, X., Yan, N., Chang, S., Zhao, Y., Dong, Q., and Boken, V.: Challenges and opportunities in remote sensing-based crop monitoring: a review, Natl. Sci. Rev., 10, nwac290, https://doi.org/10.1093/nsr/nwac290, 2022.
Wu, E., Chen, Y., Ma, R., and Zhao, X.: A review of weed image identification based on deep few-shot learning, Comput. Electr. Agr., 237, 110675, https://doi.org/10.1016/j.compag.2025.110675, 2025.
Wu, F., Wu, B., Zhang, M., Zeng, H., and Tian, F.: Identification of crop type in crowdsourced road view photos with deep convolutional neural network, Sensors, 21, 1165, https://doi.org/10.3390/s21041165, 2021.
Wu, Q., Xia, P., Yu, L., Liu, Y., Xiong, M., Zhong, L., Chen, J., Yang, M., Zhang, Y., and Wan, Y.: Cross-view image set geo-localization, arXiv [preprint], https://doi.org/10.48550/arXiv.2412.18852, 25 December 2024.
Xie, Y., Gibbs, H. K., and Lark, T. J.: Landsat-based Irrigation Dataset (LANID): 30 m resolution maps of irrigation distribution, frequency, and change for the US, 1997–2017, Earth Syst. Sci. Data, 13, 5689–5710, https://doi.org/10.5194/essd-13-5689-2021, 2021.
Xie, Y., Wang, Z., Mai, G., Li, Y., Jia, X., Gao, S., and Wang, S.: Geo-foundation models: reality, gaps and opportunities, in: Proceedings of the 31st ACM International Conference on Advances in Geographic Information Systems, 4 pp., https://doi.org/10.1145/3589132.3625616, 2023.
Yan, Y. and Ryu, Y.: Exploring Google Street View with deep learning for crop type mapping, ISPRS J. Photogramm. Remote Sens., 171, 278–296, https://doi.org/10.1016/j.isprsjprs.2020.11.022, 2021.
Yang, Z., Diao, C., and Gao, F.: Towards scalable within-season crop mapping with phenology normalization and deep learning, IEEE J. Sel. Top. Appl., 16, 1390–1402, https://doi.org/10.1109/JSTARS.2023.3237500, 2023.
Yang, Z., Diao, C., Gao, F., and Li, B.: EMET: An emergence-based thermal phenological framework for near real-time crop type mapping, ISPRS J. Photogramm., 215, 271–291, https://doi.org/10.1016/j.isprsjprs.2024.07.007, 2024.
Ye, S., Cao, P., and Lu, C.: Annual time-series 1 km maps of crop area and types in the conterminous US (CropAT-US): cropping diversity changes during 1850–2021, Earth Syst. Sci. Data, 16, 3453–3470, https://doi.org/10.5194/essd-16-3453-2024, 2024.
Yordanov, M., d'Andrimont, R., Martinez-Sanchez, L., Lemoine, G., Fasbender, D., and Van der Velde, M.: Crop identification using deep learning on LUCAS crop cover photos, Sensors, 23, 6298, https://doi.org/10.3390/s23146298, 2023.
You, L. and Sun, Z.: Mapping global cropping system: Challenges, opportunities, and future perspectives, Crop Environ., 1, 68–73, https://doi.org/10.1016/j.crope.2022.03.006, 2022.
Zanaga, D., Van De Kerchove, R., Daems, D., De Keersmaecker, W., Brockmann, C., Kirches, G., Wevers, J., Cartus, O., Santoro, M., Fritz, S., and Lesiv, M.: ESA WorldCover 10 m 2021 v200, Zenodo [data set], https://doi.org/10.5281/zenodo.7254221, 2022.
Zhang, C. and Diao, C.: A Phenology-guided Bayesian-CNN (PB-CNN) framework for soybean yield estimation and uncertainty analysis, ISPRS J. Photogramm., 205, 50–73, https://doi.org/10.1016/j.isprsjprs.2023.09.025, 2023.
Zhang, C. and Wang, S.: Good at captioning bad at counting: benchmarking GPT-4V on earth observation data, in: Proceedings of the IEEE/CVF Conference on Computer Vision and Pattern Recognition, arXiv [preprint], https://doi.org/10.48550/arXiv.2401.17600, 2024.
Zhang, C., Sargent, I., Pan, X., Li, H., Gardiner, A., Hare, J., and Atkinson, P. M.: An object-based convolutional neural network (OCNN) for urban land use classification, Remote Sens. Environ., 216, 57–70, https://doi.org/10.1016/j.rse.2018.06.034, 2018.
Zhang, X., Ouyang, T., Shang, Y., Liao, Q., and Li, Y.: UrbanMLLM: Joint learning of cross-view imagery for urban understanding, Proc. Int. Conf. on Learning Representations (ICLR), OpenReview, https://openreview.net/forum?id=YBht9Vp5vC (last access: 15 December 2025), 2025.
Zhao, M., Meng, Q., Wang, L., Zhang, L., Hu, X., and Shi, W.: Towards robust classification of multi-view remote sensing images with partial data availability, Remote Sens. Environ., 306, 114112, https://doi.org/10.1016/j.rse.2024.114112, 2024.
Zheng, H., Zhang, C., Guan, K., Deng, Y., Wang, S., Rhoads, B. L., Margenot, A. J., Zhou, S., and Wang, S.: Segment any stream: scalable water extent detection with the segment anything model, in: NeurIPS 2023 Computational Sustainability: Promises and Pitfalls from Theory to Deployment, https://openreview.net/forum?id=BaZZzH7EgA (last access: 15 December 2025), 2023.
Zhou, Y. and Ryo, M.: Agribench: a hierarchical agriculture benchmark for multimodal large language models, in: European Conference on Computer Vision, Springer, Cham, 207–223, https://doi.org/10.1007/978-3-031-91835-3_14, 2025.
Zhou, Z., Liu, Y., and Diao, C.: CROPSIGHT-US: An Object-Based Crop Type Ground Truth Dataset Using Street View and Sentinel-2 Satellite Imagery across the Contiguous United States (version 1.0.1), Zenodo [data set], https://doi.org/10.5281/zenodo.15702414, 2025.
- Abstract
- Introduction
- Study Area and Data
- Methods
- Results: Ground Truthing Framework
- CropSight-US: Object-based Crop Type Ground Truth Dataset
- Data availability
- Discussion and Conclusion
- Author contributions
- Competing interests
- Disclaimer
- Acknowledgements
- Financial support
- Review statement
- References