the Creative Commons Attribution 4.0 License.
the Creative Commons Attribution 4.0 License.
 | 27 Apr 2026
CCAV-10m: an annual spatiotemporal dataset for eastern coastal China’s wetland vegetation by integrating Sentinel-1/2 observations via deep learning
Yuying Li
Zijiang Song
Shuang Yang
Zilong Zhu
Min Liu
Coastal wetland vegetation plays a vital role in shoreline protection and ecosystem management, highlighting the need for accurate and high-resolution mapping of these unique and vulnerable habitats. Here, we present CCAV-10m, the first publicly available annual species-level wetland dataset for eastern coastal China at 10 m resolution (2016–2023). This dataset was generated using a novel phenology-guided coastal wetland vegetation classification network (P_SVCN), which integrates Sentinel-1/2 satellite imagery with extensive in situ observations. Validation based on 4668 in situ samples confirms that P_SVCN delivers strong classification performance, achieving an overall accuracy of 0.916 and a Kappa coefficient of 0.898. Spatiotemporal analysis of CCAV-10m reveals that Suaeda spp. is the dominant vegetation type, followed by Spartina alterniflora, whose coverage nearly equals the combined extent of Phragmites australis, mangroves, Scirpus mariqueter, and Tamarix chinensis. Notably, this work fills critical gaps in both spatial detail and temporal consistency across existing coastal wetland datasets, demonstrating the effectiveness of deep-learning-based fusion of optical and SAR data for high-resolution vegetation mapping. Regular updates to CCAV-10m will support long-term coastal wetland research, enhance invasive species monitoring, and inform wetland restoration and precision management efforts. The CCAV-10m dataset is openly accessible at https://doi.org/10.57760/sciencedb.31077 (Li et al., 2025).
- Article
(8860 KB) - Full-text XML
- BibTeX
- EndNote


Coastal wetlands are complex ecosystems distributed along the land–sea transition zone, influenced jointly by tidal dynamics and salinity gradients, and mainly comprise salt marshes, mangroves, tidal flats, and brackish wetland forests (Day et al., 2024; Bernhardt, 2022; Moreno-Mateos et al., 2012). Tropical mangroves cover approximately 150 000 km2, while temperate tidal marshes exceed 45 000 km2 (Webb et al., 2013; Luther and Greenberg, 2009), together forming one of the most productive and carbon-rich ecosystems on earth (Macreadie et al., 2019; Bertram et al., 2021). Coastal wetlands function not only as geochemical “sinks” but also as highly effective “green filters” that intercept and remove land-derived pollutants (Sun et al., 2015; Zhang et al., 2023b). Their ecosystem service value can reach up to USD 194 000 per ha per year, encompassing carbon sequestration and greenhouse gas regulation, coastal protection, fisheries support, water purification, and biodiversity maintenance (Gabler et al., 2017; Schuerch et al., 2018; Costanza et al., 2014; Duarte et al., 2013; Aburto-Oropeza et al., 2008).
China's coastal wetlands represent a key component of its national blue carbon ecosystems, spanning tropical, subtropical, and temperate climate zones (Cao and Wong, 2007; Sun et al., 2015; Wang et al., 2021). Their broad distribution and substantial carbon sequestration capacity place them at the core of China's blue carbon strategy (Gu et al., 2025). Dominant vegetation types in Chinese coastal wetlands include S. alterniflora, P. australis, T. chinensis, Suaeda spp., S. mariqueter, and mangroves (Gu et al., 2021). Among these, S. alterniflora, introduced in the 1990s, has rapidly expanded across Jiangsu, Shanghai, Zhejiang, and Fujian, with scattered occurrences in Liaoning, Tianjin, Hebei, and Shandong (Min et al., 2025; Chen et al., 2025). In many East Asian countries, biological invasions, tidal flat reclamation, and wetland restoration occur simultaneously; thus, timely and fine-scale species-level monitoring is crucial for tracking invasion dynamics, evaluating restoration outcomes, and supporting biodiversity conservation and sustainable coastal management (Tian et al., 2020; Sun et al., 2023).
Coastal wetlands are composed of herbaceous plants, grasses, and low-stature shrubs that are adapted to regular or occasional tidal inundation (Kumar and Sinha, 2014). Due to the inherent complexity of vegetation, tidal dynamics, and anthropogenic disturbances, mapping of coastal wetlands remains challenging (Zhao et al., 2023). To date, a variety of remote sensing data sources have been widely applied to monitor coastal wetland vegetation. In multispectral optical imagery, medium- to low-resolution datasets such as MODIS and AVHRR offer high temporal resolution (Gallo et al., 2005; Zhang et al., 2023a), which makes them suitable for wetland information extraction; however, their spatial resolution is insufficient for vegetation species-level classification (Takeuchi et al., 2003; Zhang et al., 2019). High-resolution optical imagery also plays an important role in wetland vegetation classification, but it is limited by cloud cover and atmospheric effects (Kang et al., 2023; O'Connell et al., 2017). Moreover, traditional remote sensing methods based on vegetation indices and phenological features are still widely applied. For example, the enhanced phenology-based vegetation index algorithm proposed by Zeng et al. (2022) achieved an overall accuracy of 86.67 % for coastal salt marshes along the Bohai Sea, while Sun et al. (2023) applied a time-series model and phenological parameters to classify Jiangsu coastal salt marshes with an average overall accuracy of 84.8 % (±5.5 %). Although these approaches are effective for short-term monitoring, they often struggle to capture complex spatial structures and inter-annual dynamics fully.
With the advancement of remote sensing technology, research on wetland vegetation classification has gradually shifted from traditional optical image-based methods to multi-source data fusion techniques. Synthetic Aperture Radar (SAR), with its all-weather and all-time imaging capabilities, has become a key complement to optical imagery (Van Beijma et al., 2014; Veloso et al., 2017). In recent years, researchers have attempted to integrate SAR and optical imagery to improve the accuracy of salt marsh vegetation classification. For instance, Xu et al. (2025) integrated Sentinel-1 SAR and Sentinel-2 optical imagery to classify wetland vegetation in the Yellow River Delta, China, achieving an overall accuracy of 93.51 % and a Kappa coefficient of 0.917. Similarly, Slagter et al. (2020) combined Sentinel-1 SAR and Sentinel-2 for multi-level wetland classification in the St. Lucia Wetlands, South Africa, with an overall accuracy of 90.7 %. At the same time, with the development of deep learning, convolutional neural networks and attention mechanisms have been increasingly applied to wetland vegetation classification, significantly improving spatial detail representation and cross-temporal feature extraction. For example, Sun et al. (2025) employed a hybrid 2D–3D CNN to achieve an annual average classification accuracy exceeding 97 % for Jiangsu coastal wetlands, and Li et al. (2021a) used a U-Net model to classify wetlands in South Carolina, USA, achieving a maximum accuracy of 90 %. Although these regional studies have achieved promising results, they mostly focus on single-date or short-term analyses. Therefore, long-term, species-level wetland monitoring at a national scale remains limited, which is crucial for coastal ecosystem management and wetland conservation.
In this study, we developed a novel phenology-guided coastal wetland vegetation classification network integrating Sentinel-1/2 (P_SVCN) based on deep learning and employed it to generate the CCAV-10m dataset (https://doi.org/10.57760/sciencedb.31077, Li et al., 2025), an annual spatiotemporal China's coastal wetland vegetation dataset, 2016–2023. The P_SVCN model integrates Sentinel-1 and Sentinel-2 imagery with in situ data, maintaining the sensitivity of SAR data to vegetation structure and moisture while adaptively incorporating the spectral and phenological information from optical imagery. P_SVCN significantly improves classification accuracy, enabling species-level mapping of coastal wetland vegetation. CCAV-10m provides a valuable spatiotemporal resource for long-term monitoring, ecological research, and sustainable management of China's coastal wetlands.
The Chinese coastline extends approximately 32 000 km, including 14 000 km of island coastlines, ranging from the Yalu River estuary in northern Liaoning Province to the Beilun River estuary in southern Guangxi and Hainan Island (Gu et al., 2021, 2025). This study focuses on eight coastal provinces and municipalities: Liaoning, Hebei, Tianjin, Shandong, Jiangsu, Shanghai, Zhejiang, and Fujian, spanning 23°30′–40°03′ N latitude and 115°50′–124°22′ E longitude (Fig. 1). The study area covers both temperate and subtropical climatic zones, supporting a diverse range of wetland vegetation types (Hu et al., 2021). Wetland boundaries were delineated using the GLC_FCS30D dataset (Zhang et al., 2024), with a 10 km buffer inland and seaward from the coastline applied for analysis. Common wetland species include S. alterniflora, P. australis, T. chinensis, Suaeda spp., S. mariqueter, and mangroves (Chen et al., 2022). S. alterniflora, native to the Americas, was introduced to China in the 1990s and is now widespread in Jiangsu, Shanghai, Zhejiang, and Fujian, with scattered occurrences in Liaoning, Tianjin, Hebei, and Shandong (Min et al., 2025; Chen et al., 2025). S. mariqueter occurs mainly in Shanghai, Jiangsu, and the Hangzhou Bay area (Sun et al., 2025; Zheng et al., 2023), while T. chinensis and Suaeda spp. are concentrated in northern provinces (Sun et al., 2021), and mangroves are restricted to the southern coast, reaching their northern limit in Yueqing, Zhejiang (Wei et al., 2024).
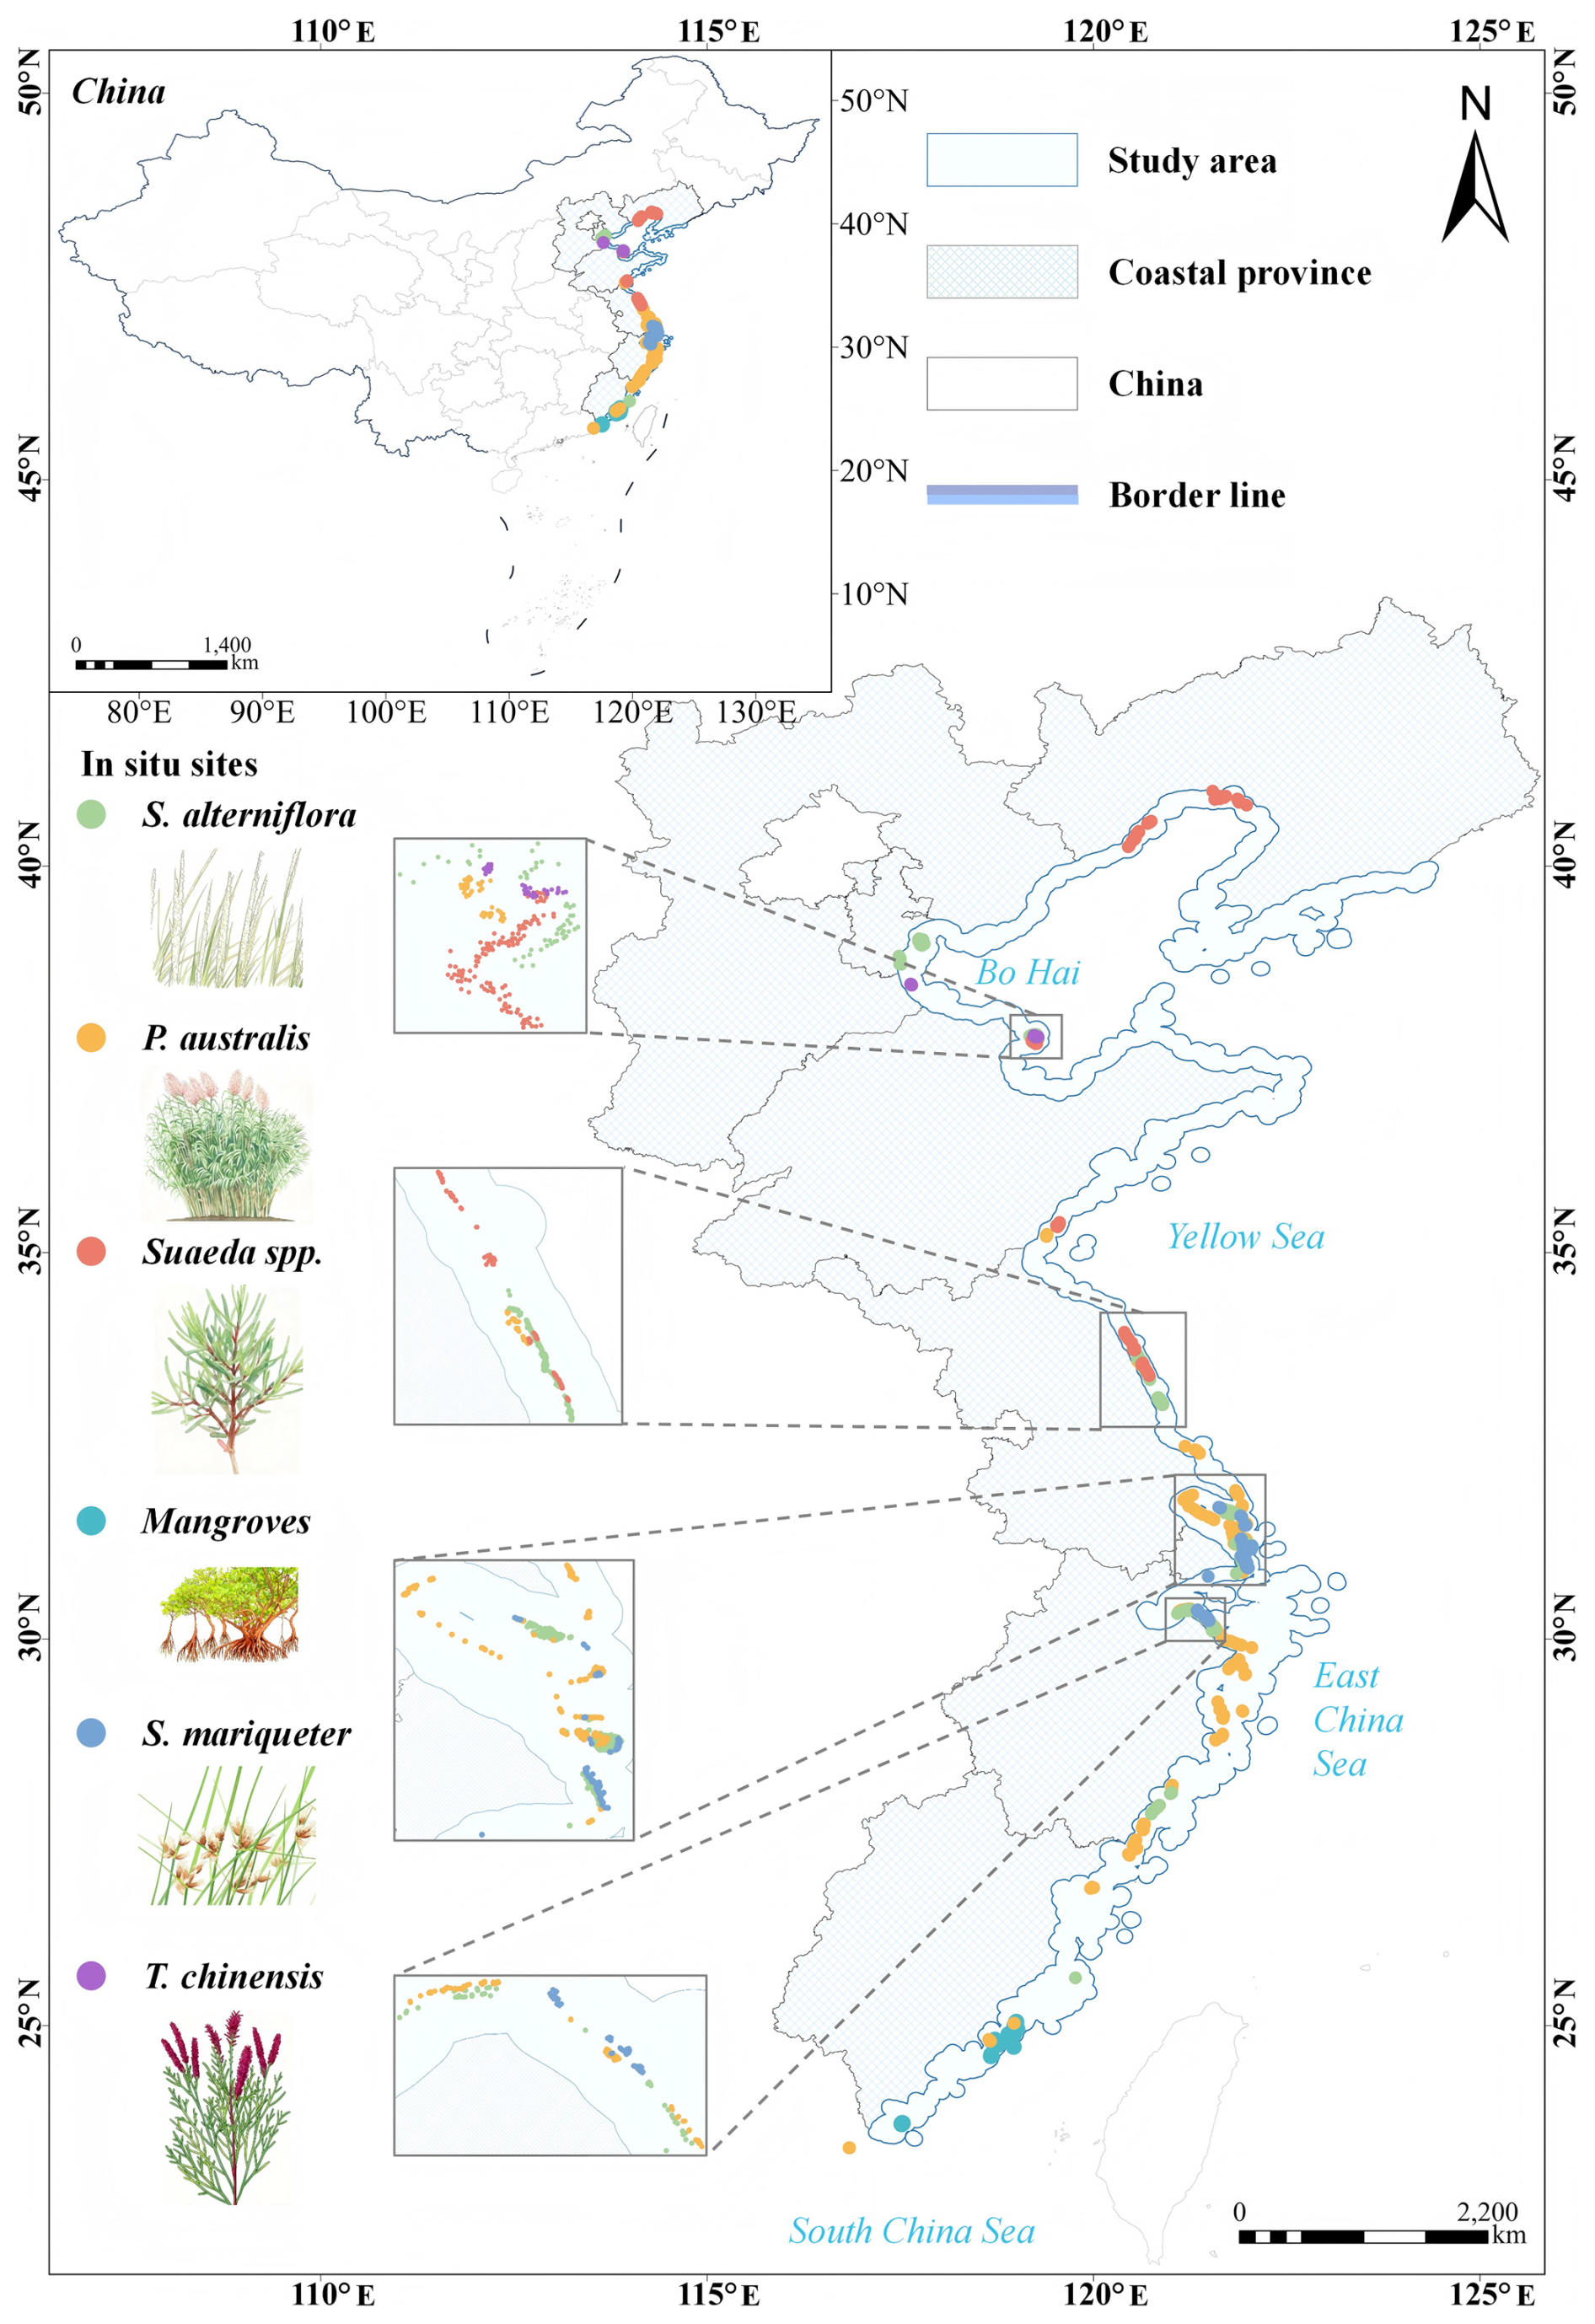
Figure 1Location of the study area along the Chinese coastline, showing the extent of the coastal zone and the distribution of in situ wetland sampling sites.
3.1 Sentinel-1
We used multisource remote sensing data, including Sentinel-1 and Sentinel-2 imagery, to improve coastal vegetation classification (Zhao et al., 2024). Sentinel-1 Level-1 Ground Range Detected (GRD) data (Potin et al., 2015) at 10 m resolution were preprocessed in SNAP following orbital correction, thermal noise removal, radiometric calibration, speckle filtering, and terrain correction, with reflectivity converted from linear scale to decibels (dB) (Li et al., 2024b). A total of 8018 scenes spanning January 2016 to December 2023 in eastern China were composited annually using a mean function. These composites captured regional climatic patterns while reducing tidal and seasonal variability in salt marsh vegetation.
3.2 Sentinel-2
Sentinel-2 imagery was selected according to the key phenological stages of coastal vegetation, namely green and senescence (Zhao et al., 2023). To ensure high spectral fidelity, a stringent cloud-cover threshold of less than 10 % was applied during the scene selection process. Across the study period, 320 high-quality scenes of dual-temporal optical imagery were processed in SNAP and ENVI, including resampling and band fusion (Wang et al., 2024). Distinct from the year-round continuous observation strategy employed for Sentinel-1 SAR data, this targeted sampling of dual-phase optical imagery aims to capture the maximum inter-species spectral contrast while minimizing atmospheric interference.
For each phenophase, four spectral bands with the highest vegetation contrast – B02 (blue), B03 (green), B04 (red), and B08 (near-infrared) – were extracted, yielding eight optical channels (Bao et al., 2025). Normalized Difference Vegetation Index (NDVI) maps were derived from the red and near-infrared bands of both phenophases to capture differences in vegetation status. All SAR and optical images were co-registered and resampled to a consistent 10 m resolution to ensure data alignment and comparability.
3.3 In situ data
We conducted field surveys and vegetation sampling across wetlands along the coast of eastern China, between 2017–2018. High-precision GPS (Trimble Juno 3D) and a DJI Phantom-4 RTK unmanned aerial vehicle were combined to systematically record site information. Following a stratified sampling design, plots were established for six representative salt marsh vegetation types: P. australis, S. alterniflora, Suaeda spp., T. chinensis, mangroves, and S. mariqueter. Each plot measured 10 m×10 m, with a minimum distance of 100 m between adjacent plots to ensure spatial independence and representativeness. Within each plot, three 0.5 m×0.5 m quadrats were randomly located. GPS coordinates of each quadrat were recorded with ±5 m accuracy to guarantee even spatial coverage across vegetation types. Plot locations were further verified and corrected using high-resolution imagery from Google Earth to ensure consistency with actual vegetation distribution. To complement the field data, we also compiled additional wetland vegetation validation points from the literature (Zhao et al., 2023; Li et al., 2021b; Sun, 2023).
In total, 2665 ground truth points were collected (Fig. 1), comprising 948 S. alterniflora, 678 P. australis, 432 Suaeda spp., 226 S. mariqueter, 263 mangrove, and 118 T. chinensis points. Experienced researchers then conducted visual interpretation and manual labeling of additional points using Google Earth imagery, resulting in 2072 S. alterniflora, 2435 P. australis, 2632 Suaeda spp., 2901 S. mariqueter, 1803 mangrove, and 1050 T. chinensis points. Collected samples underwent systematic quality control, producing a reliable dataset for training and validating remote sensing classification models.
3.4 A phenology-guided coastal wetland vegetation classification network integrating Sentinel-1/2 (P_SVCN)
In this study, we developed a phenology-guided coastal wetland vegetation classification network integrating Sentinel-1/2 (P_SVCN) with a dual-branch multi-source attention mechanism for the fine-scale classification of coastal wetland vegetation along the Chinese coast. The training dataset was based on Sentinel-1 imagery from 2017–2018, including VV and VH polarizations, along with three derived SAR features (SAR-Diff, SAR-NDVI, and SAR-SUM). Simultaneously, dual-phase Sentinel-2 optical imagery was incorporated, extracting eight spectral bands (B02, B03, B04, and B08 at two phenological phases) and their corresponding NDVI indices as input features. Vegetation types recorded at the sampled locations corresponding to the imagery periods were used as ground truth for supervised training. The dataset was strictly split into training (70 %, 10 890 samples) and validation (30 %, 4668 samples) subsets. The trained model was then applied to classify coastal wetland vegetation from 2016 to 2023 along the Chinese coast.
3.4.1 SAR feature construction from Sentinel-1
Sentinel-1 SAR imagery offers significant advantages for monitoring wetland vegetation, being highly sensitive to key variables such as total vegetation water content, canopy structure dynamics, and vegetation cover (Vreugdenhil et al., 2018; Zhang et al., 2022a). With its all-weather, all-time radar observation capability, Sentinel-1 can reliably acquire data under diverse meteorological conditions, providing robust support for temporal analyses of vegetation dynamics (Simioni et al., 2020; Mleczko and Mróz, 2018). The C-band radar signals can penetrate the canopy and effectively capture interactions between vegetation and soil (Mao et al., 2023), making Sentinel-1 particularly suitable for long-term monitoring and dynamic studies of wetland ecosystems (Yang and Guo, 2019; Zhang et al., 2021).
Backscatter coefficients in VV and VH polarization provide insight into vegetation–ground interactions (Vreugdenhil et al., 2018; Mandal et al., 2020; Nikaein et al., 2021). Vegetated areas typically exhibit higher surface roughness than non-vegetated regions, resulting in distinct backscatter differences, although VH polarization signals may be influenced by double-bounce effects from soil surfaces (Veloso et al., 2017; Ferro et al., 2011). To suppress the inherent speckle noise in SAR imagery and capture stable annual structural signatures of coastal vegetation, we utilized all available Sentinel-1 scenes acquired throughout the entire study year. An annual mean compositing strategy was applied to generate a representative backscatter coefficient for each pixel. Based on these considerations, this study utilized the processed VV and VH single-polarization SAR data along with three derived indices, including SAR_NDVI, SAR_SUM, and SAR_Diff, for the classification of wetland vegetation types along eastern China's coastal zones.
SAR_NDVI quantifies normalized differences in backscatter coefficients between VV and VH polarization states, providing a reliable basis for distinguishing vegetation types (Veloso et al., 2017). SAR_Diff effectively suppresses double-bounce effects from straw or surface structures, enhancing the ability to detect subtle differences between vegetation and soil, thereby improving classification accuracy (Mahdianpari et al., 2020). SAR_SUM integrates the total backscatter intensity from both VV and VH channels, offering a comprehensive representation of canopy and surface structure information (Li et al., 2024b).
3.4.2 Phenology-based spectral feature extraction from Sentinel-2
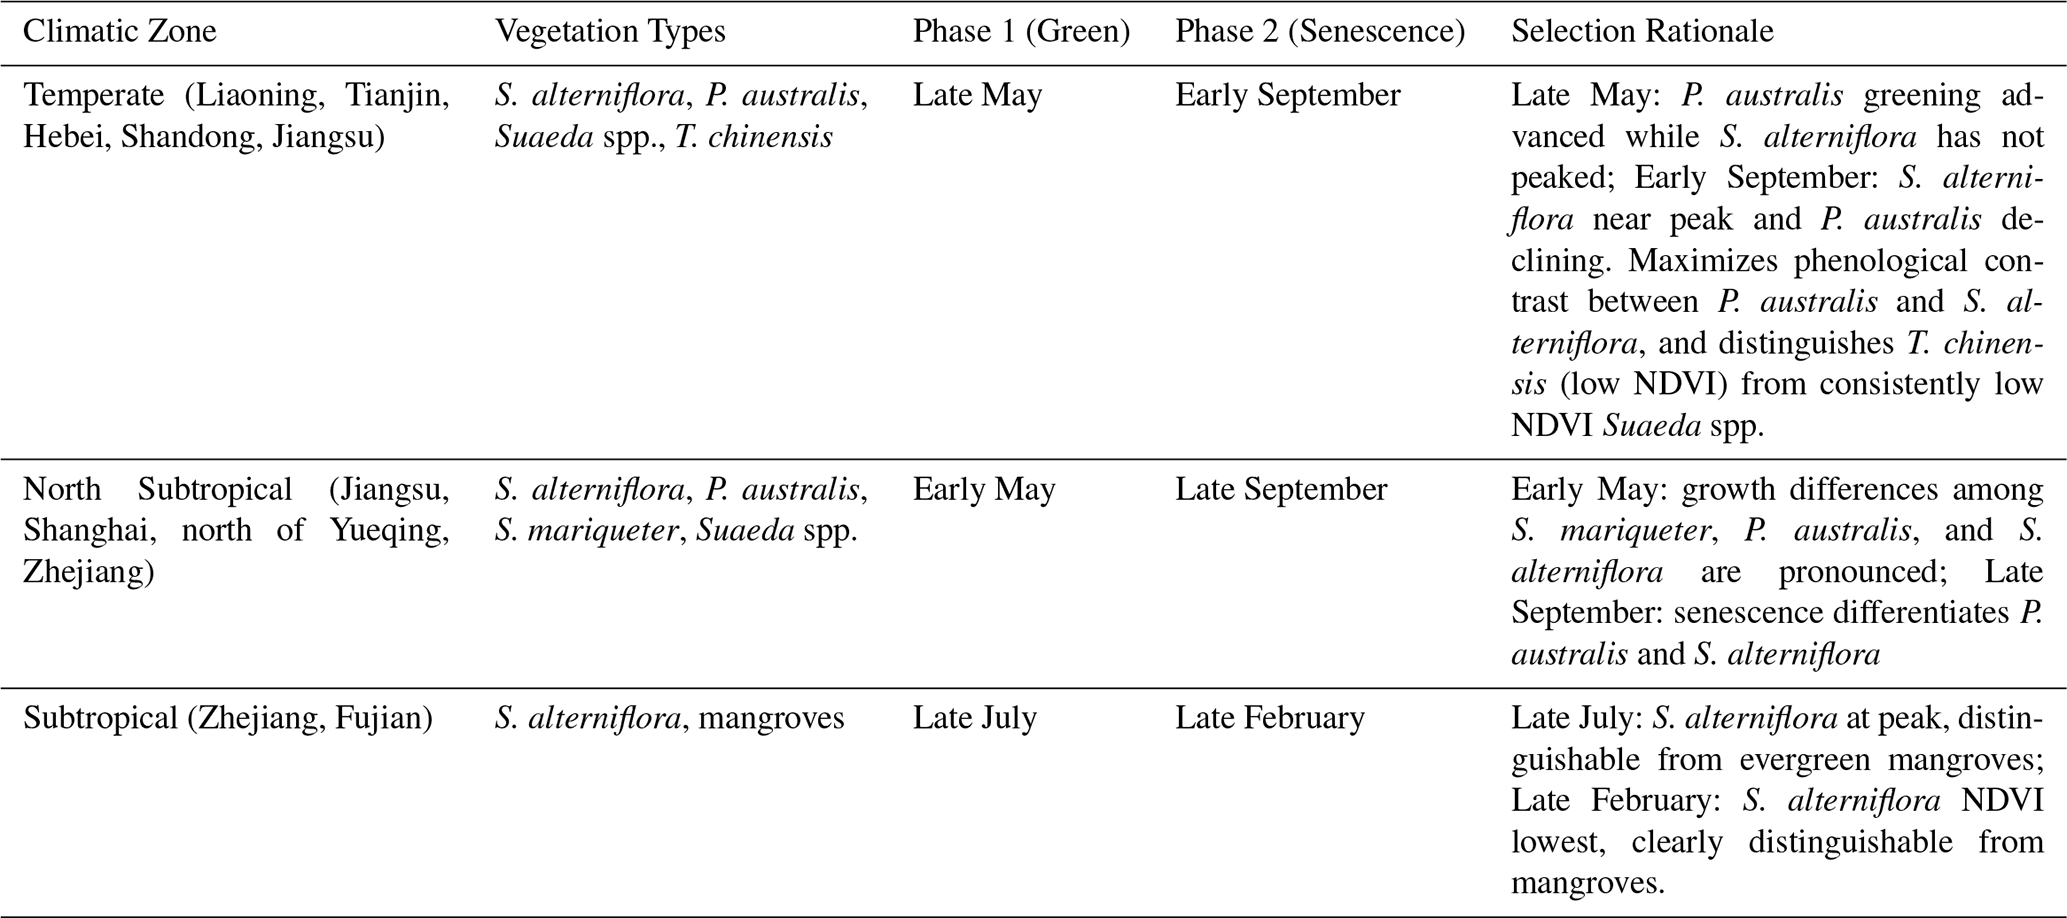
The dominant vegetation types in different climatic zones exhibit distinct phenological rhythms (Zhang et al., 2022). In temperate regions, vegetation growth is constrained by low temperatures and dormancy periods, resulting in a relatively concentrated growing season (Luo et al., 2025), whereas in subtropical regions, the growing period is prolonged and phenological transitions are relatively gradual. Using imagery acquired at a uniform time across the entire coastal zone would lead to phenological mismatches among regions, thereby increasing spectral confusion and classification errors (Zeng et al., 2022). Therefore, this study adopted a climate-zone-based strategy, selecting paired images corresponding to the green and senescence stages within each zone to enhance the spectral separability among vegetation types. To fully leverage the spectral differences of coastal wetland vegetation across phenological stages (Gao et al., 2023; Fu et al., 2025), dual-phase optical imagery was selected based on the growth patterns of representative vegetation within each climatic zone.
The annual NDVI time series for the dominant coastal vegetation species across eastern China's coastal zones. (Fig. 2) clearly reveal distinct seasonal dynamics for each species. The temperate zone was defined as the area north of the Qinling–Huaihe line (approximately 33° N), where the mean January temperature is below 0 °C (Almond et al., 2009; Chen et al., 2013), primarily including the coastal provinces of Liaoning, Tianjin, Hebei, Shandong, and northern Jiangsu. The North Subtropical zone extends from the Qinling–Huaihe line southward to the northernmost mangrove distribution in Yueqing, Zhejiang (≈28°21′ N) (You et al., 2022), covering southern Jiangsu, Shanghai, and northern Zhejiang. The Subtropical zone lies south of this boundary, encompassing southern Zhejiang and Fujian provinces. For the temperate, North Subtropical, and Subtropical regions, two key time points (t1 and t2) corresponding to the peak growth and senescence stages were identified. Within each climatic zone, the dual-phase selection was kept consistent to ensure uniform input features. For spectral feature construction, four key optical bands – blue (B2), green (B3), red (B4), and near-infrared (B8) – were extracted for each pixel at both phenological stages, and the Normalized Difference Vegetation Index (NDVI) was calculated from the red and near-infrared bands (Eq. 1). The dual-phase optical bands and corresponding NDVI values were then combined into a spectral feature vector (Eq. 2).
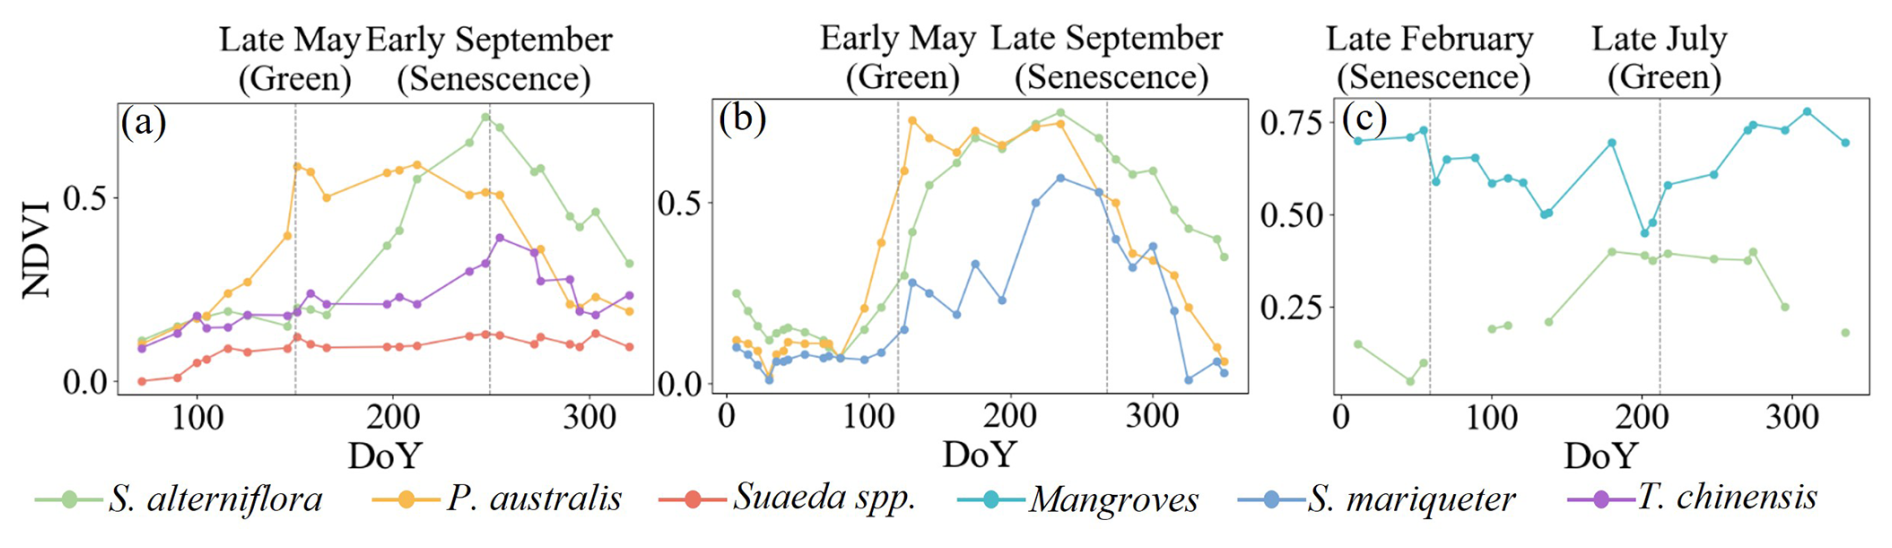
Figure 2Seasonal NDVI profiles of dominant coastal wetland vegetation in eastern China. (a) Temperate, (b) North Subtropical, and (c) Subtropical zones. Each profile represents the mean NDVI calculated from all validated samples within the respective region. Distinct annual NDVI variations were observed among the main vegetation types (S. alterniflora, P. australis, Suaeda spp., S. mariqueter, T. chinensis, and mangroves), which guided the dual-phase selection summarized in Table 1. Note that temporal gaps in the S. alterniflora profile in (c) are due to the exclusion of low-quality pixels caused by frequent precipitation and tidal inundation in low-latitude regions, ensuring the purity of phenological signatures.
Table 1Dual-phase phenological signatures of wetland vegetation across different climatic zones in eastern China. This table summarizes the representative vegetation species, the selected phenological phases, and the rationale for determining optimal dual-phase optical imagery across the temperate, north subtropical, and subtropical regions.
3.4.3 Network framework of the P_SVCN
Coastal wetland vegetation often exhibits high spectral similarity, further complicated by tidal fluctuations, salinity gradients, and seasonal phenology, which challenge accurate classification (Gao et al., 2023; Fu et al., 2025). To address this, we developed a phenology-guided coastal wetland vegetation classification network integrating Sentinel-1/ (P_SVCN), which employs a dual-branch multi-source attention fusion design to enhance feature representation (Fig. 3). One branch processes Sentinel-1 SAR bands and their derived indices, while the other handles Sentinel-2 optical bands and phenological features. Features from both branches interact through the SAR–Optical Cross-Source (SOCS) Block. Let the output features of the SAR branch be FSAR and those of the optical branch be FOptical, projected into query (Q), key (K), and value (V) spaces as in Eq. (3):
where are learnable parameters. Scaled dot-product attention is then used to compute inter-source correlation weights (Eq. 4):
These weights are applied to reweight the optical features, producing fused multi-source features (Eq. 5):
This mechanism retains the sensitivity of SAR to vegetation structure and water content, while adaptively incorporating optical spectral and phenological information, thereby enhancing feature discriminability. By applying the attention fusion at multiple hierarchical levels, P_SVCN dynamically adjusts the contribution of each source, effectively distinguishing vegetation types with similar spectral properties but differing temporal and salinity–hydrology conditions.
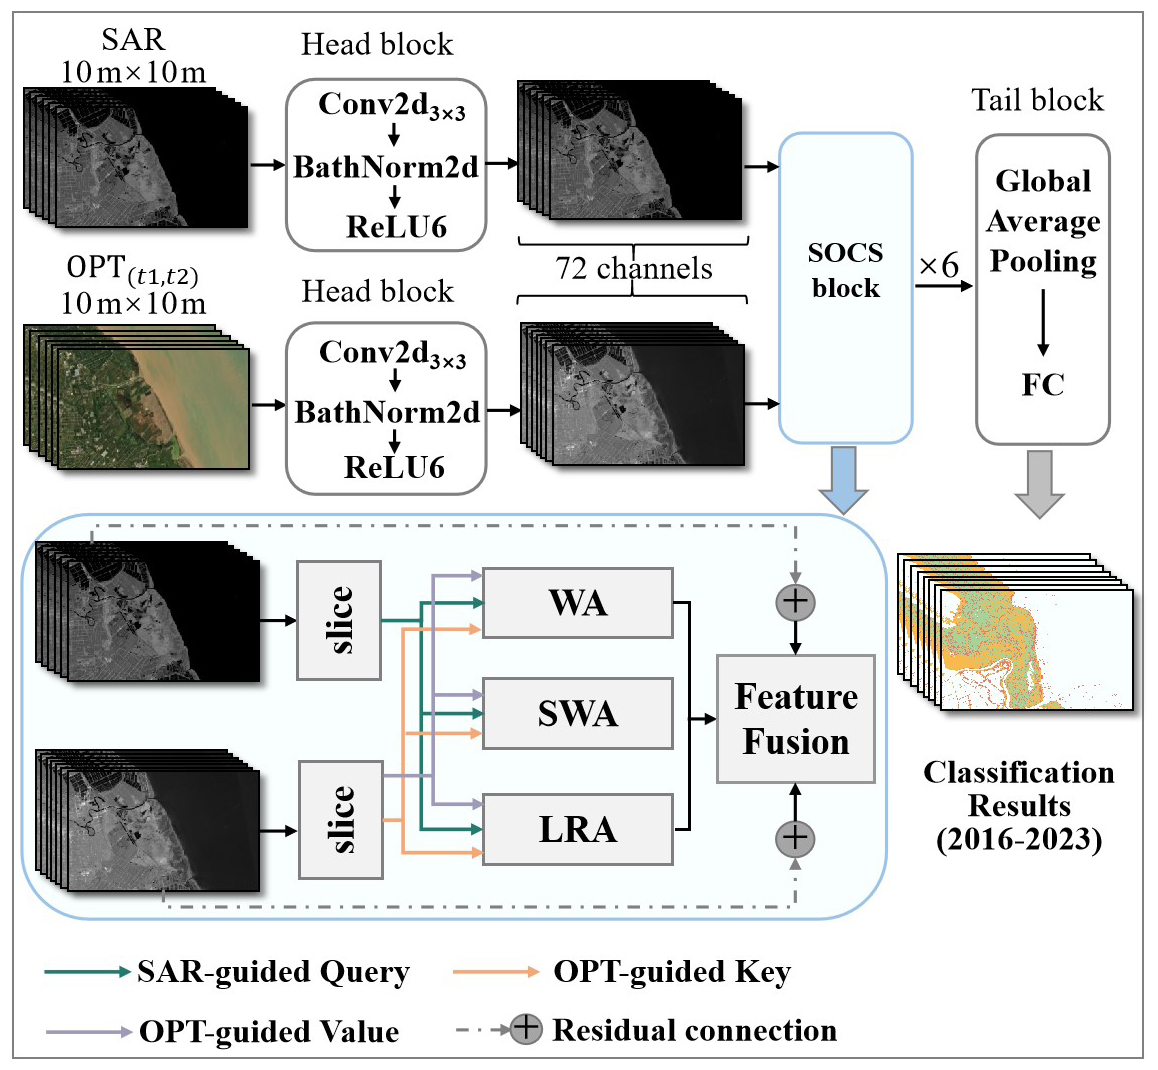
Figure 3Architecture of our proposed model, P_SVCN. The network has dual branches for Sentinel-1 SAR and dual-phase Sentinel-2 optical imagery. Each branch begins with a Head Block producing 72-channel features. Features pass through six SOCS blocks with window attention, shifted window attention, and long-range attention, residual connections, and feature fusion. Fused features are pooled globally and fed to a fully connected layer for classification, producing coastal wetland vegetation maps (2016–2023).
To fully exploit the advantages of multiple attention mechanisms, the SAR–Optical Cross-Source (SOCS) block employs three parallel attention operations along the channel dimension: window attention (WA), shifted window attention (SWA), and long-range attention (LRA) (Song and Zhong, 2022). For an input feature map , the channels are evenly split into K=3 groups, each processed by one of the three attention mechanisms. Let the group feature dimensions be , satisfying . Each group is input to its respective attention module, and the outputs are concatenated along the channel dimension, forming the SOCS block output:
where WA(⋅), SWA(⋅), and LRA(⋅) denote window attention, shifted window attention, and long-range attention, respectively, and CAT(⋅) represents channel-wise concatenation.
3.4.4 Model Training and Implementation Details
The proposed P_SVCN framework was implemented using the PyTorch deep learning library and trained on an NVIDIA GeForce RTX 4090 GPU. To optimize the network parameters for the classification of six coastal wetland vegetation types, we employed the Adam optimizer (Kingma and Ba, 2015) with a weight decay of to provide regularization and enhance generalization. The initial learning rate was set to , and the epsilon parameter (ϵ) for numerical stability was maintained at .
To ensure stable convergence and prevent the model from becoming trapped in local optima during the fine-grained classification of multi-source Sentinel-1/2 data, a MultiStepLR scheduler was utilized. The learning rate was decayed by a factor of 0.1 (γ=0.1) at specified milestones, specifically at epochs 30, 60, and 90. The Cross-Entropy loss function was adopted as the objective function to minimize categorical errors across the six classes. The entire training process spanned 100 epochs with a mini-batch size of 32.
3.4.5 Accuracy evaluation of P_SVCN
To evaluate the classification performance of the proposed P_SVCN, an independent accuracy assessment was conducted. All samples were randomly divided into training and validation subsets in a strict 7:3 ratio to ensure a balanced representation of vegetation classes, with 4668 in situ data points used for model validation.
Model performance was evaluated using a confusion matrix, from which several widely adopted statistical metrics were derived, including Overall Accuracy (OA), Producer's Accuracy (PA), User's Accuracy (UA), F1-score, and the Kappa coefficient (Morales-Barquero et al., 2019). Specifically, the Overall Accuracy (OA), representing the proportion of correctly classified samples among all validation samples, was computed as shown in Eq. (7). The Producer's Accuracy (PA) and User's Accuracy (UA), which quantify omission and commission errors for each class, respectively, were calculated according to Eq. (8). The F1-score, providing a harmonic mean of precision and recall for each class, was computed as in Eq. (9). Finally, the Kappa coefficient, which evaluates the agreement between the classified and reference data beyond random chance, was calculated following Eq. (10).
To further validate the effectiveness of the multi-source attention fusion design, P_SVCN was compared with the Salt marsh Vegetation Classification Network (SVCN) (Li et al., 2024b), a baseline model built upon MobileNet V3. Both models were trained and validated using the same dataset and experimental settings to ensure a fair and reliable comparison. All accuracy metrics were computed in a Python environment using the scikit-learn library. This validation framework provides a systematic and objective basis for quantitatively assessing the advantages of the P_SVCN over single-source approaches in salt marsh vegetation classification.
4.1 CCAV-10m dataset
We present CCAV-10m, an annual 10 m resolution vegetation dataset that accurately captures the spatiotemporal dynamics of coastal wetland species across eastern China from 2016 to 2023. The dataset has a spatial resolution of 10 m and represents the first publicly released annual time series of coastal wetland vegetation in eastern China. CCAV-10m distinguishes six representative coastal wetland vegetation types–S. alterniflora, P. australis, Suaeda spp., S. mariqueter, mangroves, and T. chinensis – achieving species-level classification. Model validation shows a high overall accuracy (OA) of 0.916 and a Kappa coefficient of 0.898, indicating stable and reliable identification across all vegetation types.
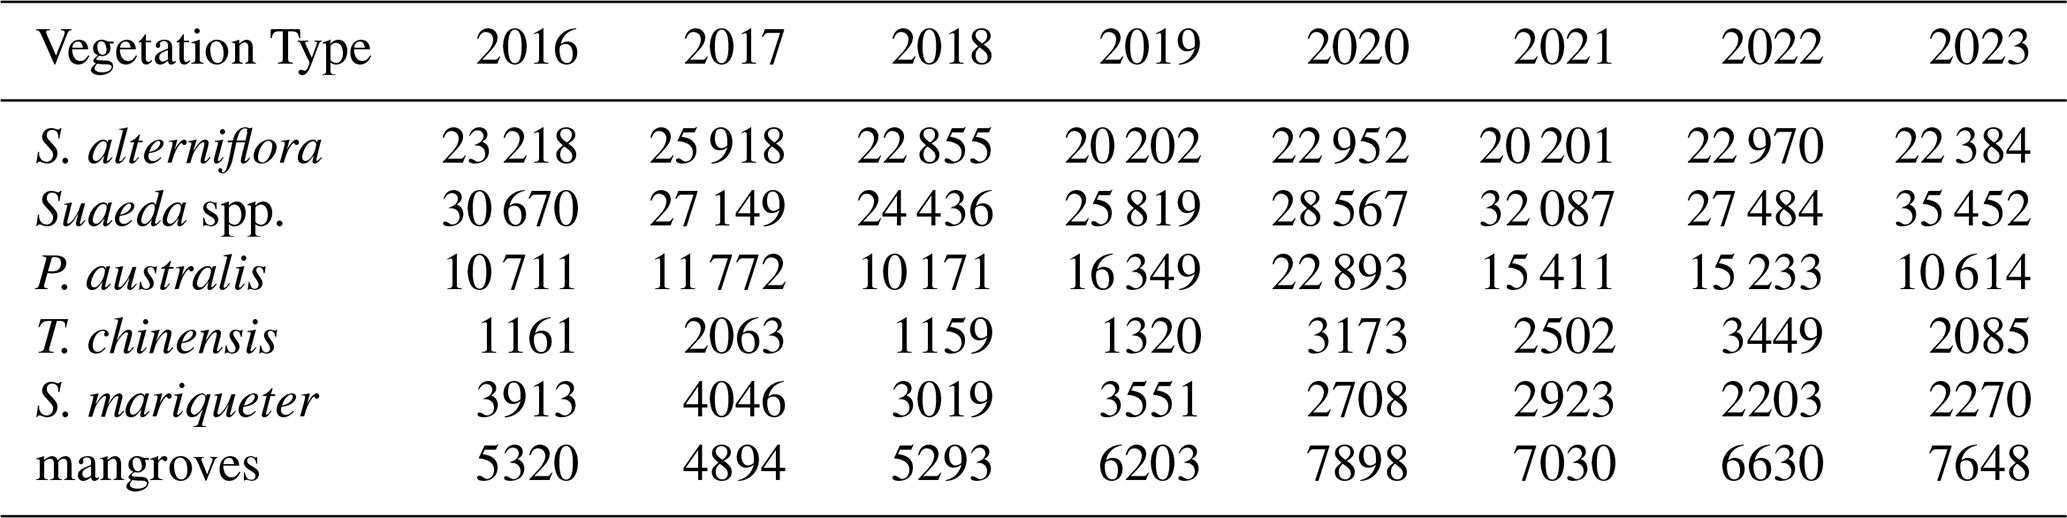
In 2023, coastal wetlands in eastern China covered a total area of 617 976.38 ha, comprising six dominant vegetation types: S. alterniflora, P. australis, Suaeda spp., S. mariqueter, T. chinensis, and mangroves (Fig. 4). From 2016 to 2023, coastal wetland vegetation exhibited pronounced interannual dynamics across eastern China (Table 2), with Suaeda spp. as the dominant type, followed by S. alterniflora, whose coverage is nearly equivalent to the combined extent of P. australis, mangroves, S. mariqueter, and T. chinensis. S. alterniflora, as an invasive saltmarsh species, maintained a relatively stable area, fluctuating between 20 202 ha and 25 918 ha, with occasional declines. Suaeda spp. showed a notable increasing trend, expanding from 24 436 ha in 2018 to 35 452 ha in 2023. P. australis exhibited considerable interannual variability, reaching its maximum of 22 893 ha in 2020, then decreasing to 10 614 ha in 2023. T. chinensis and S. mariqueter occupied relatively smaller areas, although T. chinensis experienced localized expansion in 2020 and 2022. As a key component of coastal protection, mangroves increased from 4894 ha in 2017 to 7648 ha in 2023, showing an overall upward trend.
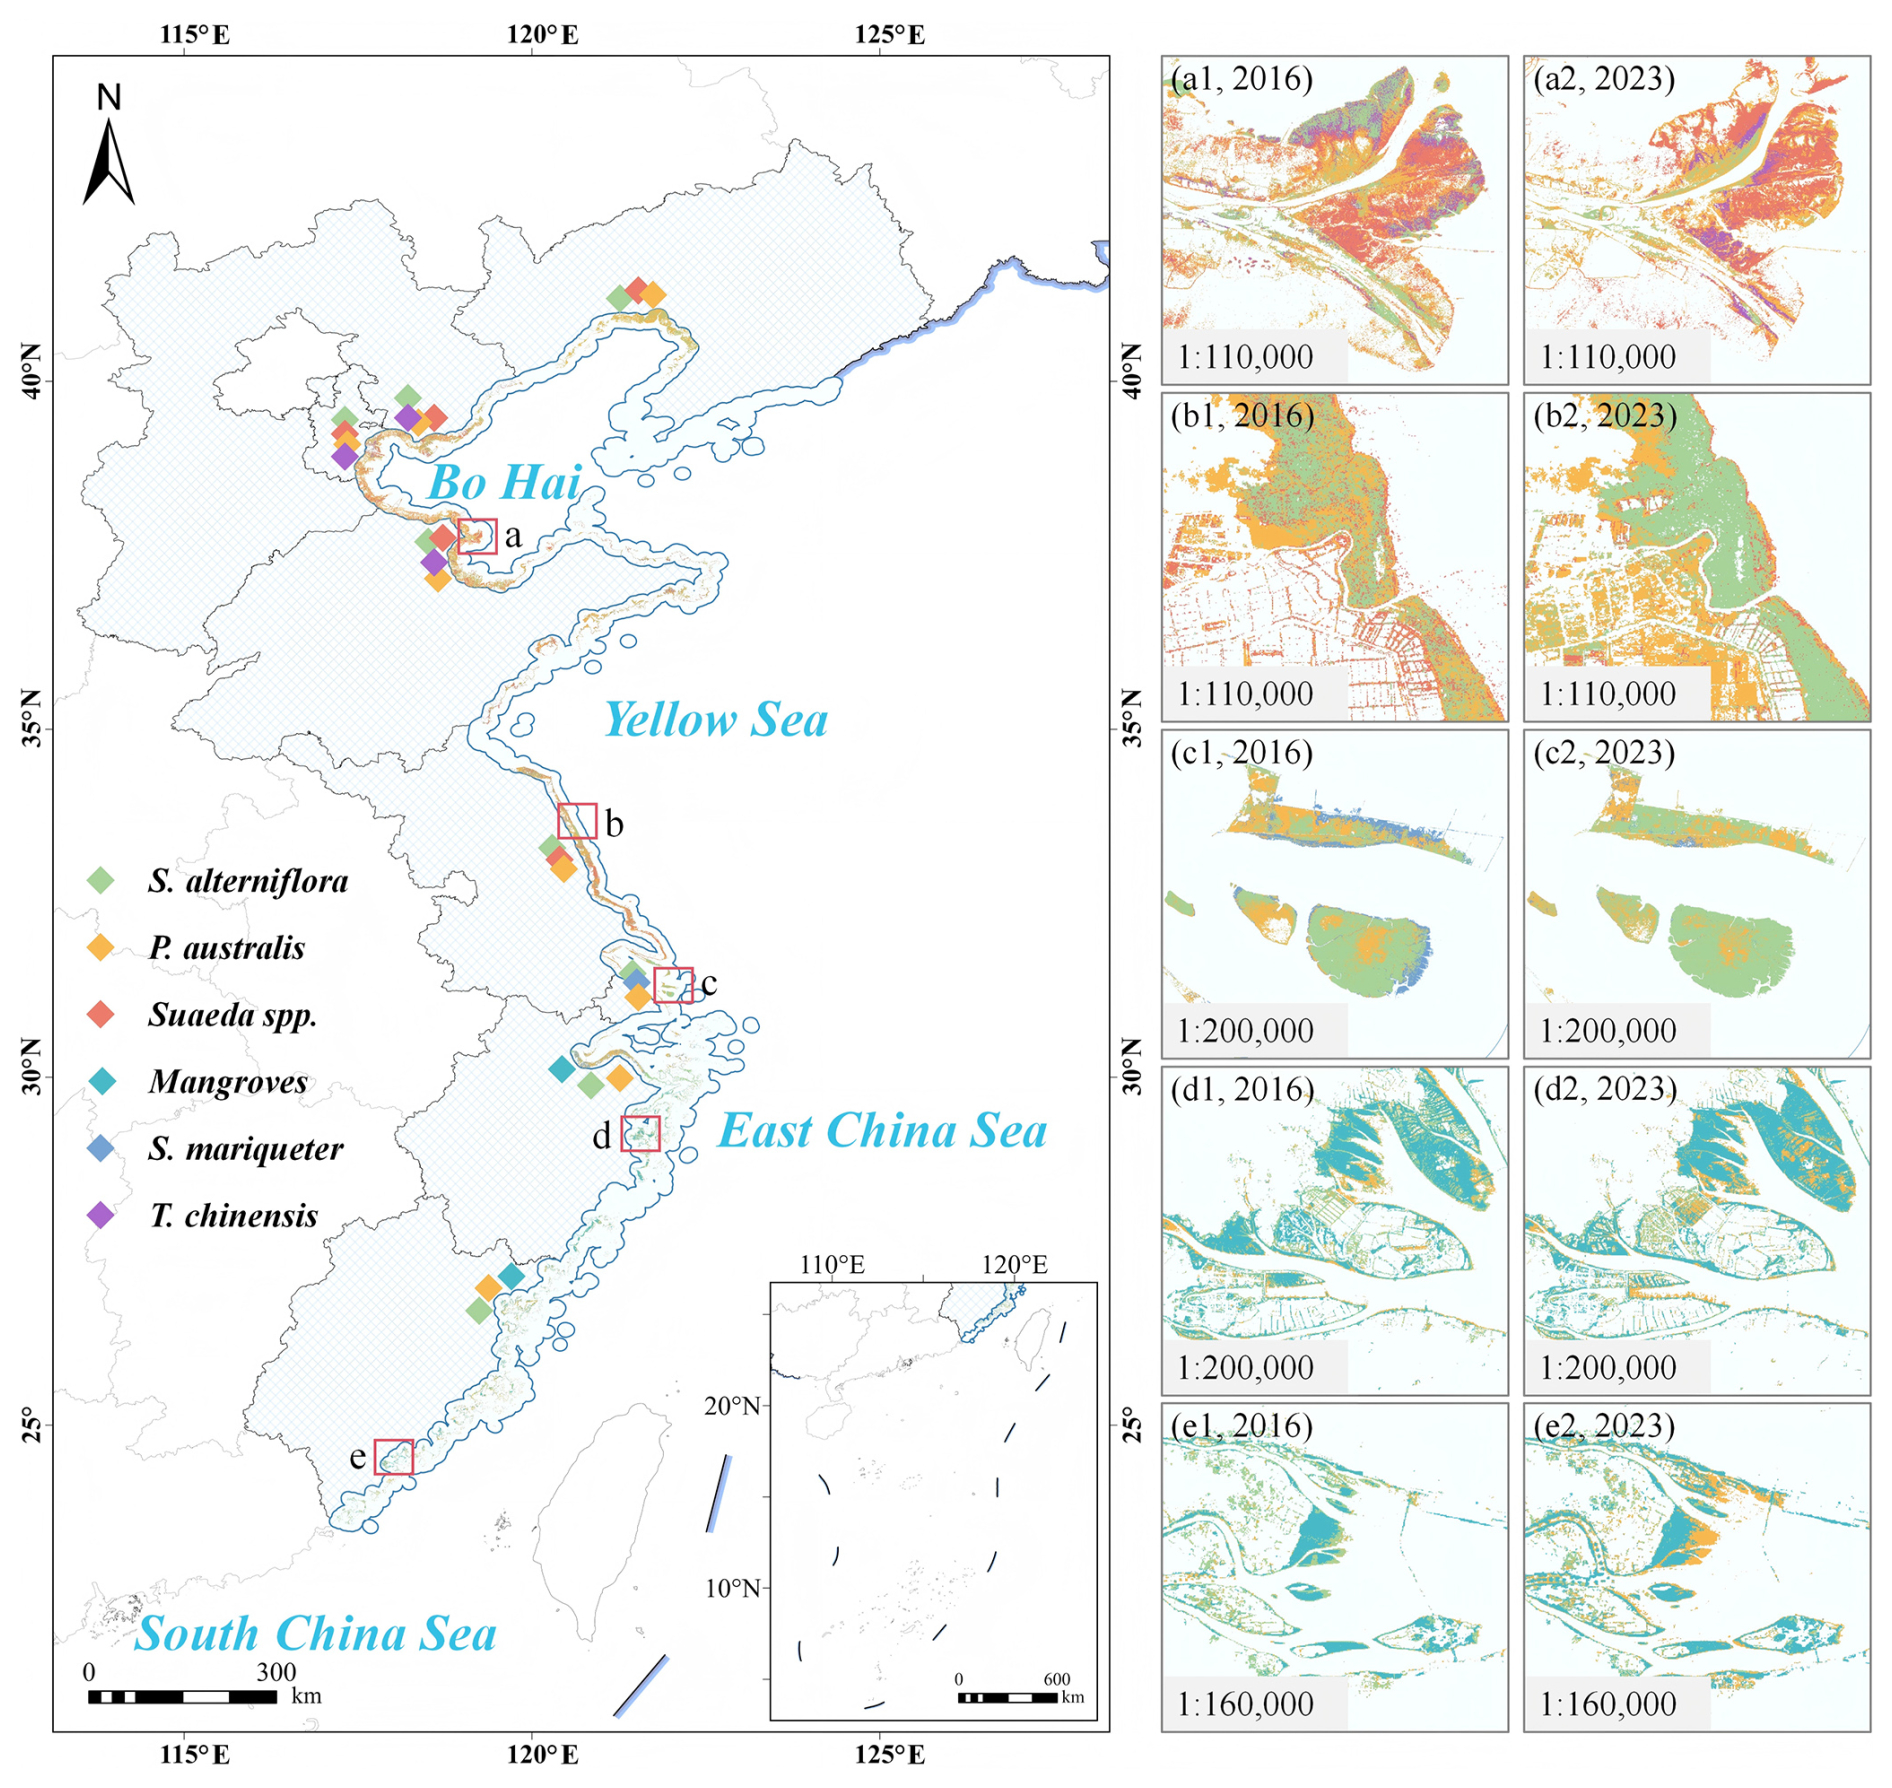
Figure 4Spatial distribution of coastal wetland vegetation in eastern China and representative regional changes from 2016 to 2023. The main map shows the distribution of dominant coastal wetland species across eastern China in 2023. Insets illustrate the temporal changes in species distribution for key coastal regions: (a1, 2016) and (a2, 2023) represent the Yellow River Estuary; (b1, 2016) and (b2, 2023) represent the Jiangsu coast; (c1, 2016) and (c2, 2023) represent the Yangtze River Estuary; (d1, 2016) and (d2, 2023) represent the Zhejiang coast; and (e1, 2016) and (e2, 2023) represent the Fujian coast.
Table 2Area of coastal wetland vegetation types in eastern China from 2016 to 2023 (ha). The table summarizes annual changes for six representative vegetation types (S. alterniflora, Suaeda spp., P. australis, T. chinensis, S. mariqueter, and mangroves), highlighting temporal dynamics and trends over the eight years.
The transition matrices (Fig. 5) derived from the classification results of 2016, 2018, 2020, and 2023 indicate that the dominant wetland vegetation types along the coast of eastern China experienced substantial dynamics during this period. Overall, transitions among S. alterniflora, Suaeda spp., and P. australis were the most frequent, whereas the distributions of T. chinensis, S. mariqueter, and mangroves remained relatively stable.
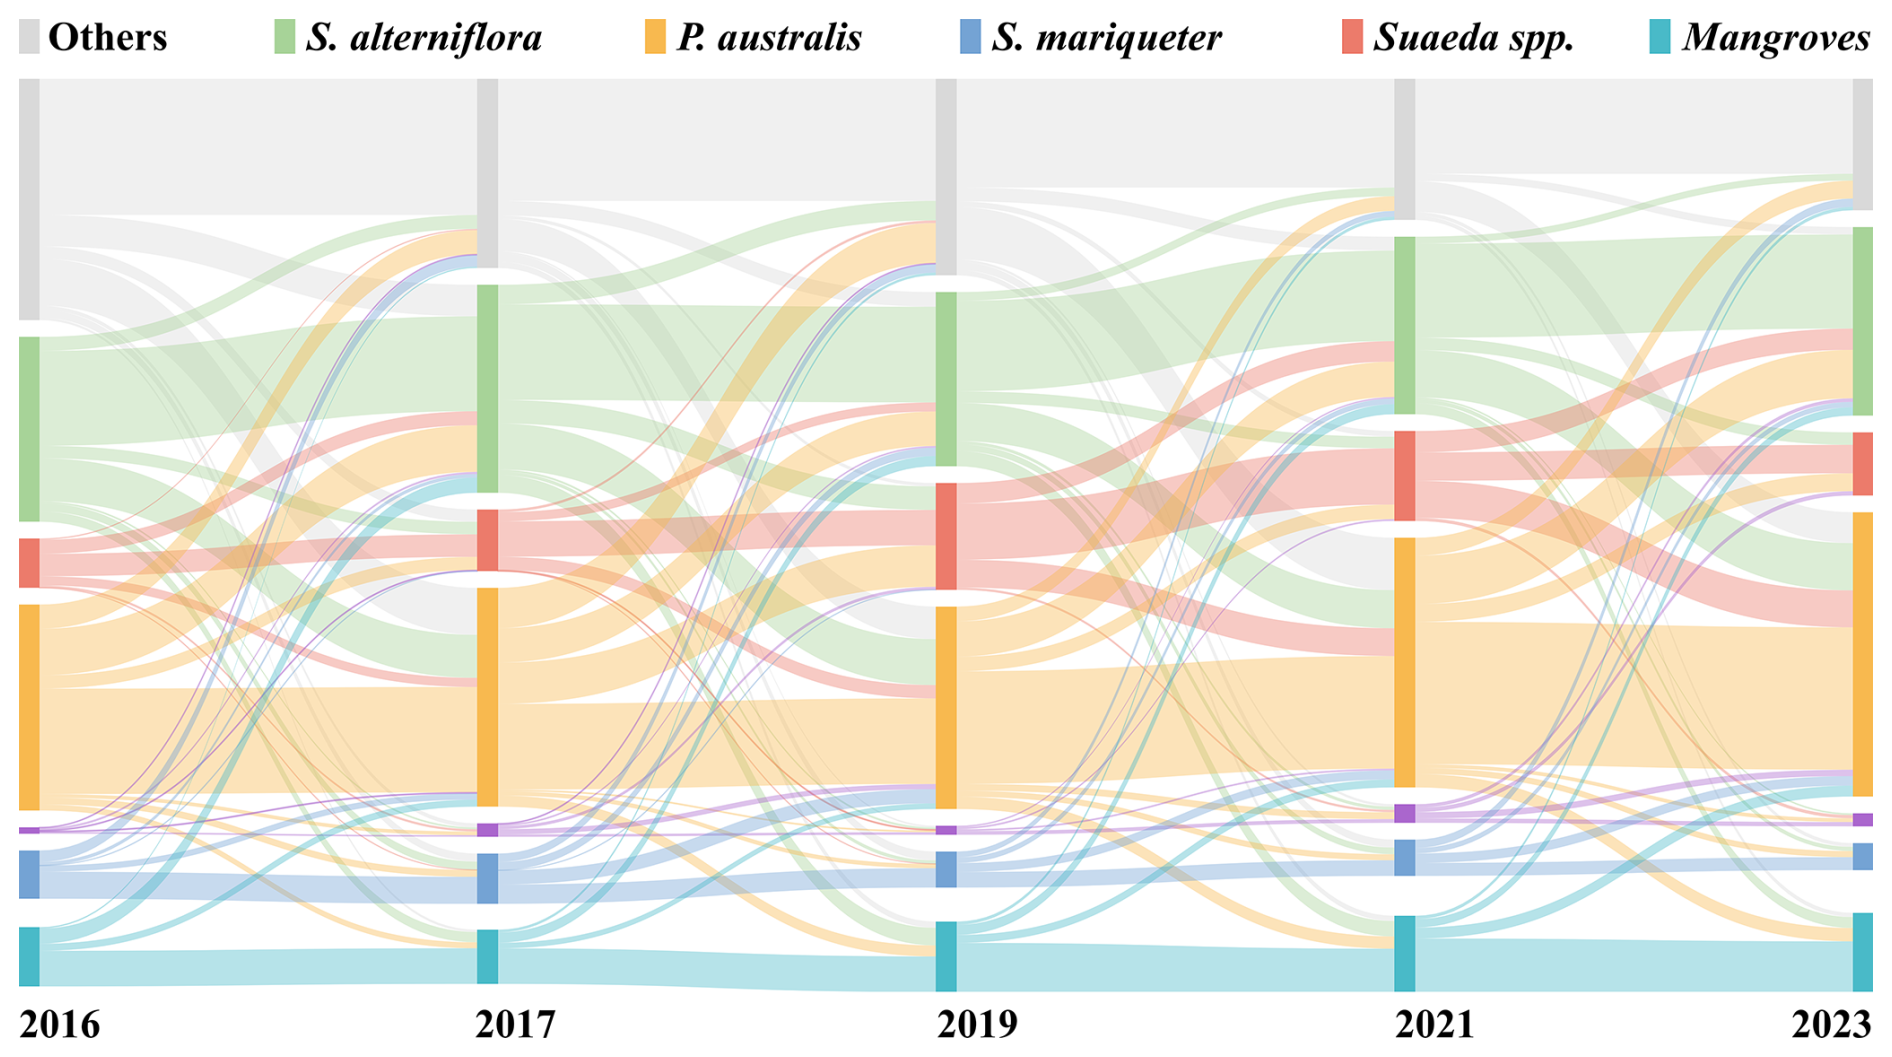
Figure 5Sankey diagram showing the transitions among coastal wetland vegetation types in eastern China from 2016 to 2023. The width of each flow represents the area of vegetation conversion between consecutive years, highlighting dominant succession pathways and interannual dynamics among S. alterniflora, Suaeda spp., P. australis, T. chinensis, S. mariqueter, and mangroves.
During 2016–2018, the primary transitions occurred from Suaeda spp. and P. australis to S. alterniflora, with transition areas of approximately 830 ha (30.5 %) and 2800 ha (26.0 %), respectively. The self-persistence of S. alterniflora was about 7970 ha (56.6 %), higher than that of other types, indicating that most patches maintained their type between the two periods. In 2018–2020, these transitions intensified, with areas converting from Suaeda spp. and P. australis to S. alterniflora reaching approximately 560 ha (17.0 %) and 2910 ha (23.5 %), respectively, both higher than in the previous period. The net gain of S. alterniflora during this interval was about 3810 ha, representing the most pronounced expansion phase, consistent with its large-scale colonization of the lower tidal flats. During 2020–2023, the overall transition rate decreased. The reverse transitions from S. alterniflora to Suaeda spp. and P. australis were approximately 970 ha (8.2 %) and 3520 ha (29.6 %), respectively, while conversions from Suaeda spp. to S. alterniflora still accounted for 1720 ha (25.1 %), suggesting local replacement or management interventions. The areas of change for mangroves and T. chinensis were both less than 200 ha (<1 %), remaining concentrated in the southern estuarine regions.
4.2 Performance evaluation of P_SVCN
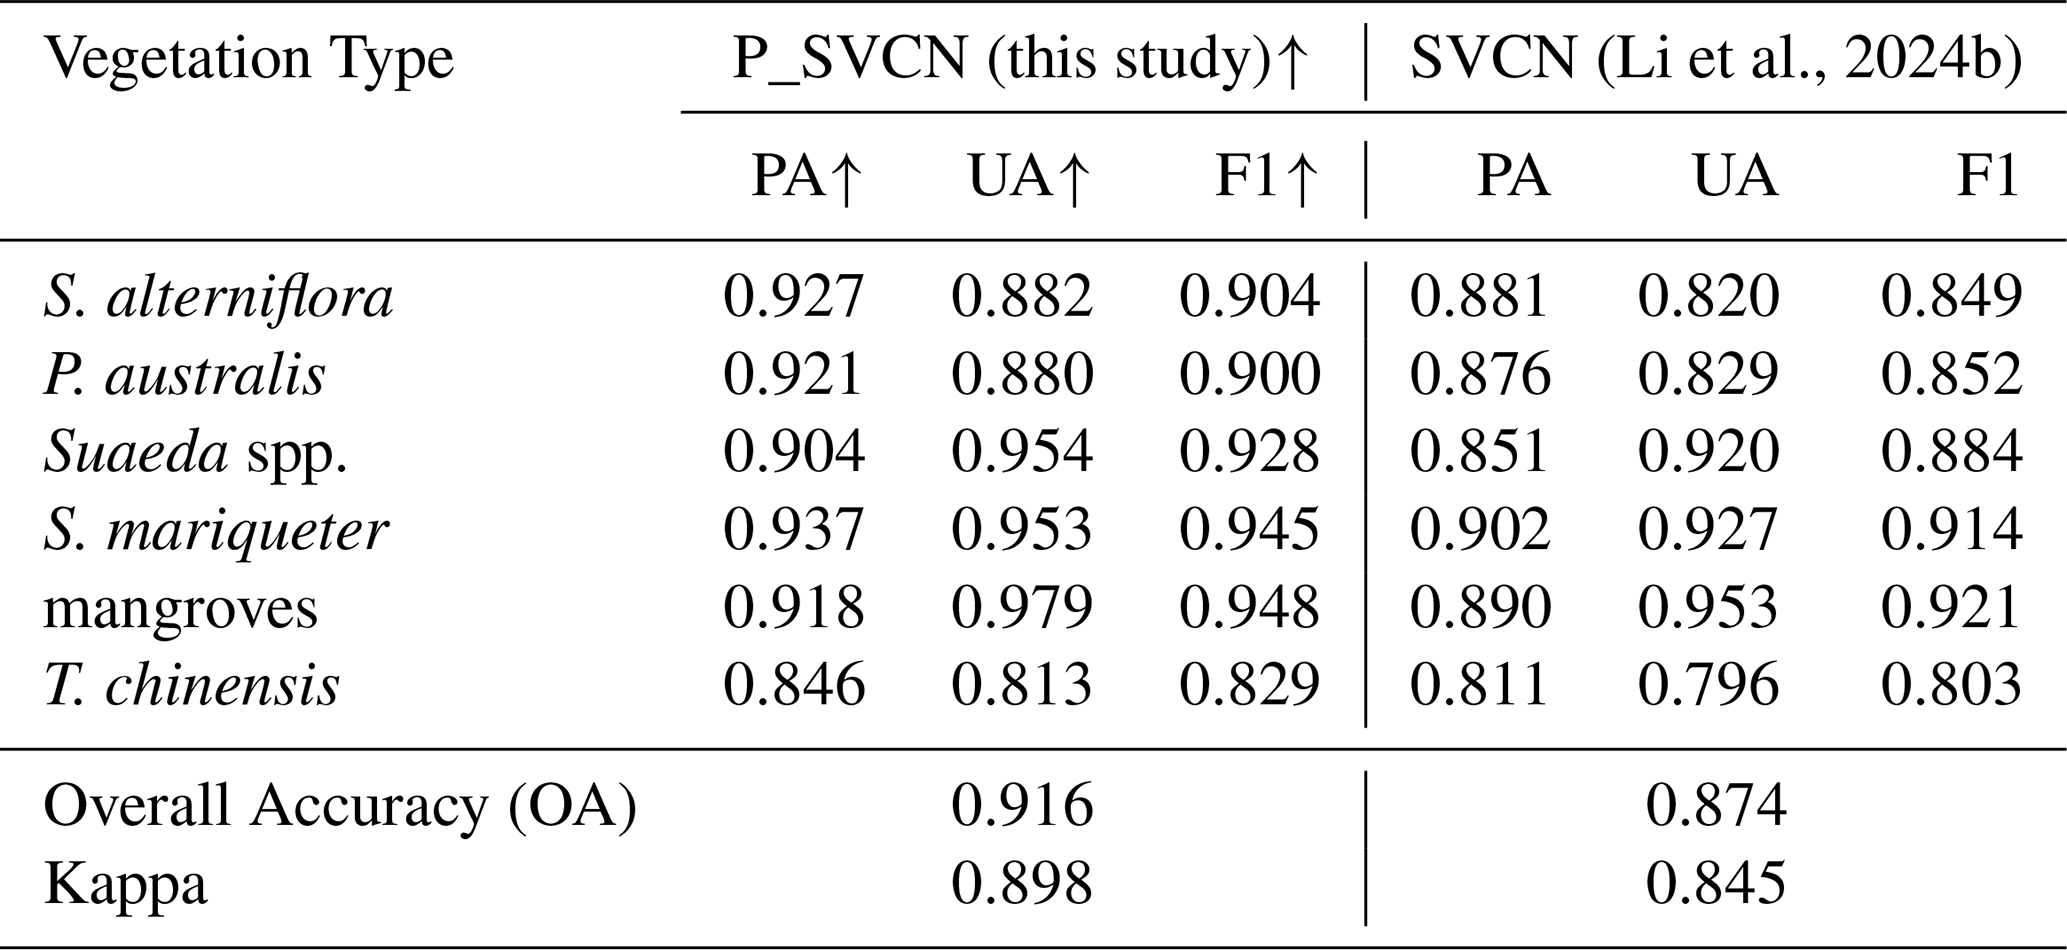
A total of 15 558 in-situ data points were collected across eastern China's coastal wetlands and partitioned into training (70 %) and validation (30 %, n=4668) sets following a stratified random sampling principle based on both vegetation types and geographic regions. To further evaluate the effectiveness of the proposed P_SVCN model, we compared its performance with the Salt marsh Vegetation Classification Network (SVCN) (Li et al., 2024b) on the same validation dataset. As shown in Table 3, P_SVCN outperformed SVCN across all vegetation classes. For S. alterniflora, P_SVCN achieved a producer's accuracy (PA) of 0.927, user's accuracy (UA) of 0.882, and F1 score of 0.904, compared to 0.881, 0.820, and 0.849 for SVCN. For P. australis, the corresponding values were 0.921, 0.880, and 0.900 for P_SVCN vs. 0.876, 0.829, and 0.852 for SVCN. For Suaeda spp., P_SVCN yielded a PA of 0.904, UA of 0.954, and F1 score of 0.928, higher than SVCN (PA=0.851, UA=0.920, F1=0.884). Similarly, S. mariqueter (P_SVCN: 0.937/0.953/0.945; SVCN: 0.902/0.927/0.914), mangroves (P_SVCN: 0.918/0.979/0.948; SVCN: 0.890/0.953/0.921), and T. chinensis (P_SVCN: 0.846/0.813/0.829; SVCN: 0.811/0.796/0.803) also exhibited higher accuracy metrics under P_SVCN. The overall accuracy (OA) and Kappa coefficient for P_SVCN were 0.916 and 0.898, respectively, exceeding those of SVCN (OA=0.874, Kappa=0.845). These results indicate that the dual-branch multi-source attention design of P_SVCN effectively enhances classification performance for coastal wetland vegetation types.
(Li et al., 2024b)Table 3Comparison of classification accuracy between P_SVCN and SVCN for coastal wetland vegetation types. The upward arrow (↑) indicates that the P_SVCN's metric values are comparatively higher, demonstrating the P_SVCN's superior performance.
The detailed confusion matrices for the P_SVCN and SVCN models are presented in Fig. 6. Rows correspond to the ground truth classes, and columns represent predicted classes. Diagonal entries indicate the number of correctly classified samples, while off-diagonal elements reflect misclassifications. P_SVCN shows consistently higher per-class accuracy compared with SVCN. The largest improvements are observed in Suaeda spp. and T. chinensis, which are often confused with neighboring species in SVCN predictions. Misclassifications in both models mainly occur between spectrally or structurally similar vegetation types, such as S. alterniflora vs. P. australis. This highlights the advantage of P_SVCN's multi-source feature integration, which effectively captures both SAR structural information and optical phenology for improved discriminability.
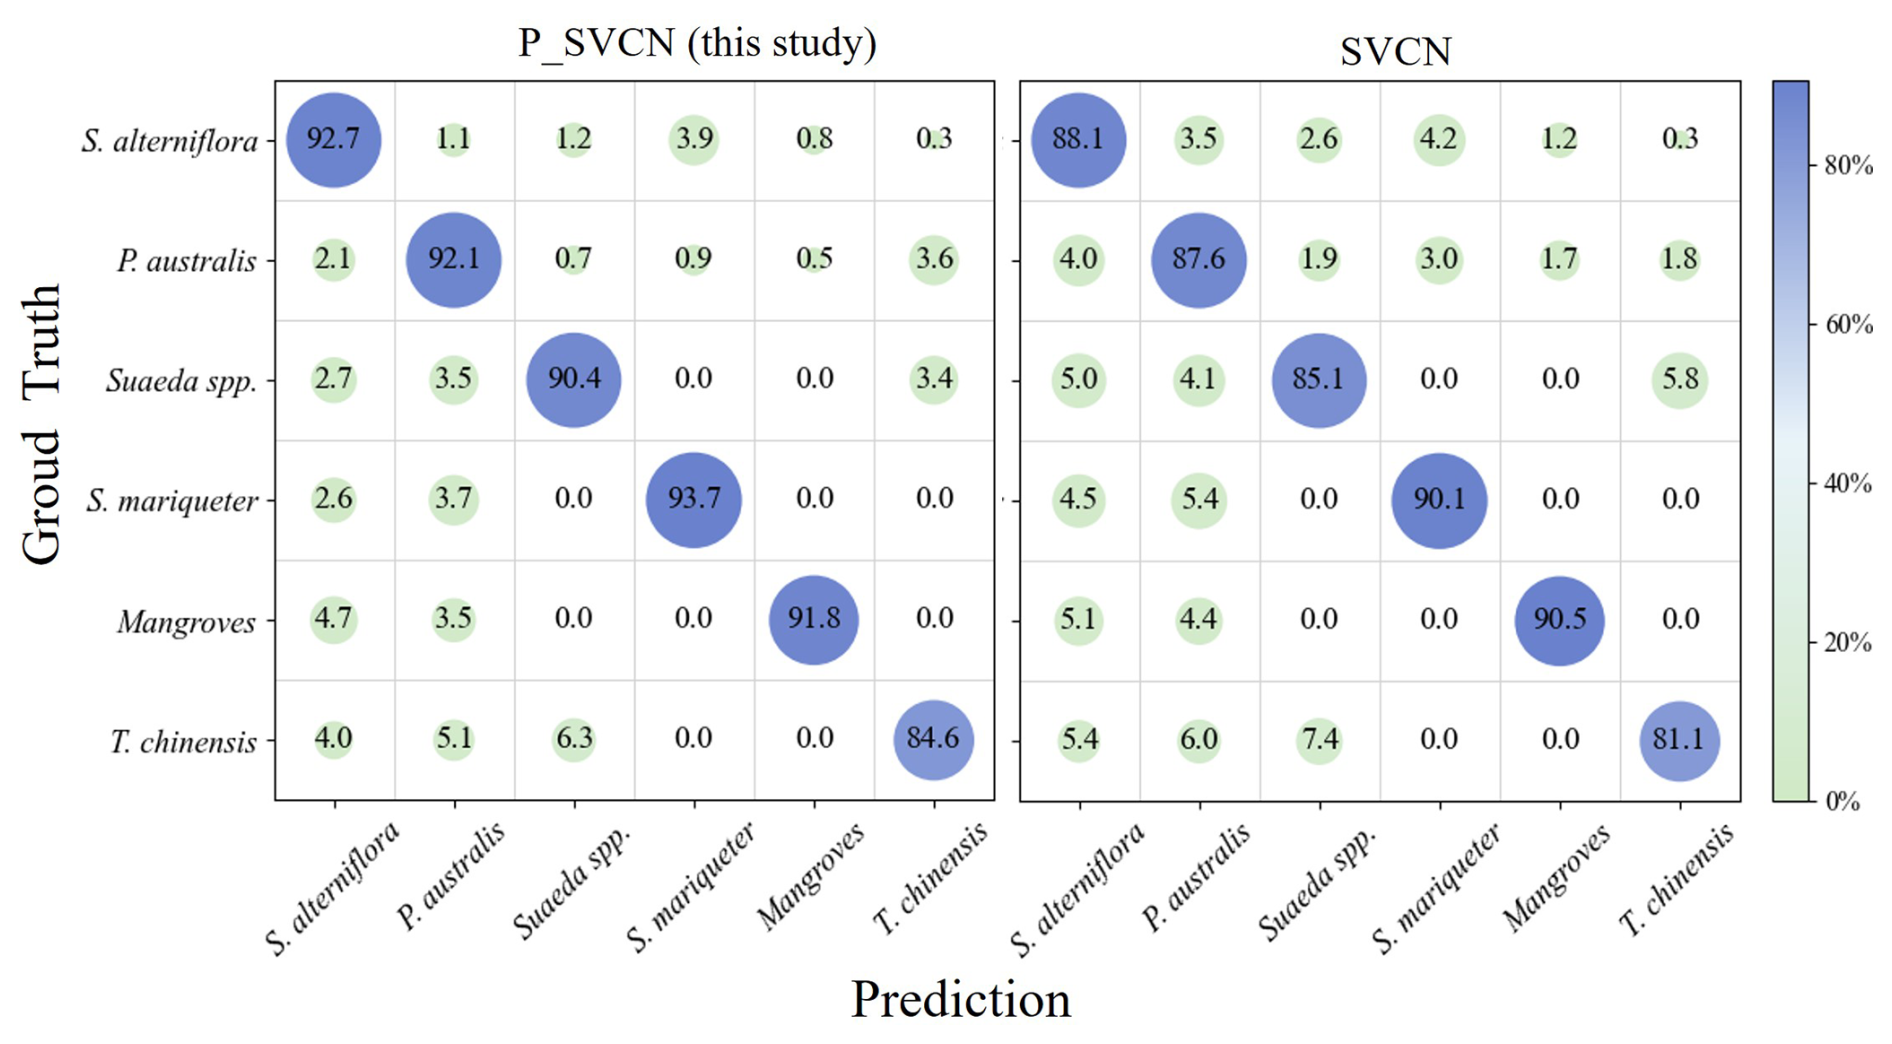
Figure 6Comparison of confusion matrices for P_SVCN and SVCN on coastal wetland vegetation classification. The diagonal elements indicate the percentage of correctly classified samples, while the off-diagonal elements represent the percentage of misclassified samples.
This marked performance leap is fundamentally attributed to the synergistic integration of multi-temporal optical phenology and Synthetic Aperture Radar (SAR) structural attributes within the P_SVCN architecture. In contrast to the SVCN model, which relies exclusively on Sentinel-1 SAR backscattering coefficients (σ0), P_SVCN introduces multi-temporal optical observations to construct a high-dimensional Phenological-Spectral Vector (PSV).
Within complex coastal wetland ecotones, discriminating between vegetation species with analogous physical architectures is inherently constrained when relying solely on SAR observations. Furthermore, radar backscatter is highly susceptible to fluctuations in the surface dielectric constant induced by periodic tidal inundation. P_SVCN effectively circumvents the information bottleneck of single-source radar data by utilizing the PSV to characterize species-specific growth trajectories – most notably the distinctive “red beach” spectral signature of Suaeda spp. during the senescence stage (Phase 2). Simultaneously, the framework preserves the deterministic advantages of SAR in characterizing canopy volume and biomass. By leveraging a multi-source attention mechanism, P_SVCN facilitates dynamic complementarity between the optical “biological fingerprint” and the radar-derived “physical structure,” thereby substantially mitigating classification uncertainty.
5.1 The CCAV-10m dataset: Filling a critical gap in coastal wetland vegetation mapping
We introduce CCAV-10m, an annual 10 m coastal wetland vegetation dataset generated using the P-SVCN model, which captures the spatial and temporal dynamics of eastern coastal China's wetland vegetation from 2016 to 2023. As the first publicly available species-level coastal wetland dataset for this region, CCAV-10m provides fine-resolution mapping of six representative vegetation types–S. alterniflora, P. australis, Suaeda spp., S. mariqueter, mangroves, and T. chinensis. Model evaluation demonstrates robust performance, with an overall accuracy of 0.916 and a Kappa coefficient of 0.898.
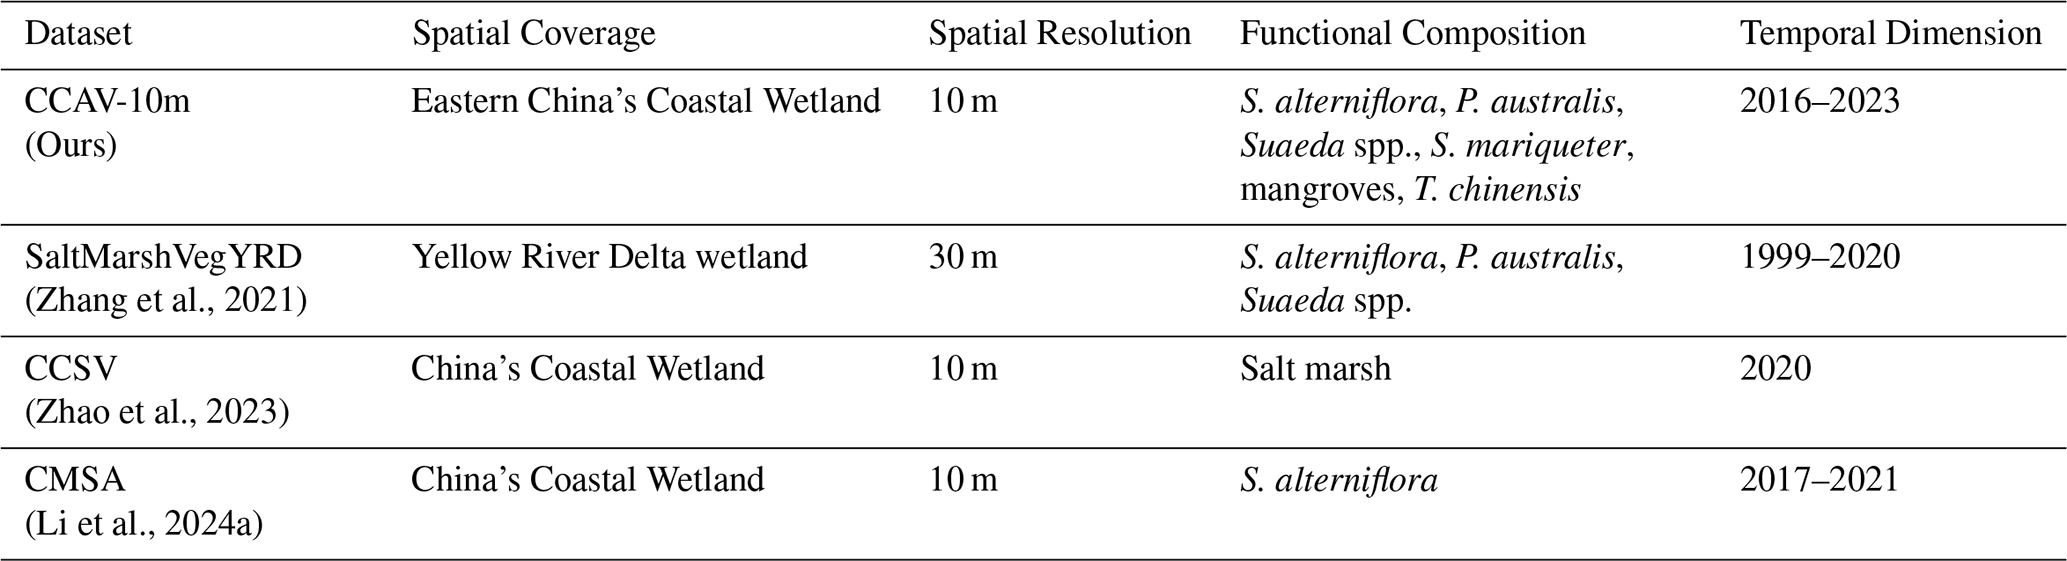
Compared with existing coastal wetland datasets (Table 4), CCAV-10m demonstrates significant advantages in terms of spatial coverage, functional composition, and temporal continuity. First, regarding spatial coverage, CCAV-10m spans the entire coastal zone of eastern China, and its 10 m resolution enables precise delineation of complex intertidal vegetation mosaics. In contrast, SaltMarshVegYRD (Zhang et al., 2021) is limited to the Yellow River Delta with a 30 m resolution, and CMSA (Li et al., 2024a), although also at 10 m resolution, focuses solely on a single invasive species, failing to systematically represent coastal vegetation patterns at the national scale. Second, in terms of functional composition, CCAV-10m provides species-level refinement, differentiating six representative vegetation types along the Chinese coast: S. alterniflora, P. australis, Suaeda spp., S. mariqueter, mangroves, and T. chinensis. By comparison, CCSV (Zhao et al., 2023) classifies only broad salt marsh categories, and CMSA focuses exclusively on the invasive species S. alterniflora, both lacking intra-community functional differentiation. Finally, in the temporal dimension, CCAV-10m offers a continuous annual time series from 2016 to 2023, enabling long-term and systematic monitoring of coastal wetland dynamics. In contrast, CCSV contains only a single epoch in 2020, and CMSA provides annual sequences but only for a single species.
(Zhang et al., 2021)(Zhao et al., 2023)(Li et al., 2024a)Table 4Comparison of CCAV-10m with existing coastal wetland datasets.
CCAV-10m achieves multidimensional improvements in spatial coverage, functional composition, and temporal continuity. It represents the first high-resolution coastal vegetation dataset in eastern China with multi-species recognition and annual consistency, providing unified and high-quality baseline data for studies on coastal ecosystem succession, invasive species spread, and blue carbon assessment.
5.2 Provincial-scale dynamics of eastern China's coastal wetland vegetation (2016–2023)
Coastal wetland vegetation exhibited clear provincial-scale differences in eastern China from 2016 to 2023. In Liaoning Province, the dominant vegetation types included S. alterniflora, Suaeda spp., and P. australis. Hebei, Shandong, and Tianjin showed similar compositions, characterized mainly by S. alterniflora, Suaeda spp., and P. australis, with additional occurrences of T. chinensis in specific areas. In Jiangsu Province, coastal wetlands were primarily dominated by S. alterniflora, Suaeda spp., and P. australis. Shanghai featured a vegetation assemblage composed of S. alterniflora, S. mariqueter, and P. australis. In Zhejiang Province, S. alterniflora and S. mariqueter were widely distributed, accompanied by patches of mangroves and P. australis. Fujian Province, located at the southernmost part of the study area, was characterized by extensive mangrove ecosystems, with additional distributions of S. alterniflora and P. australis.
Coastal wetlands showed clear provincial differences in area and species composition(Fig. 7). Jiangsu, Shandong, and Zhejiang had the largest wetland areas, followed by Fujian, Liaoning, and Shanghai, while Hebei and Tianjin were smaller. S. alterniflora and P. australis dominated most provinces, with Suaeda spp., T. chinensis, S. mariqueter, and mangroves restricted but ecologically important. In Liaoning, wetlands were stable, dominated by P. australis (450–530 ha) and S. alterniflora (450–9030 ha). Tianjin had scattered wetlands (400–780 ha) with alternating dominance of P. australis and Suaeda spp.. Hebei showed pronounced species dynamics, with S. alterniflora stable (1320–2420 ha) and P. australis increasing from 2870 to 3730 ha. Shandong experienced significant changes, P. australis rising from 3910 to 7120 ha, reflecting Spartina control effects. Jiangsu, the largest coastal wetland province, had over 60 % combined S. alterniflora and P. australis, with P. australis slightly increasing from 3740 to 4710 ha. In Shanghai, wetlands shrank from 1300 to 970 ha, while S. mariqueter partially recovered post-2021. Zhejiang's wetlands alternated between S. alterniflora and P. australis (2990–5240 ha), and S. mariqueter remained stable (2110–4210 ha). Fujian's wetlands were relatively stable (2290–3850 ha), dominated by S. alterniflora. Detailed annual values for each province and species are provided in the Appendix A (Table A1). Coastal wetlands exhibited clear provincial differences, with S. alterniflora and P. australis dominating most regions, while Suaeda spp., T. chinensis, S. mariqueter, and mangroves were more restricted in distribution yet remained ecologically significant, reflecting localized dynamic adjustments within a generally stable vegetation structure.
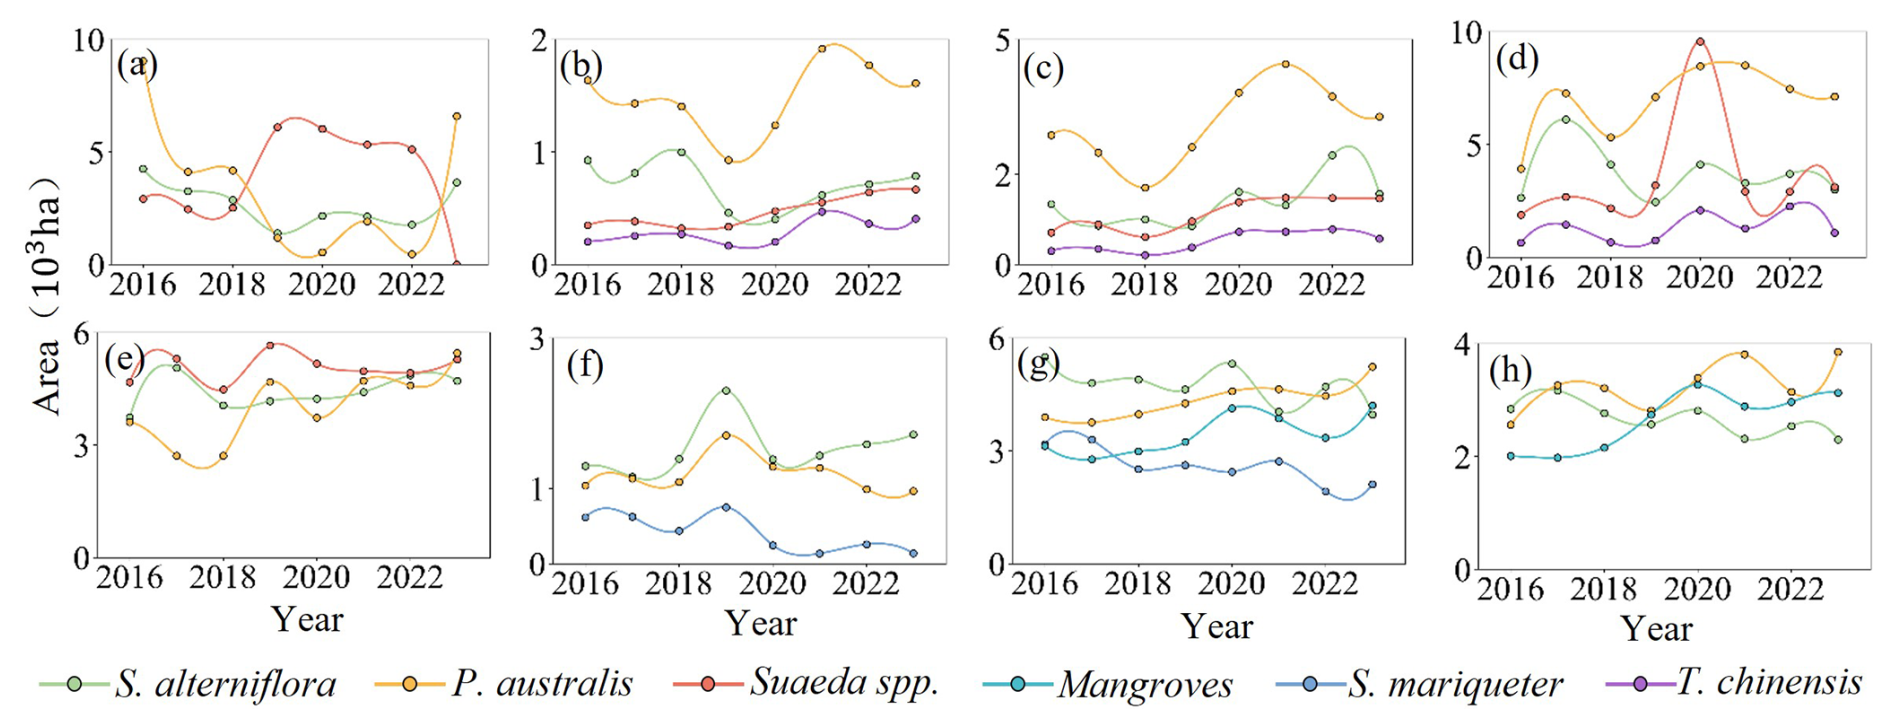
Figure 7Temporal dynamics of wetland vegetation area in eight Chinese coastal provinces from 2016 to 2023. (a) Liaoning, (b) Tianjin, (c) Hebei, (d) Shandong, (e) Jiangsu, (f) Shanghai, (g) Zhejiang, and (h) Fujian.
5.3 Uncertainty analysis of the CCAV-10m dataset
Despite the high overall classification accuracy of the CCAV-10m dataset (OA=0.916), certain uncertainties remain (Table 5). To quantitatively evaluate potential sources of error, we conducted ablation experiments comparing three input configurations: Sentinel-1 only (S1), Sentinel-2 only (S2, dual-temporal composite), and the S1+S2 fusion mode. The overall accuracies were 0.895, 0.870, and 0.916, respectively, indicating significant complementarity between radar and optical information in intertidal wetland vegetation identification.
Table 5Comparison of producer's accuracy (PA) and user's accuracy (UA) for different input configurations: Sentinel-1 (S1), Sentinel-2 (S2, dual-temporal), and S1+S2 fusion. The upward arrow (↑) indicates that the S1+S2 configuration achieves comparatively higher metric values, demonstrating its superior performance.
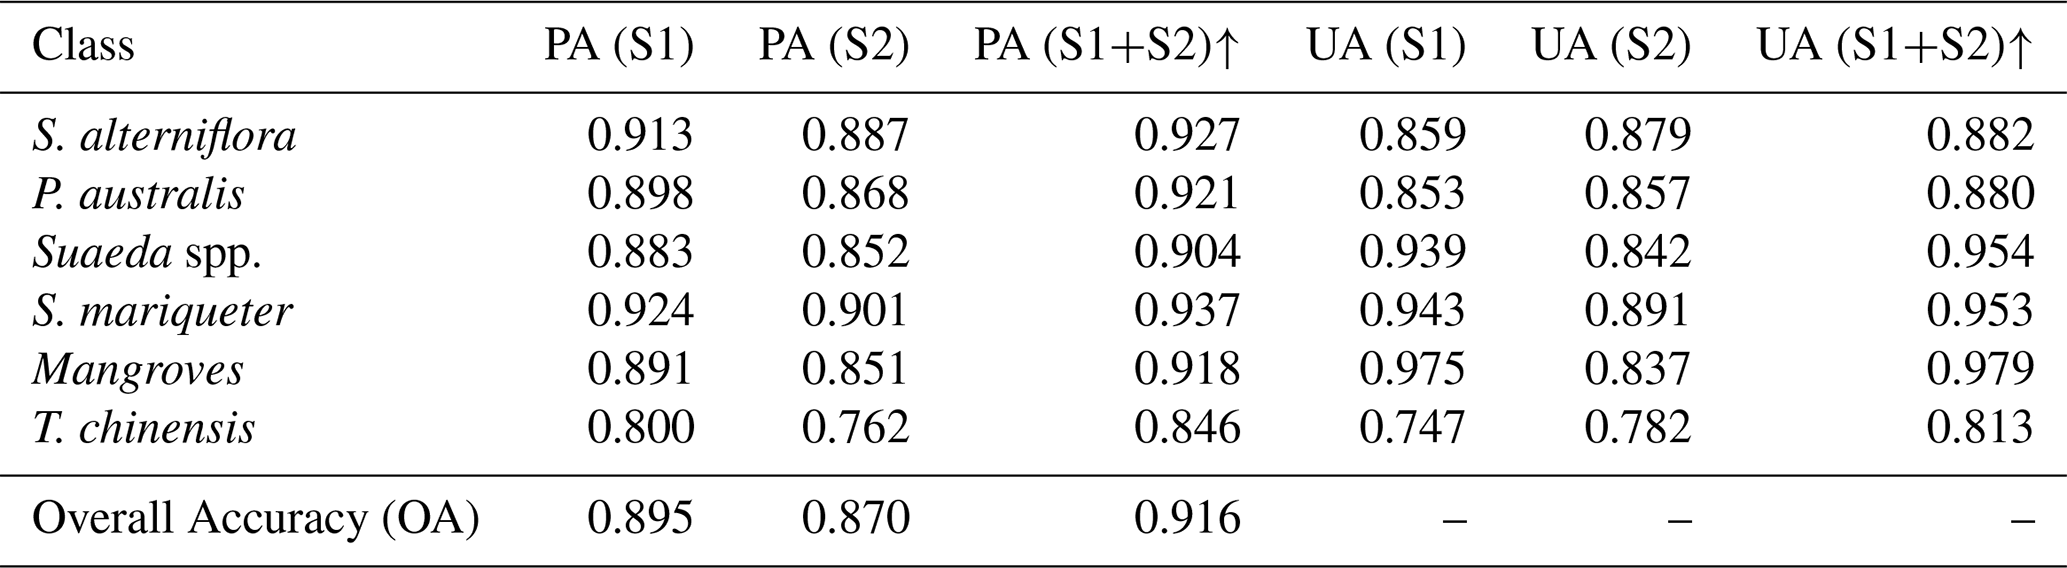
From the classification results, the S1-only configuration slightly outperformed S2 in most vegetation types, particularly in the discrimination of S. alterniflora and P. australis. Sentinel-1 C-band SAR captures canopy structure, surface roughness, and moisture scattering features (Zhang et al., 2022a; Mleczko and Mróz, 2018; Rajngewerc et al., 2022), which are less sensitive to optical disturbances caused by turbid water and cloudy conditions, thus providing advantages in identifying structurally distinct vegetation. In contrast, the S2-only configuration, although leveraging dual-temporal imagery to enhance spectral temporal information, is affected by surface albedo variations and spectral mixing in intertidal zones (Feng et al., 2022), resulting in misclassifications between spectrally similar types such as Suaeda spp. and T. chinensis. The S1+S2 fusion significantly improved per-class producer's accuracy (PA) and user's accuracy (UA), effectively mitigating the limitations of single data sources. The structural and moisture information from SAR complements the spectral and vegetation index features from optical imagery, enabling stable model performance across different tidal stages and climatic conditions, particularly enhancing the separability of Suaeda spp. and T. chinensis.
Nevertheless, residual uncertainties persist. First, T. chinensis and Suaeda spp. are often interspersed in the upper wetland, with similar temporal and phenological characteristics (Gao et al., 2015; Jiao et al., 2021; Wu et al., 2020), making complete discrimination challenging even under multi-source fusion. Second, S. mariqueter has a narrow and highly patchy distribution (Gu et al., 2021), which may result in omission errors under 10 m resolution. Third, despite the overall robustness of the model, localized “out-of-range” misclassifications were observed (e.g. mangrove patches erroneously identified in Hangzhou Bay, exceeding their northern distribution limit).
Future studies could integrate higher-resolution SAR data (e.g. TerraSAR-X, GF-3) and incorporate geographic prior knowledge – such as latitudinal distribution limits and climatic thresholds – as spatial constraints in the post-processing phase. Such a knowledge-guided approach will effectively filter out biologically inconsistent errors and further enhance the spatial reliability of coastal wetland mapping.
5.4 Limitations of the CCAV-10m dataset
While the CCAV-10m dataset demonstrates high overall thematic fidelity, localized inter-annual fluctuations in species distribution (as illustrated in Fig. 7) necessitate a rigorous interpretation within the context of complex environmental background fields. The spatial distribution and spectral identification of coastal wetland vegetation are profoundly influenced by tidal regimes, salinity gradients, and phenological dynamics (Murray et al., 2022). Tidal inundation typically attenuates reflectance in the near-infrared (NIR) spectrum, frequently leading to the omission of low-stature vegetation due to water-induced signal absorption (Kearney et al., 2009). Simultaneously, spatial variations in salinity gradients can alter the biophysical parameters of P. australis, inducing localized spectral deviations that exacerbate the risk of confusion with invasive species such as S. alterniflora (Zhou et al., 2021; Cingano et al., 2025).
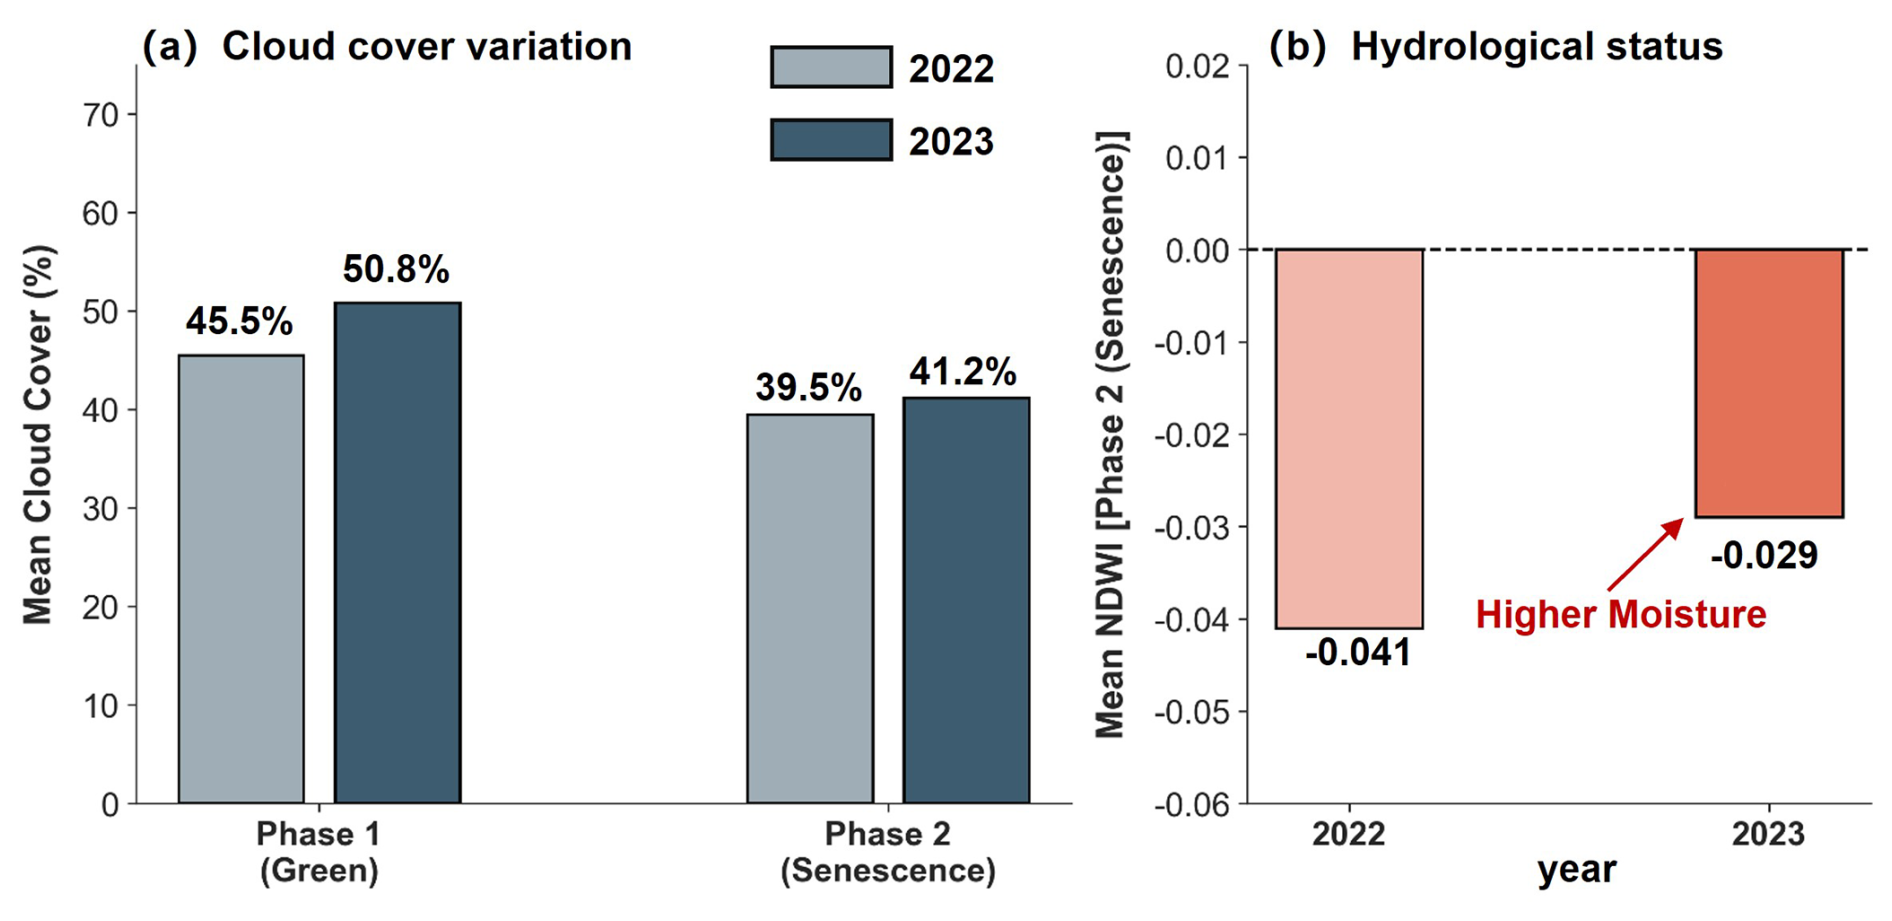
Figure 8Comparative analysis of environmental constraints in the Liaoning coastal zone (2022–2023). (a) Atmospheric Constraints: Mean cloud cover (%) during the green (Phase 1) and senescence (Phase 2) stages. (b) Hydrologic Signal: Mean Normalized Difference Water Index (NDWI) during Phase 2 (senescence).
A prominent case study is the observed abrupt fluctuations of P. australis and Suaeda spp. along the Liaoning coast between 2022–2023. Meteorological back-analysis reveals that these shifts are not indicative of actual ecological succession but are instead “environmental artifacts” induced by extreme hydrometeorological anomalies. From August to September 2023, the Liaoning coastal zone was struck by the consecutive impacts of Typhoons Doksuri and Khanun, which triggered rare and catastrophic precipitation events (Liaoning Provincial Meteorological Service, 2023).
This extreme climate directly compromised the classification logic through two primary mechanisms.First, the physical submergence and subsequent spectral masking. Since Suaeda spp. is a low-stature species with a typical height of less than 30 cm, it is highly susceptible to complete submergence by typhoon-induced storm surges and inland flooding. During the critical “red beach” phenological window in 2023, record-breaking rainfall caused widespread surface water pooling. The regional mean NDWI increased from −0.041 in 2022 to −0.029 in 2023, confirming a significant intensification of the moisture signal (Fig. 8b). This hydrological stress led to strong NIR absorption by the overlying water, which severely dampened the diagnostic spectral signatures of the vegetation and reduced the Signal-to-Noise Ratio (SNR). Consequently, the extracted phenological profiles underwent major distortions that resulted in localized omission errors.
Second, the interplay between atmospheric constraints and observation gaps. The persistent storm systems associated with these typhoons triggered a surge in regional cloudiness. Mean cloud cover during the two critical phases reached 50.76 % and 41.25 % respectively (Fig. 8a). Although we maintained a 10 % cloud-cover threshold for scene selection, the sheer frequency of cloudy days in 2023 drastically curtailed the availability of high-quality “clear-sky” pixels during the peak phenological stages. This scarcity forced a reliance on temporally offset or sub-optimal observations, which hindered the capacity of the model to accurately reconstruct fine-scale phenological trajectories (Cingano et al., 2025). As a result, the distinctive spectral contrast of coastal vegetation was partially compromised by increased atmospheric noise and reduced observation frequency.
The CCAV-10m dataset possesses inherent limitations during climatically anomalous years, where the “observable area” may deviate from the “actual distribution” due to environmental noise. Future iterations of the CCAV-10m framework will prioritize the integration of SAR-derived inundation masks and multi-source high-frequency data fusion to effectively decouple ecological evolutionary signals from short-term environmental noise within complex coastal ecotones.
The Sentinel-1 synthetic aperture radar (SAR) and Sentinel-2 multispectral data used in this study are available from the Copernicus Data Space Ecosystem (https://dataspace.copernicus.eu, last access: 21 April 2026) under the Copernicus open data policy. The species-level coastal wetland vegetation dataset, CCAV-10m, produced in this study is publicly available at the Science Data Bank (https://doi.org/10.57760/sciencedb.31077, Li et al., 2025). To ensure long-term spatiotemporal monitoring, we are committed to updating this dataset annually; these updates will be released as distinct versions corresponding to different year intervals (e.g. 2024, 2025, and beyond) and will be accompanied by updated technical documentation on the same platform. Validation samples comprising 84 % of the total dataset are provided in the file “Vegetation samples.xlsx” within the same repository; these samples cover all vegetation classes and major coastal regions and were derived from field surveys, visual interpretation, and public reference sources. The remaining 16 % of the field sampling data are not publicly released but can be obtained upon a reasonable scientific request to the authors.
This study developed a phenology-guided coastal wetland vegetation classification network integrating Sentinel-1/2 (P_SVCN) and generated the CCAV-10m dataset, which maps the wetland vegetation types in eastern coastal China from 2016 to 2023. By integrating multi-source Sentinel-1 SAR and Sentinel-2 MSI data, the P_SVCN fully exploits structural and phenological features, enabling accurate discrimination of spectrally similar and spatially fragmented vegetation types. The results are summarized as follows:
-
A long-term, high-resolution species-level vegetation dataset (CCAV-10m). The dataset provides annual species-level maps of coastal wetland vegetation at a spatial resolution of 10 m, distinguishing six dominant plant types. Spatiotemporal analysis shows that Suaeda spp. is the predominant vegetation type, followed by S. alterniflora, whose coverage nearly matches the combined extent of P. australis, mangroves, S. mariqueter, and T. chinensis. Further temporal assessments reveal pronounced community succession in recent years, including the continued expansion of S. alterniflora and Suaeda spp., fluctuating patterns in P. australis, and a steady increase in mangrove extent. Transition matrices indicate that conversions among S. alterniflora, Suaeda spp., and P. australis occurs most frequently, reflecting the dynamic responses of coastal wetland ecosystems to natural processes and human activities.
-
A novel phenology-guided deep-learning framework (P_SVCN). The P_SVCN model exhibits strong classification performance, achieving an overall accuracy of 0.916 and a Kappa coefficient of 0.898 based on validation with 4668 in situ samples. These results exceed those of the baseline SVCN model (overall accuracy 0.874, Kappa 0.845). Ablation experiments further demonstrate the complementary strengths of Sentinel-1 synthetic aperture radar and Sentinel-2 optical observations, particularly in distinguishing vegetation types with highly similar spectral properties or fragmented spatial patterns.
CCAV-10m effectively bridges the gap between coarse-resolution ecosystem maps and single-species products by balancing species-level classification accuracy and large-scale spatial coverage. The dataset provides high-precision spatiotemporal information for monitoring vegetation succession, assessing invasive species, estimating blue carbon stocks, and supporting ecological restoration planning. Moreover, it offers a robust foundation for sustainable coastal ecosystem management under global environmental change. The CCAV-10m dataset is publicly available at https://doi.org/10.57760/sciencedb.31077, supporting reproducibility and further applications in related research.
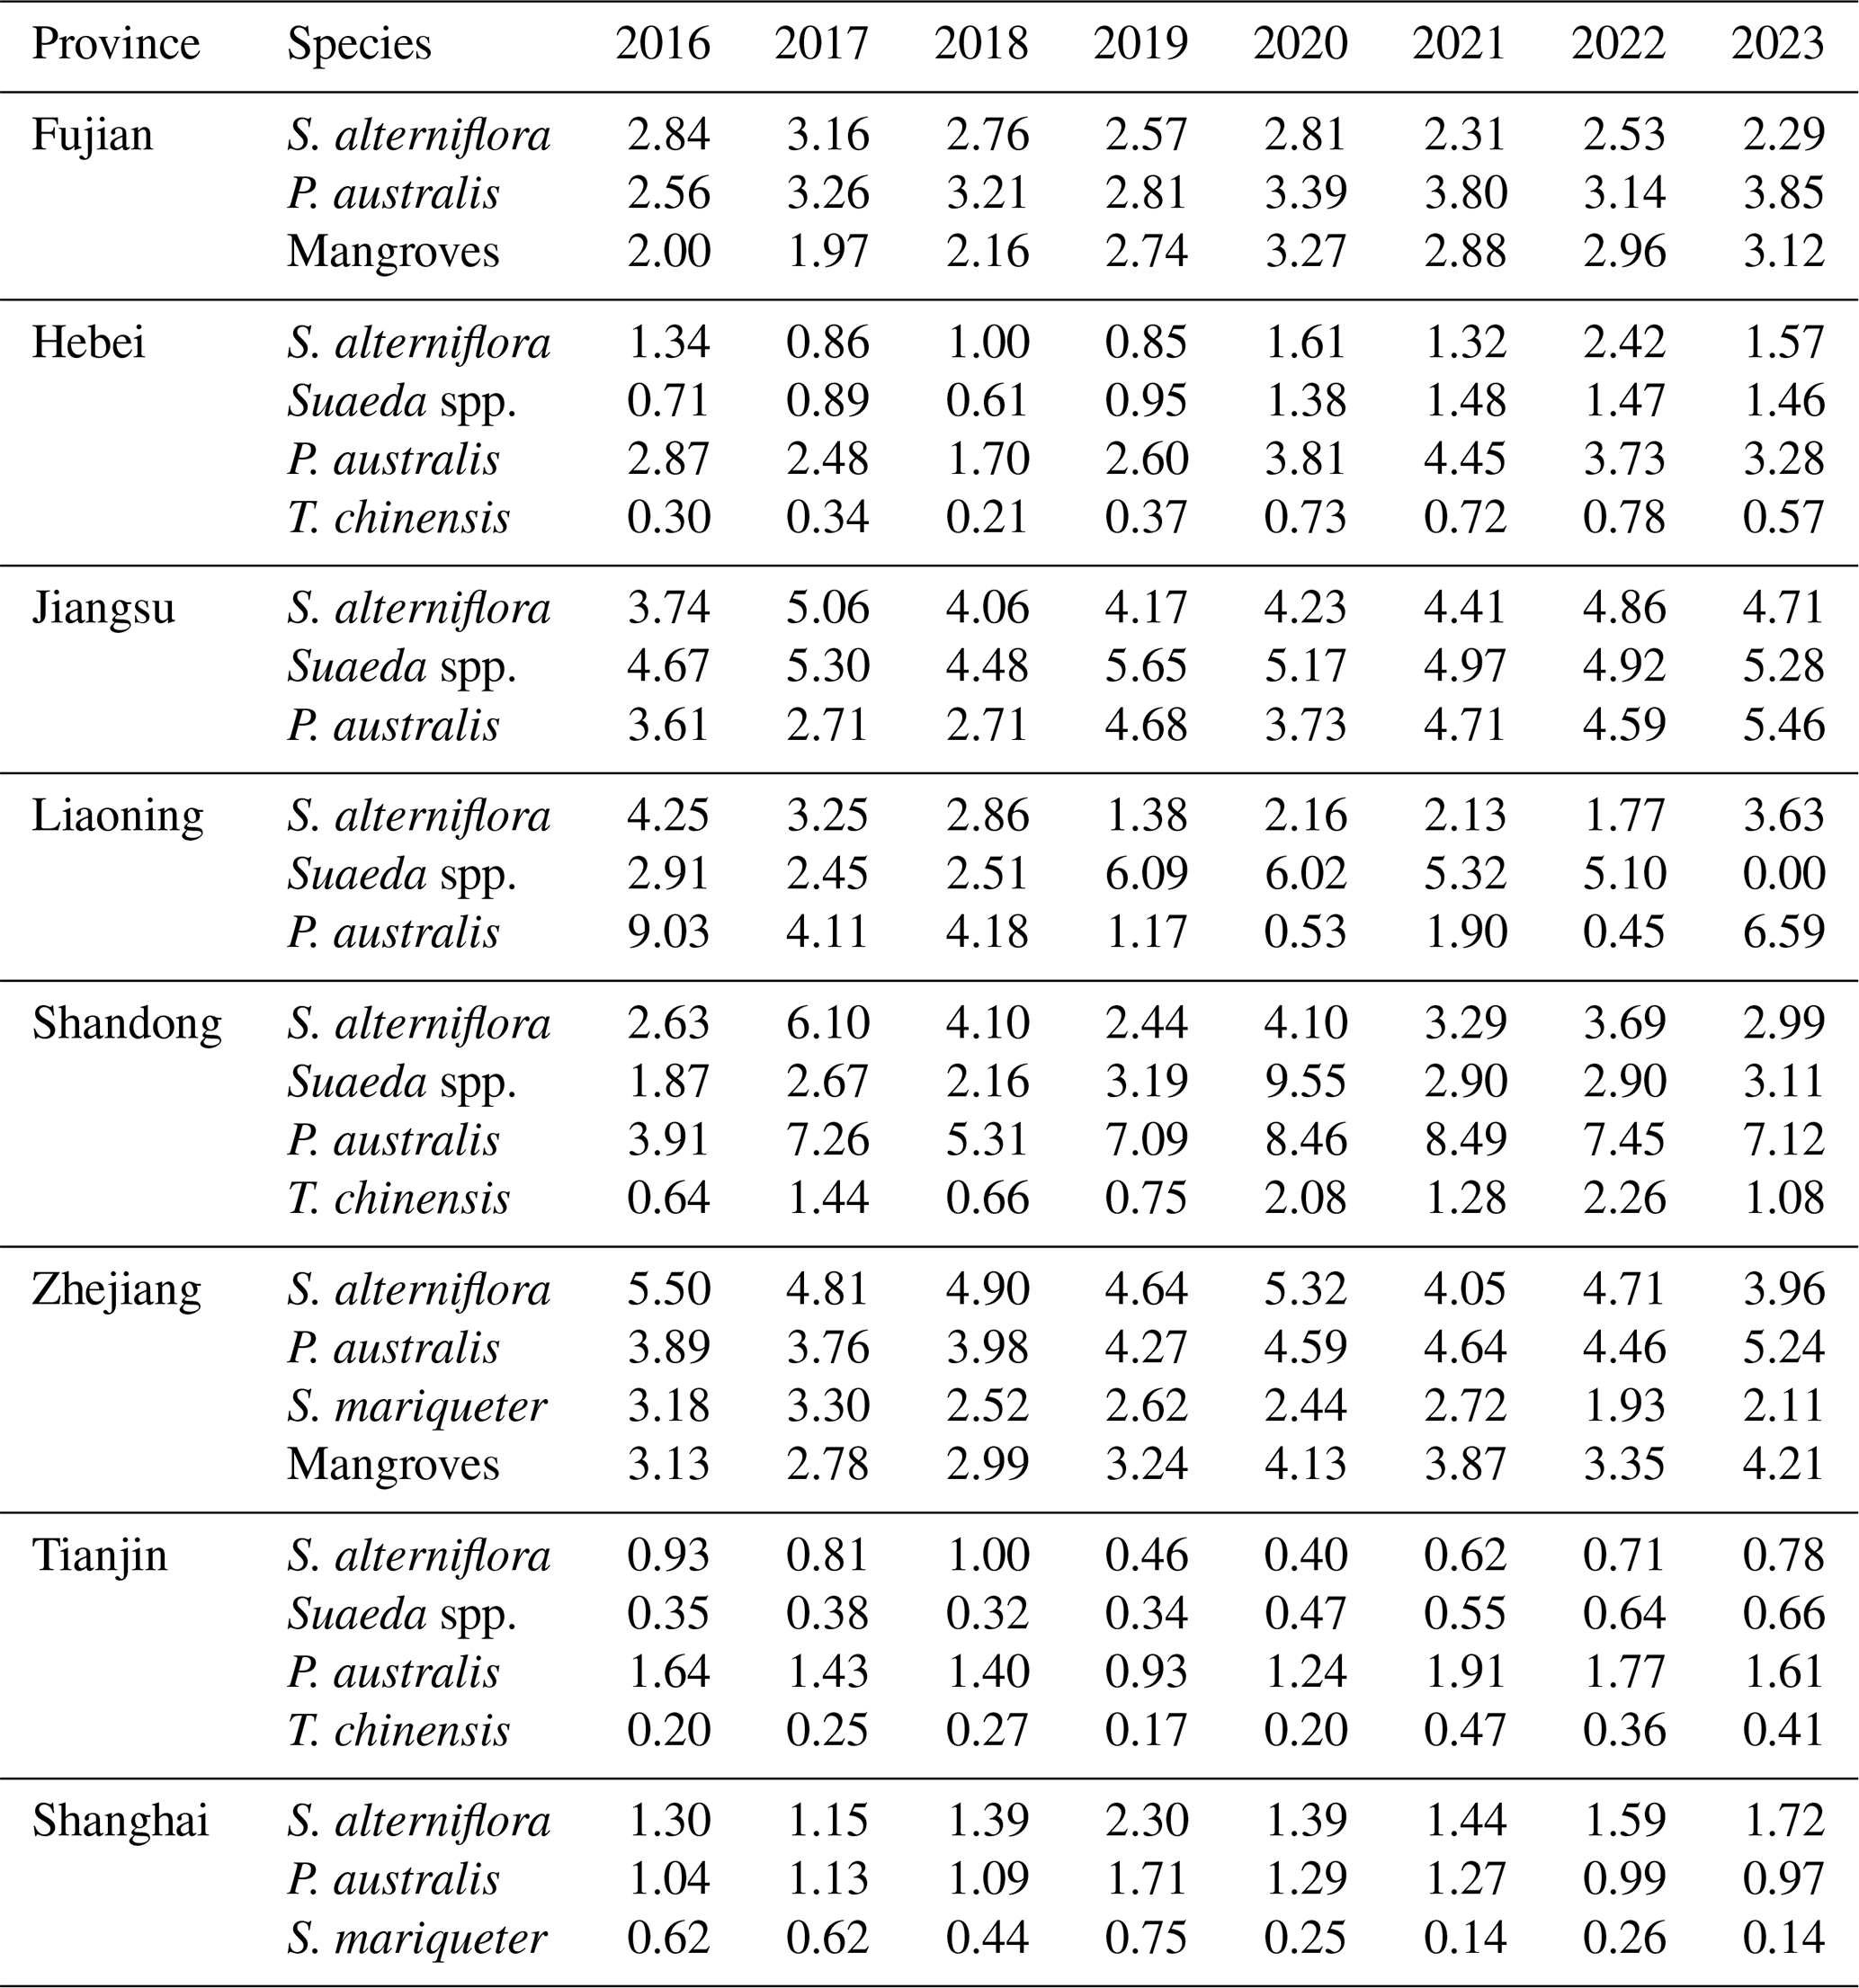
To complement Fig. 7, this Appendix provides the precise numerical datasets for provincial coastal vegetation coverage. The following table organizes the annual areas (104 ha) by province and species, covering the entire study duration from 2016 to 2023.
Table A1Annual area values (104 ha) of coastal vegetation by province and species (2016–2023).
B1 Validation of Interpretation Reliability via Field-Truth Benchmarking
To ensure the high quality and representativeness of the training data, we implemented a rigorous validation process for our visual interpretation criteria. All interpretation was performed using high-resolution Google Earth imagery, which provides the sub-meter level detail necessary to distinguish coastal wetland vegetation.
To quantify the reliability of our interpretation criteria, we conducted a consistency verification specifically at the locations of the field-surveyed sites. In this process, interpreters were required to perform a blind identification of the vegetation types by examining the high-resolution Google Earth imagery corresponding to each field-surveyed coordinate. By cross-referencing these image-based interpretation results with the actual ground-truth observations, we calculated the Kappa coefficient (κ) using Eq. (10).
Our verification yielded a Kappa value of 0.95, confirming that the classification features observed on Google Earth imagery highly match the actual vegetation types on the ground.
B2 Inter-Interpreter Cross-Validation
To further mitigate subjective bias, a double-blind review process was implemented. Each sample point was independently reviewed by at least two experienced researchers. Only samples where both researchers reached a 100 % consensus were retained in the final dataset. This rigorous cross-verification ensured the internal consistency and reliability of the sample pool.
Following the quality control and cross-verification processes, the field-surveyed data and the validated interpreted samples were integrated into a unified high-confidence dataset. To further refine the sample pool, we excluded points located in mixed pixels or transition zones to prevent spectral contamination. Finally, this refined dataset was randomly partitioned into a training set (70 %) and a validation set (30 %). This partitioning strategy ensures that the model is trained on reliable data while maintaining an independent set for unbiased accuracy assessment.
To ensure the transparency and reliability of the CCAV-10m dataset, we provide a visual summary of the spatial distribution of the samples used for model training and validation. A total of 15 558 samples were collected through a combination of field surveys and high-resolution manual interpretation of Google Earth.
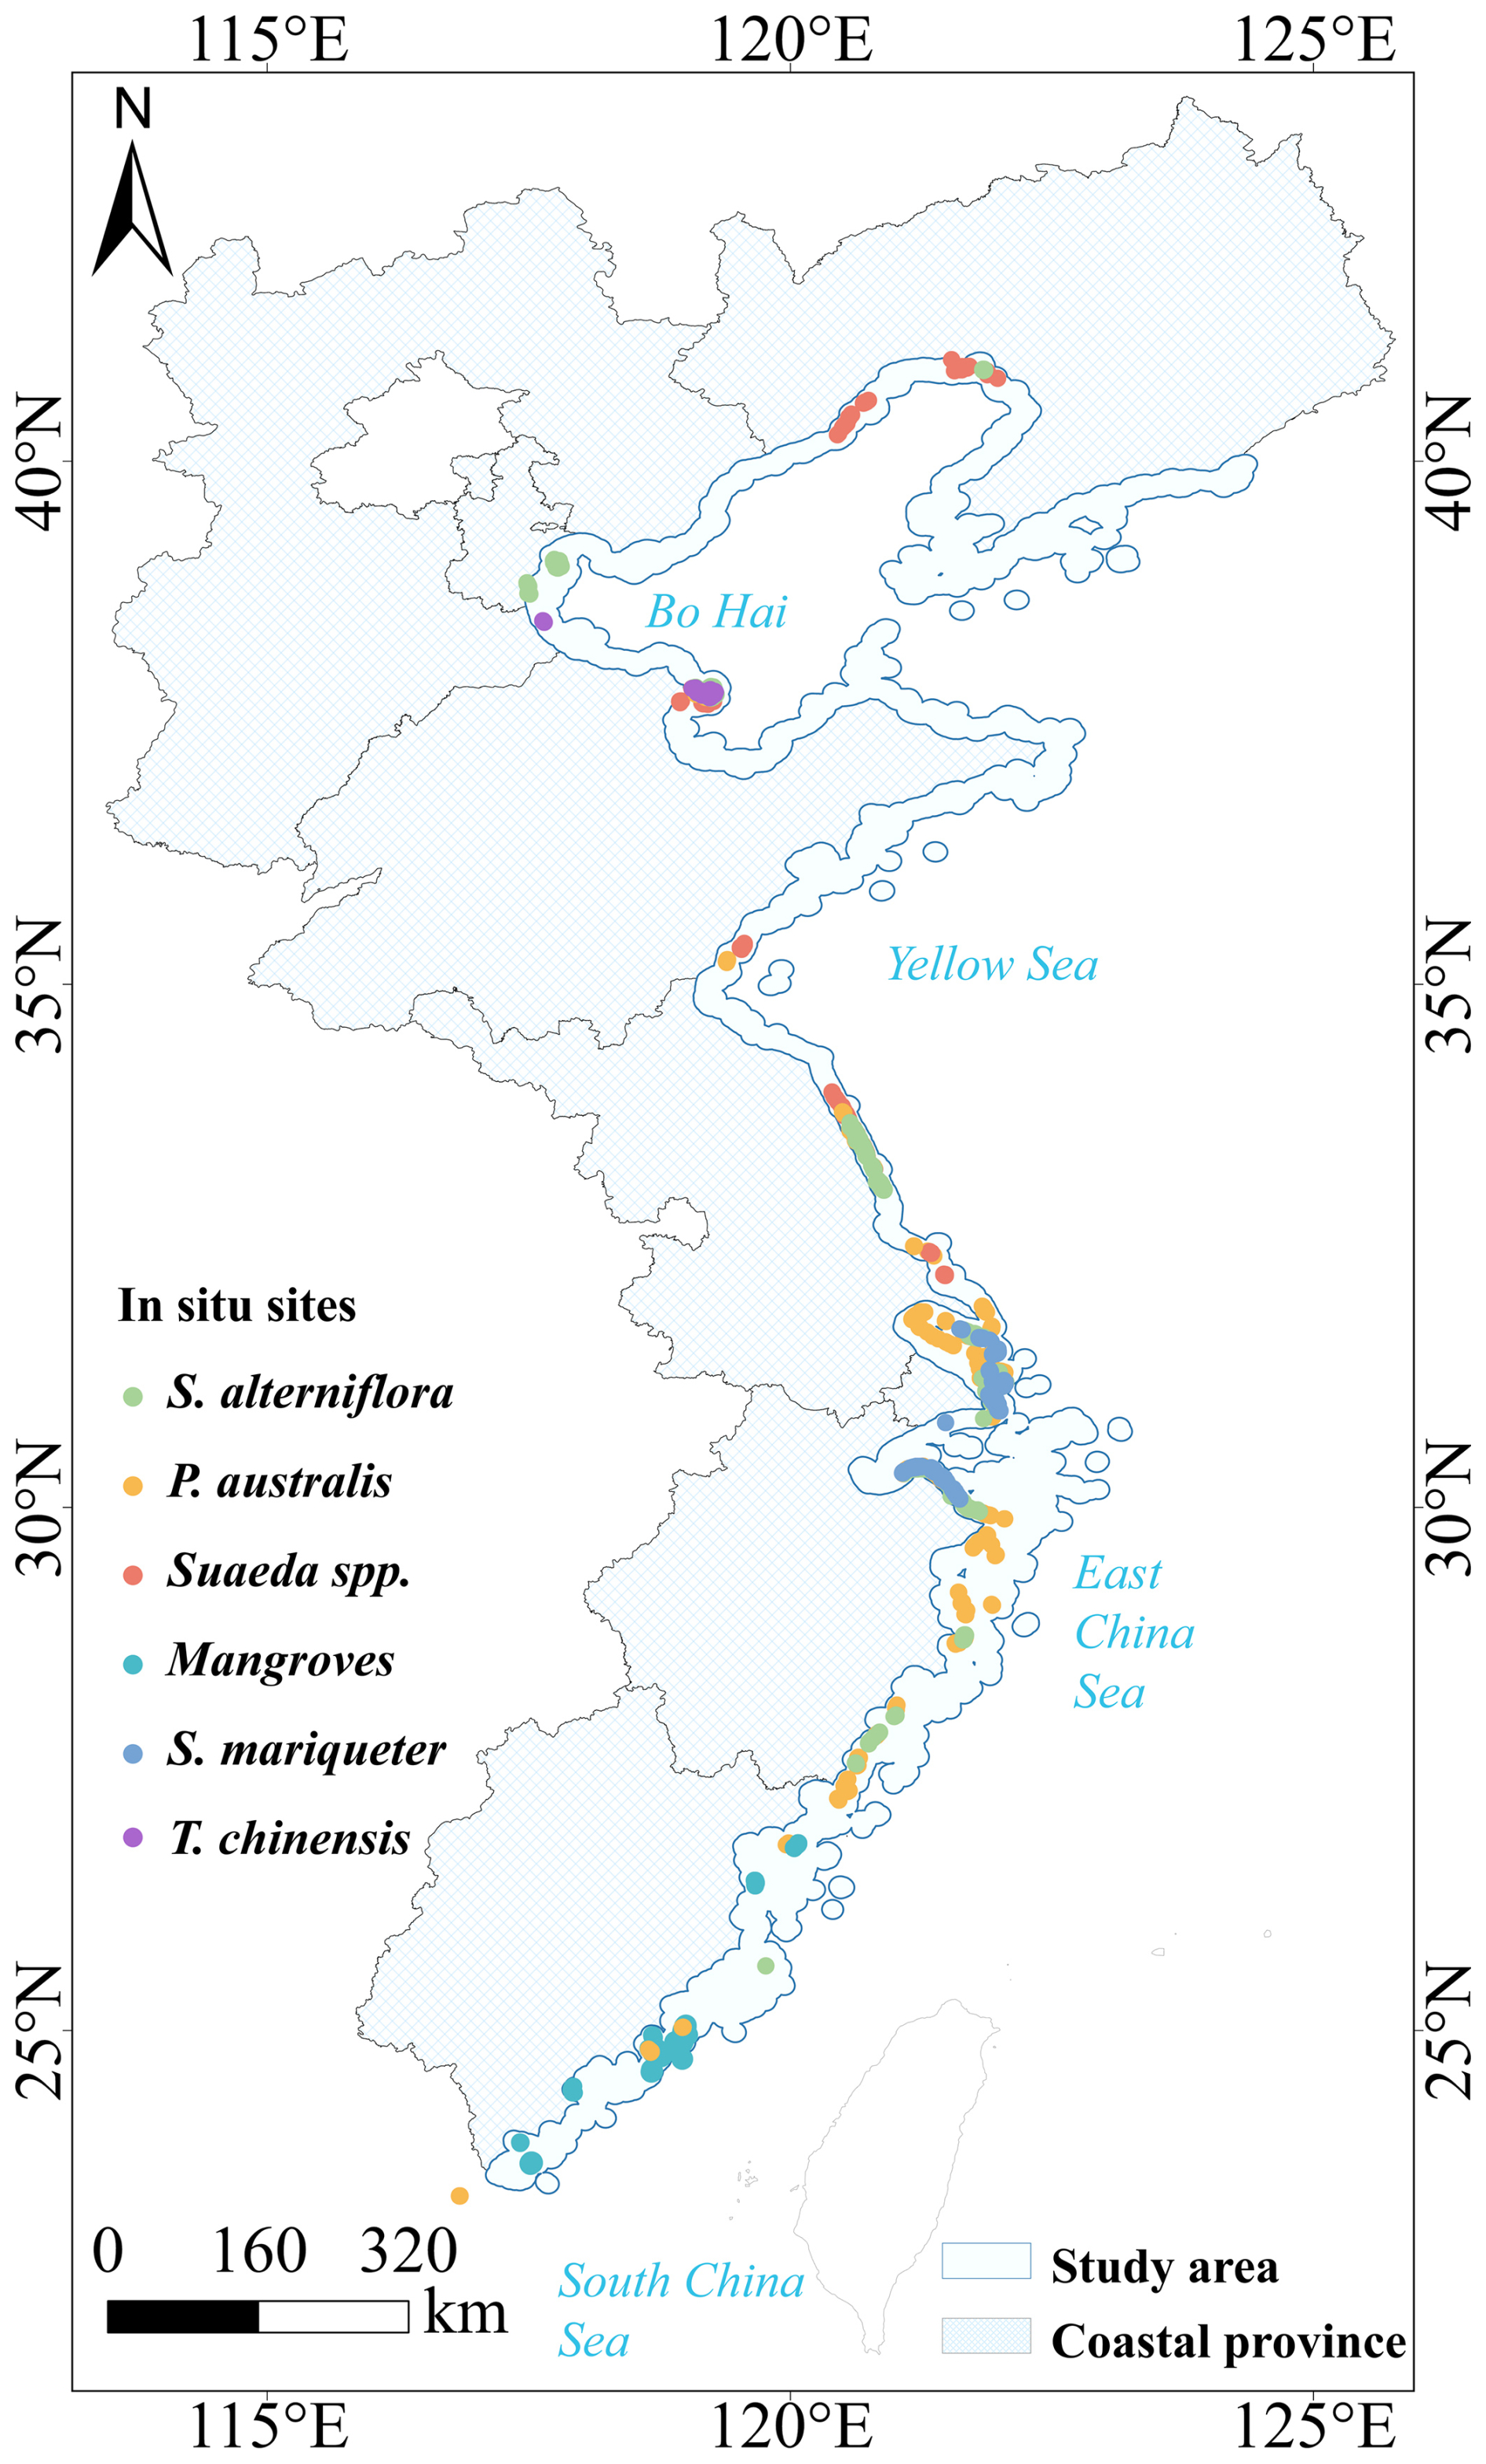
Figure C1 Spatial distribution of samples.
LYY designed the research. LYY and LT performed the experiments and code. LYY wrote the manuscript. LT, SZJ, YS, and ZZL processed the data analysis. LM and YLN provided the resources. LM and YLN supervised and reviewed the manuscript.
The contact author has declared that none of the authors has any competing interests.
Publisher's note: Copernicus Publications remains neutral with regard to jurisdictional claims made in the text, published maps, institutional affiliations, or any other geographical representation in this paper. The authors bear the ultimate responsibility for providing appropriate place names. Views expressed in the text are those of the authors and do not necessarily reflect the views of the publisher.
We thank the European Space Agency (ESA) for providing the Sentinel-1 (SAR) and Sentinel-2 (Multispectral) data. We thank Prof. Bo Tian from the State Key Laboratory of Estuarine and Coastal Research, East China Normal University, for providing in situ data. Finally, we thank all reviewers, editors, and others who helped with this paper.
This research has been supported by the National Natural Science Foundation of China (grant nos. W2412140 and 42230505), the Open Fund of Key Laboratory of Geographic Information Science (Ministry of Education), East China Normal University (grant no. KLGIS2025A01), and the International Research Center of Big Data for Sustainable Development Goals (grant no. CBAS2022GSP07).
This paper was edited by Zihao Bian and reviewed by Naiqing Pan and one anonymous referee.
Aburto-Oropeza, O., Ezcurra, E., Danemann, G., Valdez, V., Murray, J., and Sala, E.: Mangroves in the Gulf of California increase fishery yields, P. Natl. Acad. Sci. USA, 105, 10456–10459, https://doi.org/10.1073/pnas.0804601105, 2008. a
Almond, D., Chen, Y., Greenstone, M., and Li, H.: Winter heating or clean air? Unintended impacts of China's Huai river policy, Am. Econ. Rev., 99, 184–190, https://doi.org/10.1257/aer.99.2.184, 2009. a
Bao, Y., Lin, X., Jia, M., Xiao, Z., Wang, C., Liao, J., and Zhang, Y.: Convergence in key month of phenology-based mangrove species classification using sentinel-2 imagery data: insights from structural and physiological indices, Int. J. Digit. Earth, 18, 2528651, https://doi.org/10.1080/17538947.2025.2528651, 2025. a
Bernhardt, E.: Coastal freshwater wetlands squeezed between migrating salt marshes and working lands, Science Advances, 8, eadd1628, https://doi.org/10.1126/sciadv.add1628, 2022. a
Bertram, C., Quaas, M., Reusch, T. B., Vafeidis, A. T., Wolff, C., and Rickels, W.: The blue carbon wealth of nations, Nat. Clim. Change, 11, 704–709, https://doi.org/10.1038/s41558-021-01089-4, 2021. a
Cao, W. and Wong, M. H.: Current status of coastal zone issues and management in China: a review, Environ. Int., 33, 985–992, https://doi.org/10.1016/j.envint.2007.04.009, 2007. a
Chen, C., Chen, Y., Liu, Z., Xue, Z., Yang, G., and Sun, W.: PCSAI: a phenological characteristics-based Spartina alterniflora index derived from a time-series of remote sensing images, Big Earth Data, 9, 1–29, https://doi.org/10.1080/20964471.2025.2554043, 2025. a, b
Chen, G., Jin, R., Ye, Z., Li, Q., Gu, J., Luo, M., Luo, Y., Christakos, G., Morris, J., He, J., Chen, Z., and Qin, Q.: Spatiotemporal mapping of salt marshes in the intertidal zone of China during 1985–2019, J. Remote Sens., 2022, 9793626, https://doi.org/10.34133/2022/9793626, 2022. a
Chen, Y., Ebenstein, A., Greenstone, M., and Li, H.: Evidence on the impact of sustained exposure to air pollution on life expectancy from China's Huai River policy, P. Natl. Acad. Sci. USA, 110, 12936–12941, https://doi.org/10.1073/pnas.1300018110, 2013. a
Cingano, P., Moro, D., Pellegrini, E., Asquini, E., Contin, M., Trotta, G., Vuerich, M., Trevisan, F., Scagnetto, I., Casarsa, L., Marmiroli, M., and Brancaleoni, L.: Integrating remote sensing and functional traits to elucidate estuarine common reed beds decline driven by soil salinity and anoxia, Ecol. Indic., 180, 114294, https://doi.org/10.1016/j.ecolind.2025.114294, 2025. a, b
Costanza, R., De Groot, R., Sutton, P., Van der Ploeg, S., Anderson, S. J., Kubiszewski, I., Farber, S., and Turner, R. K.: Changes in the global value of ecosystem services, Global Environ. Chang., 26, 152–158, https://doi.org/10.1016/j.gloenvcha.2014.04.002, 2014. a
Day, J. W., Anthony, E., Costanza, R., Edmonds, D. A., Gunn, J., Hopkinson, C. S., Mann, M. E., Morris, J. T., Osland, M. J., Quirk, T., Rybczyk, J. M., Steyer, G. D., Syvitski, J. P., Twilley, R. R., and Kemp, G. P.: Coastal wetlands in the Anthropocene, Annu. Rev. Env. Resour., 49, 105–135, https://doi.org/10.1146/annurev-environ-121922-041109, 2024. a
Duarte, C. M., Losada, I. J., Hendriks, I. E., Mazarrasa, I., and Marbà, N.: The role of coastal plant communities for climate change mitigation and adaptation, Nat. Clim. Change, 3, 961–968, https://doi.org/10.1038/nclimate1970, 2013. a
Feng, K., Mao, D., Qiu, Z., Zhao, Y., and Wang, Z.: Can time-series Sentinel images be used to properly identify wetland plant communities?, GISci. Remote Sens., 59, 2202–2216, https://doi.org/10.1080/15481603.2022.2156064, 2022. a
Ferro, A., Brunner, D., Bruzzone, L., and Lemoine, G.: On the relationship between double bounce and the orientation of buildings in VHR SAR images, IEEE Geosci. Remote S., 8, 612–616, https://doi.org/10.1109/LGRS.2010.2097580, 2011. a
Fu, B., Yuan, B., Yao, H., Sun, W., Jia, M., Yao, Z., and Wang, Y.: Spatio-temporal dynamics of invasive Spartina alterniflora and its functional traits' responding to hydro-meteorology, Earths Future, 13, e2024EF005421, https://doi.org/10.1029/2024EF005421, 2025. a, b
Gabler, C. A., Osland, M. J., Grace, J. B., Stagg, C. L., Day, R. H., Hartley, S. B., Enwright, N. M., From, A. S., McCoy, M. L., and McLeod, J. L.: Macroclimatic change expected to transform coastal wetland ecosystems this century, Nat. Clim. Change, 7, 142–147, https://doi.org/10.1038/nclimate3203, 2017. a
Gallo, K., Ji, L., Reed, B., Eidenshink, J., and Dwyer, J.: Multi-platform comparisons of MODIS and AVHRR normalized difference vegetation index data, Remote Sens. Environ., 99, 221–231, https://doi.org/10.1016/j.rse.2005.08.014, 2005. a
Gao, M., Wang, X., Hui, C., Yi, H., Zhang, C., Wu, X., Bi, X., Wang, Y., Xiao, L., and Wang, D.: Assembly of plant communities in coastal wetlands – the role of saltcedar Tamarix chinensis during early succession, J. Plant Ecol., 8, 539–548, https://doi.org/10.1093/jpe/rtu037, 2015. a
Gao, Y., Hu, Z., Wang, Z., Shi, Q., Chen, D., Wu, S., Gao, Y., and Zhang, Y.: Phenology metrics for vegetation type classification in estuarine wetlands using satellite imagery, Sustainability, 15, 1373, https://doi.org/10.3390/su15021373, 2023. a, b
Gu, J., Jin, R., Chen, G., Ye, Z., Li, Q., Wang, H., Li, D., Christakos, G., Agusti, S., Duarte, C. M., and Qin, Q.: Areal extent, species composition, and spatial distribution of coastal saltmarshes in China, IEEE J. Sel. Top. Appl., 14, 7085–7094, https://doi.org/10.1109/JSTARS.2021.3093673, 2021. a, b, c
Gu, J., Wu, J., and Xie, D.: Coastal salt marsh changes in China: Landscape pattern, driving factors, and carbon dynamics, Geography and Sustainability, 100281, https://doi.org/10.1016/j.geosus.2025.100281, 2025. a, b
Hu, Y., Tian, B., Yuan, L., Li, X., Huang, Y., Shi, R., Jiang, X., Sun, C., and Pan, L.: Mapping coastal salt marshes in China using time series of Sentinel-1 SAR, ISPRS J. Photogramm., 173, 122–134, https://doi.org/10.1016/j.isprsjprs.2021.01.003, 2021. a
Jiao, L., Zhang, Y., Sun, T., Yang, W., Shao, D., Zhang, P., and Liu, Q.: Spatial analysis as a tool for plant population conservation: a case study of Tamarix chinensis in the Yellow River Delta, China, Sustainability, 13, 8291, https://doi.org/10.3390/su13158291, 2021. a
Kang, B., Chen, X., Du, Z., Meng, W., and Li, H.: Species-based mapping of carbon stocks in salt marsh: Tianjin coastal zone as a case study, Ecosystem Health and Sustainability, 9, 0052, https://doi.org/10.34133/ehs.0052, 2023. a
Kearney, M. S., Stutzer, D., Turpie, K., and Stevenson, J. C.: The effects of tidal inundation on the reflectance characteristics of coastal marsh vegetation, J. Coast. Res., 25, 1177–1186, 2009. a
Kingma, D. P. and Ba, J.: Adam: A method for stochastic optimization, 3rd International Conference on Learning Representations (ICLR), San Diego, CA, USA, 7–9 May 2015, arXiv [preprint], https://doi.org/10.48550/arXiv.1412.6980, 2015. a
Kumar, L. and Sinha, P.: Mapping salt-marsh land-cover vegetation using high-spatial and hyperspectral satellite data to assist wetland inventory, GISci. Remote Sens., 51, 483–497, https://doi.org/10.1080/15481603.2014.947838, 2014. a
Li, H., Wang, C., Cui, Y., and Hodgson, M.: Mapping salt marsh along coastal South Carolina using U-Net, ISPRS J. Photogramm., 179, 121–132, https://doi.org/10.1016/j.isprsjprs.2021.07.011, 2021a. a
Li, H., Zhang, C., Zhang, S., Ding, X., and Atkinson, P. M.: Iterative Deep Learning (IDL) for agricultural landscape classification using fine spatial resolution remotely sensed imagery, Int. J. Appl. Earth Obs., 102, 102437, https://doi.org/10.1016/j.jag.2021.102437, 2021b. a
Li, X., Tian, J., Li, X., Yu, Y., Ou, Y., Zhu, L., Zhu, X., Zhou, B., and Gong, H.: Annual mapping of Spartina alterniflora with deep learning and spectral-phenological features from 2017 to 2021 in the mainland of China, Int. J. Remote Sens., 45, 3172–3199, https://doi.org/10.1080/01431161.2024.2343136, 2024a. a, b
Li, Y., Yuan, L., Song, Z., Yu, S., Zhang, X., Tian, B., and Liu, M.: Salt marsh carbon stock estimation using deep learning with Sentinel-1 SAR of the Yangtze River estuary, China, Int. J. Appl. Earth Obs., 133, 104138, https://doi.org/10.1016/j.jag.2024.104138, 2024b. a, b, c, d, e
Li, Y., TingLiu, Yuan, L., Song, Z., Yang, S., Zhu, Z., and Liu, M.: CCAV-10m: An Annual Spatiotemporal China Coastal Wetland Vegetation Dataset Integrating Sentinel-1/2 Observations via Deep Learning, Science Data Bank [data set], https://doi.org/10.57760/sciencedb.31077, 2025. a, b, c
Liaoning Provincial Meteorological Service: Main Meteorological Disasters and Early Warning Signals in Liaoning Province, August 2023, Meteorological Bulletin, Liaoning Provincial Meteorological Service, Shenyang, http://ln.cma.gov.cn/xwzx/qxxw/202309/t20230905_5757479.html (last access: 21 April 2026), 2023. a
Luo, J., Wu, X., Gao, Y., Cai, Y., Yang, L., Xiong, Y., Yang, Q., Liu, J., Li, Y., Deng, Z., Gong, Y., and Liang, S.: Spatiotemporal variations and seasonal climatic driving factors of stable vegetation phenology across China over the past two decades, Remote Sens.-Basel, 17, 3467, https://doi.org/10.3390/rs17203467, 2025. a
Luther, D. A. and Greenberg, R.: Mangroves: a global perspective on the evolution and conservation of their terrestrial vertebrates, BioScience, 59, 602–612, https://doi.org/10.1525/bio.2009.59.7.11, 2009. a
Macreadie, P. I., Anton, A., Raven, J. A., Beaumont, N., Connolly, R. M., Friess, D. A., Kelleway, J. J., Kennedy, H., Kuwae, T., Lavery, P. S., Lovelock, C. E., Smale, D. A., Apostolaki, E. T., Atwood, T. B., Baldock, J., Bianchi, T. S., Chmura, G. L., Eyre, B. D., Fourqurean, J. W., Hall-Spencer, J. M., Huxham, M., Hendriks, I. E., Krause-Jensen, D., Laffoley, D., Luisetti, T., Marbà, N., Masqué, P., McGlathery, K. J., Megonigal, J. P., Murdiyarso, D., Russell, B. D., Santos, R., Serrano, O., Silliman, B. R., Watanabe, K., and Duarte, C. M.: The future of Blue Carbon science, Nat. Commun., 10, 3998, https://doi.org/10.1038/s41467-019-11693-w, 2019. a
Mahdianpari, M., Jafarzadeh, H., Granger, J. E., Mohammadimanesh, F., Brisco, B., Salehi, B., Homayouni, S., and Weng, Q.: A large-scale change monitoring of wetlands using time series Landsat imagery on Google Earth Engine: a case study in Newfoundland, GISci. Remote Sens., 57, 1102–1124, https://doi.org/10.1080/15481603.2020.1846948, 2020. a
Mandal, D., Kumar, V., Ratha, D., Dey, S., Bhattacharya, A., Lopez-Sanchez, J. M., McNairn, H., and Rao, Y. S.: Dual polarimetric radar vegetation index for crop growth monitoring using sentinel-1 SAR data, Remote Sens. Environ., 247, 111954, https://doi.org/10.1016/j.rse.2020.111954, 2020. a
Mao, W., Wang, X., Liu, G., Pirasteh, S., Zhang, R., Lin, H., Xie, Y., Xiang, W., Ma, Z., and Ma, P.: Time series InSAR ionospheric delay estimation, correction, and ground deformation monitoring with reformulating range split-spectrum interferometry, IEEE T. Geosci. Remote, 61, 1–18, https://doi.org/10.1109/TGRS.2023.3298919, 2023. a
Min, Y., Ke, Y., Zhuo, Z., Qi, W., Li, J., Li, P., and Zhao, N.: Monitoring Spartina Alterniflora removal dynamics across coastal China using time series Sentinel-1 imagery, Remote Sens. Environ., 326, 114813, https://doi.org/10.1016/j.rse.2025.114813, 2025. a, b
Mleczko, M. and Mróz, M.: Wetland mapping using sar data from the sentinel-1a and tandem-x missions: a comparative study in the biebrza floodplain (Poland), Remote Sens.-Basel, 10, 78, https://doi.org/10.3390/rs10010078, 2018. a, b
Morales-Barquero, L., Lyons, M. B., Phinn, S. R., and Roelfsema, C. M.: Trends in remote sensing accuracy assessment approaches in the context of natural resources, Remote Sens.-Basel, 11, 2305, https://doi.org/10.3390/rs11192305, 2019. a
Moreno-Mateos, D., Power, M. E., Comín, F. A., and Yockteng, R.: Structural and functional loss in restored wetland ecosystems, PLoS Biol., 10, e1001247, https://doi.org/10.1371/journal.pbio.1001247, 2012. a
Murray, N. J., Worthington, T. A., Bunting, P., Duce, S., Hagger, V., Lovelock, C. E., Lucas, R., Saunders, M. I., Sheaves, M., Spalding, M., Villoslada, M., and Waltham, N. J.: High-resolution mapping of losses and gains of Earth's tidal wetlands, Science, 376, 744–749, 2022. a
Nikaein, T., Iannini, L., Molijn, R. A., and Lopez-Dekker, P.: On the value of Sentinel-1 InSAR coherence time-series for vegetation classification, Remote Sens.-Basel, 13, 3300, https://doi.org/10.3390/rs13163300, 2021. a
O'Connell, J. L., Mishra, D. R., Cotten, D. L., Wang, L., and Alber, M.: The Tidal Marsh Inundation Index (TMII): an inundation filter to flag flooded pixels and improve MODIS tidal marsh vegetation time-series analysis, Remote Sens. Environ., 201, 34–46, https://doi.org/10.1016/j.rse.2017.08.008, 2017. a
Potin, P., Rosich, B., Grimont, P., Miranda, N., Shurmer, I., O'Connell, A., Torres, R., and Krassenburg, M.: Sentinel-1 mission status, in: International Geoscience and Remote Sensing Symposium (IGARSS), IEEE, https://doi.org/10.1109/IGARSS.2015.7326401, 2820–2823, 2015. a
Rajngewerc, M., Grimson, R., Bali, L., Minotti, P., and Kandus, P.: Cover classifications in wetlands using Sentinel-1 data (Band C): a case study in the Parana river delta, Argentina, Revista de Teledetección, 29–46, https://doi.org/10.4995/raet.2022.16915, 2022. a
Schuerch, M., Spencer, T., Temmerman, S., Kirwan, M. L., Wolff, C., Lincke, D., McOwen, C. J., Pickering, M. D., Reef, R., Vafeidis, A. T., Hinkel, J., Nicholls, R. J., and Brown, S.: Future response of global coastal wetlands to sea-level rise, Nature, 561, 231–234, https://doi.org/10.1038/s41586-018-0476-5, 2018. a
Simioni, J. P. D., Guasselli, L. A., Nascimento, V. F., Ruiz, L. F. C., and Belloli, T. F.: Integration of multi-sensor analysis and decision tree for evaluation of dual and quad-Pol SAR in L-and C-bands applied for marsh delineation, Environ. Dev. Sustain, 22, 5603–5620, https://doi.org/10.1007/s10668-019-00442-0, 2020. a
Slagter, B., Tsendbazar, N.-E., Vollrath, A., and Reiche, J.: Mapping wetland characteristics using temporally dense Sentinel-1 and Sentinel-2 data: a case study in the St. Lucia wetlands, South Africa, Int. J. Appl. Earth Obs., 86, 102009, https://doi.org/10.1016/j.jag.2019.102009, 2020. a
Song, Z. and Zhong, B.: A lightweight local-global attention network for single image super-resolution, in: Proceedings of the Asian conference on computer vision, https://doi.org/10.1007/978-3-031-26351-4_37, 4395–4410, 2022. a
Sun, B., Zhang, D., and Lai, Z.: Coastal salt marsh vegetation classification using hybrid convolutional neural networks and spectral index time series images, Ecol. Indic., 178, 113996, https://doi.org/10.1016/j.ecolind.2025.113996, 2025. a, b
Sun, C., Li, J., Liu, Y., Liu, Y., and Liu, R.: Plant species classification in salt marshes using phenological parameters derived from Sentinel-2 pixel-differential time-series, Remote Sens. Environ., 256, 112320, https://doi.org/10.1016/j.rse.2021.112320, 2021. a
Sun, C., Li, J., Liu, Y., Zhao, S., Zheng, J., and Zhang, S.: Tracking annual changes in the distribution and composition of saltmarsh vegetation on the Jiangsu coast of China using Landsat time series–based phenological parameters, Remote Sens. Environ., 284, 113370, https://doi.org/10.1016/j.rse.2022.113370, 2023. a, b
Sun, L.: Survey Dataset of Wetland Plants in Coastal Areas of China (2013–2017), Science Data Bank [data set], https://doi.org/10.57760/sciencedb.IGA.00342, 2023. a
Sun, Z., Sun, W., Tong, C., Zeng, C., Yu, X., and Mou, X.: China's coastal wetlands: conservation history, implementation efforts, existing issues and strategies for future improvement, Environ. Int., 79, 25–41, https://doi.org/10.1016/j.envint.2015.02.017, 2015. a, b
Takeuchi, W., Tamura, M., and Yasuoka, Y.: Estimation of methane emission from West Siberian wetland by scaling technique between NOAA AVHRR and SPOT HRV, Remote Sens. Environ., 85, 21–29, https://doi.org/10.1016/S0034-4257(02)00183-9, 2003. a
Tian, J., Wang, L., Yin, D., Li, X., Diao, C., Gong, H., Shi, C., Menenti, M., Ge, Y., Nie, S., Hou, Z., and Wang, S.: Development of spectral-phenological features for deep learning to understand Spartina alterniflora invasion, Remote Sens. Environ., 242, 111745, https://doi.org/10.1016/j.rse.2020.111745, 2020. a
Van Beijma, S., Comber, A., and Lamb, A.: Random forest classification of salt marsh vegetation habitats using quad-polarimetric airborne SAR, elevation and optical RS data, Remote Sens. Environ., 149, 118–129, https://doi.org/10.1016/j.rse.2014.04.010, 2014. a
Veloso, A., Mermoz, S., Bouvet, A., Le Toan, T., Planells, M., Dejoux, J.-F., and Ceschia, E.: Understanding the temporal behavior of crops using Sentinel-1 and Sentinel-2-like data for agricultural applications, Remote Sens. Environ., 199, 415–426, https://doi.org/10.1016/j.rse.2017.07.015, 2017. a, b, c
Vreugdenhil, M., Wagner, W., Bauer-Marschallinger, B., Pfeil, I., Teubner, I., Rüdiger, C., and Strauss, P.: Sensitivity of Sentinel-1 backscatter to vegetation dynamics: an Austrian case study, Remote Sens.-Basel, 10, 1396, https://doi.org/10.3390/rs10091396, 2018. a, b
Wang, X., Xiao, X., Xu, X., Zou, Z., Chen, B., Qin, Y., Zhang, X., Dong, J., Liu, D., Pan, L., and Li, B.: Rebound in China's coastal wetlands following conservation and restoration, Nature Sustainability, 4, 1076–1083, https://doi.org/10.1038/s41893-021-00793-5, 2021. a
Wang, Y., Jin, S., and Dardanelli, G.: Vegetation classification and evaluation of yancheng coastal wetlands based on random forest algorithm from sentinel-2 images, Remote Sens.-Basel, 16, 1124, https://doi.org/10.3390/rs16071124, 2024. a
Webb, E. L., Friess, D. A., Krauss, K. W., Cahoon, D. R., Guntenspergen, G. R., and Phelps, J.: A global standard for monitoring coastal wetland vulnerability to accelerated sea-level rise, Nat. Clim. Change, 3, 458–465, https://doi.org/10.1038/nclimate1756, 2013. a
Wei, S., Zhang, H., Xu, Z., Lin, G., Lin, Y., Liang, X., Ling, J., Wee, A. K. S., Lin, H., Zhou, Y., Sun, B., and He, Z.: Coastal urbanization may indirectly positively impact growth of mangrove forests, Communications Earth and Environment, 5, 608, https://doi.org/10.1038/s43247-024-01776-y, 2024. a
Wu, Y., Dai, L., Wang, Y., Xie, L., Zhao, S., Liu, Y., Zhang, M., and Zhang, Z.: Coexistence mechanisms of Tamarix chinensis and Suaeda salsa in the Yellow River Delta, China, Environ. Sci. Pollut. R., 27, 26172–26181, https://doi.org/10.1007/s11356-020-08883-1, 2020. a
Xu, R., Fan, Y., Fan, B., Feng, G., and Li, R.: Classification and monitoring of salt marsh vegetation in the Yellow River Delta based on multi-source remote sensing data fusion, Sensors, 25, 529, https://doi.org/10.3390/s25020529, 2025. a
Yang, R.-M. and Guo, W.-W.: Using Sentinel-1 imagery for soil salinity prediction under the condition of coastal restoration, IEEE J. Sel. Top. Appl., 12, 1482–1488, https://doi.org/10.1109/JSTARS.2019.2906064, 2019. a
You, S., Loh, P., Li, Z., Qin, H., Pradit, S., Le, T. P. Q., Oeurng, C., Mohamed, C. A. R., Lee, C. W., Lu, X., and Wang, S.: Geochemical behavior of sedimentary phosphorus species in northernmost artificial mangroves in China, Forests, 13, 610, https://doi.org/10.3390/f13040610, 2022. a
Zeng, J., Sun, Y., Cao, P., and Wang, H.: A phenology-based vegetation index classification (PVC) algorithm for coastal salt marshes using Landsat 8 images, Int. J. Appl. Earth Obs., 110, 102776, https://doi.org/10.1016/j.jag.2022.102776, 2022. a, b
Zhang, A., Sun, G., Ma, P., Jia, X., Ren, J., Huang, H., and Zhang, X.: Coastal wetland mapping with Sentinel-2 MSI imagery based on gravitational optimized multilayer perceptron and morphological attribute profiles, Remote Sens.-Basel, 11, 952, https://doi.org/10.3390/rs11080952, 2019. a
Zhang, C., Gong, Z., Qiu, H., Zhang, Y., and Zhou, D.: Mapping typical salt-marsh species in the Yellow River Delta wetland supported by temporal-spatial-spectral multidimensional features, Sci. Total Environ., 783, 147061, https://doi.org/10.1016/j.scitotenv.2021.147061, 2021. a, b, c
Zhang, B., Wdowinski, S., Gann, D., Hong, S.-H., and Sah, J.: Spatiotemporal variations of wetland backscatter: the role of water depth and vegetation characteristics in Sentinel-1 dual-polarization SAR observations, Remote Sens. Environ., 270, 112864, https://doi.org/10.1016/j.rse.2021.112864, 2022a. a, b
Zhang, J., Chen, S., Wu, Z., and Fu, Y. H.: Review of vegetation phenology trends in China in a changing climate, Progress in Physical Geography: Earth and Environment, 46, 829–845, https://doi.org/10.1177/03091333221114737, 2022. a
Zhang, J., Zhang, Y., Cong, N., Tian, L., Zhao, G., Zheng, Z., Gao, J., Zhu, Y., and Zhang, Y.: Coarse spatial resolution remote sensing data with AVHRR and MODIS miss the greening area compared with the Landsat data in Chinese drylands, Front. Plant Sci., 14, 1129665, https://doi.org/10.3389/fpls.2023.1129665, 2023a. a
Zhang, X., Liu, L., Zhao, T., Chen, X., Lin, S., Wang, J., Mi, J., and Liu, W.: GWL_FCS30: a global 30 m wetland map with a fine classification system using multi-sourced and time-series remote sensing imagery in 2020, Earth Syst. Sci. Data, 15, 265–293, https://doi.org/10.5194/essd-15-265-2023, 2023b. a
Zhang, X., Zhao, T., Xu, H., Liu, W., Wang, J., Chen, X., and Liu, L.: GLC_FCS30D: the first global 30 m land-cover dynamics monitoring product with a fine classification system for the period from 1985 to 2022 generated using dense-time-series Landsat imagery and the continuous change-detection method, Earth Syst. Sci. Data, 16, 1353–1381, https://doi.org/10.5194/essd-16-1353-2024, 2024. a
Zhao, C., Jia, M., Wang, Z., Mao, D., and Wang, Y.: Toward a better understanding of coastal salt marsh mapping: a case from China using dual-temporal images, Remote Sens. Environ., 295, 113664, https://doi.org/10.1016/j.rse.2023.113664, 2023. a, b, c, d, e
Zhao, X., Nishina, K., Izumisawa, H., Masutomi, Y., Osako, S., and Yamamoto, S.: Monsoon Asia Rice Calendar (MARC): a gridded rice calendar in monsoon Asia based on Sentinel-1 and Sentinel-2 images, Earth Syst. Sci. Data, 16, 3893–3911, https://doi.org/10.5194/essd-16-3893-2024, 2024. a
Zheng, J., Sun, C., Zhao, S., Hu, M., Zhang, S., and Li, J.: Classification of salt marsh vegetation in the Yangtze River Delta of China using the pixel-level time-series and XGBoost algorithm, Journal of Remote Sensing, 3, 0036, https://doi.org/10.1080/20964471.2025.2554043, 2023. a
Zhou, D., Ni, Y., Yu, X., Lin, K., Du, N., Liu, L., Guo, X., and Guo, W.: Trait-based adaptability of Phragmites australis to the effects of soil water and salinity in the Yellow River Delta, Ecol. Evol., 11, 11352–11361, 2021. a
- Abstract
- Introduction
- Study area
- Data and methods
- Results
- Discussion
- Data availability
- Conclusions
- Appendix A: Statistical data for provincial coastal vegetation areas
- Appendix B: Quality Control Procedures for Vegetation Samples
- Appendix C: Spatial Distribution of Samples
- Author contributions
- Competing interests
- Disclaimer
- Acknowledgements
- Financial support
- Review statement
- References