the Creative Commons Attribution 4.0 License.
the Creative Commons Attribution 4.0 License.
 | 22 Apr 2026
Small uncrewed aircraft based microphysical measurements of polar stratus cloud during the Pallas Cloud Experiment 2022
Jessica Girdwood
David Brus
Konstantinos-Matthaios Doulgeris
Alexander Böhmländer
A dataset of in situ observations of stratus cloud microphysics was created from measurements performed at the Pallas atmosphere-ecosystem super site during the Pallas Cloud Experiment (PaCE) in autumn 2022. The data were collected using a small uncrewed aircraft (SUA) and the low-cost, lightweight Universal Cloud and Aerosol Sounding System (UCASS, Smith et al., 2019). Data from the instrument – platform combination was previously validated in Girdwood et al. (2022b) during a similar field campaign at the same site. These measurements are intended to expand on the previous campaign since they form an extended dataset with the uncertainties already evaluated by previous experimental work. The dataset contains cloud droplet size distribution, number concentration, and mass concentration, in addition to geolocation data, and meteorological variables. The flight pattern of the SUA was planned to provide a quasi-vertical profile. A total of 84 of these profiles across 39 flights were performed during the campaign period. The data from the SUA flights are available from https://doi.org/10.5281/zenodo.14756233 (Girdwood et al., 2022a).
- Article
(3131 KB) - Full-text XML
- BibTeX
- EndNote


Clouds are inadequately represented in earth system models, and thus contribute to large uncertainties in effective radiative forcing (Masson-Delmotte et al., 2021), particularly in the Arctic (Previdi et al., 2021). Vavrus (2004) shows the strong influence of cloud – radiation feedback processes on climate. In a more recent study, Lenaerts et al. (2017) specifically highlights a large uncertainty in the radiative forcing of polar clouds, in addition to a need for more measurements. Additionally, many cloud processes are not sufficiently well understood or characterised to adequately represent in weather models, leading to errors in forecasting precipitation and fog. In-situ cloud microphysical measurements are essential for targeted studies of cloud processes, validation of remote sensing retrievals, and development thereof. There currently exists a lack of effective measurements of clouds, due to the limited capability of conventional platforms; conventional aircraft cannot strafe through a cloud with a high enough spatial resolution, due to manoeuvrability limitations. In addition, cloud in situ instrumentation is often deployed in a prototype stage, and requires significant calibration, characterisation, and validation for appropriate data utilisation in models and cloud research.
Small uncrewed aircraft (SUA) as a measurement platform have the potential to part-fill the measurement gap in in situ cloud microphysics. This is because they are often small and manoeuvrable, meaning they can be piloted through a cloud with high spatial resolution when compared to conventional aircraft. In addition, SUA often carry lower financial risk when compared with conventional aircraft, which increases the accessibility of cloud physics to researchers without access to conventional aircraft.
However, calibration and validation of instrumentation is particularly important when considering SUA cloud in situ instrumentation, since such instruments are usually lightweight and low cost. Platform-instrument synergy is of paramount importance when considering SUA measurements due to the wide array of platforms, and the complex aerodynamics surrounding airframes. Recent efforts have been made to validate the Universal Cloud and Aerosol Sounding System (UCASS, Smith et al., 2019) with the Talon SUA from the Finnish Meteorological institute (FMI-Talon). The UCASS is an optical particle spectrometer (OPS), which measures the scattering cross section of cloud particles. This can be translated into a physical radius via the means of a scattering model based retrieval. The UCASS has been previously used as part of a balloon based sounding system (Smith et al., 2019; Kezoudi et al., 2021b; Jost et al., 2025), has also been adapted for use on SUA (Girdwood et al., 2020; Kezoudi et al., 2021a; Girdwood et al., 2022b), and has been used in ground based applications (Meyer et al., 2026). The working principles of the UCASS is described in more detail in Sect. 2. Girdwood et al. (2022b) conducted experiments to compare cloud in situ measurements from the FMI-Talon – UCASS combination with a reference instrument mounted on a hilltop, in addition to computation fluid dynamics with Lagrangian particle tracking (CFD-LPT) to influence the design of the system.
The Pallas Cloud Experiments (PaCE) are a series of field campaigns designed for the validation of in situ cloud observational apparatus, the evaluation of remote sensing retrieval algorithms, and targeted studies of polar stratus cloud. The Pallas atmosphere-ecosystem super site provides an ideal location for the use of SUA cloud instrumentation, because there is protected airspace up to 2 km above ground level, and a reliable presence of stratus cloud in the autumn – the chosen campaign period. The work conducted by this author team in previous campaign periods (Girdwood et al., 2022b) had the aim of validating the SUA based cloud measurements and defining the associated errors. The purpose of this work is to provide a cloud microphysics dataset to compliment the other cloud data gathered during the PaCE 2022 campaign, the results for which can be found in Bagheri et al. (2025) and associated works.
In this paper, we use the system presented in Girdwood et al. (2022b) to measure the microphysics of arctic liquid droplet stratus cloud. We implement automated data quality assurance (QA), and add derived products such as number concentration and effective diameter to the dataset, which is available from Girdwood et al. (2022a). The data presented in this paper were gathered with two main use cases in mind: the validation of a Cloudnet (Hogan and O’Connor, 2004) cloud observation site, and the experimental evaluation of warm cloud precipitation models for example Zeng (2018). Both of these use cases require vertical profiles of droplet concentration and size distribution through the cloud, and both benefit from the high spatio-temporal resolution which is provided by the use of a SUA platform.
The UCASS was attached to the FMI-Talon using the same mounting points as described in Girdwood et al. (2022b). This was in order to ensure that the characterisation of the platform was still valid in this situation. Positional data pertaining to the SUA were obtained from a Global Navigation Satellite System (GNSS), which was also used for flight automation. An inertial measurement unit (IMU) was also included in the flight controller of the SUA, which was used to obtain the airframe orientation data necessary for quality assurance. A pitot tube (Holybro, 2025) was used to obtain airspeed data, which were necessary to calculate particle concentrations from the UCASS, in addition to data quality assurance. An annotated image of the FMI-Talon is shown in Fig. 1.
The detailed schematics and working principles of the UCASS can be found in Smith et al. (2019) and Girdwood (2023), however this can be briefly summarised as: 650 nm light was scattered off of a cloud droplet, which was then collected by an ellipsoidal mirror and reflected onto a photodiode, whereupon the magnitude of the scattered light is measured and recorded. The photodiode of the UCASS has two elements which are annular. This configuration is used to define an area of the laser beam where a particle is considered to be valid. This enables concentration measurements, since it allows the volume of air which has passed through the UCASS to be calculated. If less than 50 % of the total scattered light on the photodiode is sensed by the inner element, a particle is considered to be rejected.
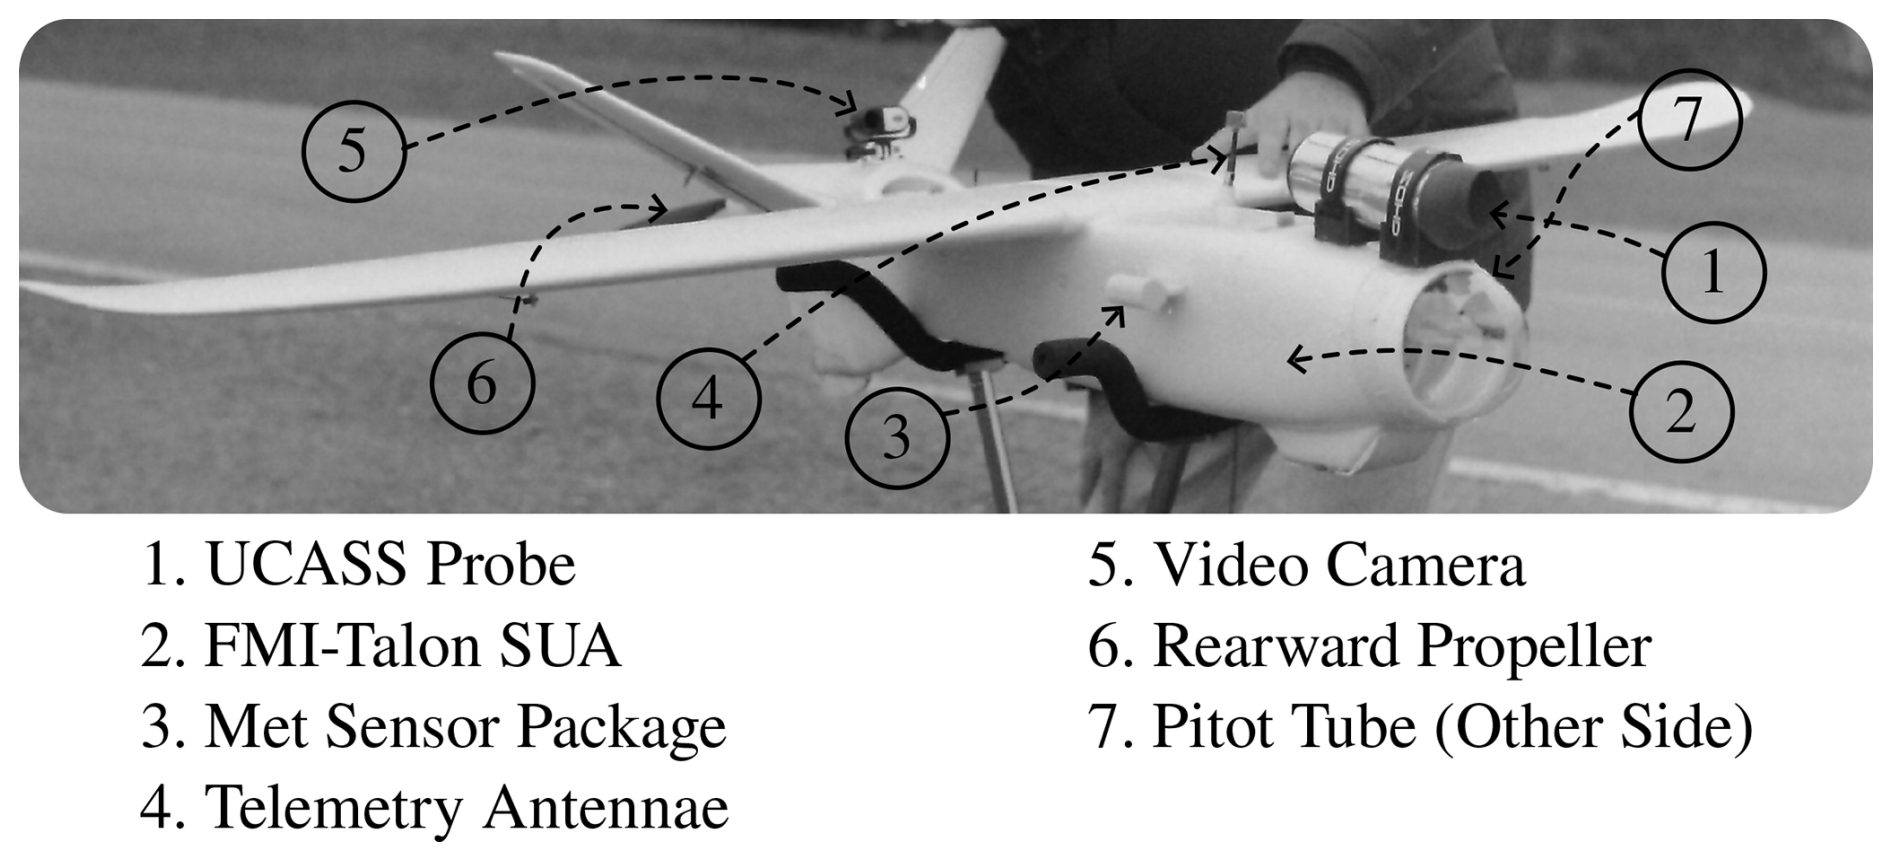
Figure 1A picture of the FMI-Talon SUA in the configuration which was used for the campaign. The various components of the instrument platform are marked.
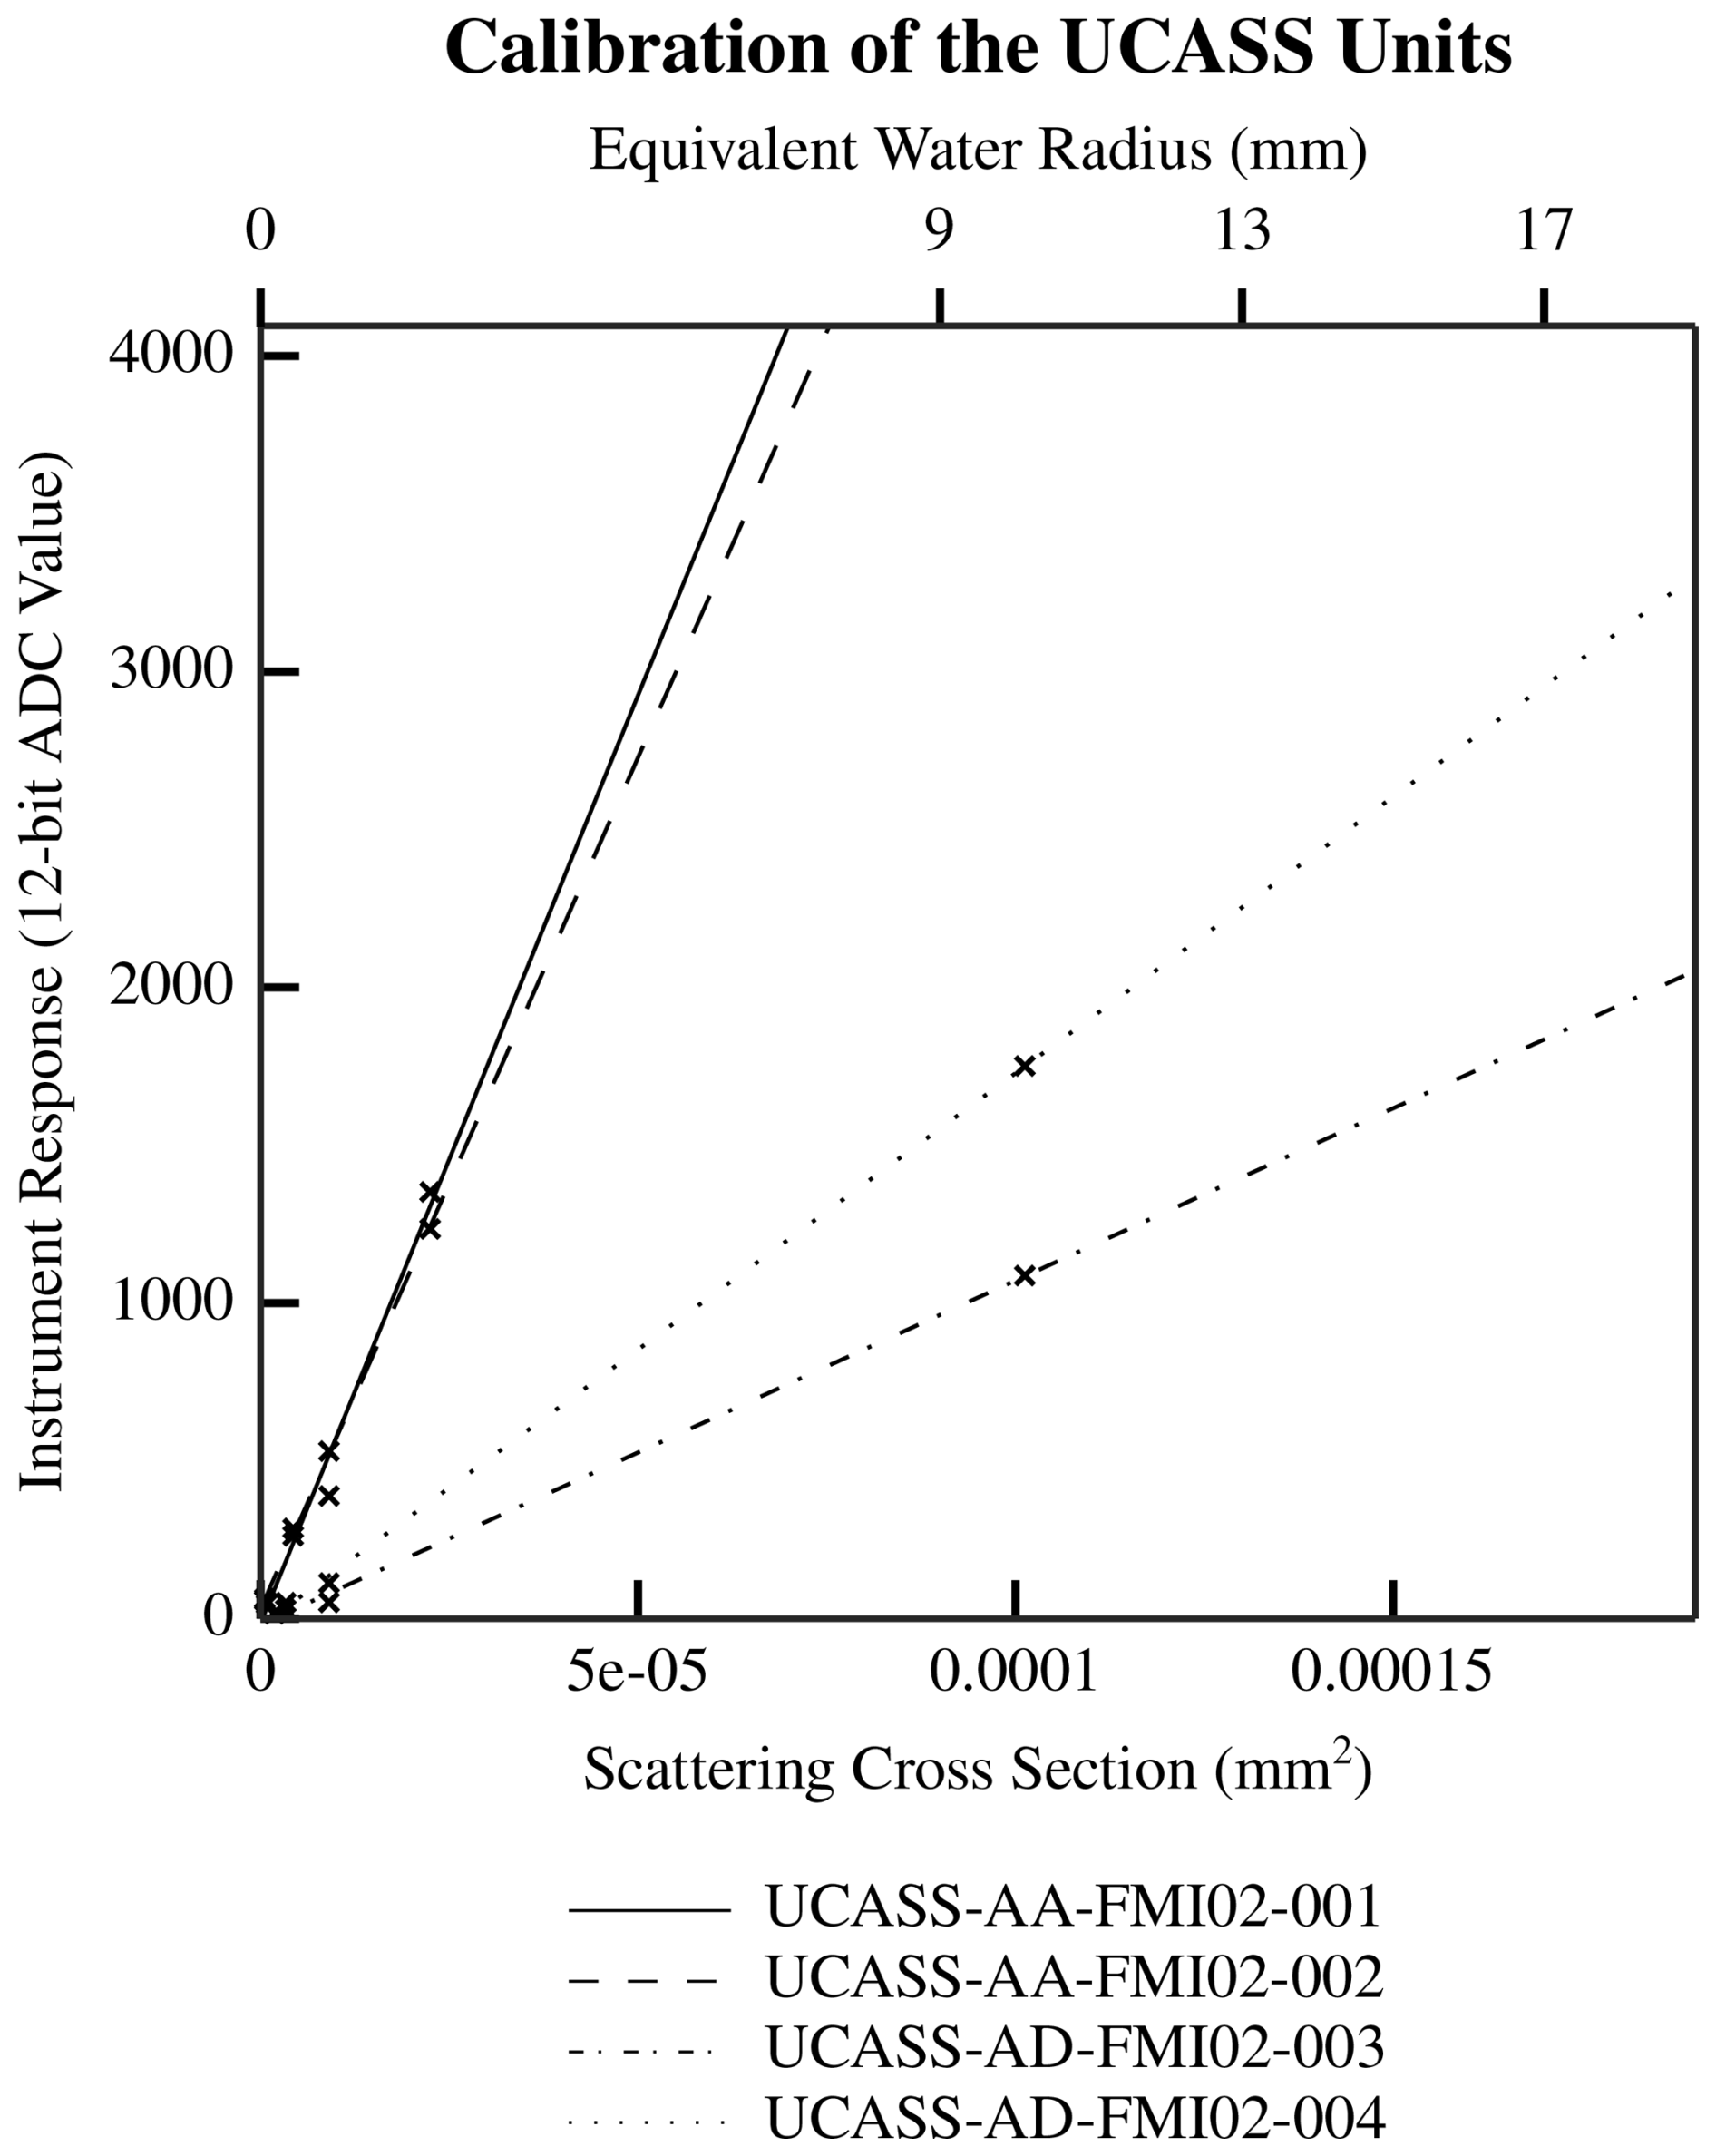
Figure 2A graph showing the different calibration curves of the UCASS units which were used for the campaign. The serial numbers for the four instruments are stated in the key. The calibration data points were marked on the graph with an “×”.
The sizing uncertainty of the UCASS is 10 %, as stated in Smith et al. (2019). This is due to an inhomogeneity in the laser beam spatial power distribution causing a slightly different amount of light to be collected by the collection optics depending on its position in the beam. The uncertainty of the concentration measurements of the UCASS is 15 %. This is due to variations in the alignment of the collection optics causing the sample area of the beam to slightly change in size between different UCASS units. The maximum speed of a particle traversing the UCASS sample area is 20 m s−1. This is because each particle traversing the UCASS laser beam causes a time domain signal in the transimpedance amplifier, which has an upper bandwidth limit. The period of a particle travelling at 20 m s−1 through the 50 µm thick laser beam is the upper limit.
The UCASS units used in this paper were calibrated using the aerosol calibration method described in Girdwood et al. (2025). There were two possible transimpedance amplifier gain modes in which the units could be set: low gain and high gain, which had size ranges of approximately 3 to 40 and 0.4 to 15 µm respectively. The exact size ranges depended on the instrument calibration coefficients. A total of four UCASS units – two low gain and two high gain variants – were deployed throughout this campaign, the calibrations for which are shown in Fig. 2. The UCASS unit which was used at any one time was chosen based on availability, and the presence of clouds – a low gain unit was used for measurements of cloud droplets and a high gain unit was used for measurements of aerosol.
Thermodynamic measurements of temperature and humidity were obtained from an SHT85 (Sensirion, 2025) sensor which was positioned in a radiation shielding housing. However, this sensor was rendered inoperable part way through the campaign due to an issue with moisture ingress, and was therefore replaced with a BME280 (Sensortec, 2025). The data were logged from three separate sources: the flight data and housekeeping, including GNSS and IMU data, were logged on the SUA flight controller; meteorological data were logged on a Raspberry Pi Zero (Pi, 2025) with a frequency of 1 Hz; and the UCASS data were logged on a separate Raspberry Pi Zero with a sample frequency of 2 Hz. The housing design for the temperature and humidity sensors was identical to that used in Greene et al. (2018). It was considered that condensation on the sensor would likely be an issue for in-cloud temperature sensing, however this is an expansive issue not only limited to temperature and humidity measurements on SUA, but also conventional aircraft and considered beyond the scope of this paper.
During the month long intensive part of the field campaign, a total of 39 SUA flights were conducted. A flight consisted of a profile – or series thereof – up to the maximum allowed ceiling of 2 km above ground level. For all but two flights – flight numbers 009 and 010 in Table 2 – the cloud top was beneath this 2 km legal ceiling. A total of 84 profiles were extracted from the data, see Sect. 7 for more information. Stratus cloud was present during the campaign from flight 007 to flight 028. The encountered clouds were entirely liquid and supercooled liquid droplet clouds, with a negligible change of encountering solid ice as found in Doulgeris et al. (2022). The SUA was never piloted through its own wake, therefore the effects of rotor wash can be negated.
The SUA flight controller firmware was capable of facilitating waypoint navigation, meaning that a series of GNSS waypoints could be programmed before a flight, then the SUA would follow this flight plan. The waypoints were positioned in a vertical “zig-zag” switchback pattern with the aim of creating a quasi-vertical profile which was constrained to a lateral deviation of no more than 1 km, however wind conditions often necessitated operating beyond this. The switchback pattern was programmed to be laterally parallel with the wind direction to minimise deviations from the 15° angle of attack (AoA) limit defined in Girdwood et al. (2022b). The airspeed acceptance limit of the UCASS, as determined by the bandwidth of the amplification and signal conditioning electronics, was 20 m s−1. Therefore, the desired cruising speed was adjusted accordingly to 15 m s−1. Since there were times that the SUA had to stray beyond the AoA and airspeed limits for manoeuvres and operational necessity, it was determined that the most pragmatic approach would be to apply these limits as a data quality assurance (QA) step.
The flights took place at the Pallas atmosphere-ecosystem super site. The site is located 170 km north of the Arctic Circle (67.973° N, 24.116° E), partly in the area of Pallas-Yllästunturi National Park (Lohila et al., 2015). A map of the SUA operation area, in addition to an example flight, is shown in Fig. 3.
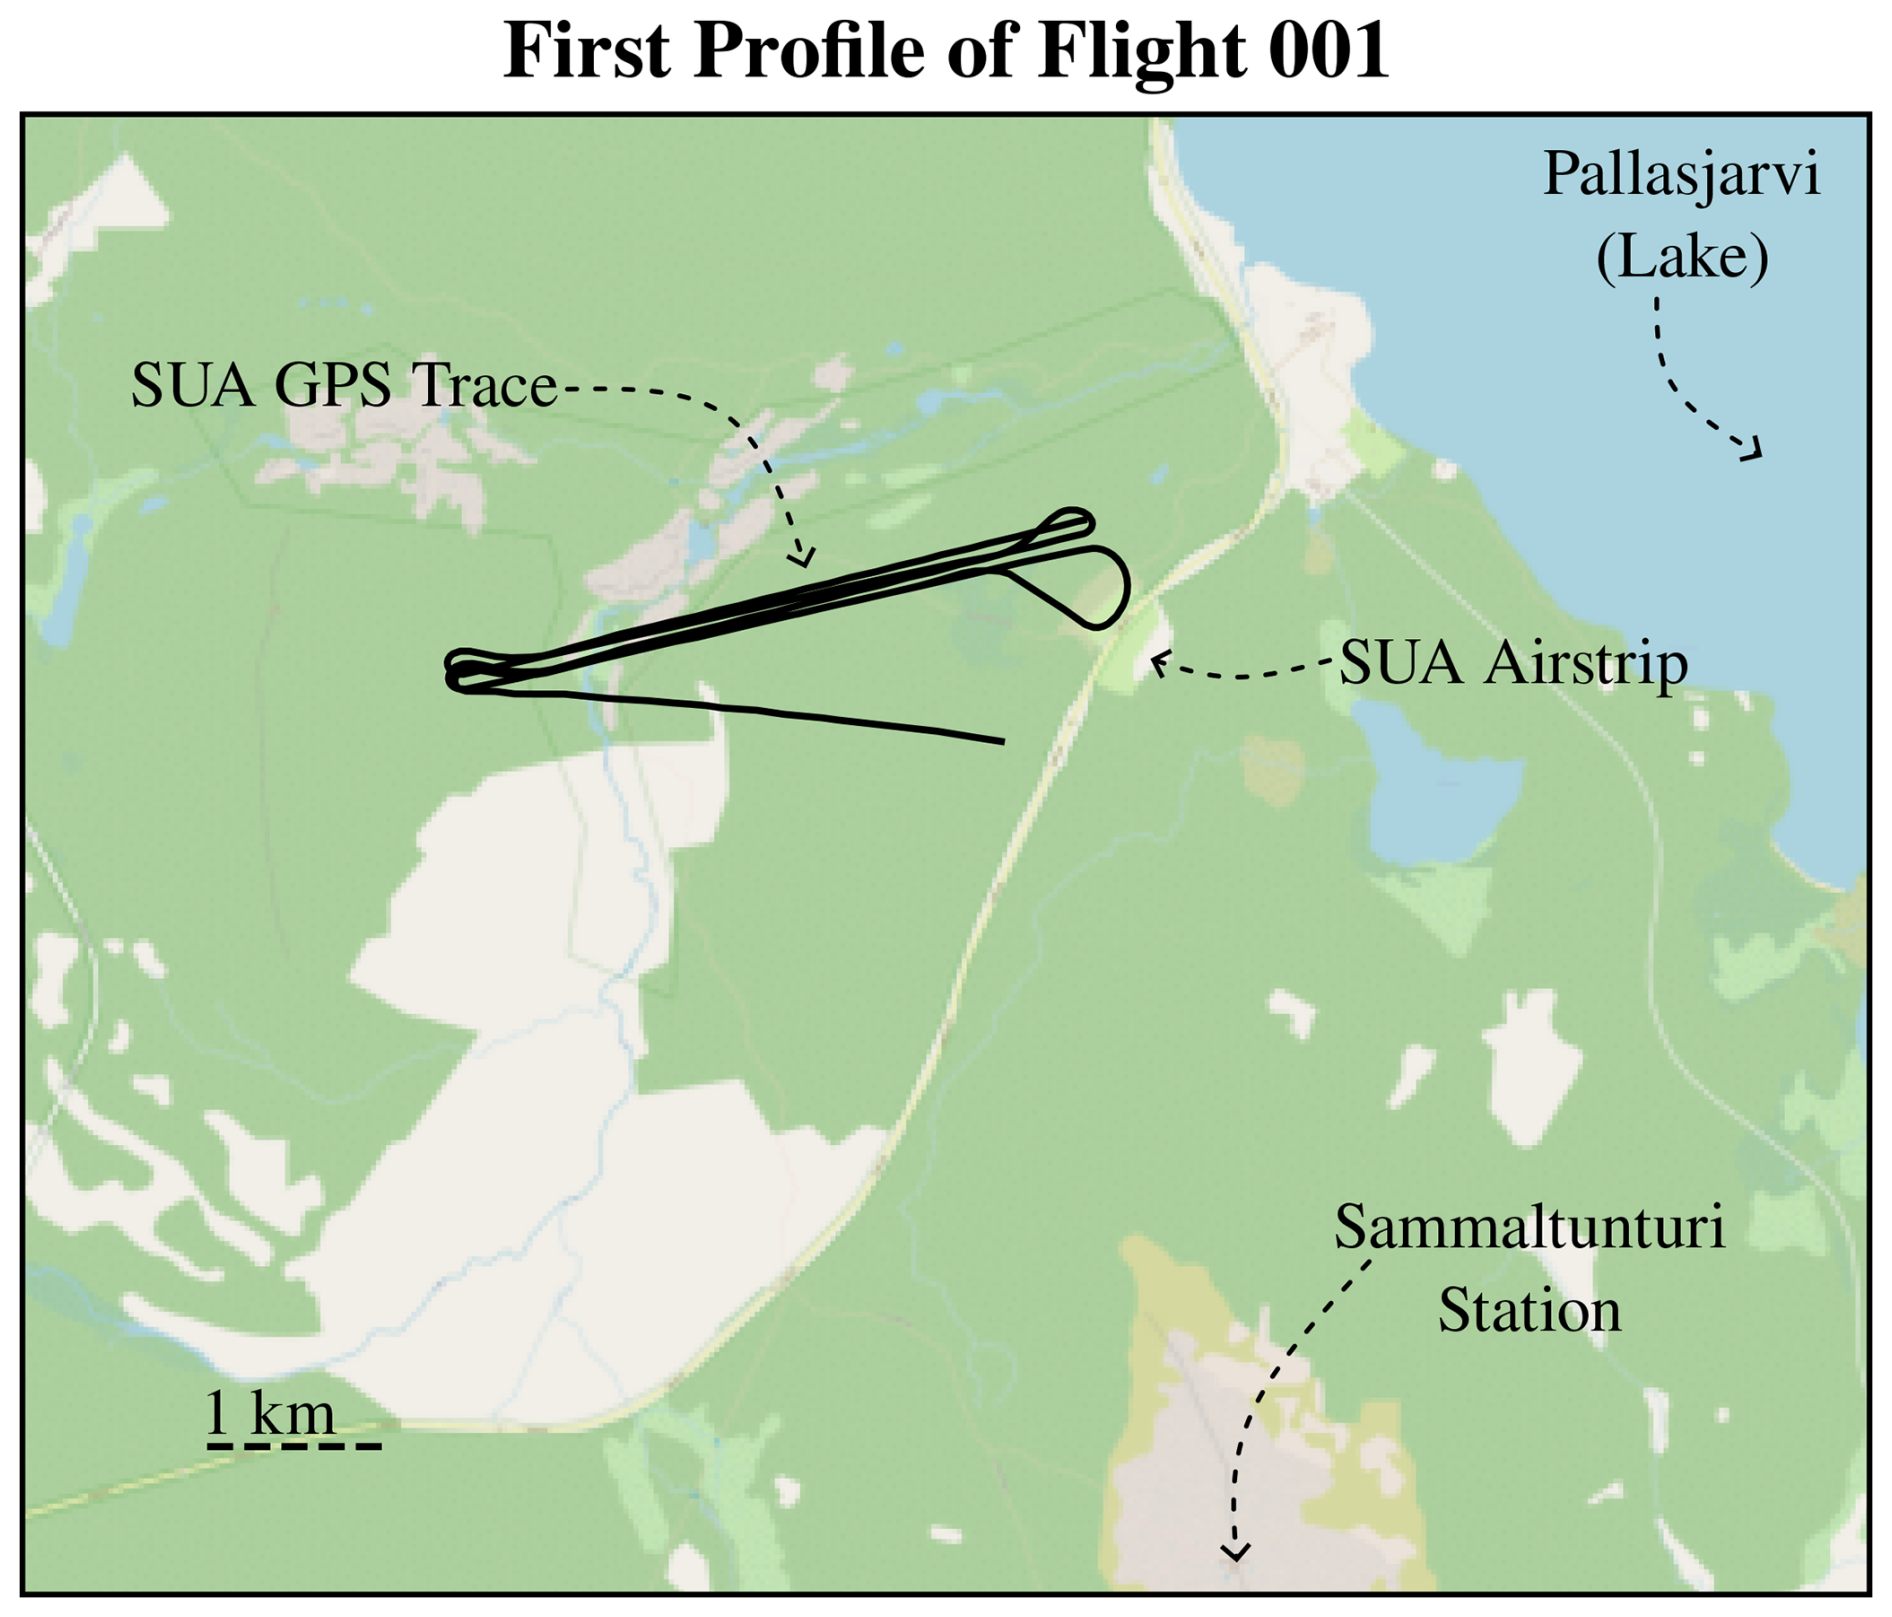
Figure 3A map of the SUA operations area which was active for the campaign period. The latitude-longitude trace for flight “001” – see Table 2 for more information – is also shown on the map as an example. The data for the map were obtained from Open Street Map Contributors (2017) (map data from OpenStreetMap). Distributed under the Open Data Commons Open Database License (ODbL) v1.0. This profile was chosen as that which is representative of the entire dataset, with only the strafing direction changed slightly to match the wind direction.
The data were processed using the “oproc” python package, which was custom made for integrating OPS data with meteorological and geolocation data, and can be found on GitHub (Girdwood, 2025). This package is capable of processing raw data from an indeterminate number of files and synchronising it to a global time step which, in this instance, was set to 0.5 s. This was necessary because the meteorological data, the UCASS data, and the flight controller data were all recorded on different data loggers at different time steps. The spatial resolution of the data depended on the ground speed and ascent speed of the SUA, which varied with wind speed throughout the campaign. The dataset is time indexed in order to comply with the data standards outlines in Bagheri et al. (2025).
The software uses a configuration file which allows the user to specify which raw files are desired, which columns and rows are needed from each file, and the units of all the variables. Unit conversion is handled automatically by referencing the specified variables against a central database, which can be altered by the user if desired. While the package was created with the intention of analysing OPS data specifically, it can also be used as a processing framework for general meteorological data. Once the data are imported, they can be processed using one of a number of algorithms, which are referred to in the software as “proc” objects, because they are subclasses of a class called “__Proc”. These algorithms are expanded upon in Sect. 6. This is to ensure that the processing of units is consistent, and that all the required variables are present. Once the data are imported they can be saved in an HDF5 file in which the units and descriptions of each variable are also stored as metadata.
All processing, data extraction, and plotting can be done in this software, which additionally includes space for customisation and addition of user specified processing routines.
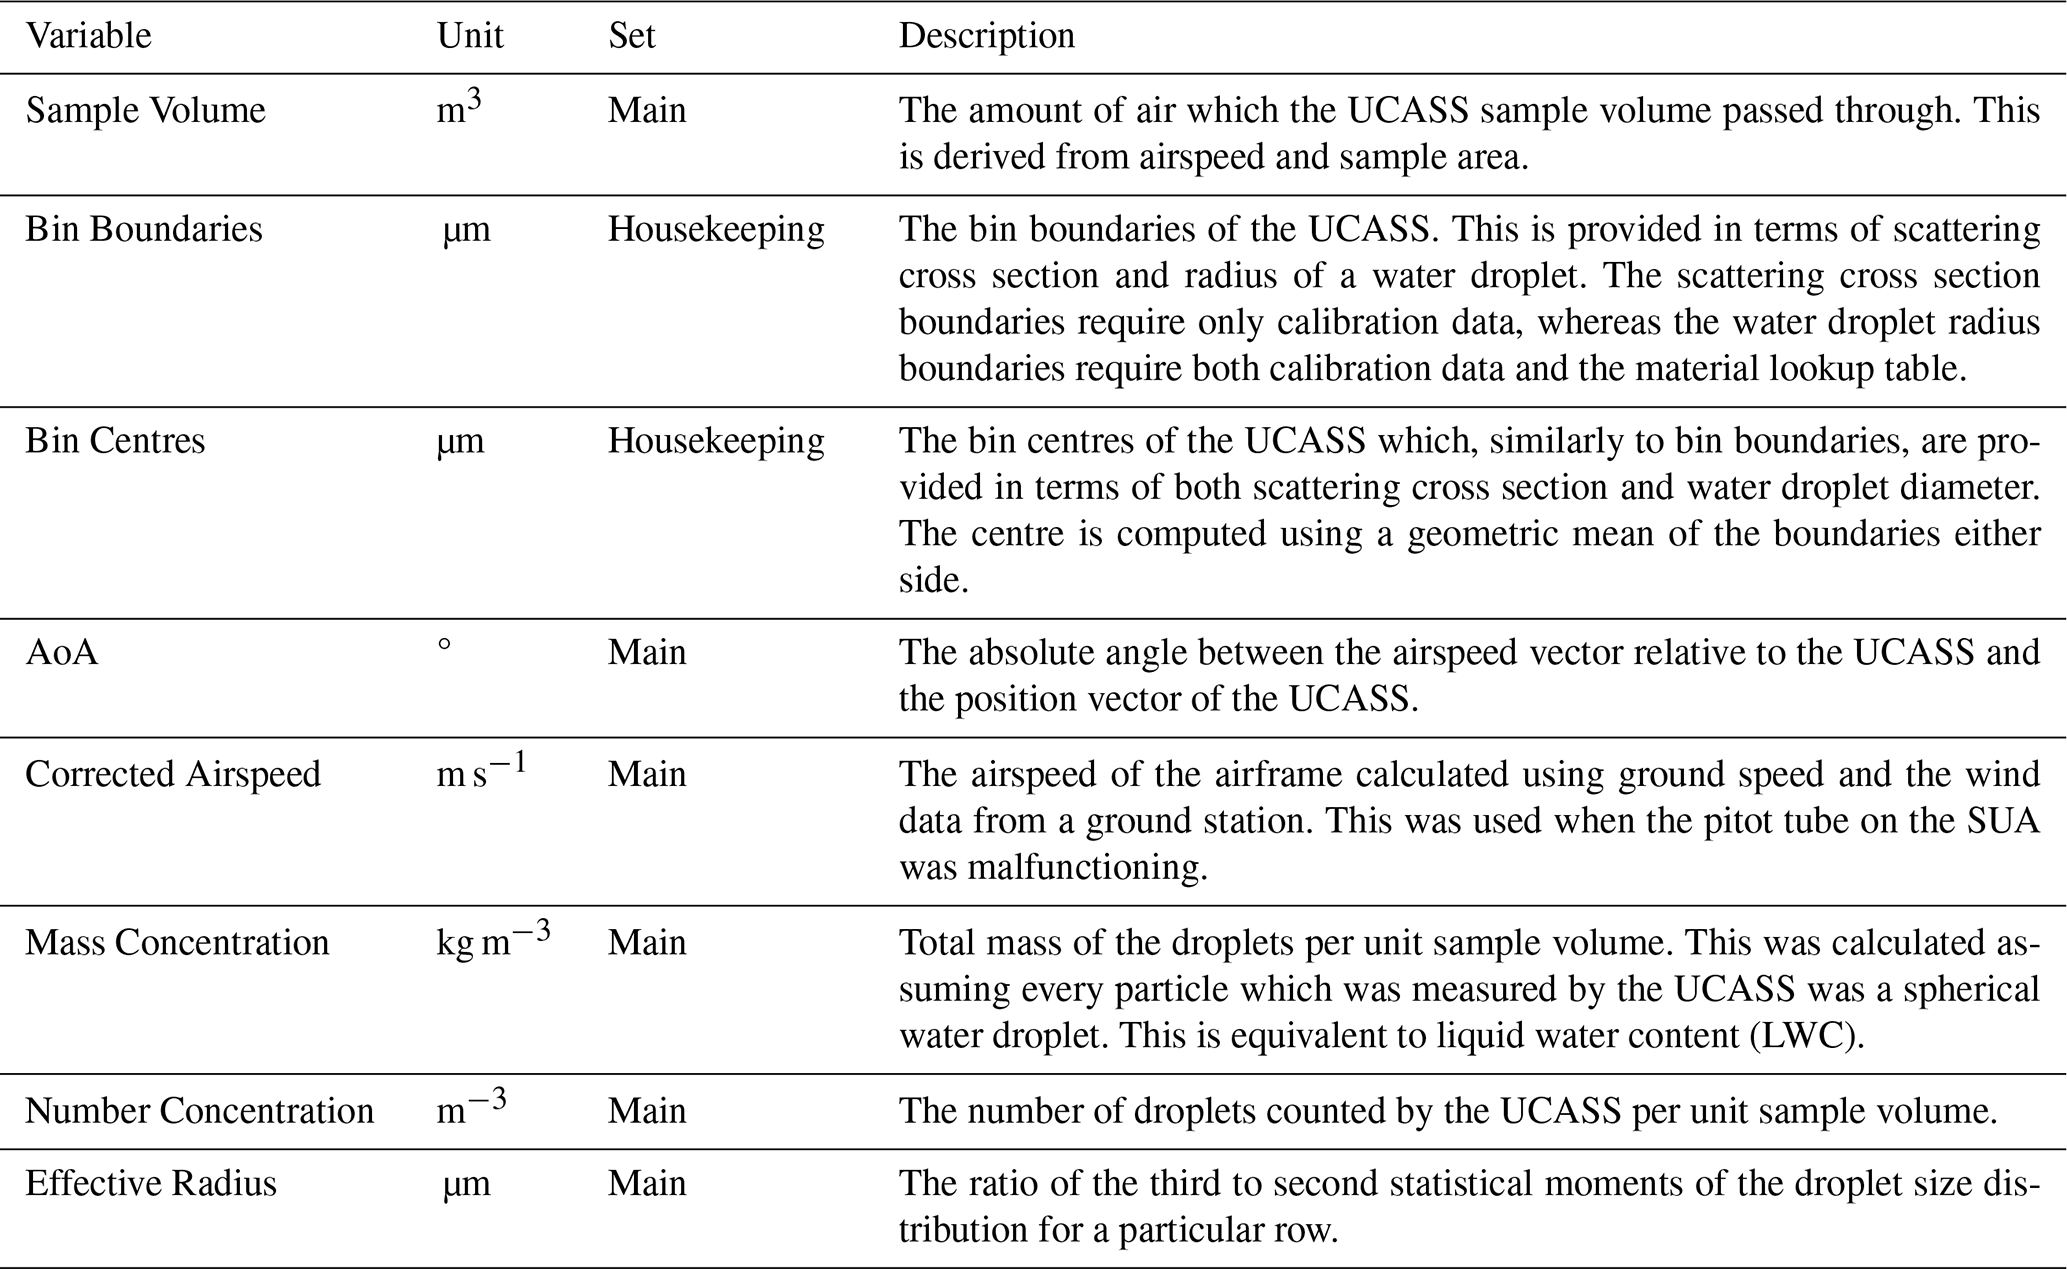
Table 1The derived data products which are present in the dataset.
Since the constraining conditions for the UCASS – as discussed previously in Sect. 3 – were occasionally breached due to operational necessity, data QA was needed. In order to do this a series of data QA variables, which will henceforth be referred to as ”masks”, were created. A mask variable is a column with the same length as the rest of the data, which has a boolean value. If the mask value resolves as true for a particular row, then this row would be accepted for this mask condition. For example, if one were to create a mask variable for airspeeds above 20 m s−1, every row where the airspeed exceeded this limit would be false. The masking variable conditions for these data were AoA values exceeding 15°, airspeed values exceeding 20 m s−1, and profile number. These limits were chosen based on the engineering constraints of the UCASS, as discussed in Sect. 3.
The time series data for a flight can be split into different profiles using the profile mask variable. This was calculated from the peaks of the (inverted) barometric pressure time series. From each flight there exists an even number of profiles, which are summarised in Table 2. Odd number profiles were ascending in altitude and even number profiles were descending. The AoA is also included in the dataset. This was calculated using Eqs. (2) to (8) of Girdwood et al. (2022b), and is not reiterated here for the sake of brevity.
Occasionally, the pitot tube, which was used to measure airspeed, would get blocked with liquid water or ice – resulting from impact freezing of supercooled water droplets – while flying through a cloud. This meant that the default airspeed would be unusable for a profile. In order to compute UCASS data products, a corrected airspeed needed to be derived. This was calculated by using Eqs. (2) to (8) of Girdwood et al. (2022b), and obtaining the wind speed and direction from Sammaltunturi station. However, care should be taken when using concentration data from these flights, since the corrected airspeed is less accurate. Recently, work was conducted on a new airspeed sensor which can be integrated into the UCASS which does not have the issue of blockages (Jost et al., 2025). While this was not ready for the PaCE 2022 campaign, future campaigns involving the UCASS should implement this sensor.
The variables obtained from Sammaltunturi station varied with distance away from the station. This inevitably led to a co-location error in the estimation of AoA and corrected airspeed which increased in magnitude with distance between the station and the SUA. This was negated by deciding a conservative estimate in the maximum AoA used for the mask.
Included in the data are some derived data products; these are summarised in Table 1. The sample volume variable, in units of m3, is the amount of air which has passed through the sample area of the UCASS in a measurement time step – 0.5 s in this case. This is calculated from
where Vs is the sample volume, As is the sample area of the UCASS which is defined optically as 0.5 mm2, va is the airspeed of the SUA in m s−1, and t is the time step. The bin boundaries are the scattering cross section boundaries of the UCASS bins. The bin centres are the geometric centres of the UCASS bins which are calculated from
Where bc,i is the geometric bin centre of bin i, and bb,i is the bin boundary of bin i. The scattering cross section bin boundaries and centres can be used to calculate the physical droplet radii using a material data lookup table which is included in each file of the dataset. This lookup table is generated by using Generalised Lorenz-Mie Theory (GLMT), using the method and weighting function described in detail in Girdwood et al. (2025). The lookup table included in this dataset was generated using the refractive index of water, 1.33. The UCASS measures the number of particles in a particular bin, which can be used with the bin centres to calculate mass concentration from
where mj is the mass concentration in row j, i is the bin centre number from 0 to 15, ri is the centre radius of bin i calculated from bc,i and the material data lookup table, and ci,j is the number of droplet counts in bin i of row j. The number concentration of cloud droplets is also provided as part of this dataset. This was calculated from
where nj is the number concentration of cloud droplets in row j. The effective radius of the cloud droplets was also derived and added to the dataset. This is the ratio of the third to second statistical moments of the droplet size distribution and was calculated from
where is the effective radius of row j, and ni,j is the number concentration of cloud droplets in bin i of row j.
A summary of the contents and processing of all the data files provided is shown in Table 2. The data in the set came from three different data loggers – one for the UCASS, one for the flight controller, and one for the meteorological data – which occasionally malfunctioned or were unavailable due to repair. The data sources which were available for each file are shown in Table 2. The meteorological data logger is split into “SHT” and “BME” because, for the first part of the campaign, a Sensirion SHT85 sensor was used, and for the latter part of the campaign a Bosch BME280 was used.
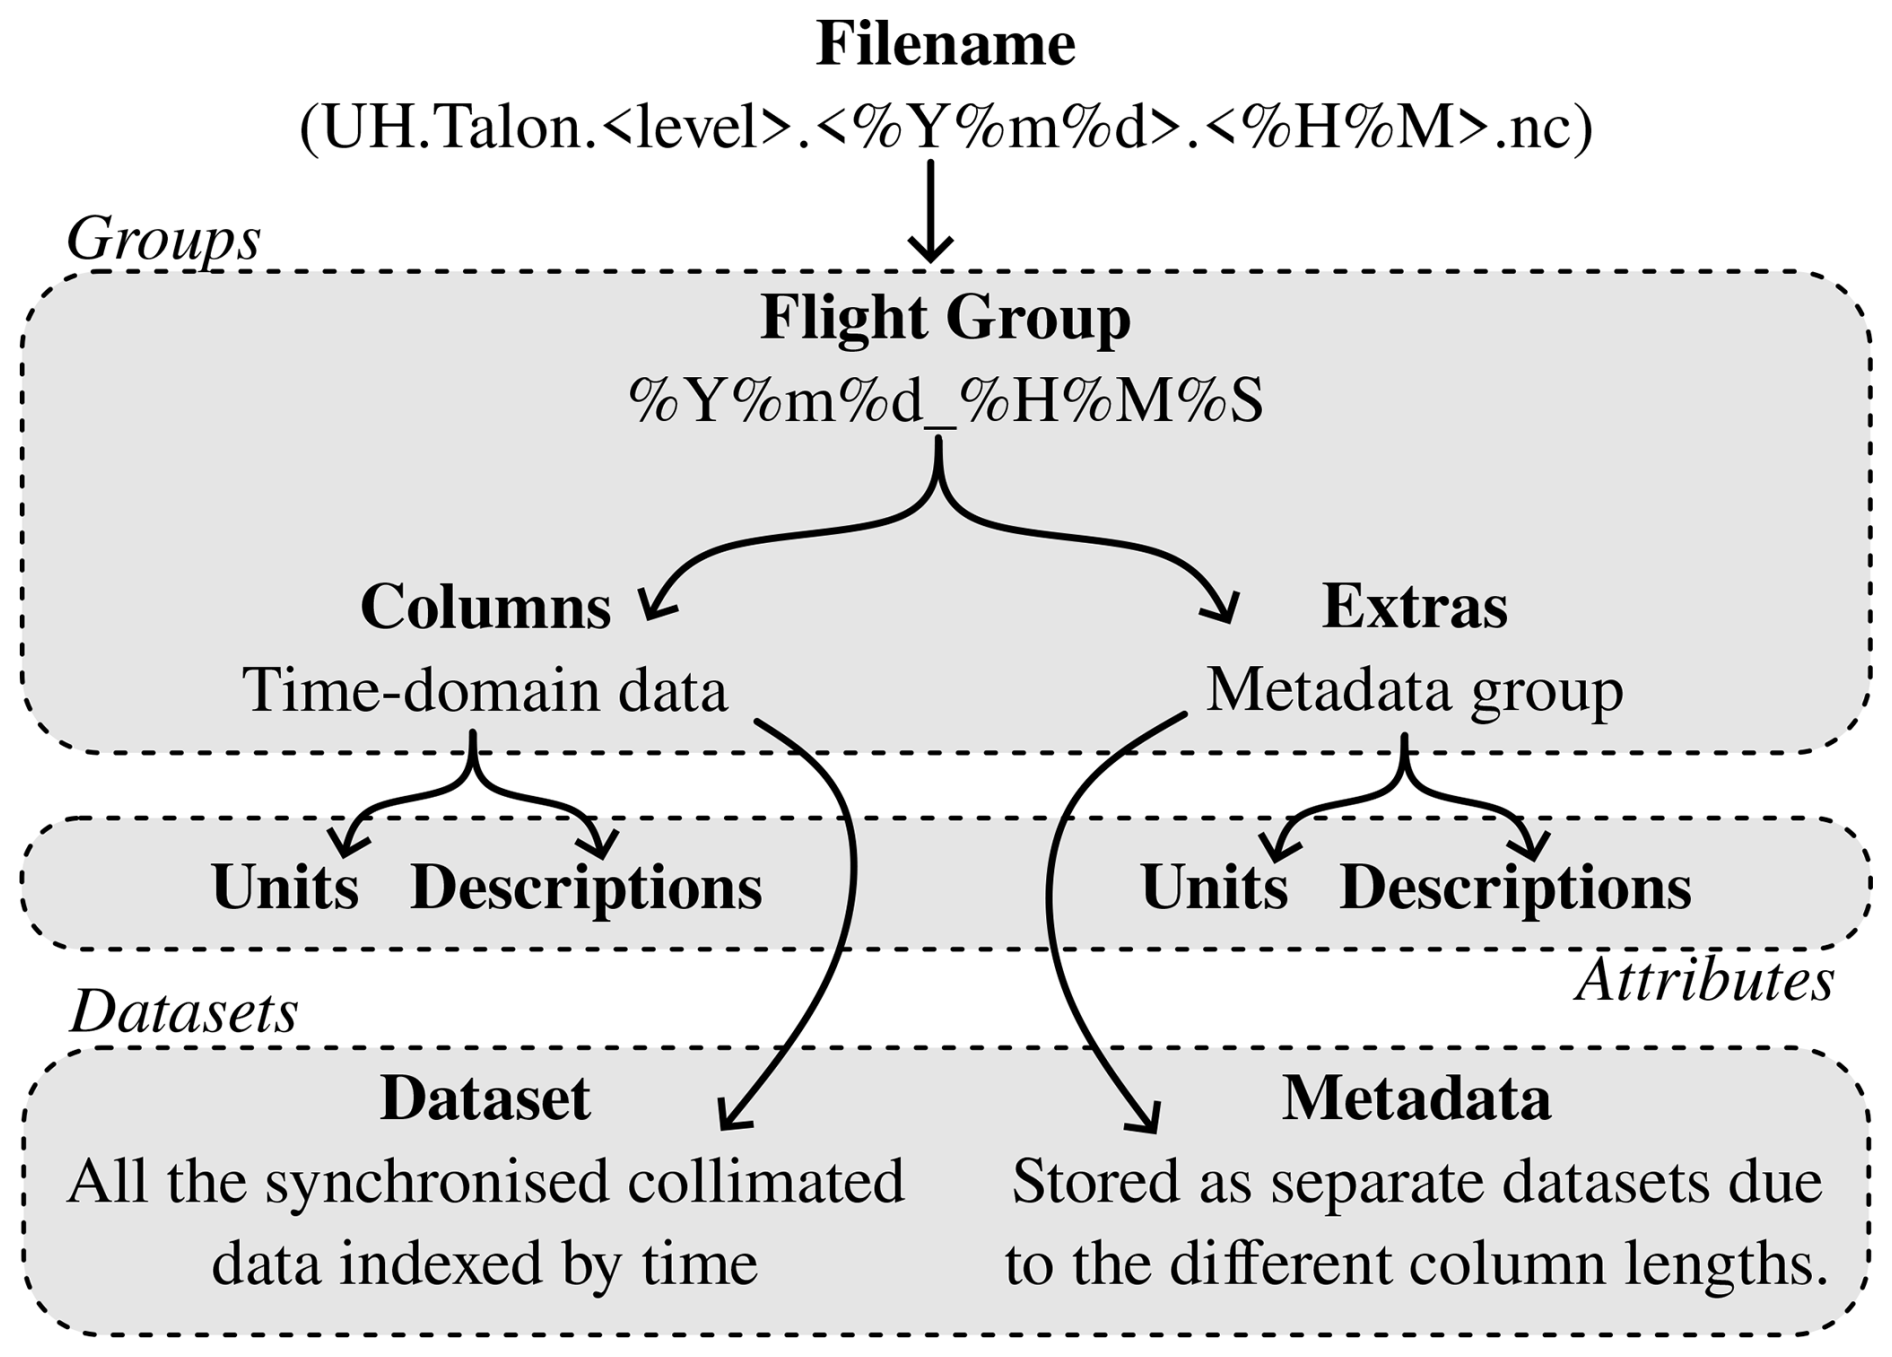
Figure 4An illustration of the structure of the HDF5 files which are in the dataset. The groups, attributes, and dataset file structures are labelled.
Table 2A summary of all the flights, to which level they are processed, and which data sources are in each file. Also included here is the airspeed type used for processing and the number of profiles. The profile number is not applicable in cases where the data were not processed to level “c1”. NA – not available
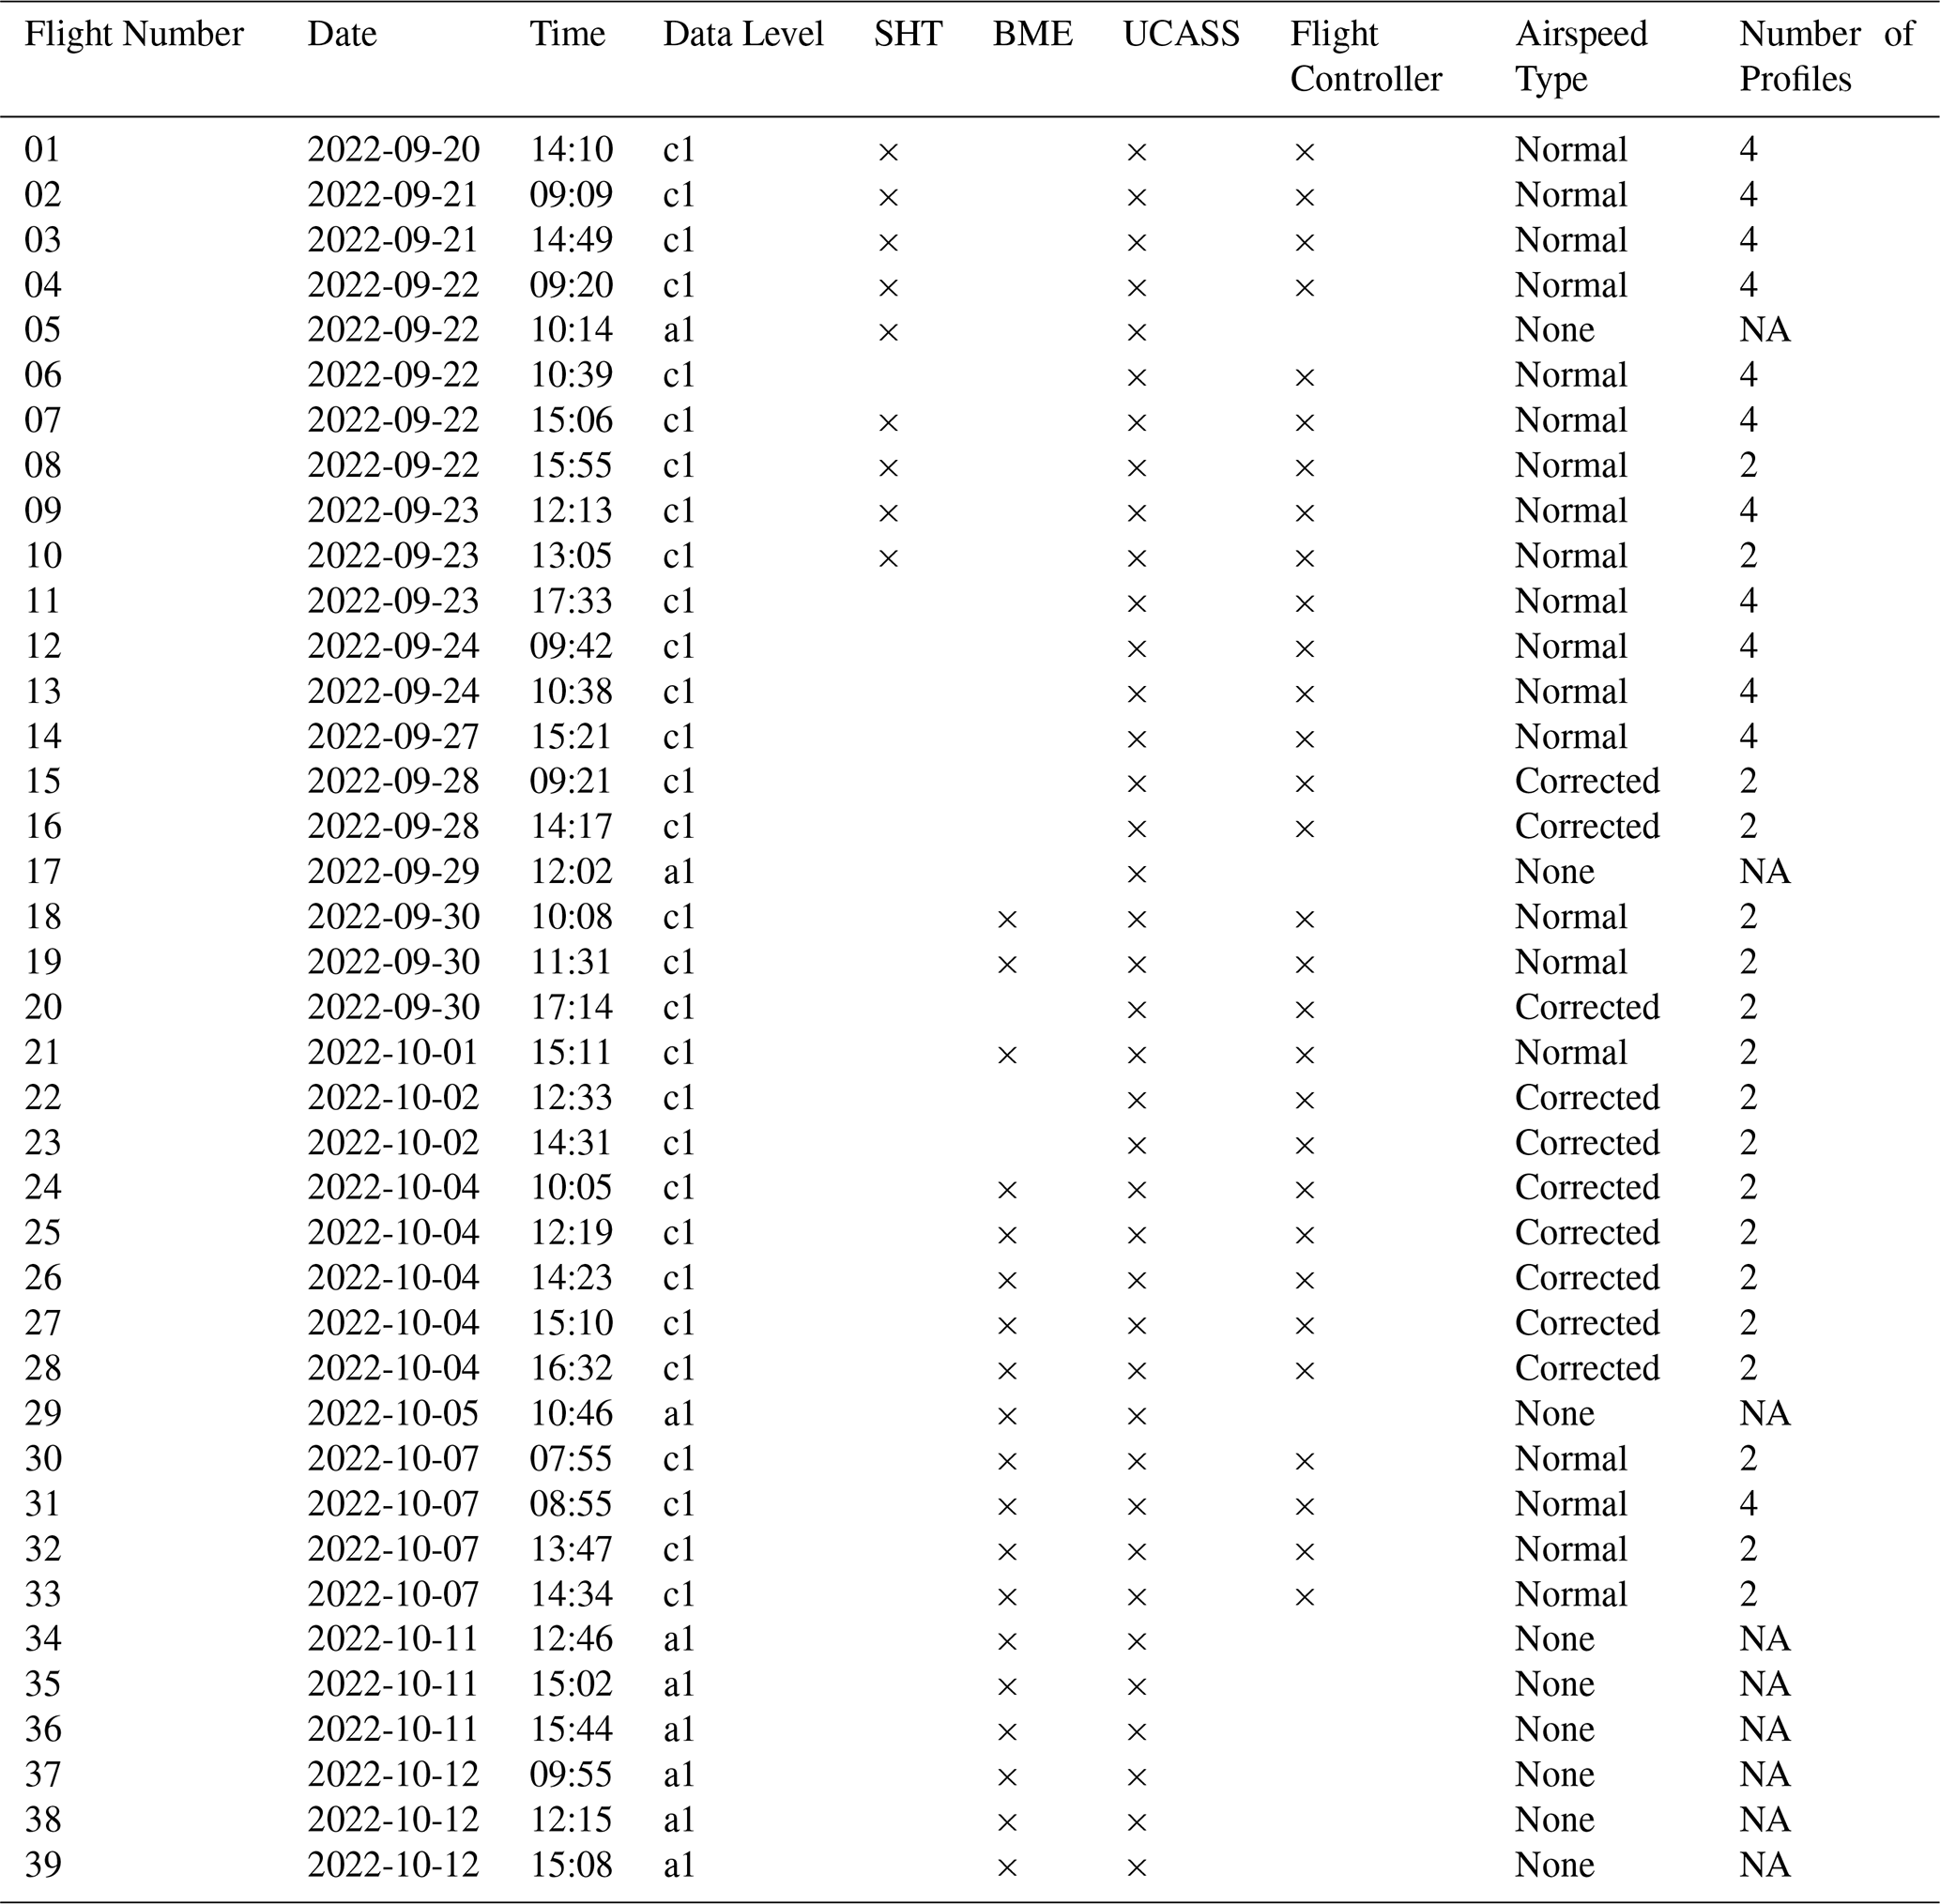
The data level is also included here. If the flight controller data were not available for a particular flight, then no further processing could be conducted since both airspeed and corrected airspeed require flight controller data, and these are used to compute all the derived data products. In addition, flight controller data, specifically attitude and position data, are used to perform the automated QA process. These flight files are therefore left at level “a1”, while the rest are processed to level “c1”. The data levels used here are consistent with those used in Bagheri et al. (2025).
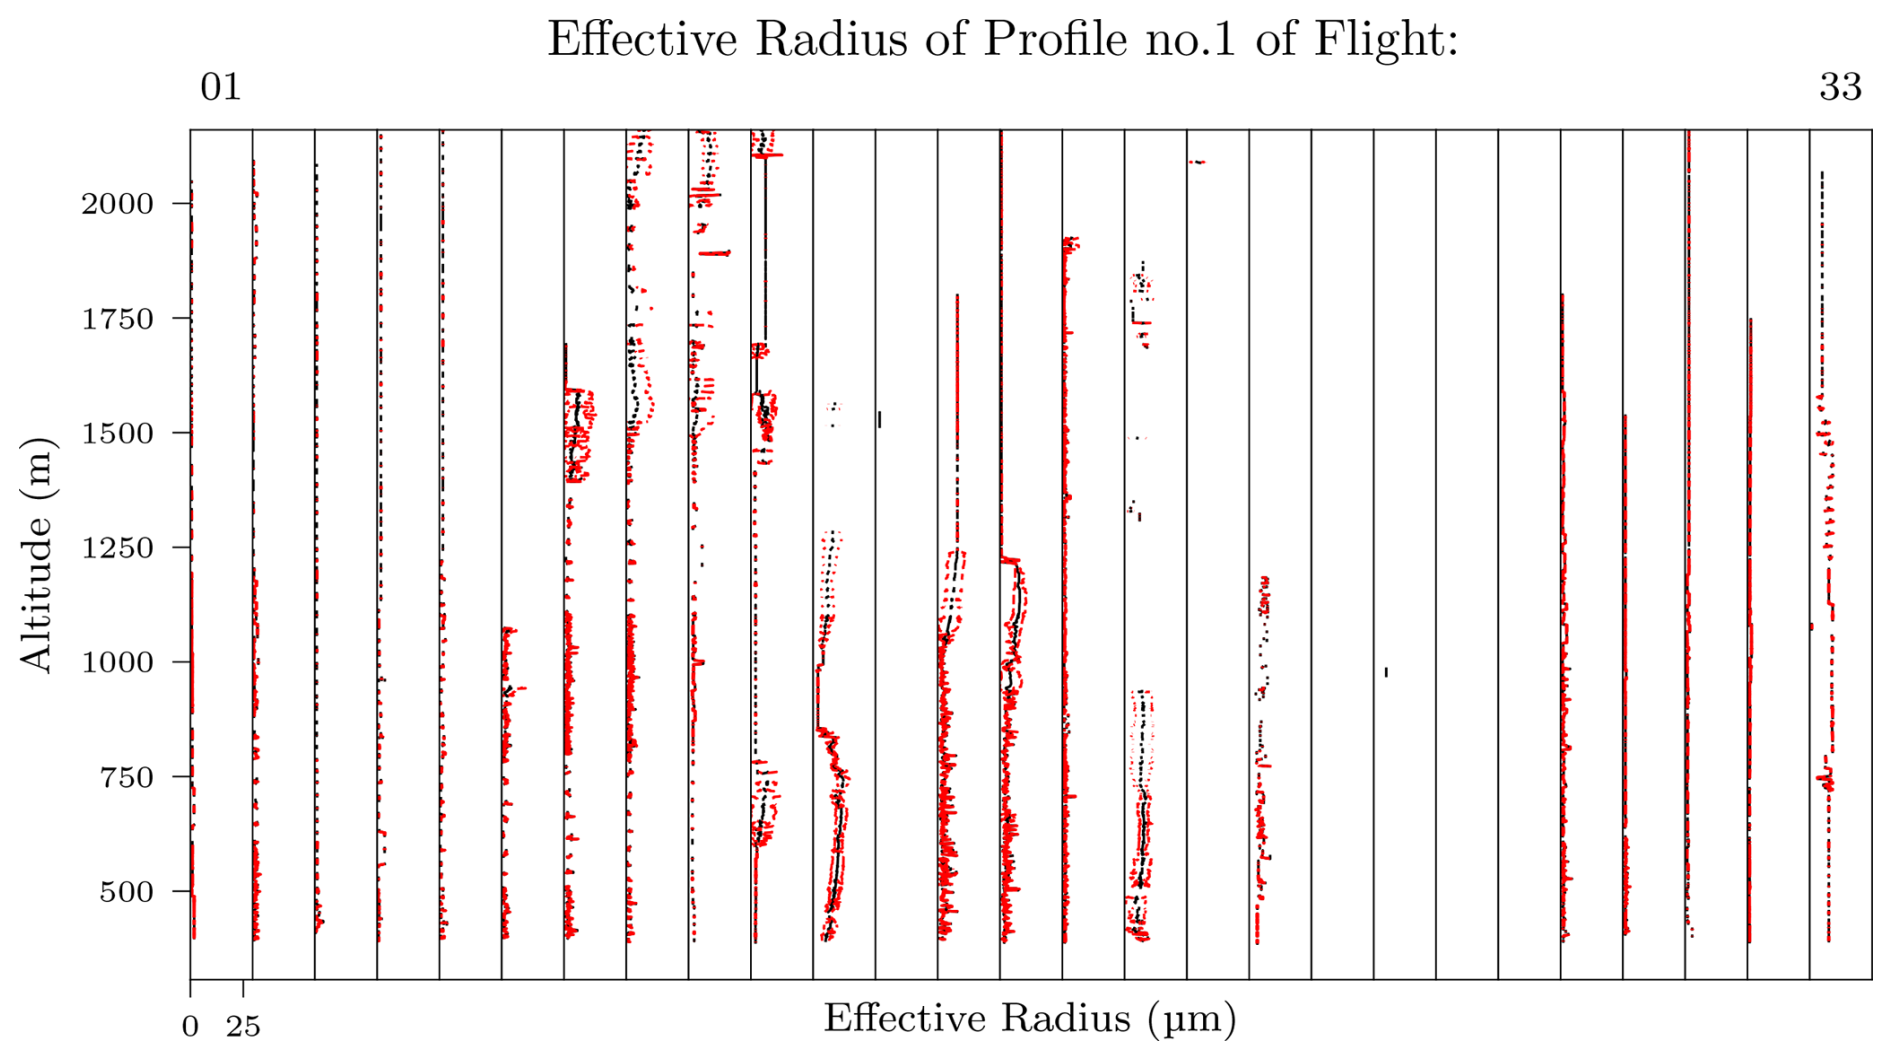
Examples of the level “c1” data are presented in Figs. 5 and 6, where plots of number concentration and effective radius versus altitude above sea level for the intensive campaign period are shown. The flight number is shown on both of these plots, and for brevity only the first profile (the first upwards leg) is shown in each one. The red lines in the plots show the error bounds of the parameters. The number concentration plots have the sample area error of the UCASS which is 15 %. The error bounds of the effective radius plots were calculated from
where Er is the error in the effective radius calculation, σC is the standard deviation of the raw counts detected by the UCASS, and Ci is the raw counts detected by the UCASS in row i.
Also included in Table 2 is the number of profiles which were performed in each flight, which varied depending on weather conditions, battery capacity, and other operational constraints. The total number of profiles performed over the campaign period was 84, which includes downwards profiles, and excludes all flights where flight controller data were unavailable, since the total number of profiles cannot be known in this case.
Each flight is in one single file named following the constraints outlined in Bagheri et al. (2025). The file format is HDF5; within each file is a master group with the flight date and time in format “ %Y %m %d_ %H %M %S”. Within this master group are two subgroups called “columns” and “extras”, which contain the synchronised collimated data and the housekeeping data respectively. The units and descriptions of each variable are stored as group attributes, assigned to the “columns” and “extras” groups as appropriate for the specific variable. A graphical depiction of the file structure is shown in Fig. 4.
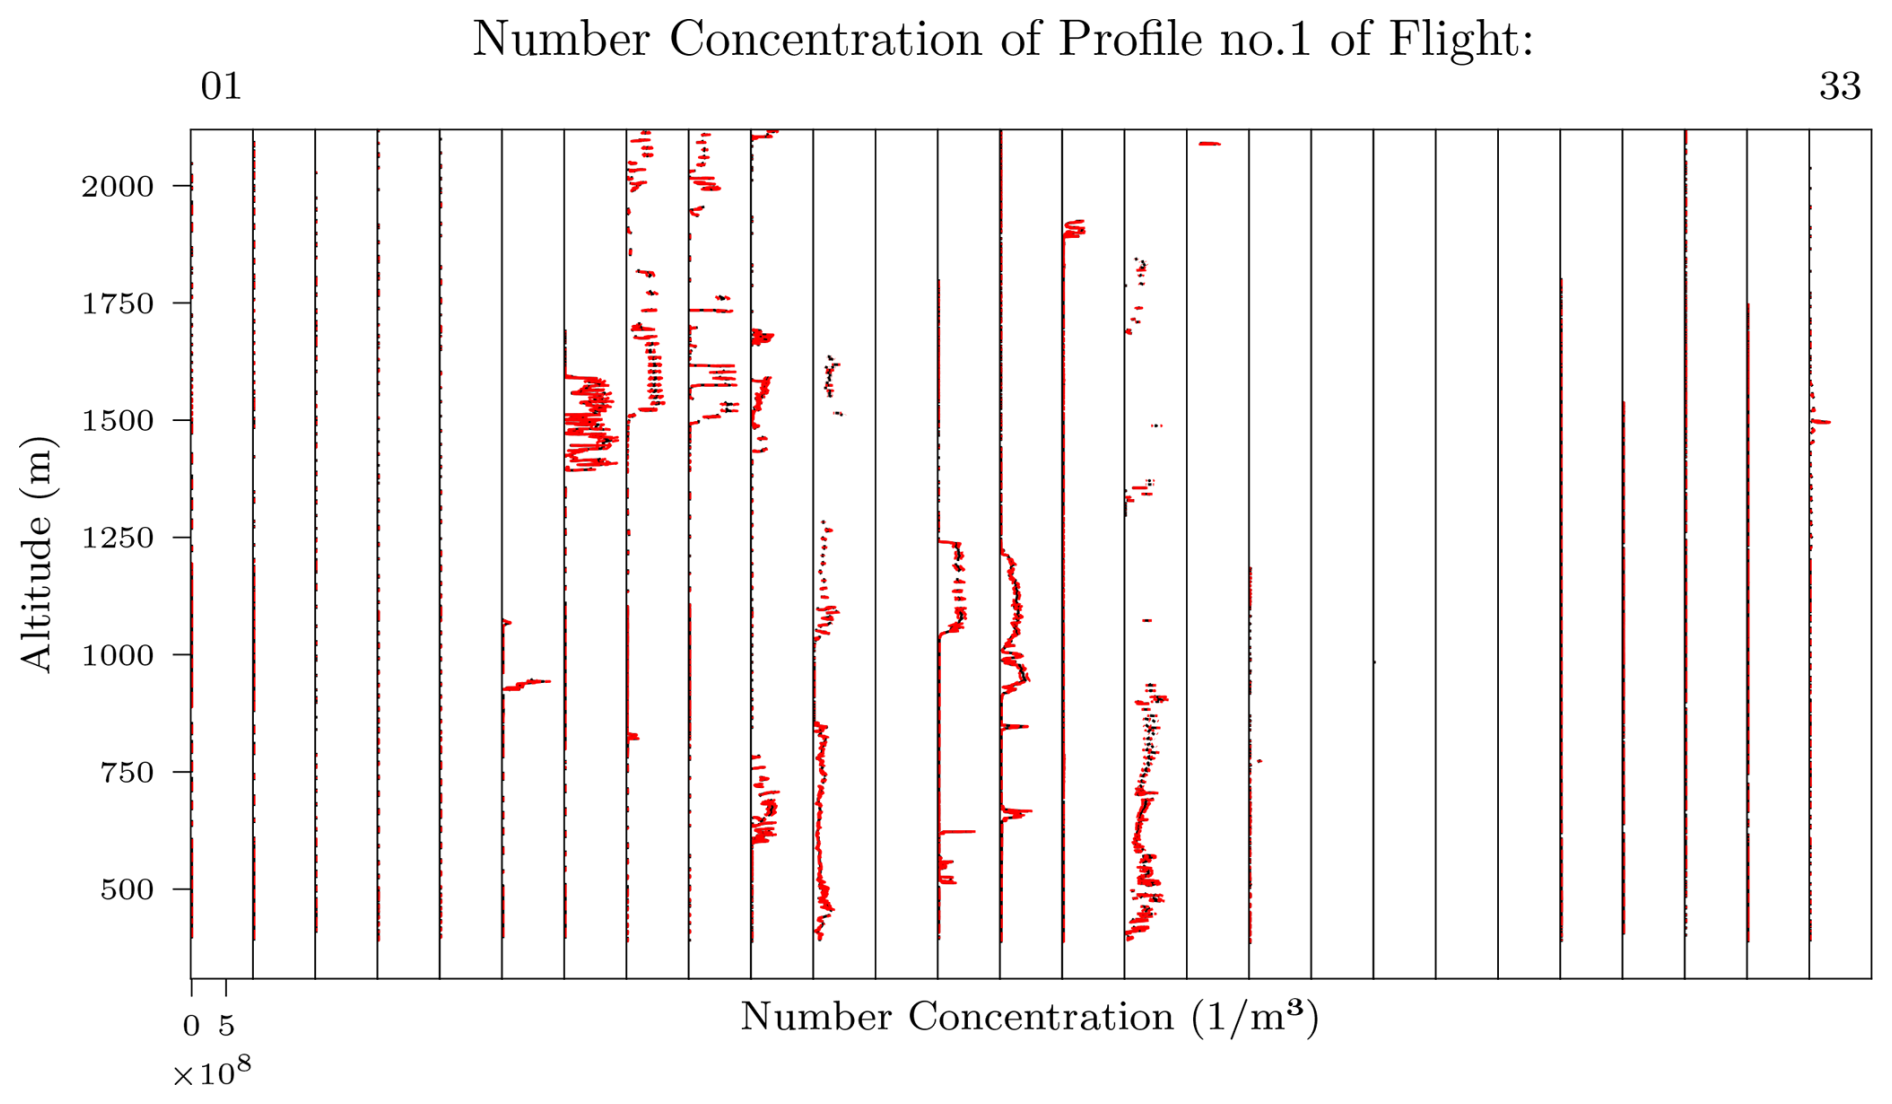
Figure 5The number concentration profiles from the UCASS throughout the intensive campaign period. The flights where flight controller data were not available are omitted from the figure. The flight number, consistent with Table 2, is shown at the top of the graph.
The dataset is available from https://doi.org/10.5281/zenodo.14756233 (Girdwood et al., 2022a) and the code is available from https://github.com/wolkchen-cirrus/UCASSDataProcessor (Girdwood, 2025) and https://doi.org/10.5281/zenodo.19455847 (Wolkchen, 2026).
This manuscript presents the data collected using the UCASS instrument on the FMI-Talon SUA during the intensive period of the PaCE 2022 field campaign. This campaign took place during Autumn 2022, with the purpose of investigating polar liquid cloud processes, and the advancement of measurement techniques. The dataset, which can be found in Girdwood et al. (2022a), contains data which was processed to level “c1” – with the exception of flights which did not contain flight controller data which were processed to level “a1” only – using the custom made “oproc” python package, which is available from Girdwood (2025).
The methods used for data collection were validated during a separate campaign in Pallas in 2020, the results of which can be found in Girdwood et al. (2022b). The data QA was conducted autonomously using the “oproc” software package. The data from the campaign are published alongside data from other platforms, the overview for which can be found in Bagheri et al. (2025). It is the intention that these data can be used alongside each-other to provide a more complete picture of the atmosphere for the campaign duration.
The dataset presented in this paper is intended for use in the validation of the Cloudnet cloud radar present at the Pallas site (Hogan and O’Connor, 2004). In addition, it can be used for intercomparison with the other data gathered during the PaCE 2022 campaign, which is presented in the Bagheri et al. (2025) special edition, and the assessment of the microphysics regimes of liquid cloud in weather models.
Data were collected by all authors, the manuscript was written by JG and curated by all authors, data curation was conducted by JG, software development was conducted by JG, conceptualisation and supervision was provided by DB.
The contact author has declared that none of the authors has any competing interests.
Publisher's note: Copernicus Publications remains neutral with regard to jurisdictional claims made in the text, published maps, institutional affiliations, or any other geographical representation in this paper. The authors bear the ultimate responsibility for providing appropriate place names. Views expressed in the text are those of the authors and do not necessarily reflect the views of the publisher.
This article is part of the special issue “Data generated during the Pallas Cloud Experiment 2022 campaign”. It is not associated with a conference.
Map data copyrighted OpenStreetMap contributors and available from https://www.openstreetmap.org (last access: 3 December 2025). The authors acknowledge the Finnish Meteorological Institute for running the Pallas-Yllästunturi super site, and for providing logistical support throughout the campaign. Some of the fieldwork was funded under the Aerosol, Clouds and Trace Gases Research Infrastructure (ACTRIS) transnational access programme.
This paper was edited by Gholamhossein Bagheri and reviewed by three anonymous referees.
Bagheri, G., Böhmländer, A., Girdwood, J., Doulgeris, K., Carlson, D., and Ialongo, I. (Eds.): Data generated during the Pallas Cloud Experiment 2022 campaign, Earth System Science Data, https://essd.copernicus.org/articles/special_issue1296.html (last access: 3 December 2025), 2025. a, b, c, d, e, f
Doulgeris, K. M., Lihavainen, H., Hyvärinen, A.-P., Kerminen, V.-M., and Brus, D.: An extensive data set for in situ microphysical characterization of low-level clouds in a Finnish sub-Arctic site, Earth System Science Data, 14, 637–649, https://doi.org/10.5194/essd-14-637-2022, 2022. a
Girdwood, J.: Optical Measurement of Airborne Particles on Unmanned Aircraft, Ph.D. thesis, University of Hertfordshire, Hatfield, https://doi.org/10.18745/th.27277, 2023. a
Girdwood, J.: wolkchen-cirrus/UCASSDataProcessor, Github [code] https://github.com/wolkchen-cirrus/UCASSDataProcessor (last access: 3 December 2025), 2025. a, b, c
Girdwood, J., Smith, H., Stanley, W., Ulanowski, Z., Stopford, C., Chemel, C., Doulgeris, K.-M., Brus, D., Campbell, D., and Mackenzie, R.: Design and field campaign validation of a multi-rotor unmanned aerial vehicle and optical particle counter, Atmospheric Measurement Techniques, 13, 6613–6630, https://doi.org/10.5194/amt-13-6613-2020, 2020. a
Girdwood, J., Brus, D., and Doulgeris, K.: Data From the Universal Cloud and Aerosol Sounding System Abord an Uncrewed Aircraft During the Pallas Cloud Experiment 2022, Zenodo [data set], https://doi.org/10.5281/zenodo.14756233, 2022a. a, b, c, d
Girdwood, J., Stanley, W., Stopford, C., and Brus, D.: Simulation and field campaign evaluation of an optical particle counter on a fixed-wing UAV, Atmospheric Measurement Techniques, 15, 2061–2076, https://doi.org/10.5194/amt-15-2061-2022, 2022b. a, b, c, d, e, f, g, h, i, j
Girdwood, J., Ballington, H., Stopford, C., Lewis, R., and Hesse, E.: Calibration of optical particle spectrometers using mounted fibres, Atmospheric Measurement Techniques, 18, 305–317, https://doi.org/10.5194/amt-18-305-2025, 2025. a, b
Greene, B. R., Segales, A. R., Waugh, S., Duthoit, S., and Chilson, P. B.: Considerations for temperature sensor placement on rotary-wing unmanned aircraft systems, Atmospheric Measurement Techniques, 11, 5519–5530, https://doi.org/10.5194/amt-11-5519-2018, 2018. a
Hogan, R. J. and O’Connor, E.: Facilitating cloud radar and lidar algorithms: the Cloudnet Instrument Synergy, Target Categorization product, 470, https://www.researchgate.net/profile/Robin-Hogan-3/publication/228821899_Facilitating_cloud_radar_and_ lidar_algorithms_the_Cloudnet_Instrument_SynergyTarget _Categorization_product/links/00b7d5169c308b151b000000/ Facilitating-cloud-radar-and-lidar-algorithms-the-Cloudnet-Instrument-Synergy-Target-Categorization-product.pdf (last access: 3 December 2025), 2004. a, b
Holybro: Digital Air Speed Sensor – MS4525DO, https://holybro.com/products/digital-air-speed-sensor-ms4525do (last access: 3 December 2025), 2025. a
Jost, S., Weigel, R., Kandler, K., Valero, L., Girdwood, J., Stopford, C., Stanley, W., Eichhorn, L. K., von Glahn, C., and Tost, H.: Improving the accuracy in particle concentration measurements of a balloon-borne optical particle counter, UCASS, Atmospheric Measurement Techniques, 18, 4397–4412, https://doi.org/10.5194/amt-18-4397-2025, 2025. a, b
Kezoudi, M., Keleshis, C., Antoniou, P., Biskos, G., Bronz, M., Constantinides, C., Desservettaz, M., Gao, R.-S., Girdwood, J., Harnetiaux, J., Kandler, K., Leonidou, A., Liu, Y., Lelieveld, J., Marenco, F., Mihalopoulos, N., Močnik, G., Neitola, K., Paris, J.-D., Pikridas, M., Sarda-Esteve, R., Stopford, C., Unga, F., Vrekoussis, M., and Sciare, J.: The Unmanned Systems Research Laboratory (USRL): A New Facility for UAV-Based Atmospheric Observations, Atmosphere, 12, 1042, https://doi.org/10.3390/atmos12081042, 2021a. a
Kezoudi, M., Tesche, M., Smith, H., Tsekeri, A., Baars, H., Dollner, M., Estellés, V., Bühl, J., Weinzierl, B., Ulanowski, Z., Müller, D., and Amiridis, V.: Measurement report: Balloon-borne in situ profiling of Saharan dust over Cyprus with the UCASS optical particle counter, Atmospheric Chemistry and Physics, 21, 6781–6797, https://doi.org/10.5194/acp-21-6781-2021, 2021b. a
Lenaerts, J. T. M., Van Tricht, K., Lhermitte, S., and L'Ecuyer, T. S.: Polar clouds and radiation in satellite observations, reanalyses, and climate models, Geophysical Research Letters, 44, 3355–3364, https://doi.org/10.1002/2016GL072242, 2017. a
Lohila, A., Penttilä, T., Jortikka, S., Aalto, T., Anttila, P., Asmi, E., Aurela, M., Hatakka, J., Hellén, H., Henttonen, H., Hänninen, P., Kilkki, J., Kyllönen, K., Laurila, T., Lepistö, A., Lihavainen, H., Makkonen, U., Paatero, J., Rask, M., Sutinen, R., Tuovinen, J.-P., Vuorenmaa, J., and Viisanen, Y.: Preface to the special issue on integrated research of atmosphere, ecosystems and environment at Pallas, Boreal Environment Research, https://doi.org/10.60910/9a7c-653q, 2015. a
Masson-Delmotte, V., Zhai, P., Pirani, A., Connors, S. L., Péan, C., Berger, S., Caud, N., Goldfarb, L., Gomis, M. I., Chen, Y., Huang, M., Leitzell, K., Lonnoy, E., Matthews, J. R., Maycock, T. K., Waterfield, T., Yelekçi, O., Yu, R., and Zhou, B.: IPCC, 2021: Climate Change 2021: The Physical Science Basis. Contribution of Working Group I to the Sixth Assessment Report of the Intergovernmental Panel on Climate Change, Cambridge University Press, Cambridge, United Kingdom and New York, NY, USA, https://doi.org/10.1017/9781009157896, 2021. a
Meyer, H., Kandler, K., Dupont, S., Escribano, J., Girdwood, J., Nikolich, G., Alastuey, A., Etyemezian, V., González-Flórez, C., González-Romero, A., Hussein, T., Irvine, M., Knippertz, P., Möhler, O., Querol, X., Stopford, C., Vogel, F., Weis, F., Wieser, A., Pérez García-Pando, C., and Klose, M.: From fine to giant: multi-instrument assessment of the dust particle size distribution at an emission source during the J-WADI field campaign, Atmospheric Measurement Techniques, 19, 21–61, https://doi.org/10.5194/amt-19-21-2026, 2026. a
Open Street Map Contributors: Planet dump retrieved from https://planet.osm.org, https://www.openstreetmap.org (last access: 3 December 2025), 2017. a
Pi, R.: Raspberry Pi Zero, https://www.raspberrypi.com/products/raspberry-pi-zero/ (last access: 3 December 2025), 2025. a
Previdi, M., Smith, K. L., and Polvani, L. M.: Arctic amplification of climate change: a review of underlying mechanisms, Environmental Research Letters, 16, 093003, https://doi.org/10.1088/1748-9326/ac1c29, 2021. a
Sensirion: SHT31-DIS-B – ±2% (0–100%RH) Digital humidity and temperature sensor, https://sensirion.com/products/catalog/SHT31-DIS-B (last access: 3 December 2025), 2025. a
Sensortec, B.: Pressure Sensor BMP280, https://www.bosch-sensortec.com/products/environmental-sensors/pressure-sensors/bmp280/ (last access: 3 December 2025), 2025. a
Smith, H. R., Ulanowski, Z., Kaye, P. H., Hirst, E., Stanley, W., Kaye, R., Wieser, A., Stopford, C., Kezoudi, M., Girdwood, J., Greenaway, R., and Mackenzie, R.: The Universal Cloud and Aerosol Sounding System (UCASS): a low-cost miniature optical particle counter for use in dropsonde or balloon-borne sounding systems, Atmospheric Measurement Techniques, 12, 6579–6599, https://doi.org/10.5194/amt-12-6579-2019, 2019. a, b, c, d, e
Vavrus, S.: The Impact of Cloud Feedbacks on Arctic Climate under Greenhouse Forcing, Journal of Climate, 17, 603–615, https://doi.org/10.1175/1520-0442(2004)017<0603:TIOCFO>2.0.CO;2, 2004. a
Wolkchen: wolkchen-cirrus/UCASSDataProcessor: OPROC software for Pallas (v1.0.0-alpha), Zenodo [code], https://doi.org/10.5281/zenodo.19455847, 2026. a
Zeng, X.: Modeling the Effect of Radiation on Warm Rain Initiation, Journal of Geophysical Research: Atmospheres, 123, 6896–6906, https://doi.org/10.1029/2018JD028354, 2018. a