the Creative Commons Attribution 4.0 License.
the Creative Commons Attribution 4.0 License.
 | 09 Apr 2026
Differences in anthropogenic greenhouse gas emissions estimates explained
William F. Lamb
Robbie M. Andrew
Matthew Jones
Zebedee Nicholls
Glen P. Peters
Chris Smith
Marielle Saunois
Giacomo Grassi
Julia Pongratz
Steven J. Smith
Francesco N. Tubiello
Monica Crippa
Matthew Gidden
Pierre Friedlingstein
Jan Minx
Piers M. Forster
We examine differences in global and national greenhouse gas (GHG) emissions estimates, focusing on the role of varying system boundaries and conceptual approaches in driving these variations. Despite consensus among assessments and datasets that GHG emissions continue to increase and that trends are far from aligned with the Paris Agreement goals, estimates can differ significantly. Our review finds three main reasons for these differences. First, datasets vary in their coverage of gases, sectors and countries; second, there are different approaches to defining “anthropogenic” emissions and removals in the land use, land-use change and forestry (LULUCF) sector; and third, the Paris Agreement doesn't cover all relevant sources of emissions, including the cement carbonation sink and ozone depleting substances. As different assessments have different objectives, they may deal with these issues differently. We highlight three assessment conventions that report or use emissions data: those focused on interpreting national progress, policies and pledges under the Paris Agreement; those consistent with integrated assessment modelling (IAM) benchmarks of emissions under different warming scenarios; and those consistent with climate forcing assessments. Considering annual average emissions over the period 2014 to 2023, we show global totals of 44.4 GtCO2e yr−1 [90 % CI ± 4.9], 54.5 GtCO2e yr−1 [90 % CI ± 5.6], and 56.4 GtCO2e yr−1 [90 % CI ± 5.7] for these three conventions, respectively. We suggest that users of GHG emissions data increase transparency in their decision criteria for choosing datasets and setting the scope of an assessment. The data used in this study to make Figs. 9–14 is available at: https://doi.org/10.5281/zenodo.15126539 (Lamb, 2026).
- Article
(4094 KB) - Full-text XML
- BibTeX
- EndNote


A key indicator to assess human influence on the climate is total anthropogenic greenhouse gas (GHG) emissions. At a global level, tracking developments in this metric is necessary to evaluate progress towards the climate objectives of the Paris Agreement – including the human contribution to warming so far, the timing of peak emissions, and how fast emission reductions need to proceed in the coming decades. At the national level, tracking GHG emissions trends is instrumental to evaluating the climate policy implementation and progress.
Despite its centrality to climate and climate policy assessments, different communities report different levels and trends in total anthropogenic GHG emissions - even though all assessments show that GHG emissions have conclusively increased over the past decades, and are off track from a pathway consistent with the goals of the Paris Agreement (Forster et al., 2024; IPCC, 2022; UNEP, 2024; UNFCCC, 2022c). Nevertheless, as we will show below, global estimates of annual GHG emissions can vary by a margin of several GtCO2e. This is a phenomenon that has received increasing attention in the literature and in global assessments under the Intergovernmental Panel on Climate Change (IPCC) (Gidden et al., 2023; Grassi et al., 2023; IPCC, 2024). These differences are often related to different input datasets, different definitions and scope, as well as decisions regarding what is included in the estimates (Andrew, 2020), in addition to the underlying parametric uncertainties.
It is important to distinguish differences in emissions reporting that result from different methodologies and data sources, which can represent uncertainty and data quality in our understanding, versus those that result from alternative conceptual approaches and system boundaries. An example of the former would be the use of different emissions factors (EFs) across datasets or data versions, which provide an estimate of the emissions associated with a given activity. An example of the latter is the fact that assessments may choose to exclude certain emissions categories, for instance those from biomass fires, while others include them. In some cases, it may not be made explicit that an emission source is excluded in an assessment. In this article we are concerned with the latter kind of decisions and the fact that specific system boundary choices greatly matter for tracking GHG emissions.
There is no single agreed approach to setting the system boundaries of an anthropogenic GHG emissions assessment. Even if the same input data and emission factors are used, different communities have developed their own conventions on which categories of emissions are included in an assessment. Two of the main communities include users of national greenhouse gas inventories (used for country reporting), and the scientific communities performing mitigation analysis, integrated assessment modeling (IAM), and climate modelling. Further, national, regional and global anthropogenic GHG emissions are widely depicted in a variety of reports and the decision criteria for which components of emissions they include or exclude are often not transparent (Boehm et al., 2023; European Commission, 2024; Forster et al., 2024; UNEP, 2024; UNEP and CCAC, 2021; USGCRP, 2023).
It is critical to explain the decision criteria behind system boundary choices in emissions reporting, and to understand the consequences of these differences. Besides the fact that different published estimates lead to general confusion among non-domain experts, this issue can compromise important science-policy processes. For example, differences in land use, land-use change and forestry (LULUCF) emissions between national inventories and IAMs are highly consequential for calculating benchmarks to meet the 1.5 and 2 °C goals, including when countries should reach net-zero, or for calculating whether net-zero targets are sufficient to stabilise global temperatures (Allen et al., 2025; Gidden et al., 2023; Grassi et al., 2021). Further, there is a risk that observers start to lose trust in emissions estimates, including the official inventories published by countries, simply because they are perceived to misrepresent or exclude certain sources (Mooney et al., 2021; Yona, 2025).
In this perspective we ask three questions. First, what are the main system boundary issues causing anthropogenic GHG estimates to differ? Second, what conventions are taken in different assessment communities with respect to these system boundaries? And third, what is the possible spread in global or national GHG estimates according to these conventions? In answering these questions, we aim to explain and promote transparency in key decision criteria that lie behind GHG emissions assessments.
In terms of scope, our discussion covers the main well-mixed anthropogenic GHGs that are covered by the Kyoto Protocol, the Paris Agreement and the Montreal Protocol, including carbon dioxide (CO2), methane (CH4), nitrous oxide (N2O) and Fluorinated gases (F-gases) as well as Ozone Depleting Substances (ODS). We do not extend our analysis to other climate relevant emissions (e.g. SOx, NOx, CO, etc.), while recognizing that these too have relevant impacts on atmospheric chemistry and the climate. We also do not consider the role of global warming potential metrics, even though different choices here can obviously lead to varying estimates. We consider differences in emissions estimates primarily at the national or global level, rather than subnational levels such as gridded data or urban emissions estimates – while noting that gridded data is often needed for emission validation exercises, with spatial data also relevant in the context of wildfires and other LULUCF components. Finally, while our discussion covers anthropogenic emissions from terrestrial sources (i.e. on land), it excludes fluxes taking place on the open ocean (apart from those related to shipping) as these are generally not included in national GHG inventories or other accounts of anthropogenic emissions.
Emissions inventories form the basis for most national and global reporting of anthropogenic GHG emissions. These “bottom-up” accounts are constructed by tracking human activities in different domains (e.g., fuel use, cement production, land use transitions, livestock numbers) and estimating the expected GHG emissions or removals under different conditions (e.g. technology or climate). Combustion emissions are usually estimated by multiplying fuel use by a corresponding emission factor. Some of these accounts also depend on modelling, particularly for agricultural and land-based activities. A number of different datasets are now available and are in widespread use across the climate research community to estimate global and national GHG emissions. However, despite being well documented, there are several key reasons why studies using them can arrive at quite different estimates of global or national emissions.
2.1 Datasets vary in their coverage of gases, sectors and countries
Bottom-up datasets generally aim to cover the set of emissions sources outlined by the United Nations Framework Convention on Climate Change (UNFCCC, 2018b). In terms of gases, this includes CO2, CH4, N2O and a subset of F-gases covering hydrofluorocarbons (HFCs), Perfluorocarbons (PFCs), Nitrogen Trifluoride (NF3) and Sulfur Hexafluoride (SF6). These are often referred to in the literature as the “Kyoto gases” since they were covered under the Kyoto Protocol. In terms of sectors, national reporting to the UNFCCC includes five main categories (and many more subcategories) which sum to the total: (1) Energy, (2) Industrial process and product use (IPPU), (3) Agriculture, (4) LULUCF, and (5) Waste. Parties to the UNFCCC report their emissions according to this scope of gases and sectors, and do so using the methods, formats and conventions laid out in the IPCC Guidelines on National Greenhouse Gas Inventories (IPCC, 2006, 2019) (hereafter referred to as the “IPCC Guidelines”). Independent inventories outside of the UNFCCC process use similar methods, but often using simplified or harmonised assumptions across countries to ensure consistency and comparability.
The IPCC Guidelines define emissions and removals as “taking place within national territory and offshore areas over which the country has jurisdiction”. This means that emissions and removals are allocated to where they occur, though, there are exceptions discussed below. Many countries also have jurisdiction over some ocean areas (e.g., Exclusive Economic Zones, EEZ), and if these emissions and removals are anthropogenic, then they are in principle included. Anthropogenic emissions and removals in areas that are not allocated to a country, primarily international aviation and shipping, are reported as a memo called “bunkers”, and not included in country totals in most inventories, though exceptions exist.
The national GHG inventories that parties submit to the UNFCCC cannot currently be used to make a complete assessment of global emissions. While they do, in principle, cover all “Kyoto gases” and all sectors, reporting tends to be sporadic for all but Annex I (essentially developed) countries. Parties are guided to submit an annual time series starting in 1990, reporting emissions up to two years prior, which would cover many use cases (UNFCCC, 2018b). However, in practice the UNFCCC recognises that parties have different capabilities and statistical infrastructures, and has made a series of allowances for non-Annex I parties: they have the flexibility to report three gases (CO2, CH4, N2O) instead of all seven (i.e. they may exclude F-gases); they may report annual time series from 2020 onwards instead of from 1990; and they may do so up to three years prior instead of two (UNFCCC, 2018b, chaps. 48, 57 and 58). The Biennial Transparency Reports have improved the frequency of inventory reporting, but still make allowances for Least Developed Countries and Small Island Developing States to submit at their discretion. As a result, national GHG inventories are typically only complete and timely for Annex I countries from 1990 onwards, covering about one-third of total world emissions.
Consequently, third-party datasets produced by researchers and international institutes are frequently used to report global or national totals, including trends before 1990. These third-party datasets usually explicitly follow the inventory conventions for sectors and coverage of gases, but make use of national statistics for activity data and independently assessed emissions factors, often based on general default values (also known as “Tier 1” estimates). Key global datasets that cover multiple sectors and gases with a global scope include: the Emissions Database for Global Atmospheric Research (EDGAR) (Crippa et al., 2024; Janssens-Maenhout et al., 2019); the Community Earth atmospheric Data System (CEDS) (Hoesly et al., 2025); and the PRIMAP-hist national historical emissions time series (PRIMAP-Hist) (Gütschow et al., 2025). Some data sets focus on specific GHGs or sectors, including the Global Carbon Project's (GCP's) Global Carbon Budget (GCB) (Friedlingstein et al., 2025b), Global Methane Budget (Saunois et al., 2025) and Global Nitrous Oxide Budget (GNB) (Tian et al., 2024); the Energy Institute's Statistical Review of World Energy (EI – formerly published by BP) (Energy Institute, 2025); the International Energy Agency (IEA) GHG Emissions from Energy dataset (IEA, 2024), and the Food and Agriculture Organisation of the UN (FAOSTAT) Greenhouse Gas Emissions dataset (FAO, 2025b).
Several further useful datasets include the gap-filled and harmonised dataset of LULUCF data based on National GHG inventories (JRC-NGHGI) (Melo et al., 2025); the Greenhouse Gas and Air Pollution Interactions and Synergies (GAINS) dataset of methane emissions (Höglund-Isaksson et al., 2020); the Global Fire Emissions Database (GFED), the Global Fire Assimilation System (GFAS), and the Global Wildfire Information System (GWIS) for fire emissions (Giglio et al., 2013; GWIS, 2025; Kaiser et al., 2012; van der Werf et al., 2017); Andrew (2025) for cement-process emissions; and inversion datasets for ODS and F-gas emissions (Forster et al., 2024; Velders et al., 2015; WMO, 2022).
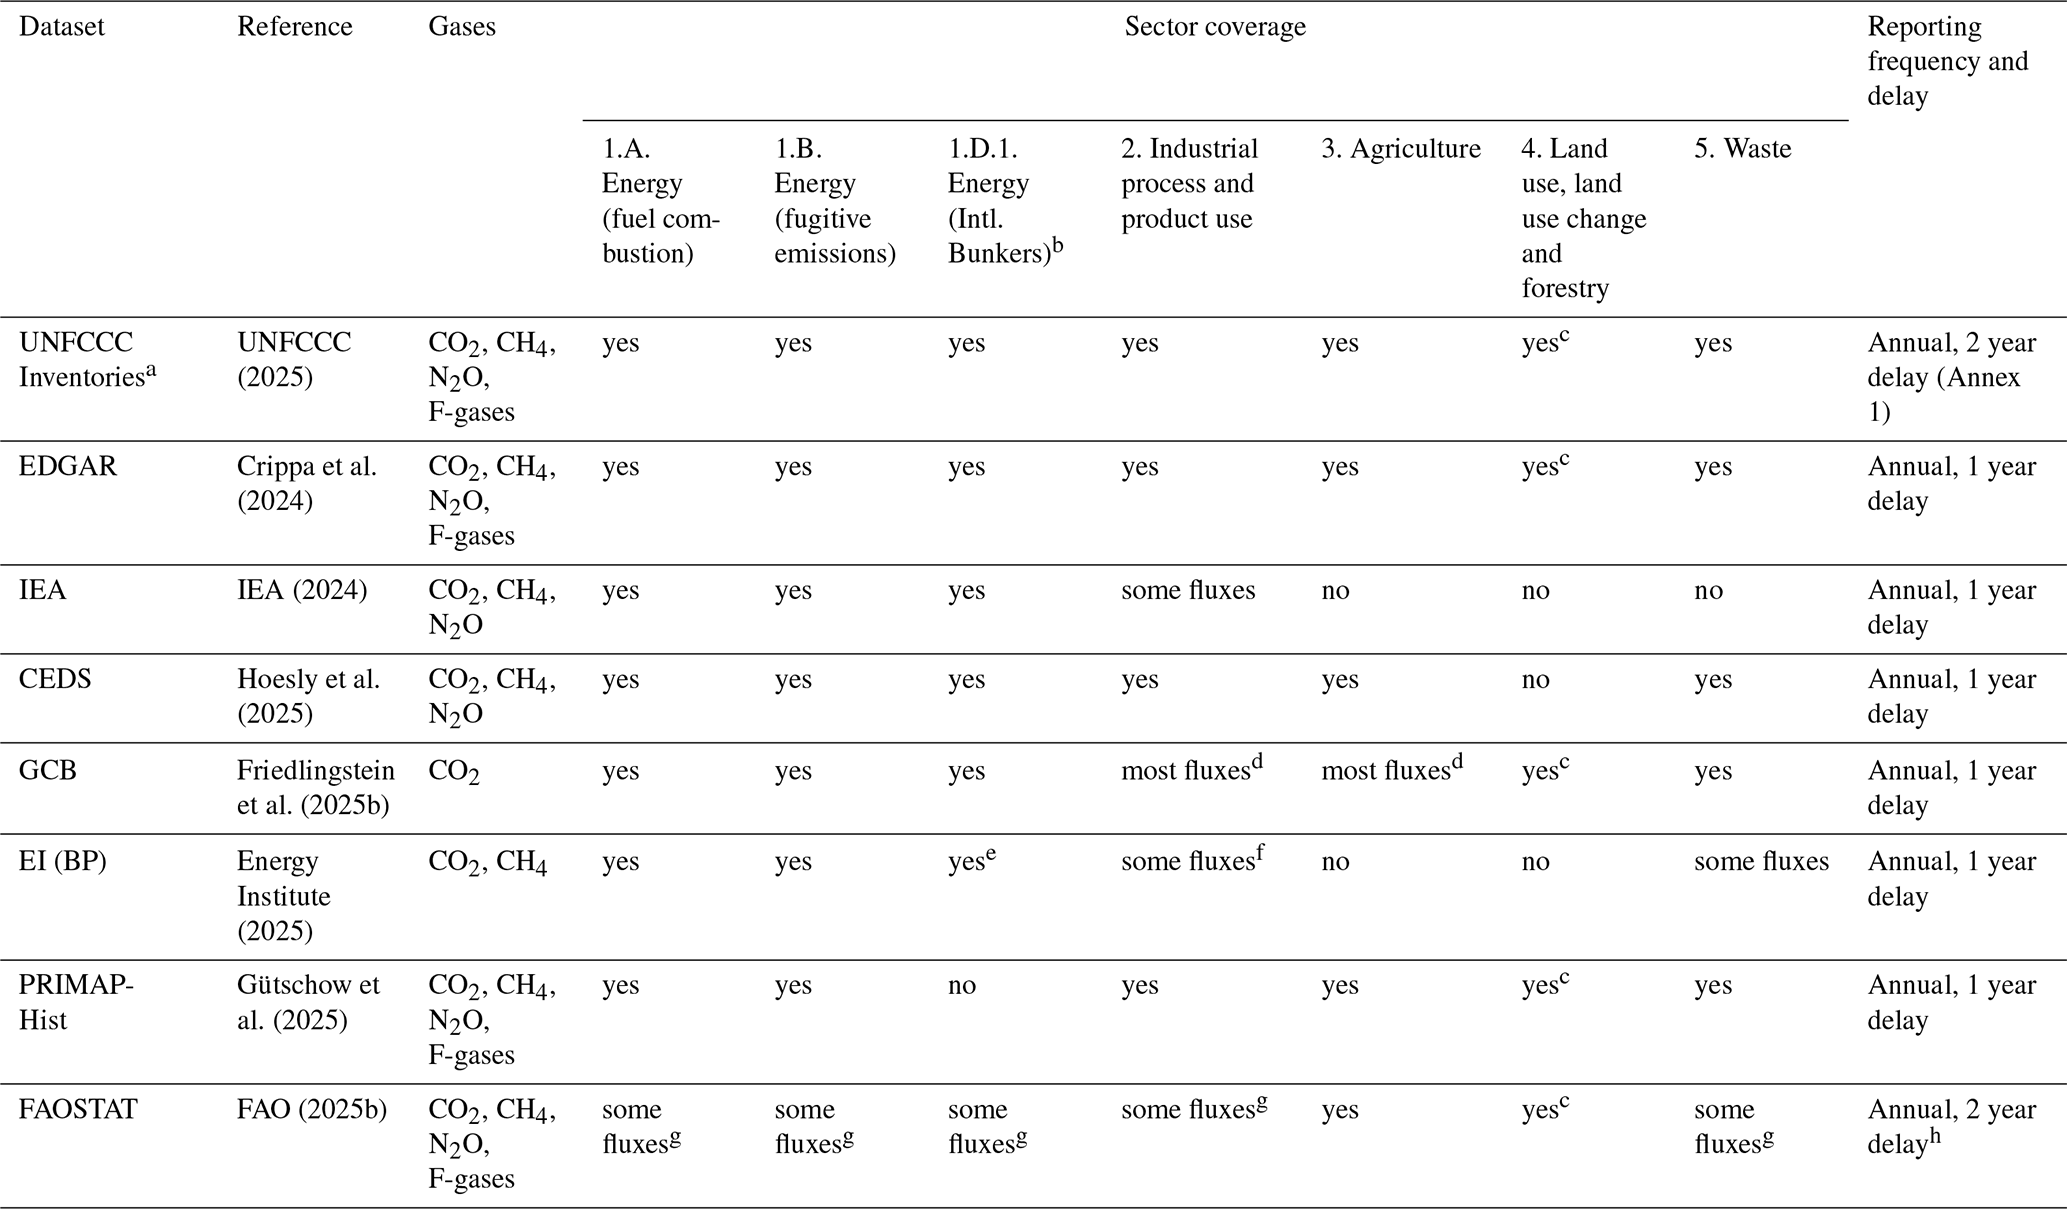
Third-party datasets are useful to track global, national, and sectoral trends, over long-time periods, and provide independent checks against official NGHGI reporting to the UNFCCC. However, their appropriate use is complicated by several issues. The first is that, as it stands, no single third-party dataset has complete and up-to-date coverage of all UNFCCC relevant gases, sectors and countries (Table 1). Only two datasets cover all GHGs in the convention (EDGAR and PRIMAP-Hist) and while many cover agriculture, most exclude LULUCF emissions, though EDGAR now includes JRC-NGHGI. Only two datasets cover global emissions of non-CO2 LULUCF emissions (FAOSTAT, PRIMAP-Hist). To obtain a complete global or national total across all gases it is therefore often necessary to combine multiple datasets.
Table 1Bottom-up emissions datasets of anthropogenic GHG emissions and their characteristics. Several subcategories of the energy sector are shown to highlight their exclusion in some datasets. Datasets are named and referenced in Sect. 2.1. Notes: a Only Annex I countries reliably submit complete inventories each year. b Bunkers are included as a memo item in UNFCCC inventories (excluded from national totals), and typically as a separate “country” in other datasets. c Definitions of LULUCF differ, as discussed in Sect. 2.2. d For some countries, excludes lime, glass and other decomposition in sector 2, and liming in sector 3. e Included in national totals and not reported separately. f Includes cement only. g FAO includes agrifood system emissions across all sectors, and separately a version of the PRIMAP-Hist database for non-agrifood sectors. h Currently FAOSTAT is at T-0 for forest emissions and regularly at T-1 for peatland drainage and fire emissions. Adapted from Andrew (2020). Note that PRIMAP-Hist includes two datasets (Hist-CR and Hist-TP), which prioritise data from national inventories and third-party sources, respectively.
Second, due to different formats, overlaps between datasets, and varying methodological approaches, it is generally advised to take care when combining them. Each dataset is not necessarily like-for-like; EDGAR for example often applies global average emission factors (Tier 1) while most UNFCCC Annex I countries apply national emission factors and/or models (Tier 2 or 3), which can lead to differences in emission levels and trends, particularly at the national level and for non-CO2 GHGs. Further, individual datasets have different approaches to dealing with certain sectors. For instance, in the case of emissions from bunker fuels (international aviation and shipping): the national GHG inventories report these as a memo item for each country (i.e., excluded from national totals); CEDS, IEA, EDGAR and GCB report these as a single stand-alone quantity which can be interpreted as a memo, but is often allocated to global totals; EI includes these in national totals; and PRIMAP-Hist excludes them entirely. Differences in accounting for emissions and removals in the LULUCF sector are even more consequential, as discussed in the next section.
Third, there can be significant dependencies between datasets (Andrew, 2020). Even though many datasets rely ultimately on activity data reported by the IEA, the UN Statistics Division (UNSD), EI and FAOSTAT, these data can have different levels of details and can be applied differently (for example, in a sector or reference approach, Tier 1 or Tier 3, etc). For example, the PRIMAP-Hist dataset is an amalgamation of several underlying data products, with two individual time series: the “CR scenario”, which prioritises national GHG inventory data and gap fills these with third-party data (EI, Andrew, FAO, EDGAR); and the “TP scenario”, which prioritises the latter third-party data. Conversely, the FAOSTAT GHG emissions dataset has begun to incorporate UNSD and PRIMAP-Hist data for energy, IPPU and waste emissions. Changes in underlying datasets can therefore cascade across many of the datasets we discuss here.
A further complication is that dataset methodologies can carry implicit system boundary decisions. For instance, the IPCC Guidelines on National Greenhouse Gas Inventories (IPCC, 2006, 2019) take a territorial approach, but recommend at Tier 1 the use of fuel sales data to calculate road transport emissions. Since fuel use is transboundary in nature, this means that large discrepancies can be observed between the Tier 1 inventory approach and higher Tier datasets that apply a more refined territorial principle (i.e. using modelling studies to estimate fuel consumption within a country) (e.g. BMK, 2023). Likewise, the IPCC Tier 1 methodology for Harvested Wood Products (HWPs) follows the so-called production approach and explicitly assumes that end-of-life emissions from traded HWPs occur within the country from which they were exported, rather than in the importing country (IPCC, 2019). Assuming all countries follow the same principle, then these differences will balance out at the global level, but can lead to significant inconsistencies between and within datasets for countries that have large trade flows in biomass products in particular.
Together, these issues mean that dataset choices matter, and that assessments often have to combine different datasets to gain totals that are comparable to the scope of national GHG inventories. Further, this requires caution due to potential overlaps and conceptual differences between datasets.
2.2 There are different approaches to defining “anthropogenic” emissions
A second issue affecting comparability in emissions assessments is that different communities and datasets have different approaches to estimating or even defining “anthropogenic” emissions and removals (together: fluxes). Specifically, this issue arises in connection with GHG fluxes in terrestrial ecosystems (e.g. forests and wetlands), where a given area of land can be influenced by three main types of effects: (1) direct anthropogenic effects, such as changes in land use (e.g. deforestation or crop abandonment) and various types of management practices; (2) indirect anthropogenic effects, which include environmental changes caused by humans, like alterations in temperature, precipitation, CO2 levels, and nitrogen deposition which can impact growth rates, mortality, decomposition, and natural disturbance patterns; and (3) natural effects, including climate variability and inherent natural disturbances such as fires and pests (Grassi et al., 2018; IPCC, 2019). The definitional difficulties arise with the second category of “indirect anthropogenic” effects, such as when increased atmospheric CO2 concentrations (resulting from anthropogenic emissions) influence forest growth and lead to increased removals.
The separation of direct anthropogenic, indirect anthropogenic, and natural sources of emissions is conceptually challenging and can be difficult to communicate to users of emissions data. Here we cover three of the main areas of emissions accounting where indirect anthropogenic effects arise, all of which occur in the LULUCF sector of national inventories, but also to some degree in the agriculture sector.
2.2.1 Forest land CO2
CO2 emissions and removals on forest land in the LULUCF sector are generally complex, difficult to track and involve significant uncertainties, but are nonetheless highly consequential for global estimates of GHG emissions. Like land-use related CO2 fluxes in general, forest fluxes share the complexity that they require modeling or other assumptions to distinguish anthropogenic from other drivers and vary concerning completeness of land-use activities represented, which contributes to large discrepancies between the various modeling and observational approaches (Obermeier et al., 2025). There are two main approaches to account for forest land fluxes: the approach developed by the IPCC guidelines and implemented in the national GHG inventories and the FAOSTAT emissions dataset, and the global bookkeeping model approach, such as the one implemented by the carbon cycle community and the Global Carbon Project. Both track changes between different types of land use (e.g. forest land, cropland, grasslands, settlements, other land) and how they influence various carbon stocks (e.g. living biomass, soil organic matter, etc.). However, they differ conceptually in one important respect: how they estimate the anthropogenic component of emissions and removals (Grassi et al., 2018, 2021, 2023; IPCC, 2024; Schwingshackl et al., 2022).
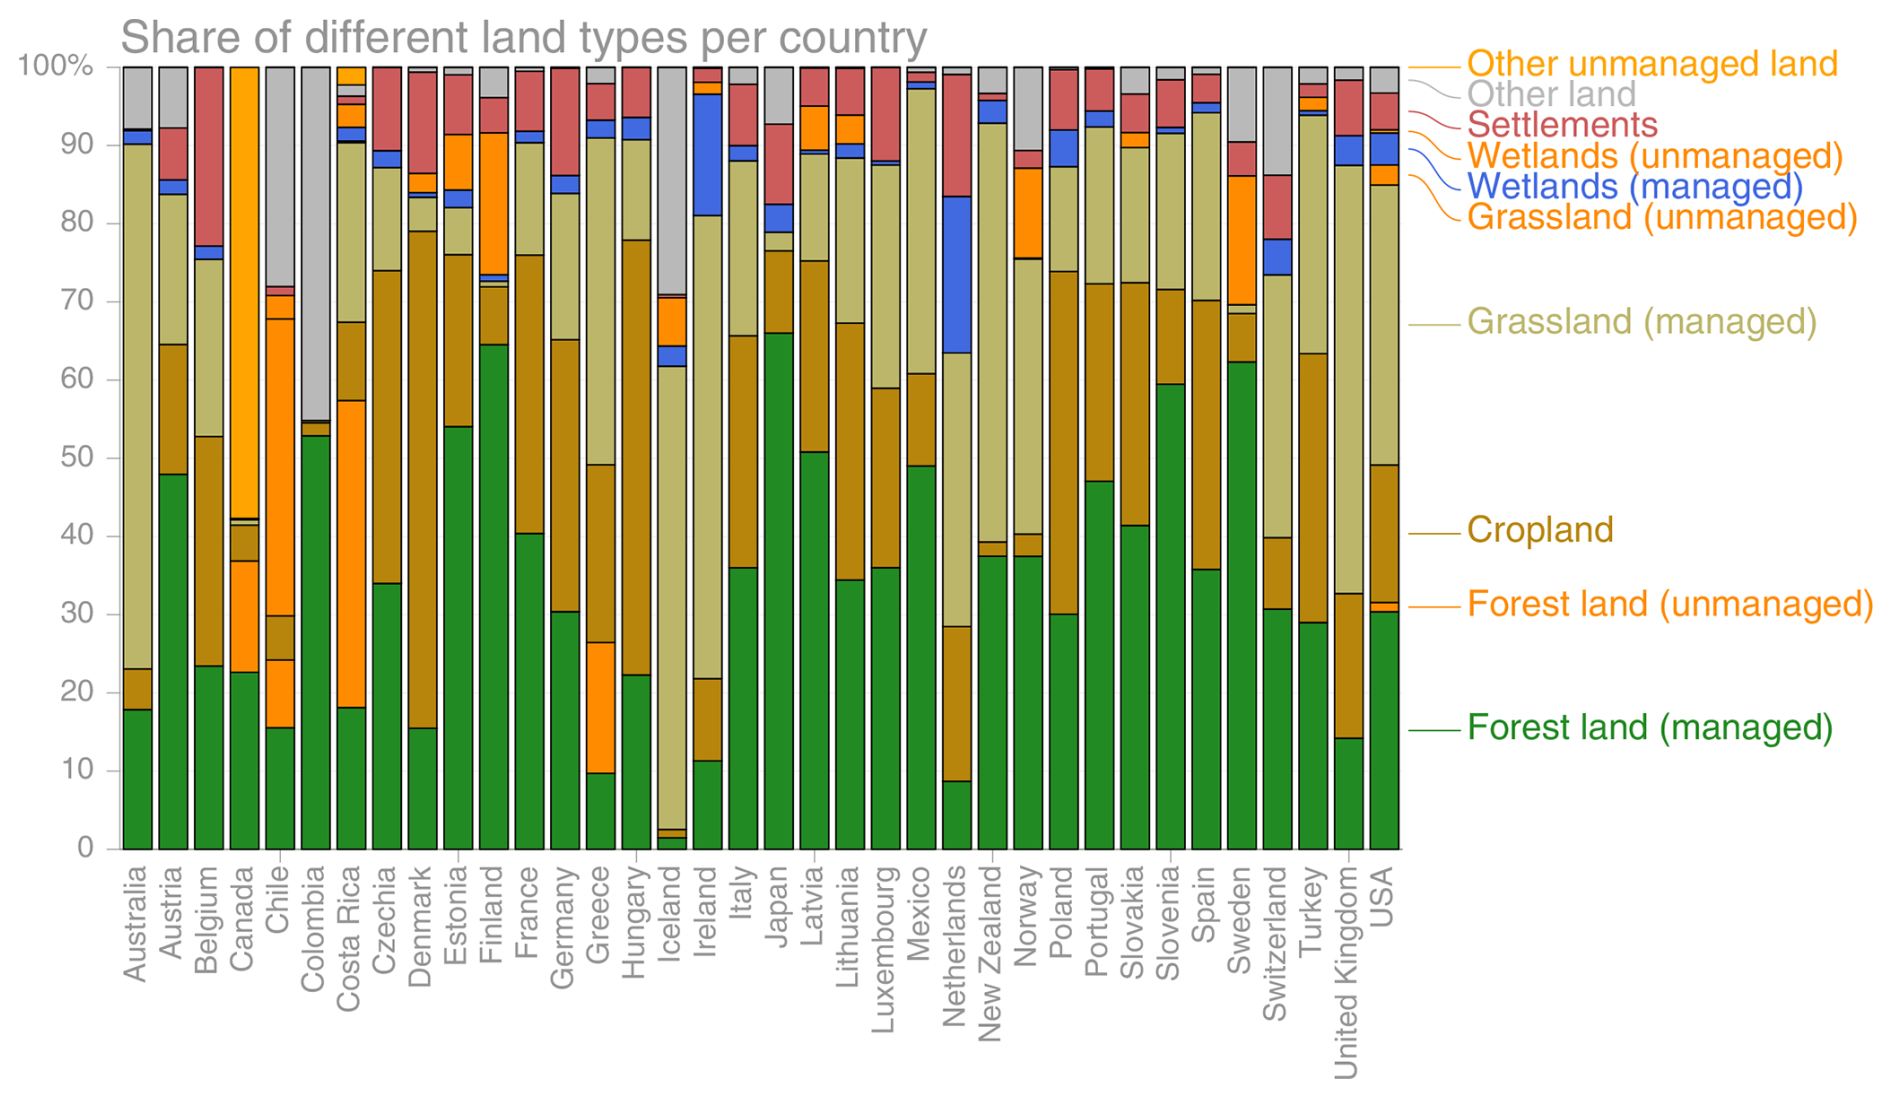
The national GHG inventory approach is primarily survey-based and pragmatically counts all fluxes on “managed land” as anthropogenic, including both direct and indirect anthropogenic effects. Simply put, countries estimate – in line with national definitions – which areas of land are “managed” in their inventories; track this area consistently over space and time; and compute the resulting fluxes as anthropogenic. All other areas and fluxes are treated as unmanaged and hence natural, and no GHG emissions or removals are reported. This convention was used as it is not easy to separate direct anthropogenic and indirect anthropogenic effects (Canadell et al., 2007; IPCC, 2006; Pongratz et al., 2021). A consequence of the inventory approach is that the quantified fluxes depend critically on the definition of “managed land”. Conventionally, “managed land” is defined in a broad sense to include land that “perform[s] production, ecological, or social functions” (IPCC, 2006, 2024). In addition to cropland, and managed forests, this may include large areas of national parks, indigenous lands or areas subject to fire-protection activities, among others (Grassi et al., 2018; Ogle et al., 2018). In the case of forests, most Annex I countries report all their land as managed (Fig. 1). Thus, in most Annex I countries, all carbon fluxes on land are considered anthropogenic, whether they are direct or indirect effects.
Even within the national GHG inventory approach, important differences may arise due to use of different IPCC tier methods, despite similarities in the land use approach. These include the Tier 1 “gain-loss” method (estimating fluxes due to deforestation, harvest, regrowth, etc.) and the Tier 3 “carbon stock change” approach (deriving fluxes from changes in biomass stocks over time). While many country inventories, including some of those used as input into the JRC-NGHGI dataset, apply gain-loss, the FAOSTAT forest data in LULUCF are estimated using the carbon stock difference approach, using country data from the FAO Forest Resources Assessment (Tubiello et al., 2025, 2021). The application of one of the two methods brings differences in input datasets and their quality. Additional important differences between JRC-NGHGI and FAOSTAT stem from more complete coverage of sources in the former, including soils stocks, whereas the latter excludes fluxes from the soil carbon pool (Grassi et al., 2022; Tubiello et al., 2025). In particular, the forest sink is underestimated in FAOSTAT compared to JRC-NGHGI, in countries where the underlying carbon stock data is incomplete. This issue has been largely resolved due to data quality improvements in the Global Forest Resources Assessment 2025 update (FAO, 2025a).
The carbon cycle community takes a different approach to defining anthropogenic fluxes on land. Bookkeeping models are used to quantify fluxes that are the result of direct human intervention (e.g. deforestation, harvest, regrowth) (Houghton, 1999) and exclude, by simulation, those that are natural responses to human-induced environmental changes (i.e. indirect effects) – the most important of which is the increase in vegetation growth due to rising atmospheric CO2 concentrations. The bookkeeping approach is independent of definitional choices related to the managed land area, as it distinguishes natural from anthropogenic fluxes not by area, but by driver (whether or not there is land-use activity). This means that implicitly all land is considered, independent of a definition of being managed or not, but fluxes only occur when land management or land-use change as defined by the models take place. Recent developments now allow the indirect fluxes of areas of land-use change to be included together with the direct flux (Friedlingstein et al., 2026).
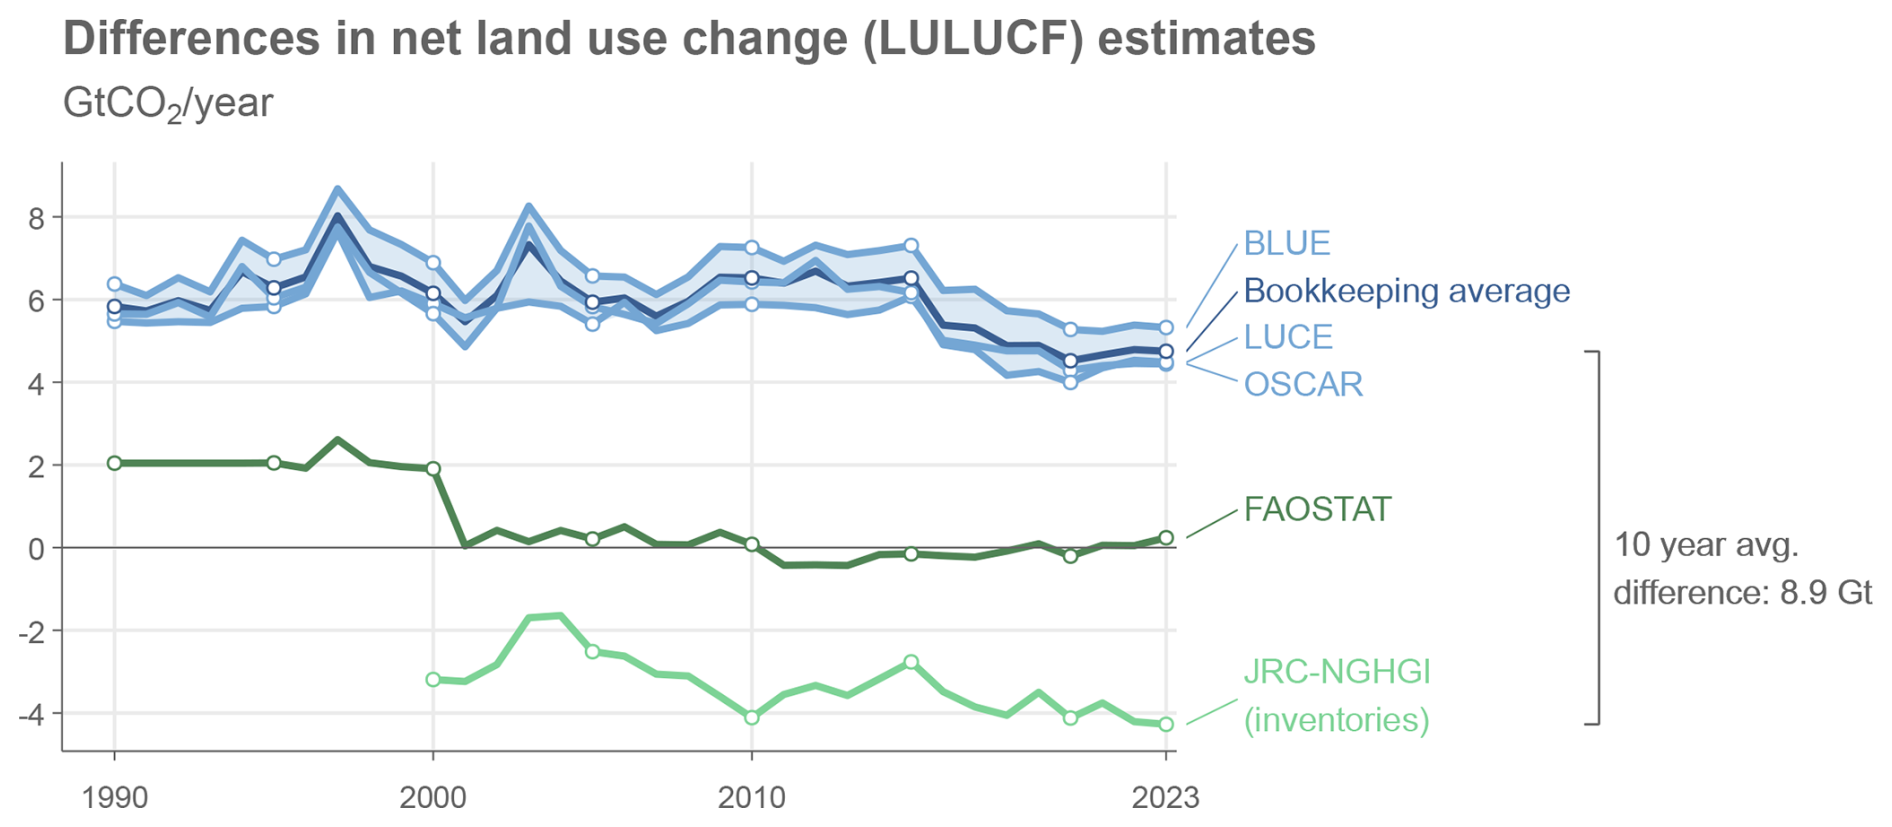
Figure 2Differences in net land use change (LULUCF) estimates. Data: bookkeeping models BLUE, OSCAR, H&N and their average from Friedlingstein et al. (2025b); FAOSTAT from FAO (2025b) and Tubiello et al. (2025); Inventories from JRC-NGHGI (Melo et al., 2025). Composite data based on inventories and FAO are also available in PRIMAP-Hist, but not shown here.
The result of these conceptual differences is a gap of about 8.9 GtCO2 yr−1 between inventory and bookkeeping estimates of LULUCF CO2 emissions (10 year average up to 2023, see Fig. 2). There are now methods to “translate” between these two approaches (Friedlingstein et al., 2025b; Grassi et al., 2018, 2023; Schwingshackl et al., 2022) – using a proxy map of countries' managed forest – with the results documented in the JRC LULUCF data hub (Melo et al., 2025). This large difference has diverse consequences for global benchmarks of mitigation action (Gidden et al., 2023; Grassi et al., 2021), and could also have important equity implications. Thus the simple choice of national GHG inventory versus GCB data for the LULUCF sector – keeping everything else constant – can significantly affect global GHG estimates. To this regard, the IPCC (2025a) has indicated in the outlines of its AR7 reports that estimates and scenarios for human-induced, land-based CO2 fluxes will need to consider alignment with national inventory definitions.
2.2.2 Natural disturbances
Fires and other disturbances occur on land, including the managed lands covered by national GHG inventories, and can generate significant emissions of CO2, CH4 and N2O. To illustrate, an estimated 8.8 GtCO2 was released in March 2023–February 2024 fire season, including extreme wildfires in Canada that were around 3 times more likely due to anthropogenic climate change (Jones et al., 2024b). In a stable fire regime, the vegetation on burnt areas generally recovers in subsequent years, drawing down CO2 from the atmosphere during the recovery phase. In principle, this suggests that fire emissions could have a net zero impact on atmospheric CO2 emissions over multiple decades under a natural fire regime (Yue et al., 2016). However, observed increases in the extent and severity of fires under climate change point to shifts in fire regimes that ultimately lead to more disturbed landscapes that store less carbon (Cunningham et al., 2024; Jones et al., 2024a).
The key problem with fires is that although they can occur naturally, they are now more likely than in the pre-industrial period due to anthropogenic climate change. This leads to major definitional obstacles to separating “anthropogenic” from “natural” fire emissions. The distinction is further complicated by the mixture of anthropogenic and natural (lightning) ignitions that occur. Anthropogenic ignitions are themselves complicated because some fires are deliberately set to clear land for agriculture or for land management purposes, or are simply the result of arson, whereas others are unintentional (e.g. power infrastructure failure or dropped cigarettes). Today's anthropogenic ignitions must also be viewed within the context of historical rates of ignition by people, which is challenging due to poor constraints on pre-industrial fire use which lead to unreliable counterfactuals. These many complications lead to different interpretations of how fires should be accounted for in global GHG budgets. Despite this, there is a large literature and community studying fires, and numerous satellite-driven observational datasets that are used across different approaches (Giglio et al., 2013; GWIS, 2025; Kaiser et al., 2012; van der Werf et al., 2017).
In the national GHG inventories, including FAOSTAT (Prosperi et al., 2020), CO2, CH4 and N2O emissions from fires and controlled burning (e.g. of crop residues, prescribed burning, and savannahs) are reported in the agriculture and LULUCF sectors (with the CO2 emissions from some components disregarded on the assumption of equivalence between emissions and removals). In the LULUCF sector, countries either explicitly report burnt areas and their associated emissions, or they implicitly report these events in their net account of forest biomass stock changes. As discussed in the prior section, the inventories follow an area-based approach and account for all types of fires on managed land – whether they were ignited by anthropogenic or natural means, and regardless of how anthropogenic climate change has influenced their odds. In terms of reporting however, there is an important difference: in accordance with decision 18/CMA.1 chap. 55 (UNFCCC, 2018b), countries may choose to report “wildfire” events as a “natural disturbance” memo item, and exclude the associated emissions and subsequent removals from their national totals and related climate targets. So far, Australia and Canada have made use of this convention in their inventories, significantly altering the sum total of reported annual anthropogenic emissions estimates and their trends (Fig. 3). In principle, the underlying assumption in this rule is that these natural disturbance exclusions would be carbon neutral with respect to subsequent regrowth in post-fire years.
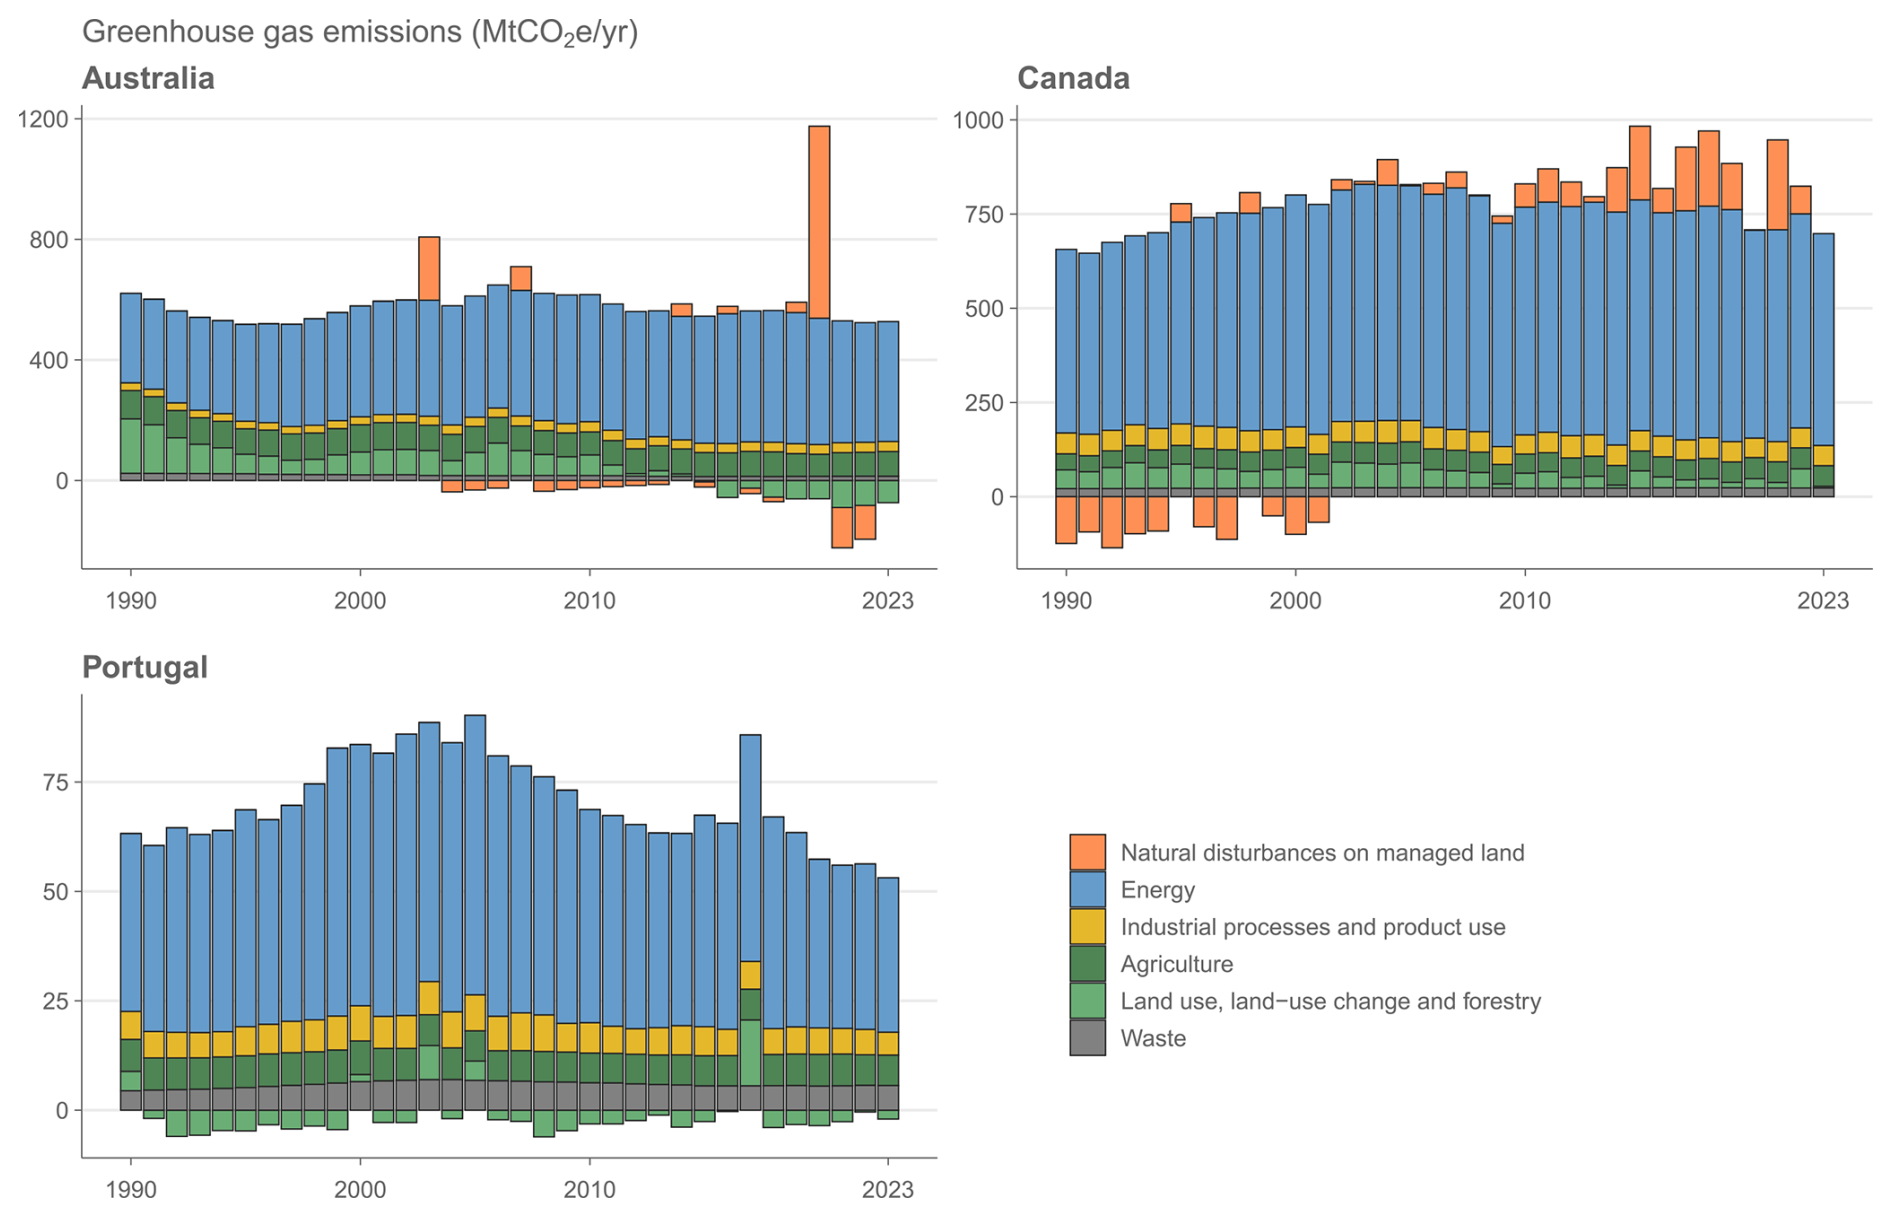
Figure 3Alternative approaches to accounting for wildfires in national GHG inventories. Australia and Canada report wildfires as the memo “natural disturbances on managed land” and exclude these emissions and subsequent removals from their totals. Note that Canada started to count natural disturbances before 1990 and therefore has excluded removals in the early 1990s that occurred on previously burnt areas. Other countries have so far not used the natural disturbances memo and instead report and account for wildfires on managed land in the LULUCF sector, even in years with major events – such as Portugal in 2017. Data: National GHG inventories compiled by Lamb (2025).
By contrast, the GCB takes a strict interpretation of “anthropogenic”, with CO2 emissions from fires associated with anthropogenic (land-use and land management) activities included implicitly in the estimate of land-use change fluxes as part of the fluxes representing fast release of carbon to the atmosphere (as opposed to slower decomposition of material on site or as products). As the GCB defines land-use change fluxes by driver (land-use activity), these fires are often related to deforestation and shifting cultivation activities that free up land for anthropogenic use. Emissions from wildfires related to anthropogenic global warming or vegetation productivity changes are not considered as part of the land-use change fluxes, but rather as an emission term in the land sink. However, a change in climate may increase the odds that agricultural management or forest clearing fires escape and have a larger than “intended” effect (Silva Junior et al., 2020). This can be observed in, for example, high land-use emission estimates associated with peat drainage and fires in dry El Niño years. These synergistic terms of direct and indirect drivers are included in the GCB land-use change fluxes as part of peat drainage and peat fire emissions. Problematically, the poor representation of the spatial distribution and trends of global fires by dynamic global vegetation models (Jones et al., 2022; Kloster and Lasslop, 2017), as well as major fire emissions anomalies such as those linked to Canada's wildfires of 2023 or Australia's Black Summer bushfires of 2019/20, leads to missing fluxes of CO2 in estimates of the global land sink and likely contributes to an imbalance in the global budget (Friedlingstein et al., 2025a; Sitch et al., 2024).
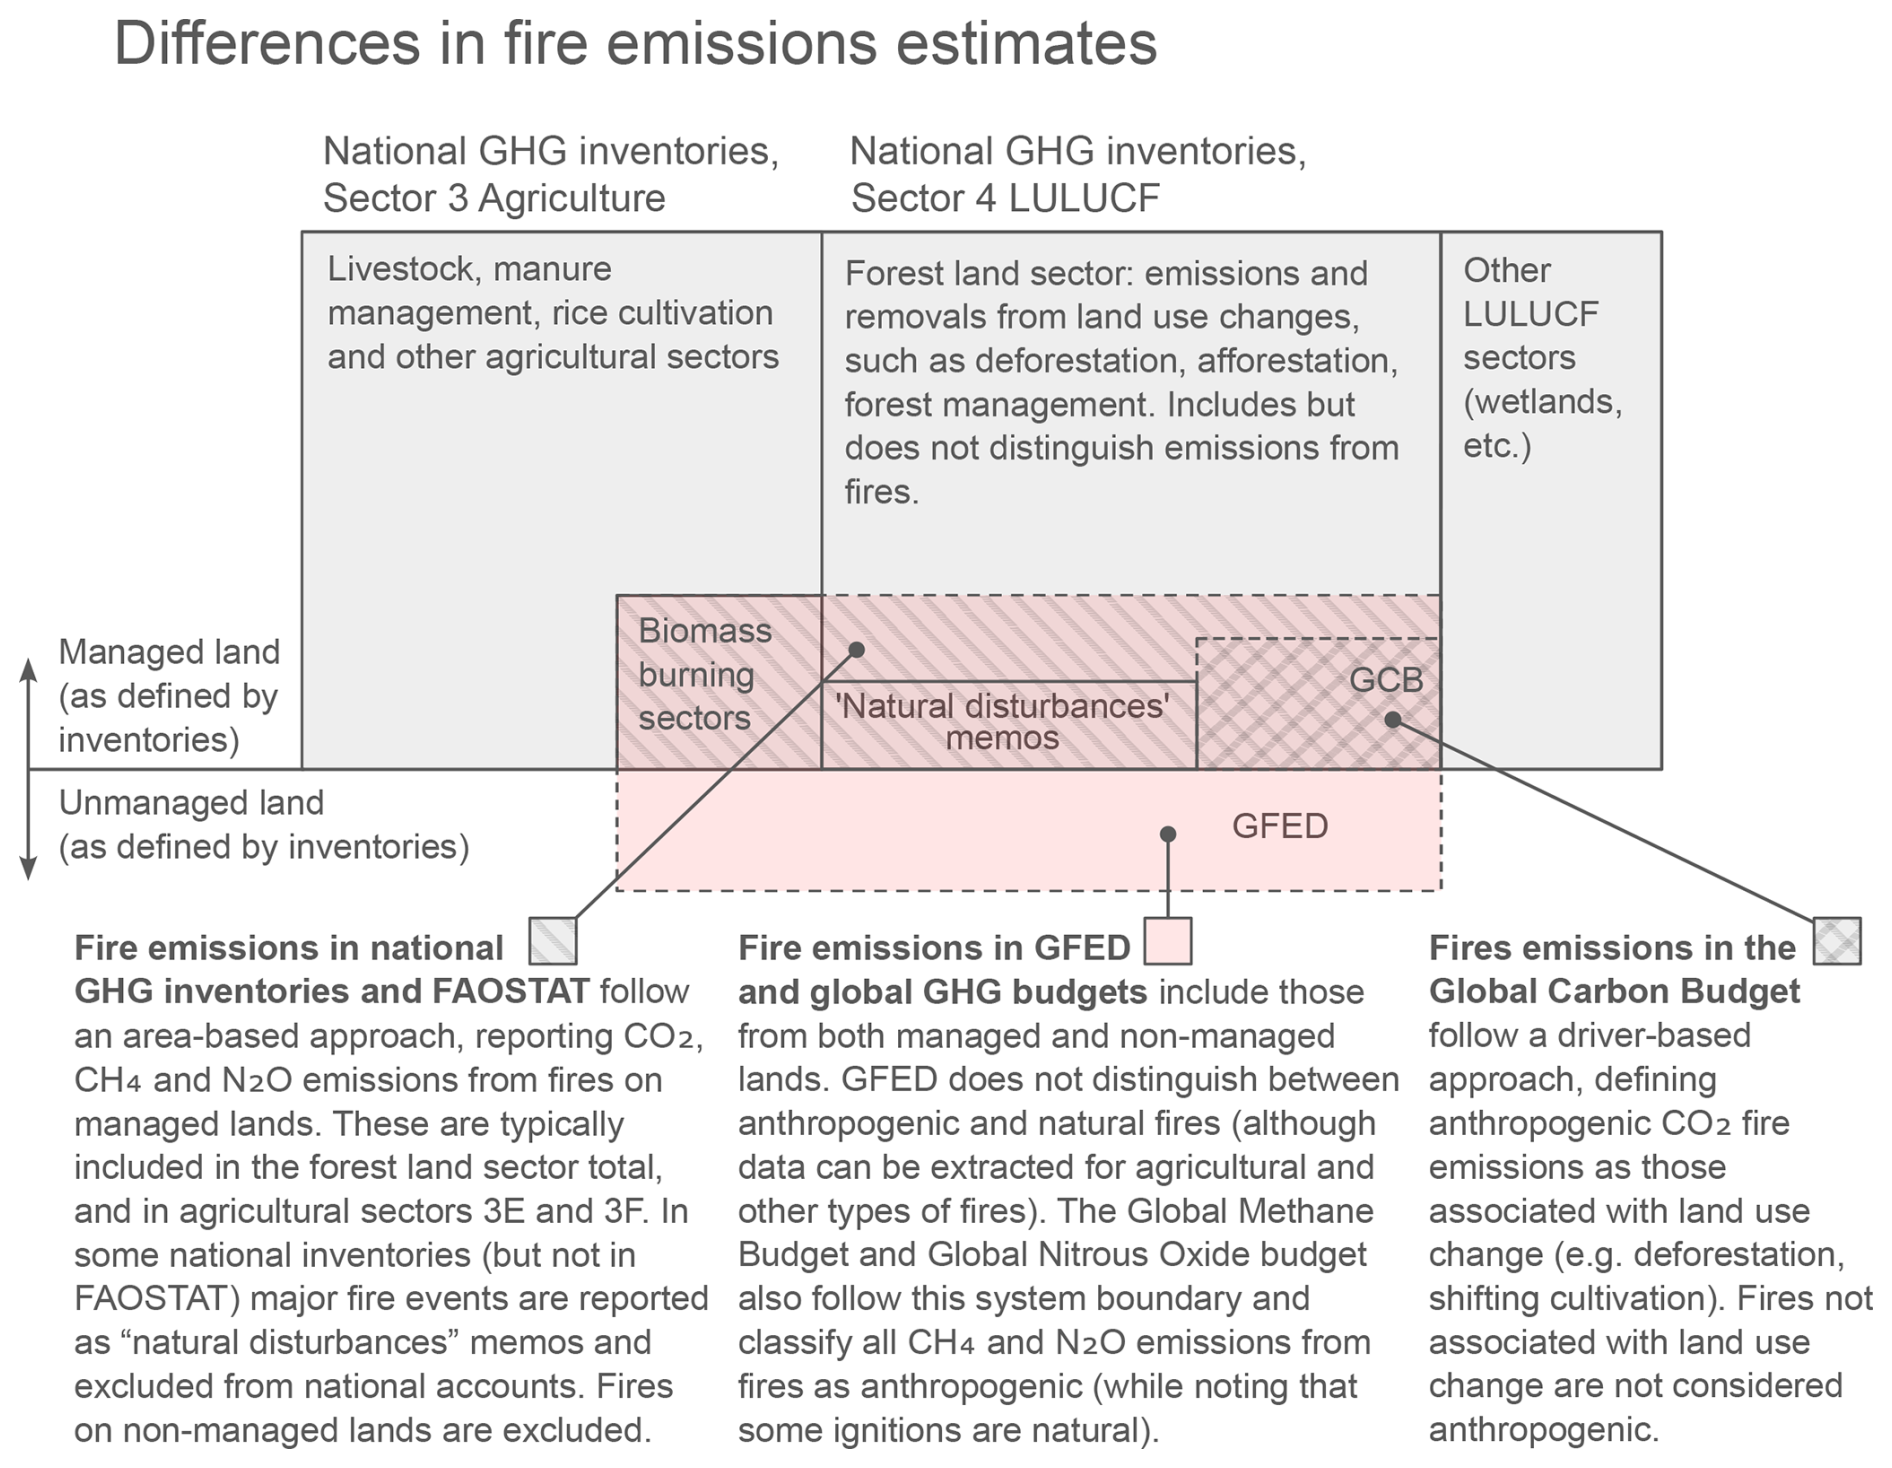
Figure 4Differences in fire emissions accounting. Note: box areas are not representative of total fluxes in each component.
A third approach to accounting for fire emissions is represented in the Global Methane and Nitrous Oxide Budgets (Saunois et al., 2025; Tian et al., 2024), as well as in the FAOSTAT approach (Prosperi et al., 2020) which as in the other cases typically draw from satellite-driven observational datasets such as GFED or GFAS but do not distinguish between anthropogenic and natural fires, nor between managed and non-managed land areas (although the GFED database categorises fires as agricultural, deforestation and other types). In the Methane and Nitrous Oxide budgets these are known as “biomass fires” and to date have simply been accounted as fully anthropogenic in the totals. Figure 4 summarises the three different approaches to accounting for fire emissions. Total annual CH4 and N2O emissions from fires are significant at approximately 0.75 GtCO2e yr−1 but with a highly variable trend (Fig. 5).
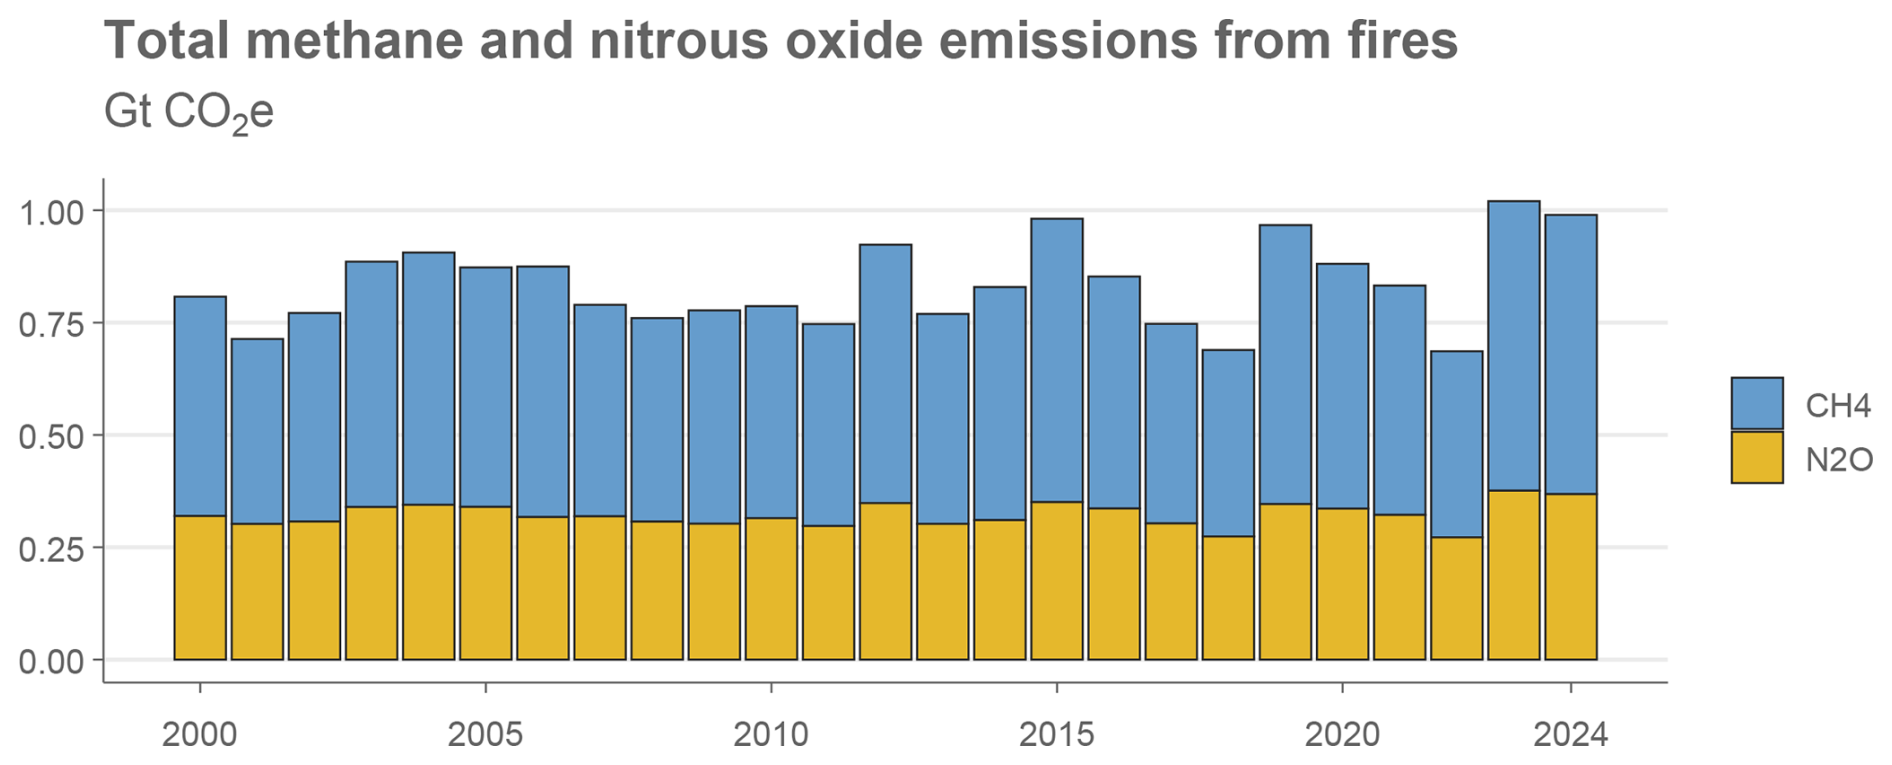
Figure 5Global methane and nitrous oxide emissions from fires. Data: GFEDv5.1 (van der Werf et al., 2025). CO2e emissions are calculated using GWP100 from AR6 WGI chap. 7 (Forster et al., 2021).
2.2.3 Wetlands and freshwater body methane emissions
A range of different landscapes and land use types produce large quantities of CH4 emissions via the anaerobic decomposition of organic matter. These include wetlands (e.g. peatlands, bogs, marshes) as well as freshwater bodies (reservoirs, canals, ponds, etc.). For both of these together, the Global Methane Budget reports decadal (2010 to 2019) average emissions of 248 [159 to 369 min–max] MtCH4 yr−1 or 6.9 [4.4 to 10.3] GtCO2e yr−1 (Saunois et al., 2025). In addition, N2O emissions are produced by peatland drainage. However, as in other areas of land use, there are major definitional obstacles to determining the anthropogenic component of these emissions, for example due to nutrient runoff into natural systems, as well as the influence of climate change on them.
In the national GHG inventories, methane emissions from wetlands and freshwater bodies both fall under the LULUCF “wetlands” sector where they are restricted to managed areas of peatlands, and flooded lands resulting from artificially constructed water bodies such as reservoirs, canals, ditches and ponds. The IPCC guidelines, under the basic (Tier 1) approach, consider that methane emission changes on managed peatland are insignificant due to drainage, effectively excluding these emissions. For flooded lands, the IPCC guidance now covers methane emissions resulting from constructed water bodies and provides default emission factors based on latitudinal region to be applied to the created flooded surface. As in the case of forest land fluxes and natural disturbances, emissions from unmanaged wetlands are not estimated nor included. FAOSTAT covers only CO2 and N2O emissions from peatland drainage following IPCC 2019 guidelines (Conchedda and Tubiello, 2020).
The Global Methane Budget and the wider scientific community estimate wetland emissions separately based on biogeochemical models driven by the so-called wetland extent. Major uncertainties arise from difficulties in determining the extent of these areas, for example because they are under vegetated cover, or because they are in close proximity to other ecosystem types. Individual studies have estimated global emissions from reservoirs (e.g. Harrison et al., 2021; Johnson et al., 2021), rivers and streams (e.g., Rocher-Ros et al., 2023) and lakes and ponds (e.g. Johnson et al., 2022; Zhuang et al., 2023), which are classified as inland freshwater ecosystems in the Global Methane Budget.
Wetland and freshwater body emissions are typically classified as natural sources, even though some are artificially constructed and managed (e.g. reservoirs and farmer ponds), or are exposed to indirect anthropogenic disturbances such as eutrophication, erosion and runoff of agricultural landscapes, as well as warming. An attempt was therefore made to distinguish anthropogenic and non-anthropogenic emissions in the latest Global Methane Budget, suggesting that about half (56 of 112 Tg CH4 yr−1 or 1.6 GtCO2e yr−1) of freshwater emissions can be classified as indirect anthropogenic emissions. Further, about 30 Tg of 159 Tg CH4 yr−1 or 0.8 GtCO2e yr−1 of wetland emissions are considered as anthropogenic disturbances, due to restoration activities and climate feedbacks. Since few studies have estimated anthropogenic disturbances of wetland and inland freshwater emissions, such values should be taken with caution. As in the case of fires, these emissions are climate sensitive (through temperature and moisture) and warming has already led to increased methane emissions from wetlands as calculated by biogeochemical models (Zhang et al., 2025).
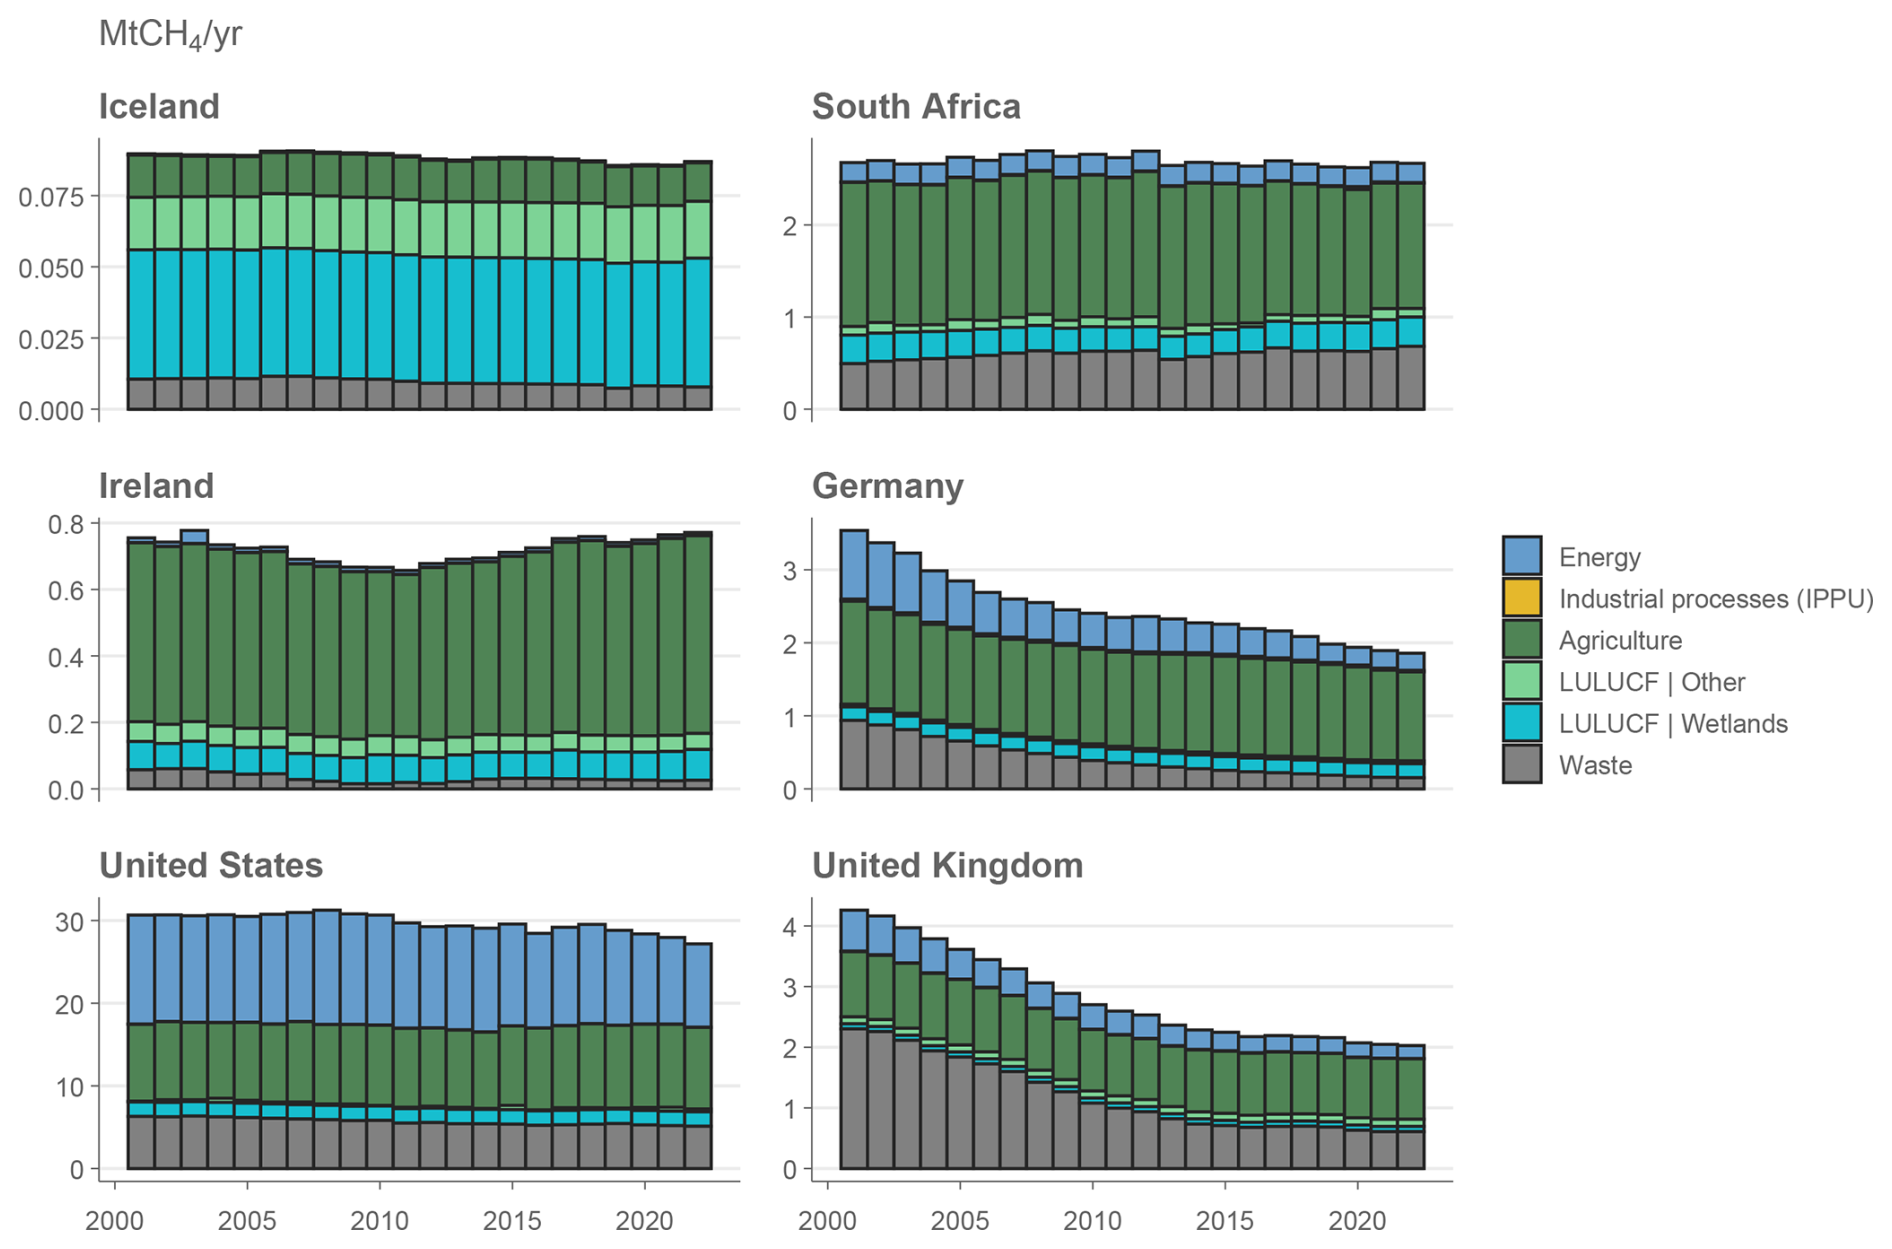
Figure 6Methane emissions in countries with high shares of wetland emissions. Data: National GHG inventories compiled by Lamb (2025).
Even though global anthropogenic and indirect anthropogenic CH4 fluxes from wetlands and freshwater bodies are assessed to be large at approximately 2.4 GtCO2e yr−1 (based on Saunois et al., 2025, equal to 23 % of methane emissions from fossil fuel production sector, agriculture, waste and biofuel and biomass burning), national GHG inventories – which are restricted to “artificial” water bodies on managed lands – account these emissions as very small. Figure 6 shows the CH4 inventories of six countries with the highest shares of the wetlands sector in their total CH4 estimates. With the exception of Iceland (>50 % share), these emissions are trivial compared to the livestock, waste or fuel production sectors. Most countries stand at well below 1 % of their total CH4 emissions from wetlands, while total wetland CH4 emissions of all Annex I countries was on average 0.064 GtCO2e yr−1 between 2010 and 2019, suggesting that current inventory reporting does not take into account the contributions of eutrophication, nutrient runoff and climate feedbacks.
2.3 The Paris Agreement does not cover all relevant sources of emissions
The third reason why GHG estimates can differ is that current UNFCCC guidance does not cover all climatically relevant sources of emissions and removals. This stems from the existence of other global environmental agreements and the fact that inventory reporting guidance is not as agile in updating its scope compared to the wider literature. And since inventories exclude certain sources and gases, this has a knock-on effect on third-party datasets that harmonise with the UNFCCC approach. Two major current omissions are ozone depleting F-gases and the cement carbonation sink.
2.3.1 Ozone Depleting Substances (ODS): F-gases
Fluorinated gases are human made substances that are widely used in industrial processes and consumer products, for example as refrigerants, aerosols, and insulation materials. F-gases have high global warming potentials and are comprehensively assessed in the IPCC Assessment Reports (Forster et al., 2021).
National inventory reporting and some third-party datasets include estimates of HFCs, PFCs, SF6 and NF3. We call these the “UNFCCC F-gases”. (As mentioned before, the UNFCCC F-gases plus CO2, CH4 and N2O are often referred to as the “Kyoto gases”). However, the UNFCCC F-gases do not cover chlorofluorocarbons (CFCs) and hydrochlorofluorocarbons (HCFCs). We call these two categories the Ozone Depleting Substances or “ODS F-gases”. The ODS F-gases also have high global warming potentials, but were already regulated under the 1987 Montreal Protocol and the subsequent Kigali amendment because of their impacts on the ozone layer.
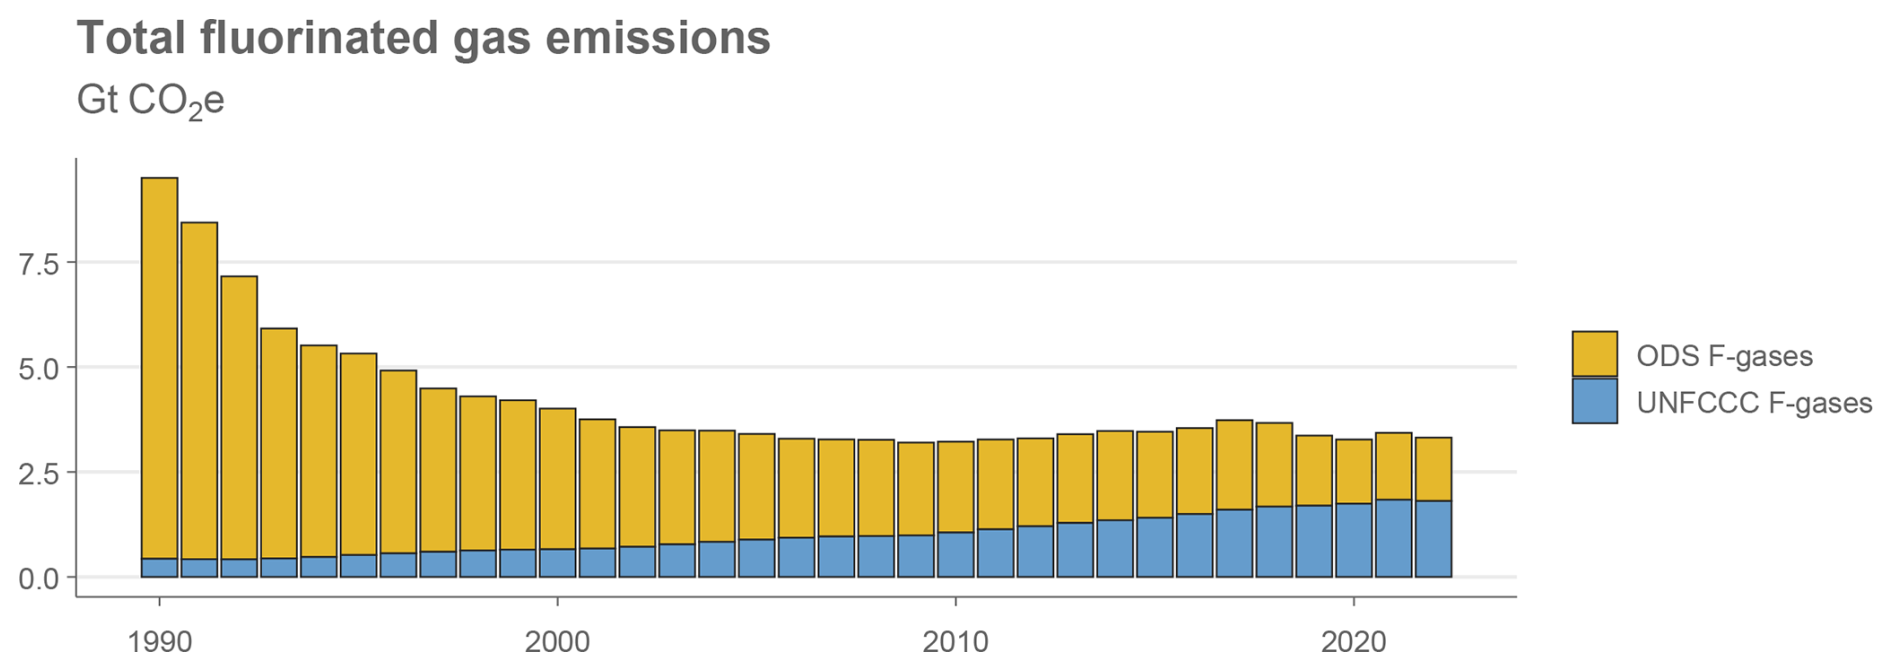
Figure 7Total fluorinated (F-) gas emissions. Data: Inversions from Forster et al. (2024). CO2e emissions are calculated using GWP100 from AR6 WGI chap. 7 (Forster et al., 2021).
The Montreal Protocol was successful in reducing ODS F-gas emissions (Fig. 7) and consequently expected levels of global warming (Velders et al., 2007; Young et al., 2021). However, reductions have leveled off in the past decade and there is known to be a large quantity of these gases in storage and end-use devices that will continue to emit over the coming decades. As it stands, UNFCCC F-gases accounted for approximately 1.8 GtCO2e yr−1 (90 % CI ± 0.54) in 2022, while ODS F-gases contributed 1.5 GtCO2e yr−1 (90 % CI ± 0.45) (Forster et al., 2024). Thus, while all emissions of F-gases can be well estimated using top-down methods – since there are no natural sources and they only break down chemically – typical reporting of global and national emissions estimates only includes a portion of them, simply because ODS F-gases are excluded from UNFCCC reporting.
2.3.2 Cement carbonation
Atmospheric CO2 is gradually absorbed into cement materials that are exposed to air, a process known as cement carbonation. This is a slow process over decades, but a globally significant one, because of the enormous quantity of cement that is produced and used in the built environment.
The GCB tracks the global cement carbonation sink (Friedlingstein et al., 2025b), which itself is based on a bottom-up assessment of cement production and use statistics (Huang et al., 2023). Current estimates indicate a global sink of 0.8 GtCO2 yr−1 that has steadily and rapidly increased alongside cement production. This is currently sufficient to compensate for about one third of cement process emissions (Huang et al., 2023). However, uncertainty is currently large, particularly due to lack of data on the share of cement that is used for concrete versus mortar, which are products with very different rates of carbon uptake.
Cement carbonation has historically not been included in national GHG inventories, since it has not been covered by the IPCC inventory guidelines and refinements. It is therefore technically, but not formally, excluded from the Paris Agreement. However, this is not from lack of interest from governments. Sweden has reported a Tier 1 cement carbonation calculation and memo in its National Inventory Report since 2020, but excludes this from its submitted inventory account. The UK has also recently published a Tier 2 methodology (DESNZ, 2023). The IPCC is expected to soon begin work on including a new chapter specifically on carbonation of both cement and lime in the Guidelines, as part of a new supplement to the 2006 Guidelines (IPCC, 2025b). Once in the IPCC Guidelines, there is a clearer path for inclusion in national inventories. In third-party datasets of national emissions, cement carbonation is not included, but estimates of national totals have recently been published (Niu et al., 2025).
One question that the inclusion of cement and lime carbonation raises is whether it is a sink that can be directly and intentionally modified, given that it is something that occurs to substances that have been already produced in the past (much like the concept of “indirect anthropogenic effects” in the land use sector). Currently most concrete structures are designed to minimise carbonation, because it often leads to structural weaknesses. Changes in design and cement composition (e.g. to allow the use of aluminium reinforcing instead of steel) could lead to less focus on mitigating carbonation, and hence greater absorption of CO2. Further, at the end of a structure's life, when concrete is demolished, whether that concrete rubble is buried without access to air or not has a large effect on further uptake, and this is something that could be controlled.
For any given assessment of emissions, there are clearly many different decisions to be made regarding scope, system boundaries and the selection of appropriate data. In this section, we therefore discuss how and why these choices are made in several different assessment communities that are involved in estimating, tracking or using GHG emissions data. These different conventions and their implied data choices are summarised in Fig. 8.
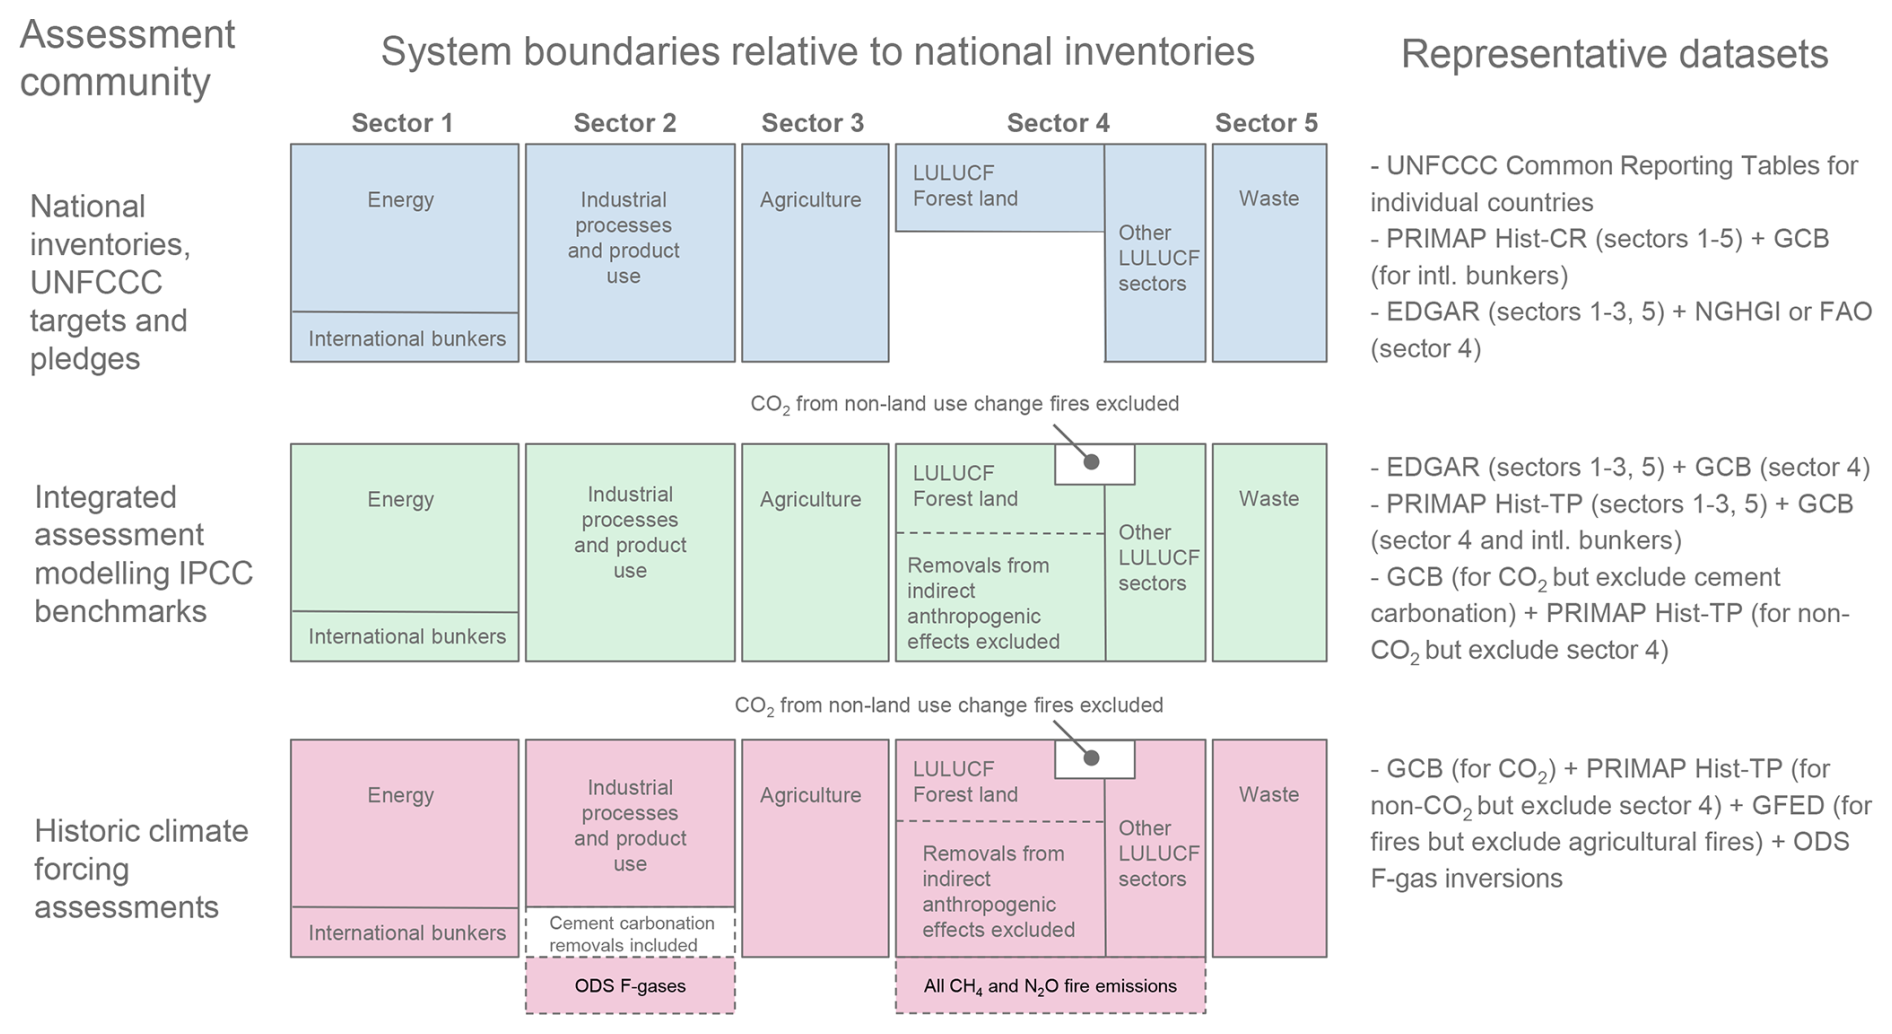
Figure 8Differences in greenhouse gas emissions conventions for three assessment communities. Box sizes are not representative of total emissions in each component. Notes: * PRIMAP Hist excludes international bunkers, but these could be added using the GCB or EDGAR datasets.
3.1 National targets, pledges and inventories under the UNFCCC
Countries are obligated to formulate climate targets, strategies and policies under the UNFCCC, most notably the Nationally Determined Contributions (NDCs), which define their pledges to reduce emissions in the coming decades. The NDCs are one of the core mechanisms of the Paris Agreement and are formally linked to the national GHG inventories: where countries pledge emissions reductions with reference to their historic emissions (e.g. a baseline level), that information should be in accordance with IPCC conventions and their national GHG inventories (UNFCCC, 2018a, 2022a). Similarly, national net zero targets are all based on inventory conventions. This ensures some degree of consistency in the agreement and encourages all countries to pledge emissions reductions in the same set of sectors, sources and gases, under the same definitions (e.g. of anthropogenic vs. natural sources and sinks).
A consequence of this framework for the research community and the IPCC is that independent assessments of current policy projections, the NDCs and net zero targets must also follow inventory conventions. This means that the data should cover the same scope of sectors and gases as inventories, and that LULUCF estimates follow the inventory approach. Since ODS F-gases and cement carbonation currently lie outside of the agreement, they must be excluded or treated separately. Similarly, it implies that fires not occurring on managed land do not matter for target achievement, and that countries are able to define their approach to excluding natural disturbances (Australia and Canada have already done so in their NDCs with reference to their GHG inventory conventions, see above). Finally, international aviation and shipping emissions are something of a grey area under the agreement, as they are reported as memos in national inventories, but are not accounted in totals nor towards national target achievement. Together, these requirements lead to a handful of options for tracking emissions in line with the inventory approach: the PRIMAP Hist-CR dataset; the EDGAR dataset in combination with JRC-NGHGI (for CO2 LULUCF), or national GHG inventories when dealing with individual or Annex I countries.
In practice, assessments of national pledges are particularly complicated by the LULUCF sector. The official synthesis of NDC emissions projections prepared by the UNFCCC secretariat excludes inventory-based LULUCF emissions (UNFCCC, 2022b). In the scientific literature, emissions projections of the NDCs and current policies also tend to avoid the LULUCF sector (Meinshausen et al., 2022), or carefully deal with it separately (Den Elzen et al., 2022). This is due to both ambiguity in the LULUCF contribution towards the targets of many countries (Fyson and Jeffery, 2019), as well as definitional differences between the inventory and bookkeeping approach (Sect. 2.2), which is consequential for benchmarking the NDCs against integrated assessment models. By contrast, UNFCCC reporting on historical emissions includes LULUCF, following the national inventory approach (UNFCCC, 2022c). The UNEP Emissions Gap Reports have also been reporting emissions at the national level including inventory-based LULUCF for several years – alongside a global total aligned with integrated assessment modelling benchmarks (see next section) (UNEP, 2022, 2023, 2024). Indeed, detailed analyses of LULUCF pledges shows it is an important sector from the perspective of countries, both in their short and long-term targets (Grassi et al., 2017; Roman-Cuesta et al., 2025). Thus while analyses focusing on national targets and pledges generally agree on the scope of emissions to assess, approaches to LULUCF can differ.
3.2 Integrated assessment modelling benchmarks
Another key area where emissions assessments take place is in the integrated assessment modelling (IAM) literature. IAMs are used to derive future emissions scenarios under different assumptions of technology development and policy action, which then inform projections of climate change in the coming decades. IAMs therefore model future rather than past GHG emissions, but do so in accordance with a specific scope and set of system boundaries, and are often calibrated by or are compared to historic estimates of emissions (e.g. in terms of projected emission reduction rates). Notably, benchmarks from IAMs (e.g. describing emissions levels or reductions in the future that lead to different climate outcomes) are reported in the IPCC and are widely used to contextualise national or global progress towards the temperature goals of the Paris Agreement (IPCC, 2022; UNEP, 2024).
There are over a dozen different IAMs that regularly contribute to the literature, with significant heterogeneity in model structure and scope. Nonetheless, they tend to follow several key conventions. First, most IAMs model the same basket of greenhouse gases as national GHG inventories: the Kyoto gases. Emissions reporting is also often split into a similar set of sectors as in national inventories and third-party emissions datasets (Byers et al., 2022). However, not all IAMs contain a land use model and therefore some exclude the LULUCF sector. Beyond the Kyoto gases, many IAMs also include aerosols and other precursor species with climate effects. IMAGE, MESSAGE-GLOBIOM, REMIND-MAgPIE and GCAM do not report ODS F-gases (IAM, 2025). Most IAMs do not incorporate cement carbonation, though MESSAGE and IMAGE do. Second, and related to the LULUCF sector, IAMs typically only model anthropogenically induced emissions. This follows from the basic purpose of IAMs, which is to analyse how human-driven technology and policy options can shape the future climate response. Where a land use model is included, they predominantly consider direct anthropogenic effects only associated with agriculture, land-use, land-use change or forestry (as in the Global Carbon Budget bookkeeping approach), and do not include climate and fertilisation effects, particularly in forests remaining forests. Nonetheless, IAMs continue to be improved to represent other emissions sources on land, both direct and indirect, including peatland rewetting, fire emissions, and others.
Different IAM groups use different historical emissions data to calibrate their models, and the calibration is often done for consistency and not for replication. There have been attempts to harmonise energy and emissions input data across models (Giarola et al., 2021) and protocols written for various projects (Korsbakken et al., 2024), but because of differences in model structure, it is not always possible or desirable to harmonise. To perform consistent climate assessments across multiple models it is therefore necessary to post-process IAM emissions data, in-filling missing gases or sectors where necessary (Kikstra et al., 2022). Post-processed IAM results form the backbone of IPCC benchmarks of global action, such as the timing of net zero emissions required to meet different climate objectives. To date these assessments have been aligned with the set of gases and sectors outlined in inventories and the Paris agreement, but with the important difference that they use bookkeeping conventions for the LULUCF sector. Other (e.g. non-Paris) emissions or land-based fluxes, as well as aerosols and precursor species, may be modelled within IAMs, but these would be excluded from the benchmarks. This means that IAM benchmarks cannot be directly compared to NDC assessments, but post processing can be used to translate between the two (Gidden et al., 2023; Grassi et al., 2021), as IAMs do not yet do this modelling natively. The translation and comparison of native IAM results to national inventory definitions is already foreseen in the IPCC AR7 report outline. This is needed to emphasize the consequences of different definitions: after IAM results are translated to national inventory definitions, the carbon budget is reduced (Gidden et al., 2023; Grassi et al., 2021) and reaching net-zero CO2 alone will not suffice to prevent global warming (Allen et al., 2025).
3.3 Climate forcing assessments
A third area of emissions assessments takes the atmosphere as the primary frame of reference, in contrast to national accounts and IAM benchmarks. The main objective of these is to track and explain observed changes to atmospheric concentrations of greenhouse gases, to evaluate their influences on the climate (for instance through effective radiative forcing (ERF) estimates), or to develop forward looking climate projections (Forster et al., 2024; Smith et al., 2021, 2024). They may also include emissions budgeting studies and related publications that aim to track both natural and anthropogenic fluxes of emissions to the atmosphere (Friedlingstein et al., 2025b; Saunois et al., 2025; Tian et al., 2024; UNEP and CCAC, 2021). All are closely related to the climate modelling literature.
Since these assessments aim to get the best estimate of GHG fluxes to the atmosphere, they would consider non-Paris Agreement sources (ODS F-gases and cement carbonation) as well as all (non-CO2) fire emissions. (Note that aerosol precursor species and other short-lived climate forcers would also be considered relevant for these assessments). Removals due to natural sinks are generally not considered as input data, as they are modelled directly by the climate models themselves, partly because these sinks are functions of the climate state and hence are considered part of climate feedbacks. Additionally, climate modelling requires inputs starting from pre-industrial, usually 17- or 1850, meaning that long time series datasets are often prioritised. Unless studies are explicitly considering national boundaries or contributions to climate change (e.g. as in Jones et al., 2023), detailed national or sectoral data is usually not required. This relaxes some constraints on using top-down observational datasets (e.g. fire emissions observations, inversions of atmospheric concentrations), which often cannot be easily assigned to territorial boundaries. These considerations lead to a few key sources being used for historical emissions: the GCB for CO2, CEDS or PRIMAP Hist-TP datasets for CO2, CH4 and N2O emissions, the GFED dataset for CH4 and N2O from fires, and inversion datasets (e.g. Velders et al., 2015; WMO, 2022) for F-gases (both UNFCCC and ODS).
To what extent do the discussed issues of dataset coverage, definitions of anthropogenic emissions, and scope of the Paris Agreement influence total GHG estimates?
In the first instance, only a handful of datasets come close to a complete coverage of inventory sectors and gases. For all Kyoto gases (CO2, CH4, N2O and UNFCCC F-gases) and excluding the LULUCF sector, these include PRIMAP Hist-TP, PRIMAP Hist-CR and EDGAR. A fourth dataset covers these gases but excludes F-gases: CEDS. Between these datasets we observe relatively minor deviations in total average decadal GHG emissions, the largest of which is due to differences in CH4 estimates between PRIMAP Hist-CR and PRIMAP Hist-TP (Fig. 9).
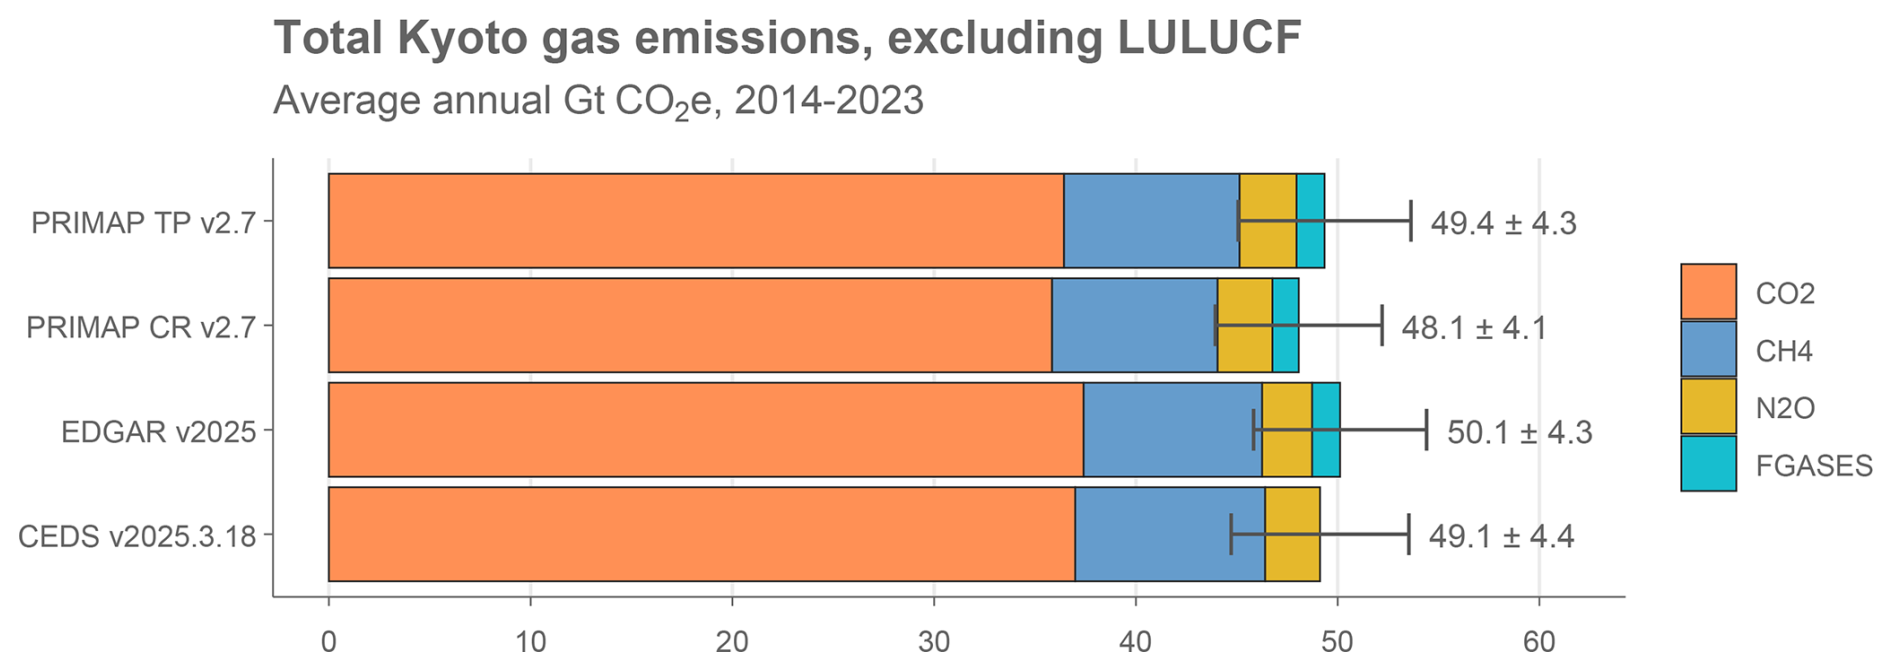
Figure 9Total Kyoto gas emissions across datasets, excluding LULUCF. Kyoto gases refer to CO2, CH4, N2O and UNFCCC F-gas emissions. Error bars indicate composite uncertainties of ± 8 % for CO2 (excl. LULUCF), ± 30 % for CH4 and F-gases, and ± 60 % for N2O, corresponding to a 90 % confidence interval following Minx et al. (2021). CO2e emissions are calculated using GWP100 from AR6 WGI chap. 7 (Forster et al., 2021). Note that the PRIMAP datasets exclude international bunker emissions.
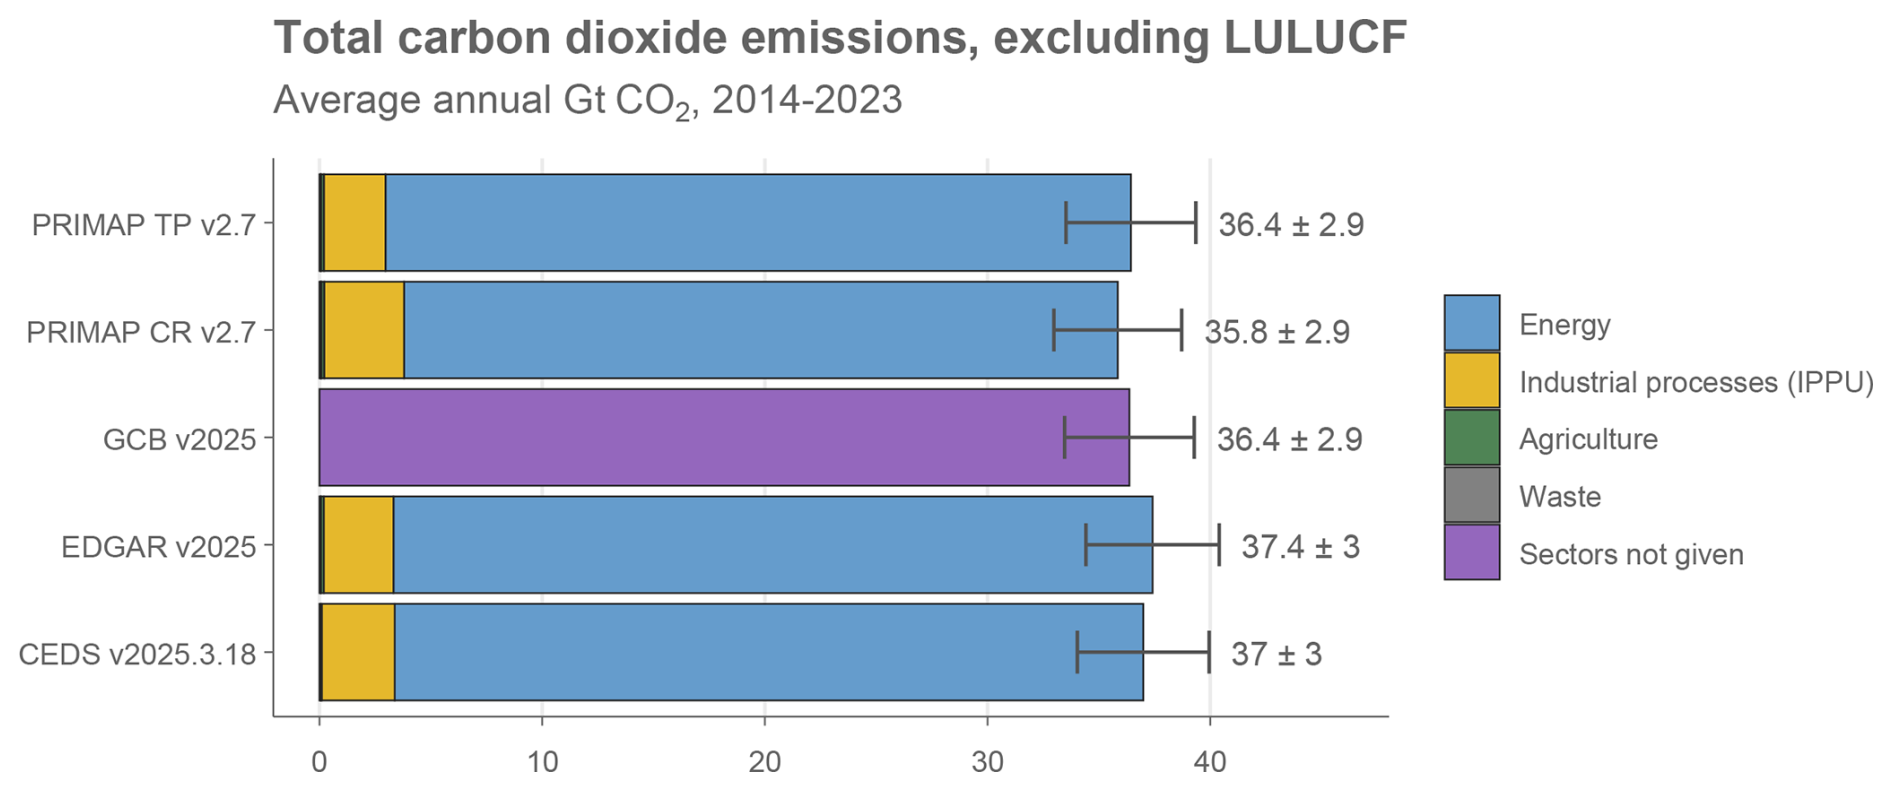
Figure 10Total carbon dioxide emissions across datasets, excluding LULUCF. Error bars indicate uncertainties of ± 8 % for CO2 (excl. LULUCF), corresponding to a 90 % confidence interval following Minx et al. (2021). Note that the PRIMAP datasets exclude international bunker emissions, and that the GCB estimate excludes cement carbonation.
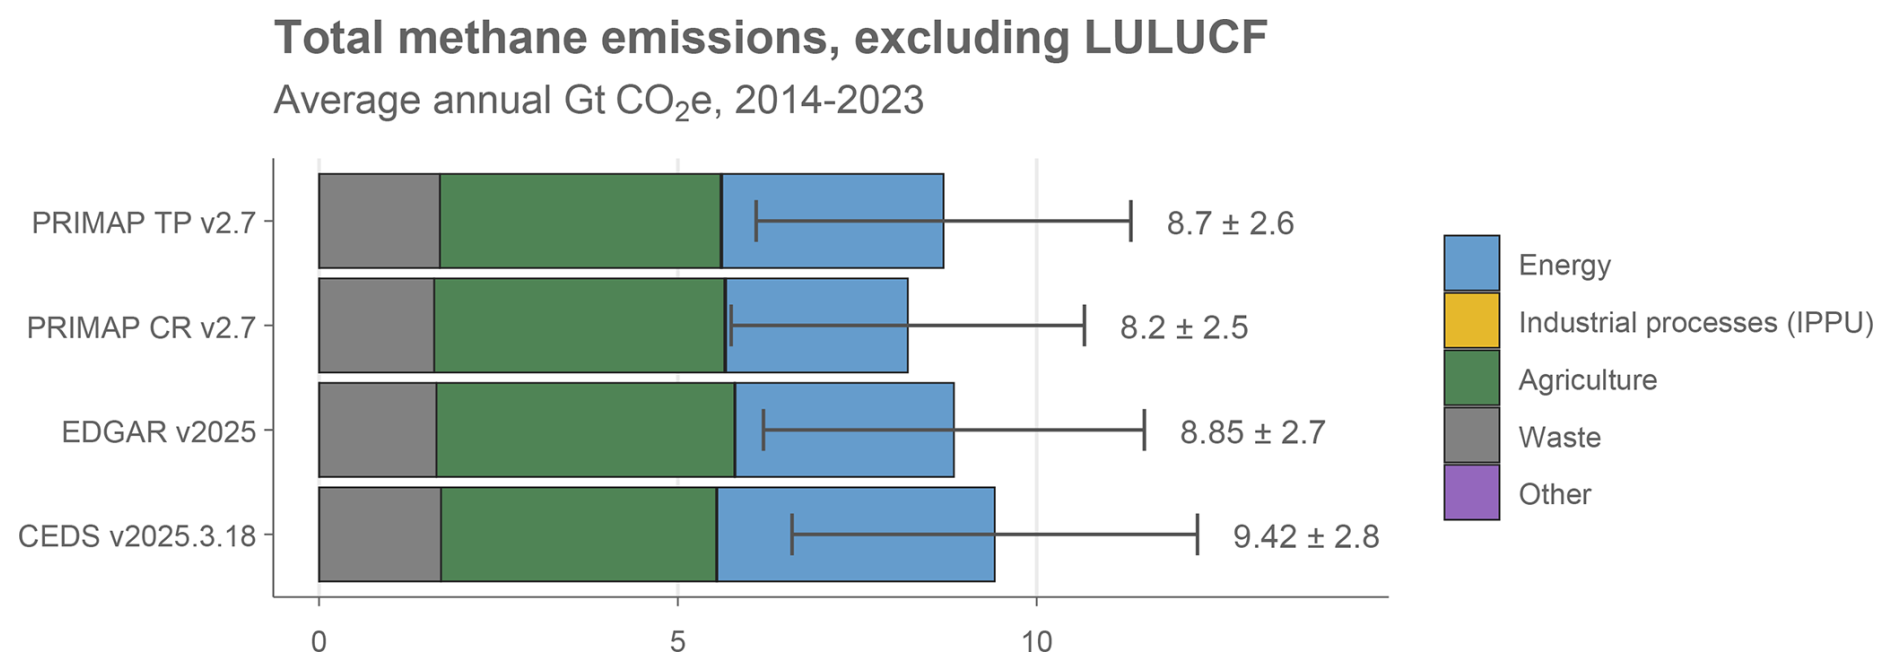
Figure 11Total methane emissions across datasets, excluding LULUCF. Error bars indicate uncertainties of ± 30 % for CH4 (excl. LULUCF), corresponding to a 90 % confidence interval following Minx et al. (2021). CO2e emissions are calculated using GWP100 from AR6 WGI chap. 7, here with a value of 27.9 (Forster et al., 2021).
Considering CO2 emissions separately, we observe a low relative spread between datasets that cover a similar set of system boundaries, but absolute differences of up to 2.05 GtCO2 yr−1 (e.g. between the lowest estimate from PRIMAP Hist-CR and the highest from EDGAR; Fig. 10). Relative differences as well as uncertainties are higher for CH4 and N2O emissions, with PRIMAP Hist-CR – the PRIMAP time series that prioritises national inventory data – in particular reporting lower fossil CH4 emissions (Figs. 11 to 12). Indeed, several studies have pointed to relatively low estimates of fossil CH4 in national inventories compared to observational evidence (Deng et al., 2022; Janardanan et al., 2024; Scarpelli et al., 2022; Tibrewal et al., 2024).
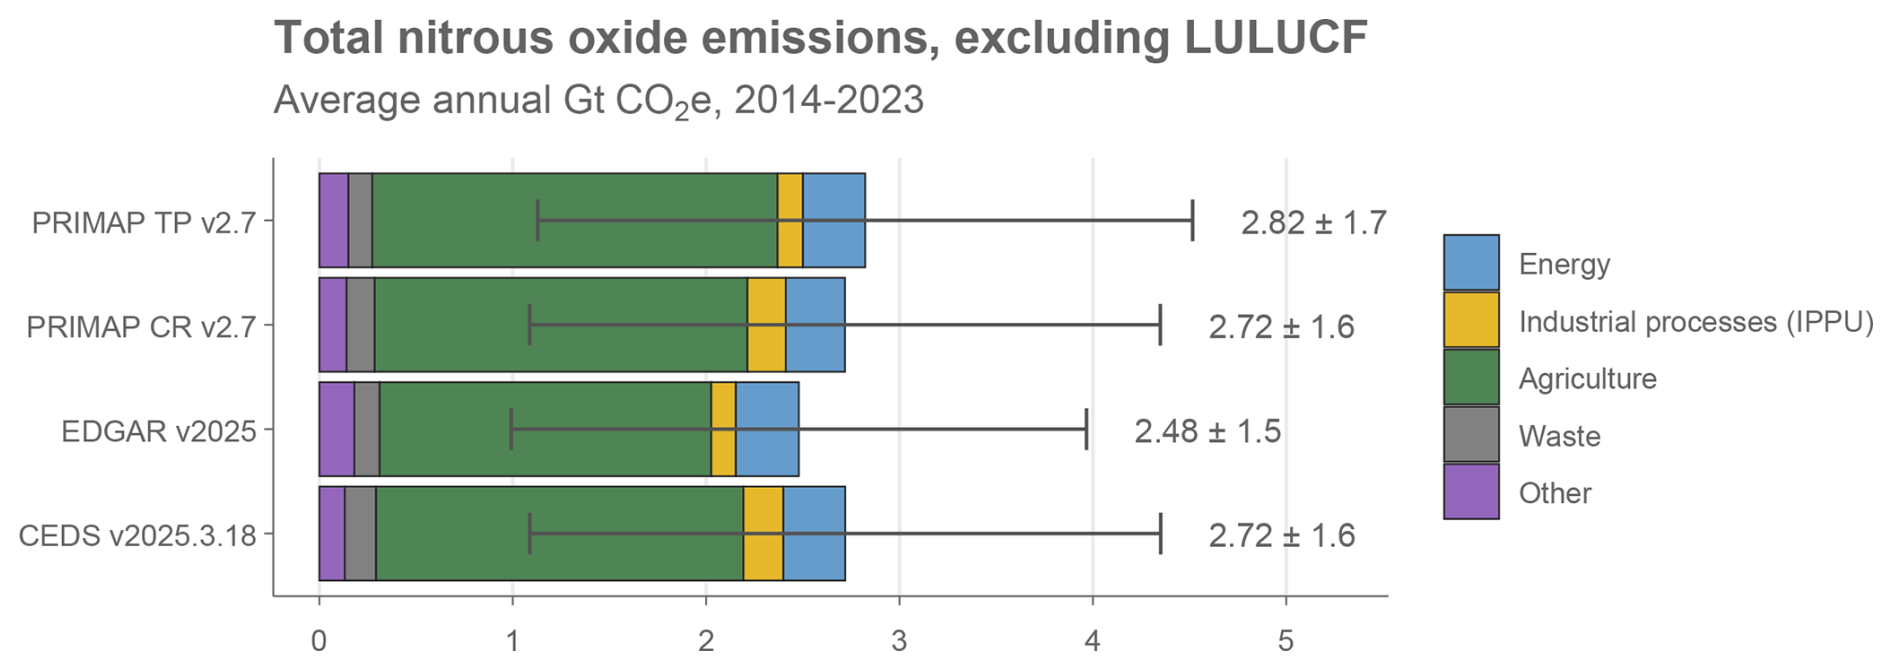
Figure 12Total nitrous oxide emissions across datasets, excluding LULUCF. Error bars indicate uncertainties of ± 60 % for N2O (excl. LULUCF), corresponding to a 90 % confidence interval following Minx et al. (2021). CO2e emissions are calculated using GWP100 from AR6 WGI chap. 7 (Forster et al., 2021).
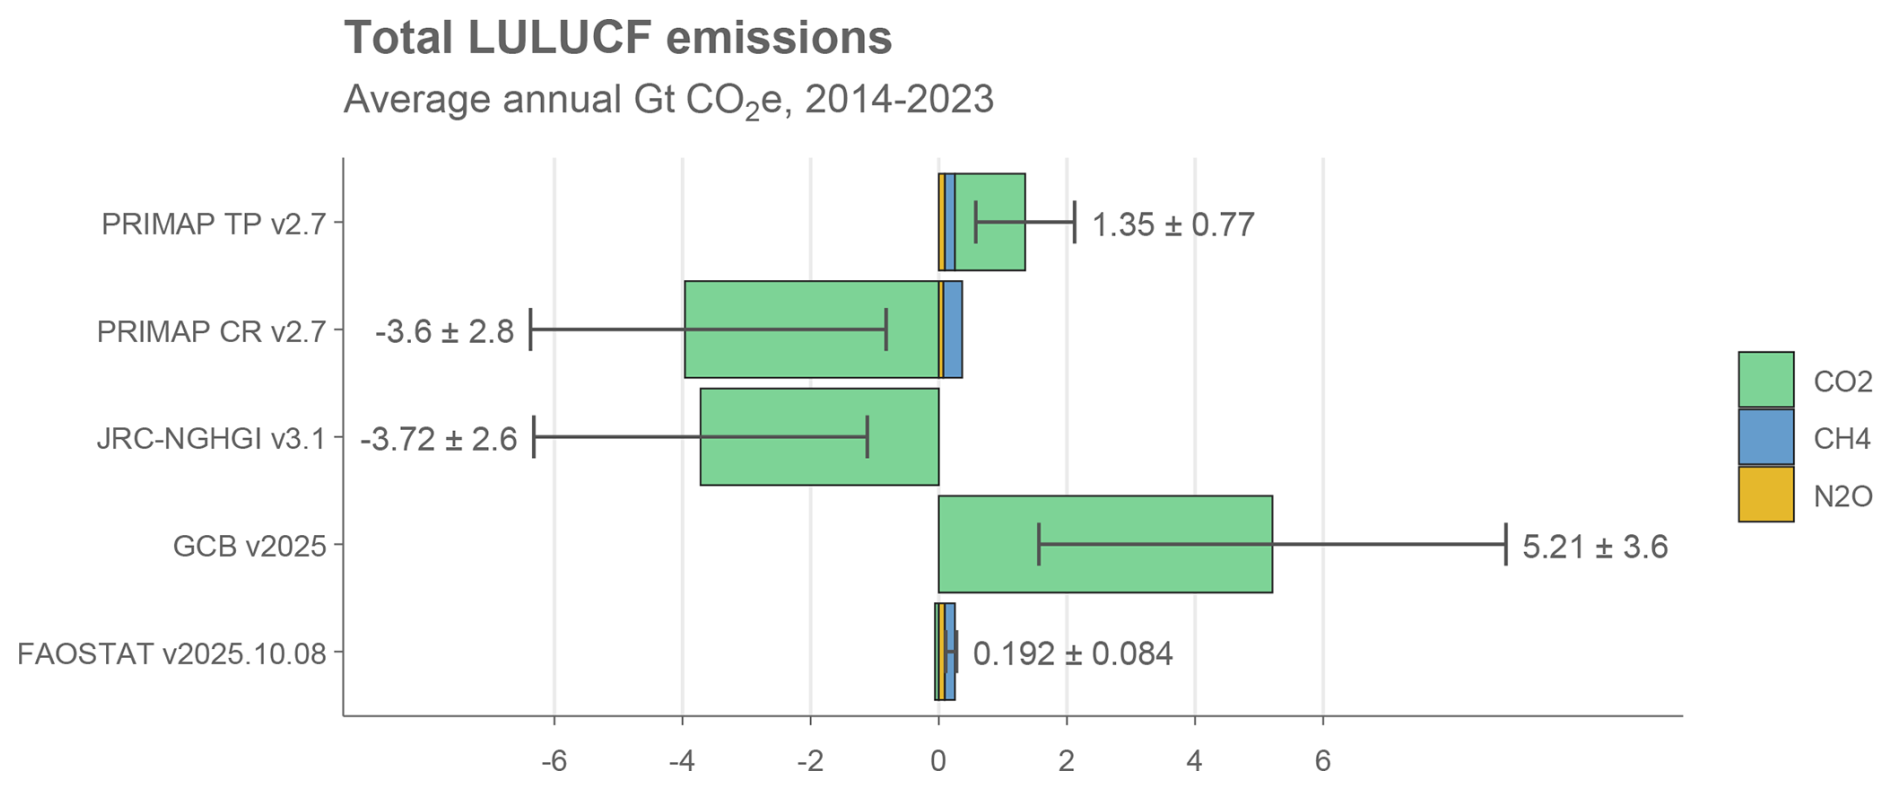
Figure 13Total LULUCF emissions across datasets. Error bars indicate uncertainties of ± 70 % for CO2 LULUCF, ± 30 % for CH4 and ± 60 % for N2O, corresponding to a 90 % confidence interval following Minx et al. (2021). CO2e emissions are calculated using GWP100 from AR6 WGI chap. 7 (Forster et al., 2021).
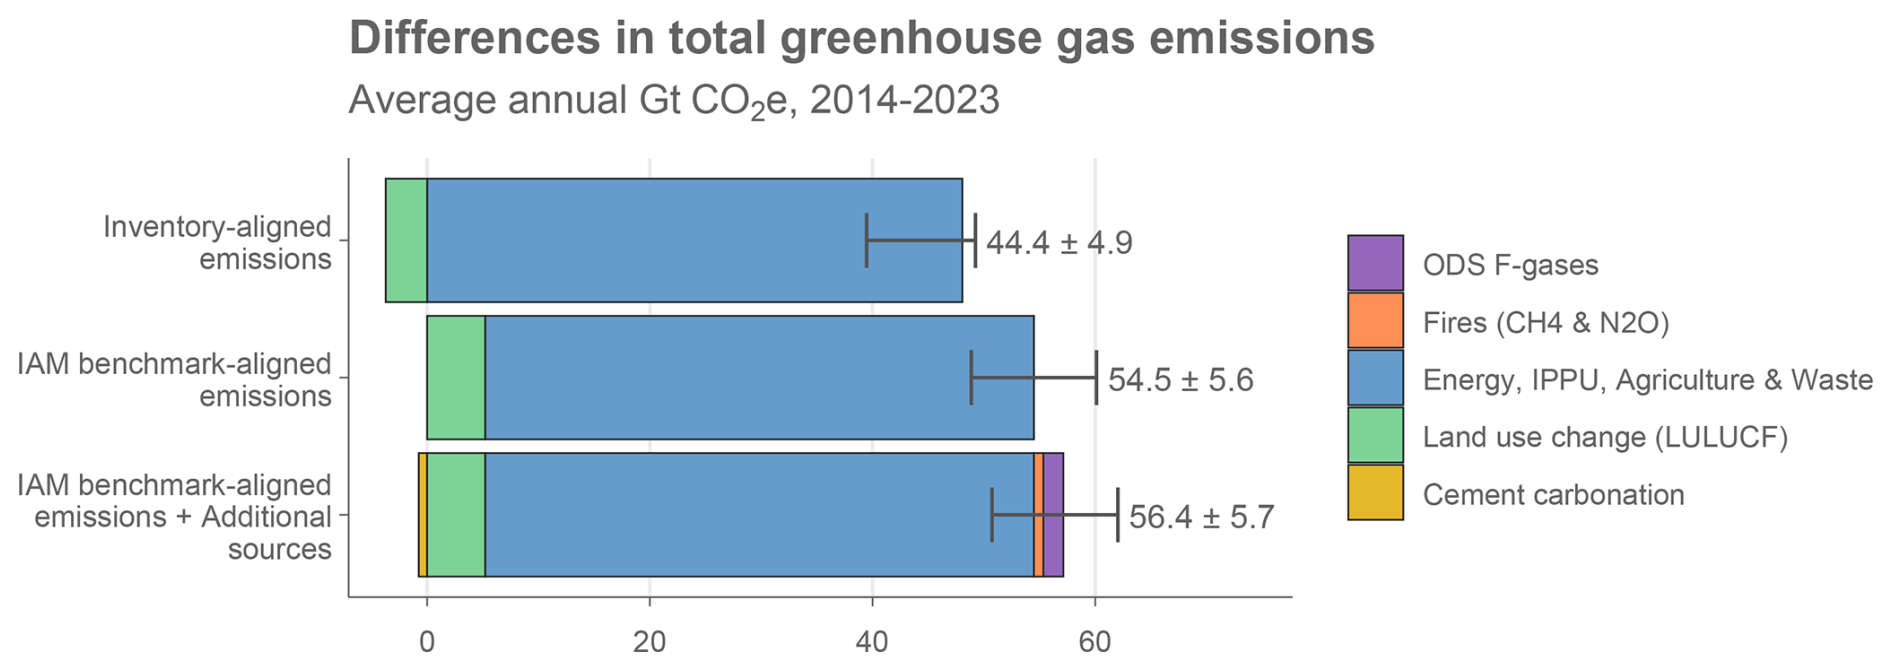
Figure 14Differences in total greenhouse gas emissions under different data and system boundary choices. Error bars indicate uncertainties of ±8 % for CO2 Fossil, ± 70 % for CO2 LULUCF, ±30 % for CH4 and ± 60 % for N2O, corresponding to a 90 % confidence interval following Minx et al. (2021). CO2e emissions are calculated using GWP100 from AR6 WGI chap. 7 (Forster et al., 2021). Data: for “inventory-aligned emissions” PRIMAP Hist-CR (non-LULUCF sectors) and JRC-NGHGI (LULUCF) (Gütschow et al., 2025; Melo et al., 2025); for “IAM benchmark-aligned emissions” GCB (all CO2 incl. LULUCF) and PRIMAP Hist-TP (non-CO2, excl. LULUCF) (Friedlingstein et al., 2025b; Gütschow et al., 2025); for “Additional sources” Forster et al. (2024) (ODS F-gases), GFED (fires) and GCB (cement carbonation) (Forster et al., 2024; Friedlingstein et al., 2025b; van der Werf et al., 2017). The order of the bars does not presuppose any preferences for which approach should be used, which depends on the research question, aims and context of an assessment.
By far the largest differences between datasets can be observed in the LULUCF sector (Fig. 13). According to decadal averages, these range from net negative emissions of −3.72 to −3.6 GtCO2e yr−1 in the two national inventory aligned datasets (JRC-NGHGI and PRIMAP Hist-CR), to net positive emissions in FAO (0.192 GtCO2e yr−1) and its derivative, PRIMAP Hist-TP (1.35 GtCO2e yr−1), to significantly larger net emissions in the GCB (5.21 GtCO2e yr−1). As described in Sect. 2.2, JRC-NGHGI and GCB differ conceptually in terms of how they define anthropogenic removals and how they treat natural disturbances. And as noted by Grassi et al. (2022) the forest sink may be underestimated in FAOSTAT, in those countries where the underlying input data is incomplete. Of the datasets above, only some of them (FAOSTAT and its derivative PRIMAP) include non-CO2 emissions from fires and other land uses.
Comparing emissions across the three assessment conventions outlined in Sect. 3 (summarised in Fig. 8), significant differences in total global greenhouse gas emissions can be observed (Fig. 14). Inventory-aligned emissions, shown here using PRIMAP Hist-CR for non-LULUCF sectors and JRC-NGHGI for LULUCF, were 44.4 GtCO2e yr−1 [90 % CI ± 4.9] in the decade 2014–2023. These emissions are both low relative to third-party datasets in terms of fossil methane, exclude international aviation and shipping, and include the inventory-aligned definition of LULUCF. This is ∼ 10.1 GtCO2e yr−1 lower than emissions comparable with IAM benchmarks, primarily due to the bookkeeping definition of LULUCF (∼ 8.9 GtCO2e yr−1), but also due to lower estimates of fossil methane in inventory prioritised data, as well as the inclusion of bunker emissions (the latter adding 1.1 GtCO2 yr−1 between 2014–2023). Expanding the scope further to consider non-Paris sources (ODS F-gases, cement carbonation) and all global fire emissions of CH4 and N2O, decadal average emissions increase by 1.9 GtCO2e yr−1, of which 1.8 GtCO2e yr−1 is from ODS F-gases, −0.75 GtCO2 yr−1 is from the cement carbonation sink, and 0.85 GtCO2 yr−1 is from fires. Interannual variability in emissions also increases due to large fluctuations in annual fire emissions (Fig. 5).
The emissions shown in Fig. 14 do not include non-CO2 emissions in the LULUCF sector, which based on FAOSTAT would be 0.25 GtCO2 yr−1. Further, none of the datasets in Fig. 14 (nor FAOSTAT) include the indirect anthropogenic portion of emissions from wetlands or freshwater bodies, which aggregated and estimated from individual studies may sum to as much as 2.4 GtCO2 yr−1 as discussed in Sect. 2.2.3.
The data used in this study to make Figs. 9–14 is available at: https://doi.org/10.5281/zenodo.15126539 (Lamb, 2026).
The code used in this study to make Figs. 9–14 is available at: https://doi.org/10.5281/zenodo.15126539 (Lamb, 2026).
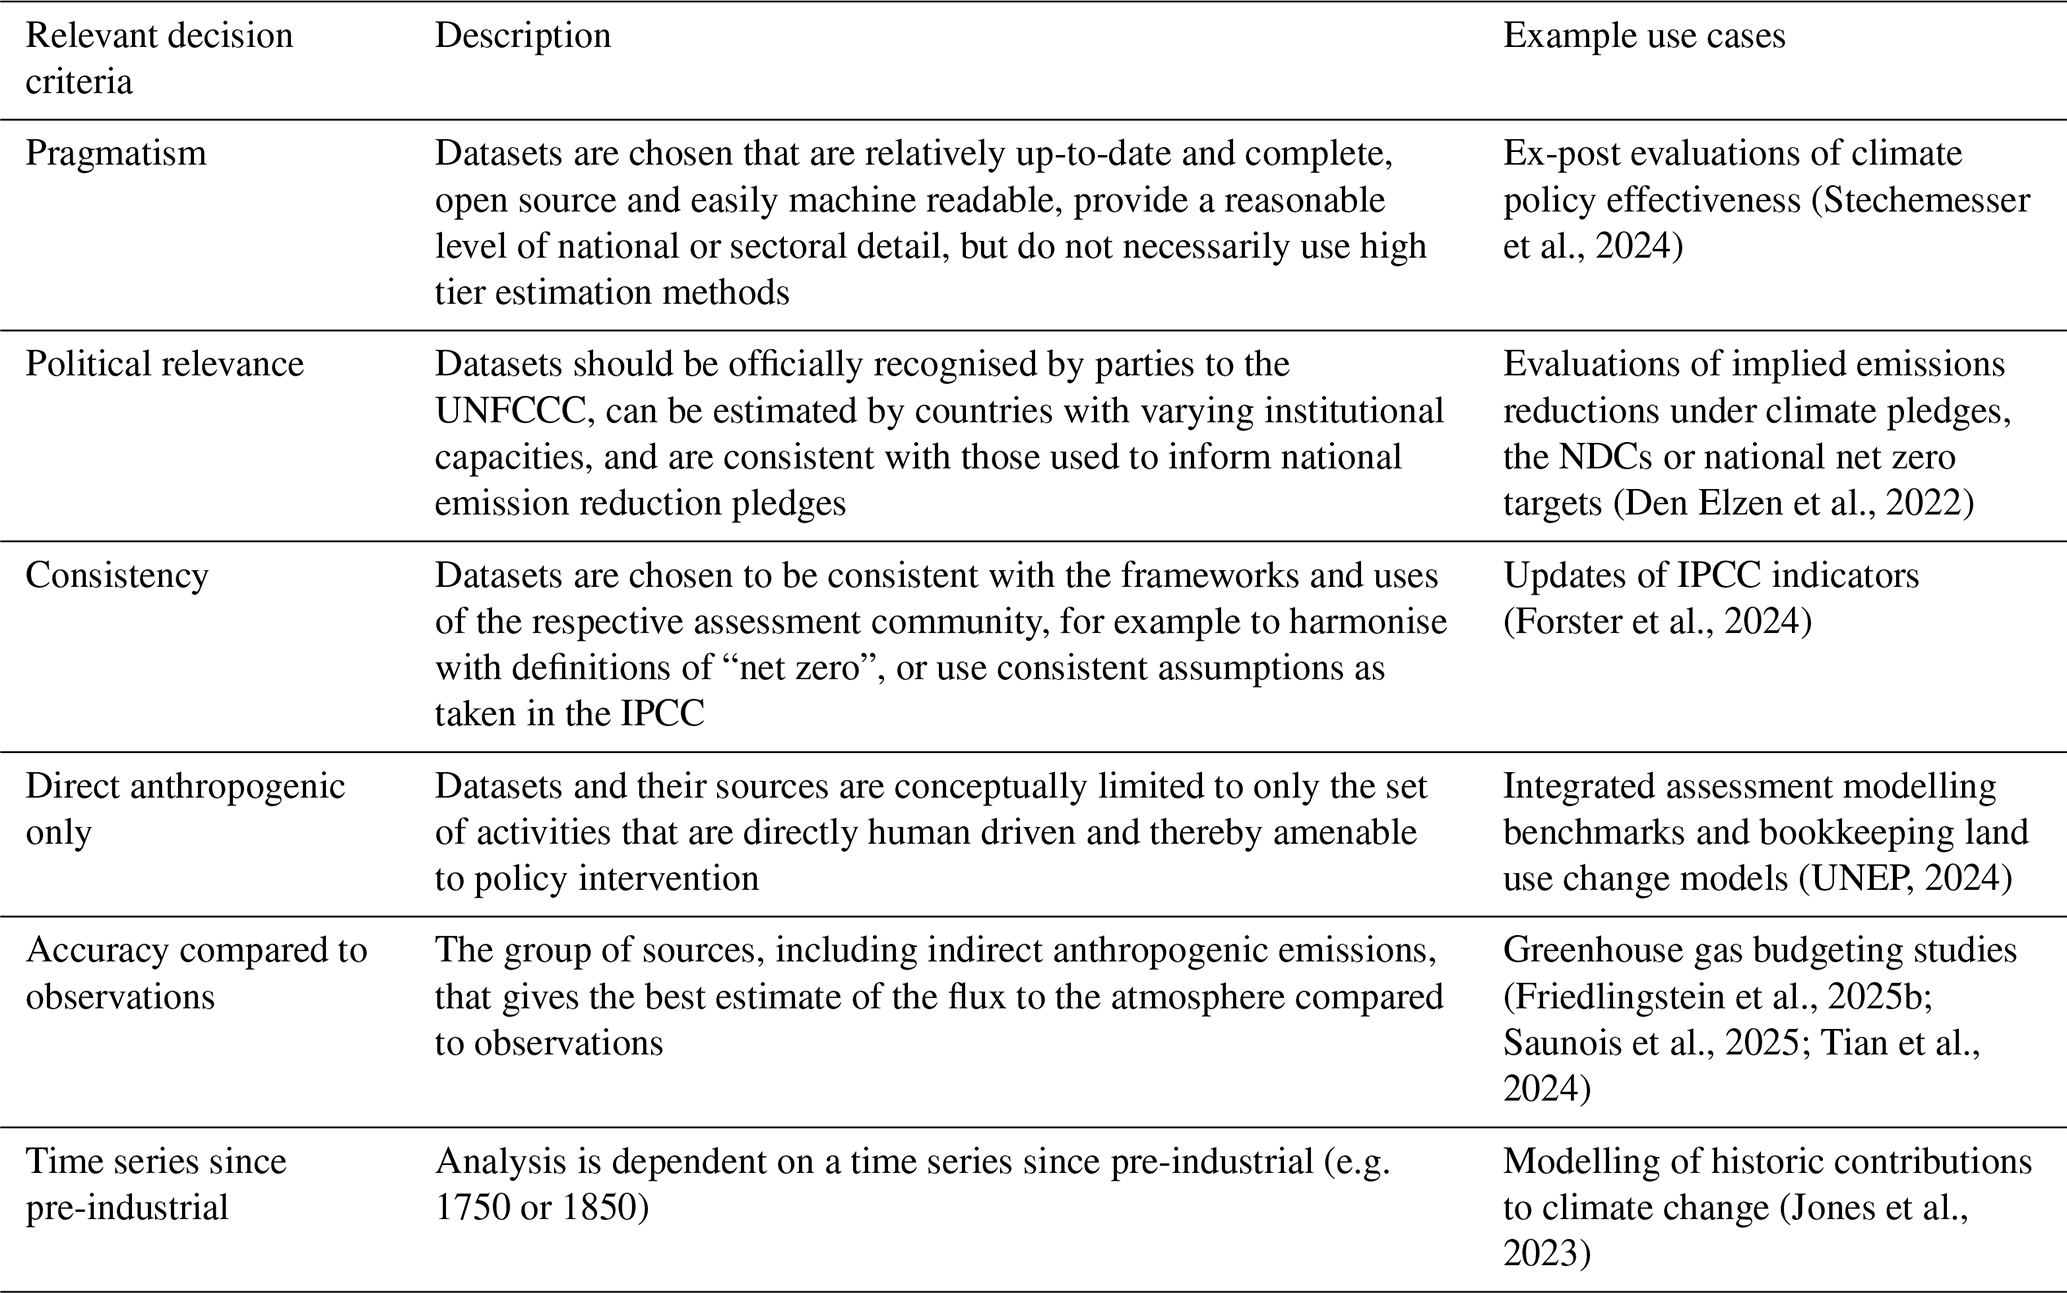
In this article we have explored key reasons why GHG emissions estimates differ, namely that datasets vary in their coverage of gases, sectors and countries; that there are different approaches to defining “anthropogenic” emissions; and that the Paris Agreement doesn't cover all relevant sources of emissions. Importantly, we find that there are multiple possible approaches to addressing these issues, and that these depend on different decision criteria determining the scope and conceptual boundaries of an assessment. Among the assessment conventions we have described, such criteria include political relevance (where an assessment aims to be consistent with the scope of the Paris Agreement), that emissions should be direct anthropogenic only (where an assessment excludes sources and sinks that are less amenable to direct policy intervention), or that emissions should be accurate compared to observations (where an assessment aims to describe the best estimate of fluxes consistent with observations). Other decision criteria are also possible, some of which are mutually exclusive or in conflict with one another (Table 2). This underlines the importance of clearly stating which criteria drive an assessment, and what they imply in terms of emissions coverage and system boundaries.
Table 2Decision criteria for selecting and using emissions data.
For some components of emissions, it is straightforward to quantify the impact of including or excluding them from totals. This is the case for ODS F-gases, cement carbonation, as well as for the LULUCF sector where significant efforts have been made to explain differences and provide translation methodologies between estimates (Friedlingstein et al., 2025b; Grassi et al., 2023; Schwingshackl et al., 2022). However, for others the impact of different conceptual approaches is more challenging to quantify. For instance, while the broad treatment of fire emissions in inventories, models and third-party datasets is known (Fig. 3), quantifying these differences would require directly comparing their estimates of burned areas and emissions within the LULUCF sector. While this is largely available in the national GHG inventories, these are globally incomplete. Further, observational datasets such as GFED do not differentiate by national borders; while others (e.g. FAO, GCB, PRIMAP-Hist) do. Similarly, in the case of wetlands and freshwater bodies, there are estimates in literature on global fluxes, but little work on comparing these to bottom-up, national or inventory estimates – although such comparisons have been made for N2O (Conchedda and Tubiello, 2020). As a result, differences in how datasets treat indirect anthropogenic fluxes from fires and wetlands are largely unknown to non-domain experts. As interest grows in the potentials, limits and risks of carbon dioxide removal and “natural climate solutions” including wetland restoration (Ma et al., 2024; Zou et al., 2022), it may become increasingly important to assess these fluxes with more specificity.
Overall, we find significant differences between global GHG estimates, primarily driven by the LULUCF sector, but also with non-trivial impacts from including non-Paris Agreement sources. Nonetheless, emissions are unambiguously increasing and are far off track from levels and trends consistent with meeting the objectives of the Paris Agreement. At a national level, even larger relative differences are to be expected for countries with significant land or forest areas. As it stands, though, we lack sufficient and comprehensive national data for ODS F-gases and fires to evaluate their influence below the global scale, though individual studies are starting to fill this gap (Niu et al., 2025).
A multitude of activities and processes drive GHG emissions, many of which interact with natural systems. The resulting data is therefore inherently complex, with nuances that may not be obvious to users lacking specific domain knowledge. Some issues also cannot be resolved easily, such as the attribution of synergistic effects of anthropogenic and natural drivers. Despite this, GHG emissions data is very widely used and remains one of the most important indicators of human impact on the planet. Different choices of data can have wide reaching implications, especially at a national level where varying definitions (e.g. of LULUCF emissions) could cast doubt over a country's claimed mitigation progress. We have therefore attempted to explain some of the key factors that drive differences between estimates, as well as the decision criteria underlying these choices. We recommend that data users familiarise themselves with these issues, and take steps to clearly state the decision criteria behind their own choices and what impact it may have on their analysis.
WFL, RMA, GPP, CS, JP, PF, JM and PMF conceptualised the study. WFL conducted the analysis and prepared figures. All authors contributed to writing, reviewing and editing the draft.
At least one of the (co-)authors is a member of the editorial board of Earth System Science Data. The peer-review process was guided by an independent editor, and the authors also have no other competing interests to declare.
Publisher's note: Copernicus Publications remains neutral with regard to jurisdictional claims made in the text, published maps, institutional affiliations, or any other geographical representation in this paper. The authors bear the ultimate responsibility for providing appropriate place names. Views expressed in the text are those of the authors and do not necessarily reflect the views of the publisher.
RMA and GPP were supported by the Horizon Europe Research and Innovation Programs under grant agreement nos. 101081395 (EYE-CLIMA) and 101056907 (Pathfinder). WFL was supported by the European Union ERC-2020-SyG “GENIE” (951542) grant. CS was supported by the Horizon Europe Research and Innovation Programs under grant agreement nos. 101081661 (WorldTrans) and 101081369 (SPARCCLE). ZN acknowledges funding from the European Union's Horizon 2020 research and innovation programmes (grant agreement no. 101003536) (ESM2025). MJG and SJS are also affiliated with Pacific Northwest National Laboratory, which did not provide specific support for this paper.
The article processing charges for this open-access publication were covered by the Potsdam Institute for Climate Impact Research (PIK).
This paper was edited by Martina Stockhause and reviewed by two anonymous referees.
Allen, M. R., Frame, D. J., Friedlingstein, P., Gillett, N. P., Grassi, G., Gregory, J. M., Hare, W., House, J., Huntingford, C., Jenkins, S., Jones, C. D., Knutti, R., Lowe, J. A., Matthews, H. D., Meinshausen, M., Meinshausen, N., Peters, G. P., Plattner, G.-K., Raper, S., Rogelj, J., Stott, P. A., Solomon, S., Stocker, T. F., Weaver, A. J., and Zickfeld, K.: Geological Net Zero and the need for disaggregated accounting for carbon sinks, Nature, 638, 343–350, https://doi.org/10.1038/s41586-024-08326-8, 2025.
Andrew, R. M.: A comparison of estimates of global carbon dioxide emissions from fossil carbon sources, Earth Syst. Sci. Data, 12, 1437–1465, https://doi.org/10.5194/essd-12-1437-2020, 2020.
Andrew, R. M.: Global CO2 emissions from cement production, Zenodo [data set], https://doi.org/10.5281/zenodo.14931651, 2025.
BMK: Detailbericht zur Nahzeitprognose der Österreichischen Treibhausgas-Emissionen des Verkehrs 2022, Bundesministerium für Klimaschutz, Umwelt, Energie, Mobilität, Innovation und Technologie (BMK), Vienna, Austria, https://www.umweltbundesamt.at/fileadmin/site/publikationen/rep0872.pdf (last access: 7 April 2026), 2023.
Boehm, S., Jeffery, L., Hecke, J., Schumer, C., Jaeger, J., Fyson, C., Levin, K., Nilsson, A., Naimoli, S., Daly, E., Thwaites, J., Lebling, K., Waite, R., Collis, J., Sims, M., Singh, N., Grier, E., Lamb, W., Castellanos, S., Lee, A., Geffray, M.-C., Santo, R., Balehegn, M., Petroni, M., and Masterson, M.: State of Climate Action 2023, World Resources Institute, https://www.wri.org/research/state-climate-action-2023 (last access: 7 April 2026), 2023.
Byers, Edward, Krey, V., Kriegler, E., Riahi, K., Schaeffer, R., Kikstra, J., Lamboll, R., Nicholls, Z., Sandstad, M., Smith, C., van der Wijst, K., Al Khourdajie, A., Lecocq, F., Portugal-Pereira, J., Saheb, Y., Stromann, A., Winkler, H., Auer, C., Brutschin, E., Gidden, M., Hackstock, P., Harmsen, M., Huppmann, D., Kolp, P., Lepault, C., Lewis, J., Marangoni, G., Müller-Casseres, E., Skeie, R., Werning, M., Calvin, K., Forster, P., Guivarch, C., Hasegawa, T., Meinshausen, M., Peters, G., Rogelj, J., Samset, B., Steinberger, J., Tavoni, M., and van Vuuren, D.: AR6 Scenarios Database hosted by IIASA, Zenodo [data set], https://doi.org/10.5281/zenodo.5886911, 2022.
Canadell, J. G., Kirschbaum, M. U. F., Kurz, W. A., Sanz, M.-J., Schlamadinger, B., and Yamagata, Y.: Factoring out natural and indirect human effects on terrestrial carbon sources and sinks, Environ. Sci. Policy, 10, 370–384, https://doi.org/10.1016/j.envsci.2007.01.009, 2007.
Conchedda, G. and Tubiello, F. N.: Drainage of organic soils and GHG emissions: validation with country data, Earth Syst. Sci. Data, 12, 3113–3137, https://doi.org/10.5194/essd-12-3113-2020, 2020.
Crippa, M., Guizzardi, D., Pagani, F., Banja, M., Muntean, M., Schaaf, E., Becker, W., Monforti-Ferrario, F., Quadrelli, R., Risquez Martin, A., Taghavi-Moharamli, P., Grassi, G., Rossi, S., Brandao De Melo, J., Oom, D., Branco, A., San-Miguel, J., and Vignati, E.: GHG emissions of all world countries, Publications Office of the European Union [data set], https://doi.org/10.2760/4002897, 2024.
Cunningham, C. X., Williamson, G. J., and Bowman, D. M. J. S.: Increasing frequency and intensity of the most extreme wildfires on Earth, Nat. Ecol. Evol., 8, 1420–1425, https://doi.org/10.1038/s41559-024-02452-2, 2024.
Den Elzen, M. G. J., Dafnomilis, I., Forsell, N., Fragkos, P., Fragkiadakis, K., Höhne, N., Kuramochi, T., Nascimento, L., Roelfsema, M., Van Soest, H., and Sperling, F.: Updated nationally determined contributions collectively raise ambition levels but need strengthening further to keep Paris goals within reach, Mitig. Adapt. Strat. Gl., 27, 33, https://doi.org/10.1007/s11027-022-10008-7, 2022.
Deng, Z., Ciais, P., Tzompa-Sosa, Z. A., Saunois, M., Qiu, C., Tan, C., Sun, T., Ke, P., Cui, Y., Tanaka, K., Lin, X., Thompson, R. L., Tian, H., Yao, Y., Huang, Y., Lauerwald, R., Jain, A. K., Xu, X., Bastos, A., Sitch, S., Palmer, P. I., Lauvaux, T., d'Aspremont, A., Giron, C., Benoit, A., Poulter, B., Chang, J., Petrescu, A. M. R., Davis, S. J., Liu, Z., Grassi, G., Albergel, C., Tubiello, F. N., Perugini, L., Peters, W., and Chevallier, F.: Comparing national greenhouse gas budgets reported in UNFCCC inventories against atmospheric inversions, Earth Syst. Sci. Data, 14, 1639–1675, https://doi.org/10.5194/essd-14-1639-2022, 2022.
DESNZ: UK GHG Inventory Improvement: Carbonation of Concrete Emissions Sink Modelling, Department of Energy Security and Net Zero, United Kingdom, London, https://uk-air.defra.gov.uk/library/reports?report_id=1114 (last access: 7 April 2026), 2023.
Energy Institute: Statistical Review of World Energy, Energy Institute [data set], https://www.energyinst.org/statistical-review (last access: 7 April 2026), 2025.
European Commission: EU Climate Action Progress Report 2024, European Commission, Brussels, https://eur-lex.europa.eu/legal-content/EN/TXT/?uri=celex:52024DC0498 (last access: 7 April 2026), 2024.
FAO: Global Forest Resources Assessment 2025, FAO, Rome, Italy, 210 pp., https://doi.org/10.4060/cd6709en, 2025a.
FAO: Greenhouse gas emissions from agrifood systems – Global, regional and country trends, Food and Agriculture Organization of the United Nations, Rome, https://www.fao.org/faostat/en/#data/GT (last access: 7 April 2026), 2025b.
Forster, P., Storelvmo, T., Armour, K., Collins, W., Dufresne, J.-L., Frame, D., Lunt, D. J., Mauritsen, T., Palmer, M. D., Watanabe, M., Wild, M., and Zhang, H.: Chapter 7: The Earth's Energy Budget, Climate Feedbacks and Climate Sensitivity, in: Climate Change 2021: The Physical Science Basis. Contribution of Working Group I to the Sixth Assessment Report of the Intergovernmental Panel on Climate Change, Cambridge University Press, Cambridge, United Kingdom and New York, NY, USA, 923–1054, https://doi.org/10.1017/9781009157896.009, 2021.
Forster, P. M., Smith, C., Walsh, T., Lamb, W. F., Lamboll, R., Hall, B., Hauser, M., Ribes, A., Rosen, D., Gillett, N. P., Palmer, M. D., Rogelj, J., von Schuckmann, K., Trewin, B., Allen, M., Andrew, R., Betts, R. A., Borger, A., Boyer, T., Broersma, J. A., Buontempo, C., Burgess, S., Cagnazzo, C., Cheng, L., Friedlingstein, P., Gettelman, A., Gütschow, J., Ishii, M., Jenkins, S., Lan, X., Morice, C., Mühle, J., Kadow, C., Kennedy, J., Killick, R. E., Krummel, P. B., Minx, J. C., Myhre, G., Naik, V., Peters, G. P., Pirani, A., Pongratz, J., Schleussner, C.-F., Seneviratne, S. I., Szopa, S., Thorne, P., Kovilakam, M. V. M., Majamäki, E., Jalkanen, J.-P., van Marle, M., Hoesly, R. M., Rohde, R., Schumacher, D., van der Werf, G., Vose, R., Zickfeld, K., Zhang, X., Masson-Delmotte, V., and Zhai, P.: Indicators of Global Climate Change 2023: annual update of key indicators of the state of the climate system and human influence, Earth Syst. Sci. Data, 16, 2625–2658, https://doi.org/10.5194/essd-16-2625-2024, 2024.
Friedlingstein, P., O'Sullivan, M., Jones, M. W., Andrew, R. M., Hauck, J., Landschützer, P., Le Quéré, C., Li, H., Luijkx, I. T., Olsen, A., Peters, G. P., Peters, W., Pongratz, J., Schwingshackl, C., Sitch, S., Canadell, J. G., Ciais, P., Jackson, R. B., Alin, S. R., Arneth, A., Arora, V., Bates, N. R., Becker, M., Bellouin, N., Berghoff, C. F., Bittig, H. C., Bopp, L., Cadule, P., Campbell, K., Chamberlain, M. A., Chandra, N., Chevallier, F., Chini, L. P., Colligan, T., Decayeux, J., Djeutchouang, L. M., Dou, X., Duran Rojas, C., Enyo, K., Evans, W., Fay, A. R., Feely, R. A., Ford, D. J., Foster, A., Gasser, T., Gehlen, M., Gkritzalis, T., Grassi, G., Gregor, L., Gruber, N., Gürses, Ö., Harris, I., Hefner, M., Heinke, J., Hurtt, G. C., Iida, Y., Ilyina, T., Jacobson, A. R., Jain, A. K., Jarníková, T., Jersild, A., Jiang, F., Jin, Z., Kato, E., Keeling, R. F., Klein Goldewijk, K., Knauer, J., Korsbakken, J. I., Lan, X., Lauvset, S. K., Lefèvre, N., Liu, Z., Liu, J., Ma, L., Maksyutov, S., Marland, G., Mayot, N., McGuire, P. C., Metzl, N., Monacci, N. M., Morgan, E. J., Nakaoka, S.-I., Neill, C., Niwa, Y., Nützel, T., Olivier, L., Ono, T., Palmer, P. I., Pierrot, D., Qin, Z., Resplandy, L., Roobaert, A., Rosan, T. M., Rödenbeck, C., Schwinger, J., Smallman, T. L., Smith, S. M., Sospedra-Alfonso, R., Steinhoff, T., Sun, Q., Sutton, A. J., Séférian, R., Takao, S., Tatebe, H., Tian, H., Tilbrook, B., Torres, O., Tourigny, E., Tsujino, H., Tubiello, F., van der Werf, G., Wanninkhof, R., Wang, X., Yang, D., Yang, X., Yu, Z., Yuan, W., Yue, X., Zaehle, S., Zeng, N., and Zeng, J.: Global Carbon Budget 2024, Earth Syst. Sci. Data, 17, 965–1039, https://doi.org/10.5194/essd-17-965-2025, 2025a.
Friedlingstein, P., O'Sullivan, M., Jones, M. W., Andrew, R. M., Bakker, D. C. E., Hauck, J., Landschützer, P., Le Quéré, C., Li, H., Luijkx, I. T., Peters, G. P., Peters, W., Pongratz, J., Schwingshackl, C., Sitch, S., Canadell, J. G., Ciais, P., Aas, K., Alin, S. R., Anthoni, P., Barbero, L., Bates, N. R., Bellouin, N., Benoit-Cattin, A., Berghoff, C. F., Bernardello, R., Bopp, L., Brasika, I. B. M., Chamberlain, M. A., Chandra, N., Chevallier, F., Chini, L. P., Collier, N. O., Colligan, T. H., Cronin, M., Djeutchouang, L., Dou, X., Enright, M. P., Enyo, K., Erb, M., Evans, W., Feely, R. A., Feng, L., Ford, D. J., Foster, A., Fransner, F., Gasser, T., Gehlen, M., Gkritzalis, T., Goncalves De Souza, J., Grassi, G., Gregor, L., Gruber, N., Guenet, B., Gürses, Ö., Harrington, K., Harris, I., Heinke, J., Hurtt, G. C., Iida, Y., Ilyina, T., Ito, A., Jacobson, A. R., Jain, A. K., Jarníková, T., Jersild, A., Jiang, F., Jones, S. D., Kato, E., Keeling, R. F., Klein Goldewijk, K., Knauer, J., Kong, Y., Korsbakken, J. I., Koven, C., Kunimitsu, T., Lan, X., Liu, J., Liu, Z., Liu, Z., Lo Monaco, C., Ma, L., Marland, G., McGuire, P. C., McKinley, G. A., Melton, J., Monacci, N., Monier, E., Morgan, E. J., Munro, D. R., Müller, J. D., Nakaoka, S.-I., Nayagam, L. R., Niwa, Y., Nutzel, T., Olsen, A., Omar, A. M., Pan, N., Pandey, S., Pierrot, D., Qin, Z., Regnier, P. A. G., Rehder, G., Resplandy, L., Roobaert, A., Rosan, T. M., Rödenbeck, C., Schwinger, J., Skjelvan, I., Smallman, T. L., Spada, V., Sreeush, M. G., Sun, Q., Sutton, A. J., Sweeney, C., Swingedouw, D., Séférian, R., Takao, S., Tatebe, H., Tian, H., Tian, X., Tilbrook, B., Tsujino, H., Tubiello, F., van Ooijen, E., van der Werf, G., van de Velde, S. J., Walker, A., Wanninkhof, R., Yang, X., Yuan, W., Yue, X., and Zeng, J.: Global Carbon Budget 2025, Earth Syst. Sci. Data Discuss. [preprint], https://doi.org/10.5194/essd-2025-659, in review, 2025b.
Friedlingstein, P., Le Quéré, C., O'Sullivan, M., Hauck, J., Landschützer, P., Luijkx, I. T., Li, H., van der Woude, A., Schwingshackl, C., Pongratz, J., Regnier, P., Andrew, R. M., Bakker, D. C. E., Canadell, J. G., Ciais, P., Gasser, T., Jones, M. W., Lan, X., Morgan, E., Olsen, A., Peters, G. P., Peters, W., Sitch, S., and Tian, H.: Emerging climate impact on carbon sinks in a consolidated carbon budget, Nature, 649, 98–103, https://doi.org/10.1038/s41586-025-09802-5, 2026.
Fyson, C. L. and Jeffery, M. L.: Ambiguity in the Land Use Component of Mitigation Contributions Toward the Paris Agreement Goals, Earth's Future, 7, 873–891, https://doi.org/10.1029/2019EF001190, 2019.
Giarola, S., Mittal, S., Vielle, M., Perdana, S., Campagnolo, L., Delpiazzo, E., Bui, H., Kraavi, A. A., Kolpakov, A., Sognnaes, I., Peters, G., Hawkes, A., Köberle, A. C., Grant, N., Gambhir, A., Nikas, A., Doukas, H., Moreno, J., and Van De Ven, D.-J.: Challenges in the harmonisation of global integrated assessment models: A comprehensive methodology to reduce model response heterogeneity, Sci. Total Environ., 783, 146861, https://doi.org/10.1016/j.scitotenv.2021.146861, 2021.
Gidden, M. J., Gasser, T., Grassi, G., Forsell, N., Janssens, I., Lamb, W. F., Minx, J., Nicholls, Z., Steinhauser, J., and Riahi, K.: Aligning climate scenarios to emissions inventories shifts global benchmarks, Nature, 624, 102–108, https://doi.org/10.1038/s41586-023-06724-y, 2023.
Giglio, L., Randerson, J. T., and van der Werf, G. R.: Analysis of daily, monthly, and annual burned area using the fourth-generation global fire emissions database (GFED4), J. Geophys. Res.-Biogeo., 118, 317–328, https://doi.org/10.1002/jgrg.20042, 2013.
Grassi, G., House, J., Dentener, F., Federici, S., den Elzen, M., and Penman, J.: The key role of forests in meeting climate targets requires science for credible mitigation, Nat. Clim. Change, 7, 220–226, https://doi.org/10.1038/nclimate3227, 2017.
Grassi, G., House, J., Kurz, W. A., Cescatti, A., Houghton, R. A., Peters, G. P., Sanz, M. J., Viñas, R. A., Alkama, R., Arneth, A., Bondeau, A., Dentener, F., Fader, M., Federici, S., Friedlingstein, P., Jain, A. K., Kato, E., Koven, C. D., Lee, D., Nabel, J. E. M. S., Nassikas, A. A., Perugini, L., Rossi, S., Sitch, S., Viovy, N., Wiltshire, A., and Zaehle, S.: Reconciling global-model estimates and country reporting of anthropogenic forest CO2 sinks, Nat. Clim. Change, 8, 914–920, https://doi.org/10.1038/s41558-018-0283-x, 2018.
Grassi, G., Stehfest, E., Rogelj, J., van Vuuren, D., Cescatti, A., House, J., Nabuurs, G.-J., Rossi, S., Alkama, R., Abad Viñas, R., Calvin, K., Ceccherini, G., Federici, S., Fujimori, S., Gusti, M., Hasegawa, T., Havlik, P., Humpenoeder, F., Korosuo, A., Perugini, L., Tubiello, F. N., and Popp, A.: Critical adjustment of land mitigation pathways for assessing countries' climate progress, Nat. Clim. Change, 11, 14, https://doi.org/10.1038/s41558-021-01033-6, 2021.
Grassi, G., Conchedda, G., Federici, S., Abad Viñas, R., Korosuo, A., Melo, J., Rossi, S., Sandker, M., Somogyi, Z., Vizzarri, M., and Tubiello, F. N.: Carbon fluxes from land 2000–2020: bringing clarity to countries' reporting, Earth Syst. Sci. Data, 14, 4643–4666, https://doi.org/10.5194/essd-14-4643-2022, 2022.
Grassi, G., Schwingshackl, C., Gasser, T., Houghton, R. A., Sitch, S., Canadell, J. G., Cescatti, A., Ciais, P., Federici, S., Friedlingstein, P., Kurz, W. A., Sanz Sanchez, M. J., Abad Viñas, R., Alkama, R., Bultan, S., Ceccherini, G., Falk, S., Kato, E., Kennedy, D., Knauer, J., Korosuo, A., Melo, J., McGrath, M. J., Nabel, J. E. M. S., Poulter, B., Romanovskaya, A. A., Rossi, S., Tian, H., Walker, A. P., Yuan, W., Yue, X., and Pongratz, J.: Harmonising the land-use flux estimates of global models and national inventories for 2000–2020, Earth Syst. Sci. Data, 15, 1093–1114, https://doi.org/10.5194/essd-15-1093-2023, 2023.
Gütschow, J., Busch, D., and Pflüger, M.: The PRIMAP-hist national historical emissions time series (1750–2024) v2.7, Zenodo [data set], https://doi.org/10.5281/zenodo.17090760, 2025.
GWIS: Global Wildfire Information System, Copernicus Emergency Management Service, Group on Earth Observations [data set], https://gwis.jrc.ec.europa.eu/ (last access: 7 April 2026), 2025.
Harrison, J. A., Prairie, Y. T., Mercier-Blais, S., and Soued, C.: Year-2020 Global Distribution and Pathways of Reservoir Methane and Carbon Dioxide Emissions According to the Greenhouse Gas From Reservoirs (G-res) Model, Global Biogeochem. Cy., 35, e2020GB006888, https://doi.org/10.1029/2020GB006888, 2021.
Hoesly, R., Smith, S. J., Ahsan, H., Prime, N., O'Rourke, P., Crippa, M., Klimont, Z., Guizzardi, D., Feng, L., Harkins, C., McDonald, B. C., and Wang, S.: CEDS v_2025_03_18 Gridded Data 0.5 degree (v_2025_03_18), Zenodo [data set], https://doi.org/10.5281/zenodo.15001544, 2025.
Höglund-Isaksson, L., Gómez-Sanabria, A., Klimont, Z., Rafaj, P., and Schöpp, W.: Technical potentials and costs for reducing global anthropogenic methane emissions in the 2050 timeframe – results from the GAINS model, Environ. Res. Commun., 2, 025004, https://doi.org/10.1088/2515-7620/ab7457, 2020.
Houghton, R. A.: The annual net flux of carbon to the atmosphere from changes in land use 1850–1990*, Tellus B, 51, 298–313, https://doi.org/10.3402/tellusb.v51i2.16288, 1999.
Huang, Z., Wang, J., Bing, L., Qiu, Y., Guo, R., Yu, Y., Ma, M., Niu, L., Tong, D., Andrew, R. M., Friedlingstein, P., Canadell, J. G., Xi, F., and Liu, Z.: Global carbon uptake of cement carbonation accounts 1930–2021, Earth Syst. Sci. Data, 15, 4947–4958, https://doi.org/10.5194/essd-15-4947-2023, 2023.
IAM: The common Integrated Assessment Model (IAM) documentation: https://www.iamcdocumentation.eu/IAMC_wiki, last access: 2 April 2025.
IEA: Greenhouse Gas Emissions from Energy, International Energy Agency (IEA) [data set], https://www.iea.org/data-and-statistics/data-tools/greenhouse-gas-emissions-from-energy-data-explorer (last access: 7 April 2026), 2024.
IPCC: IPCC Guidelines for National Greenhouse Gas Inventories, 1–14, https://www.ipcc-nggip.iges.or.jp/public/2006gl/ (last access: 7 April 2026), 2006.
IPCC: 2019 Refinement to the 2006 IPCC Guidelines for National Greenhouse Gas Inventories, edited by: Calvo Buendia, E., Tanabe, K., Kranjc, A., Baasansuren, J., Fukuda, M., S., N., Osako, A., Pyrozhenko, Y., Shermanau, P., and Federici, S., IPCC, Switzerland, https://www.ipcc-nggip.iges.or.jp/public/2019rf/index.html (last access: 7 April 2026), 2019.
IPCC: Summary for Policymakers, in: Climate Change 2022: Mitigation of Climate Change. Contribution of Working Group III to the Sixth Assessment Report of the Intergovernmental Panel on Climate Change, edited by: Shukla, P. R., Skea, J., Slade, R., Al Khourdajie, A., van Diemen, R., McCollum, D., Pathak, M., Some, S., Vyas, P., Fradera, R., Belkacemi, M., Hasija, A., Lisboa, G., Luz, S., and Malley, J., Cambridge University Press, Cambridge, UK and New York, NY, USA, https://doi.org/10.1017/9781009157926.001, 2022.
IPCC: Report of the IPCC Expert Meeting on Reconciling Anthropogenic Land Use Emissions, edited by: Enoki, T., Hayat, M., Grassi, G., Sanz, M., Rojas, Y., Federici, S., Seneviratne, S., Rupakheti, M., Howden, M., Sukumar, R., Fuglestvedt, J., Itsoua Madzous, G., Krug, T., Romanowskaya, A., and Sturgiss, R., IGES, Japan, https://www.ipcc-nggip.iges.or.jp/public/mtdocs/pdfiles/2407_EM_Land_Report.pdf (last access: 7 April 2026), 2024.
IPCC: Decision IPCC-LXII-8. Scoping of the IPCC Seventh Assessment Report (AR7), Intergovernmental Panel on Climate Change (IPCC), Hangzhou, China, https://www.ipcc.ch/site/assets/uploads/2025/03/Decision-8-Working-Group-Outlines.pdf (last access: 7 April 2026), 2025a.
IPCC: Sixty-second Session of the IPCC (IPCC-62), Fifteenth Session of the IPCC Working Group I (WGI-15), Thirteenth Session of the IPCC Working Group II (WGII-13), and Fifteenth Session of the IPCC Working Group III (WGIII-15) – IPCC, https://www.ipcc.ch/meeting-doc/ipcc-62/ (last access: 7 April 2026), 2025b.
Janardanan, R., Maksyutov, S., Wang, F., Nayagam, L., Sahu, S. K., Mangaraj, P., Saunois, M., Lan, X., and Matsunaga, T.: Country-level methane emissions and their sectoral trends during 2009–2020 estimated by high-resolution inversion of GOSAT and surface observations, Environ. Res. Lett., 19, 034007, https://doi.org/10.1088/1748-9326/ad2436, 2024.
Janssens-Maenhout, G., Crippa, M., Guizzardi, D., Muntean, M., Schaaf, E., Dentener, F., Bergamaschi, P., Pagliari, V., Olivier, J. G. J., Peters, J. A. H. W., van Aardenne, J. A., Monni, S., Doering, U., Petrescu, A. M. R., Solazzo, E., and Oreggioni, G. D.: EDGAR v4.3.2 Global Atlas of the three major greenhouse gas emissions for the period 1970–2012, Earth Syst. Sci. Data, 11, 959–1002, https://doi.org/10.5194/essd-11-959-2019, 2019.
Johnson, M. S., Matthews, E., Bastviken, D., Deemer, B., Du, J., and Genovese, V.: Spatiotemporal Methane Emission From Global Reservoirs, J. Geophys. Res.-Biogeo., 126, e2021JG006305, https://doi.org/10.1029/2021JG006305, 2021.
Johnson, M. S., Matthews, E., Du, J., Genovese, V., and Bastviken, D.: Methane Emission From Global Lakes: New Spatiotemporal Data and Observation-Driven Modeling of Methane Dynamics Indicates Lower Emissions, J. Geophys. Res.-Biogeo., 127, e2022JG006793, https://doi.org/10.1029/2022JG006793, 2022.
Jones, M. W., Abatzoglou, J. T., Veraverbeke, S., Andela, N., Lasslop, G., Forkel, M., Smith, A. J. P., Burton, C., Betts, R. A., Van Der Werf, G. R., Sitch, S., Canadell, J. G., Santín, C., Kolden, C., Doerr, S. H., and Le Quéré, C.: Global and Regional Trends and Drivers of Fire Under Climate Change, Rev. Geophys., 60, e2020RG000726, https://doi.org/10.1029/2020RG000726, 2022.
Jones, M. W., Peters, G. P., Gasser, T., Andrew, R. M., Schwingshackl, C., Gütschow, J., Houghton, R. A., Friedlingstein, P., Pongratz, J., and Le Quéré, C.: National contributions to climate change due to historical emissions of carbon dioxide, methane, and nitrous oxide since 1850, Sci. Data, 10, 155, https://doi.org/10.1038/s41597-023-02041-1, 2023.
Jones, M. W., Veraverbeke, S., Andela, N., Doerr, S. H., Kolden, C., Mataveli, G., Pettinari, M. L., Le Quéré, C., Rosan, T. M., Van Der Werf, G. R., Van Wees, D., and Abatzoglou, J. T.: Global rise in forest fire emissions linked to climate change in the extratropics, Science, 386, eadl5889, https://doi.org/10.1126/science.adl5889, 2024a.
Jones, M. W., Kelley, D. I., Burton, C. A., Di Giuseppe, F., Barbosa, M. L. F., Brambleby, E., Hartley, A. J., Lombardi, A., Mataveli, G., McNorton, J. R., Spuler, F. R., Wessel, J. B., Abatzoglou, J. T., Anderson, L. O., Andela, N., Archibald, S., Armenteras, D., Burke, E., Carmenta, R., Chuvieco, E., Clarke, H., Doerr, S. H., Fernandes, P. M., Giglio, L., Hamilton, D. S., Hantson, S., Harris, S., Jain, P., Kolden, C. A., Kurvits, T., Lampe, S., Meier, S., New, S., Parrington, M., Perron, M. M. G., Qu, Y., Ribeiro, N. S., Saharjo, B. H., San-Miguel-Ayanz, J., Shuman, J. K., Tanpipat, V., van der Werf, G. R., Veraverbeke, S., and Xanthopoulos, G.: State of Wildfires 2023–2024, Earth Syst. Sci. Data, 16, 3601–3685, https://doi.org/10.5194/essd-16-3601-2024, 2024b.
Kaiser, J. W., Heil, A., Andreae, M. O., Benedetti, A., Chubarova, N., Jones, L., Morcrette, J.-J., Razinger, M., Schultz, M. G., Suttie, M., and van der Werf, G. R.: Biomass burning emissions estimated with a global fire assimilation system based on observed fire radiative power, Biogeosciences, 9, 527–554, https://doi.org/10.5194/bg-9-527-2012, 2012.
Kikstra, J. S., Nicholls, Z. R. J., Smith, C. J., Lewis, J., Lamboll, R. D., Byers, E., Sandstad, M., Meinshausen, M., Gidden, M. J., Rogelj, J., Kriegler, E., Peters, G. P., Fuglestvedt, J. S., Skeie, R. B., Samset, B. H., Wienpahl, L., van Vuuren, D. P., van der Wijst, K.-I., Al Khourdajie, A., Forster, P. M., Reisinger, A., Schaeffer, R., and Riahi, K.: The IPCC Sixth Assessment Report WGIII climate assessment of mitigation pathways: from emissions to global temperatures, Geosci. Model Dev., 15, 9075–9109, https://doi.org/10.5194/gmd-15-9075-2022, 2022.
Kloster, S. and Lasslop, G.: Historical and future fire occurrence (1850 to 2100) simulated in CMIP5 Earth System Models, Global Planet. Change, 150, 58–69, https://doi.org/10.1016/j.gloplacha.2016.12.017, 2017.
Korsbakken, J. I., Mittal, S., and Peters, G. P.: D4.4 Broad scenario logic – Update, IAM COMPACT, Zenodo, https://doi.org/10.5281/zenodo.10430891, 2024.
Lamb, W.: Tidy GHG Inventories (0.3), Zenodo [data set], https://doi.org/10.5281/zenodo.14637347, 2025.
Lamb, W. F.: Differences in anthropogenic greenhouse gas emissions estimates explained dataset, Zenodo [data set, code], https://doi.org/10.5281/zenodo.15126539, 2026.
Ma, S., Creed, I. F., and Badiou, P.: New perspectives on temperate inland wetlands as natural climate solutions under different CO2-equivalent metrics, npj Clim. Atmos. Sci., 7, 222, https://doi.org/10.1038/s41612-024-00778-z, 2024.
Meinshausen, M., Lewis, J., McGlade, C., Gütschow, J., Nicholls, Z., Burdon, R., Cozzi, L., and Hackmann, B.: Realization of Paris Agreement pledges may limit warming just below 2 °C, Nature, 604, 304–309, https://doi.org/10.1038/s41586-022-04553-z, 2022.
Melo, J., Rossi, S., Achard, F., Alkama, R., Canadell, J. G., Friedlingstein, P., Gibbs, D., Harris, N., Heinrich, V., O'Sullivan, M., Peters, G., Pongratz, J., Rose, M., Roman-Cuesta, R., Sanz Sanchez, M. J., Schwingshackl, C., Sitch, S., and Grassi, G.: The LULUCF data hub: translating global land use emissions estimates into the national GHG inventory framework (Version 3.0, 2025 NGHGI release) (3.0), Zenodo [data set], https://doi.org/10.5281/zenodo.17153438, 2025.
Minx, J. C., Lamb, W. F., Andrew, R. M., Canadell, J. G., Crippa, M., Döbbeling, N., Forster, P. M., Guizzardi, D., Olivier, J., Peters, G. P., Pongratz, J., Reisinger, A., Rigby, M., Saunois, M., Smith, S. J., Solazzo, E., and Tian, H.: A comprehensive and synthetic dataset for global, regional, and national greenhouse gas emissions by sector 1970–2018 with an extension to 2019, Earth Syst. Sci. Data, 13, 5213–5252, https://doi.org/10.5194/essd-13-5213-2021, 2021.
Mooney, C., Eilperin, J., Butler, D., Muyskens, J., Narayanswamy, A., and Ahmed, N.: Countries' climate pledges built on flawed data, Post investigation finds, Washington Post, https://www.washingtonpost.com/climate-environment/interactive/2021/greenhouse-gas-emissions-pledges-data/ (last access: 7 April 2026), 2021.
Niu, L., Wu, S., Andrew, R. M., Shao, Z., Wang, J., and Xi, F.: Global and national CO2 uptake by cement carbonation from 1928 to 2024, Earth Syst. Sci. Data, 17, 2231–2247, https://doi.org/10.5194/essd-17-2231-2025, 2025.
Obermeier, W. A., Schwingshackl, C., Ganzenmüller, R., Grassi, G., Heinrich, V., Luijkx, I. T., Bastos, A., Ciais, P., Sitch, S., and Pongratz, J.: Differences and uncertainties in land-use CO2 flux estimates, Nat. Rev. Earth Environ., 6, 747–766, https://doi.org/10.1038/s43017-025-00730-6, 2025.
Ogle, S. M., Domke, G., Kurz, W. A., Rocha, M. T., Huffman, T., Swan, A., Smith, J. E., Woodall, C., and Krug, T.: Delineating managed land for reporting national greenhouse gas emissions and removals to the United Nations framework convention on climate change, Carbon Balance Manage., 13, 9, https://doi.org/10.1186/s13021-018-0095-3, 2018.
Pongratz, J., Schwingshackl, C., Bultan, S., Obermeier, W., Havermann, F., and Guo, S.: Land Use Effects on Climate: Current State, Recent Progress, and Emerging Topics, Curr. Clim. Change Rep., 7, 99–120, https://doi.org/10.1007/s40641-021-00178-y, 2021.
Prosperi, P., Bloise, M., Tubiello, F. N., Conchedda, G., Rossi, S., Boschetti, L., Salvatore, M., and Bernoux, M.: New estimates of greenhouse gas emissions from biomass burning and peat fires using MODIS Collection 6 burned areas, Climatic Change, 161, 415–432, https://doi.org/10.1007/s10584-020-02654-0, 2020.
Rocher-Ros, G., Stanley, E. H., Loken, L. C., Casson, N. J., Raymond, P. A., Liu, S., Amatulli, G., and Sponseller, R. A.: Global methane emissions from rivers and streams, Nature, 621, 530–535, https://doi.org/10.1038/s41586-023-06344-6, 2023.
Roman-Cuesta, R. M., Elzen, M. D., Araujo, Z., Forsell, N., Lamb, W. F., McGlynn, E., Melo, J., Rossi, S., Meinshausen, M., Federici, S., Gidden, M., Keramidas, K., Korouso, A., and Grassi, G.: Land remains a blind spot in tracking progress under the Paris Agreement due to lack of data comparability, Commun. Earth Environ., 6, https://doi.org/10.1038/s43247-025-02494-9, 2025.
Saunois, M., Martinez, A., Poulter, B., Zhang, Z., Raymond, P. A., Regnier, P., Canadell, J. G., Jackson, R. B., Patra, P. K., Bousquet, P., Ciais, P., Dlugokencky, E. J., Lan, X., Allen, G. H., Bastviken, D., Beerling, D. J., Belikov, D. A., Blake, D. R., Castaldi, S., Crippa, M., Deemer, B. R., Dennison, F., Etiope, G., Gedney, N., Höglund-Isaksson, L., Holgerson, M. A., Hopcroft, P. O., Hugelius, G., Ito, A., Jain, A. K., Janardanan, R., Johnson, M. S., Kleinen, T., Krummel, P. B., Lauerwald, R., Li, T., Liu, X., McDonald, K. C., Melton, J. R., Mühle, J., Müller, J., Murguia-Flores, F., Niwa, Y., Noce, S., Pan, S., Parker, R. J., Peng, C., Ramonet, M., Riley, W. J., Rocher-Ros, G., Rosentreter, J. A., Sasakawa, M., Segers, A., Smith, S. J., Stanley, E. H., Thanwerdas, J., Tian, H., Tsuruta, A., Tubiello, F. N., Weber, T. S., van der Werf, G. R., Worthy, D. E. J., Xi, Y., Yoshida, Y., Zhang, W., Zheng, B., Zhu, Q., Zhu, Q., and Zhuang, Q.: Global Methane Budget 2000–2020, Earth Syst. Sci. Data, 17, 1873–1958, https://doi.org/10.5194/essd-17-1873-2025, 2025.
Scarpelli, T. R., Jacob, D. J., Grossman, S., Lu, X., Qu, Z., Sulprizio, M. P., Zhang, Y., Reuland, F., Gordon, D., and Worden, J. R.: Updated Global Fuel Exploitation Inventory (GFEI) for methane emissions from the oil, gas, and coal sectors: evaluation with inversions of atmospheric methane observations, Atmos. Chem. Phys., 22, 3235–3249, https://doi.org/10.5194/acp-22-3235-2022, 2022.
Schwingshackl, C., Obermeier, W. A., Bultan, S., Grassi, G., Canadell, J. G., Friedlingstein, P., Gasser, T., Houghton, R. A., Kurz, W. A., Sitch, S., and Pongratz, J.: Differences in land-based mitigation estimates reconciled by separating natural and land-use CO2 fluxes at the country level, One Earth, 5, 1367–1376, https://doi.org/10.1016/j.oneear.2022.11.009, 2022.
Silva Junior, C. H. L., Aragão, L. E. O. C., Anderson, L. O., Fonseca, M. G., Shimabukuro, Y. E., Vancutsem, C., Achard, F., Beuchle, R., Numata, I., Silva, C. A., Maeda, E. E., Longo, M., and Saatchi, S. S.: Persistent collapse of biomass in Amazonian forest edges following deforestation leads to unaccounted carbon losses, Sci. Adv., 6, eaaz8360, https://doi.org/10.1126/sciadv.aaz8360, 2020.
Sitch, S., O'Sullivan, M., Robertson, E., Friedlingstein, P., Albergel, C., Anthoni, P., Arneth, A., Arora, V. K., Bastos, A., Bastrikov, V., Bellouin, N., Canadell, J. G., Chini, L., Ciais, P., Falk, S., Harris, I., Hurtt, G., Ito, A., Jain, A. K., Jones, M. W., Joos, F., Kato, E., Kennedy, D., Klein Goldewijk, K., Kluzek, E., Knauer, J., Lawrence, P. J., Lombardozzi, D., Melton, J. R., Nabel, J. E. M. S., Pan, N., Peylin, P., Pongratz, J., Poulter, B., Rosan, T. M., Sun, Q., Tian, H., Walker, A. P., Weber, U., Yuan, W., Yue, X., and Zaehle, S.: Trends and Drivers of Terrestrial Sources and Sinks of Carbon Dioxide: An Overview of the TRENDY Project, Global Biogeochem. Cy., 38, e2024GB008102, https://doi.org/10.1029/2024GB008102, 2024.
Smith, C., Nicholls, Z. R. J., Armour, K., Collins, W., Forster, P., Meinshausen, M., Palmer, M. D., and Watanabe, M.: The Earth's Energy Budget, Climate Feedbacks and Climate Sensitivity Supplementary Material, in: Climate Change 2021 – The Physical Science Basis: Working Group I Contribution to the Sixth Assessment Report of the Intergovernmental Panel on Climate Change, edited by: Masson-Delmotte, V., Zhai, P., Pirani, A., Connors, S. L., Pean, C., Berger, S., Caud, N., Chen, Y., Goldfarb, L., Gomis, M. I., Huang, M., Leitzell, K., Lonnoy, E., Matthews, J. B. R., Maycock, T. K., Waterfield, T., Yelekçi, O., Yu, R., and Zhou, B., Cambridge University Press, Cambridge, https://doi.org/10.1017/9781009157896, 2021.
Smith, C., Cummins, D. P., Fredriksen, H.-B., Nicholls, Z., Meinshausen, M., Allen, M., Jenkins, S., Leach, N., Mathison, C., and Partanen, A.-I.: fair-calibrate v1.4.1: calibration, constraining, and validation of the FaIR simple climate model for reliable future climate projections, Geosci. Model Dev., 17, 8569–8592, https://doi.org/10.5194/gmd-17-8569-2024, 2024.
Stechemesser, A., Koch, N., Mark, E., Dilger, E., Klösel, P., Menicacci, L., Nachtigall, D., Pretis, F., Ritter, N., Schwarz, M., Vossen, H., and Wenzel, A.: Climate policies that achieved major emission reductions: Global evidence from two decades, Science, 385, 884–892, https://doi.org/10.1126/science.adl6547, 2024.
Tian, H., Pan, N., Thompson, R. L., Canadell, J. G., Suntharalingam, P., Regnier, P., Davidson, E. A., Prather, M., Ciais, P., Muntean, M., Pan, S., Winiwarter, W., Zaehle, S., Zhou, F., Jackson, R. B., Bange, H. W., Berthet, S., Bian, Z., Bianchi, D., Bouwman, A. F., Buitenhuis, E. T., Dutton, G., Hu, M., Ito, A., Jain, A. K., Jeltsch-Thömmes, A., Joos, F., Kou-Giesbrecht, S., Krummel, P. B., Lan, X., Landolfi, A., Lauerwald, R., Li, Y., Lu, C., Maavara, T., Manizza, M., Millet, D. B., Mühle, J., Patra, P. K., Peters, G. P., Qin, X., Raymond, P., Resplandy, L., Rosentreter, J. A., Shi, H., Sun, Q., Tonina, D., Tubiello, F. N., van der Werf, G. R., Vuichard, N., Wang, J., Wells, K. C., Western, L. M., Wilson, C., Yang, J., Yao, Y., You, Y., and Zhu, Q.: Global nitrous oxide budget (1980–2020), Earth Syst. Sci. Data, 16, 2543–2604, https://doi.org/10.5194/essd-16-2543-2024, 2024.
Tibrewal, K., Ciais, P., Saunois, M., Martinez, A., Lin, X., Thanwerdas, J., Deng, Z., Chevallier, F., Giron, C., Albergel, C., Tanaka, K., Patra, P., Tsuruta, A., Zheng, B., Belikov, D., Niwa, Y., Janardanan, R., Maksyutov, S., Segers, A., Tzompa-Sosa, Z. A., Bousquet, P., and Sciare, J.: Assessment of methane emissions from oil, gas and coal sectors across inventories and atmospheric inversions, Commun. Earth Environ., 5, 26, https://doi.org/10.1038/s43247-023-01190-w, 2024.
Tubiello, F., Pekkarinen, A., Branthomme, A., Piccoli, M., Obli-Laryea, G., Ramadan, N., and Conchedda, G.: New FAOSTAT forest emissions and removals estimates: 1990–2025, Earth Syst. Sci. Data Discuss. [preprint], https://doi.org/10.5194/essd-2025-635, in review, 2025.
Tubiello, F. N., Conchedda, G., Wanner, N., Federici, S., Rossi, S., and Grassi, G.: Carbon emissions and removals from forests: new estimates, 1990–2020, Earth Syst. Sci. Data, 13, 1681–1691, https://doi.org/10.5194/essd-13-1681-2021, 2021.
UNEP: Emissions Gap Report 2022: The Closing Window – Climate crisis calls for rapid transformation of societies, United Nations Environment Programme, Nairobi, https://www.unep.org/resources/emissions-gap-report-2022 (last access: 7 April 2026), 2022.
UNEP: Emissions Gap Report 2023: Broken Record – Temperatures hit new highs, yet world fails to cut emissions (again), United Nations Environment Programme, Nairobi, https://doi.org/10.59117/20.500.11822/43922, 2023.
UNEP: Emissions Gap Report 2024: No more hot air … please! With a massive gap between rhetoric and reality, countries draft new climate commitments, United Nations Environment Programme, Nairobi, https://doi.org/10.59117/20.500.11822/46404, 2024.
UNEP and CCAC: Global Methane Assessment: Benefits and Costs of Mitigating Methane Emissions, United Nations Environment Programme and Climate and Clean Air Coalition, Nairobi, https://www.unep.org/resources/report/global-methane-assessment-benefits-and-costs-mitigating-methane-emissions (last access: 7 April 2026), 2021.
UNFCCC: Decision 4/CMA.1, United Nations Framework Convention on Climate Change, Geneva, Switzerland, https://unfccc.int/sites/default/files/resource/4-CMA.1_English.pdf (last access: 7 April 2026), 2018a.
UNFCCC: Decision 18/CMA.1, United Nations Framework Convention on Climate Change, Geneva, Switzerland, https://unfccc.int/resource/tet/0/00mpg.pdf (last access: 7 April 2026), 2018b.
UNFCCC: Decision 5/CMA.3, United Nations Framework Convention on Climate Change, Geneva, Switzerland, https://unfccc.int/sites/default/files/resource/cma3_auv_5_transparency_0.pdf (last access: 7 April 2026), 2022a.
UNFCCC: Nationally determined contributions under the Paris Agreement, Synthesis report by the secretariat, United Nations Framework Convention on Climate Change, Geneva, Switzerland, https://unfccc.int/sites/default/files/resource/cma2022_04.pdf (last access: 7 April 2026), 2022b.
UNFCCC: Synthesis report for the technical assessment component of the first global stocktake, United Nations Framework Convention on Climate Change, https://unfccc.int/sites/default/files/resource/GST_SR_36a_1.pdf (last access: 7 April 2026), 2022c.
UNFCCC: National Inventory Submissions 2025, UNFCCC [data set], https://unfccc.int/ghg-inventories-annex-i-parties/2025 (last access: 7 April 2026), 2025.
USGCRP: Fifth National Climate Assessment, U.S. Global Change Research Program, Washington, DC, USA, https://doi.org/10.7930/NCA5.2023, 2023.
van der Werf, G. R., Randerson, J. T., Giglio, L., van Leeuwen, T. T., Chen, Y., Rogers, B. M., Mu, M., van Marle, M. J. E., Morton, D. C., Collatz, G. J., Yokelson, R. J., and Kasibhatla, P. S.: Global fire emissions estimates during 1997–2016, Earth Syst. Sci. Data, 9, 697–720, https://doi.org/10.5194/essd-9-697-2017, 2017.
van der Werf, G. R., Randerson, J. T., van Wees, D., Chen, Y., Giglio, L., Hall, J., Vernooij, R., Mu, M., Binte Shahid, S., Barsanti, K. C., Yokelson, R., and Morton, D. C.: Landscape fire emissions from the 5th version of the Global Fire Emissions Database (GFED5), Sci. Data, 12, 1870, https://doi.org/10.1038/s41597-025-06127-w, 2025.
Velders, G. J. M., Andersen, S. O., Daniel, J. S., Fahey, D. W., and McFarland, M.: The importance of the Montreal Protocol in protecting climate, P. Natl. Acad. Sci. USA, 104, 4814–4819, https://doi.org/10.1073/pnas.0610328104, 2007.
Velders, G. J. M., Fahey, D. W., Daniel, J. S., Andersen, S. O., and McFarland, M.: Future atmospheric abundances and climate forcings from scenarios of global and regional hydrofluorocarbon (HFC) emissions, Atmos. Environ., 123, 200–209, https://doi.org/10.1016/j.atmosenv.2015.10.071, 2015.
WMO: Scientific Assessment of Ozone Depletion 2022, World Meteorological Organization (WMO), Geneva, Switzerland, https://ozone.unep.org/sites/default/files/2023-02/Scientific-Assessment-of-Ozone-Depletion-2022.pdf (last access: 7 April 2026), 2022.
Yona, L.: Emissions Omissions: Greenhouse Gas Accounting Gaps, Harvard Environmental Law Review, Forthcoming, https://journals.law.harvard.edu/elr/wp-content/uploads/sites/79/2025/09/5_HELR_49.2_Yona_Emissions-Omissions.pdf (last access: 7 April 2026), 2025.
Young, P. J., Harper, A. B., Huntingford, C., Paul, N. D., Morgenstern, O., Newman, P. A., Oman, L. D., Madronich, S., and Garcia, R. R.: The Montreal Protocol protects the terrestrial carbon sink, Nature, 596, 384–388, https://doi.org/10.1038/s41586-021-03737-3, 2021.
Yue, C., Ciais, P., Zhu, D., Wang, T., Peng, S. S., and Piao, S. L.: How have past fire disturbances contributed to the current carbon balance of boreal ecosystems?, Biogeosciences, 13, 675–690, https://doi.org/10.5194/bg-13-675-2016, 2016.
Zhang, Z., Poulter, B., Melton, J. R., Riley, W. J., Allen, G. H., Beerling, D. J., Bousquet, P., Canadell, J. G., Fluet-Chouinard, E., Ciais, P., Gedney, N., Hopcroft, P. O., Ito, A., Jackson, R. B., Jain, A. K., Jensen, K., Joos, F., Kleinen, T., Knox, S. H., Li, T., Li, X., Liu, X., McDonald, K., McNicol, G., Miller, P. A., Müller, J., Patra, P. K., Peng, C., Peng, S., Qin, Z., Riggs, R. M., Saunois, M., Sun, Q., Tian, H., Xu, X., Yao, Y., Xi, Y., Zhang, W., Zhu, Q., Zhu, Q., and Zhuang, Q.: Ensemble estimates of global wetland methane emissions over 2000–2020, Biogeosciences, 22, 305–321, https://doi.org/10.5194/bg-22-305-2025, 2025.
Zhuang, Q., Guo, M., Melack, J. M., Lan, X., Tan, Z., Oh, Y., and Leung, L. R.: Current and Future Global Lake Methane Emissions: A Process-Based Modeling Analysis, J. Geophys. Res.-Biogeo., 128, e2022JG007137, https://doi.org/10.1029/2022JG007137, 2023.
Zou, J., Ziegler, A. D., Chen, D., McNicol, G., Ciais, P., Jiang, X., Zheng, C., Wu, J., Wu, J., Lin, Z., He, X., Brown, L. E., Holden, J., Zhang, Z., Ramchunder, S. J., Chen, A., and Zeng, Z.: Rewetting global wetlands effectively reduces major greenhouse gas emissions, Nat. Geosci., 15, 627–632, https://doi.org/10.1038/s41561-022-00989-0, 2022.
- Abstract
- Introduction
- Three reasons why greenhouse gas estimates can differ
- Conventions to assess emissions in different communities
- Comparison and spread of GHG estimates
- Data availability
- Code availability
- Discussion and conclusion
- Author contributions
- Competing interests
- Disclaimer
- Financial support
- Review statement
- References